Embed Size (px)
Citation preview
STRENGTH AND DURABILITY OF FLY ASH-BASED FIBER-REINFORCED
GEOPOLYMER CONCRETE IN A SIMULATED MARINE ENVIRONMENT
by
Francisco Javier Martinez Rivera
A Thesis Submitted to the Faculty of
The College of Engineering and Computer Science
in Partial Fulfillment of the Requirements for the Degree of
Master of Science
Florida Atlantic University
Boca Raton, Florida
December 2013
iii
ACKNOWLEDGEMENTS
I would like to express my sincerest gratitude to my thesis advisor, Dr. Khaled
Sobhan, as well as my thesis committee member, Dr. D.V. Reddy, Department of Civil,
Environmental, and Geomatics Engineering, for providing me with their guidance and
support throughout the entirety of my research, which was instrumental in the success of
this thesis and the innovative work produced. I would also like to thank my thesis
committee member, Dr. M. Arockiasamy, Department of Civil, Environmental, and
Geomatics Engineering, for his insight and advice in finishing the thesis work.
I would like to thank the Florida Atlantic University, Boca Raton, Civil,
Environmental, and Geomatics Engineering Department for allowing me the use of their
facilities to conduct my experiment. I would also like to thank Radise International,
Riviera Beach, for the use of their laboratory equipment, and CEMEX for providing the
Class F fly ash used in this project.
I would like to thank Mr. Hank Van Sant, Department of Computer & Electrical
Engineering and Computer Science, for his help in understanding and setting up the
electrical components of this project, and the various graduate and undergraduate
students who helped me in the completion of the experimental program: Meba Solomon,
Noel Rodriguez, Bruno Assis, Juan Martinez, Jamie Polidora, and Lillian Gonzalez.
Finally, I would like to acknowledge my family, who have supported me in my efforts
my entire college career, and without whom I could not have accomplished this work.
iv
ABSTRACT
Author: Francisco Javier Martinez Rivera
Title: Strength and Durability of Fly Ash-Based Fiber-Reinforced
Geopolymer Concrete in a Simulated Marine Environment
Institution: Florida Atlantic University
Thesis Advisor: Dr. Khaled Sobhan
Degree: Master of Science
Year: 2013
This research is aimed at investigating the corrosion durability of polyolefin fiber-
reinforced fly ash-based geopolymer structural concrete (hereafter referred to as GPC, in
contradistinction to unreinforced geopolymer concrete referred to as simply geopolymer
concrete), where cement is completely replaced by fly ash, that is activated by alkalis,
sodium hydroxide and sodium silicate. The durability in a marine environment is tested
through an electrochemical method for accelerated corrosion. The GPC achieved
compressive strengths in excess of 6,000 psi. Fiber reinforced beams contained
polyolefin fibers in the amounts of 0.1%, 0.3%, and 0.5% by volume. After being
subjected to corrosion damage, the GPC beams were analyzed through a method of crack
scoring, steel mass loss, and residual flexural strength testing. Fiber reinforced GPC
beams showed greater resistance to corrosion damage with higher residual flexural
strength. This makes GPC an attractive material for use in submerged marine structures.
v
STRENGTH AND DURABILITY OF FLY ASH-BASED FIBER-REINFORCED
GEOPOLYMER CONCRETE IN A SIMULATED MARINE ENVIRONMENT
LIST OF TABLES ........................................................................................................................ viii
LIST OF FIGURES ........................................................................................................................ ix
CHAPTER 1: INTRODUCTION .................................................................................................... 1
1.1 GENERAL ............................................................................................................................. 1
1.2 RESEARCH OBJECTIVE .................................................................................................... 4
1.3 SCOPE OF WORK ................................................................................................................ 5
CHAPTER 2: LITERATURE REVIEW ......................................................................................... 6
2.1 GEOPOLYMERS .................................................................................................................. 6
2.1.1 Terminology and Chemistry ........................................................................................... 6
2.1.2 Source Materials ............................................................................................................. 9
2.1.3 Alkaline Liquids ........................................................................................................... 11
2.1.4 Mix Proportions ............................................................................................................ 12
2.1.5 Factors Affecting Geopolymer Properties .................................................................... 13
2.1.6 Geopolymer Applications ............................................................................................. 15
2.2 FLY ASH ............................................................................................................................. 17
2.3 CORROSION OF STEEL IN CONCRETE ........................................................................ 20
2.4 FIBER REINFORCEMENT ................................................................................................ 23
CHAPTER 3: MATERIALS USED AND SPECIMEN PREPARATION ................................... 26
vi
3.1 MATERIALS USED ........................................................................................................... 26
3.1.1 Aggregates .................................................................................................................... 26
3.1.2 Fly Ash .......................................................................................................................... 27
3.1.3 Alkaline Liquid ............................................................................................................. 28
3.1.4 Superplasticizer ............................................................................................................. 28
3.1.5 Fibers ............................................................................................................................ 28
3.2 MIX DESIGN PRELUDE ................................................................................................... 29
3.3 SPECIMEN PREPARATION ............................................................................................. 29
3.3.1 Mix Design ................................................................................................................... 29
3.3.2 Preparation of Test Specimens...................................................................................... 30
3.3.2.1 Alkaline Liquid Preparation ................................................................................... 31
3.3.2.2 Molds ..................................................................................................................... 33
3.3.2.3 Mixing and Casting ................................................................................................ 34
3.3.2.4 Curing of Test Specimens ...................................................................................... 38
CHAPTER 4: ACCELERATED CORROSION DURABILITY TESTING ................................ 41
4.1 EXPERIMENTAL PROGRAM .......................................................................................... 43
4.1.1 Test Specimens ............................................................................................................. 43
4.1.2 Testing Apparatus and Materials .................................................................................. 44
4.1.3 Seawater Solution ......................................................................................................... 44
4.2 TEST PROCEDURE ........................................................................................................... 45
CHAPTER 5: STRENGTH EVALUATION OF GEOPOLYMER CONCRETE ........................ 48
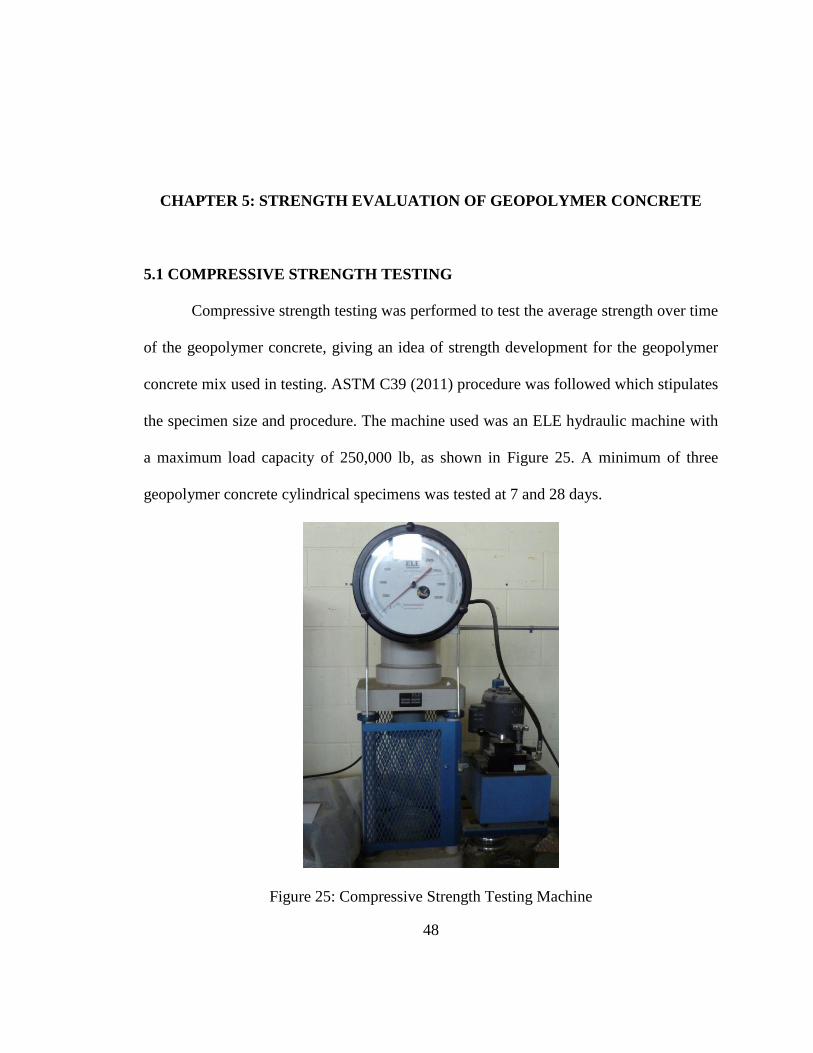
5.1 COMPRESSIVE STRENGTH TESTING ........................................................................... 48
5.2 SPLITTING TENSILE STRENGTH .................................................................................. 49
5.3 RESIDUAL FLEXURAL STRENGTH .............................................................................. 50
vii
CHAPTER 6: RESULTS ............................................................................................................... 52
6.1 COMPRESSIVE STRENGTH ............................................................................................ 52
6.2 SPLITTING TENSILE STRENGTH .................................................................................. 53
6.3 CORROSION CURRENT AND CRACKING BEHAVIOR .............................................. 54
6.4 CRACKING EVALUATION .............................................................................................. 63
6.5 MASS LOSS ........................................................................................................................ 66
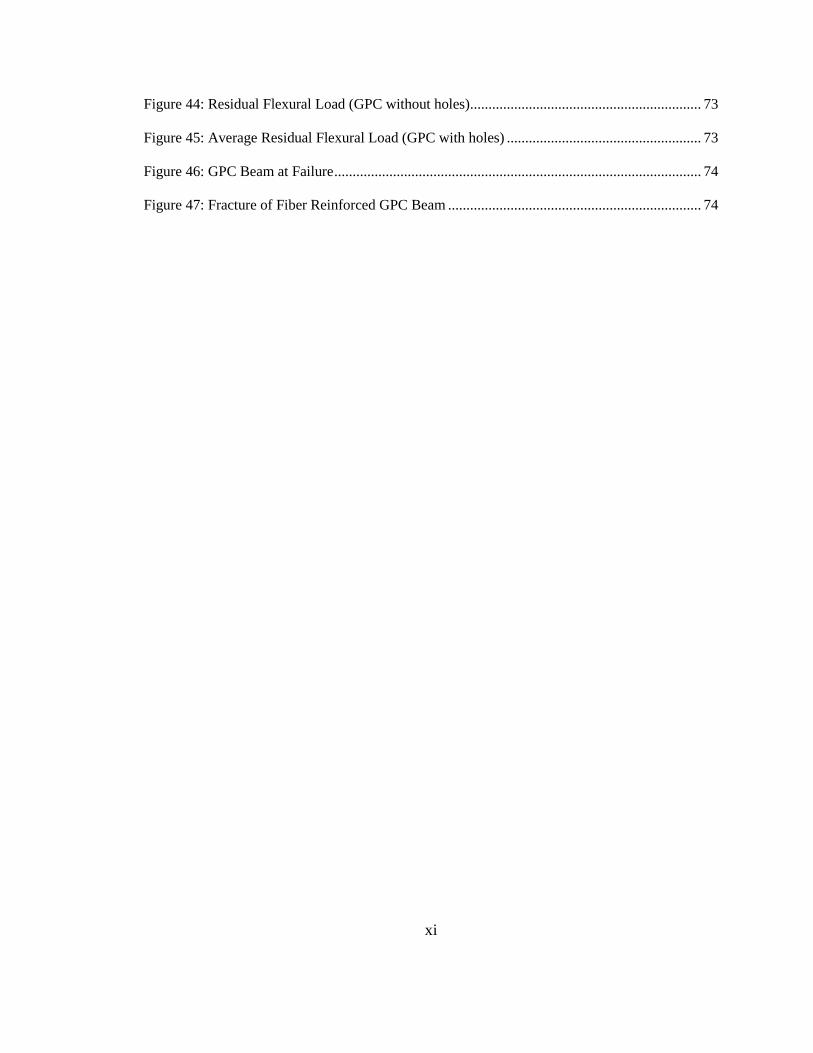
6.6 FLEXURAL LOAD TESTING ........................................................................................... 69
CHAPTER 7: DISCUSSION AND CONCLUSIONS .................................................................. 75
APPENDIX A ................................................................................................................................ 77
REFERENCES .............................................................................................................................. 87
viii
LIST OF TABLES
Table 1: Geopolymer Mix Proportions (Wallah and Rangan 2006) .............................................. 13
Table 2: Geopolymer Applications by Si:Al ratio ......................................................................... 17
Table 3: Chemical Composition of Low Calcium Fly Ash ........................................................... 27
Table 4: Geopolymer Concrete Mix Design .................................................................................. 30
Table 5: Number and Type of Specimens ...................................................................................... 31
Table 6: Composition of Instant Ocean Seawater Solution ........................................................... 45
Table 7: Compressive and Splitting Tensile Strength Results ....................................................... 53
Table 8: Crack Scoring for GPC without Holes ............................................................................ 65
Table 9: Crack Scoring for GPC with Holes.................................................................................. 65
Table 10: Residual Flexural Loads for All GPC Beams ................................................................ 69
Table A 1: Current Readings for Samples GPC 1 through GPC 6 ................................................ 78
Table A 2: Current Reading for GPC 7 through GPC 12 .............................................................. 80
Table A 3: Observed Crack Scoring Data ...................................................................................... 83
Table A 4: Residual Flexural Load Values .................................................................................... 85
Table A 5: Density Data for Cylinders .......................................................................................... 85
Table A 6: Density Data for Beams ............................................................................................... 86
Table A 7: Fiber Addition Calculations ......................................................................................... 86
ix
LIST OF FIGURES
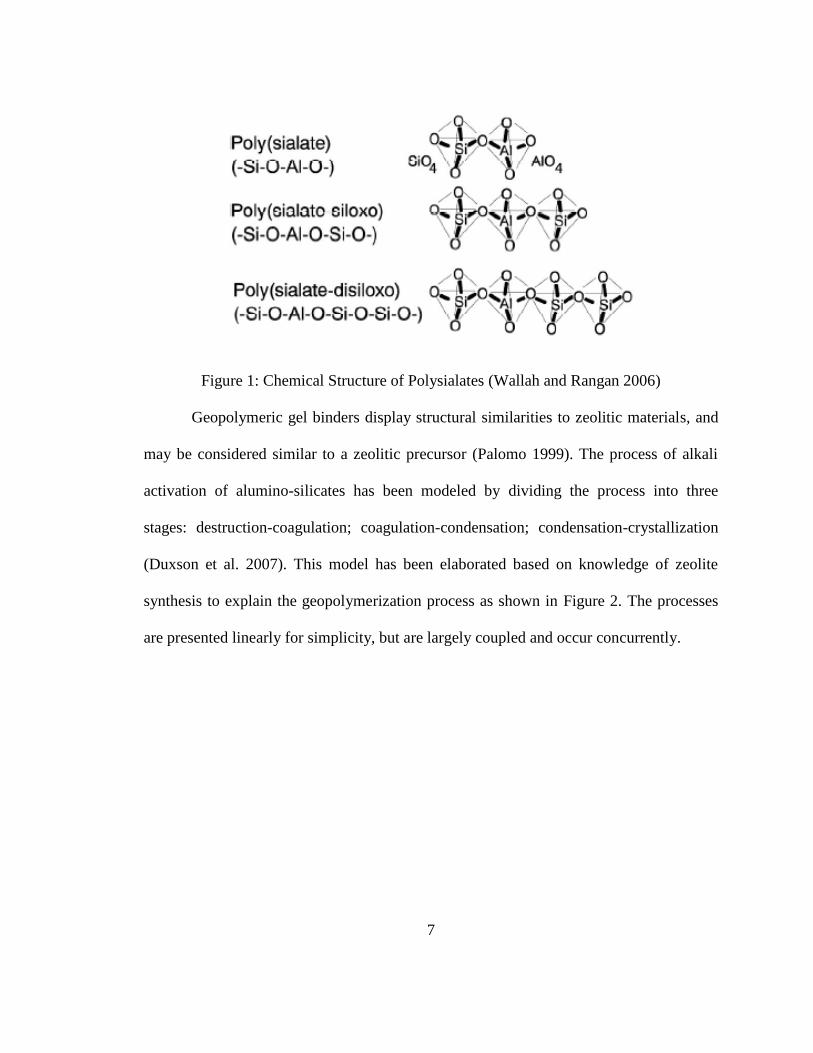
Figure 1: Chemical Structure of Polysialates (Wallah and Rangan 2006) ....................................... 7
Figure 2: Conceptual Model for Geopolymerization (Duxson et al. 2007) ..................................... 8
Figure 3: Geopolymerization Reaction of an Alumino-Silicate (Davidovits 1991) ........................ 9
Figure 4: Different Types of Fly Ash............................................................................................. 18
Figure 5: Chloride Attack of Steel Reinforcement through Concrete (Broomfield 1997) ............. 21
Figure 6: Corrosion Reaction of Reinforcement (Broomfield 1997) ............................................. 22
Figure 7: Polyolefin Fibers from 3M ............................................................................................. 24
Figure 8: Left: Fly Ash (top), Sand (bottom) - Right: Pearock ...................................................... 27
Figure 9: Alkali Liquids Prior to Mixing (sodium hydroxide, sodium silicate, water).................. 32
Figure 10: Preparation of Sodium Hydroxide Solution ................................................................. 33
Figure 11: Wooden Mold Coated with Diesel Prior to Casting ..................................................... 34
Figure 12: Polyolefin Fiber Addition to Dry Materials ................................................................. 35
Figure 13: Freshly Mixed Geopolymer Concrete .......................................................................... 35
Figure 14: Manual Rodding of Geopolymer Concrete Beams ....................................................... 36
Figure 15: Geopolymer Concrete Compaction with Concrete Vibrator ........................................ 37
Figure 16: Rebar Placement in Geopolymer Concrete Beam ........................................................ 37
Figure 17: Finishing the Beam Specimens .................................................................................... 38
Figure 18: Weighing Beams After De-Molding ............................................................................ 39
Figure 19: Heat Curing of Geopolymer Concrete Cylindrical Specimens .................................... 39
x
Figure 20: Heat Curing of Geopolymer Concrete Beam Specimens ............................................. 40
Figure 21: FDOT Accelerated Corrosion Test Schematic ............................................................. 42
Figure 22: GPC Beams Used for Corrosion................................................................................... 43
Figure 23: Accelerated Corrosion Testing Schematic ................................................................... 46
Figure 24: Accelerated Corrosion Test Setup in the Laboratory ................................................... 47
Figure 25: Compressive Strength Testing Machine ....................................................................... 48
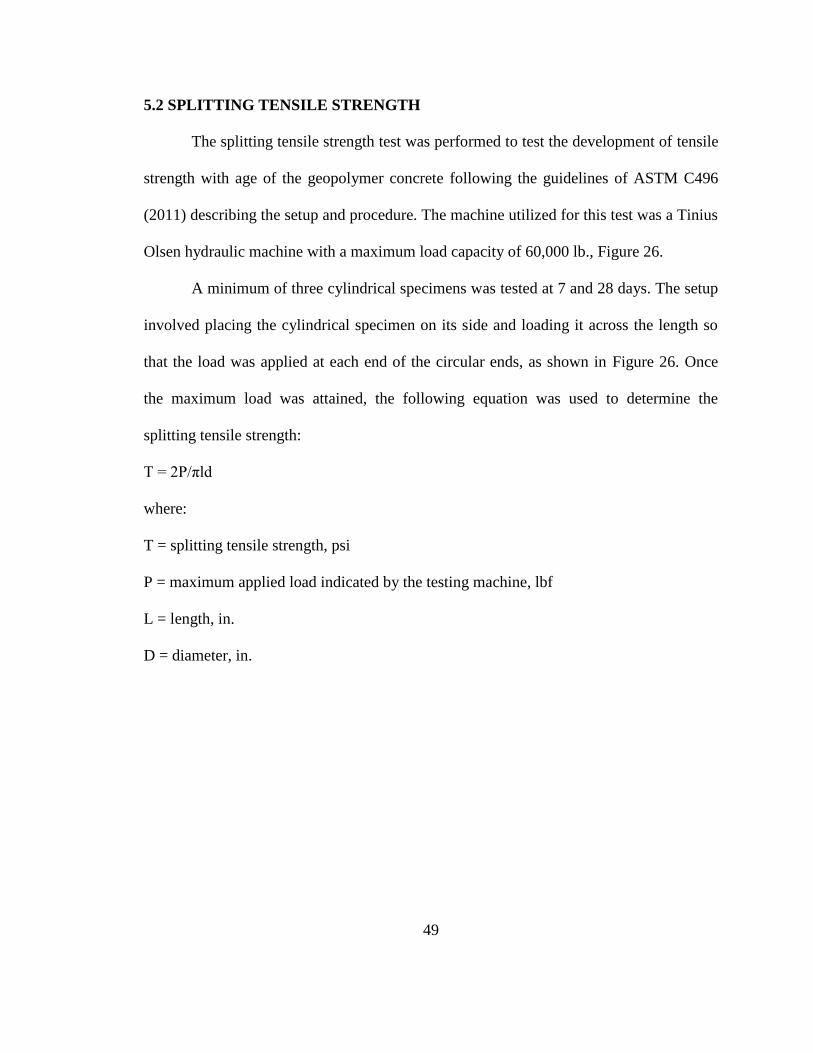
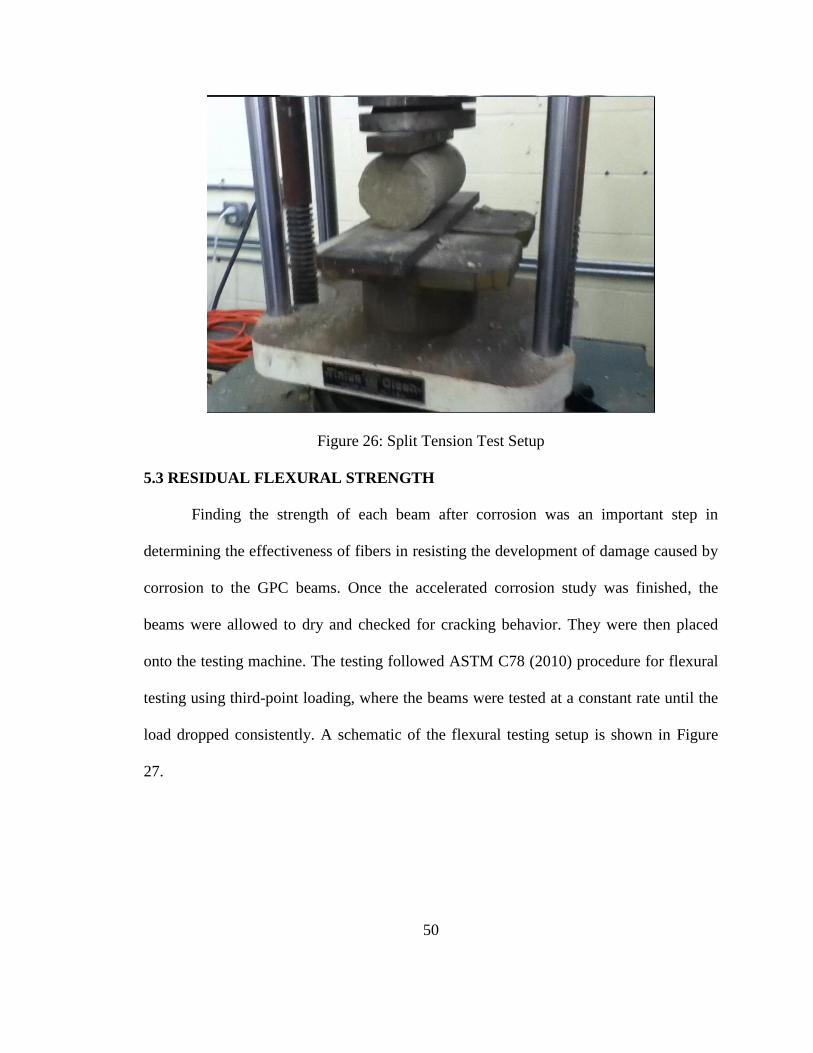
Figure 26: Split Tension Test Setup ............................................................................................... 50
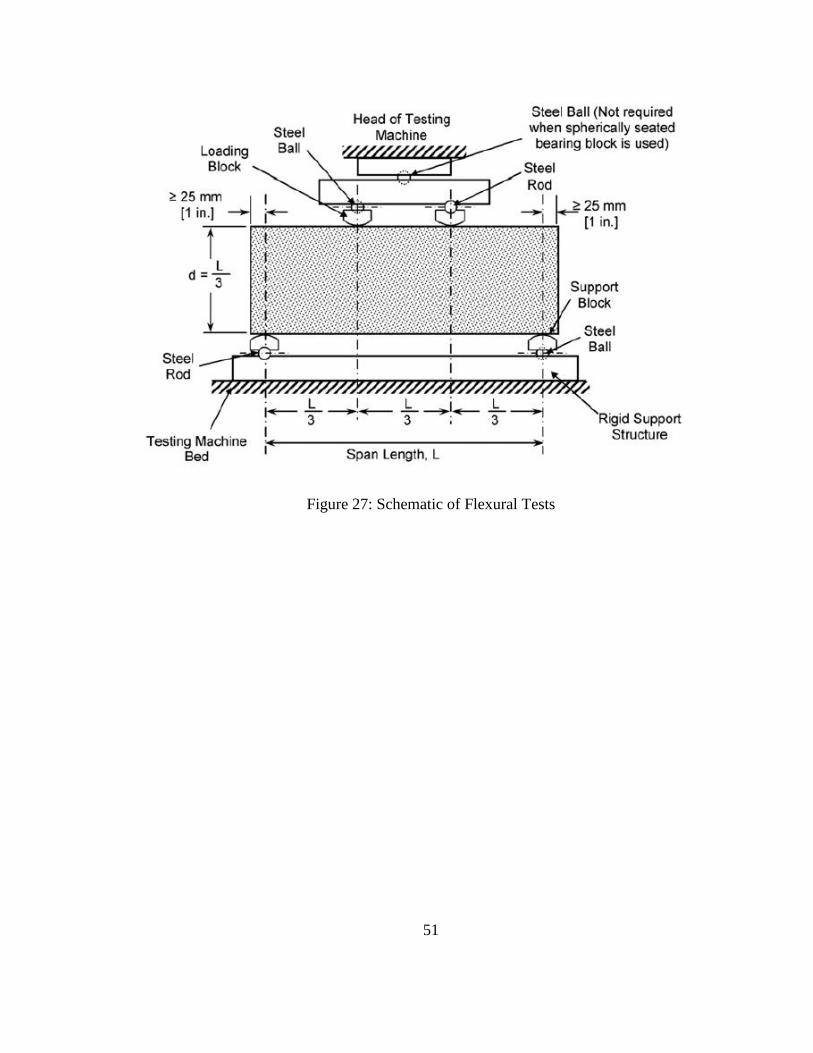
Figure 27: Schematic of Flexural Tests ......................................................................................... 51
Figure 28: Compressive Cylinder Failure ...................................................................................... 53
Figure 29: Splitting Tensile Cylinder Failure ................................................................................ 54
Figure 30: GPC Current Readings vs. OPC (Edouard 2011) ......................................................... 56
Figure 31: Current Readings for All GPC Beams .......................................................................... 57
Figure 32: Drilled Holes in GPC Specimens ................................................................................. 59
Figure 33: Current Readings for GPC wihout Holes ..................................................................... 60
Figure 34: GPC 6-0.1: Corrosion Product Beginning to Form ...................................................... 60
Figure 35: Current Readings for GPC with Holes ......................................................................... 62
Figure 36: Cracking Along Length of GPC Beam ......................................................................... 64
Figure 37: Mass Loss Measurements for GPC with Holes ............................................................ 67
Figure 38: Mass Loss Measurements for GPC without Holes ....................................................... 67
Figure 39: Partially Corroded Steel Rebar Reinforcment .............................................................. 68
Figure 40: Flexural Testing Loads (No Fibers) ............................................................................. 70
Figure 41: Flexural Testing Loads (0.1% Fibers) .......................................................................... 70
Figure 42: Flexural Testing Loads (0.3% Fibers) .......................................................................... 71
Figure 43: Flexural Testing Loads (0.5% Fibers) .......................................................................... 71
xi
Figure 44: Residual Flexural Load (GPC without holes)............................................................... 73
Figure 45: Average Residual Flexural Load (GPC with holes) ..................................................... 73
Figure 46: GPC Beam at Failure .................................................................................................... 74
Figure 47: Fracture of Fiber Reinforced GPC Beam ..................................................................... 74
1
CHAPTER 1: INTRODUCTION
1.1 GENERAL
Green building has become an ever-growing concept in the construction industry
given how the production of new materials affects the environment. Companies are
becoming more conscientious about the amount of new materials that must be used
during a construction project and have turned to the use of recycled materials and
efficiency during construction to help reduce the amount of materials that must be
expended throughout the lifetime of any structure. One way in which construction
negatively affects the environment is through cement production, a required product in
the manufacture of concrete.
Cement production throughout the world has increased over the years, with 3.6
billion tons of cement having been produced in 2011 (Armstrong 2012). A side-effect of
cement production is the release of carbon dioxide (CO2) into the atmosphere caused by
the calcination of limestone and the combustion of fossil fuels during the process. The
production of 1 ton of cement contributes about 1 ton of CO2 into the atmosphere
(Malhotra 1999). With the demand for cement growing annually, researchers have found
ways to reduce the amount of cement required in the production of concrete. The use of
recycled materials and admixtures into concrete has been an area of research which has
found methods of using less cement in a concrete mix while still retaining the favorable
2
characteristics of concrete. One such admixture which has been used in concrete to
replace a significant amount of cement in a mix is fly ash.
Fly ash is a by-product of coal burning typically done in power plants. In the
United States the production of fly ash is in the order of 60 million tons for the year 2011.
From this fly ash produced, only about 23 million tons are used beneficially, most of
which is being used in concrete products (ACAA 2012). Using fly ash in the manufacture
of concrete can help limit the amount of cement required in a concrete mixture and
reduce the amount of fly ash that is landfilled each year. Researchers have found a way to
make concrete by fully replacing the cement content with fly ash, known as geopolymer
concrete.
Geopolymers were conceived by Davidovits (1991) as inorganic polymers
produced when an aluminosilicate, such as fly ash, is activated by an alkali silicate and
alkali hydroxide. When activated, the fly ash goes through geopolymerization process
that produces a semi-crystalline structure similar to that of ordinary Portland cement
concrete. Geopolymers offer many of the benefits of a polymer with the strength
characteristics of concrete. With the development of geopolymers, researchers have been
able to develop concepts for geopolymer concrete.
Low-calcium fly ash-based geopolymer concrete (GPC) mixes were tested at
Curtin University following the work of previous researchers on geopolymer technology
(Hardjito and Rangan 2005). GPC was shown to have high compressive strengths, greater
than 6000 psi, and was rapid setting requiring low temperature heat curing. The aggregate
composition of the GPC was similar to that of ordinary Portland cement (OPC) concrete
3
and did not require water for curing as there is no hydration process. Given the properties
of geopolymers, such as low permeability, rapid setting time, and high strength,
geopolymer concrete may be suitable for use in an environment in which concrete is
exposed to excess water.
Reinforced concrete in a marine environment is susceptible to corrosion of the
steel rebar reinforcement. The corrosion reaction of the steel rebar causes rust product to
form along the surface of the steel reinforcement and apply pressure to the surrounding
concrete. The tensile forces that form along the concrete eventually lead to cracking to
form in the concrete, and ultimately failure. Due to its permeability and the hydration
process, OPC concrete is vulnerable to attack from chlorides found in seawater. Fiber
reinforcement of the concrete has been used as a secondary method to arrest the
propagation of cracks in concrete exposed to a marine environment. Many different types
and sizes of fibers have been used to prevent cracks from spreading, with the most
common being steel and synthetic fibers. Finding an ideal concrete mix as well as using
the right amount of fibers is important in reducing damage done to a structure by
corrosion.
In a study conducted here at Florida Atlantic University (Edouard 2011) the
corrosion resistance of two concrete mixes, OPC and GPC, was tested through an
accelerated corrosion laboratory test. In the time span of the study, reinforcement in OPC
specimens corroded and clear signs of corrosion-induced cracking were visible, while
GPC specimens showed no signs of corrosion or damage. This shows that a geopolymer
concrete structure in a marine environment may have a longer service life than a structure
4
produced with ordinary Portland cement concrete, reducing the cost and need of repair to
the structure. This earlier study, however, left a question about the amount of time it
would take for GPC to show signs of corrosion damage, as well as how GPC
performance in a marine environment could be improved. One way to improve the
corrosion performance of GPC in a marine environment is through fiber reinforcement.
1.2 RESEARCH OBJECTIVE
The objective of this study is to experimentally evaluate the durability of fiber-
reinforced geopolymer concrete subjected to a simulated marine environment. When
chloride ions from seawater penetrate through the concrete and reach the steel
reinforcement, rust is formed that expands and leads to tensile cracking of the
surrounding concrete. When trying to prevent corrosion-induced cracking in concrete the
type of concrete used is important. In the work performed by Edouard (2011) and Reddy,
Edouard, and Sobhan (2013), GPC was shown to have greater corrosion resistance than
OPC for the period of testing, with GPC beams showing no signs of corrosion while OPC
beams had significant corrosion-induced damage. As a method of improving corrosion
resistance of concrete the addition of fibers was tested. Fiber reinforcement has been used
in concrete as secondary reinforcement to aid in arresting crack propagation (Bentur and
Mindess 2007). Some researchers have found that fiber addition in concrete can delay
corrosion by preventing cracking (Kakooei et al. 2012). This study is meant to find an
improvement for concrete exposed to the marine environment by testing the beneficial
effects of fiber addition to geopolymer concrete.
The main goals of this research were:
5
To evaluate the resistance to corrosion of no-fiber and fiber-reinforced GPC with
induced current in the rebar
To determine the beneficial effects of polyolefin fibers in GPC in arresting
corrosion-induced cracks, through a crack scoring analysis
To evaluate the residual flexural strength of no-fiber and fiber-reinforced GPC
after corrosion damage
1.3 SCOPE OF WORK
The concrete used in this study was low-calcium fly ash geopolymer concrete that
followed closely the manufacturing procedures of ordinary Portland cement concrete.
Both cylinders and beams were made to test the strength and corrosion durability of GPC.
Some of the beams manufactured also included addition of polyolefin fibers in different
volume percentages.
The initial part of the experiments consisted of compressive and splitting tensile
strength tests of cylinders to determine the properties of the geopolymer concrete at
different ages. The next part of the experiment involved accelerated corrosion testing of
centrally reinforced beams to investigate the effects of fiber addition on the cracking
behavior of geopolymer concrete after corrosion of the reinforcement. After testing for
corrosion, the final step was to evaluate residual flexural strength of the geopolymer
concrete beams, and quantify the performance of GPC through crack scoring analysis and
determining the mass loss of the reinforcing steel.
6
CHAPTER 2: LITERATURE REVIEW
2.1 GEOPOLYMERS
2.1.1 Terminology and Chemistry
In the search for inorganic-polymer technologies in 1978, Davidovits found
“similar hydrothermal conditions which were controlling the synthesis of organic
phenolic plastics on one hand, and of mineral feldspathoids and zeolites on the other
hand” (Davidovits 1991). Using mineral chemistry for development of mineral binders
and mineral polymers, led to the development of amorphous to semi-crystalline three
dimensional silico-aluminate structures which were termed ‘geopolymers.’
Poly(sialate) was suggested as the chemical designation of geopolymers based on
silico-aluminates. The sialate network consists of SiO4 and AlO4 tetrahedra linked
alternately by sharing all the oxygens. Poly(sialates) are chain and ring polymers with
Si4+
and Al3+
in IV-fold coordination with oxygen and range from amorphous to semi-
crystalline, having an empirical formula:
Mn{-(SiO2)z-AlO2}n*wH2O Eq. 1
where M is a cation such as potassium or sodium, ‘n’ is a degree of polycondensation,
and ‘z’ is 1, 2, 3. Three types of silico-aluminate structures from polymerization reactions
are shown in Figure 1.
7
Figure 1: Chemical Structure of Polysialates (Wallah and Rangan 2006)
Geopolymeric gel binders display structural similarities to zeolitic materials, and
may be considered similar to a zeolitic precursor (Palomo 1999). The process of alkali
activation of alumino-silicates has been modeled by dividing the process into three
stages: destruction-coagulation; coagulation-condensation; condensation-crystallization
(Duxson et al. 2007). This model has been elaborated based on knowledge of zeolite
synthesis to explain the geopolymerization process as shown in Figure 2. The processes
are presented linearly for simplicity, but are largely coupled and occur concurrently.
8
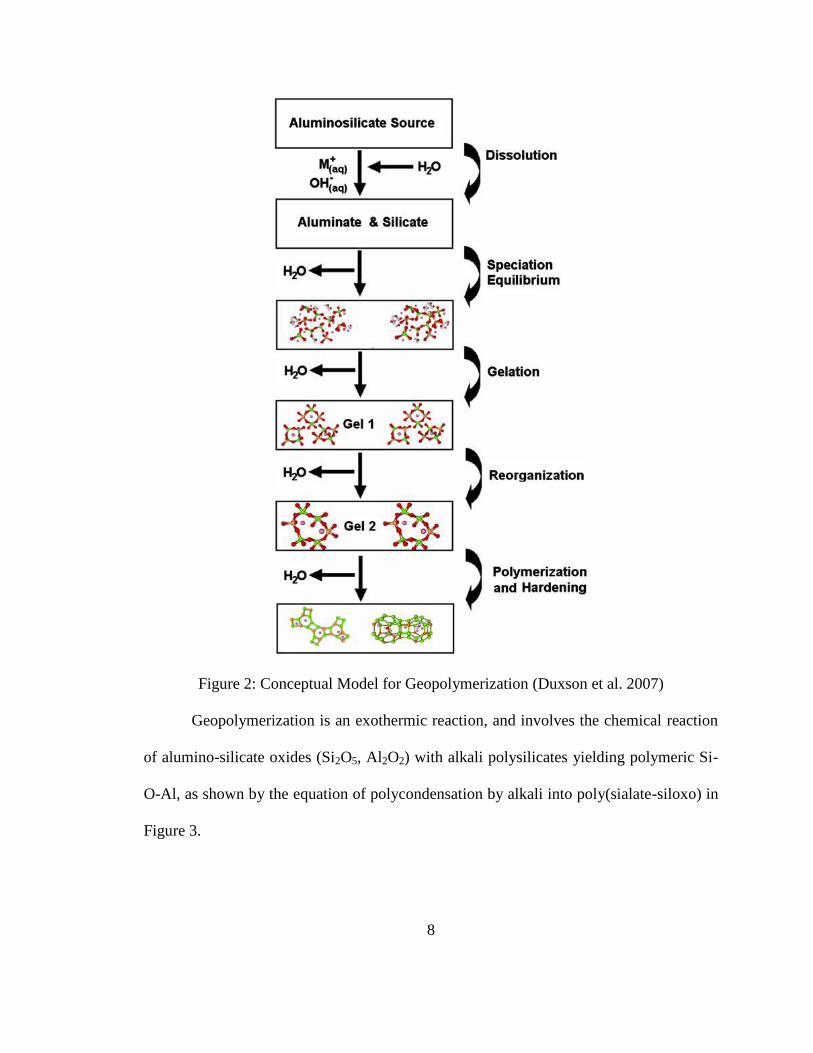
Figure 2: Conceptual Model for Geopolymerization (Duxson et al. 2007)
Geopolymerization is an exothermic reaction, and involves the chemical reaction
of alumino-silicate oxides (Si2O5, Al2O2) with alkali polysilicates yielding polymeric Si-
O-Al, as shown by the equation of polycondensation by alkali into poly(sialate-siloxo) in
Figure 3.
9
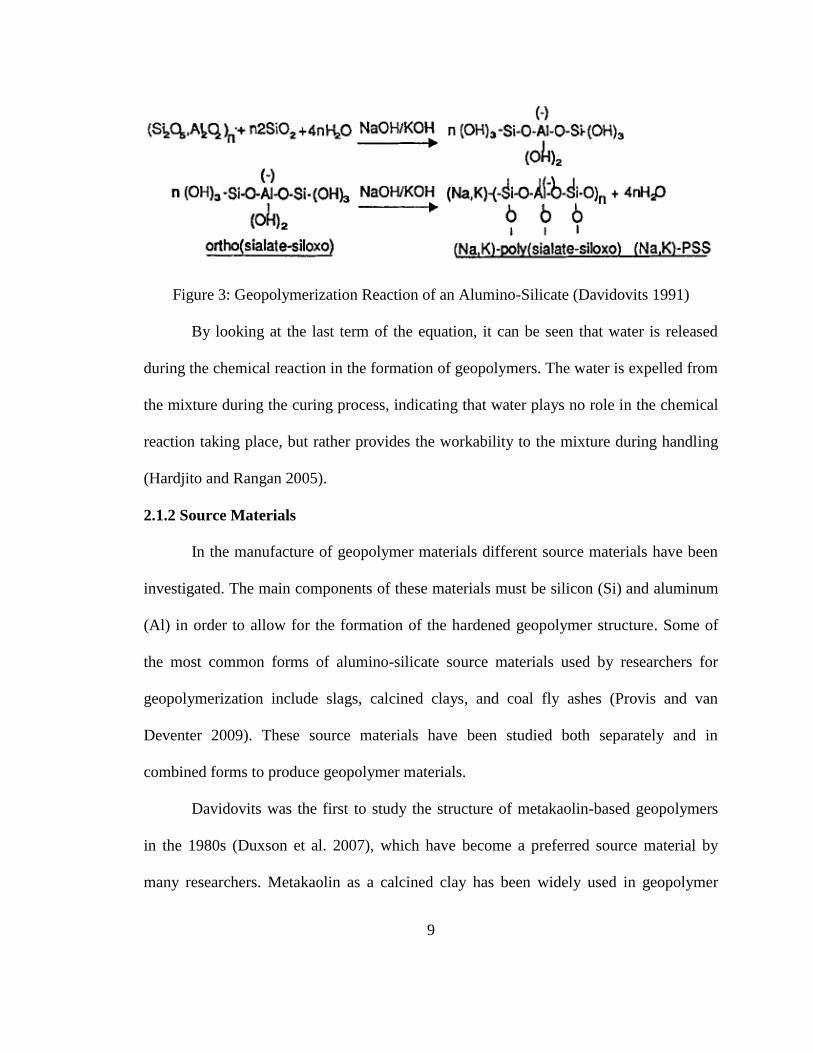
Figure 3: Geopolymerization Reaction of an Alumino-Silicate (Davidovits 1991)
By looking at the last term of the equation, it can be seen that water is released
during the chemical reaction in the formation of geopolymers. The water is expelled from
the mixture during the curing process, indicating that water plays no role in the chemical
reaction taking place, but rather provides the workability to the mixture during handling
(Hardjito and Rangan 2005).
2.1.2 Source Materials
In the manufacture of geopolymer materials different source materials have been
investigated. The main components of these materials must be silicon (Si) and aluminum
(Al) in order to allow for the formation of the hardened geopolymer structure. Some of
the most common forms of alumino-silicate source materials used by researchers for
geopolymerization include slags, calcined clays, and coal fly ashes (Provis and van
Deventer 2009). These source materials have been studied both separately and in
combined forms to produce geopolymer materials.
Davidovits was the first to study the structure of metakaolin-based geopolymers
in the 1980s (Duxson et al. 2007), which have become a preferred source material by
many researchers. Metakaolin as a calcined clay has been widely used in geopolymer
10
synthesis, but its plate-like particle morphology tends to give an unfeasibly high water
demand in geopolymer concrete applications (Provis and Van Deventer 2009).
Unlike the heterogeneity of the metakaolin, the composition of fly ash is highly
variable depending on the source of coal, but still provides the needed silicon (Si) and
aluminum (Al) content required for the geopolymerization process. Van Jaarsveld (1996,
1999) conducted an investigation into the potential of geopolymer concretes to
immobilize toxic metals, mainly from waste materials such as fly ash, contaminated soil,
mine tailings, and even building waste. These materials contain large amounts of silica
and alumina which allow them to be utilized as geopolymerization reagents. This study
concluded that heavy metals could be immobilized inside a geopolymer concrete made
from different fly ashes, without affecting the geopolymerization process; and the
geopolymer concrete produced had “fairly high” compressive strengths such that it could
be used in structural applications.
In the production of fly ash geopolymer concrete, low calcium fly ash, Class F, is
mostly used due to the low calcium (Ca) content. Higher calcium contents may interfere
with the polymerization process and alter the microstructure (Hardjito and Rangan 2005)
Also, high-calcium, Class C, fly ashes have not been subjected to as much analysis as
Class F fly ashes (Provis and Van Deventer 2009). Other researchers have investigated
the ability of multiple types of Class F fly ashes to be activated by sodium hydroxide
(NaOH) forming into alkaline activated cements (Fernandez-Jimenez and Palomo 2003).
They concluded that most Class F fly ashes have the ability to be alkali-activated,
generating a material with very good cementitious properties. Also determined in this
11
study were fly ash properties that lead to optimal binding properties: percentage of
unburned material lower than 5%, Fe2O3 content not higher than 10%, low content of
CaO, content of reactive silica between 40-50%, percentage of particles with size lower
than 45µm between 80 and 90%, and high content of vitreous phase.
Some researchers have even looked into the production of geopolymer concrete
using a mixture of alumino-silicate materials (Van Jaarsveld et al. 2002, Xu and Van
Deventer 2002). In the study performed by Xu and Van Deventer (2002) three reagent
materials, fly ash, kaolinite, and albite, were used in different combinations to synthesize
geopolymer mixtures. The mixture of a calcined source material, fly ash, and non-
calcined materials, kaolinite and albite, provided a significant improvement in
compressive strength and reduction in reaction time.
2.1.3 Alkaline Liquids
In looking at the alkaline liquids used in geopolymerization, various researchers
have found that different combinations of alkali-silicates and alkali-hydroxides are ideal.
Based on research done by Palomo et al. (1999), when the alkali solution contains soluble
silicates (sodium or potassium silicate), the geopolymerization reactions occur at a higher
rate than when hydroxides are used as activators. Thus, the type of solution used for
activation is critical in the development of reactions. The reaction between alkaline
solution containing sodium hydroxide (NaOH) or potassium hydroxide (KOH) was also
studied. When activating multiple natural Al-Si minerals, higher extent of dissolution was
observed when in NaOH than in KOH (Xu and Van Deventer 2000).
12
More recently Hardjito and Rangan, and Wallah and Rangan (2005, 2006) began
an extensive study into the development and properties of low-calcium fly ash-based
geopolymer concrete. In the first study (Hardjito and Rangan 2005) the effects of
activator solution combinations were tested in the production of fly-ash based
geopolymer concrete. Different amounts of sodium silicate solution were used, as well as
different amounts of sodium hydroxide solution with molarities ranging from 8M to 16M.
It was concluded that higher concentration (in molar units) of sodium hydroxide results in
higher compressive strength and higher ratio of sodium silicate-to-sodium hydroxide ratio
by mass results in higher compressive strength.
2.1.4 Mix Proportions
Many previous researchers have studied the properties of geopolymer paste, but
few focused on mixes for geopolymer concrete. Bakharev (2004) utilized sodium
hydroxide, potassium hydroxide, and sodium silicate solutions in the activation of fly ash,
with a water-to-binder ratio of 0.3. Compressive strength tests showed that samples with
sodium silicate as the activator had higher compressive strengths at 66 MPa. Palomo et
al. (1999) studied four different solutions with activator-to-fly ash ratio of 0.25 and 0.3.
The highest compressive strengths, greather than 60 MPa, came from samples prepared
with both sodium silicate and sodium hydroxide.
Drawing from the work of previous researchers, Hardjito and Rangan (2005)
began to investigate the properties and mix proportions of a geopolymer concrete.
Locally available Class F fly ash was used as the main source material for the production
of the low-calcium fly ash geopolymer concrete. Various amounts of sodium hydroxide
13
(NaOH) solution with varying concentrations, and varying amounts of sodium silicate
solution were studied. The makeup of the geopolymer mix followed with standard
practices in development of ordinary Portland cement (OPC) concretes, with coarse and
fine aggregates making up about 75-80% of the mass. Based on different water-to-
geopolymer solids (solid fly ash and solid sodium hydroxide and sodium silicate) ratios,
different compressive strengths were evaluated with the lower ratio of 0.16 water-to-
geopolymer solids ratio having the highest design compressive strength, but the lowest
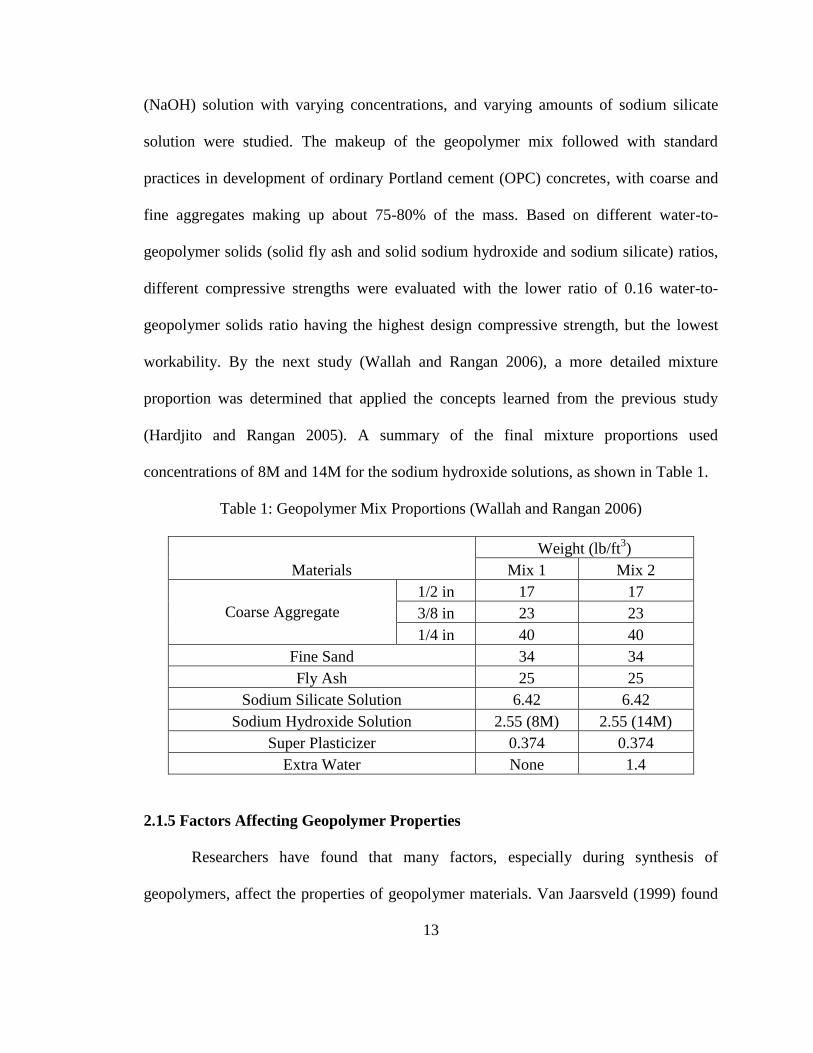
workability. By the next study (Wallah and Rangan 2006), a more detailed mixture
proportion was determined that applied the concepts learned from the previous study
(Hardjito and Rangan 2005). A summary of the final mixture proportions used
concentrations of 8M and 14M for the sodium hydroxide solutions, as shown in Table 1.
Table 1: Geopolymer Mix Proportions (Wallah and Rangan 2006)
Materials
Weight (lb/ft3)
Mix 1 Mix 2
Coarse Aggregate
1/2 in 17 17
3/8 in 23 23
1/4 in 40 40
Fine Sand 34 34
Fly Ash 25 25
Sodium Silicate Solution 6.42 6.42
Sodium Hydroxide Solution 2.55 (8M) 2.55 (14M)
Super Plasticizer 0.374 0.374
Extra Water None 1.4
2.1.5 Factors Affecting Geopolymer Properties
Researchers have found that many factors, especially during synthesis of
geopolymers, affect the properties of geopolymer materials. Van Jaarsveld (1999) found
14
that the presence of heavy metals do not greatly affect the formation of a polymeric
structure, but may affect physical properties of the geopolymer material formed. When
temperature and time of curing are considered, Palomo et al. (1999) concluded that
temperature is a reaction accelerator, causing reaction steps to overlap each other,
meaning that temperature increases result in the gain of mechanical strength. Also, when
alkali solution contains soluble silicates in the form of sodium or potassium silicate, the
reactions occur at higher rates than when alkali hydroxides are used alone. Palomo et al.
(1999) also discuss that longer time of curing, at temperatures varying from 65 to 85°C,
results in higher compressive strength.
In testing geopolymerization of 16 natural Al-Si minerals Xu and Van Deventer
(2000) concluded that the minerals prepared with NaOH experience a higher extent of
dissolution than those prepared with KOH. “Factors usch as %CaO, %K2O and the molar
Si-Al ratio in the original mineral, the type of alkali, the extent of dissolution of Si and
the molar Si/Al ratio in solution had a significant correlation with compressive strength”
(Xu and Van Deventer 2000).
A study into the effects of temperature and composition was carried out by Van
Jaarsveld et al. (2002). It was reported that water content, curing as well as calcining
conditions for kaolin clays affected the final properties of a geopolymer. The influence of
mild curing also seemed to improve physical properties, with rapid curing at too high
temperatures resulting in cracking, causing a negative effect on physical properties.
The source materials, as discussed earlier, also affect the properties of
geopolymer concretes. Xu and Van Deventer (2002) found that geopolymers made from
15
fly ash set and hardened within 7 days while geopolymers made from kaolinite and albite
took 28 days to gain their mechanical strength after 28 days.
The work of Hardjito and Rangan (2005) showed factors that affected the mixing
characteristics and properties of low-calcium fly ash-based geopolymer concrete. Higher
compressive strengths were achieved through higher concentration of sodium hydroxide
solution and higher ratio of sodium silicate-to-sodium hydroxide by mass. Curing
temperatures up to 90°C also proved beneficial, while curing times past 24 hours were
not very significant. Although more water increases workability, it also decreases the
compressive strength. Other factors were studied, but the conclusions indicate that fly
ash-based geopolymer concrete has properties which are comparable to OPC concrete.
2.1.6 Geopolymer Applications
In terms of applications of geopolymer materials, Davidovits (2002) has
developed patents for potential uses based on the strength characteristics of geopolymers
as well as fire-resistance and durability. Some of the significant applications of
geopolymers include: fire resistant wood panels; insulated panels and walls; decorative
stone artifacts; foamed geopolymer panels for thermal insulation; low-tech building
materials; energy low ceramic tiles; refractory items; thermal shock refractory; aluminum
foundry application; geopolymer cement and concrete; fire resistant and fire proof
composite for infrastructures repair and strengthening; fireproof high-tech applications,
aircraft interior, automobile; and high-tech resin systems.
Balaguru et al. (1997) investigated the potential for geopolymers to be used in
repair and rehabilitation of reinforced concrete beams. They found that geopolymer can
16
bond carbon fabrics to reinforced concrete beams and failure by delamination of
composite can be eliminated. Geopolymer performance was shown to be better than
organic polymers for adhesion, and showed properties of fire resistance, durability under
UV light, and lack of toxic substances in the composition making it safe to discard as
ordinary waste.
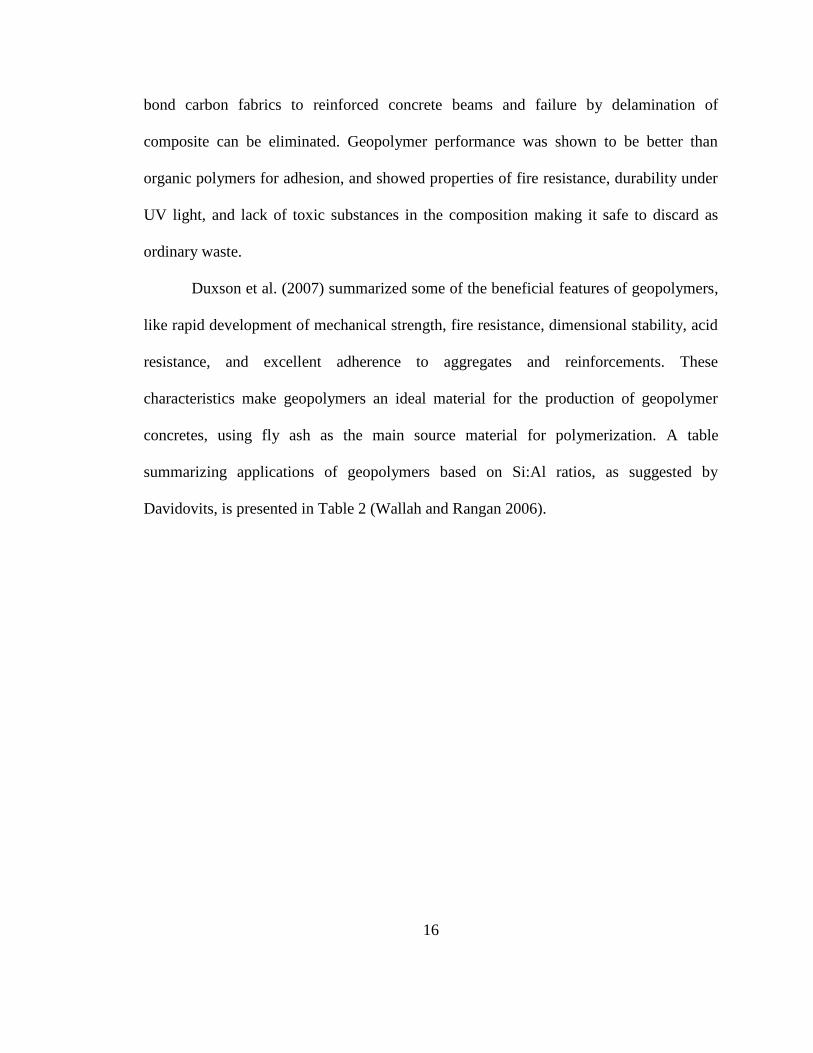
Duxson et al. (2007) summarized some of the beneficial features of geopolymers,
like rapid development of mechanical strength, fire resistance, dimensional stability, acid
resistance, and excellent adherence to aggregates and reinforcements. These
characteristics make geopolymers an ideal material for the production of geopolymer
concretes, using fly ash as the main source material for polymerization. A table
summarizing applications of geopolymers based on Si:Al ratios, as suggested by
Davidovits, is presented in Table 2 (Wallah and Rangan 2006).
17
Table 2: Geopolymer Applications by Si:Al ratio
Si: Al ratio Applications
1
- Bricks
- Ceramics
- Fire protection
2 - Low CO2 cements and concretes
- Radioactive and toxic waste encapsulation
3
- Fire protection fibre glass composite
- Foundry equpiments
- Heat resistant composites, 200°C to 1000°C
- Tooling for aeronautics titanium process
>3 - Sealants for industry, 200C to 600C
- Tooling for aeronautics SPF aluminum
20-35 - Fire resistant and heat resistant fiber composites
Hardjito and Rangan, and Wallah and Rangan (2005, 2006) investigated the
properties of low-calcium fly ash-based geopolymer concrete. The properties of the
geopolymer concrete met the mechanical strength characteristics required of ordinary
Portland cement (OPC) concrete, such as compressive strength and tensile strength, and
in most cases outperformed the OPC.
2.2 FLY ASH
The production of coal fly ash is a by-product of coal-fired power stations. Power
stations commonly employ a dry-bottom furnace boiler and when pulverized coal is
combusted the ash produced leaves the furnace in the flue gas and is collected using
electrostatic precipitation. Coal fly ash, or fly ash, is defined as the finely divided residue
18
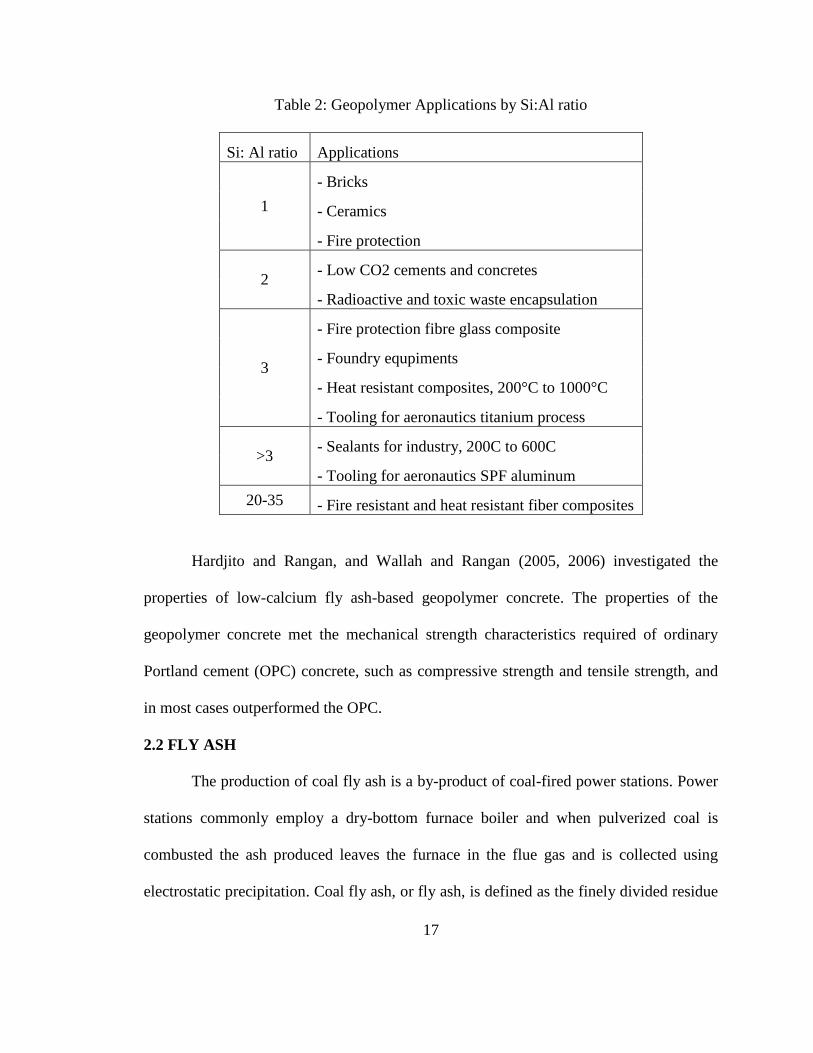
that results from combustion of ground or powdered coal and that is transported by flue
gasses (ASTM C618 2012). Fly ash can have a different appearance, as shown in Figure
4, depending on the source of the fly ash.
Figure 4: Different Types of Fly Ash
The properties of fly ash are determined by the different types and amounts of
incombustible material present in each individual coal particle. The main constituents of
fly ash are generally aluminum, silicon, and iron oxides, and some amount of calcium.
Fly ash particles are spherical in nature, ranging in diameter from less than 1 µm to no
more than 150 µm, and must have fineness as defined by ASTM C618 (2012) of no more
than 35% retained on a 45 µm sieve. Some fly ashes have pozzolanic and/or cementitious
properties, which make them ideal for substitution as binders in concrete materials.
19
Fly ashes are generally made up of aluminum, silicon, and iron oxides, with other
minerals present depending on the source of the coal. There are two categories in which
fly ash can be classified: Class F, which is typically produced from burning anthracite or
bituminous coal; and Class C, which is typically produced from burning lignite or
subbituminous coal. ASTM C618 (2012) classifies class F fly ash as containing a
minimum amount of silicon dioxide (SiO2) plus aluminum oxide (Al2O3) plus iron oxide
(Fe2O3) of 70%, whereas class C fly ash must contain a minimum of 50% of the same
chemical constituents. Class F fly ashes will normally have a low calcium oxide (CaO)
content (less than 10%), while Class C fly ashes may contain more than 10% and often
15-30% calcium oxide (Nawy 2001). For this investigation a low calcium Class F fly ash
is used.
According to an American Coal Ash Association (ACAA) 2011 Coal Combustion
Product (CCP) Production and Use Survey Report, 59.9 million tons (Mt) of fly ash were
produced in 2011, with nearly 12 Mt of the fly ash (20%) being used for concrete and
concrete products. In total, 38% of the fly ash produced in 2011 found beneficial use,
mainly in construction/engineering-related projects, but still 62% is left as a waste
product. Since the majority of the fly ash produced is not used it is disposed in places
such as landfills, lagoons, and abandoned quarries. Worldwide the need for more energy
is seeing the installation of more coal-fired power stations to supply electricity to meet
growing population and manufacturing industries. With an increase in population also
comes a need for more cement in developing countries (Malhotra 1999). By
20
incorporating fly ash into a concrete mixture, the need for cement would be diminished
and the otherwise wasted fly ash could be recycled.
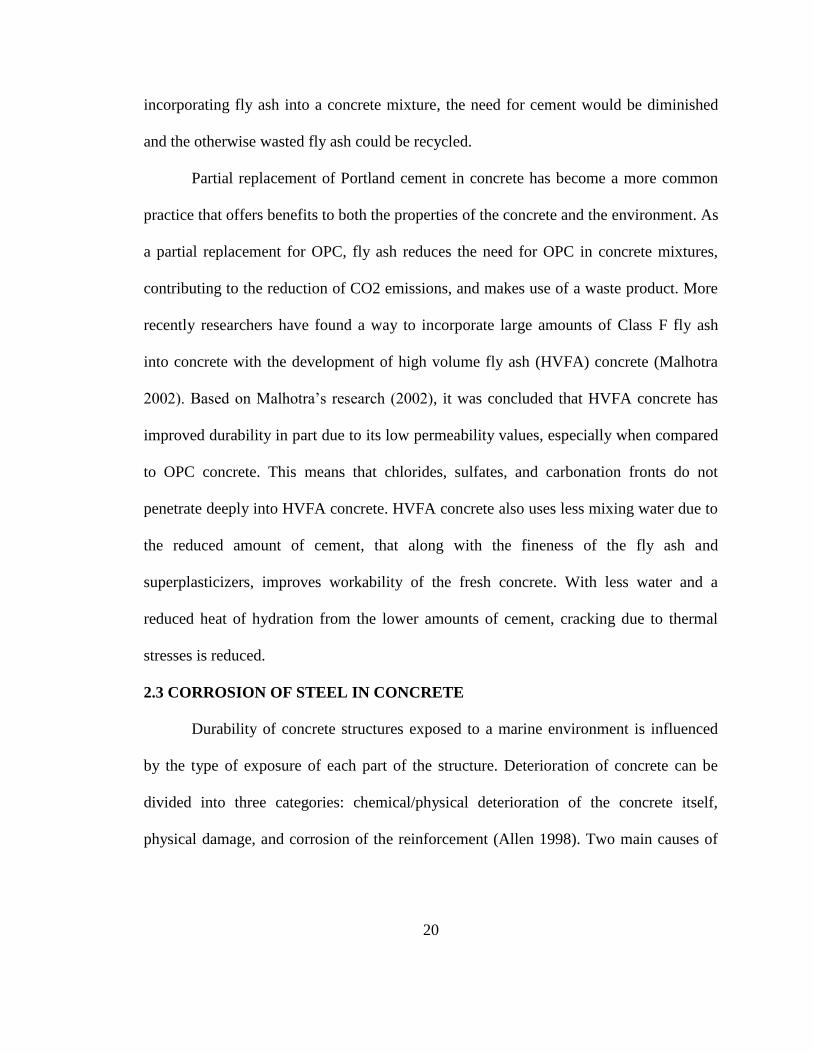
Partial replacement of Portland cement in concrete has become a more common
practice that offers benefits to both the properties of the concrete and the environment. As
a partial replacement for OPC, fly ash reduces the need for OPC in concrete mixtures,
contributing to the reduction of CO2 emissions, and makes use of a waste product. More
recently researchers have found a way to incorporate large amounts of Class F fly ash
into concrete with the development of high volume fly ash (HVFA) concrete (Malhotra
2002). Based on Malhotra’s research (2002), it was concluded that HVFA concrete has
improved durability in part due to its low permeability values, especially when compared
to OPC concrete. This means that chlorides, sulfates, and carbonation fronts do not
penetrate deeply into HVFA concrete. HVFA concrete also uses less mixing water due to
the reduced amount of cement, that along with the fineness of the fly ash and
superplasticizers, improves workability of the fresh concrete. With less water and a
reduced heat of hydration from the lower amounts of cement, cracking due to thermal
stresses is reduced.
2.3 CORROSION OF STEEL IN CONCRETE
Durability of concrete structures exposed to a marine environment is influenced
by the type of exposure of each part of the structure. Deterioration of concrete can be
divided into three categories: chemical/physical deterioration of the concrete itself,
physical damage, and corrosion of the reinforcement (Allen 1998). Two main causes of
21
corrosion of steel in concrete are carbonation and chloride attack. Corrosion due to
chloride attack will be investigated in this paper.
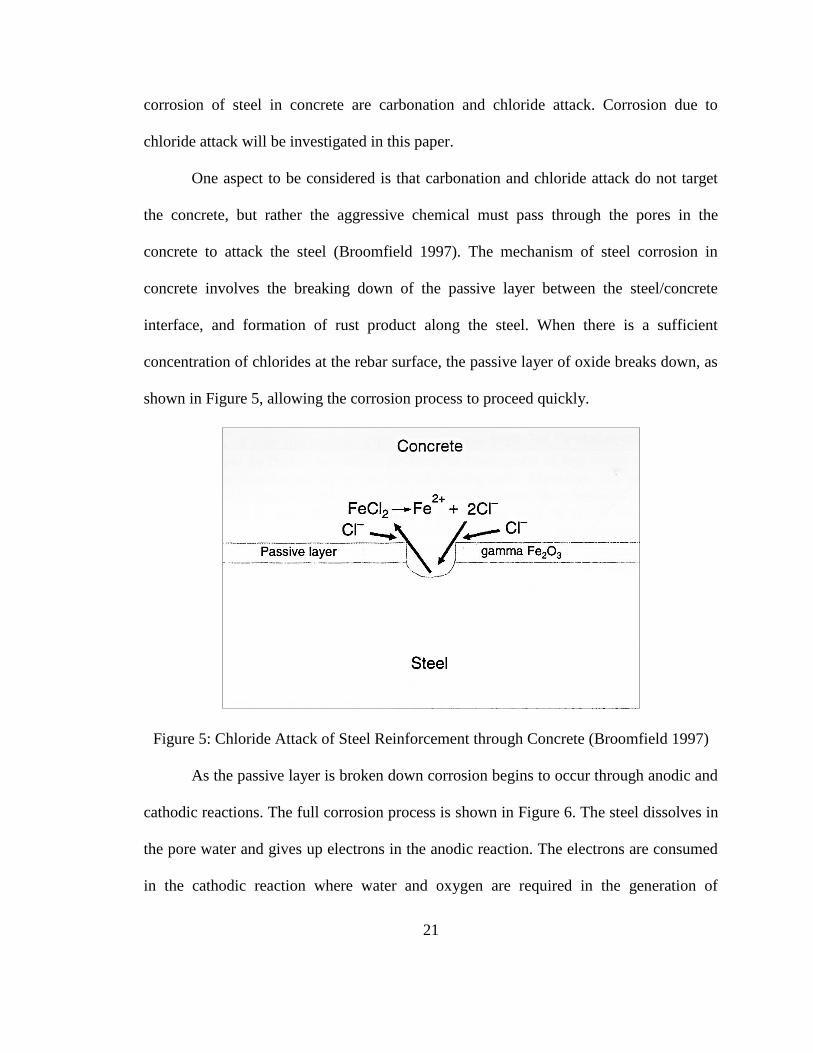
One aspect to be considered is that carbonation and chloride attack do not target
the concrete, but rather the aggressive chemical must pass through the pores in the
concrete to attack the steel (Broomfield 1997). The mechanism of steel corrosion in
concrete involves the breaking down of the passive layer between the steel/concrete
interface, and formation of rust product along the steel. When there is a sufficient
concentration of chlorides at the rebar surface, the passive layer of oxide breaks down, as
shown in Figure 5, allowing the corrosion process to proceed quickly.
Figure 5: Chloride Attack of Steel Reinforcement through Concrete (Broomfield 1997)
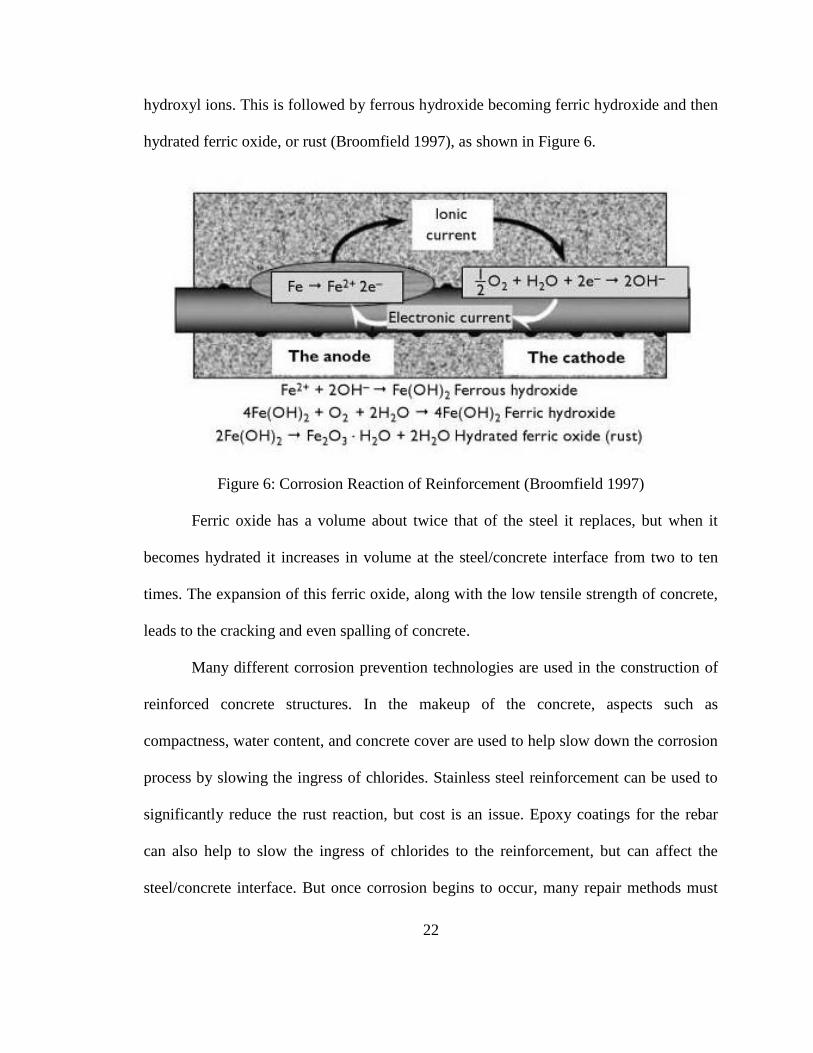
As the passive layer is broken down corrosion begins to occur through anodic and
cathodic reactions. The full corrosion process is shown in Figure 6. The steel dissolves in
the pore water and gives up electrons in the anodic reaction. The electrons are consumed
in the cathodic reaction where water and oxygen are required in the generation of
22
hydroxyl ions. This is followed by ferrous hydroxide becoming ferric hydroxide and then
hydrated ferric oxide, or rust (Broomfield 1997), as shown in Figure 6.
Figure 6: Corrosion Reaction of Reinforcement (Broomfield 1997)
Ferric oxide has a volume about twice that of the steel it replaces, but when it
becomes hydrated it increases in volume at the steel/concrete interface from two to ten
times. The expansion of this ferric oxide, along with the low tensile strength of concrete,
leads to the cracking and even spalling of concrete.
Many different corrosion prevention technologies are used in the construction of
reinforced concrete structures. In the makeup of the concrete, aspects such as
compactness, water content, and concrete cover are used to help slow down the corrosion
process by slowing the ingress of chlorides. Stainless steel reinforcement can be used to
significantly reduce the rust reaction, but cost is an issue. Epoxy coatings for the rebar
can also help to slow the ingress of chlorides to the reinforcement, but can affect the
steel/concrete interface. But once corrosion begins to occur, many repair methods must
23
be implemented to extend the service life of a structure. If corrosion and the corrosion
cracking process could be delayed, the cost for repairs could be minimized.
2.4 FIBER REINFORCEMENT
Fiber reinforcement contributes to the load-carrying capacity of a body that
consists of fibers embedded in a surrounding matrix. The load is transferred through the
matrix to the fiber by shear deformation at the fiber-matrix interface. The load transfer
occurs due to the different physical properties between the fiber and the matrix. In
cementitious composites, fibers serve to increase the fracture toughness of the composite
by the resultant crack arresting processes and increase in tensile and flexural strengths
(Beaudoin 1990).
In fiber reinforced cementitious composites the major role played by the fibers is
in the post-cracking zone, where the fibers bridge across the cracked matrix. In the post-
cracking zone, the fibers can help to increase the strength of the composite over that of
the matrix, which means that after first cracking the stress-strain curve can continue to
ascend. The fibers can also serve to increase toughness of the composite by providing
energy absorption mechanisms (Bentur and Mindess 2007).
Factors in fibers that can affect their effectiveness include the length and
orientation of fibers, the amount of fibers in a mixture, and more importantly the type of
fibers. Since the early use of asbestos fibers a wide variety of other fibers have been used:
conventional fibers such as steel and glass; new fibers such as carbon or Kevlar; and low
modulus synthetic fibers, like polypropylene, and natural fibers (Bentur and Mindess
24
2007). In this investigation the properties of synthetic fibers will be discussed, as well as
general use of fiber reinforcement in concrete.
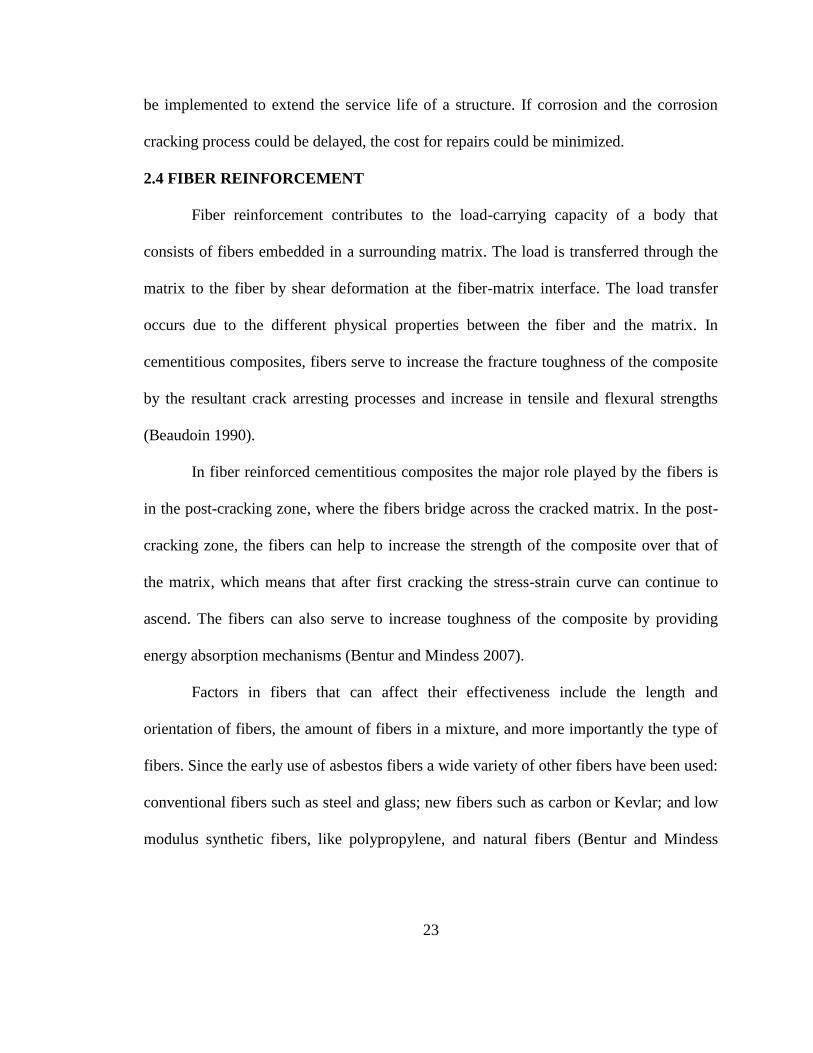
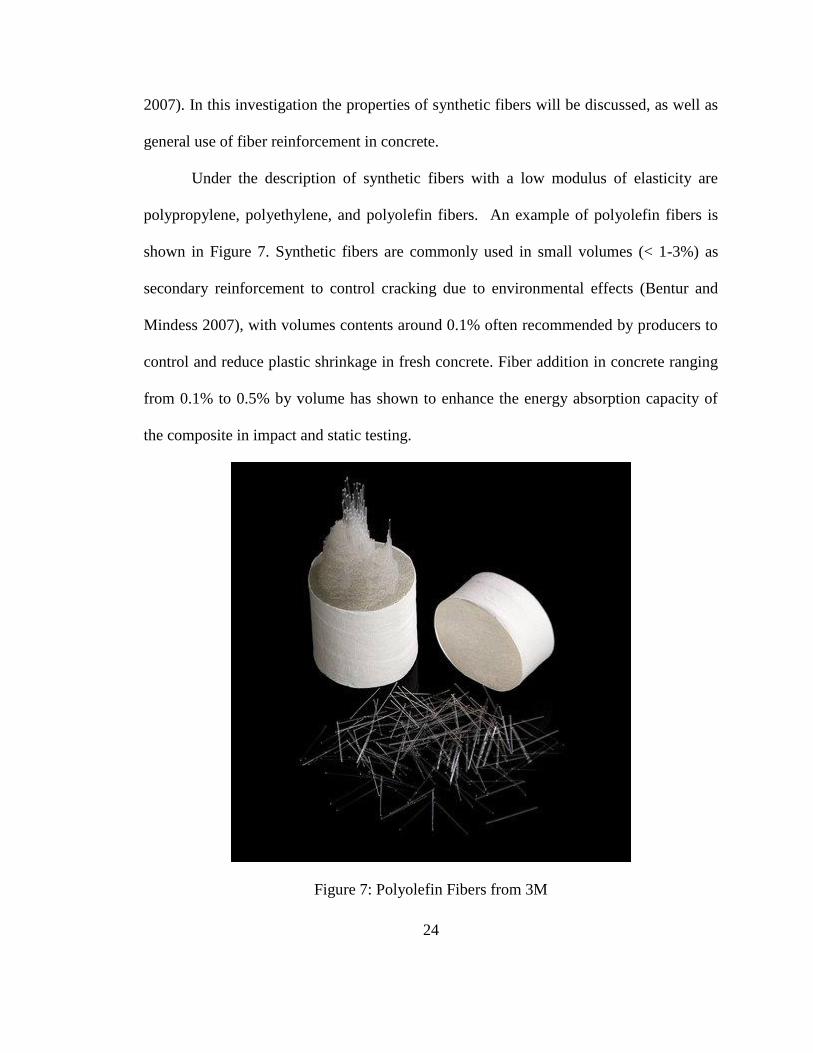
Under the description of synthetic fibers with a low modulus of elasticity are
polypropylene, polyethylene, and polyolefin fibers. An example of polyolefin fibers is
shown in Figure 7. Synthetic fibers are commonly used in small volumes (< 1-3%) as
secondary reinforcement to control cracking due to environmental effects (Bentur and
Mindess 2007), with volumes contents around 0.1% often recommended by producers to
control and reduce plastic shrinkage in fresh concrete. Fiber addition in concrete ranging
from 0.1% to 0.5% by volume has shown to enhance the energy absorption capacity of
the composite in impact and static testing.
Figure 7: Polyolefin Fibers from 3M
25
In a study performed by Van Chanh (2005) there is a discussion on the properties
of steel fiber reinforced concretes. Fibers show little to no improvement in compressive
strength, but tensile strength is increased by as much as 133% when fibers are arranged in
a pattern, with randomly distributed fibers only gaining 60% tensile strength gain. The
main increase in strength comes in the flexural strength of fiber reinforced members with
increases of 100% being found. The strength effects of deformed fibers are also greater
than in straight fibers due to the improved bonding characteristics in deformed fibers.
In studying the bond effects of polyolefin fibers, Tagnit-Hamou et al. (2005) talk
about the possibility of polyolefin fibers having bonding problems with the paste due to
the cylindrical smooth surface of the fibers. Polyolefin fibers have shown to have a
higher impact/static strength ratio and toughness factor than steel fibers. It was also found
that polyolefin fibers, due to their low superficial hardness compared to steel fibers, allow
for a change in the fiber roughness during mixing that increases the adherence of the
polyolefin fibers to a cement paste.
26
CHAPTER 3: MATERIALS USED AND SPECIMEN PREPARATION
3.1 MATERIALS USED
3.1.1 Aggregates
The aggregate used consisted of both coarse aggregate and fine aggregate, and as
with ordinary Portland cement concrete mixes, made up between 75-80% of the mixture.
Both the coarse and fine aggregates used in this investigation were purchased from a
local Home Depot hardware store. The coarse aggregate used in the mixture was pearock,
consisting mainly of rocks that were 3/8 in. in diameter. Using pearock of 3/8 in.
diameter was influenced by the work previously done on geopolymer concrete by
Edouard (2011) which gave favorable results in the concrete mix. The coarse aggregate
was used in a saturated surface dry condition (SSD).
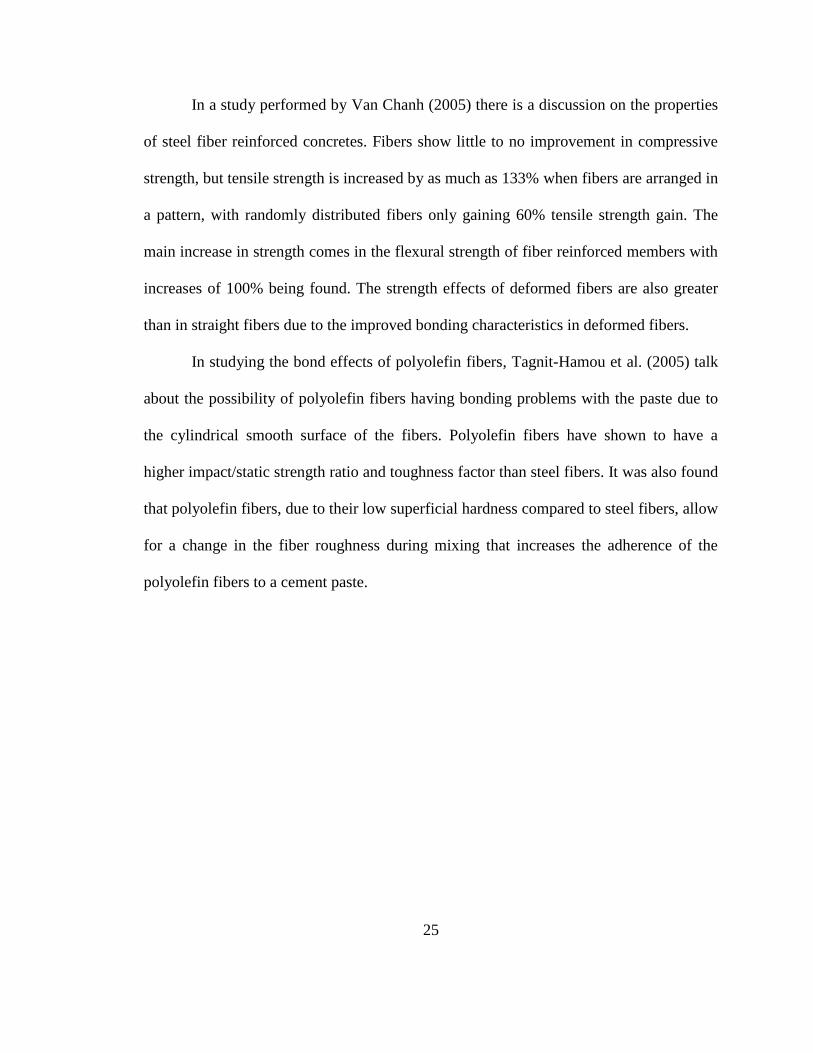
The fine aggregate used was a “medium coarse” sand which was labeled for
multipurpose use including concrete mixtures. The coarse and fine aggregates used meet
ASTM standards for concrete aggregates (ASTM C33 2011). An example of the
materials used is shown in Figure 8.
27
Figure 8: Left: Fly Ash (top), Sand (bottom) - Right: Pearock
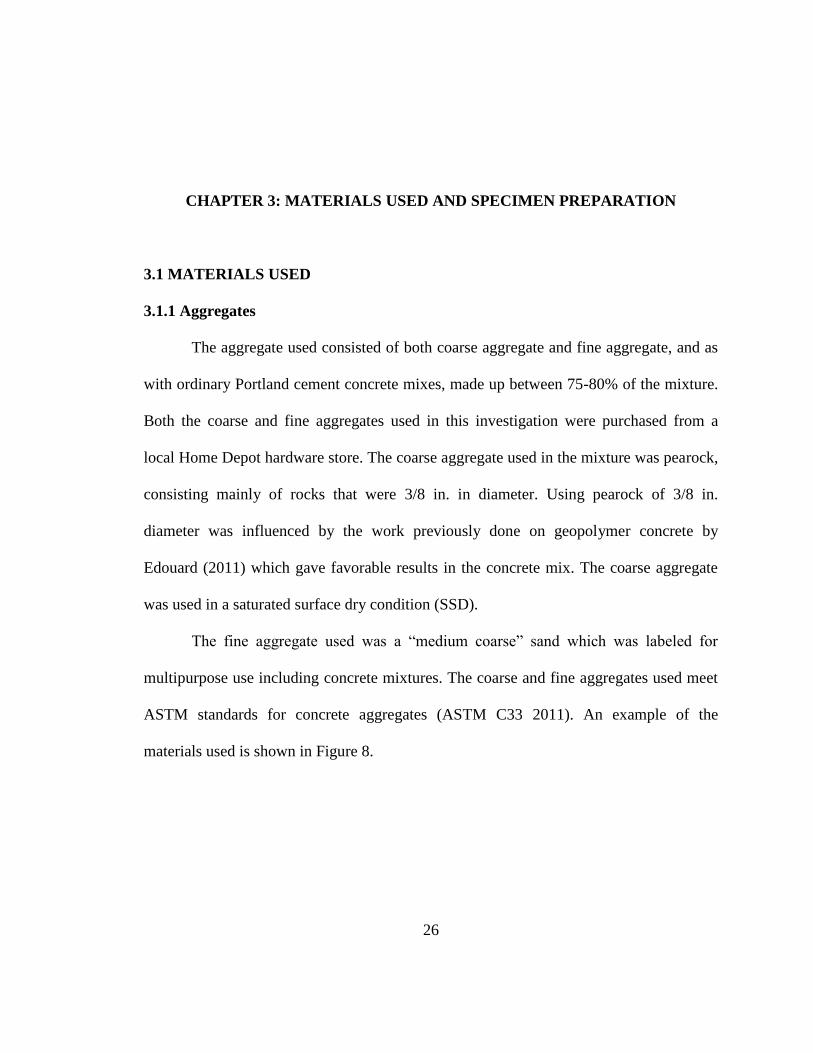
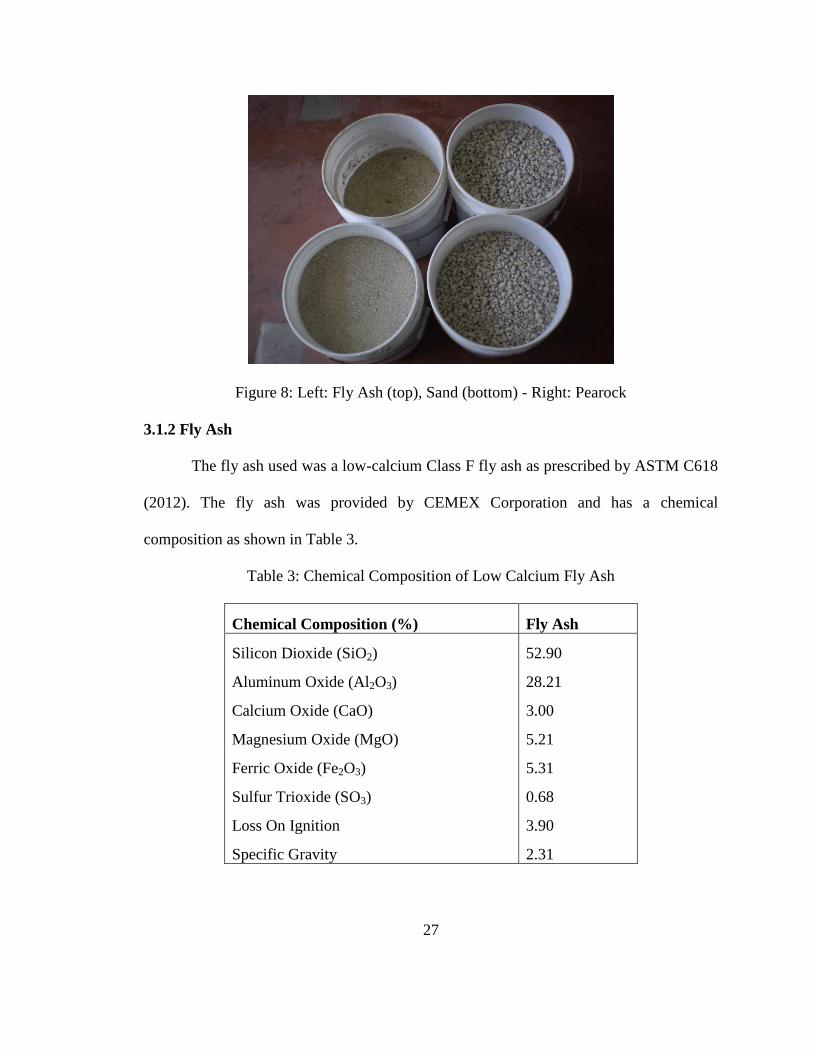
3.1.2 Fly Ash
The fly ash used was a low-calcium Class F fly ash as prescribed by ASTM C618
(2012). The fly ash was provided by CEMEX Corporation and has a chemical
composition as shown in Table 3.
Table 3: Chemical Composition of Low Calcium Fly Ash
Chemical Composition (%) Fly Ash
Silicon Dioxide (SiO2) 52.90
Aluminum Oxide (Al2O3) 28.21
Calcium Oxide (CaO) 3.00
Magnesium Oxide (MgO) 5.21
Ferric Oxide (Fe2O3) 5.31
Sulfur Trioxide (SO3) 0.68
Loss On Ignition 3.90
Specific Gravity 2.31
28
3.1.3 Alkaline Liquid
The choice of alkali activator to be used in making the low-calcium fly ash
geopolymer concrete followed the work of Edouard (2011) and Reddy, Edouard, and
Sobhan (2013). A mix of sodium hydroxide and sodium silicate was used, a mixture
originally determined by Hardjito and Rangan (2005) to produce geopolymer concrete
with desirable durability characteristics. The sodium silicate, with product designation D,
was obtained in solution from PQ Corporation. The composition is made up of 55.9%
water and 44.1% sodium silicate with a 2.0 weight ratio (Na2O=14.7%, SiO2=29.4%).
The sodium hydroxide was obtained from Fisher Scientific in solid pellet form.
The pellets were composed of 99% assay sodium hydroxide, and were prepared into
solution in the FAU laboratory. The concentration of sodium hydroxide used was 14
Molar following Mixture-2 as suggested by Wallah and Rangan (2006). The molecular
weight of NaOH, 40, was multiplied by the required molarity of the solution, 14, to
determine the amount of grams of NaOH solids per liter of solution: 14x40 = 560 grams
of NaOH per liter of solution. The mass of NaOH solids required to make the 14 Molar
solution was then calculated to be 404 grams per kg of solution.
3.1.4 Superplasticizer
To increase the workability of the geopolymer concrete without adding more
water, ADVA 120 superplasticizer was added to the mixture.
3.1.5 Fibers
Fiber reinforcement in the concrete was achieved through the use of Type 50/63
Polyolefin Fibers from 3M. The polyolefin fibers had a length of 2 in. and a diameter of
29
0.025 in. Fibers were added to the geopolymer concrete beams in three different
percentages by volume: 0.1%, 0.3%, and 0.5%.
3.2 MIX DESIGN PRELUDE
Prior to beginning work on geopolymer concrete, certain tests were done to
understand the properties of geopolymer concrete and how best to handle working with
this concrete. Following the work of Hardjito and Rangan (2005), the main goals of the
preliminary trials were to:
Determine an appropriate mixing procedure
Evaluate the effects of the mixing order between dry materials and wet materials
Evaluate the behavior of the fresh concrete and time to setting
Develop a regime for the curing of specimens in the laboratory
It was found that fresh geopolymer concrete has a rapid setting time, and therefore
batches had to be kept relatively small. Most other mixing procedures such as mixing
order and time were kept similar to those used by Edouard (2011).
3.3 SPECIMEN PREPARATION
3.3.1 Mix Design
The mix design used for this project follows closely with Wallah and Rangan’s
(2006) Mixture-2 with a 14 Molar sodium hydroxide solution. The detailed mix design is
shown in Table 4. The mix design encompasses some of the current practice in the
manufacture of ordinary Portland cement (OPC) concrete. The coarse and fine aggregates
make up between 75-80% of the mass, while the rest is made up of the fly ash and the
chemicals used to activate the fly ash and increase the workability of the fresh concrete
30
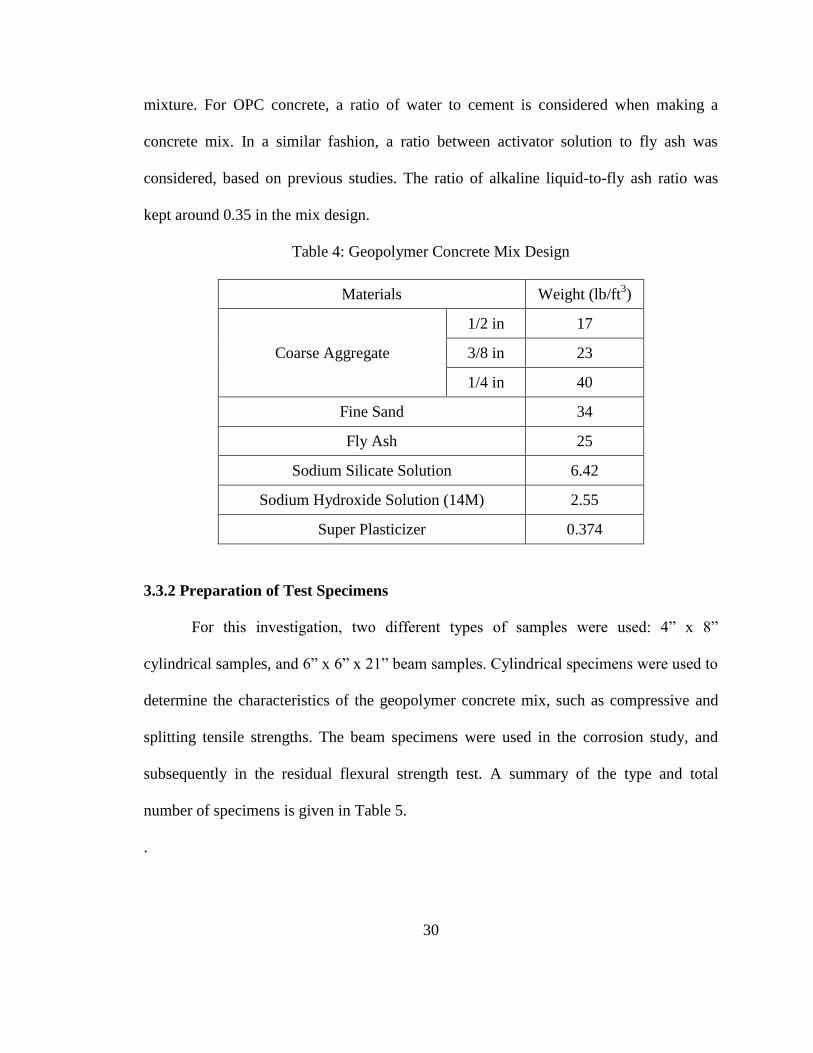
mixture. For OPC concrete, a ratio of water to cement is considered when making a
concrete mix. In a similar fashion, a ratio between activator solution to fly ash was
considered, based on previous studies. The ratio of alkaline liquid-to-fly ash ratio was
kept around 0.35 in the mix design.
Table 4: Geopolymer Concrete Mix Design
Materials Weight (lb/ft3)
Coarse Aggregate
1/2 in 17
3/8 in 23
1/4 in 40
Fine Sand 34
Fly Ash 25
Sodium Silicate Solution 6.42
Sodium Hydroxide Solution (14M) 2.55
Super Plasticizer 0.374
3.3.2 Preparation of Test Specimens
For this investigation, two different types of samples were used: 4” x 8”
cylindrical samples, and 6” x 6” x 21” beam samples. Cylindrical specimens were used to
determine the characteristics of the geopolymer concrete mix, such as compressive and
splitting tensile strengths. The beam specimens were used in the corrosion study, and
subsequently in the residual flexural strength test. A summary of the type and total
number of specimens is given in Table 5.
.
31
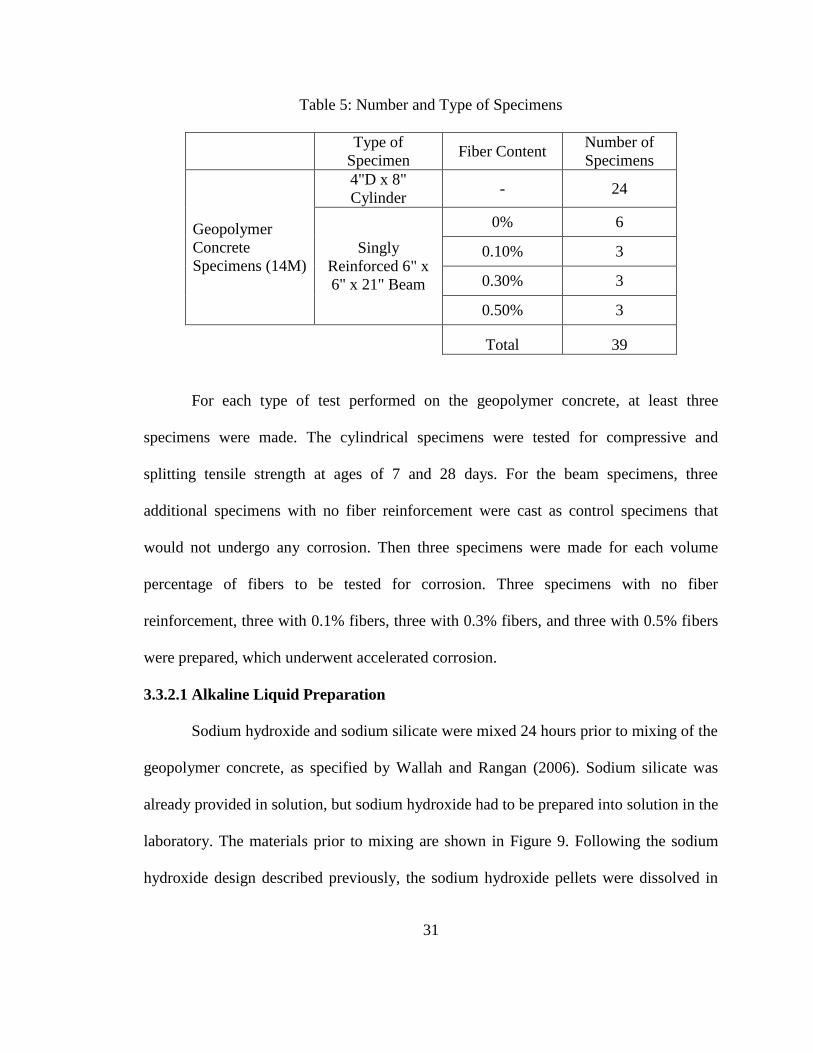
Table 5: Number and Type of Specimens
Type of
Specimen Fiber Content
Number of
Specimens
Geopolymer
Concrete
Specimens (14M)
4"D x 8"
Cylinder - 24
Singly
Reinforced 6" x
6" x 21" Beam
0% 6
0.10% 3
0.30% 3
0.50% 3
Total 39
For each type of test performed on the geopolymer concrete, at least three
specimens were made. The cylindrical specimens were tested for compressive and
splitting tensile strength at ages of 7 and 28 days. For the beam specimens, three
additional specimens with no fiber reinforcement were cast as control specimens that
would not undergo any corrosion. Then three specimens were made for each volume
percentage of fibers to be tested for corrosion. Three specimens with no fiber
reinforcement, three with 0.1% fibers, three with 0.3% fibers, and three with 0.5% fibers
were prepared, which underwent accelerated corrosion.
3.3.2.1 Alkaline Liquid Preparation
Sodium hydroxide and sodium silicate were mixed 24 hours prior to mixing of the
geopolymer concrete, as specified by Wallah and Rangan (2006). Sodium silicate was
already provided in solution, but sodium hydroxide had to be prepared into solution in the
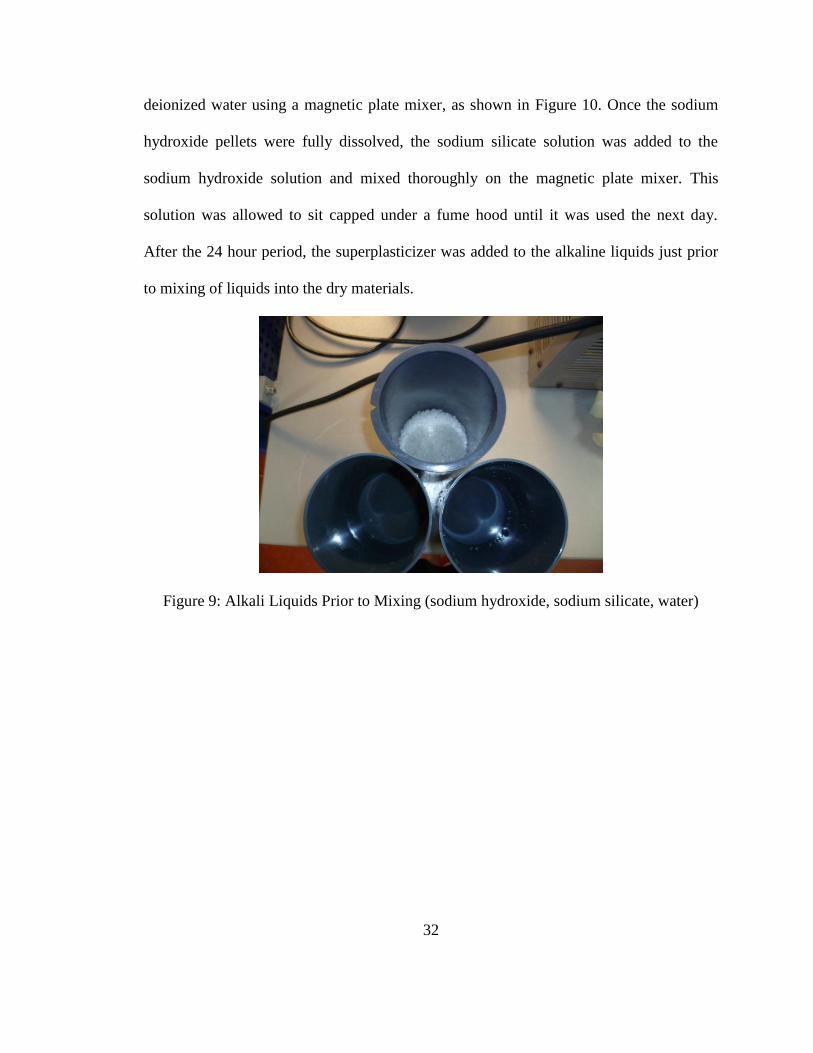
laboratory. The materials prior to mixing are shown in Figure 9. Following the sodium
hydroxide design described previously, the sodium hydroxide pellets were dissolved in
32
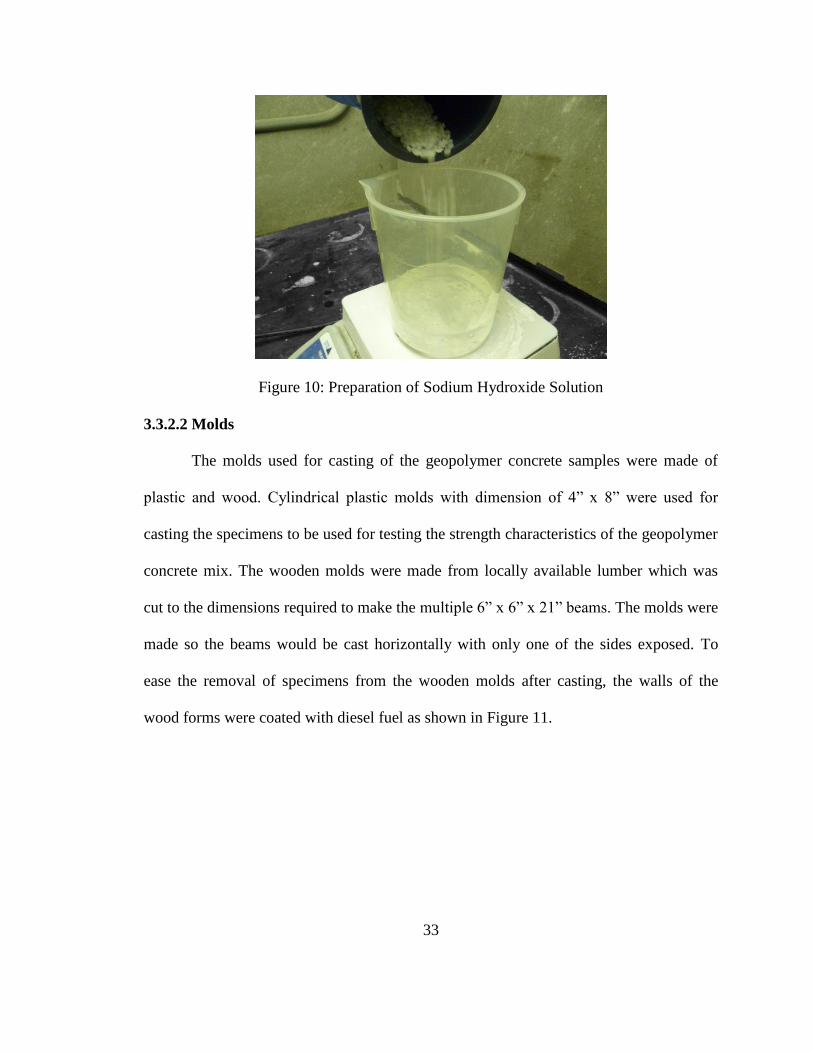
deionized water using a magnetic plate mixer, as shown in Figure 10. Once the sodium
hydroxide pellets were fully dissolved, the sodium silicate solution was added to the
sodium hydroxide solution and mixed thoroughly on the magnetic plate mixer. This
solution was allowed to sit capped under a fume hood until it was used the next day.
After the 24 hour period, the superplasticizer was added to the alkaline liquids just prior
to mixing of liquids into the dry materials.
Figure 9: Alkali Liquids Prior to Mixing (sodium hydroxide, sodium silicate, water)
33
Figure 10: Preparation of Sodium Hydroxide Solution
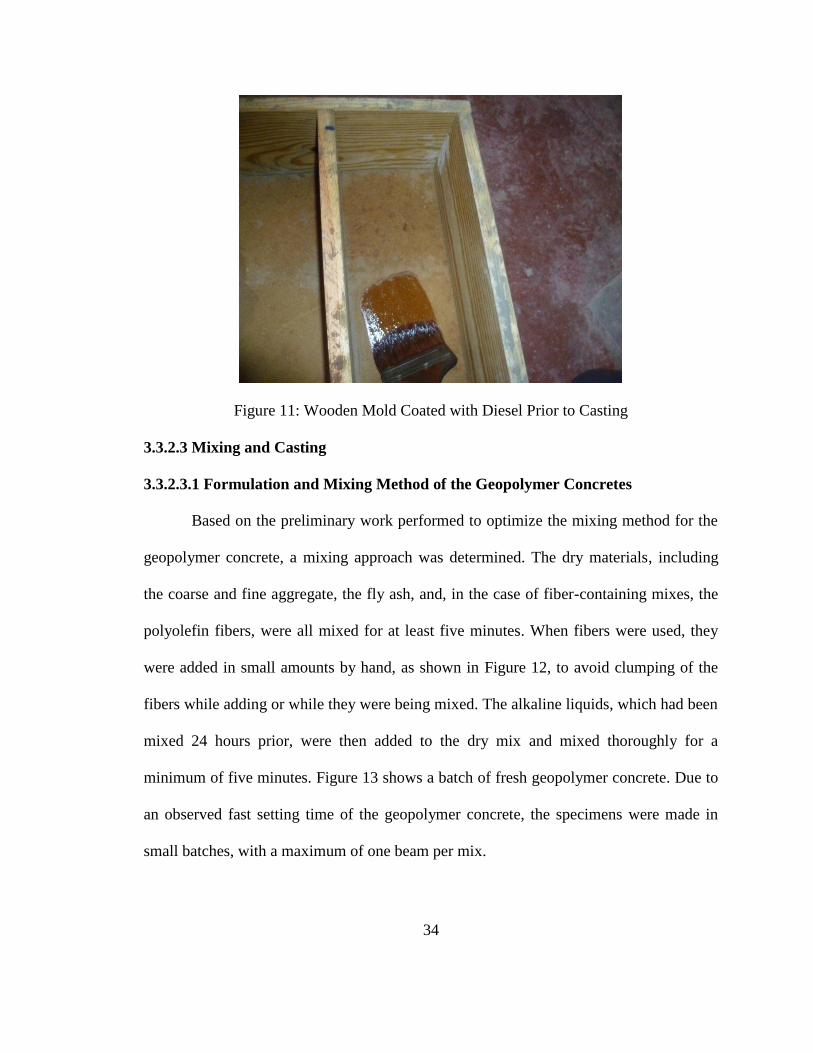
3.3.2.2 Molds
The molds used for casting of the geopolymer concrete samples were made of
plastic and wood. Cylindrical plastic molds with dimension of 4” x 8” were used for
casting the specimens to be used for testing the strength characteristics of the geopolymer
concrete mix. The wooden molds were made from locally available lumber which was
cut to the dimensions required to make the multiple 6” x 6” x 21” beams. The molds were
made so the beams would be cast horizontally with only one of the sides exposed. To
ease the removal of specimens from the wooden molds after casting, the walls of the
wood forms were coated with diesel fuel as shown in Figure 11.
34
Figure 11: Wooden Mold Coated with Diesel Prior to Casting
3.3.2.3 Mixing and Casting
3.3.2.3.1 Formulation and Mixing Method of the Geopolymer Concretes
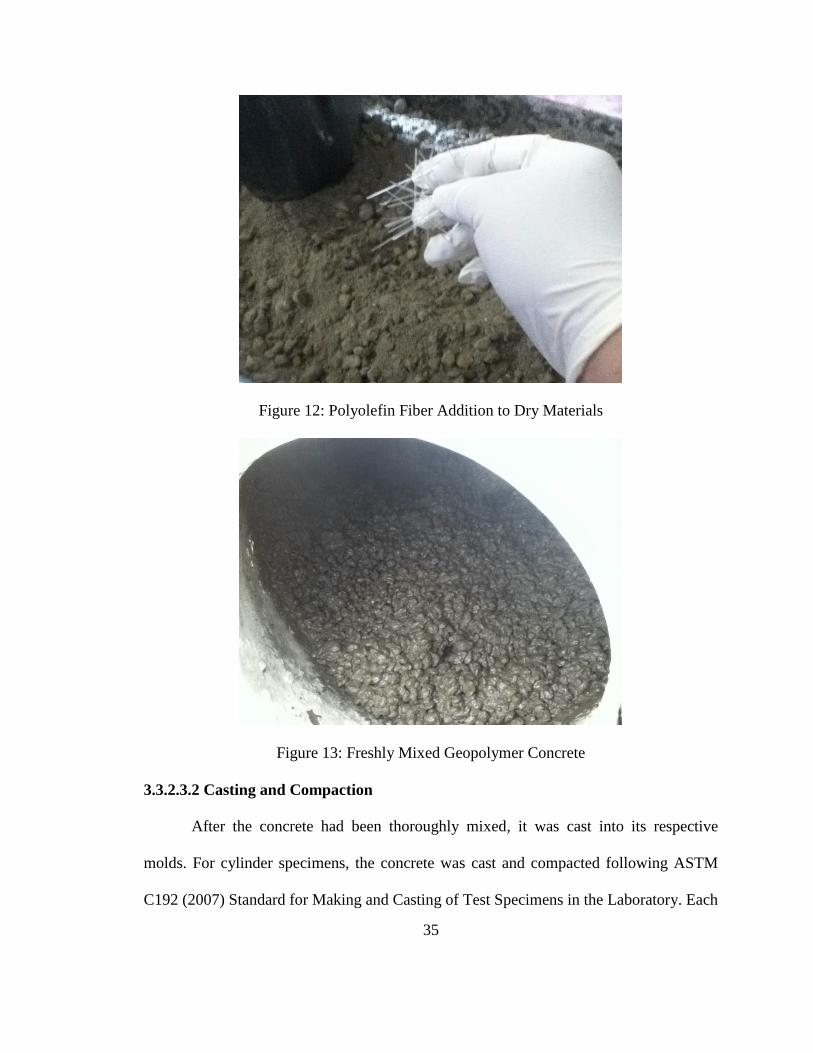
Based on the preliminary work performed to optimize the mixing method for the
geopolymer concrete, a mixing approach was determined. The dry materials, including
the coarse and fine aggregate, the fly ash, and, in the case of fiber-containing mixes, the
polyolefin fibers, were all mixed for at least five minutes. When fibers were used, they
were added in small amounts by hand, as shown in Figure 12, to avoid clumping of the
fibers while adding or while they were being mixed. The alkaline liquids, which had been
mixed 24 hours prior, were then added to the dry mix and mixed thoroughly for a
minimum of five minutes. Figure 13 shows a batch of fresh geopolymer concrete. Due to
an observed fast setting time of the geopolymer concrete, the specimens were made in
small batches, with a maximum of one beam per mix.
35
Figure 12: Polyolefin Fiber Addition to Dry Materials
Figure 13: Freshly Mixed Geopolymer Concrete
3.3.2.3.2 Casting and Compaction
After the concrete had been thoroughly mixed, it was cast into its respective
molds. For cylinder specimens, the concrete was cast and compacted following ASTM
C192 (2007) Standard for Making and Casting of Test Specimens in the Laboratory. Each
36
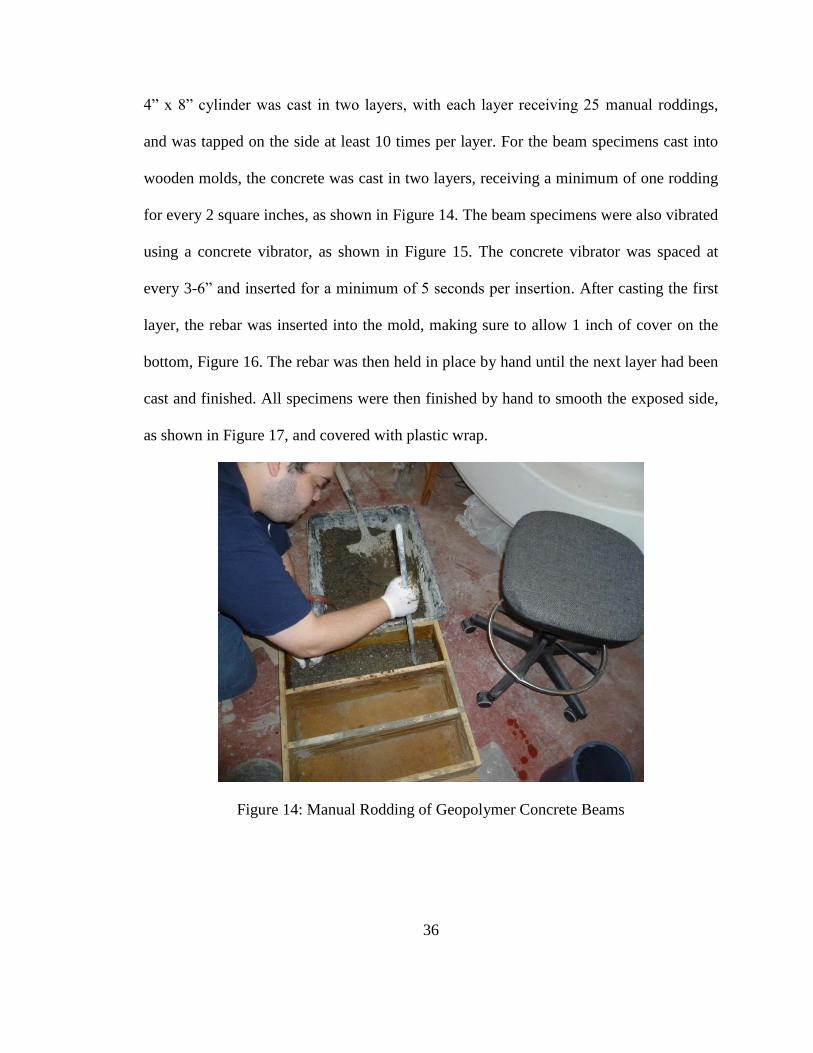
4” x 8” cylinder was cast in two layers, with each layer receiving 25 manual roddings,
and was tapped on the side at least 10 times per layer. For the beam specimens cast into
wooden molds, the concrete was cast in two layers, receiving a minimum of one rodding
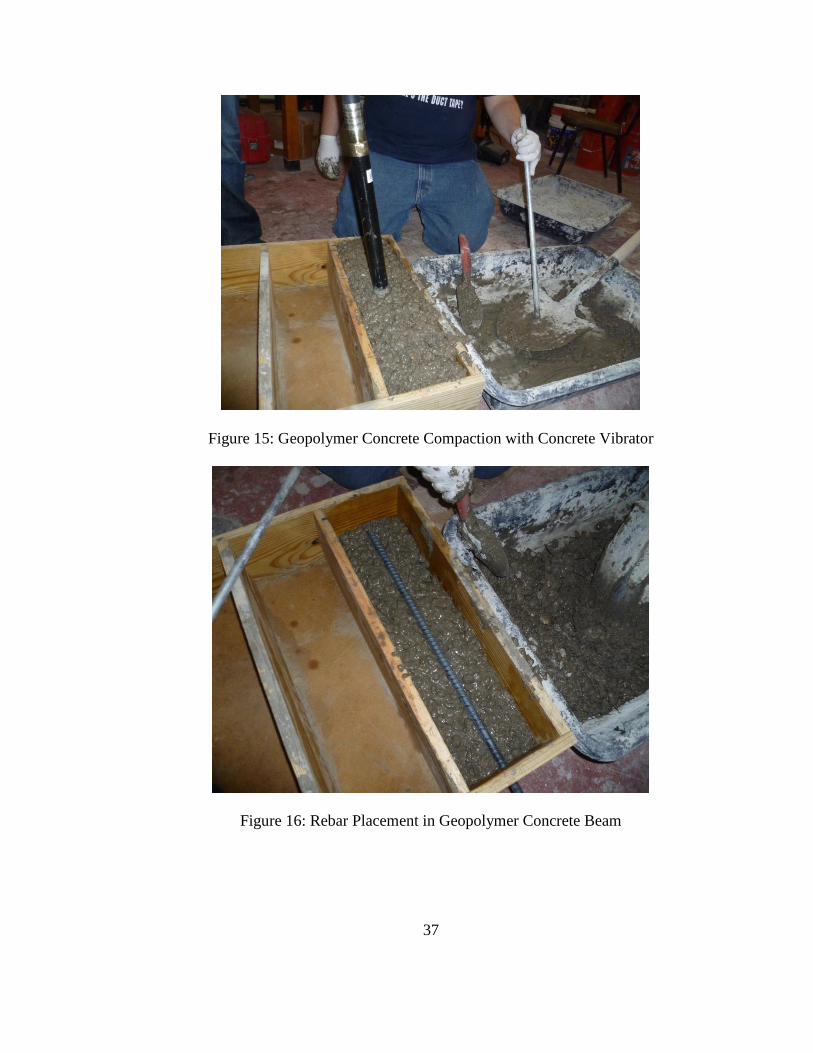
for every 2 square inches, as shown in Figure 14. The beam specimens were also vibrated
using a concrete vibrator, as shown in Figure 15. The concrete vibrator was spaced at
every 3-6” and inserted for a minimum of 5 seconds per insertion. After casting the first
layer, the rebar was inserted into the mold, making sure to allow 1 inch of cover on the
bottom, Figure 16. The rebar was then held in place by hand until the next layer had been
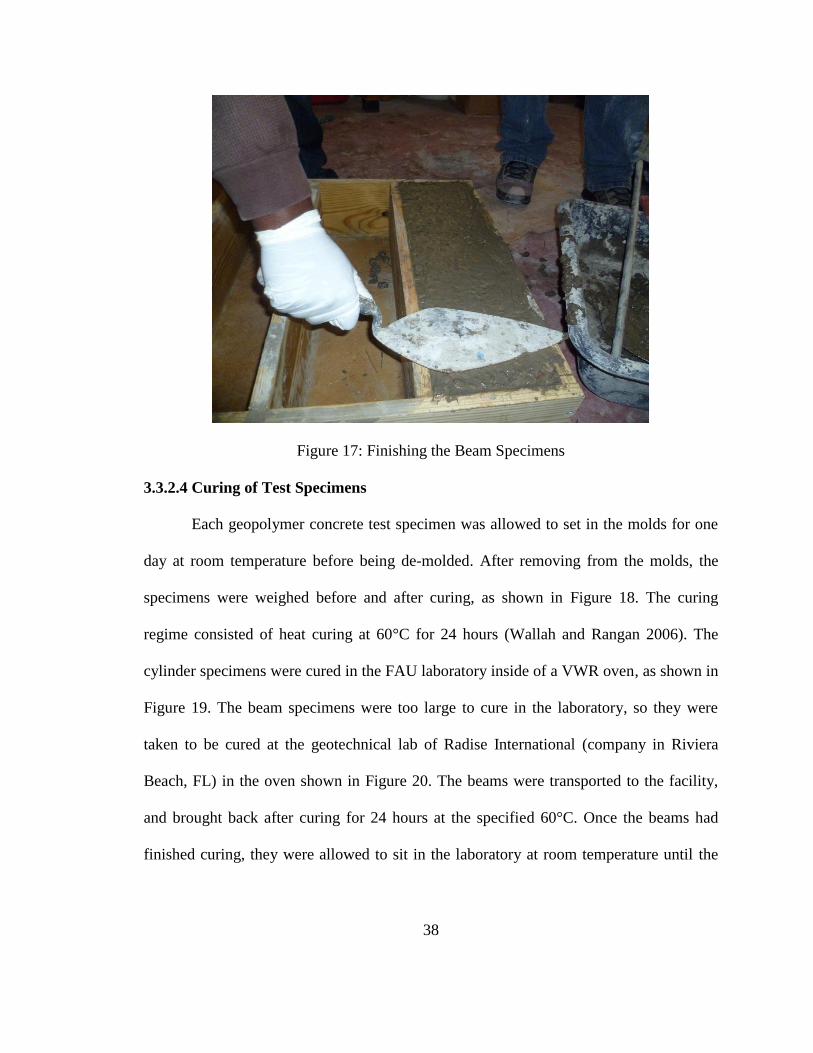
cast and finished. All specimens were then finished by hand to smooth the exposed side,
as shown in Figure 17, and covered with plastic wrap.
Figure 14: Manual Rodding of Geopolymer Concrete Beams
37
Figure 15: Geopolymer Concrete Compaction with Concrete Vibrator
Figure 16: Rebar Placement in Geopolymer Concrete Beam
38
Figure 17: Finishing the Beam Specimens
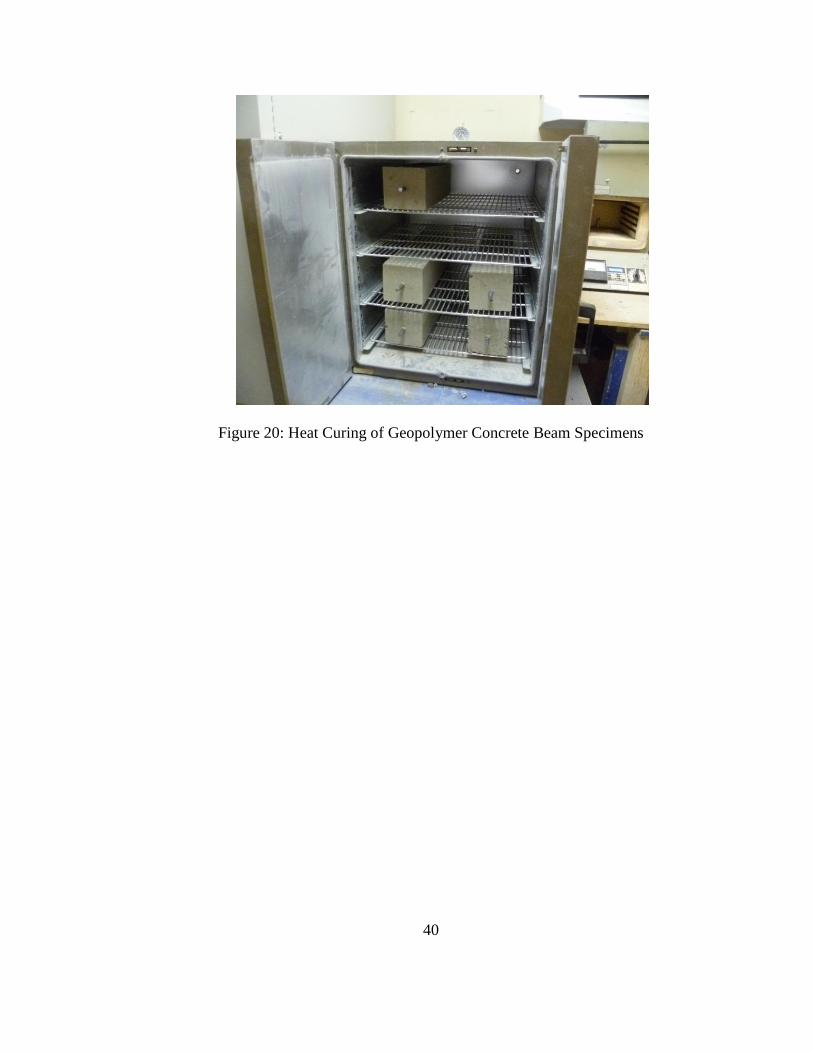
3.3.2.4 Curing of Test Specimens
Each geopolymer concrete test specimen was allowed to set in the molds for one
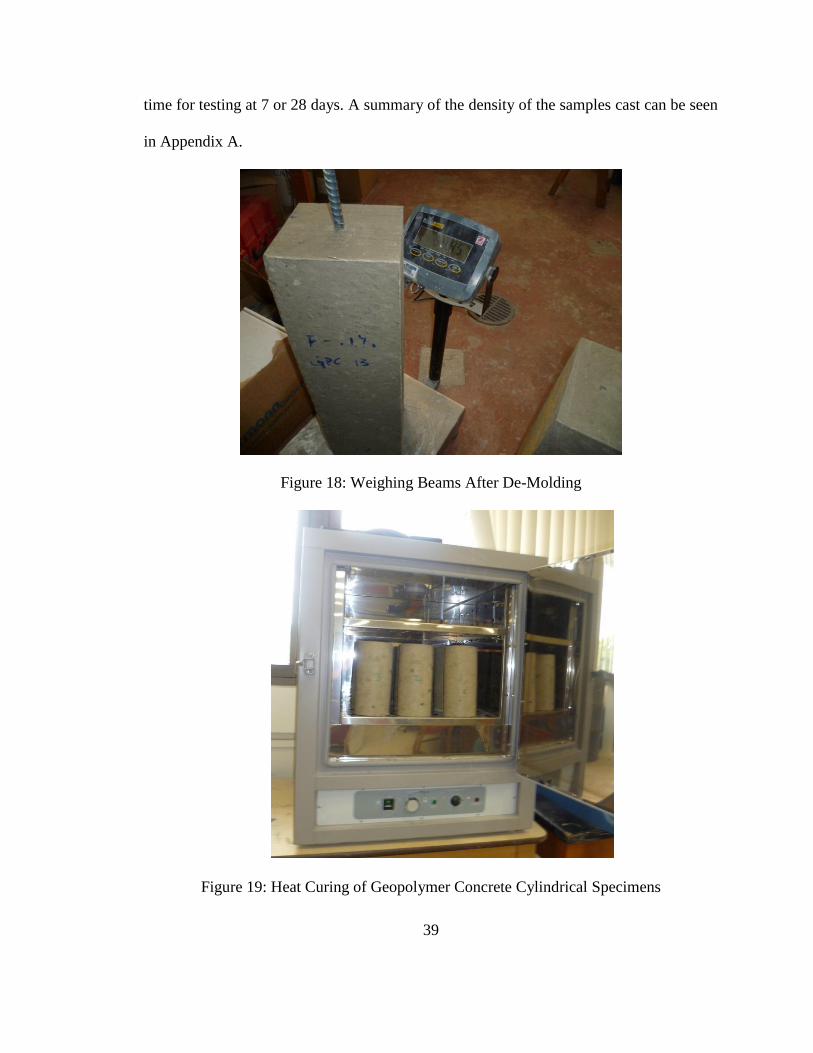
day at room temperature before being de-molded. After removing from the molds, the
specimens were weighed before and after curing, as shown in Figure 18. The curing
regime consisted of heat curing at 60°C for 24 hours (Wallah and Rangan 2006). The
cylinder specimens were cured in the FAU laboratory inside of a VWR oven, as shown in
Figure 19. The beam specimens were too large to cure in the laboratory, so they were
taken to be cured at the geotechnical lab of Radise International (company in Riviera
Beach, FL) in the oven shown in Figure 20. The beams were transported to the facility,
and brought back after curing for 24 hours at the specified 60°C. Once the beams had
finished curing, they were allowed to sit in the laboratory at room temperature until the
39
time for testing at 7 or 28 days. A summary of the density of the samples cast can be seen
in Appendix A.
Figure 18: Weighing Beams After De-Molding
Figure 19: Heat Curing of Geopolymer Concrete Cylindrical Specimens
40
Figure 20: Heat Curing of Geopolymer Concrete Beam Specimens
41
CHAPTER 4: ACCELERATED CORROSION DURABILITY TESTING
Different testing methods are available to test for corrosion in reinforced concrete
specimens. During this investigation, an impressed current was used for accelerated
corrosion testing. In an investigation into the bond characteristics of reinforced concrete,
Al-Sulaimani et al. (1990) performed accelerated corrosion through an impressed direct
current method, which has been used in previous investigations to test the resistance
against chloride penetration through concrete. Concrete specimens with different
reinforcement embedment lengths as well as samples with or without fibers were tested
for pullout after being subjected to reinforcement corrosion. Accelerated corrosion was
setup by providing a constant current to samples through the rebar reinforcement, which
acted as an anode, and a stainless steel plate acting as a cathode. From the investigation,
fiber reinforced concrete samples showed greater bond strength than non-fiber reinforced
samples at different stages of corrosion.
In 2000, the Florida Department of Transportation developed the “Florida Method
of Test for An Accelerated Laboratory Method for Corrosion Testing of Reinforced
Concrete Using Impressed Current.” This test method was intended to test various
concrete mixes for resistance to corrosion using centrally reinforced concrete samples
immersed in a saltwater solution. A constant voltage is applied to all samples and the
current to each specimen is measured. Failure occurs once an increase in current is
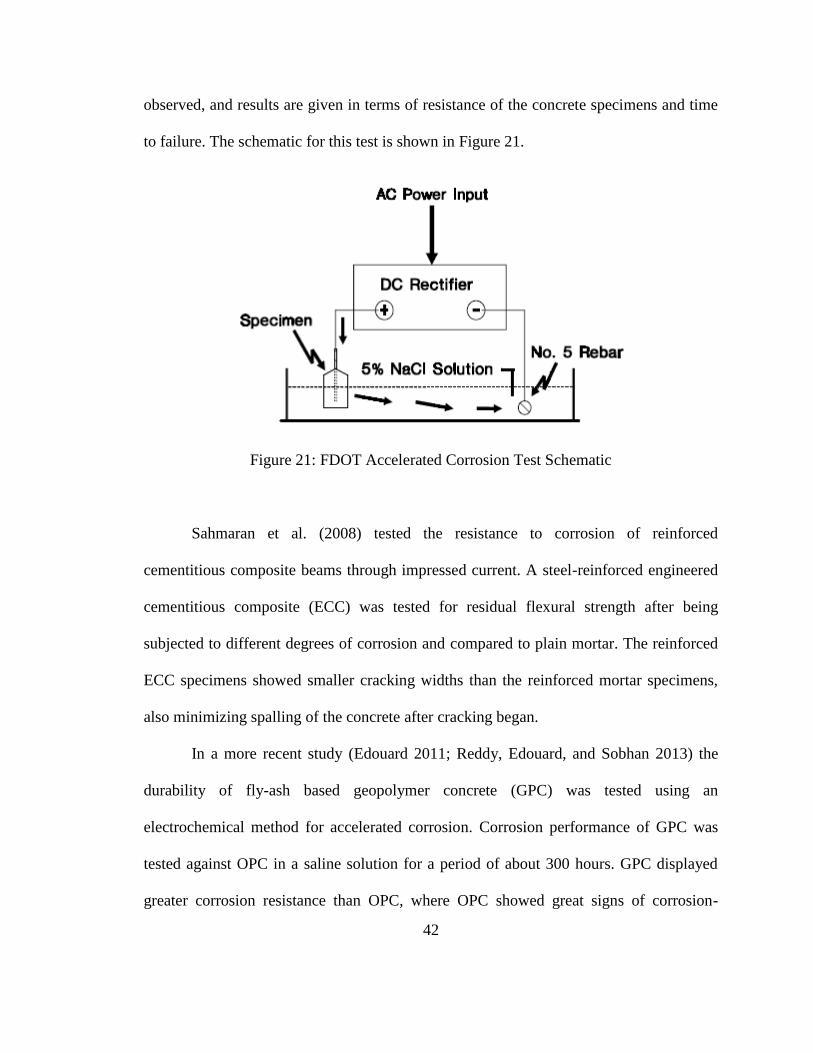
42
observed, and results are given in terms of resistance of the concrete specimens and time
to failure. The schematic for this test is shown in Figure 21.
Figure 21: FDOT Accelerated Corrosion Test Schematic
Sahmaran et al. (2008) tested the resistance to corrosion of reinforced
cementitious composite beams through impressed current. A steel-reinforced engineered
cementitious composite (ECC) was tested for residual flexural strength after being
subjected to different degrees of corrosion and compared to plain mortar. The reinforced
ECC specimens showed smaller cracking widths than the reinforced mortar specimens,
also minimizing spalling of the concrete after cracking began.
In a more recent study (Edouard 2011; Reddy, Edouard, and Sobhan 2013) the
durability of fly-ash based geopolymer concrete (GPC) was tested using an
electrochemical method for accelerated corrosion. Corrosion performance of GPC was
tested against OPC in a saline solution for a period of about 300 hours. GPC displayed
greater corrosion resistance than OPC, where OPC showed great signs of corrosion-
43
induced cracking while GPC did not show any signs of corrosion or cracking in the same
time period.
4.1 EXPERIMENTAL PROGRAM
4.1.1 Test Specimens
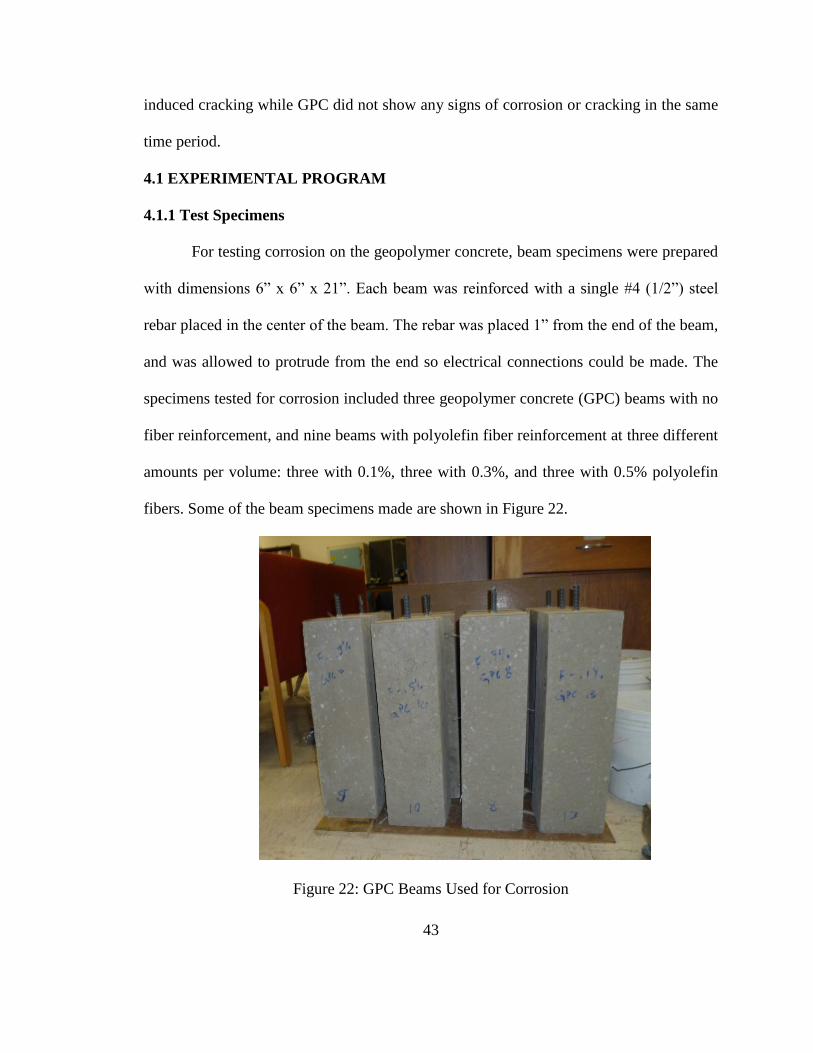
For testing corrosion on the geopolymer concrete, beam specimens were prepared
with dimensions 6” x 6” x 21”. Each beam was reinforced with a single #4 (1/2”) steel
rebar placed in the center of the beam. The rebar was placed 1” from the end of the beam,
and was allowed to protrude from the end so electrical connections could be made. The
specimens tested for corrosion included three geopolymer concrete (GPC) beams with no
fiber reinforcement, and nine beams with polyolefin fiber reinforcement at three different
amounts per volume: three with 0.1%, three with 0.3%, and three with 0.5% polyolefin
fibers. Some of the beam specimens made are shown in Figure 22.
Figure 22: GPC Beams Used for Corrosion
44
4.1.2 Testing Apparatus and Materials
The testing materials used for accelerated corrosion included one 150-gallon
structural foam stock Rubbermaid tank with dimensions 25” height, 39” width, and 58”
length used for holding the beam specimens in the seawater solution. A 30 volt D.C.
power supply to feed all test specimens was used to provide the constant electric potential
to each beam. Copper wiring was used to form the circuit from the power supply to the
beam specimens and back. A digital multimeter was used for reading the current running
through the beams, as well as ensuring that the voltage running through the circuit was
constant. Stainless steel mesh was used around the beams to act as a cathode and
complete the circuit to the power supply. Artificial seawater solution was used to
simulate the effects of a marine environment. And an epoxy coating was applied on the
steel-concrete interface where the steel rebar was exposed to avoid crevice corrosion.
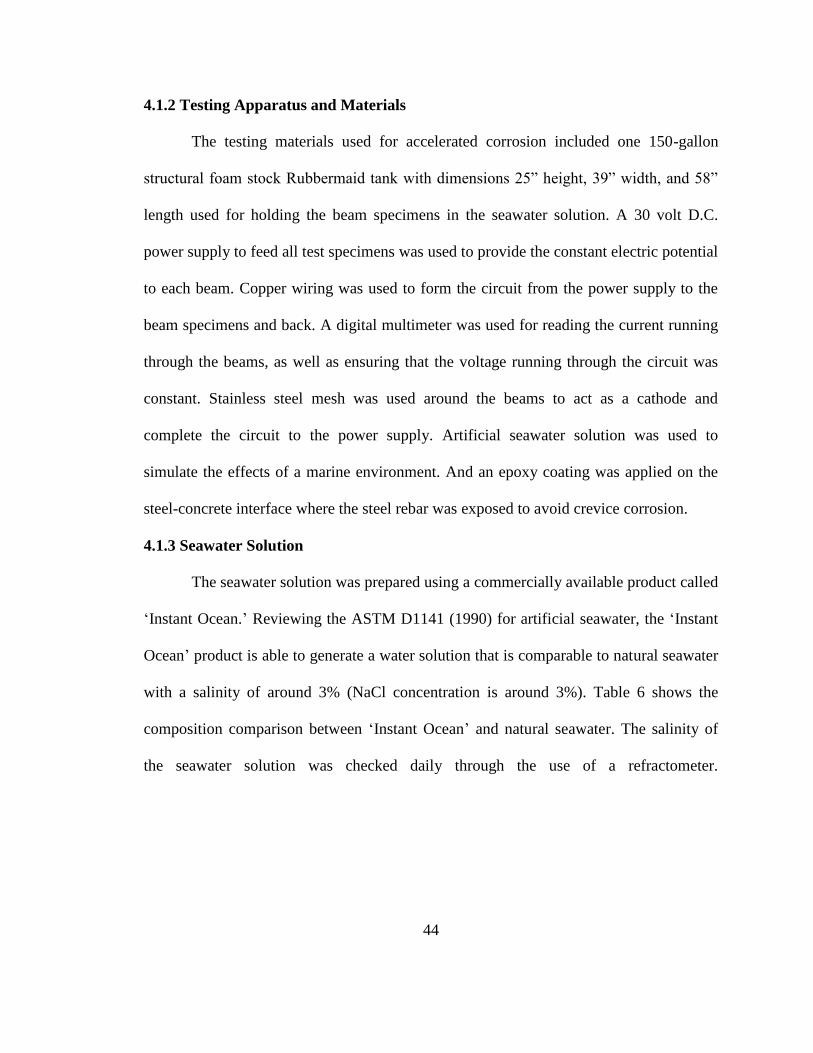
4.1.3 Seawater Solution
The seawater solution was prepared using a commercially available product called
‘Instant Ocean.’ Reviewing the ASTM D1141 (1990) for artificial seawater, the ‘Instant
Ocean’ product is able to generate a water solution that is comparable to natural seawater
with a salinity of around 3% (NaCl concentration is around 3%). Table 6 shows the
composition comparison between ‘Instant Ocean’ and natural seawater. The salinity of
the seawater solution was checked daily through the use of a refractometer.
45
Table 6: Composition of Instant Ocean Seawater Solution
Ion
Natural
Seawater
Instant
Ocean
Sodium (Na+) 10.781 10.78
Potassium (K+) 0.399 0.42
Magnesium (Mg++
) 1.284 1.32
Calcium (Ca++
) 0.4119 0.4
Strontium (Sr++
) 0.00794 0.0088
Chloride (Cl-) 19.353 19.29
Sulfate (SO4--) 2.712 2.66
Bicarbonate (HCO3-) 0.126 0.2
Bromide (Br-) 0.0673 0.056
Boric (B(OH)3) 0.0257 —
Fluoride (F-) 0.0013 0.001
4.2 TEST PROCEDURE
The full accelerated corrosion procedure followed closely the FDOT test method
for accelerated corrosion using impressed current (2000), and the work by Sahmaran et.
al (2008). The tank was prepared with the seawater solution to a depth that would allow
each beam to be submerged up to about 18 in. The stainless steel mesh counter electrode
was placed in the filled tank and connected to the negative terminal of the D.C. power
supply. After curing for 28 days the beams were placed in the seawater solution for
46
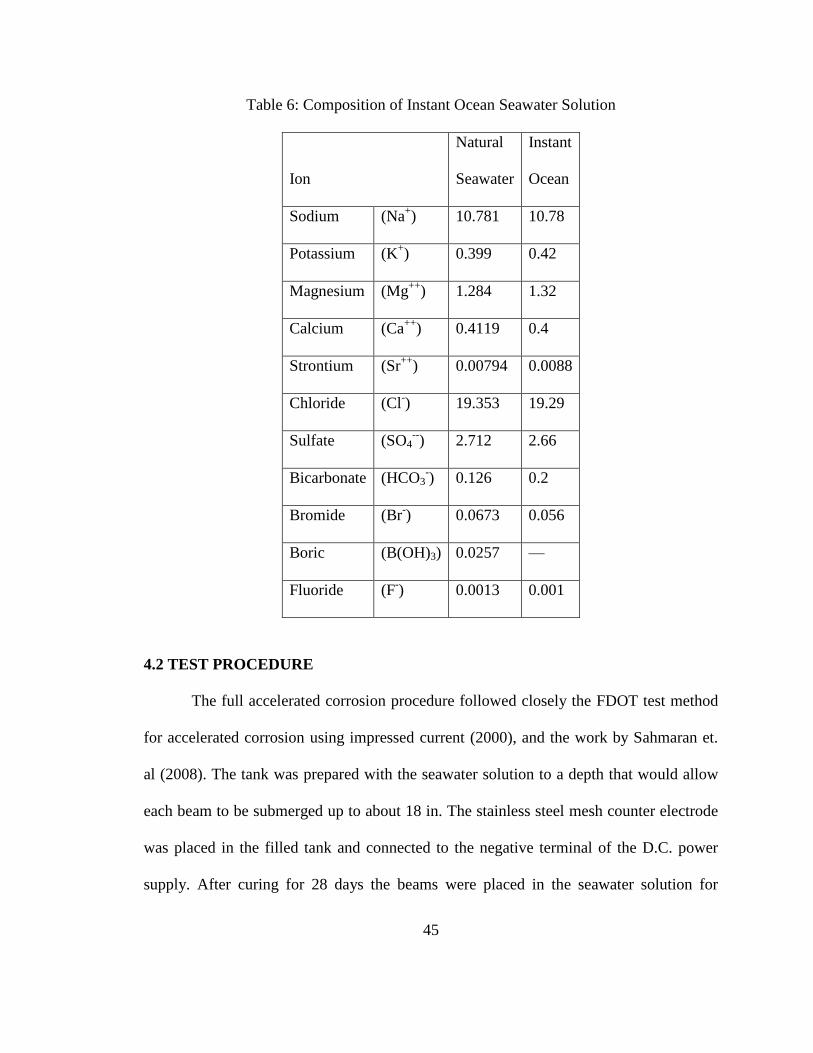
conditioning at the testing depth of 18 in. for a period of 28 days. After the beams had
been conditioned, the top exposed rebar was attached through a plate connector with 12
gage copper wire to the 30 volt D.C. power supply. The D.C. power supply was then
turned on and set to 30V so that each beam would have a 30V electrical potential. The
accelerated corrosion setup is shown in Figure 23.
Figure 23: Accelerated Corrosion Testing Schematic
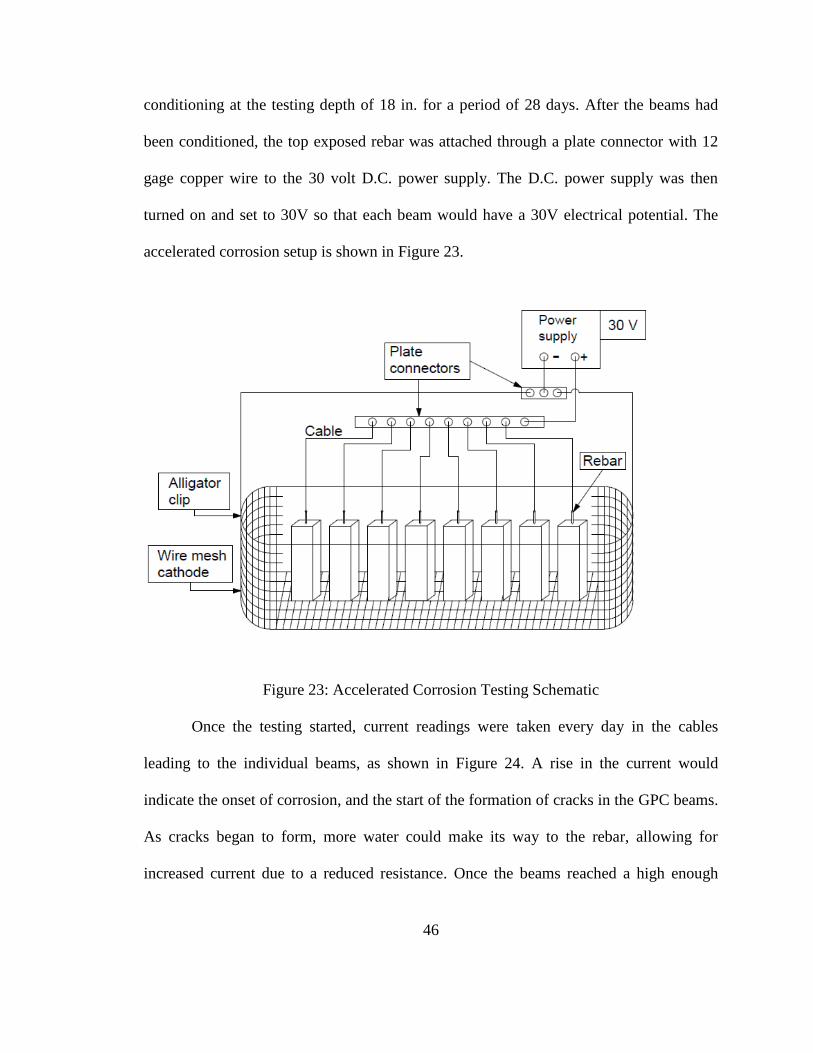
Once the testing started, current readings were taken every day in the cables
leading to the individual beams, as shown in Figure 24. A rise in the current would
indicate the onset of corrosion, and the start of the formation of cracks in the GPC beams.
As cracks began to form, more water could make its way to the rebar, allowing for
increased current due to a reduced resistance. Once the beams reached a high enough
47
current, there were visible signs of corrosion and cracking and they were considered to
have failed. The beams were removed from the seawater solution and the amount of
cracking was analyzed for each beam by the crack scoring method (Bolivar 2008; Reddy,
Bolivar, and Sobhan 2013). After crack evaluation, the beams were tested for residual
strength after corrosion through third-point flexural loading. The final step involved
autopsying the GPC beams to determine the effects that corrosion had on the rebar. This
was done by measuring the mass loss of the steel rebar for each beam.
Figure 24: Accelerated Corrosion Test Setup in the Laboratory
48
CHAPTER 5: STRENGTH EVALUATION OF GEOPOLYMER CONCRETE
5.1 COMPRESSIVE STRENGTH TESTING
Compressive strength testing was performed to test the average strength over time
of the geopolymer concrete, giving an idea of strength development for the geopolymer
concrete mix used in testing. ASTM C39 (2011) procedure was followed which stipulates
the specimen size and procedure. The machine used was an ELE hydraulic machine with
a maximum load capacity of 250,000 lb, as shown in Figure 25. A minimum of three
geopolymer concrete cylindrical specimens was tested at 7 and 28 days.
Figure 25: Compressive Strength Testing Machine
49
5.2 SPLITTING TENSILE STRENGTH
The splitting tensile strength test was performed to test the development of tensile
strength with age of the geopolymer concrete following the guidelines of ASTM C496
(2011) describing the setup and procedure. The machine utilized for this test was a Tinius
Olsen hydraulic machine with a maximum load capacity of 60,000 lb., Figure 26.
A minimum of three cylindrical specimens was tested at 7 and 28 days. The setup
involved placing the cylindrical specimen on its side and loading it across the length so
that the load was applied at each end of the circular ends, as shown in Figure 26. Once
the maximum load was attained, the following equation was used to determine the
splitting tensile strength:
T = 2P/πld
where:
T = splitting tensile strength, psi
P = maximum applied load indicated by the testing machine, lbf
L = length, in.
D = diameter, in.
50
Figure 26: Split Tension Test Setup
5.3 RESIDUAL FLEXURAL STRENGTH
Finding the strength of each beam after corrosion was an important step in
determining the effectiveness of fibers in resisting the development of damage caused by
corrosion to the GPC beams. Once the accelerated corrosion study was finished, the
beams were allowed to dry and checked for cracking behavior. They were then placed
onto the testing machine. The testing followed ASTM C78 (2010) procedure for flexural
testing using third-point loading, where the beams were tested at a constant rate until the
load dropped consistently. A schematic of the flexural testing setup is shown in Figure
27.
51
Figure 27: Schematic of Flexural Tests
52
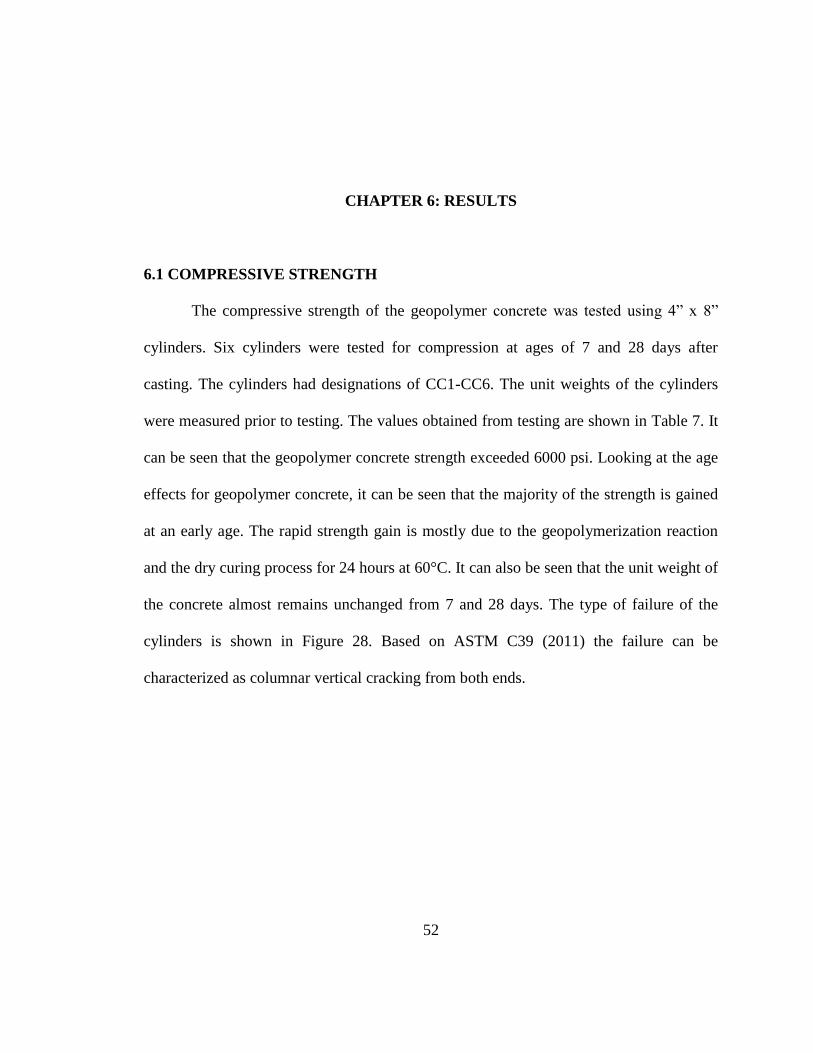
CHAPTER 6: RESULTS
6.1 COMPRESSIVE STRENGTH
The compressive strength of the geopolymer concrete was tested using 4” x 8”
cylinders. Six cylinders were tested for compression at ages of 7 and 28 days after
casting. The cylinders had designations of CC1-CC6. The unit weights of the cylinders
were measured prior to testing. The values obtained from testing are shown in Table 7. It
can be seen that the geopolymer concrete strength exceeded 6000 psi. Looking at the age
effects for geopolymer concrete, it can be seen that the majority of the strength is gained
at an early age. The rapid strength gain is mostly due to the geopolymerization reaction
and the dry curing process for 24 hours at 60°C. It can also be seen that the unit weight of
the concrete almost remains unchanged from 7 and 28 days. The type of failure of the
cylinders is shown in Figure 28. Based on ASTM C39 (2011) the failure can be
characterized as columnar vertical cracking from both ends.
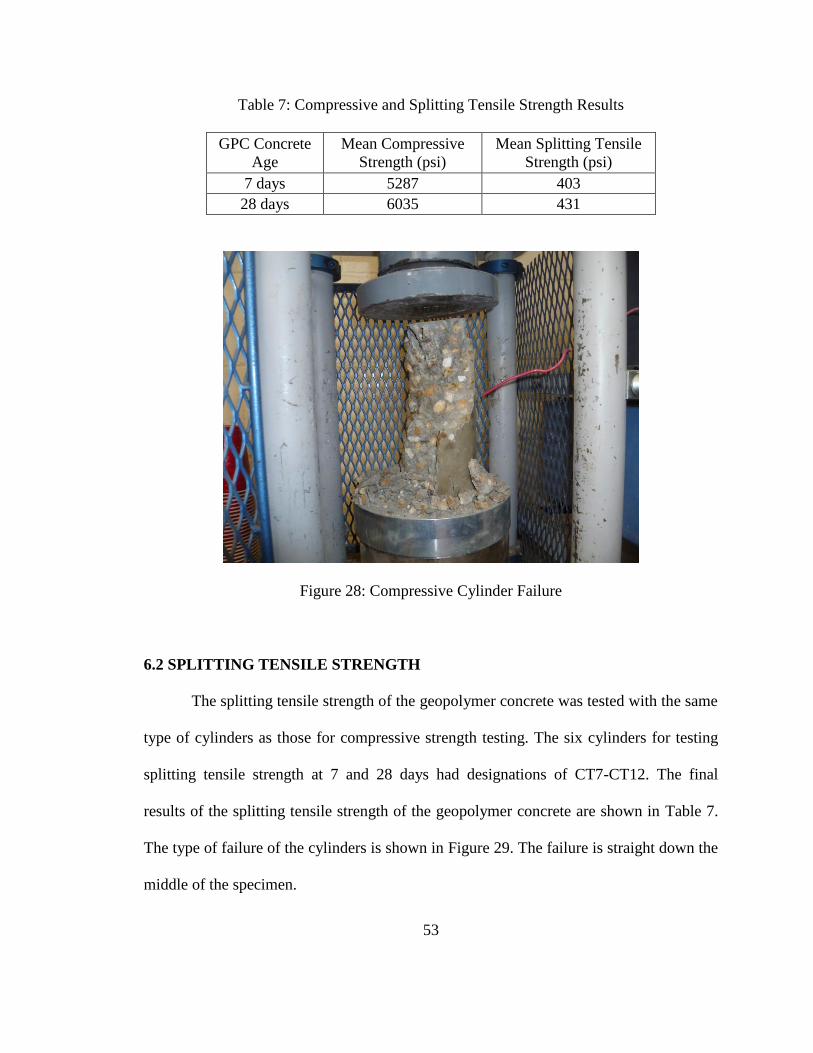
53
Table 7: Compressive and Splitting Tensile Strength Results
GPC Concrete
Age
Mean Compressive
Strength (psi)
Mean Splitting Tensile
Strength (psi)
7 days 5287 403
28 days 6035 431
Figure 28: Compressive Cylinder Failure
6.2 SPLITTING TENSILE STRENGTH
The splitting tensile strength of the geopolymer concrete was tested with the same
type of cylinders as those for compressive strength testing. The six cylinders for testing
splitting tensile strength at 7 and 28 days had designations of CT7-CT12. The final
results of the splitting tensile strength of the geopolymer concrete are shown in Table 7.
The type of failure of the cylinders is shown in Figure 29. The failure is straight down the
middle of the specimen.
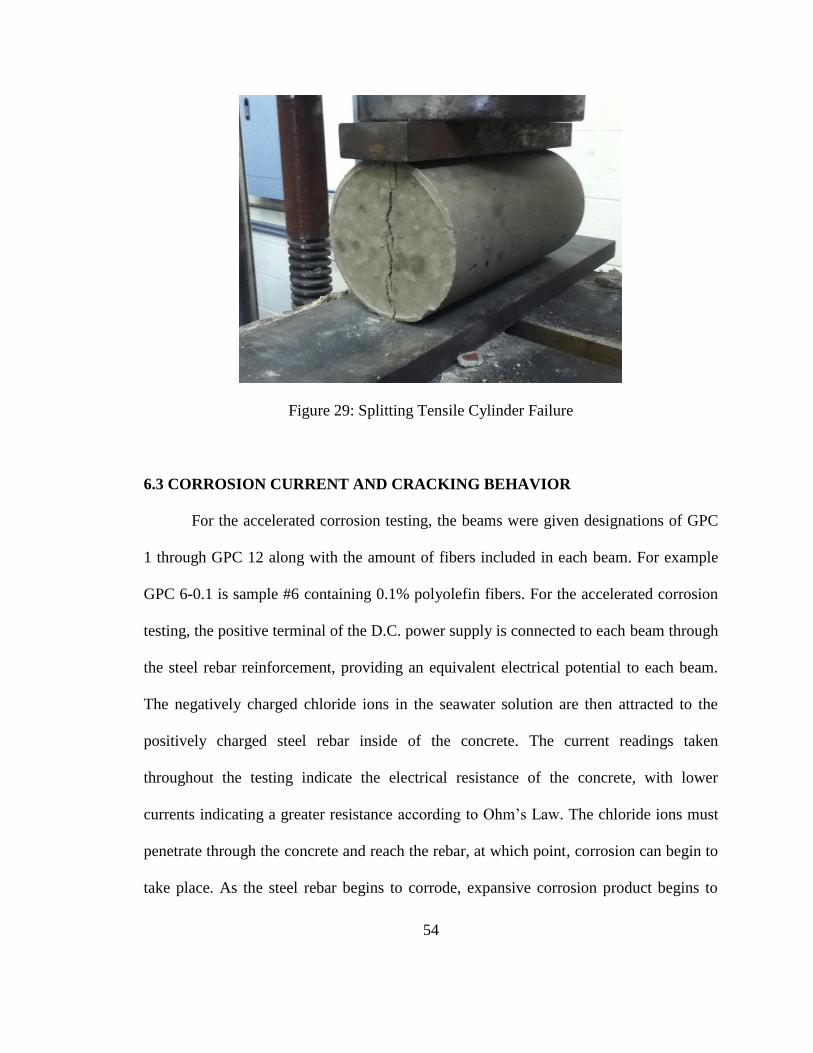
54
Figure 29: Splitting Tensile Cylinder Failure
6.3 CORROSION CURRENT AND CRACKING BEHAVIOR
For the accelerated corrosion testing, the beams were given designations of GPC
1 through GPC 12 along with the amount of fibers included in each beam. For example
GPC 6-0.1 is sample #6 containing 0.1% polyolefin fibers. For the accelerated corrosion
testing, the positive terminal of the D.C. power supply is connected to each beam through
the steel rebar reinforcement, providing an equivalent electrical potential to each beam.
The negatively charged chloride ions in the seawater solution are then attracted to the
positively charged steel rebar inside of the concrete. The current readings taken
throughout the testing indicate the electrical resistance of the concrete, with lower
currents indicating a greater resistance according to Ohm’s Law. The chloride ions must
penetrate through the concrete and reach the rebar, at which point, corrosion can begin to
take place. As the steel rebar begins to corrode, expansive corrosion product begins to
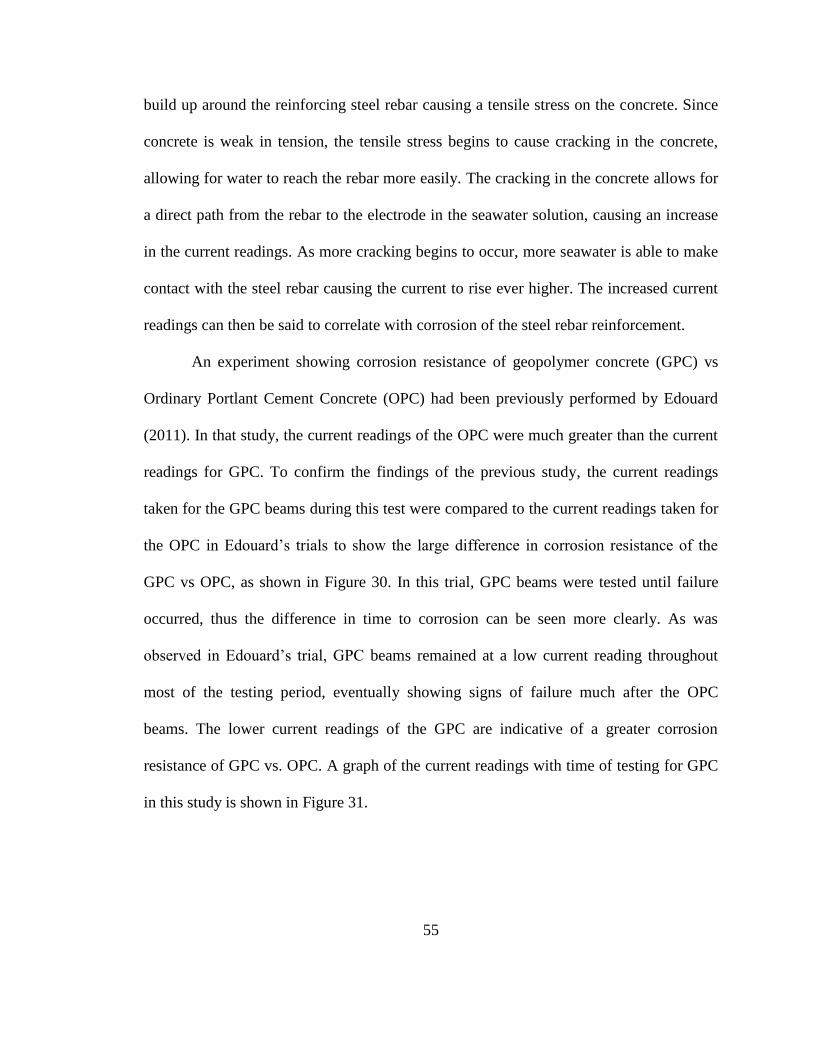
55
build up around the reinforcing steel rebar causing a tensile stress on the concrete. Since
concrete is weak in tension, the tensile stress begins to cause cracking in the concrete,
allowing for water to reach the rebar more easily. The cracking in the concrete allows for
a direct path from the rebar to the electrode in the seawater solution, causing an increase
in the current readings. As more cracking begins to occur, more seawater is able to make
contact with the steel rebar causing the current to rise ever higher. The increased current
readings can then be said to correlate with corrosion of the steel rebar reinforcement.
An experiment showing corrosion resistance of geopolymer concrete (GPC) vs
Ordinary Portlant Cement Concrete (OPC) had been previously performed by Edouard
(2011). In that study, the current readings of the OPC were much greater than the current
readings for GPC. To confirm the findings of the previous study, the current readings
taken for the GPC beams during this test were compared to the current readings taken for
the OPC in Edouard’s trials to show the large difference in corrosion resistance of the
GPC vs OPC, as shown in Figure 30. In this trial, GPC beams were tested until failure
occurred, thus the difference in time to corrosion can be seen more clearly. As was
observed in Edouard’s trial, GPC beams remained at a low current reading throughout
most of the testing period, eventually showing signs of failure much after the OPC
beams. The lower current readings of the GPC are indicative of a greater corrosion
resistance of GPC vs. OPC. A graph of the current readings with time of testing for GPC
in this study is shown in Figure 31.
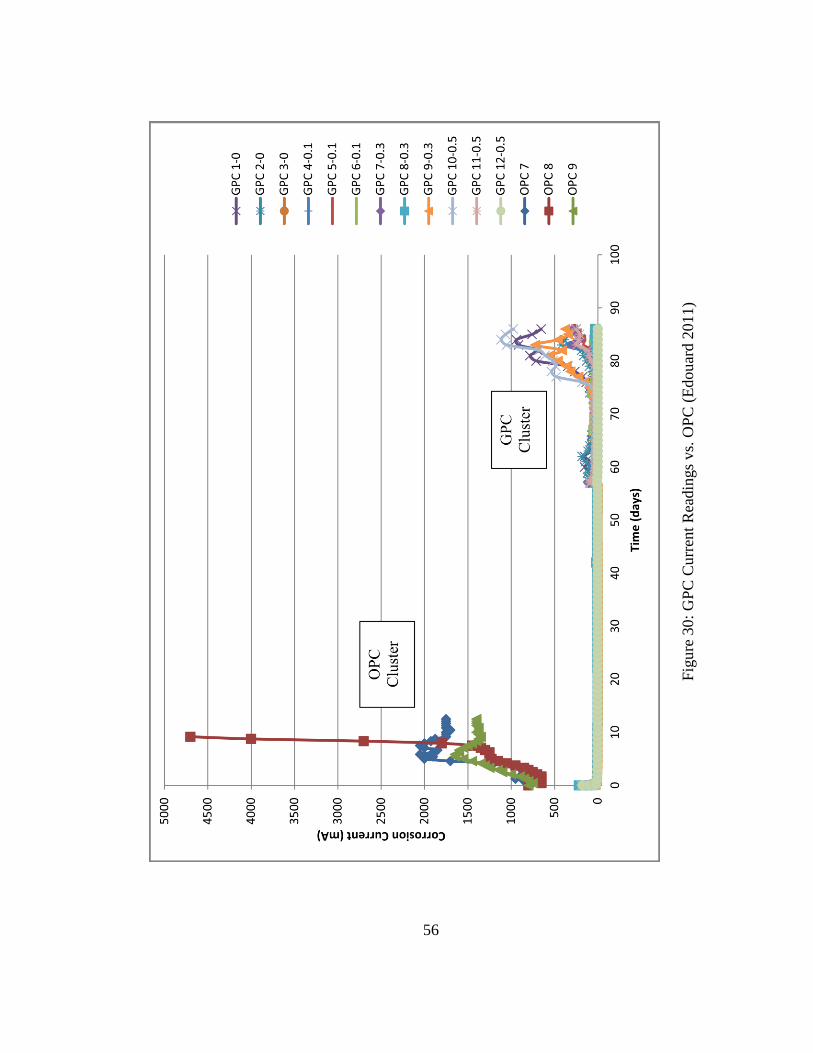
56
Fig
ure
30:
GP
C C
urr
ent
Rea
din
gs
vs.
OP
C (
Edou
ard 2
011)
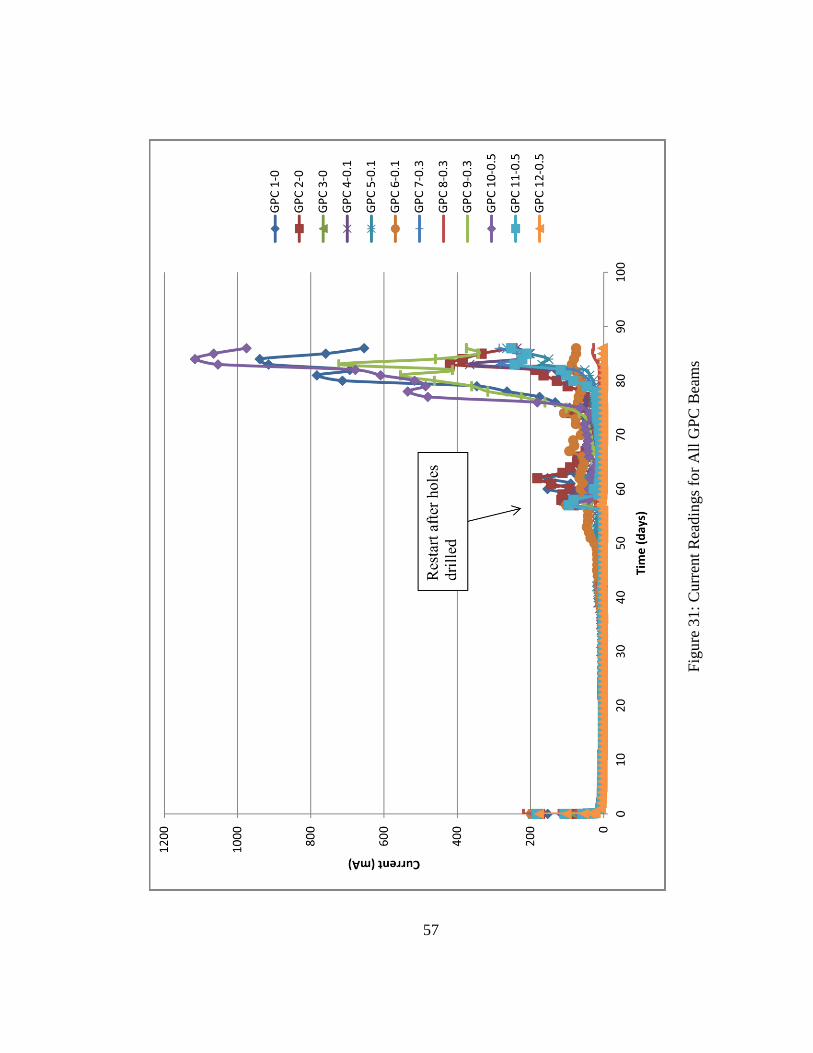
57
Fig
ure
31:
Curr
ent
Rea
din
gs
for
All
GP
C B
eam
s
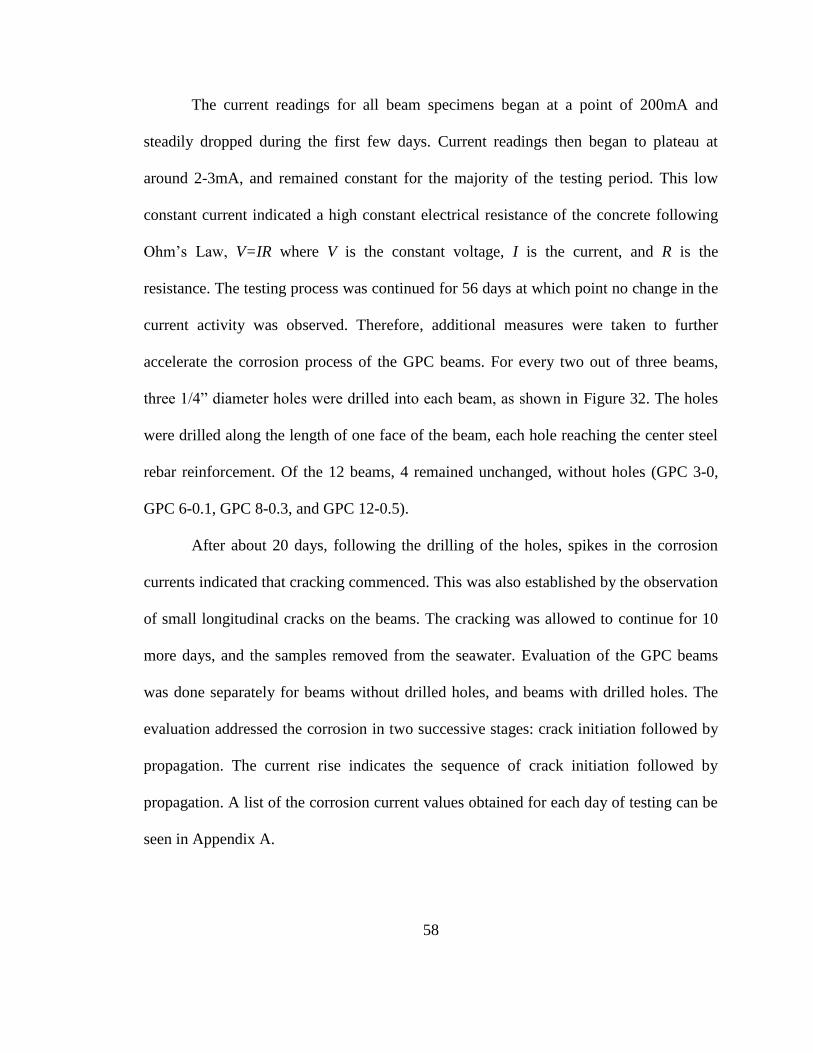
58
The current readings for all beam specimens began at a point of 200mA and
steadily dropped during the first few days. Current readings then began to plateau at
around 2-3mA, and remained constant for the majority of the testing period. This low
constant current indicated a high constant electrical resistance of the concrete following
Ohm’s Law, V=IR where V is the constant voltage, I is the current, and R is the
resistance. The testing process was continued for 56 days at which point no change in the
current activity was observed. Therefore, additional measures were taken to further
accelerate the corrosion process of the GPC beams. For every two out of three beams,
three 1/4” diameter holes were drilled into each beam, as shown in Figure 32. The holes
were drilled along the length of one face of the beam, each hole reaching the center steel
rebar reinforcement. Of the 12 beams, 4 remained unchanged, without holes (GPC 3-0,
GPC 6-0.1, GPC 8-0.3, and GPC 12-0.5).
After about 20 days, following the drilling of the holes, spikes in the corrosion
currents indicated that cracking commenced. This was also established by the observation
of small longitudinal cracks on the beams. The cracking was allowed to continue for 10
more days, and the samples removed from the seawater. Evaluation of the GPC beams
was done separately for beams without drilled holes, and beams with drilled holes. The
evaluation addressed the corrosion in two successive stages: crack initiation followed by
propagation. The current rise indicates the sequence of crack initiation followed by
propagation. A list of the corrosion current values obtained for each day of testing can be
seen in Appendix A.
59
Figure 32: Drilled Holes in GPC Specimens
To analyze the corrosion of the beams without holes, a graph of the current for
beams without holes was plotted in Figure 33. The first beam to show any signs of an
elevated current was GPC 6-0.1, which indicated that some cracking may have begun to
occur in the beam. This rise in current was accompanied by formation of the corrosion
product on the top of the beam, around the exposed rebar as shown in Figure 34.
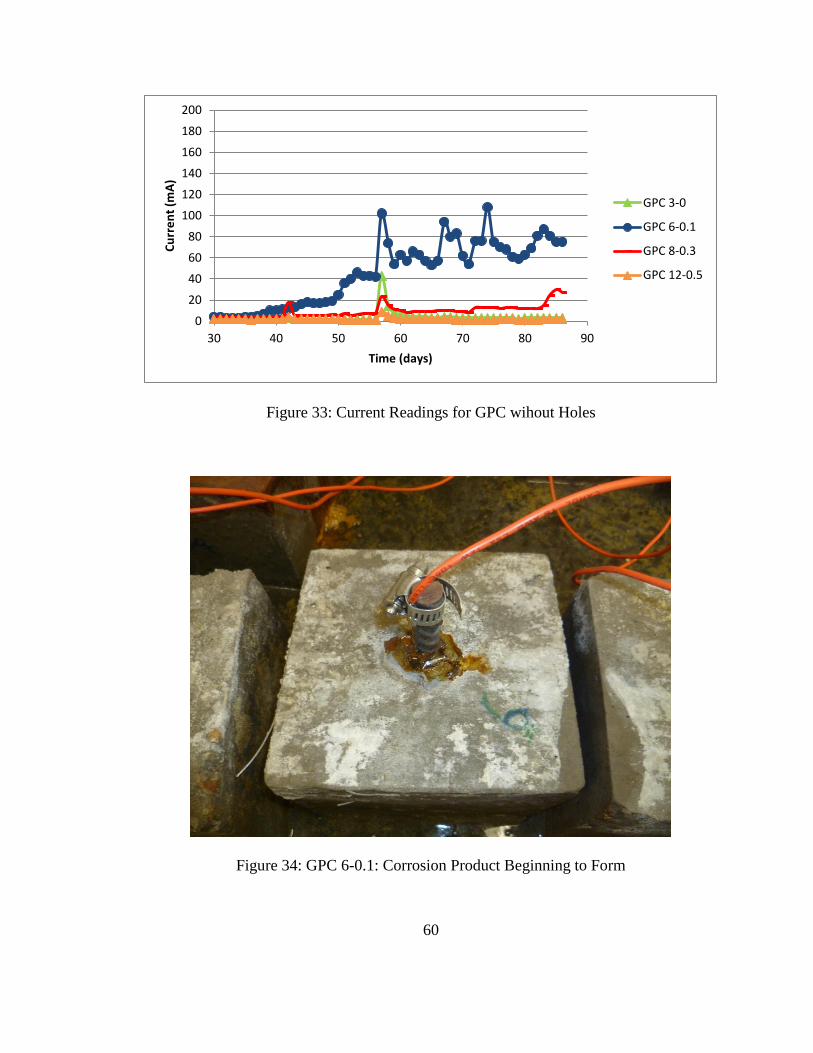
60
Figure 33: Current Readings for GPC wihout Holes
Figure 34: GPC 6-0.1: Corrosion Product Beginning to Form
0
20
40
60
80
100
120
140
160
180
200
30 40 50 60 70 80 90
Cu
rre
nt
(mA
)
Time (days)
GPC 3-0
GPC 6-0.1
GPC 8-0.3
GPC 12-0.5
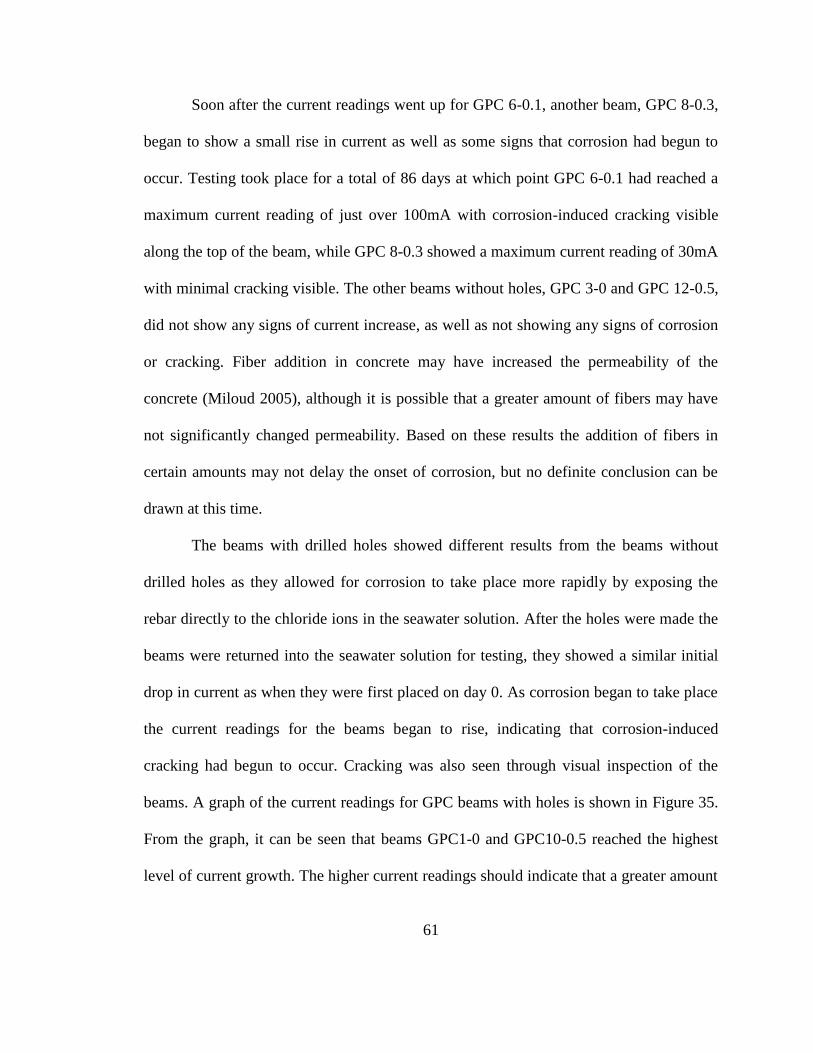
61
Soon after the current readings went up for GPC 6-0.1, another beam, GPC 8-0.3,
began to show a small rise in current as well as some signs that corrosion had begun to
occur. Testing took place for a total of 86 days at which point GPC 6-0.1 had reached a
maximum current reading of just over 100mA with corrosion-induced cracking visible
along the top of the beam, while GPC 8-0.3 showed a maximum current reading of 30mA
with minimal cracking visible. The other beams without holes, GPC 3-0 and GPC 12-0.5,
did not show any signs of current increase, as well as not showing any signs of corrosion
or cracking. Fiber addition in concrete may have increased the permeability of the
concrete (Miloud 2005), although it is possible that a greater amount of fibers may have
not significantly changed permeability. Based on these results the addition of fibers in
certain amounts may not delay the onset of corrosion, but no definite conclusion can be
drawn at this time.
The beams with drilled holes showed different results from the beams without
drilled holes as they allowed for corrosion to take place more rapidly by exposing the
rebar directly to the chloride ions in the seawater solution. After the holes were made the
beams were returned into the seawater solution for testing, they showed a similar initial
drop in current as when they were first placed on day 0. As corrosion began to take place
the current readings for the beams began to rise, indicating that corrosion-induced
cracking had begun to occur. Cracking was also seen through visual inspection of the
beams. A graph of the current readings for GPC beams with holes is shown in Figure 35.
From the graph, it can be seen that beams GPC1-0 and GPC10-0.5 reached the highest
level of current growth. The higher current readings should indicate that a greater amount
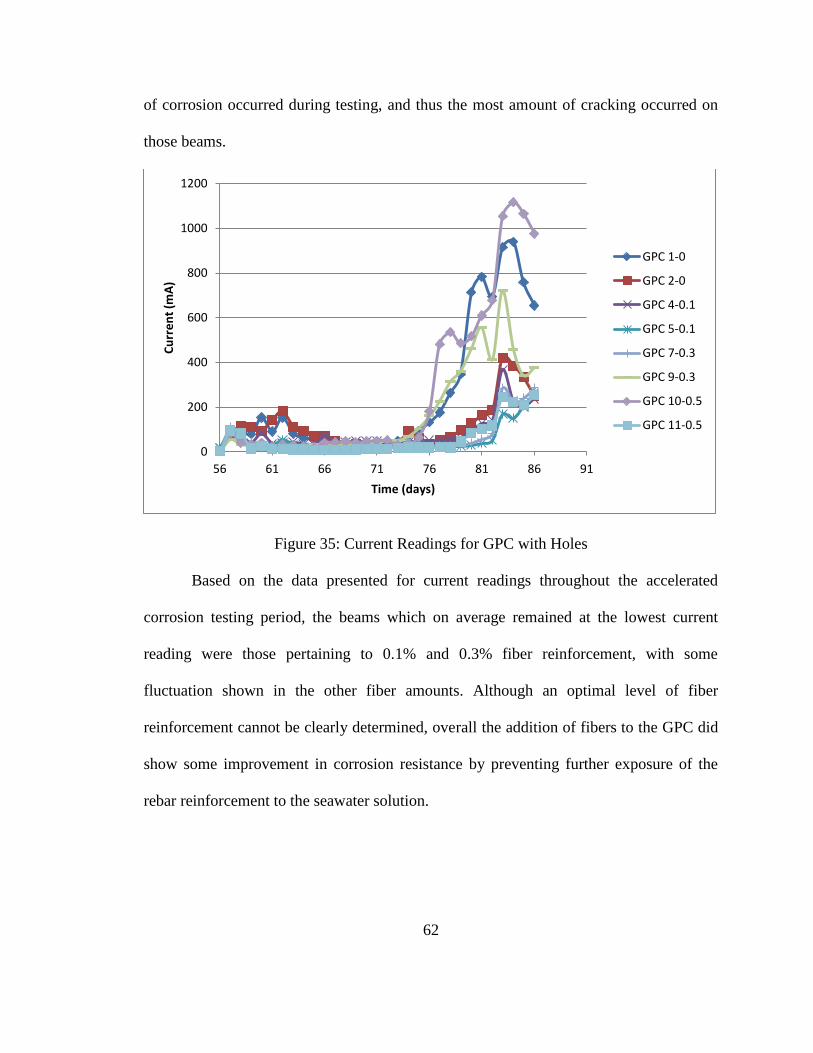
62
of corrosion occurred during testing, and thus the most amount of cracking occurred on
those beams.
Figure 35: Current Readings for GPC with Holes
Based on the data presented for current readings throughout the accelerated
corrosion testing period, the beams which on average remained at the lowest current
reading were those pertaining to 0.1% and 0.3% fiber reinforcement, with some
fluctuation shown in the other fiber amounts. Although an optimal level of fiber
reinforcement cannot be clearly determined, overall the addition of fibers to the GPC did
show some improvement in corrosion resistance by preventing further exposure of the
rebar reinforcement to the seawater solution.
0
200
400
600
800
1000
1200
56 61 66 71 76 81 86 91
Cu
rre
nt
(mA
)
Time (days)
GPC 1-0
GPC 2-0
GPC 4-0.1
GPC 5-0.1
GPC 7-0.3
GPC 9-0.3
GPC 10-0.5
GPC 11-0.5
63
6.4 CRACKING EVALUATION
Following the completion of monitoring of currents for corrosion, an analysis was
performed on the cracks observed on the surface of each beam. A method of crack
scoring suggested by Bolivar (2008) and Reddy, Bolivar, and Sobhan (2013) was
utilized. Crack scoring takes into account the number of cracks on each beam, the
average crack length of all the cracks, and the average maximum width of each crack per
beam. These values are put together for each beam and a final score is determined which
will help evaluate how each beam performed in comparison to the others.
To begin analyzing the crack score for each beam, the beam was visually
inspected for the total number of cracks which could be seen throughout the entire
surface area of the beam. An example of the cracking visible on the beams is shown in
Figure 36. The length of each of the cracks observed was then measured with a tape
measure to the nearest 1/16th
of an inch. The final step involved measuring the width of
each crack present in each beam, which was measured with a caliper to the nearest
millimeter (mm), and later converted to inches. A summary of the observed cracks per
beam can be seen in Appendix A. With these values recorded for each beam, a crack area
per specimen was calculated by multiplying the average maximum crack width by the
average crack length times the number of cracks. The sum of all cracked areas for each
fiber fraction was then added together to make a crack score from all the samples in that
mix, as shown in Equation 2.
Crack score = Σ [# of cracks × average crack length × average maximum
crack width] Eq. 2
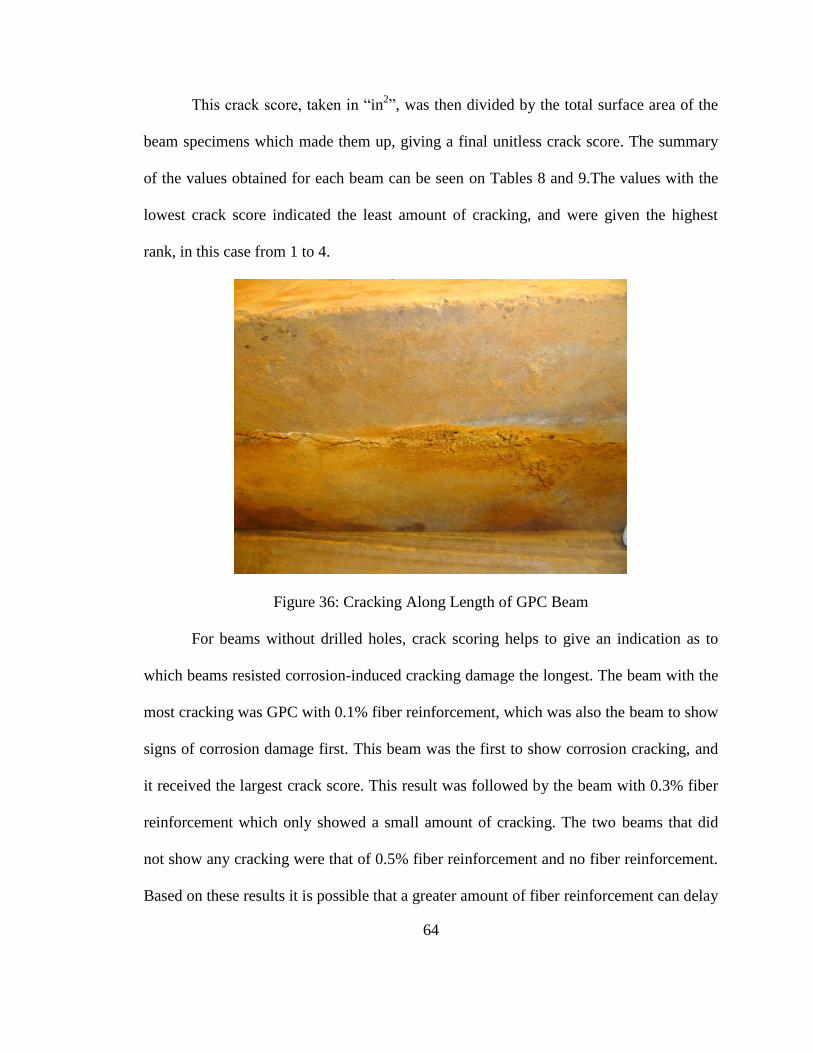
64
This crack score, taken in “in2”, was then divided by the total surface area of the
beam specimens which made them up, giving a final unitless crack score. The summary
of the values obtained for each beam can be seen on Tables 8 and 9.The values with the
lowest crack score indicated the least amount of cracking, and were given the highest
rank, in this case from 1 to 4.
Figure 36: Cracking Along Length of GPC Beam
For beams without drilled holes, crack scoring helps to give an indication as to
which beams resisted corrosion-induced cracking damage the longest. The beam with the
most cracking was GPC with 0.1% fiber reinforcement, which was also the beam to show
signs of corrosion damage first. This beam was the first to show corrosion cracking, and
it received the largest crack score. This result was followed by the beam with 0.3% fiber
reinforcement which only showed a small amount of cracking. The two beams that did
not show any cracking were that of 0.5% fiber reinforcement and no fiber reinforcement.
Based on these results it is possible that a greater amount of fiber reinforcement can delay
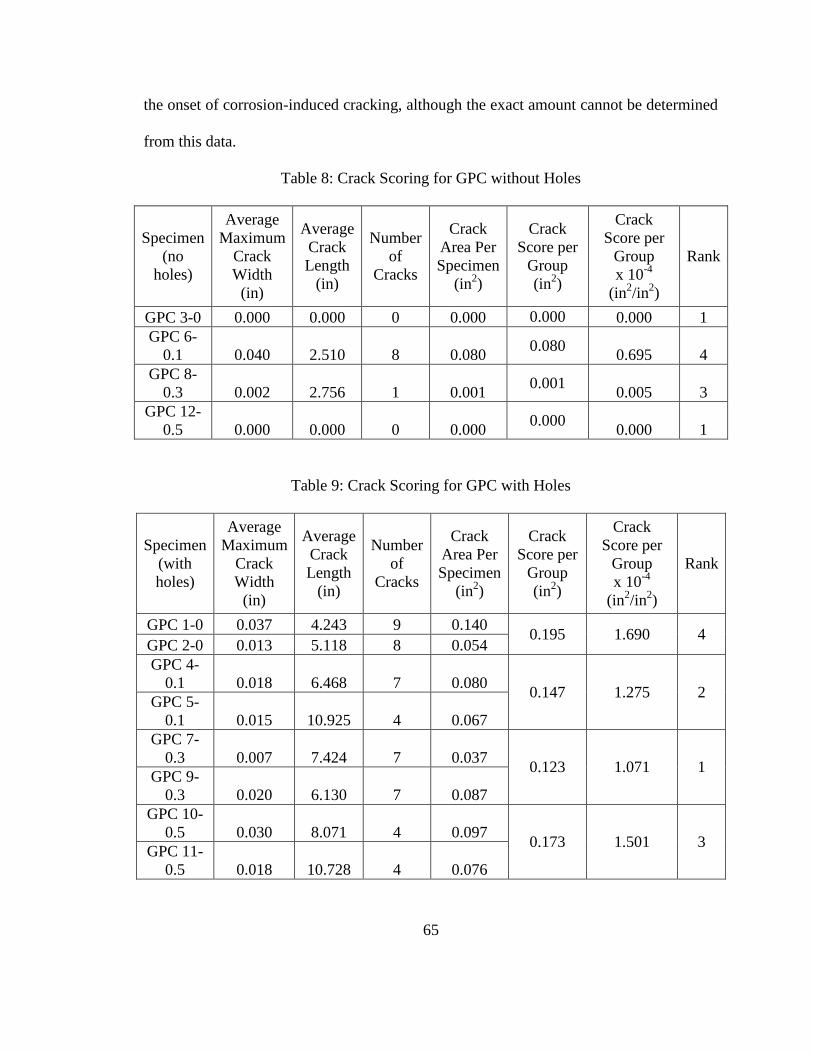
65
the onset of corrosion-induced cracking, although the exact amount cannot be determined
from this data.
Table 8: Crack Scoring for GPC without Holes
Specimen
(no
holes)
Average
Maximum
Crack
Width
(in)
Average
Crack
Length
(in)
Number
of
Cracks
Crack
Area Per
Specimen
(in2)
Crack
Score per
Group
(in2)
Crack
Score per
Group
x 10-4
(in2/in
2)
Rank
GPC 3-0 0.000 0.000 0 0.000 0.000 0.000 1
GPC 6-
0.1 0.040 2.510 8 0.080 0.080
0.695 4
GPC 8-
0.3 0.002 2.756 1 0.001 0.001
0.005 3
GPC 12-
0.5 0.000 0.000 0 0.000 0.000
0.000 1
Table 9: Crack Scoring for GPC with Holes
Specimen
(with
holes)
Average
Maximum
Crack
Width
(in)
Average
Crack
Length
(in)
Number
of
Cracks
Crack
Area Per
Specimen
(in2)
Crack
Score per
Group
(in2)
Crack
Score per
Group
x 10-4
(in2/in
2)
Rank
GPC 1-0 0.037 4.243 9 0.140 0.195 1.690 4
GPC 2-0 0.013 5.118 8 0.054
GPC 4-
0.1 0.018 6.468 7 0.080 0.147 1.275 2
GPC 5-
0.1 0.015 10.925 4 0.067
GPC 7-
0.3 0.007 7.424 7 0.037 0.123 1.071 1
GPC 9-
0.3 0.020 6.130 7 0.087
GPC 10-
0.5 0.030 8.071 4 0.097 0.173 1.501 3
GPC 11-
0.5 0.018 10.728 4 0.076
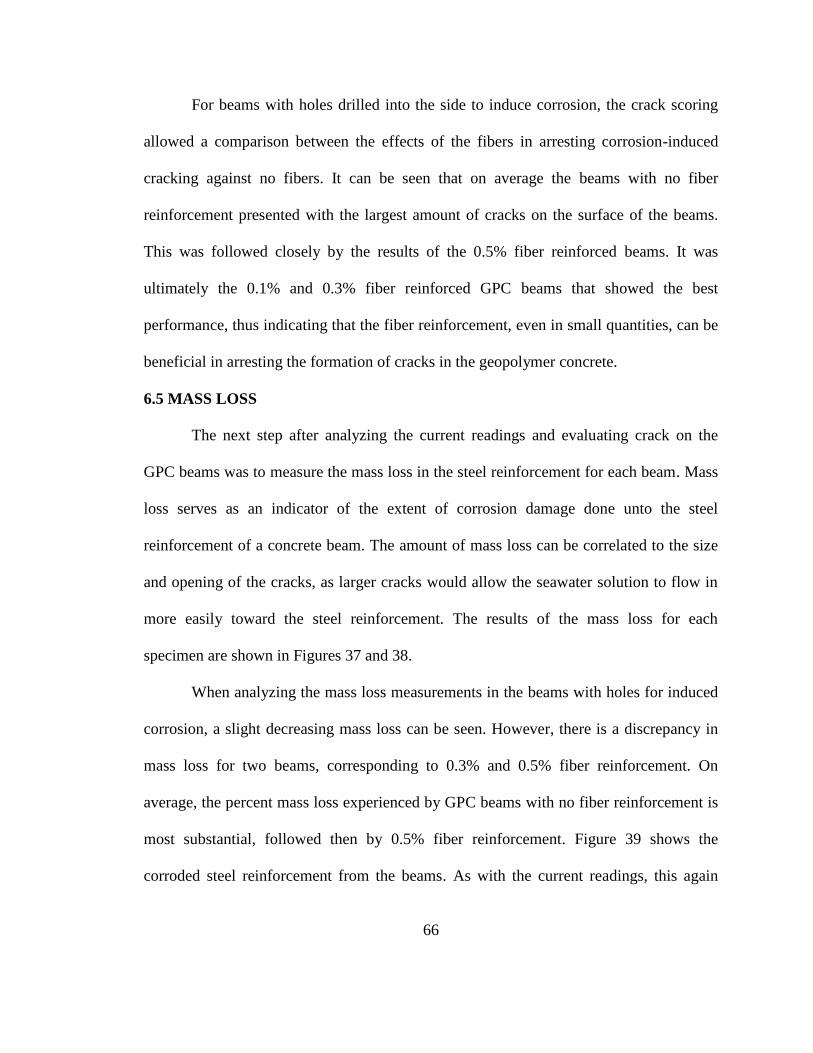
66
For beams with holes drilled into the side to induce corrosion, the crack scoring
allowed a comparison between the effects of the fibers in arresting corrosion-induced
cracking against no fibers. It can be seen that on average the beams with no fiber
reinforcement presented with the largest amount of cracks on the surface of the beams.
This was followed closely by the results of the 0.5% fiber reinforced beams. It was
ultimately the 0.1% and 0.3% fiber reinforced GPC beams that showed the best
performance, thus indicating that the fiber reinforcement, even in small quantities, can be
beneficial in arresting the formation of cracks in the geopolymer concrete.
6.5 MASS LOSS
The next step after analyzing the current readings and evaluating crack on the
GPC beams was to measure the mass loss in the steel reinforcement for each beam. Mass
loss serves as an indicator of the extent of corrosion damage done unto the steel
reinforcement of a concrete beam. The amount of mass loss can be correlated to the size
and opening of the cracks, as larger cracks would allow the seawater solution to flow in
more easily toward the steel reinforcement. The results of the mass loss for each
specimen are shown in Figures 37 and 38.
When analyzing the mass loss measurements in the beams with holes for induced
corrosion, a slight decreasing mass loss can be seen. However, there is a discrepancy in
mass loss for two beams, corresponding to 0.3% and 0.5% fiber reinforcement. On
average, the percent mass loss experienced by GPC beams with no fiber reinforcement is
most substantial, followed then by 0.5% fiber reinforcement. Figure 39 shows the
corroded steel reinforcement from the beams. As with the current readings, this again
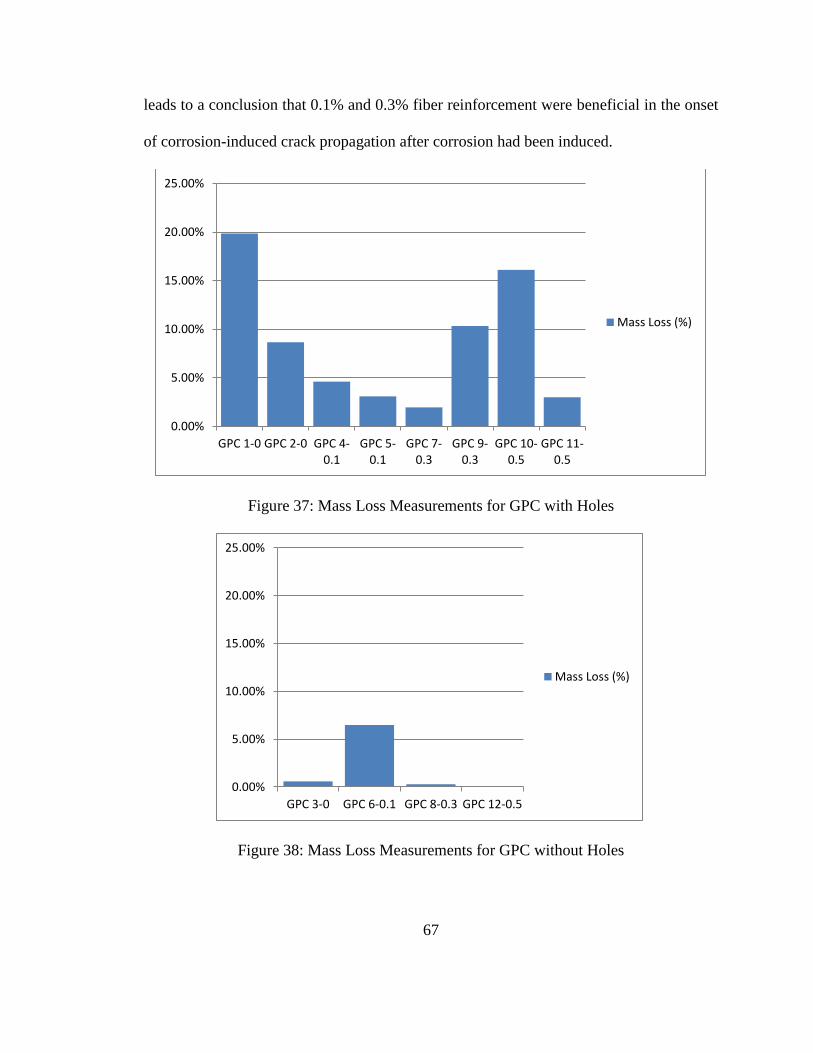
67
leads to a conclusion that 0.1% and 0.3% fiber reinforcement were beneficial in the onset
of corrosion-induced crack propagation after corrosion had been induced.
Figure 37: Mass Loss Measurements for GPC with Holes
Figure 38: Mass Loss Measurements for GPC without Holes
0.00%
5.00%
10.00%
15.00%
20.00%
25.00%
GPC 1-0 GPC 2-0 GPC 4-0.1
GPC 5-0.1
GPC 7-0.3
GPC 9-0.3
GPC 10-0.5
GPC 11-0.5
Mass Loss (%)
0.00%
5.00%
10.00%
15.00%
20.00%
25.00%
GPC 3-0 GPC 6-0.1 GPC 8-0.3 GPC 12-0.5
Mass Loss (%)
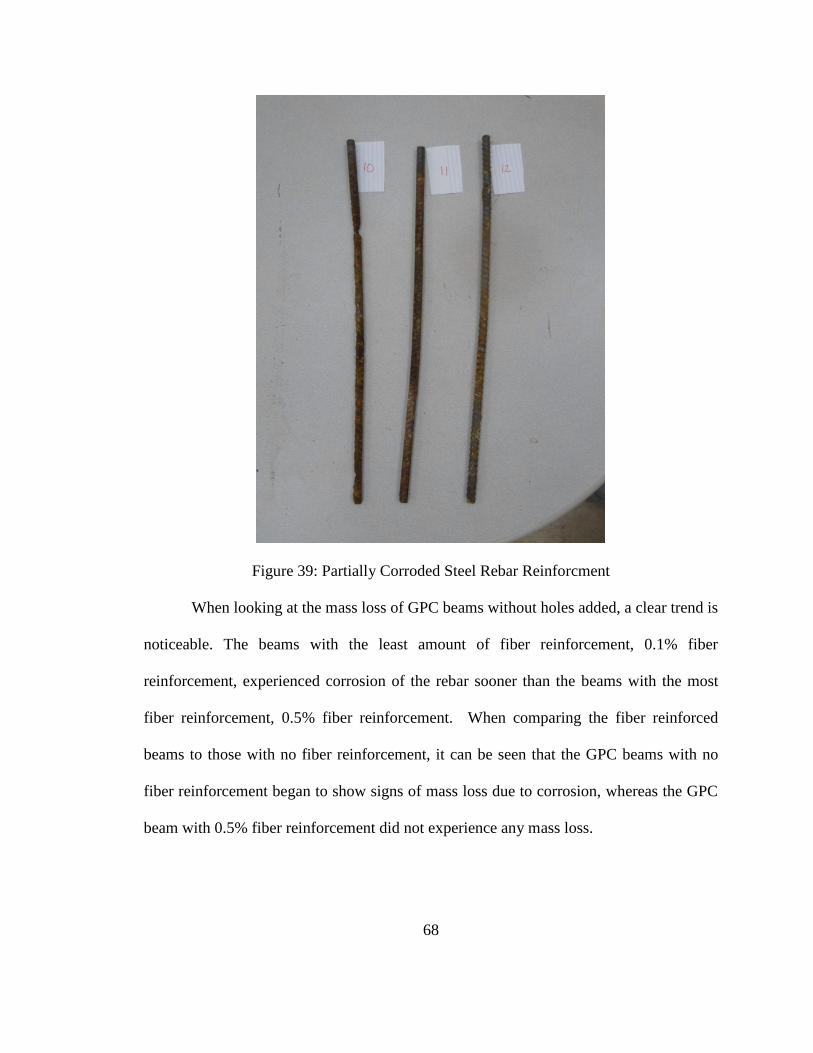
68
Figure 39: Partially Corroded Steel Rebar Reinforcment
When looking at the mass loss of GPC beams without holes added, a clear trend is
noticeable. The beams with the least amount of fiber reinforcement, 0.1% fiber
reinforcement, experienced corrosion of the rebar sooner than the beams with the most
fiber reinforcement, 0.5% fiber reinforcement. When comparing the fiber reinforced
beams to those with no fiber reinforcement, it can be seen that the GPC beams with no
fiber reinforcement began to show signs of mass loss due to corrosion, whereas the GPC
beam with 0.5% fiber reinforcement did not experience any mass loss.
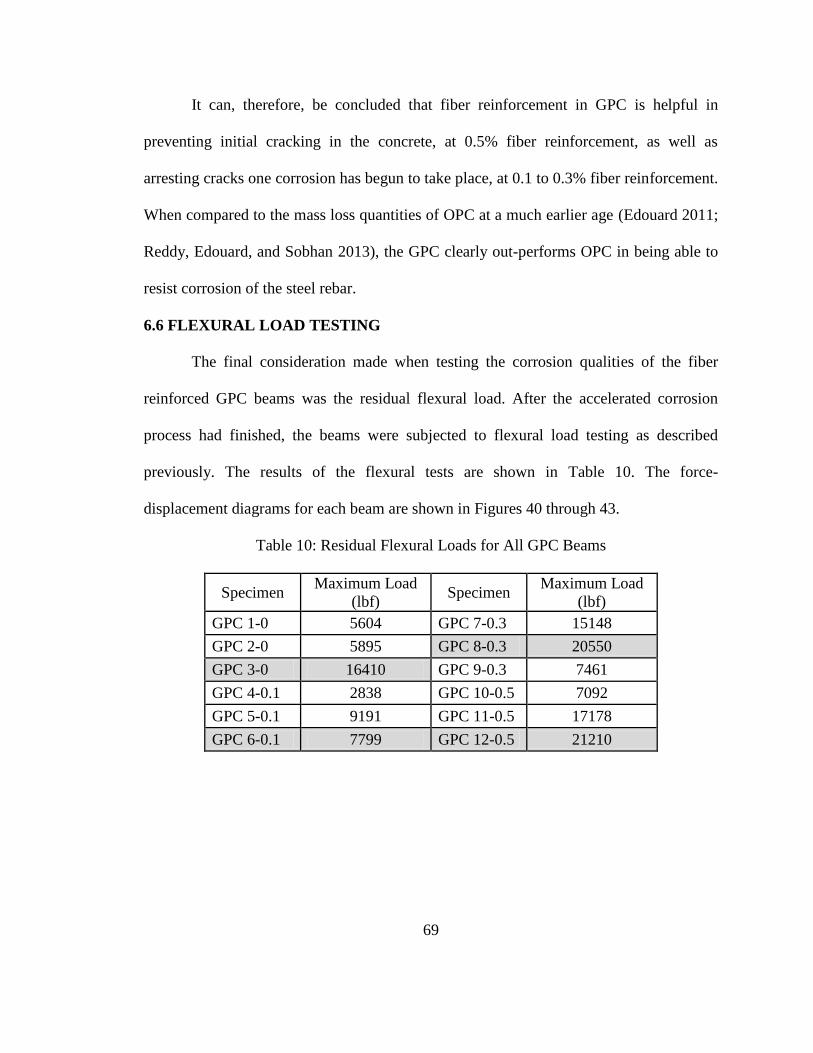
69
It can, therefore, be concluded that fiber reinforcement in GPC is helpful in
preventing initial cracking in the concrete, at 0.5% fiber reinforcement, as well as
arresting cracks one corrosion has begun to take place, at 0.1 to 0.3% fiber reinforcement.
When compared to the mass loss quantities of OPC at a much earlier age (Edouard 2011;
Reddy, Edouard, and Sobhan 2013), the GPC clearly out-performs OPC in being able to
resist corrosion of the steel rebar.
6.6 FLEXURAL LOAD TESTING
The final consideration made when testing the corrosion qualities of the fiber
reinforced GPC beams was the residual flexural load. After the accelerated corrosion
process had finished, the beams were subjected to flexural load testing as described
previously. The results of the flexural tests are shown in Table 10. The force-
displacement diagrams for each beam are shown in Figures 40 through 43.
Table 10: Residual Flexural Loads for All GPC Beams
Specimen Maximum Load
(lbf) Specimen
Maximum Load
(lbf)
GPC 1-0 5604 GPC 7-0.3 15148
GPC 2-0 5895 GPC 8-0.3 20550
GPC 3-0 16410 GPC 9-0.3 7461
GPC 4-0.1 2838 GPC 10-0.5 7092
GPC 5-0.1 9191 GPC 11-0.5 17178
GPC 6-0.1 7799 GPC 12-0.5 21210
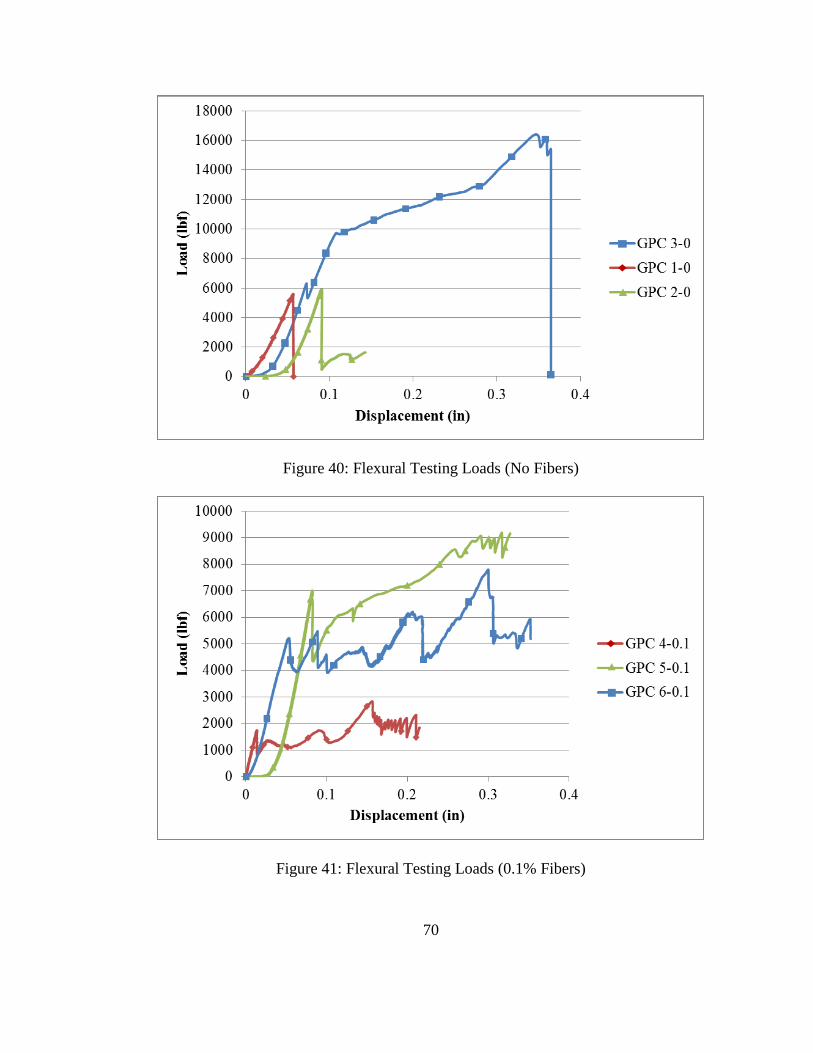
70
Figure 40: Flexural Testing Loads (No Fibers)
Figure 41: Flexural Testing Loads (0.1% Fibers)
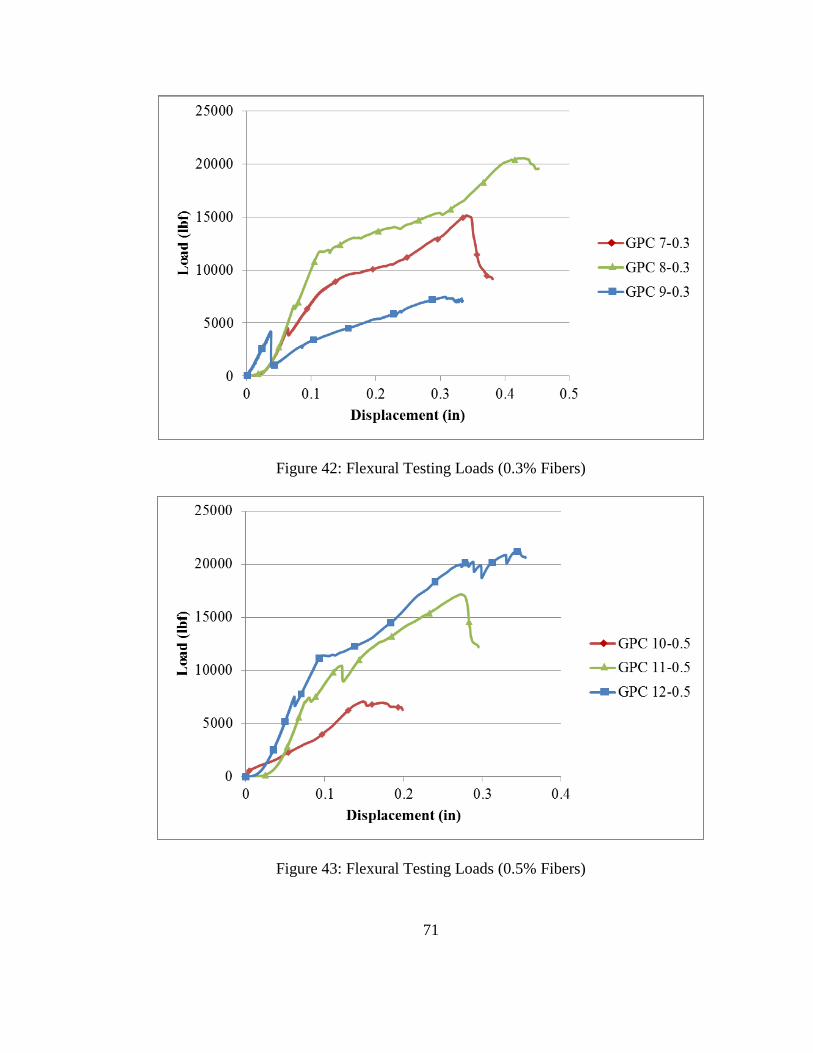
71
Figure 42: Flexural Testing Loads (0.3% Fibers)
Figure 43: Flexural Testing Loads (0.5% Fibers)
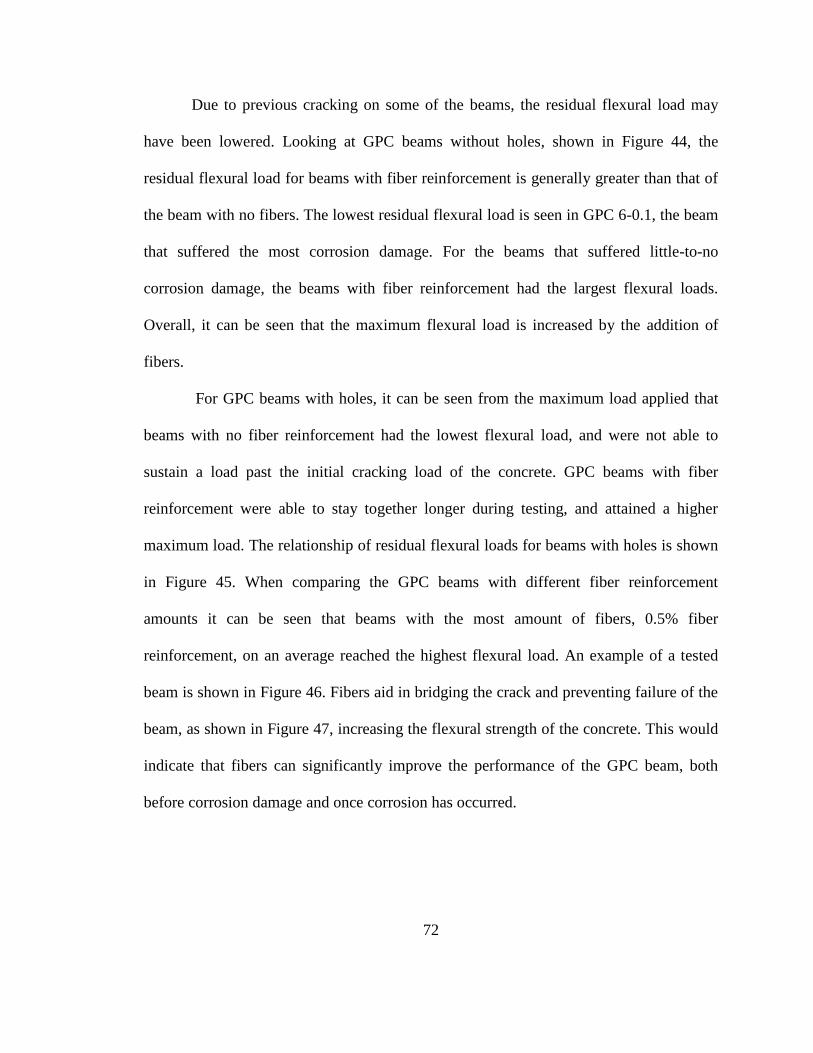
72
Due to previous cracking on some of the beams, the residual flexural load may
have been lowered. Looking at GPC beams without holes, shown in Figure 44, the
residual flexural load for beams with fiber reinforcement is generally greater than that of
the beam with no fibers. The lowest residual flexural load is seen in GPC 6-0.1, the beam
that suffered the most corrosion damage. For the beams that suffered little-to-no
corrosion damage, the beams with fiber reinforcement had the largest flexural loads.
Overall, it can be seen that the maximum flexural load is increased by the addition of
fibers.
For GPC beams with holes, it can be seen from the maximum load applied that
beams with no fiber reinforcement had the lowest flexural load, and were not able to
sustain a load past the initial cracking load of the concrete. GPC beams with fiber
reinforcement were able to stay together longer during testing, and attained a higher
maximum load. The relationship of residual flexural loads for beams with holes is shown
in Figure 45. When comparing the GPC beams with different fiber reinforcement
amounts it can be seen that beams with the most amount of fibers, 0.5% fiber
reinforcement, on an average reached the highest flexural load. An example of a tested
beam is shown in Figure 46. Fibers aid in bridging the crack and preventing failure of the
beam, as shown in Figure 47, increasing the flexural strength of the concrete. This would
indicate that fibers can significantly improve the performance of the GPC beam, both
before corrosion damage and once corrosion has occurred.
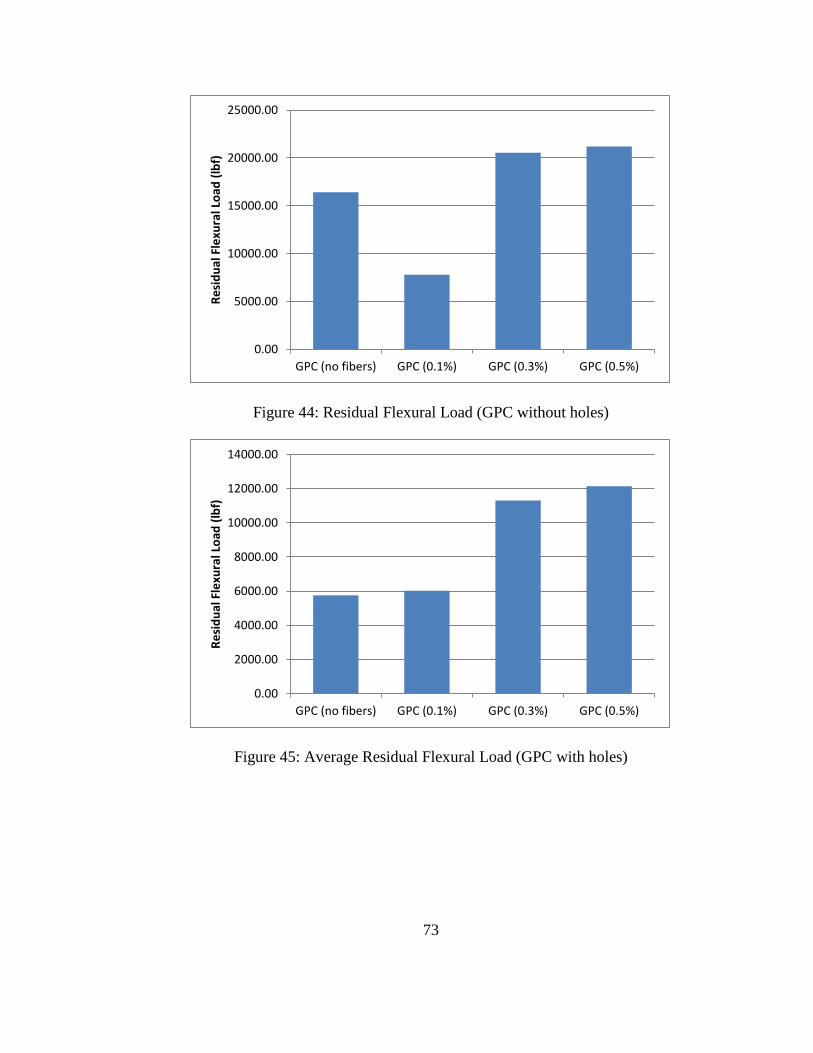
73
Figure 44: Residual Flexural Load (GPC without holes)
Figure 45: Average Residual Flexural Load (GPC with holes)
0.00
5000.00
10000.00
15000.00
20000.00
25000.00
GPC (no fibers) GPC (0.1%) GPC (0.3%) GPC (0.5%)
Re
sid
ual
Fle
xura
l Lo
ad (
lbf)
0.00
2000.00
4000.00
6000.00
8000.00
10000.00
12000.00
14000.00
GPC (no fibers) GPC (0.1%) GPC (0.3%) GPC (0.5%)
Re
sid
ual
Fle
xura
l Lo
ad (
lbf)
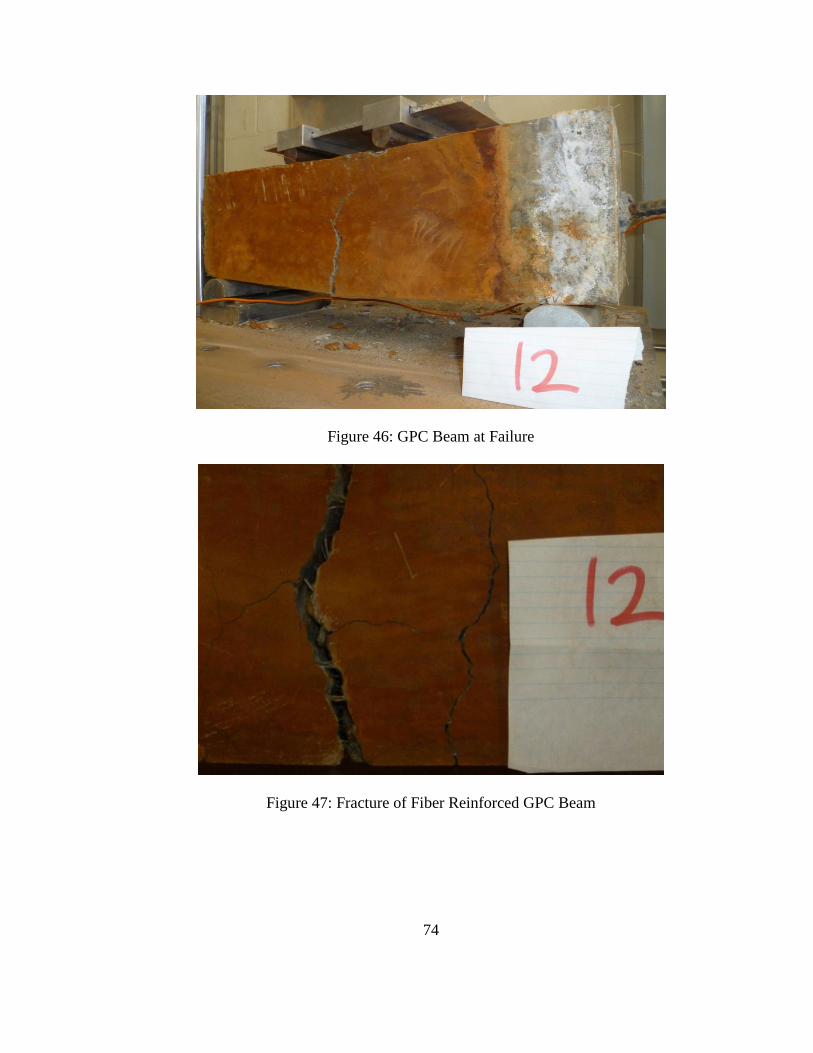
74
Figure 46: GPC Beam at Failure
Figure 47: Fracture of Fiber Reinforced GPC Beam
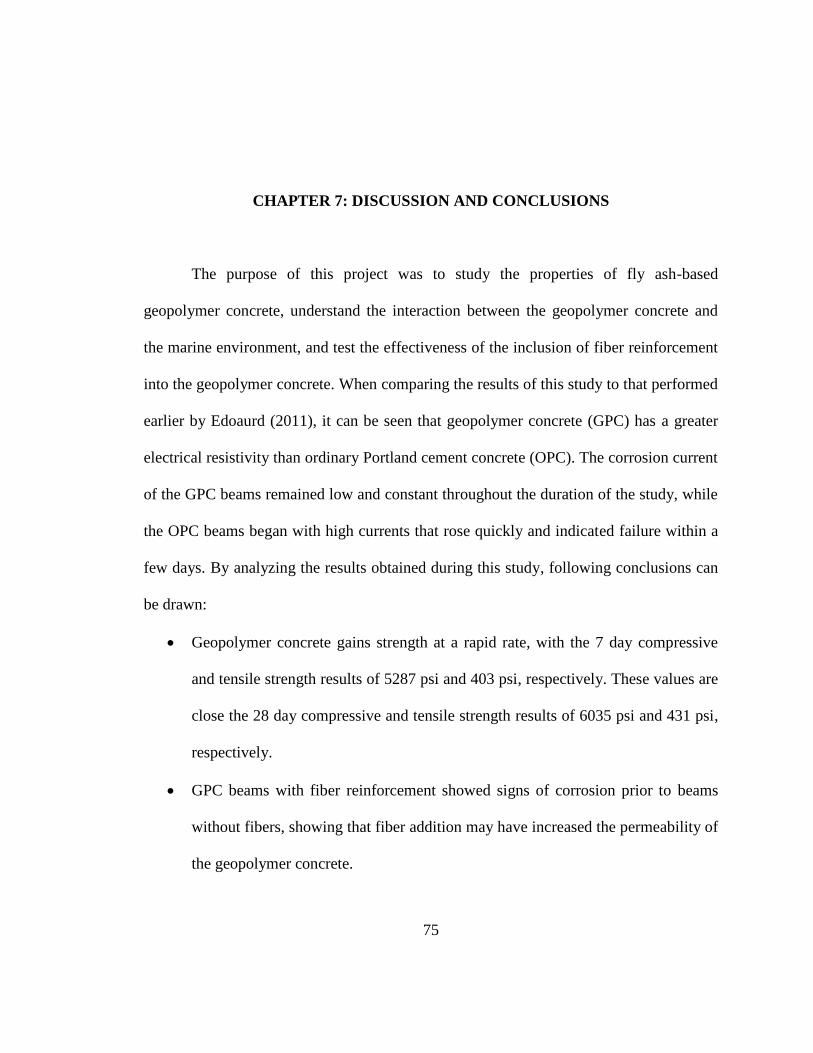
75
CHAPTER 7: DISCUSSION AND CONCLUSIONS
The purpose of this project was to study the properties of fly ash-based
geopolymer concrete, understand the interaction between the geopolymer concrete and
the marine environment, and test the effectiveness of the inclusion of fiber reinforcement
into the geopolymer concrete. When comparing the results of this study to that performed
earlier by Edoaurd (2011), it can be seen that geopolymer concrete (GPC) has a greater
electrical resistivity than ordinary Portland cement concrete (OPC). The corrosion current
of the GPC beams remained low and constant throughout the duration of the study, while
the OPC beams began with high currents that rose quickly and indicated failure within a
few days. By analyzing the results obtained during this study, following conclusions can
be drawn:
Geopolymer concrete gains strength at a rapid rate, with the 7 day compressive
and tensile strength results of 5287 psi and 403 psi, respectively. These values are
close the 28 day compressive and tensile strength results of 6035 psi and 431 psi,
respectively.
GPC beams with fiber reinforcement showed signs of corrosion prior to beams
without fibers, showing that fiber addition may have increased the permeability of
the geopolymer concrete.
76
GPC beams with fibers showed a greater resistance to crack propagation, showing
the least cracked area of the beams. Beams with 0.1% and 0.3% fiber
reinforcement performed better than beams with 0.5% fiber reinforcement. This
indicates the need for further studies addressing optimization.
Although fiber reinforced GPC beams began to show signs of steel reinforcement
corrosion faster, the mass loss of beams containing fibers was less than beams
without fibers. This shows that fiber addition can help reduce the damage of
corrosion.
GPC beams with fibers performed better in flexural testing than beams without
fibers, as the fibers helped bridge the gap of the flexural crack, allowing for a
greater stress capacity. One of the significant benefits of fiber inclusion in GPC is
the ability to resist larger moments, after reaching the cracking loads.
Because the experimental phase of the research took longer than anticipated, a change
was made to the experimental program that allowed for some discrepancies, as an
average of three samples could no longer be taken. In some of the results, such as crack
scoring and mass loss, there are some big differences in beams with similar fiber
amounts. Overall, it is clear that fiber reinforced GPC beams performed better than
unreinforced GPC beams in resisting corrosion damage.

77
APPENDIX A
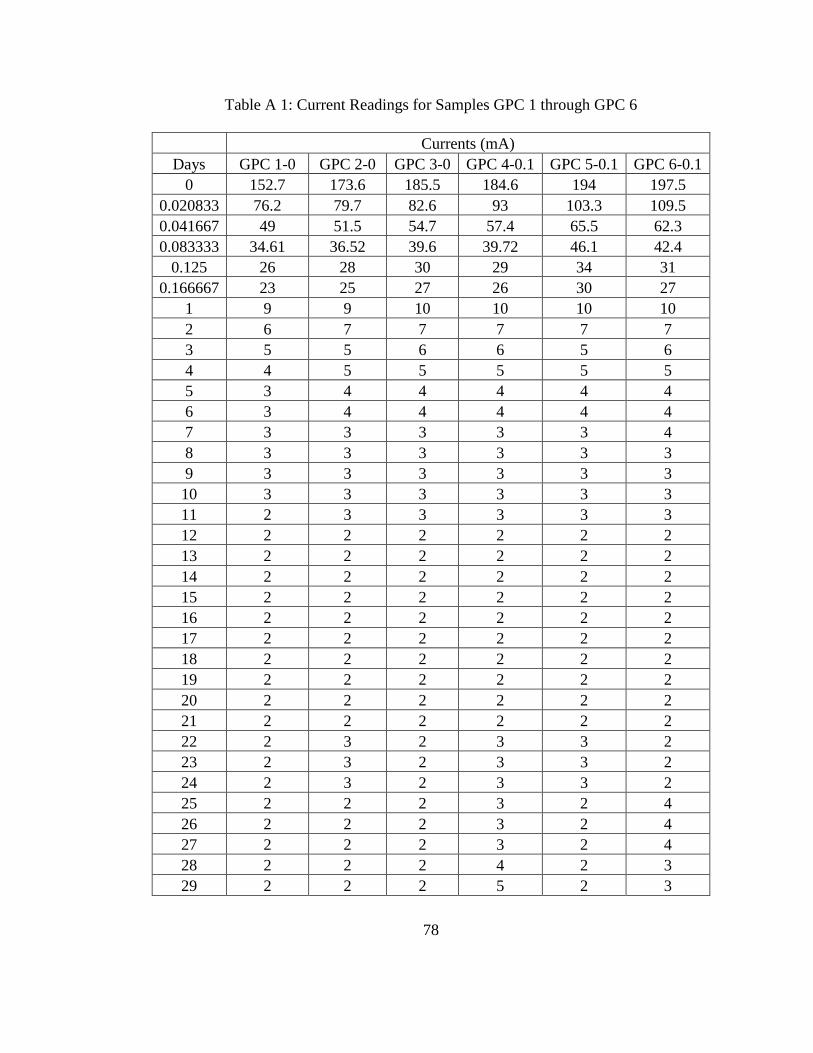
78
Table A 1: Current Readings for Samples GPC 1 through GPC 6
Currents (mA)
Days GPC 1-0 GPC 2-0 GPC 3-0 GPC 4-0.1 GPC 5-0.1 GPC 6-0.1
0 152.7 173.6 185.5 184.6 194 197.5
0.020833 76.2 79.7 82.6 93 103.3 109.5
0.041667 49 51.5 54.7 57.4 65.5 62.3
0.083333 34.61 36.52 39.6 39.72 46.1 42.4
0.125 26 28 30 29 34 31
0.166667 23 25 27 26 30 27
1 9 9 10 10 10 10
2 6 7 7 7 7 7
3 5 5 6 6 5 6
4 4 5 5 5 5 5
5 3 4 4 4 4 4
6 3 4 4 4 4 4
7 3 3 3 3 3 4
8 3 3 3 3 3 3
9 3 3 3 3 3 3
10 3 3 3 3 3 3
11 2 3 3 3 3 3
12 2 2 2 2 2 2
13 2 2 2 2 2 2
14 2 2 2 2 2 2
15 2 2 2 2 2 2
16 2 2 2 2 2 2
17 2 2 2 2 2 2
18 2 2 2 2 2 2
19 2 2 2 2 2 2
20 2 2 2 2 2 2
21 2 2 2 2 2 2
22 2 3 2 3 3 2
23 2 3 2 3 3 2
24 2 3 2 3 3 2
25 2 2 2 3 2 4
26 2 2 2 3 2 4
27 2 2 2 3 2 4
28 2 2 2 4 2 3
29 2 2 2 5 2 3
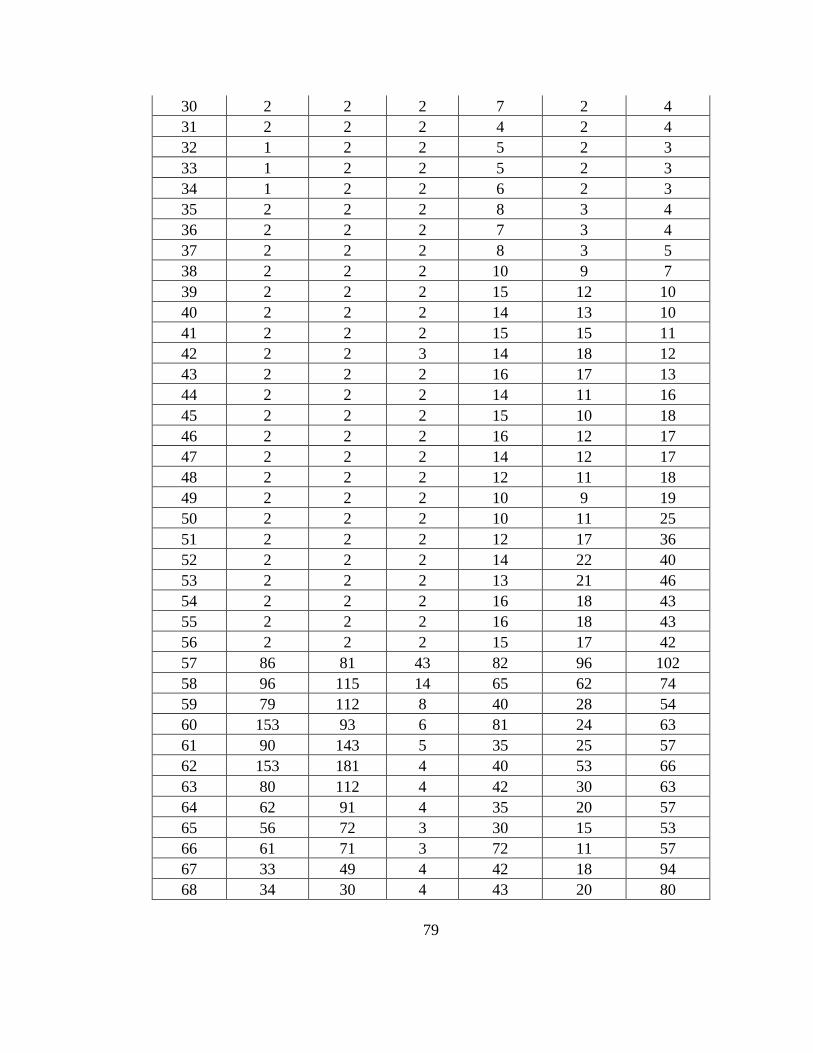
79
30 2 2 2 7 2 4
31 2 2 2 4 2 4
32 1 2 2 5 2 3
33 1 2 2 5 2 3
34 1 2 2 6 2 3
35 2 2 2 8 3 4
36 2 2 2 7 3 4
37 2 2 2 8 3 5
38 2 2 2 10 9 7
39 2 2 2 15 12 10
40 2 2 2 14 13 10
41 2 2 2 15 15 11
42 2 2 3 14 18 12
43 2 2 2 16 17 13
44 2 2 2 14 11 16
45 2 2 2 15 10 18
46 2 2 2 16 12 17
47 2 2 2 14 12 17
48 2 2 2 12 11 18
49 2 2 2 10 9 19
50 2 2 2 10 11 25
51 2 2 2 12 17 36
52 2 2 2 14 22 40
53 2 2 2 13 21 46
54 2 2 2 16 18 43
55 2 2 2 16 18 43
56 2 2 2 15 17 42
57 86 81 43 82 96 102
58 96 115 14 65 62 74
59 79 112 8 40 28 54
60 153 93 6 81 24 63
61 90 143 5 35 25 57
62 153 181 4 40 53 66
63 80 112 4 42 30 63
64 62 91 4 35 20 57
65 56 72 3 30 15 53
66 61 71 3 72 11 57
67 33 49 4 42 18 94
68 34 30 4 43 20 80
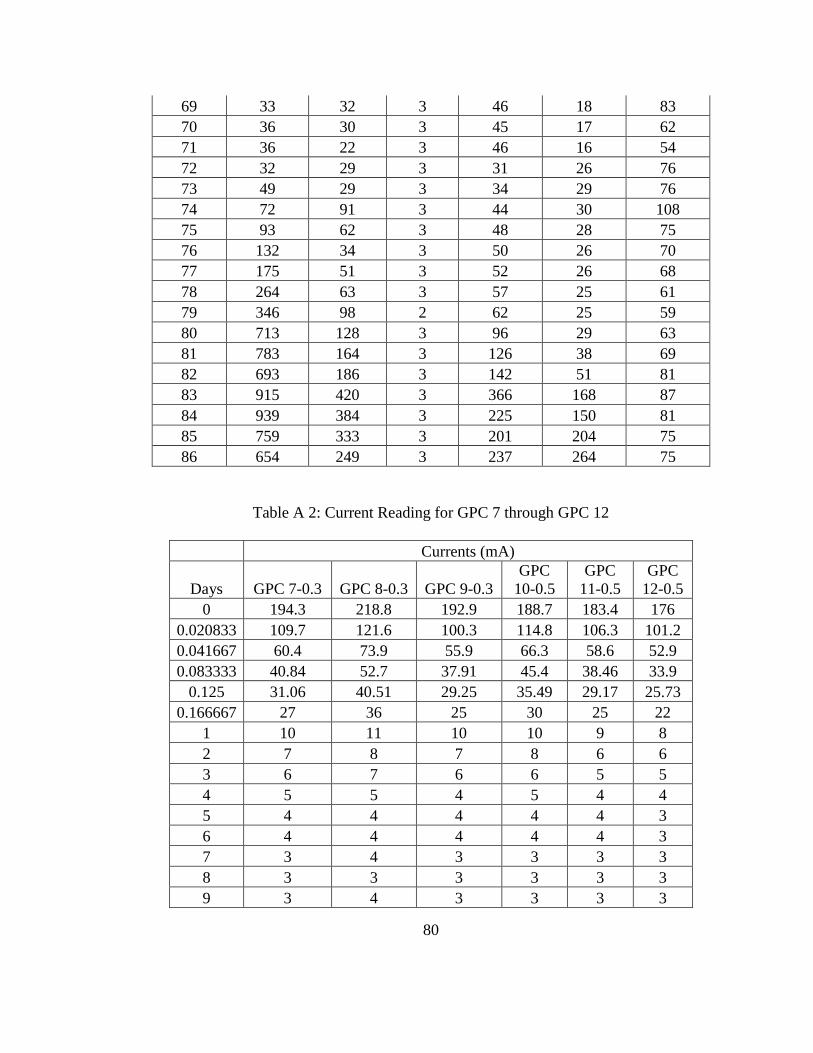
80
69 33 32 3 46 18 83
70 36 30 3 45 17 62
71 36 22 3 46 16 54
72 32 29 3 31 26 76
73 49 29 3 34 29 76
74 72 91 3 44 30 108
75 93 62 3 48 28 75
76 132 34 3 50 26 70
77 175 51 3 52 26 68
78 264 63 3 57 25 61
79 346 98 2 62 25 59
80 713 128 3 96 29 63
81 783 164 3 126 38 69
82 693 186 3 142 51 81
83 915 420 3 366 168 87
84 939 384 3 225 150 81
85 759 333 3 201 204 75
86 654 249 3 237 264 75
Table A 2: Current Reading for GPC 7 through GPC 12
Currents (mA)
Days GPC 7-0.3 GPC 8-0.3 GPC 9-0.3
GPC
10-0.5
GPC
11-0.5
GPC
12-0.5
0 194.3 218.8 192.9 188.7 183.4 176
0.020833 109.7 121.6 100.3 114.8 106.3 101.2
0.041667 60.4 73.9 55.9 66.3 58.6 52.9
0.083333 40.84 52.7 37.91 45.4 38.46 33.9
0.125 31.06 40.51 29.25 35.49 29.17 25.73
0.166667 27 36 25 30 25 22
1 10 11 10 10 9 8
2 7 8 7 8 6 6
3 6 7 6 6 5 5
4 5 5 4 5 4 4
5 4 4 4 4 4 3
6 4 4 4 4 4 3
7 3 4 3 3 3 3
8 3 3 3 3 3 3
9 3 4 3 3 3 3
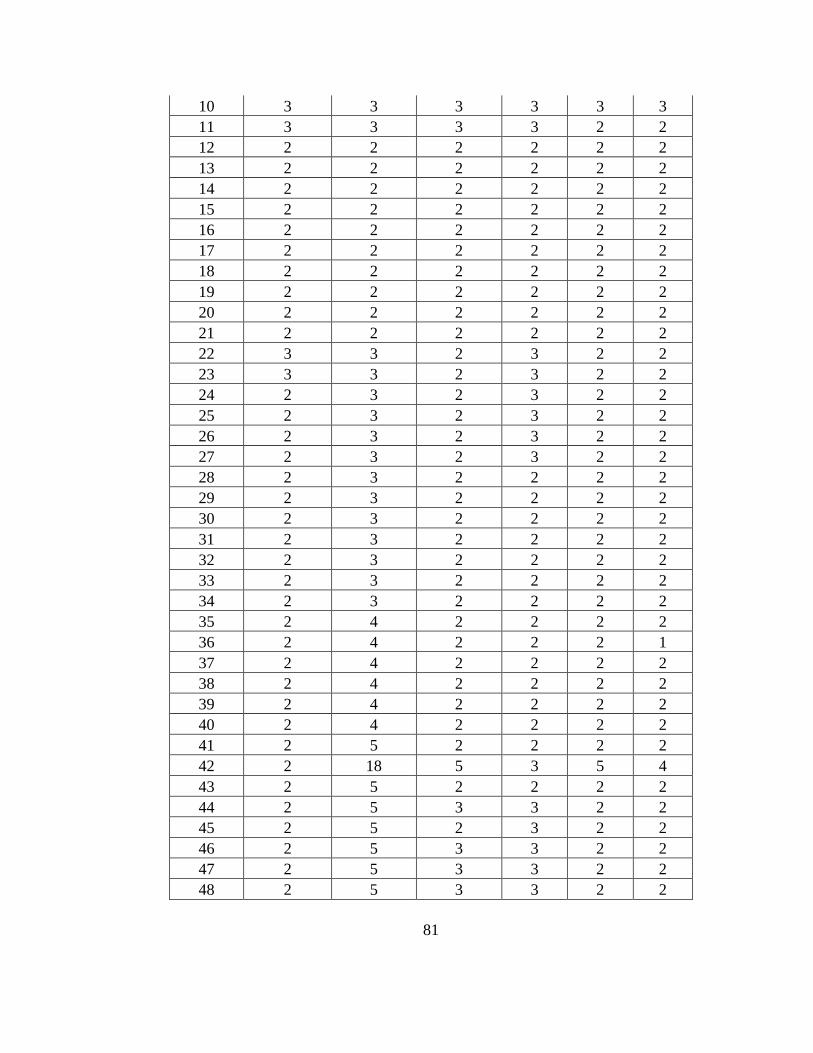
81
10 3 3 3 3 3 3
11 3 3 3 3 2 2
12 2 2 2 2 2 2
13 2 2 2 2 2 2
14 2 2 2 2 2 2
15 2 2 2 2 2 2
16 2 2 2 2 2 2
17 2 2 2 2 2 2
18 2 2 2 2 2 2
19 2 2 2 2 2 2
20 2 2 2 2 2 2
21 2 2 2 2 2 2
22 3 3 2 3 2 2
23 3 3 2 3 2 2
24 2 3 2 3 2 2
25 2 3 2 3 2 2
26 2 3 2 3 2 2
27 2 3 2 3 2 2
28 2 3 2 2 2 2
29 2 3 2 2 2 2
30 2 3 2 2 2 2
31 2 3 2 2 2 2
32 2 3 2 2 2 2
33 2 3 2 2 2 2
34 2 3 2 2 2 2
35 2 4 2 2 2 2
36 2 4 2 2 2 1
37 2 4 2 2 2 2
38 2 4 2 2 2 2
39 2 4 2 2 2 2
40 2 4 2 2 2 2
41 2 5 2 2 2 2
42 2 18 5 3 5 4
43 2 5 2 2 2 2
44 2 5 3 3 2 2
45 2 5 2 3 2 2
46 2 5 3 3 2 2
47 2 5 3 3 2 2
48 2 5 3 3 2 2
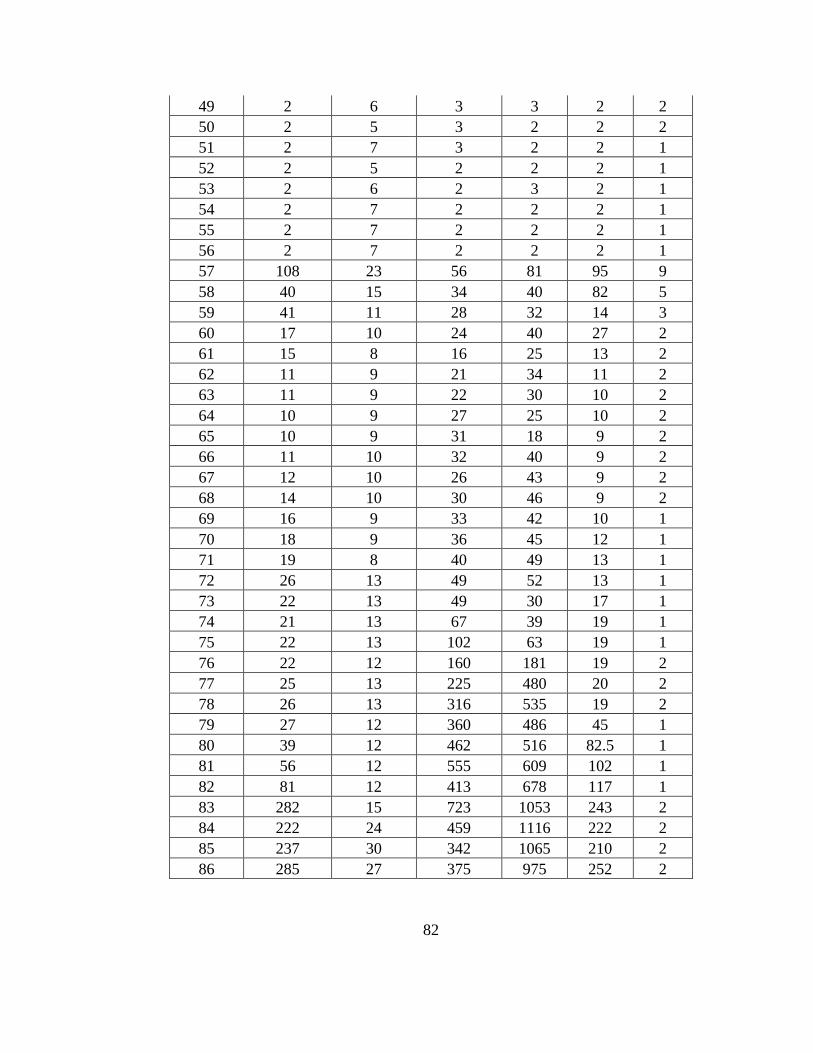
82
49 2 6 3 3 2 2
50 2 5 3 2 2 2
51 2 7 3 2 2 1
52 2 5 2 2 2 1
53 2 6 2 3 2 1
54 2 7 2 2 2 1
55 2 7 2 2 2 1
56 2 7 2 2 2 1
57 108 23 56 81 95 9
58 40 15 34 40 82 5
59 41 11 28 32 14 3
60 17 10 24 40 27 2
61 15 8 16 25 13 2
62 11 9 21 34 11 2
63 11 9 22 30 10 2
64 10 9 27 25 10 2
65 10 9 31 18 9 2
66 11 10 32 40 9 2
67 12 10 26 43 9 2
68 14 10 30 46 9 2
69 16 9 33 42 10 1
70 18 9 36 45 12 1
71 19 8 40 49 13 1
72 26 13 49 52 13 1
73 22 13 49 30 17 1
74 21 13 67 39 19 1
75 22 13 102 63 19 1
76 22 12 160 181 19 2
77 25 13 225 480 20 2
78 26 13 316 535 19 2
79 27 12 360 486 45 1
80 39 12 462 516 82.5 1
81 56 12 555 609 102 1
82 81 12 413 678 117 1
83 282 15 723 1053 243 2
84 222 24 459 1116 222 2
85 237 30 342 1065 210 2
86 285 27 375 975 252 2
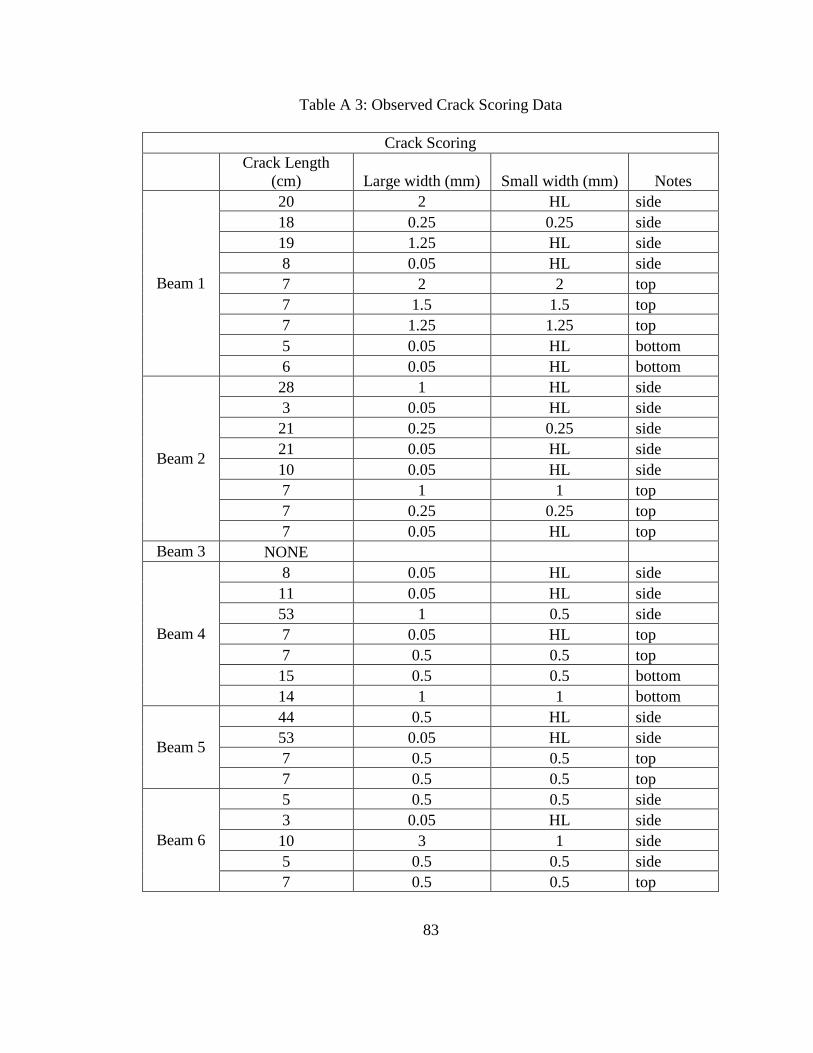
83
Table A 3: Observed Crack Scoring Data
Crack Scoring
Crack Length
(cm) Large width (mm) Small width (mm) Notes
Beam 1
20 2 HL side
18 0.25 0.25 side
19 1.25 HL side
8 0.05 HL side
7 2 2 top
7 1.5 1.5 top
7 1.25 1.25 top
5 0.05 HL bottom
6 0.05 HL bottom
Beam 2
28 1 HL side
3 0.05 HL side
21 0.25 0.25 side
21 0.05 HL side
10 0.05 HL side
7 1 1 top
7 0.25 0.25 top
7 0.05 HL top
Beam 3 NONE
Beam 4
8 0.05 HL side
11 0.05 HL side
53 1 0.5 side
7 0.05 HL top
7 0.5 0.5 top
15 0.5 0.5 bottom
14 1 1 bottom
Beam 5
44 0.5 HL side
53 0.05 HL side
7 0.5 0.5 top
7 0.5 0.5 top
Beam 6
5 0.5 0.5 side
3 0.05 HL side
10 3 1 side
5 0.5 0.5 side
7 0.5 0.5 top
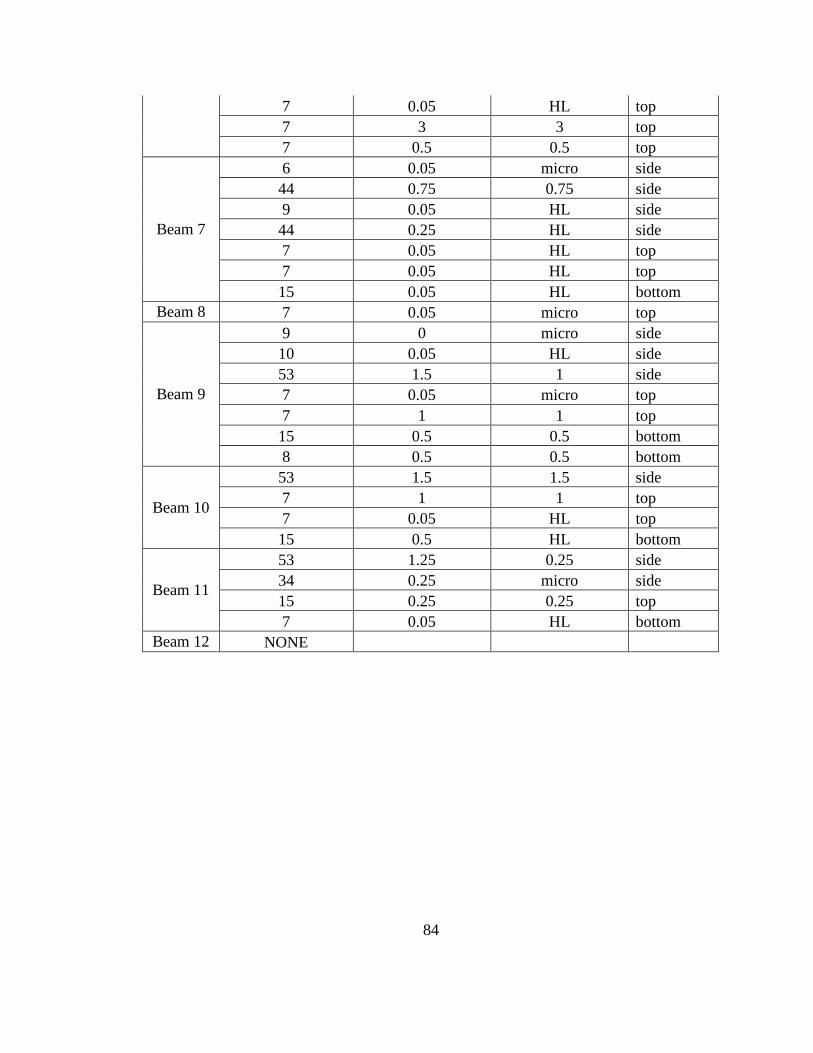
84
7 0.05 HL top
7 3 3 top
7 0.5 0.5 top
Beam 7
6 0.05 micro side
44 0.75 0.75 side
9 0.05 HL side
44 0.25 HL side
7 0.05 HL top
7 0.05 HL top
15 0.05 HL bottom
Beam 8 7 0.05 micro top
Beam 9
9 0 micro side
10 0.05 HL side
53 1.5 1 side
7 0.05 micro top
7 1 1 top
15 0.5 0.5 bottom
8 0.5 0.5 bottom
Beam 10
53 1.5 1.5 side
7 1 1 top
7 0.05 HL top
15 0.5 HL bottom
Beam 11
53 1.25 0.25 side
34 0.25 micro side
15 0.25 0.25 top
7 0.05 HL bottom
Beam 12 NONE
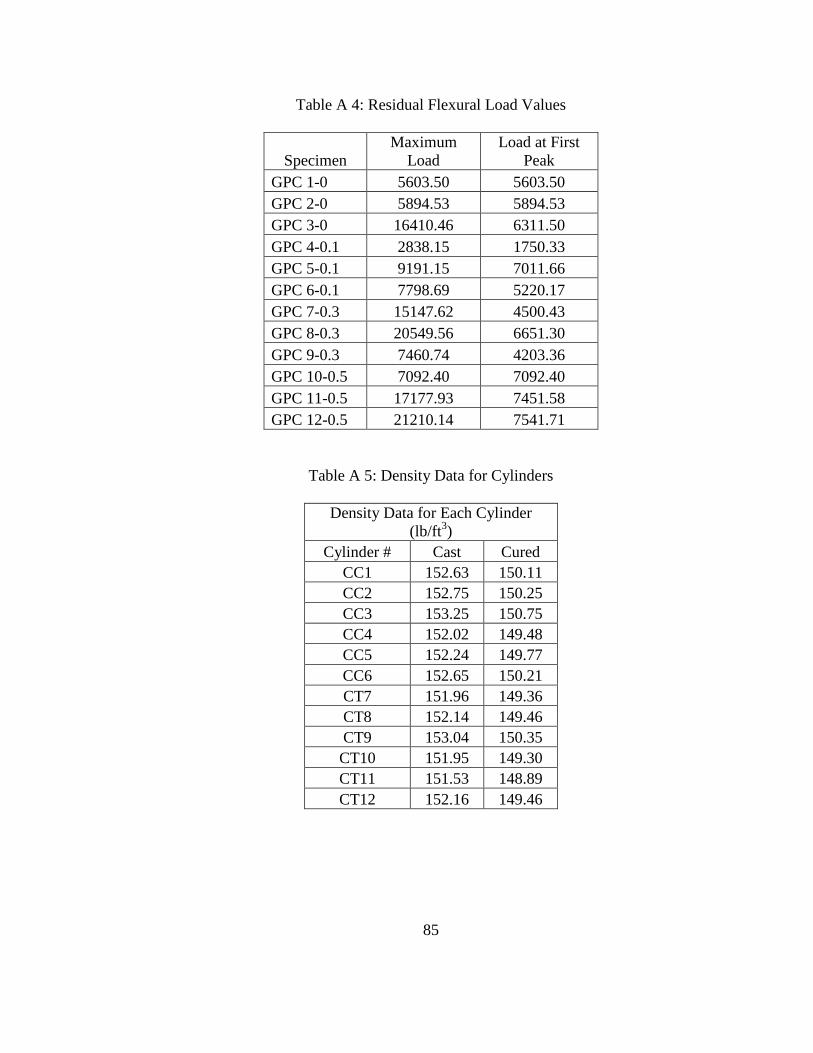
85
Table A 4: Residual Flexural Load Values
Specimen
Maximum
Load
Load at First
Peak
GPC 1-0 5603.50 5603.50
GPC 2-0 5894.53 5894.53
GPC 3-0 16410.46 6311.50
GPC 4-0.1 2838.15 1750.33
GPC 5-0.1 9191.15 7011.66
GPC 6-0.1 7798.69 5220.17
GPC 7-0.3 15147.62 4500.43
GPC 8-0.3 20549.56 6651.30
GPC 9-0.3 7460.74 4203.36
GPC 10-0.5 7092.40 7092.40
GPC 11-0.5 17177.93 7451.58
GPC 12-0.5 21210.14 7541.71
Table A 5: Density Data for Cylinders
Density Data for Each Cylinder
(lb/ft3)
Cylinder # Cast Cured
CC1 152.63 150.11
CC2 152.75 150.25
CC3 153.25 150.75
CC4 152.02 149.48
CC5 152.24 149.77
CC6 152.65 150.21
CT7 151.96 149.36
CT8 152.14 149.46
CT9 153.04 150.35
CT10 151.95 149.30
CT11 151.53 148.89
CT12 152.16 149.46
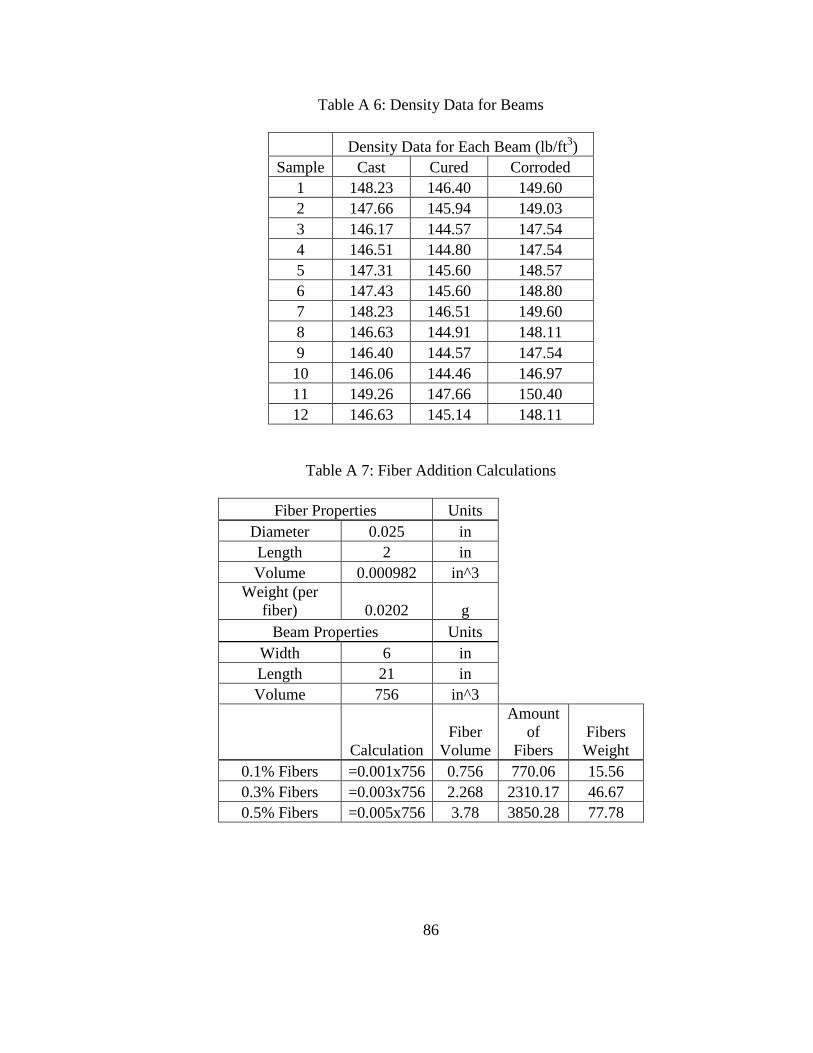
86
Table A 6: Density Data for Beams
Density Data for Each Beam (lb/ft3)
Sample Cast Cured Corroded
1 148.23 146.40 149.60
2 147.66 145.94 149.03
3 146.17 144.57 147.54
4 146.51 144.80 147.54
5 147.31 145.60 148.57
6 147.43 145.60 148.80
7 148.23 146.51 149.60
8 146.63 144.91 148.11
9 146.40 144.57 147.54
10 146.06 144.46 146.97
11 149.26 147.66 150.40
12 146.63 145.14 148.11
Table A 7: Fiber Addition Calculations
Fiber Properties Units
Diameter 0.025 in
Length 2 in
Volume 0.000982 in^3
Weight (per
fiber) 0.0202 g
Beam Properties Units
Width 6 in
Length 21 in
Volume 756 in^3
Calculation
Fiber
Volume
Amount
of
Fibers
Fibers
Weight
0.1% Fibers =0.001x756 0.756 770.06 15.56
0.3% Fibers =0.003x756 2.268 2310.17 46.67
0.5% Fibers =0.005x756 3.78 3850.28 77.78
87
REFERENCES
Al-Sulaimani, G.J., Kaleemullah, M., Basunbul, I.A., and Rasheeduzzafar (1990).
“Influence of corrosion and cracking on bond behavior and strength of reinforced
concrete members.” ACI Structural Journal, 87(2), 220-231.
Allen, R.T.L. (1998). Concrete in coastal structures. Telford, London, UK.
American Coal Ash Association (ACAA) (2012). “2011 Coal Combustion Product (CCP)
Production & Use Survey Report.” Farmington Hills, MI.
Armstrong, Thomas (2012). “The cement industry in figures: An overview of global
cement sector trends.” International Cement Review, Dorking, Surrey, UK.
ASTM C33 /C33M (2011). “Standard Specification for Concrete Aggregates.” ASTM
International, West Conshohocken, PA.
ASTM C39/C39M (2011). “Standard Test Method for Compressive Strength of
Cylindrical Concrete Specimens.” ASTM International, West Conshohocken, PA.
ASTM C78/C78M (2010). “Standard Test Method for Flexural Strength of Concrete
(Using Simple Beam with Third-Point Loading).” ASTM International, West
Conshohocken, PA.
ASTM C192/C192M (2007). “Standard Practice for Making and Curing Concrete Test
Specimens in the Laboratory.” ASTM International, West Conshohocken, PA.
88
ASTM C496/C496M (2011). “Standard Test Method for Splitting Tensile Strength of
Cylindrical Concrete Specimens.” ASTM International, West Conshohocken, PA.
ASTM C 618 (2012). “Standard Specification for Coal Fly Ash and Raw or Calcined
Natural Pozzolan for Use in Concrete.” ASTM International, West
Conshohocken, PA.
ASTM D 1141 (1990). “Standard Specification for Substitute Ocean Water.” ASTM
International, West Conshohocken, PA.
Bakharev, T. (2005). “Resistance of geopolymer materials to acid attack.” Cement and
Concrete Research, 35(4), 658-670.
Balaguru, P., Kurtz, S., and Rudolph, J. (1997). “Geopolymer for repair and rehabilitation
of reinforced concrete beams.” Geopolymer Institute, Saint-Quentin, France.
Beaudoin, J.J. (1990). Handbook of Fiber-Reinforced Concrete: Principles Properties,
Developments and Applications. Noyes Publications, Park Ridge, NJ.
Bentur, Arnon and Mindess, Sidney (2007). Fibre Reinforced Cementitious Composites.
Taylor & Francis, London, UK.
Bolivar, Juan Carlos (2008). “Experimental Evaluation of the Structural Integrity of the
Repairs for Corrosion-Damaged Marine Piles.” Florida Atlantic University, Boca
Raton, FL.
Broomfield, John P. (1997). Corrosion of Steel in Concrete. E & FN Spon, London, UK.
Davidovits, J. (1991). “GEOPOLYMERS Inorganic polymeric new materials.” Journal
of Thermal Analysis and calorimetry, 37(8), 1633-1656.
89
Davidovits, J. (2002). “30 Years of Successes and Failures in Geopolymer Applications.
Market Trends and Potential Breakthroughs.” Geopolymer 2002 Conference,
Melbourne, Australia.
Duxson, P., et al. (2007). "Geopolymer technology: the current state of the art." Journal
of Materials Science, 42(9), 2917-2933.
Edouard, Jean-Baptiste (2011). “Experimental Evaluation of the Durability of Fly Ash-
Based Geopolymer Concrete in the Marine Environment.” Florida Atlantic
University, Boca Raton, FL.
Fernández-Jiménez, A., and Palomo, A. (2003). “Characterisation of fly ashes. Potential
reactivity as alkaline cements.” Fuel, 82(18), 2259-2265.
Florida Department of Transportation (FDOT) (2000). “Florida Method of Test for An
Accelerated Laboratory Method for Corrosion Testing of Reinforced Concrete
Using Impressed Current.” Designation: FM 5-522
Hardjito, D. and Rangan, B.V. (2005). “Development and Properties of Low-Calcium Fly
Ash-Based Geopolymer Concrete.” Curtin University of Technology, Perth,
Australia.
Kakooei, S., Akil, H.M., Dolati, A., and Rouh, J. (2012). “The corrosion investigation of
rebar embedded in the fibers reinforced concrete.” Construction and Building
Materials, 35, 564-570.
Malhotra, V.M. (1999). “Making Concrete ‘Greener’ With Fly Ash.” Concrete
International, 21(5), 61-66.
90
Malhotra, V.M. (2002).“High-Performance, High-Volume Fly Ash Concrete.” Concrete
International, 24(7), 30-34.
Miloud, B. (2005). “Permeability and Porosity Characteristics of Steel Fiber Reinforced
Concrete.” Asian Journal of Civil Engineering, 6(4), 317-330.
Nawy, Edward G. (2001). Fundamentals of high-performance concrete. John Wiley,
New York, NY.
Orr, Mary (2008). “What Does That Number Really Mean? Aquarium Water Testing
Methods, Results and Interpretation.” SeaScope, 24, 1-4.
Palomo, A., Grutzeck, M.W., and Blanco, M.T. (1999). “Alkali-activated fly ashes: A
cement for the future.” Cement and Concrete Research, 29(8), 1323-1329.
Provis, J.L., & Van Deventer, J.S.J. (2009). Geopolymers: structure, processing,
properties and industrial applications. Woodhead Publishing Limited,
Cambridge, UK.
Reddy, D., Bolivar, J., and Sobhan, K. (2013). ”Durability-Based Ranking of Typical
Structural Repairs for Corrosion-Damaged Marine Piles.” ASCE Practice
Periodical on Structural Design and Construction, 18(4), 225–237.
Reddy, D., Edouard, J., and Sobhan, K. (2013). ”Durability of Fly Ash–Based
Geopolymer Structural Concrete in the Marine Environment.” Journal of
Materials in Civil Engineering, 25(6), 781–787.
91
Sahmaran, M., Li, V.C., and Andrade, C. (2008). “Corrosion resistance performance of
steel-reinforced engineered cementitious composite beams.” ACI Materials
Journal, 105(3), 243-250.
Tagnit-Hamou, A., Vanhove, Y., and Petrov, N. (2005). “Microstructural analysis of the
bond mechanism between polyolefin fibers and cement pastes.” Cement and
concrete research, 35(2), 364-370.
Van Chanh, Nguyen (2005). “Steel Fiber Reinforced Concrete.” The JSCE-VIFCEA Joint
Seminar on Concrete Engineering, Ho Chi Minh City University of Technology,
Ho Chi Minh City, Vietnam.
Van Jaarsveld, J.G.S. and Van Deventer, J.S.J. (1996). “The Potential Use of
Geopolymeric Materials to Immobilise Toxic Metals: Part I. Theory and
Applications.” Minerals Engineering, 10(7), 659-669.
Van Jaarsveld, J.G.S., Van Deventer, J.S.J., and Schwartzman, A. (1999). “The Potential
Use of Geopolymeric Materials to Immobilise Toxic Metals: Part II. Material and
Leaching Characteristics.” Minerals Engineering, 12(1), 75-93.
Van Jaarsveld, J.G.S., Van Deventer, J.S.J., and Lukey, G.C. (2002). “The effect of
composition and temperature on the properties of fly ash-and kaolinite-based
geopolymers.” Chemical Engineering Journal, 89(1), 63-73.
Wallah, S.E. and Rangan, B.V. (2006). “Low-Calcium Fly Ash-Based Geopolymer
Concrete: Long-Term Properties.” Curtin University of Technology, Perth,
Australia.
92
Xu, Hua, and Van Deventer, J.S.J. (2000). “The geopolymerisation of alumino-silicate
minerals.” International Journal of Mineral Processing, 59(3), 247-266.
Xu, Hua, and Van Deventer, Jannie S.J. (2002). “Geopolymerisation of multiple
minerals.” Minerals Engineering, 15(12), 1131-1139.