Embed Size (px)
Citation preview

Hamed Shaker H. Askar/ Engineering Research Journal 166 (JUN 2020) CV19-CV38
CV19
Strength Characteristics Of Lightweight Reinforced
Concrete Deep Beams With Web Openings
Eman Abdallah H. Abdelaal1)
, Hamed Shaker H. Askar2)
and Mohamed E. El-zoghiby3)
1 Teaching Assistant,
2 Prof. of Concrete Structures,
3Associate Prof. of Concrete Structures,
Structural Engineering Department, Mansoura University, El-Mansoura, Egypt.
ABSTRACT
The present experimental investigation reports test results of six lightweight
reinforced concrete deep beams with web openings including a reference solid beam.
The used concrete in casting the specimens has a cylinder compressive strength of
32MPa. The beams were tested to failure under two-point loads that lie at beams
shear span to determine their shear strengths. The main parameter considered in this
investigation was the size of web openings. Obtained test results showed a reduction
in the beam shear strength relative to the increasing in the opening size. Based on
the experimental and obtained results, concluding remarks were drawn. Owing to
the obtained results, an experimental equation had been adopted and showed an
accepted agreement with the authors specimens and the results of specimens
available in literature. Additionally, and owing to the observed crack patterns of
tested beams, strut-and-tie models were generated and used to verify the
experimental results.
Keywords: Deep Beams; Lightweight Concrete; Shear Strength; Openings; Strut-
and-Tie Modeling.
1. INTRODUCTION There are many structural advantages to use lightweight concrete (LWC) as a
building material. The reduction of dead weight due to a lower density of concrete
can improve the seismic resistance capacity of building structures (Bogas 2013);
(Gao 2015); and (Gesoğlu 2004). Furthermore, the smaller and lighter elements of
precast concrete are preferred because the handling and transporting system
becomes less expensive. Offshore structures which mostly used for oil production,
require LWC elements to provide easier towing and greater buoyancy (Kayali 2008).
As a result, there has been growing interest in the practical application of LWC for
structural members (Yang 2011), (Wu 2014), and (Wu 2018). In addition (Yang
2006), (Lu 2013), and (yang 2011) also proposed different shear models for deep
beams.

Hamed Shaker H. Askar/ Engineering Research Journal 166 (JUN 2020) CV19-CV38
CV20
Openings are frequently placed in the web region of reinforced concrete (RC)
deep beams to facilitate essential services such as access, conduits, AC lines, etc.
These openings may interrupt the load path and can cause a sharp decrease of
serviceability and strength of RC deep beams (Yang 2007).
Though the strength evaluation and reinforcement details around openings are
essential considerations, their design details have not been yet provided by most
codes of practice particularly for LWC; (ACI 318-14), (CSA 2014), (CEB-FIP
2010), and (CIRIA 1977).
Experimental tests showed that diagonal cracks can develop just above and
below openings. This is due to high stress concentration at opening corners. High
transverse tensile strain at diagonal crack zone, would accelerate the decreasing rate
of the effective strength of concrete (Tan 2004).
Based on the experimental results of tested specimens, an empirical equation
has been adopted and applied to the results of the tested specimens and the results
available in literatures. Comparison between the experimental results and the
calculated results showed an expected agreement. In addition, the conservatism of
strut-and-tie models (STMs) recommended by code provisions such as (ACI 318-
14), (CSA 2014), (ECP 2017), and (EC2 2004), and those proposed by (Tan and
Cheng 2006) is examined against the variation of openings size.
2. RESEARCH SIGNIFICANCE Obviously, openings are provided to deep beams to enable essential services and
accessibilities to pass. This paper helps to understand the effect of opening size on
the LWC beam's shear strength when openings interrupt the load path. A strut-and-
tie modeling approach was, also, used to recompute the shear strength of the tested
beams.
3. EXPERIMENTAL PROGRAM 3.1 Details of tested specimens
An experimental program was carried-out on specimens with details shown in Table
1. The main parameter of study in this investigation was the opening size. The
geometrical details of tested specimens are indicated in Fig. 1.
The beams have an overall depth, h, of 600mm, a span length, L, of 1000mm,
and a web thickness, b, of 160mm. Three specimens with web openings having the
same depth, m2h, of 180mm, while the other beams with web openings having the
same width, m1a, of 200mm.
3.2 Study parameter
The opening size was selected to be the parameter of study to evaluate its effect on
the shear strength of the considered deep beams. Table 1 shows the geometrical
properties and concrete compressive strength of the tested beams. The beams were
subdivided into two main groups according to the opening depth and width, 0.3h
and 0.66a, respectively.
Hamed Shaker H. Askar/ Engineering Research Journal 166 (JUN 2020) CV19-CV38
CV21
3.3 Details of reinforcement
The arrangement of steel reinforcement of the tested beams is as shown in Fig. 2.
The main bottom reinforcement was continuous over the beam length. It consists of
four bars of 16mm diameter and welded to 160×100×10mm two end plates to
provide anchorages. Top reinforcement, in contrast, was two bars of 6mm diameter.
Fig. 1 Typical specimen geometry and dimensions.
Table 1 Details of the tested specimens.
Horizontal and vertical web reinforcement are bars of 6mm diameter and
spaced at 120mm. Inclined reinforcing bars are laid in two rows above and below
openings, each having three bars of 10mm. The V- and diagonal-shaped inclined
reinforcing bars are arranged at an angle of 45 degrees to the horizontal axis of
beams and placed symmetrically just above and below openings.
4. PROPERTIES OF USED MATERIAL
For quality control purposes, all specimens were tested after 28-days and a cylinder
compressive strength of 32MPa for lightweight concrete was obtained. The
concrete mix proportions are shown in Table 2. The structural lightweight concrete
having an oven-dry density of 1980kg/m3.
Specimen
designation
,
MPa
Dimensions, mm
a/h
Opening size, mm
Opening
position,
mm
L a h m1 m2 m1a m2h k1a k2h
B0
32 1000
300
600
0.50
---- ---- ---- ---- ---- ----
B1 0.33 0.30 100 180 100 210
B2 0.50 0.30 150 180 75 210
B3 0.66 0.30 200 180 50 210
B4 0.66 0.35 200 210 50 195
B5 0.66 0.40 200 240 50 180
Hamed Shaker H. Askar/ Engineering Research Journal 166 (JUN 2020) CV19-CV38
CV22
The mechanical properties of the used reinforcing steel are shown in Table 3,
where NMS, HGS, , , and are normal mild steal, high grade steal, yield
strength, ultimate tensile strength, and elastic modulus of reinforcing steel,
respectively.
Fig. 2 Typical steel reinforcements arrangement and details.
Table 2 Concrete mix design (cylinder compressive strength = 32MPa).
Mixture
proportion
Dry
weight,
kN/m3
Standard type-10 portland cement 1.00 4.9
Silica fume 0.18 0.9
Water 0.33 1.62
Sand 1.048 5.14
Coarse aggregate 0.59 2.9
Light coarse aggregate (lika) 0.918 4.5
Super plasticizer (sikament165) 0.046 0.23
Glass fiber 0.018 0.09
Traseal DM 0.01 0.05
Table 3 Mechanical properties of Reinforcing steel.
Steel
type ,
MPa
,
MPa
,
MPa
NMS 240 350 200000
HGS 400 600 200000

Hamed Shaker H. Askar/ Engineering Research Journal 166 (JUN 2020) CV19-CV38
CV23
5. TEST SET-UP AND INSTRUMENTATION The specimens were tested using a large closed steel frame. All were connected
together by two large channels. A hydraulic jack having a 2000kN capacity was
used in applying load to tested specimens. Four strain gauges having 10mm length
were used for each specimen to measure the strain at critical sections of
reinforcing steel bars, as shown in Fig . 2.
6. TESTING PRODUCER The All beams were tested to failure under a two-point top loading system with a
loading intervals of 20kN/minute. Each tested beam was supported on a hinged
support at the left and a roller support at the right. At the load and support points of
application, a steel plate with 20mm thickness was provided to prevent bearing
failure of the loaded beam.
The description of both the test set-up and the considered loading system are
shown in Fig. 3. Vertical deflections (at specimen mid-span) were measured using
linear variable differential transducers (LVDT) mounted at the bottom face of the
tested beams.
Fig. 3 Test set up and loading system.
7. EXPERIMENTAL RESULTS AND DISCUSSIONS 7.1 Crack propagation
Figs. 4 , and 5 showed the idealized crack pattern in the tested beams. In which, 1
refers to flexural cracks, 2 to corner cracks, 3 to an arch-rib cracks, and 4 to
diagonal cracks, respectively.
Fig. 4 Idealized cracks in deep beams Fig. 5 Idealized crack pattern
with web openings. in solid reference beam.

Hamed Shaker H. Askar/ Engineering Research Journal 166 (JUN 2020) CV19-CV38
CV24
Fig . 6 Crack patterns and failure modes of tested beams.
The first crack appears in all tested beams at opening corners, propagated
towards the applied points of load with increasing in load. Flexural cracks started to
appear at the beam mid-span just after initiation of the first crack. After words, the
diagonal cracks originated at opposite corners of openings. The arch-rib cracks
appeared on all tested beams just before approaching the ultimate load capacity
The diagonal cracks, especially those formed below openings led directly to
beams failure, as shown in Fig. 6. The crack patterns which observed above and
below the openings were almost identical and illustrate the concrete struts
connecting loading points, web openings and support points. This observation is
Hamed Shaker H. Askar/ Engineering Research Journal 166 (JUN 2020) CV19-CV38
CV25
used to validate the geometry of concrete struts in the proposed strut-and-tie model
for the tested beams.
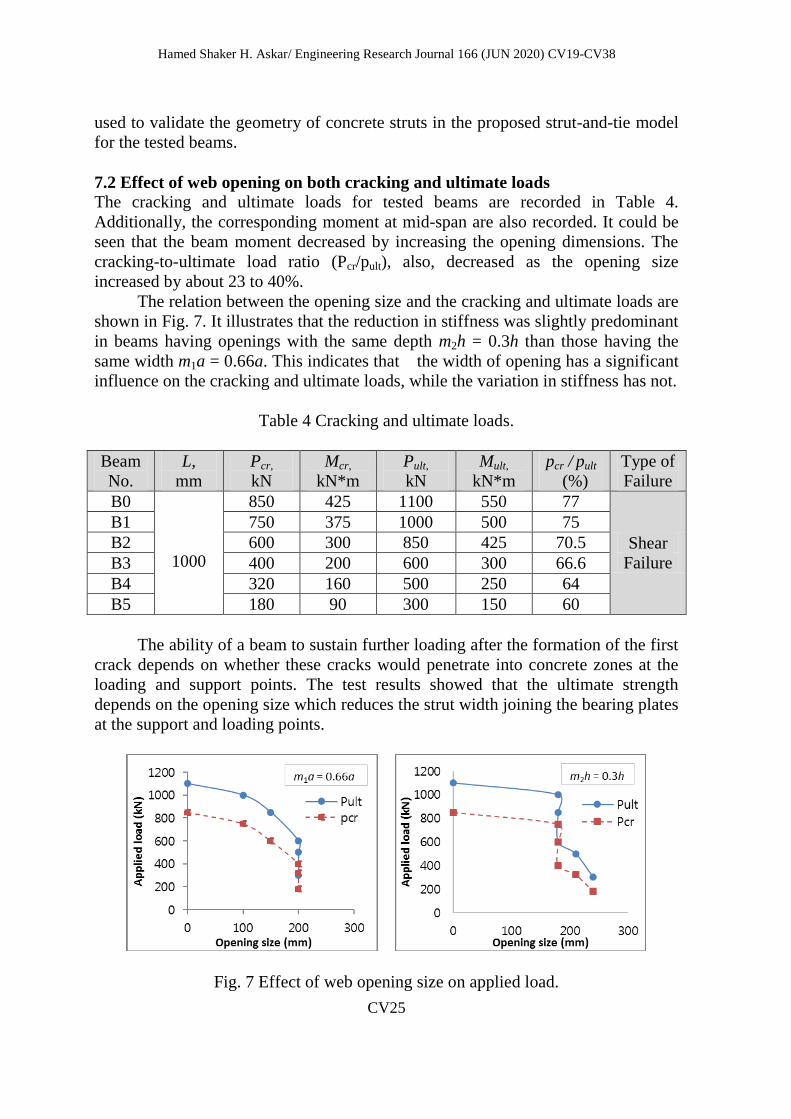
7.2 Effect of web opening on both cracking and ultimate loads
The cracking and ultimate loads for tested beams are recorded in Table 4.
Additionally, the corresponding moment at mid-span are also recorded. It could be
seen that the beam moment decreased by increasing the opening dimensions. The
cracking-to-ultimate load ratio (Pcr/pult), also, decreased as the opening size
increased by about 23 to 40%.
The relation between the opening size and the cracking and ultimate loads are
shown in Fig. 7. It illustrates that the reduction in stiffness was slightly predominant
in beams having openings with the same depth m2h = 0.3h than those having the
same width m1a = 0.66a. This indicates that the width of opening has a significant
influence on the cracking and ultimate loads, while the variation in stiffness has not.
Table 4 Cracking and ultimate loads.
Beam
No.
L,
mm
Pcr,
kN
Mcr,
kN*m
Pult,
kN
Mult,
kN*m
pcr / pult
(%)
Type of
Failure
B0
1000
850 425 1100 550 77
Shear
Failure
B1 750 375 1000 500 75
B2 600 300 850 425 70.5
B3 400 200 600 300 66.6
B4 320 160 500 250 64
B5 180 90 300 150 60
The ability of a beam to sustain further loading after the formation of the first
crack depends on whether these cracks would penetrate into concrete zones at the
loading and support points. The test results showed that the ultimate strength
depends on the opening size which reduces the strut width joining the bearing plates
at the support and loading points.
Fig. 7 Effect of web opening size on applied load.

Hamed Shaker H. Askar/ Engineering Research Journal 166 (JUN 2020) CV19-CV38
CV26
The ultimate strength of deep beams is affected only when the direct force
path from the loading to the support points is interrupted with opening. In such a
case, two alternative force paths can be identified to carry the applied force to the
support, led to shear failure. This means that the ultimate shear strength of the
beams with small openings as those of B1, has a light effect compared with the
ultimate shear strength of solid beam.
7.3 Deflection and strain observations
7.3.1 Mid-span Deflection
Mid-span deflections of tested beams versus the applied load are shown in Fig. 8.
The development of flexural cracks in the region of maximum moment had a
minimal influence on the stiffness of the tested beams. The development of diagonal
cracks caused an decrease in deflections for beams with openings than that of the
reference beam by about 18 to 54%.
The reduction in stiffness after the formation of diagonal cracks was more
predominant in beams having opening with the same depth m2h = 0.3h than those
having the same width m1a = 0.66a by about 38% and 8%, respectively. This
indicates that the width of opening size influence significantly in both the beam
behavior and stiffness, Figs. 8 and 9.
Fig. 8 Load deflection relationship at beam mid-span.
Fig. 9 Web opening size versus mid-span deflection.
Hamed Shaker H. Askar/ Engineering Research Journal 166 (JUN 2020) CV19-CV38
CV27
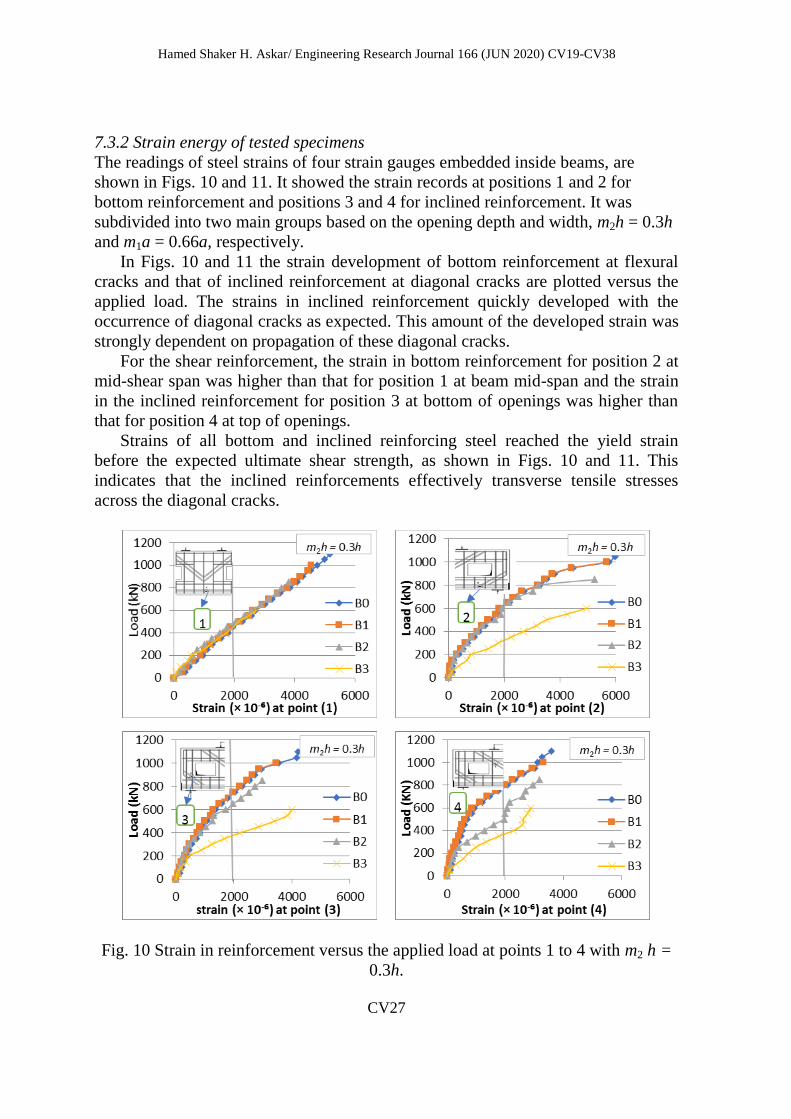
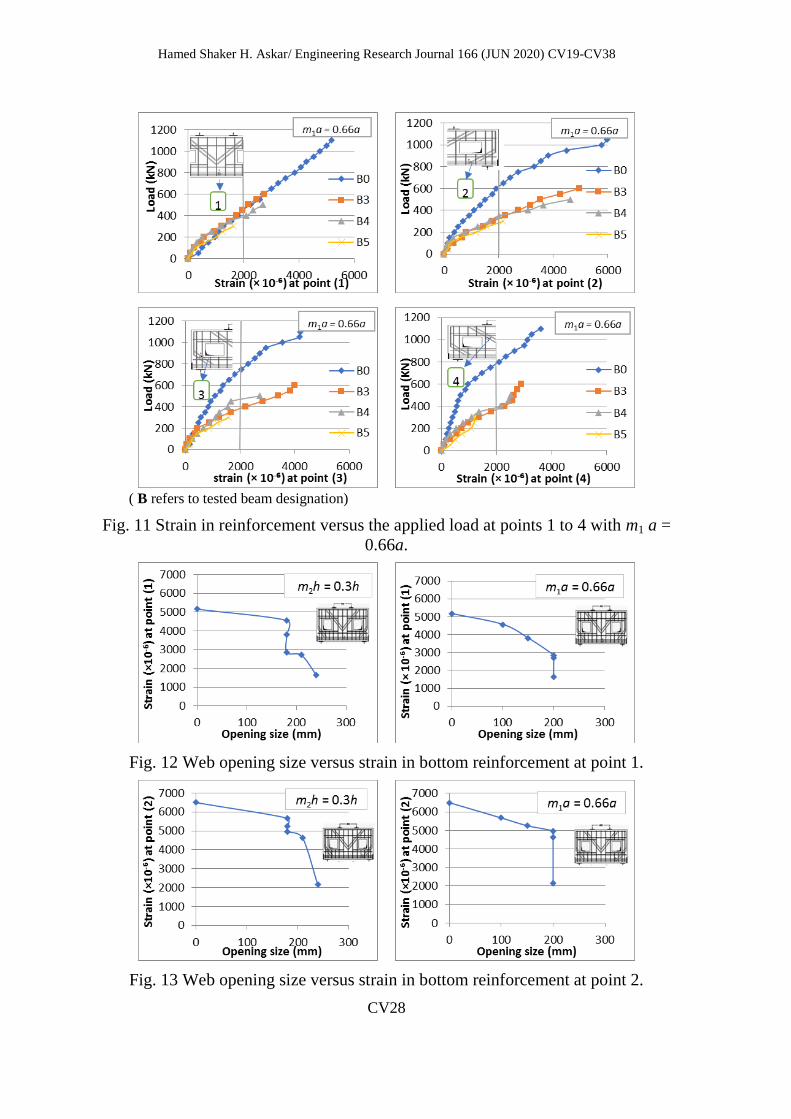
7.3.2 Strain energy of tested specimens
The readings of steel strains of four strain gauges embedded inside beams, are
shown in Figs. 10 and 11. It showed the strain records at positions 1 and 2 for
bottom reinforcement and positions 3 and 4 for inclined reinforcement. It was
subdivided into two main groups based on the opening depth and width, m2h = 0.3h
and m1a = 0.66a, respectively.
In Figs. 10 and 11 the strain development of bottom reinforcement at flexural
cracks and that of inclined reinforcement at diagonal cracks are plotted versus the
applied load. The strains in inclined reinforcement quickly developed with the
occurrence of diagonal cracks as expected. This amount of the developed strain was
strongly dependent on propagation of these diagonal cracks.
For the shear reinforcement, the strain in bottom reinforcement for position 2 at
mid-shear span was higher than that for position 1 at beam mid-span and the strain
in the inclined reinforcement for position 3 at bottom of openings was higher than
that for position 4 at top of openings.
Strains of all bottom and inclined reinforcing steel reached the yield strain
before the expected ultimate shear strength, as shown in Figs. 10 and 11. This
indicates that the inclined reinforcements effectively transverse tensile stresses
across the diagonal cracks.
Fig. 10 Strain in reinforcement versus the applied load at points 1 to 4 with m2 h =
0.3h.
Hamed Shaker H. Askar/ Engineering Research Journal 166 (JUN 2020) CV19-CV38
CV28
( B refers to tested beam designation)
Fig. 11 Strain in reinforcement versus the applied load at points 1 to 4 with m1 a =
0.66a.
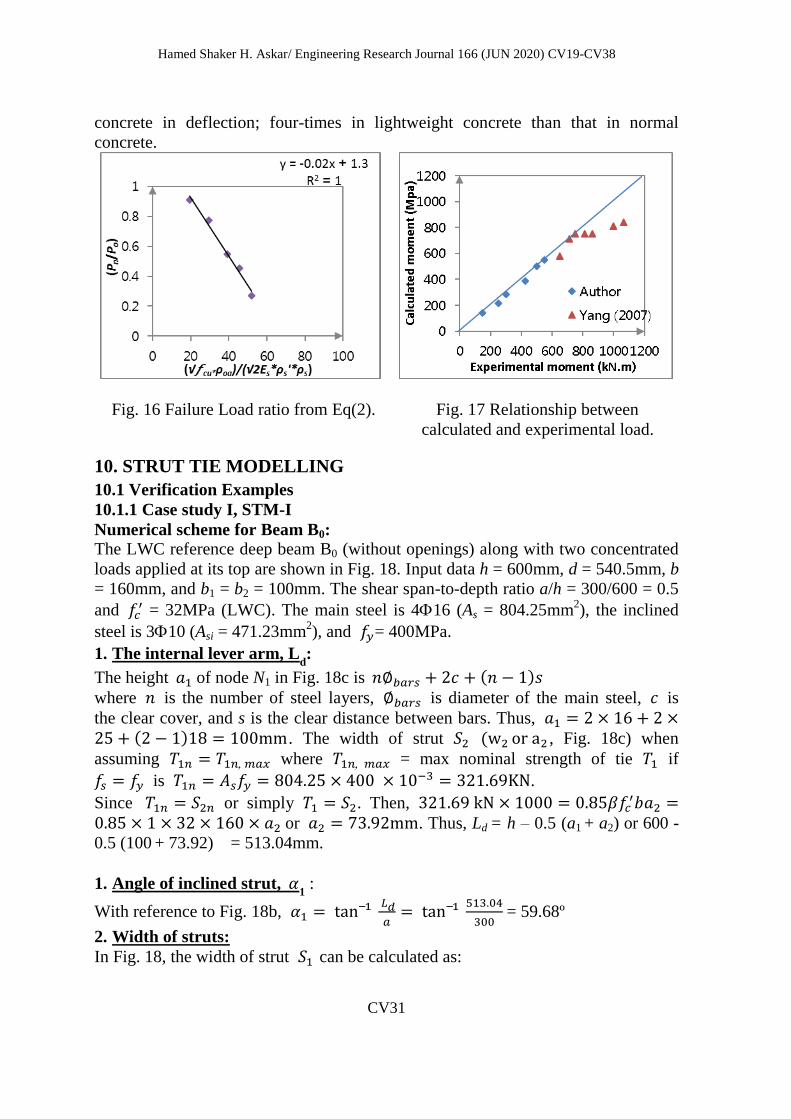
Fig. 12 Web opening size versus strain in bottom reinforcement at point 1.
Fig. 13 Web opening size versus strain in bottom reinforcement at point 2.

Hamed Shaker H. Askar/ Engineering Research Journal 166 (JUN 2020) CV19-CV38
CV29
Fig. 14 Web opening size versus strain in inclined reinforcement at point 3.
Fig. 15 Web opening size versus strain in inclined reinforcement at point 4.
Figs. 12 to 15 presenting the strain measurements against the opening size. The
figures illustrate that the strain in bottom reinforcement decreased by increasing the
opening size at points 1 and 2 by about 68.4% and 66.8%, respectively. The strain
in the inclined reinforcement decreased by increasing the opening size at points 3
and 4 by about 62.7% and 66.2%, respectively. This indicates that the width of
opening size has a significant influence on the strain behavior at different places in
bottom and inclined reinforcement.
8. EXPERIMENTAL EQUATION FOR ESTIMATION BEAMS
FAILURE LOAD Based on the experimental results of tested beams and using the regression analysis
the relationship between a failure load ratio and beams specification, the
concrete cube compressive strength , opening area, and reinforcement ratios was
proposed and illustrated in Fig 16. The ultimate load can be obtained using
Eq(2) as follows:
(
) (1)
(
) (2)

Hamed Shaker H. Askar/ Engineering Research Journal 166 (JUN 2020) CV19-CV38
CV30
where is the elastic modulus of reinforcement,
is the
opening area to shear span area ratio,
are the flexural
ratio of the main and inclined reinforcements, respectively.
9. COMPARISON OF PROPOSED EQUATION AND EXPERMINTAL
FAILURE LOAD
To investigate the applicability of the proposed equation, the predicted and
experimental values of the failure load for the tested specimens were compared
with the results available in literature (Yang2007). The comparison is shown in
Table 5 and Fig. 17. The mean and standard deviation of the predicted-to-
experimental failure load (( )Eq/ ( )Exp) obtained. The predictions obtained from
the proposed equation shows a good agreement.
Table 5 Details of test results and predictions.
Based on the above, it could be observed that the concrete strength, cu, was
the predominant parameter and not the type of concrete. Furthermore, based on the
results of tested specimen B2 and reference specimen F3-3 (Yang 2007), it was
observed that there is a difference in the behavior of lightweight and normal
Researches Spec. Details of
openings cu,
Mpa
Reinforcement Moment Mn,
kN.m
( )
( )
m1 m2 ρoa Inclined Main ρs' ρs Exp. Eq.
Author
specimens
Bo --- --- ---
41
6𝜙10 4𝜙16 0.0055 0.0093 1100 1100 1
B1 0.33 0.3 0.099 6𝜙10 4𝜙16 0.0055 0.0093 1000 1000.2 1
B2 0.5 0.3 0.15 6𝜙10 4𝜙16 0.0055 0.0093 850 778.7 0.92
B3 0.66 0.3 0.198 6𝜙10 4𝜙16 0.0055 0.0093 600 570.3 0.95
B4 0.66 0.35 0.231 6𝜙10 4𝜙16 0.0055 0.0093 500 427.04 0.85
B5 0.66 0.4 0.264 6𝜙10 4𝜙16 0.0055 0.0093 300 283.7 0.95
yang and
Ashour
specimens
(2007)
No --- --- ---
68
--- 3𝜙19 --- 0.0098 1583.3 1583.3 1
T1-1 0.25 0.1 0.025 3𝜙10 3𝜙19 0.0027 0.0098 1666.7 1673.6 1.004
T1-2 0.25 0.1 0.025 6𝜙10 3𝜙19 0.0055 0.0098 2361.1 1866.3 0.79
T3-3 0.25 0.3 0.075 9𝜙10 3𝜙19 0.0082 0.0098 1916.6 1674.1 0.87
F1-2 0.5 0.1 0.05 6𝜙10 3𝜙19 0.0055 0.0098 1805.5 1674.3 0.93
F1-3 0.5 0.1 0.05 9𝜙10 3𝜙19 0.0082 0.0098 2222.2 1802.1 0.8
F3-3 0.5 0.3 0.15 9𝜙10 3𝜙19 0.0082 0.0098 1444.4 1289.8 0.89
Mean 0.92
Standard deviation 0.07
Hamed Shaker H. Askar/ Engineering Research Journal 166 (JUN 2020) CV19-CV38
CV31
concrete in deflection; four-times in lightweight concrete than that in normal
concrete.
Fig. 16 Failure Load ratio from Eq(2). Fig. 17 Relationship between
calculated and experimental load.
10. STRUT TIE MODELLING
10.1 Verification Examples
10.1.1 Case study I, STM-I
Numerical scheme for Beam B0:
The LWC reference deep beam B0 (without openings) along with two concentrated
loads applied at its top are shown in Fig. 18. Input data h = 600mm, d = 540.5mm, b
= 160mm, and b1 = b2 = 100mm. The shear span-to-depth ratio a/h = 300/600 = 0.5
and = 32MPa (LWC). The main steel is 416 (As = 804.25mm
2), the inclined
steel is 310 (Asi = 471.23mm2), and = 400MPa.
1. The internal lever arm, Ld:
The height 𝑎 of node N1 in Fig. 18c is 𝑛∅ 𝑎𝑟 + 𝑐 + (𝑛 )𝑠
where 𝑛 is the number of steel layers, ∅ 𝑎𝑟 is diameter of the main steel, 𝑐 is
the clear cover, and s is the clear distance between bars. Thus, 𝑎 + + ( ) . The width of strut (w , Fig. 18c) when
assuming 𝑎 where 𝑎 = max nominal strength of tie if
is .
Since or simply . Then, 𝑎
𝑎 or 𝑎 . Thus, Ld = h – 0.5 (a1 + a2) or 600 -
0.5 (100 + 73.92) = 513.04mm.
1. Angle of inclined strut, 1 :
With reference to Fig. 18b,
𝑎
= 59.68º
2. Width of struts:
In Fig. 18, the width of strut can be calculated as:
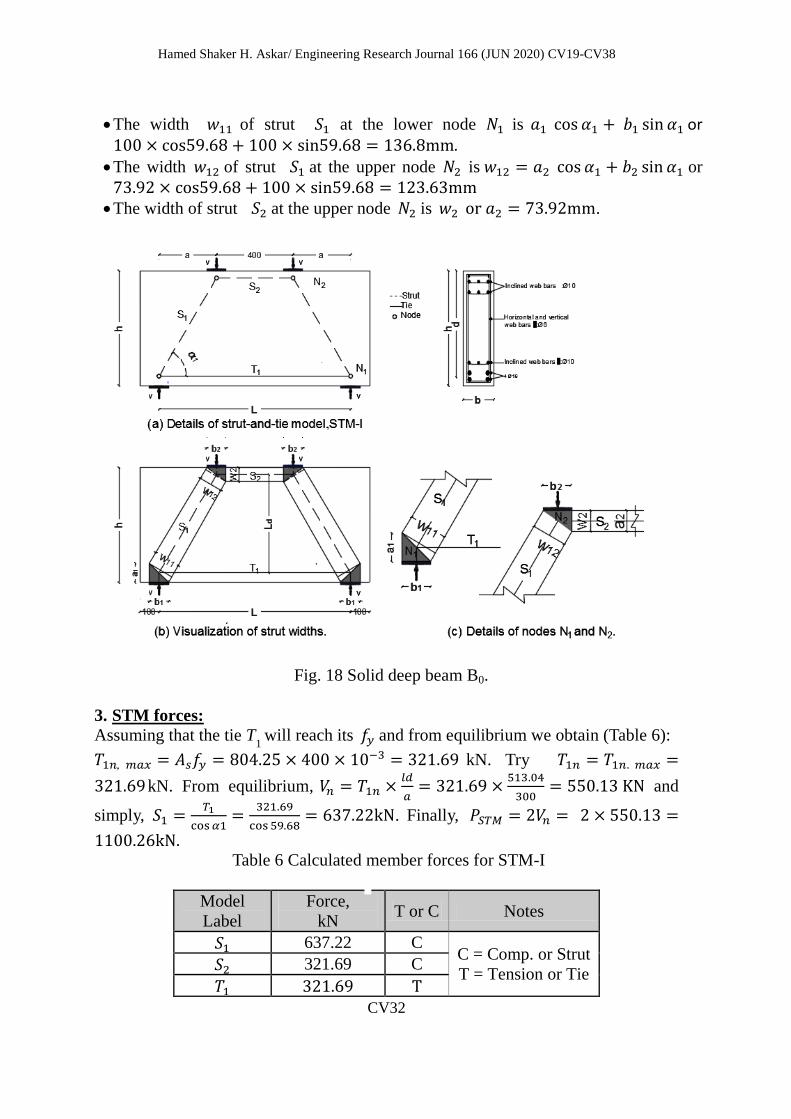
Hamed Shaker H. Askar/ Engineering Research Journal 166 (JUN 2020) CV19-CV38
CV32
The width of strut at the lower node is 𝑎 + or + .
The width of strut at the upper node is 𝑎 + or
+
The width of strut at the upper node is 𝑎 .
Fig. 18 Solid deep beam B0.
3. STM forces:
Assuming that the tie T1 will reach its and from equilibrium we obtain (Table 6):
𝑎 kN. Try 𝑎
kN. From equilibrium, 𝑉 𝑙
𝑎
and
simply, 𝑇1
cos𝛼
69
cos 9 68 . Finally, 𝑆𝑇𝑀 𝑉
Table 6 Calculated member forces for STM-I
Model
Label
Force,
kN T or C Notes
637.22 C C = Comp. or Strut
T = Tension or Tie 321.69 C
321.69 T
Hamed Shaker H. Askar/ Engineering Research Journal 166 (JUN 2020) CV19-CV38
CV33
Checking of stress limits:
a. Concrete struts:
Knowing that = 32MPa, the effective strength of a strut,
is:
MPa, for Strut S1
MPa, for Strut S2
The max nominal strength of the struts is given by, 𝑎 , i = 1, 2.
Horizontal strut S2:
No need to check S2 as its width ( or 𝑎 ) was found based on 𝑎 .
Inclined strut S1:
The maximum nominal strength of strut S1
or 𝑎 at the lower node is:
( ) .
The maximum nominal strength of strut S1
or 𝑎 at the upper node is:
( ) .
1𝑛 𝑎𝑥 = he lle v lue f n 𝑎 n 𝑎 . Since
> 𝑎 (unsafe), assume a new adjusted value of and
repeat from Step 1. Try 𝑎 . Thus,
which will be less than n 𝑎 or
321.69kN which is okay.
1. The internal lever arm, Ld :
Using a trial-and-error, try 𝑎 or
𝑎 . Ld = h – 0.5 (a
1 + a2) or 600 – 0.5 (100 + 45.5) = 527.25mm.
2. Angle of inclined strut, 1 :
𝑎𝑛
𝑎𝑛
.
3. Width of struts:
+ .
+ .
4. STM forces:
Try . 𝑇1
cos𝛼
98
cos6 6 which is slightly
less than n 𝑎 or 403.52kN, which is okay. Also, n 𝑙
𝑎
which is slightly less than 𝑉n 𝑎 or 348.16kN, which is okay.
b. Nodes:
The maximum node capacity is where
Table 7
summarizes the calculations performed for the effective concrete nodes. Finally,
PSTM = 2 Vn = 2 347.98 = 695.96kN. Since the measured collapse load was
; then,
is about 65%.

Hamed Shaker H. Askar/ Engineering Research Journal 166 (JUN 2020) CV19-CV38
CV34
Table 7 Summary of effective concrete node calculations.
Case study II, STM-II
Numerical scheme for Beam B1:
The LWC deep beam with openings along with two concentrated loads applied at its
top are shown in Fig. 19. Input data h = 600mm, d = 540.5mm, b = 160mm, and b1
= b2 = 100mm. The ratio a/h = 300/600 = 0.5, the opening width m1a = 100mm,
opening depth m2h =180mm, and = 32MPa. The main steel is 416 (As =
804.25mm2), the inclined steel is 310 (Asi = 471.23mm
2), and = 400MPa.
Fig. 19 Proposed STM-II.
1. Geometrical parameters:
The previously showed crack patterns in Fig. 6 can be used when setting-up the
strut-and-tie model for the tested beams. In Fig. 19, the width of the tie T1 (height of
node N1) is:
𝑇 𝑎 𝑛∅ 𝑎𝑟 + 𝑐 + (𝑛 )𝑠 + + ( ) .
The nominal max strength of the tie T1 𝑎 is
kN. The widths of the ties T2 and T3 (each is 2 310) can be computed from
+ + ( ) . The nominal strength of T2 is
kN. The width of strut ( or 𝑎 ) can be computed
from 𝑎 Then, 𝑎
𝑎 or 𝑎 , Ld = 600 – 0.5 (100 + 73.92) = 513.04mm.
Node
Label Type
Surrounding
forces,
kN
Available
width,
mm
,
MPa
Max.
nominal
strength,
kN
Satisfaction
N1 CCT 0.8
400.36 C 136.36
21.76
474.75 yes
𝑉 347.98 C 100 348.16 yes
198 T 100 348.16 yes
N2 CCC 1.00
347.98 C 100
27.2
435.2 yes
400.36 C 109.42 476.19 yes
198 C 45.5 198 yes

Hamed Shaker H. Askar/ Engineering Research Journal 166 (JUN 2020) CV19-CV38
CV35
2. Reactions:
From equilibrium: 𝑉 𝑙
𝑎
.
3. Model Geometry and Forces
Trying 𝑎 kN and from equilibrium,
the forces in all members can then be obtained, Fig. 20.
4. Effective concrete strength of the struts
Knowing = 32MPa, the effective strength of a strut,
is
MPa for prismatic struts and MPa for bottle-shaped
struts.
Fig. 20 Computed model forces for Fig. 21 Computed model forces due to
STM-II (kN) assuming yielding of T1. reducing P to 348.2kN for STM-II.
5. Effective concrete strength of the nodes
Knowing = 32MPa, the effective strength of a node,
is
MPa for C-C-C nodes and MPa for C-C-T nodes.
6. Checking the bearing of the nodes
For node 1, the nominal value of the reaction 𝑉n kN,
which is less than 550.13kN, Fig. 20. For node 4, the nominal value of the load
n kN, which is less than the force P = 550.13kN.
Therefore, the load and reaction should be reduced to the smaller value of
𝑉n n and the force in the tie is subsequently reduced to 203.6KN
and the forces all members are, then, recomputed, Fig. 21.
7. Checking of stresses
Node 1: The bearing stresses has been checked before and, therefore, no need to re-
check it again. For struts and , Fig. 19, the resultant force RA is 403.31kN and
its angle ° . Thus, its width 𝑎 + 𝑠𝑖𝑛 + . Then the nominal strength of the strut is
> 𝑅A kN (*the smaller of the node- and strut-
strength), which is RA or 403.31kN which is okay.
Nodes 2 and 5: Because they are very wide and the reinforcement bars have
sufficient anchorage lengths, nodes 2 and 5 need not to be checked.
Nodes 3 and 6: These two nodes (as they are smeared and the reinforcement bars
have sufficient anchorage lengths) need not, also, to be checked.

Hamed Shaker H. Askar/ Engineering Research Journal 166 (JUN 2020) CV19-CV38
CV36
Node 4: The bearing stresses has been checked before and, therefore, no need to re-
check it again. For struts S5 and S6, the resultant force RB = 403.31kN and its
angle 𝐵 °. Thus 𝐵 𝑎 + 𝑠𝑖𝑛 +
or . Then, the max nominal strength of the struts is > 𝑅 kN, which is RB or 403.31kN. Finally, PSTM = 2 Vn
= 2 348.2 = 696.4kN. Since the measured collapse load was
; then,
is about 70%. Additionally, the equation load
; then ,
𝑞 is about 77%, this indicates that the experimental and the
proposed equation results were higher than those with STM .
9. CONCLUSIONS In the present experimental investigation, six lightweight RC deep beams with web
openings (including a reference solid beam) were tested to failure. All tested beams
have two web openings located at the center of the shear span which interrupt the
concrete strut connecting load and support points. Whereas, when the same opening
is located far from the compressive force path, it would have little influence on the
beam shear behavior. A strut-tie modeling approach was, also, presented to re-
compute the shear strength of the tested beams. The following conclusions may be
drawn:
For all tested beams, the observed crack patterns just above and below the
openings were almost identical.
The variation of opening size affects significantly the propagation of cracks with
increasing the applied load.
The width of opening has a significant influence on the cracking and ultimate
loads, and the beam behavior and stiffness.
The cracking-to-ultimate load ratio decreased with the increase of the opening
size by about 23 to 40%.
The diagonal cracks were decreased in solid deep beams than that having
openings. Those formed below the openings can directly leads to beams failure
The mid-span deflection of LWC deep beams decreased in those with web
openings than that of the reference solid beam by about 18 to 54%.
Strain in steel reinforcement quickly developed with the occurrence of diagonal
cracks and decreased by increasing the opening size.
For the shear reinforcement, the strain in the bottom reinforcement at mid-shear
span was higher than that at beam mid-span. The strain in the inclined
reinforcement at the bottom of openings was higher than that at the top of
openings.
Based on the obtained experimental results, an experimental equation, to
calculate the ultimate shear capacity of tested beams with opening has been
proposed.
The comparison between the experimental results and those obtained from the
proposed equation showed an acceptable agreement.

Hamed Shaker H. Askar/ Engineering Research Journal 166 (JUN 2020) CV19-CV38
CV37
The behavior of the lightweight concrete in deflection differs from that for
normal concrete.
The strut-and-tie method was used to model the tested deep beams. The shear
strengths of the tested beams were higher than those calculated using the strut-
tie modeling approach.
REFERENCES
ACI Committee 318, "Building Code Requirements for Structural Concrete
(ACI318-14) and Commentary (318R-14)," American Concrete Institute,
Farmington Hills, MI, USA.
Bogas J. A. and Gomes A. (2013), “Compressive behavior and failure modes of
structural lightweight aggregate concrete characterization and strength prediction,”
Mater. Des., Vol. 46, 832–841.
CEB-FIP, (2010), "Design of Concrete Structures," CEB-FIP Model Code 2010,
Thomas Telford, London, UK.
CSA Building Code (2014), “Design of Concrete Structures,” Structures
(Design)- A National Standard Association, Toronto, Ontario, Canada.
CIRIA, (1977), "The Design of Deep Beams in Reinforced Concrete Structures
(CIRIA 2),” Ove Arup and Partners and CIRIA, London, UK.
Egyptian Code(2017), "The Design and Construction of Concrete Structure,
(ECP 203-2017), Ministry of Housing, Utilities and Urban Communities, National
Housing and Building Research Center, Cairo.
Eurocode 2, (2004), "Design of Concrete Structures," EN 1992-1-1:2004, British
Standards Institution, London, UK.
Gao Y and Zou C (2015), “Experimental study on segregation resistance of
nanoSiO2 fly ash lightweight aggregate concrete,” Constr. Build. Mater., Vol. 93,
64–69.
Gesoglu M., Ozturan T. and Guneyisi E. (2004), “Shrinkage cracking of
lightweight concrete made with cold-bonded fly ash aggregates,” Cem. Conc. Res.,
Vol. 34(7), 1121–1130.
Kayali, O. (2008), “Fly Ash Lightweight Aggregates in High Performance
Concrete,” Constr. Build. Mater. Vol. 22(12), 2393-2399.
Lu, WY, Lin, J. and Yu, HW. (2013), “Shear strength of reinforced concrete
deep beams,” ACI Str. J., Vol. 110(4), 671–680.
Tan, K. H., Tang, C. Y., and Tong, K. (2004), “Shear Strength Predication of
Pierced Deep Beams with Inclined Web Reinforcement,” Mag. Conc. Res., V. 56,
No. 8, 443-452.
Tan, K. H., and Cheng, G. H., (2006) “Size Effect on Shear Strength of Deep
Beams: Investigating with Strut-and-Tie Models,” Journal of Structural
Engineering, ASCE, V. 132(5), 673-685.
Wu, T., Lv, BB. and Liu, X. (2014), “Test On High-Strength Lightweight
Aggregates Concrete Deep Beams With Shear Span-To-Depth Ration Variations,”
13th Inter. Symposium on Str. Eng., Vol1 and II, 12-19.
Hamed Shaker H. Askar/ Engineering Research Journal 166 (JUN 2020) CV19-CV38
CV38
Wu, T., Wei, H. and Liu, X. (2018), “Experimental Investigation Of Shear
Models For Lightweight Aggregate Concrete Deep Beams,” Str. Eng., Vol. 21(1),
109-124.
Yang, K. H., Chung, H. S., Eun, H. C., and Ashour, A. F., (2006) “Influence of
Web Openings on the Structural Behavior of Reinforced High-Strength Concrete
Deep Beams,” Str. Eng., Vol. 28, 1825-1834.
Yang, K. H., Heon-Soo Chung, H. S., and Ashour, A.F (2007), “Influence of
Inclined Web Reinforcement on Reinforced Concrete Deep Beams with Openings,”
ACI Str. J., Vol. 104(5)580-589.
NOTATION L
d
b
Length of deep beam
Depth of deep beam
Width of deep beam
a Shear span
h Overall depth of deep beam
m1, m2 Coefficients of opening size
K1, K2
m1a
m2h
Coefficients of opening position
Width of opening
Depth of opening
Lp
B
Width of loading plate
Number of tested beam designation
Cylinder compressive strength of concrete
cube compressive strength of concrete
Yield strength of reinforcing steel
ultimate strength of steel bar
NMS
HGS
Elastic modulus of reinforcing steel
Normal mild steel
High Grade steel
δ Displacement at beams mid-span
pcr Critical load
pult Ultimate load
Mcr Moment at critical load
Mult Moment at ultimate load
𝑎 Area ratio of the opening to shear span
Flexural ratio of the main reinforcement
Flexural ratio of the inclined reinforcement
Area of the main reinforcement
Area of the inclined reinforcement
Vn Shear strength

Hamed Shaker H. Askar/ Engineering Research Journal 166 (JUN 2020) CV19-CV38
CV39