Embed Size (px)
Citation preview
ORIGINAL
Strength grading on the basis of high resolution laser scanningand dynamic excitation: a full scale investigation of performance
Anders Olsson1 • Jan Oscarsson1
Received: 27 August 2015 / Published online: 31 October 2016
� The Author(s) 2016. This article is published with open access at Springerlink.com
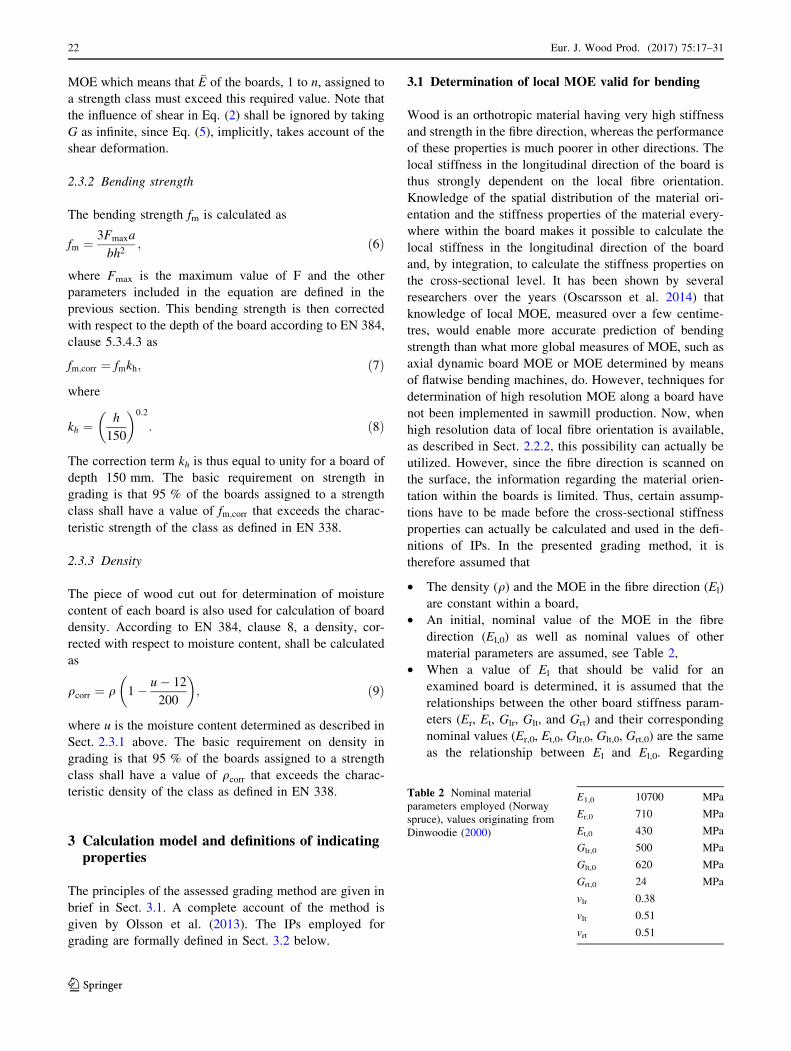
Abstract Effective utilization of structural timber requires
grading and indicating properties (IPs) that are able to
predict strength with high accuracy and machines that are
able to measure the underlying board properties at a speed
that corresponds to the production speed of sawmills. The
aim of this research is to assess the performance of a new
machine strength grading method/procedure which was
recently approved for the European market and to compare
the performance of it with the performance of other
available techniques. The novel method is based on laser
scanning utilizing the tracheid effect, in combination with
data from dynamic excitation and weighing. Applied
indicating properties are defined in detail and results pre-
sented include assessment of the repeatability, coefficients
of determination between IPs and grade determining
properties, and examples of the yield achieved in different
strength classes and combinations of strength classes. The
investigated sample comprised more than 900 pieces of
timber of Norway spruce (Picea abies) from Sweden,
Norway and Finland. For this sample the coefficient of
determination between the IP to bending strength and the
measured bending strength was as high as R2 = 0.69, while
the coefficient of determination between dynamic modulus
of elasticity (MOE) and measured bending strength was
R2 = 0.53. The yield in high strength classes, C35 and
above, becomes about twice as high using the new method/
procedure compared to machines using dynamic MOE as
IP. A comparison of the performance with what has been
presented for machines that are based on X-ray in
combination with dynamic excitation indicates that the new
method/procedure will surpass such machines as well.
1 Introduction
Effective utilization of structural timber requires grading
using indicating properties (IPs) that are able to predict
strength with high accuracy, and machines that are able to
measure the underlying board properties at a speed that
corresponds to the production speed of sawmills. Many of
the methods and machines used on the market today utilize
longitudinal dynamic modulus of elasticity (MOE) for
prediction of edgewise bending strength. The vibration
signal from dynamic excitation, the weight and the
dimensions of the board can be measured fast and accu-
rately with machines that are comparatively inexpensive,
and the dynamic MOE representing an averaged value of
the entire board is calculated using a simple equation.
However, the relationship between longitudinal dynamic
MOE and bending strength is rather weak. For Norway
spruce the coefficient of determination, R2, between lon-
gitudinal dynamic MOE and edgewise bending strength is
about 0.5 which results in poor yield in high strength
classes. Flatwise bending machines have been used since
the 1960’s and are still available on the market. Over a
span of about 1 m, and moving along the board, the
bending stiffness is determined using for example three
point bending and on the basis of this an MOE, valid for
flatwise bending and representing a certain part of the
board, is calculated. Thus, such machines give some
information regarding the stiffness variation along the
board, and the grading is based on the relationship between
the lowest flatwise MOE found along the board and the
edgewise bending strength. The speed with which the board
& Anders Olsson
1 Department of Building Technology, Linnaeus University,
351 95 Vaxjo, Sweden
123
Eur. J. Wood Prod. (2017) 75:17–31
DOI 10.1007/s00107-016-1102-6

passes through the machine may induce vibrations which
can disturb the measurement results, and the application of
three-point bending implies that the determined bending
stiffness is affected by the board’s shear properties. Thus,
when grading Norway spruce at production speed the
grading principle of such machines results in a grading
accuracy that is comparable with the one achieved using
grading machines based on dynamic MOE, see Johansson
(2003) and Oscarsson (2014).
There are grading machines on the market that combine
X-ray techniques with dynamic MOE and these represent
the most accurate strength grading that has been utilized on
the market in recent years. The information added by the
X-ray technique is high resolution information of the
variation of density within a board which means that knot
measures can be derived and used in definitions of IPs. In
an extensive study performed by Hanhijarvi and Ranta-
Maunus (2008), comprising more than 1000 pieces of
Norway spruce (Picea abies) and 1000 pieces of Scots pine
(Pinus sylvestris), mostly from Finland but also from
North-Western Russia, assessments of various strength
grading machines and IPs to tension and bending strength
were performed. The machine/IP that showed the best
performance was ‘‘GoldenEye ? Viscan’’ of the company
Microtec (Microtec 2015). On the basis of dynamic exci-
tation, X-ray and knowledge of dimensions, it gives
information on longitudinal resonance frequency, board
density, board dimensions and knot parameters that are
used in combination for the establishment of an IP to
bending strength. For the spruce timber loaded to failure in
bending the machine/IP gave an R2 to bending strength of
0.64. When dynamic MOE (also assessed by equipment
from the same company) was calculated on the basis of
resonance frequency and board density, and on resonance
frequency alone, R2 of 0.57 and 0.48, respectively, were
achieved for the same timber. For the sample of Scots pine
the improvement in grading accuracy using ‘‘Gold-
enEye ? Viscan’’, rather than dynamic MOE alone, was
larger than what it was for the sample of Norway spruce.
Other studies that give examples of the performance of the
same or similar equipment are Bacher (2008) and Nocetti
et al. (2010).
Olsson et al. (2013) suggested a strength grading method
based on dot laser scanning, which gives high resolution
information of the fibre orientation on board surfaces, to be
used in combination with knowledge of dynamic MOE.
Based on the fibre orientation, basic material wood prop-
erties, and cross-sectional integration schemes, a new IP
defined as the lowest local edgewise bending MOE found
along a board was established. A comparison of coeffi-
cients of determination of the new, suggested IP and
dynamic MOE, respectively, to bending strength was per-
formed and the result was advantageous for the new IP.
The new method/equipment also provides profiles of how
stiffness and strength varies along a board. However, the
investigation only comprised a small sample of 105 boards
of one dimension, 45 9 145 9 3600 mm3, and the exam-
ination of the boards was not performed under production
conditions or at production speed. Between 2013 and 2015
the method was examined in a large-scale study involving
cooperation with both manufacturers of equipment for
grading and sawmilling companies. The timber sample
examined was composed such that the results could be used
as the basis for a formal approval of the method for the
European market. The study was supervised by SP Tech-
nical Research Institute of Sweden and considered all parts
that would be needed for an approval and successful
market introduction, such as assessment of repetitiveness,
significance of grading speed, determination of settings and
evaluation of yield in different strength classes, etcetera.
The results of the study are made available to the research
society through the present paper. Definitions of IPs
involved are defined in detail.
In addition to the research group at Linnaeus University
in Sweden, a number of research groups in Europe are
active in research aiming at new and accurate methods and
IPs for machine strength grading, or at improvements of
regulations for how grading methods should be assessed
and setting values determined. Among these is a research
group at TU Wien which, on the basis of X-ray and
reconstruction of knots in 3D, recently has suggested new
IPs for strength grading, for example, Lukacevic et al.
(2015). Another group, based in France and involving
several universities and institutes, has suggested grading on
the basis of X-ray in combination with fibre orientation
information from tracheid effect scanning, for example
Viguier et al. (2015). Further, a group in Munich has
recently published work on assessment of grading methods
in use and on derivation of settings, for example Rais and
Van de Kuilen (2015).
2 Materials and measurement methods
2.1 Sampling of material
The investigation was aimed not only at a thorough
assessment of the method suggested by Olsson et al. (2013)
but also at a formal approval of it, i.e. fulfilment of
requirements of initial type testing according to the Euro-
pean Standard EN 14081-2, and derivation of settings for a
growth area covering Sweden, Norway and Finland.
Therefore, the sampling and the preparation of the timber
for testing, including drying aiming at 12 % moisture
content (MC), was performed in accordance with the
requirements laid down in the standard.
18 Eur. J. Wood Prod. (2017) 75:17–31
123

To derive machine settings that are valid for a new
machine type, a minimum total number of 900 timber
pieces originating from at least four different sub-samples
shall, according to EN 14081-2, clause 6.2.2, be sampled.
Each sub-sample shall consist of at least 100 pieces of one
or more board cross-sections. The pieces shall be repre-
sentative for the material to be graded in production, which
in practice, and in most cases, mean that they shall not be
pre-graded. The sub-samples shall be distributed over a
chosen geographic area with the purpose of reflecting the
variation of growth conditions. The principles on which
this distribution is based are not laid down in detail in the
standard, but sampling guidelines (Anon 2012) have been
issued by TG1 which is a technical group set up under
technical committee TC 124, Working Group 2 within the
European Committee for Standardization.
The present sample was divided into five subsamples
representing timber from (1) northern Sweden, (2) mid
Sweden, (3) southern Sweden, (4) Norway, and (5) Finland
and included dimensions ranging from 30 to 70 mm in
thickness and from 70 to 245 mm in depth. The locations
from which the timber was fetched for the subsamples are
marked on the map shown in Fig. 1.
It is stated in EN 384 (2010), clause 5.2, that when
assessing bending strength the critical section, i.e. the
section along the board at which failure is expected to
occur, shall be in a position that can be tested, that is
within the loading heads in a four point bending test as
described in EN 408 (2010). Therefore, boards having
their critical section closer to one of the ends than about
6.5 times the board depth were discarded. Hence, in
order to assess at least 900 pieces, about twice the
number had to be sampled in a first stage. The number
of boards from each region fulfilling the requirement
with respect to the criterion on the position of the crit-
ical section and actually evaluated with respect to the
grade determining properties, i.e. bending strength, mean
MOE and density, are presented in Table 1. The grade
determining properties referred to are defined in clause
3.5 of EN 14081-2 (2010) for the strength classes of EN
338 (2009). The criterion employed for which section
along each board that was regarded as the critical one is
based on a calculated local MOE in bending defined in
Sect. 3.1 below.
2.2 Measurements and equipment for IP
determining data
The IPs utilized in the grading method are based on local
fibre orientation on the four longitudinal faces of the board
and on the board longitudinal resonance frequency and
mass assessed as described below. In addition, knowledge
of the MC of the timber was required, and for each
dimension and sawmill represented in the investigation the
MC of about ten pieces was determined using a resistive
moisture transducer. Then, the average value of the MC
was used for all the boards of the same dimension from the
same sawmill.
2.2.1 Resonance frequency and mass
The equipment employed for measurements of longitudinal
resonance frequency and mass of each board was a Preci-
grader strength grading machine (Dynalyse 2015). When a
board passes the machine it is excited by means of a
hammer blow at one of the board ends. The response in
terms of the sound in the time domain is captured by means
of two microphones, and by fast Fourier transform of the
sound the lowest resonance frequency corresponding to the
first longitudinal mode of vibration is extracted. The board
weight is determined by means of a balance placed in the
production line. The length of the board is also measured
by means of a distance meter. Figure 2 shows a Precigrader
strength grading machine in action and boards fed by it in
transversal direction in a production line. The distance
meter is shown at the far end of the line.
2.2.2 Fibre orientation on wood surfaces
A WoodEye 5 scanner (WoodEye 2015) equipped with
four sets of dot lasers and multi-sensor cameras, one set for
each longitudinal surface of the board fed through the
scanner, was used for collecting high resolution data
regarding fibre orientation in the plane of each of the
scanned surfaces. In the scanner, fibre orientation data is
Fig. 1 Map including the growth area consisting of Sweden, Norway
and Finland. Black dots and numbers, 1–5 indicate locations from
where the timber of each of the five subsamples originate
Eur. J. Wood Prod. (2017) 75:17–31 19
123

obtained by means of the so-called tracheid effect which
means that the wood fibres in softwood conduct concen-
trated light better in the direction of the fibres than across
(Matthews and Beech 1976; Soest et al. 1993). This results
in the light intensity distribution around a laser dot entering
the shape of an ellipse for which the major principal axis is
oriented in the direction of the wood fibres. This provides a
practical method for measuring variations in grain angle on
a wood surface. Figure 3 shows (a) a WoodEye 5 scanner,
(b) a part of a wood surface including a knot, (c) the spread
of light from the laser dots on the wood surface, (d) the
fibre orientation on the wood surface calculated by iden-
tifying the major principal axis of each light spot using
image analysis. Within the knot, where fibres are actually
directed almost perpendicular to the surface, the light spots
become almost circular in shape and hence the calculated
fibre direction in the plane of the surface becomes uncer-
tain. The resolution obtained in the transverse direction of
the board surfaces is dependent on the grid installed on the
dot laser source. In this investigation the chosen grid
resulted in a transversal resolution of 4.4 mm. The reso-
lution obtained in the longitudinal direction, i.e. along the
board, depends on the speed of the boards fed through the
scanner and on the sampling frequency of the cameras.
Scanning was performed at two different speeds, namely
200 m/min, giving a resolution in longitudinal direction of
3.5 mm, and 450 m/min giving a resolution in longitudinal
direction of 4.4 mm. For safety reasons the lower speed
was mainly used, since no safe cordon was arranged during
scanning, but actions were taken to verify that the speed
employed had no significance for the indicating properties
calculated on the basis of data from scanning. This is
further commented upon in Sects. 4.1 and 5.2 below.
Furthermore the scanner determines length, thickness and
depth of the board and these dimension measures are used
in the definitions of the IPs as described in Sect. 3.2.Table
1Number
ofspecim
ensanddim
ensionsfrom
each
ofthefivesubsamples/origins
Sub-
sample
Origin
Dim
ensions(m
m)a/no.ofspecim
ens
309
959
3700
309
1209
4400
409
709
3000
409
1209
3600
459
959
3600
459
1459
3600
459
1709
5100
589
1709
5800
709
2209
5800
709
2459
5800
Total
1Sweden
North
48
56
104
2Sweden
Mid
75
138
60
273
3Sweden
South
57
14
32
36
69
30
238
4Norw
ay21
51
123
22
217
5Finland
44
60
104
Total
21
44
57
14
174
409
82
36
69
30
936
aThelength
given
istheminim
um
length
inanyofthesub-sam
ples
Fig. 2 Precigrader strength grading machine in action and boards fed
by it in transversal direction in a production line
20 Eur. J. Wood Prod. (2017) 75:17–31
123

2.3 Determination and requirements of grade
determining properties
The measurements and calculations performed for the
grade determining properties, i.e. the properties that are
decisive for the strength class to which a board should be
graded were carried out as follows.
2.3.1 Modulus of elasticity, MOE
In Fig. 4, the test arrangement for a four point bending test
according to EN 408 is displayed. On the basis of such a
test both a local and a global MOE may be calculated and
they are defined, respectively, as
Elocal ¼al2
1ðF2 � F1Þ
16Ið �w2 � �w1Þ; ð1Þ
and
Eglobal ¼3al2 � 4a3
4bh3 w2�w1
F2�F1� 3a
5Gbh
� � ; ð2Þ
where a = distance between one of the point loads and the
closest support (EN 408 allows a = 6 ± 1.5 h, but here
a = 6 h is used), F = total loading (two load levels, F1 and
F2, respectively), l1 = span for determination of local
MOE (= 5 h), I = second moment of inertia (bh3/12),
�w = centre deflection of the span l1 (D in relation to C and
E), l = distance between the supports (18 h), w = centre
deflection of the span l (D in relation to A and B),
b = thickness of the board, h = depth of the board,
G = shear modulus.
When Elocal and Eglobal have been determined in accor-
dance with Eqs. (1) and (2), a correction with respect to
MC is performed. According to EN 384, clause 5.3.4.2, it
shall be done such that the MOE is adjusted with 1 % for
each per cent deviation from 12 % MC. Thus, corrected
values are calculated as
Elocal;corr ¼ Elocal 1þ u� 12
100
� �; ð3Þ
Eglobal;corr ¼ Eglobal 1þ u� 12
100
� �; ð4Þ
where u is the MC (%) of the board determined for a
piece of clear wood cut out from the board close to the
position of failure in the four point bending test
described in EN 408. It should be noted that for speci-
mens with MC above 18 % the correction of MOE is
limited to 6 %, which means that MC above 18 % is
disregarded.
The stiffness property to be considered when grading
timber into strength classes is defined as (EN 384, clause
5.3.2)
�E ¼ REi=n½ � � 1:3� 2690; ð5Þ
where Ei is the ith value of Eglobal,corr and n is the number
of boards in the sample. For each of the strength classes
defined in EN 338 there is a required value of average
Fig. 3 a WoodEye 5 scanner, b part of a wood surface including a
knot, c spread of light from laser dots on the wood surface, d fibre
orientation on wood surface calculated by identifying the major
principal axis of each light spot using image analysis.
Figure b–d originate from Petersson (2010)
a = 6h 6h a = 6h
h
l1 = 5hA BC D E
F/2 F/2Fig. 4 Test setup for
determination of local and
global MOE and bending
strength in edgewise bending
Eur. J. Wood Prod. (2017) 75:17–31 21
123
MOE which means that �E of the boards, 1 to n, assigned to
a strength class must exceed this required value. Note that
the influence of shear in Eq. (2) shall be ignored by taking
G as infinite, since Eq. (5), implicitly, takes account of the
shear deformation.
2.3.2 Bending strength
The bending strength fm is calculated as
fm ¼ 3Fmaxa
bh2; ð6Þ
where Fmax is the maximum value of F and the other
parameters included in the equation are defined in the
previous section. This bending strength is then corrected
with respect to the depth of the board according to EN 384,
clause 5.3.4.3 as
fm;corr ¼ fmkh; ð7Þ
where
kh ¼h
150
� �0:2
: ð8Þ
The correction term kh is thus equal to unity for a board of
depth 150 mm. The basic requirement on strength in
grading is that 95 % of the boards assigned to a strength
class shall have a value of fm;corr that exceeds the charac-
teristic strength of the class as defined in EN 338.
2.3.3 Density
The piece of wood cut out for determination of moisture
content of each board is also used for calculation of board
density. According to EN 384, clause 8, a density, cor-
rected with respect to moisture content, shall be calculated
as
qcorr ¼ q 1� u� 12
200
� �; ð9Þ
where u is the moisture content determined as described in
Sect. 2.3.1 above. The basic requirement on density in
grading is that 95 % of the boards assigned to a strength
class shall have a value of qcorr that exceeds the charac-
teristic density of the class as defined in EN 338.
3 Calculation model and definitions of indicatingproperties
The principles of the assessed grading method are given in
brief in Sect. 3.1. A complete account of the method is
given by Olsson et al. (2013). The IPs employed for
grading are formally defined in Sect. 3.2 below.
3.1 Determination of local MOE valid for bending
Wood is an orthotropic material having very high stiffness
and strength in the fibre direction, whereas the performance
of these properties is much poorer in other directions. The
local stiffness in the longitudinal direction of the board is
thus strongly dependent on the local fibre orientation.
Knowledge of the spatial distribution of the material ori-
entation and the stiffness properties of the material every-
where within the board makes it possible to calculate the
local stiffness in the longitudinal direction of the board
and, by integration, to calculate the stiffness properties on
the cross-sectional level. It has been shown by several
researchers over the years (Oscarsson et al. 2014) that
knowledge of local MOE, measured over a few centime-
tres, would enable more accurate prediction of bending
strength than what more global measures of MOE, such as
axial dynamic board MOE or MOE determined by means
of flatwise bending machines, do. However, techniques for
determination of high resolution MOE along a board have
not been implemented in sawmill production. Now, when
high resolution data of local fibre orientation is available,
as described in Sect. 2.2.2, this possibility can actually be
utilized. However, since the fibre direction is scanned on
the surface, the information regarding the material orien-
tation within the boards is limited. Thus, certain assump-
tions have to be made before the cross-sectional stiffness
properties can actually be calculated and used in the defi-
nitions of IPs. In the presented grading method, it is
therefore assumed that
• The density (q) and the MOE in the fibre direction (El)
are constant within a board,
• An initial, nominal value of the MOE in the fibre
direction (El,0) as well as nominal values of other
material parameters are assumed, see Table 2,
• When a value of El that should be valid for an
examined board is determined, it is assumed that the
relationships between the other board stiffness param-
eters (Er, Et, Glr, Glt, and Grt) and their corresponding
nominal values (Er,0, Et,0, Glr,0, Glt,0, Grt,0) are the same
as the relationship between El and El,0. Regarding
Table 2 Nominal material
parameters employed (Norway
spruce), values originating from
Dinwoodie (2000)
E1,0 10700 MPa
Er,0 710 MPa
Et,0 430 MPa
Glr,0 500 MPa
Glt,0 620 MPa
Grt,0 24 MPa
vlr 0.38
vlt 0.51
vrt 0.51
22 Eur. J. Wood Prod. (2017) 75:17–31
123

notation of the stiffness parameters, E and G represent
MOE and shear modulus, respectively, and indices l,
r and t, represent longitudinal, radial and tangential
direction, respectively. Poisson’s ratios, displayed in
Table 2, are denoted as v.
• Fibre directions measured on the wood surface
(Fig. 5a) are located in the longitudinal-tangential
plane of the wood material,
• The fibre direction coincides with the wood surface, i.e.
the out of plane angle is set to zero, and
• Thefibredirectionmeasuredona surface is valid to a certain
depth, which means that the fibre angle u highlighted in
Fig. 5a, and the corresponding local MOE, i.e. Ex(x,y,z), is
assumed to be valid within the volume defined by the area
dA (Fig. 5b) times the length dx (Fig. 5a, d).
On the basis of the described assumptions, the edgewise
bending MOE of the segment shown in Fig. 5d can be
calculated by stiffness integration over the segment’s
cross-section. Information that originates from the dynamic
excitation and weighing is used to get a value of El which is
assumed to be representative for the board investigated.
The maximum resolution of the determined bending
MOE profile is mainly dependent on the speed of the
Fig. 5 a Local fibre directions scanned on a member’s surface by
means of a row of laser dots, b cross-section divided into sub-areas
implying that the exhibited angle u and corresponding MOE in the
longitudinal direction, Ex(x,y,z), is valid within the volume dA 9 dx,
c distribution of Ex(x,y,z), d segment of length dx for which the
edgewise bending MOE is calculated by stiffness integration over the
segment’s cross-section, and e a bending MOE profile, each value
along the graph representing the average edgewise bending MOE of
the surrounding 90 mm, and the lowest value along the profile
defining the IP to bending strength.Figure a–d from Oscarsson et al.
(2014)
Eur. J. Wood Prod. (2017) 75:17–31 23
123
scanning, but even for very fast scanning the bending
stiffness is evaluated for sections along the board being
only a few millimetres apart (as mentioned above, a reso-
lution of 4.4 mm can be achieved for scanning at a speed of
450 m/minute). Figure 5e shows a bending MOE profile
where the value shown in each position along the board is
the average MOE of the surrounding 90 mm long sec-
tion. The lowest MOE along the profile is used as the
indicating property to the board bending strength.
3.2 Definitions of indicating properties
Different IPs for the grade determining properties density,
MOE and bending strength are defined and may be utilized
for grading. The first one is intended for prediction of qcorrand it is defined as
IPdensity ¼m
L � h � b 1� us � 12
200
� �; ð10Þ
where m is the mass (m) of the board registered by the
Precigrader, L, h and b are the length, depth and thickness
of the board registered by the WoodEye 5 and us is the MC
(%) measured by a device in the line of production or
manually supplied by an operator. A value of us repre-
sentative for the batch, as defined in EN 14081-1 (2005),
being graded is sufficient. However, it is specified for the
machine that the mean MC of the batch shall be between
10 and 20 % and the MC of individual pieces shall not
deviate by more than four percentage points from the
mean.
The second IP may be used for prediction of MOE and it
is defined as
IPMOE ¼ 4m
L � h � b � f2 � L2 1þ us � 12
100
� �; ð11Þ
where f is the resonance frequency (Hz) corresponding to
the first mode of axial vibration of the board determined by
Precigrader and the other parameters are defined in the
same way as for IPdensity.
The third IP is used for prediction of bending strength,
fm,corr, and it can also be used for prediction of MOE. It is
defined as
IPfb ¼ Eb;90 1þ us � 12
100
� �; ð12Þ
where Eb,90 is the lowest bending MOE over a 90 mm long
section of the board determined on the basis of information
from WoodEye 5 and Precigrader as described above in
Sect. 3.1 and illustrated in Fig. 5e. During development of
the grading method different lengths of sections to be
considered for lowest bending MOE were evaluated and a
length of about 90 mm gave the highest coefficient of
determination between the IP to bending strength and the
bending strength. This length is, however, the only
parameter that was adjusted empirically to optimize the
accuracy of the method when it was developed. Moreover,
the coefficient of determination is not very sensitive to the
length of the section. For example, if 70 or 110 mm is
used, rather than 90 mm, the coefficient of determination
between IP and bending strength decreases with less than
one percentage point. A brief study on the significance of
the section length is presented in Oscarsson (2014),
pp. 62–63.
4 Grading and regulations
As described in Sect. 2 the presented investigation con-
cerns a formal approval of the current grading method.
Thus, all the requirements of initial type testing according
to EN 14081-2 must be fulfilled. The requirements and
evaluation with respect to repeatability are described in
Sect. 4.1 below and the procedure for calculation of setting
values for different strength classes are set out in brief in
Sect. 4.2.
4.1 Requirements and assessment of repeatability
and significance of scanning speed
If the same board is graded repeatedly the measured data
should result in the same calculated IPs and the board
should be assigned to the same strength class each time
but, of course, some tolerances must always be allowed
for. In EN 14081-2, clause 6.2.5, it is stated that a
repeatability check including at least 100 boards of one
size must be performed. The boards shall be passed
through the machine five times and each time the IPs
shall be determined. The feed speed shall be equivalent
with the machine’s critical feed speed, i.e. the maximum
speed at which the machine is intended to operate in
commercial grading. The range of the IP value considered
shall then be divided into n intervals, each containing
approximately the same number of boards, representing
fictitious grades. The most frequent grade assigned to
each board over the five passes shall be designated its
optimum grade. Then a so called size matrix is established
and the number in each cell represents the number of
times a board with a certain optimum grade is assigned to
a certain assigned grade. Numbers in the diagonal rep-
resent correctly graded boards, i.e. when the board is
assigned to the optimum grade, while off-diagonal num-
bers represent erroneously graded boards. An elementary
cost matrix is also established and filled with penalty
factors. In the cells in the diagonal these factors are set to
24 Eur. J. Wood Prod. (2017) 75:17–31
123
zero. In cells adjacent to the diagonal the factors are set
to 1, two steps away from the diagonal they are set to 2
and so on. A global cost matrix is then established such
that each cell in it contains the product of the number in
the corresponding cells of the size matrix and the ele-
mentary cost matrix divided by the sum of the numbers in
all cells for the assigned grade of the size matrix. The
requirement is that no number in the global cost matrix
may exceed 0.1. If this requirement is fulfilled the method
is regarded accurate enough for grading n - 1 strength
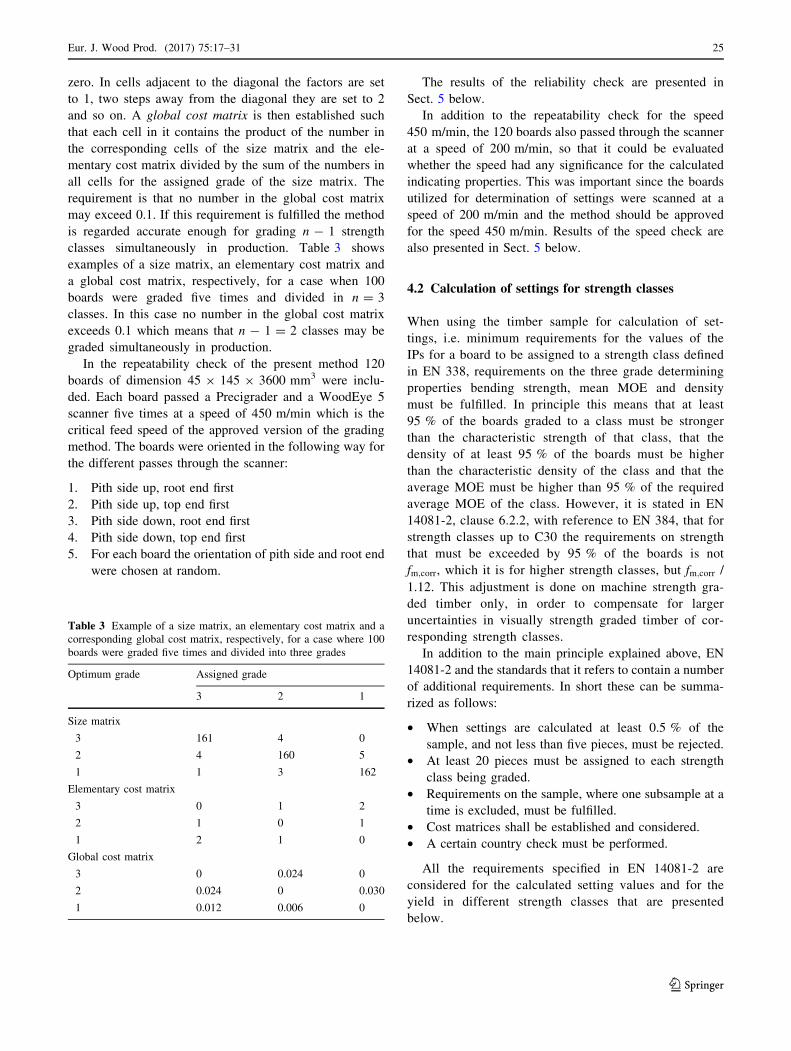
classes simultaneously in production. Table 3 shows
examples of a size matrix, an elementary cost matrix and
a global cost matrix, respectively, for a case when 100
boards were graded five times and divided in n = 3
classes. In this case no number in the global cost matrix
exceeds 0.1 which means that n - 1 = 2 classes may be
graded simultaneously in production.
In the repeatability check of the present method 120
boards of dimension 45 9 145 9 3600 mm3 were inclu-
ded. Each board passed a Precigrader and a WoodEye 5
scanner five times at a speed of 450 m/min which is the
critical feed speed of the approved version of the grading
method. The boards were oriented in the following way for
the different passes through the scanner:
1. Pith side up, root end first
2. Pith side up, top end first
3. Pith side down, root end first
4. Pith side down, top end first
5. For each board the orientation of pith side and root end
were chosen at random.
The results of the reliability check are presented in
Sect. 5 below.
In addition to the repeatability check for the speed
450 m/min, the 120 boards also passed through the scanner
at a speed of 200 m/min, so that it could be evaluated
whether the speed had any significance for the calculated
indicating properties. This was important since the boards
utilized for determination of settings were scanned at a
speed of 200 m/min and the method should be approved
for the speed 450 m/min. Results of the speed check are
also presented in Sect. 5 below.
4.2 Calculation of settings for strength classes
When using the timber sample for calculation of set-
tings, i.e. minimum requirements for the values of the
IPs for a board to be assigned to a strength class defined
in EN 338, requirements on the three grade determining
properties bending strength, mean MOE and density
must be fulfilled. In principle this means that at least
95 % of the boards graded to a class must be stronger
than the characteristic strength of that class, that the
density of at least 95 % of the boards must be higher
than the characteristic density of the class and that the
average MOE must be higher than 95 % of the required
average MOE of the class. However, it is stated in EN
14081-2, clause 6.2.2, with reference to EN 384, that for
strength classes up to C30 the requirements on strength
that must be exceeded by 95 % of the boards is not
fm;corr, which it is for higher strength classes, but fm;corr /
1.12. This adjustment is done on machine strength gra-
ded timber only, in order to compensate for larger
uncertainties in visually strength graded timber of cor-
responding strength classes.
In addition to the main principle explained above, EN
14081-2 and the standards that it refers to contain a number
of additional requirements. In short these can be summa-
rized as follows:
• When settings are calculated at least 0.5 % of the
sample, and not less than five pieces, must be rejected.
• At least 20 pieces must be assigned to each strength
class being graded.
• Requirements on the sample, where one subsample at a
time is excluded, must be fulfilled.
• Cost matrices shall be established and considered.
• A certain country check must be performed.
All the requirements specified in EN 14081-2 are
considered for the calculated setting values and for the
yield in different strength classes that are presented
below.
Table 3 Example of a size matrix, an elementary cost matrix and a
corresponding global cost matrix, respectively, for a case where 100
boards were graded five times and divided into three grades
Optimum grade Assigned grade
3 2 1
Size matrix
3 161 4 0
2 4 160 5
1 1 3 162
Elementary cost matrix
3 0 1 2
2 1 0 1
1 2 1 0
Global cost matrix
3 0 0.024 0
2 0.024 0 0.030
1 0.012 0.006 0
Eur. J. Wood Prod. (2017) 75:17–31 25
123
5 Results and discussion
5.1 Properties decisive for the grade determining
properties
A summary of the results for the properties defined in
Sect. 3.2 is given in Table 4. Mean values, standard devi-
ation and coefficient of variation are presented and it can
be concluded that the quality of the timber is similar to
what has been reported in other studies on Norway spruce
from these countries, e.g. Johansson et al. (1992) and
Hanhijarvi and Ranta-Maunus (2008). Regarding the rela-
tionships between the different properties in terms of
coefficient of determination these are, as well as the
coefficients of determination to the IP values, reported in
Sect. 5.3 below.
5.2 Repeatability check and significance of scanning
speed on indicating properties
Repeatability checks using a sample of 120 boards, see
Sect. 4.1, were performed for all three IPs being defined,
namely, IPfb, IPMOE and IPdensity and the results were sat-
isfactory. For all three IPs the repeatability allowed for five
classes or more, including rejects, to be graded simultane-
ously while fulfilling the requirements stipulated for the
global cost matrix as described in Sect. 4.1. This means that
four classes plus reject may be graded simultaneously using
this method, which is more than what is generally done in
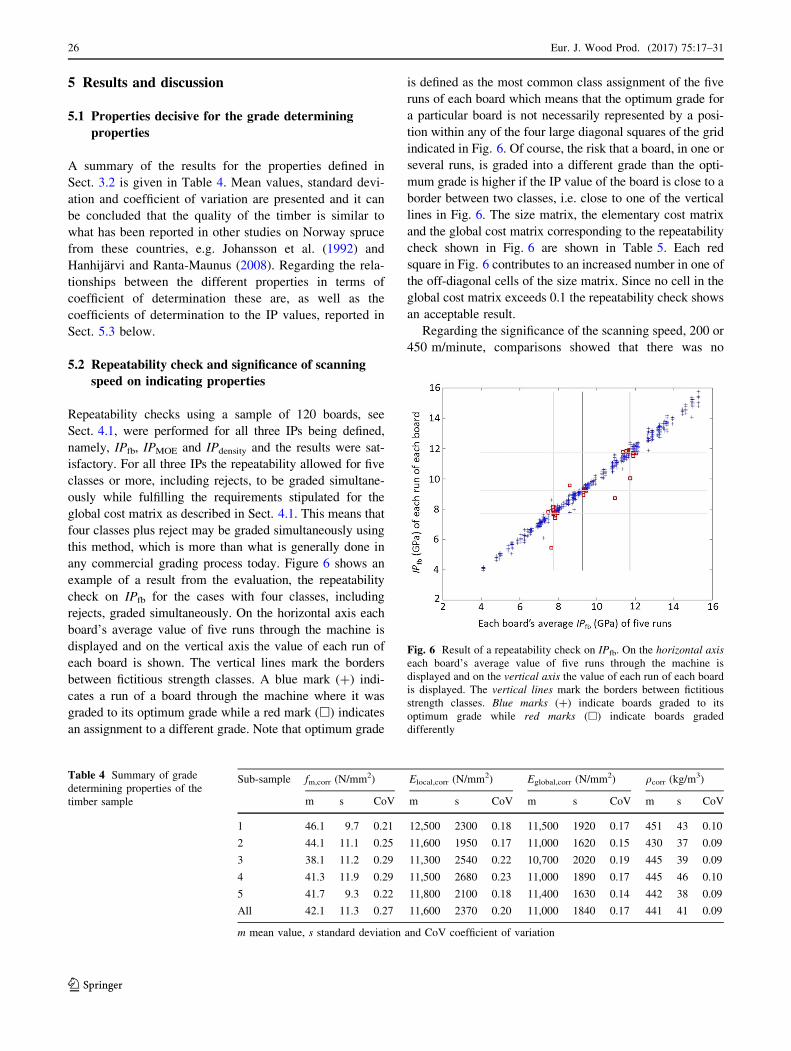
any commercial grading process today. Figure 6 shows an
example of a result from the evaluation, the repeatability
check on IPfb for the cases with four classes, including
rejects, graded simultaneously. On the horizontal axis each
board’s average value of five runs through the machine is
displayed and on the vertical axis the value of each run of
each board is shown. The vertical lines mark the borders
between fictitious strength classes. A blue mark (?) indi-
cates a run of a board through the machine where it was
graded to its optimum grade while a red mark (h) indicates
an assignment to a different grade. Note that optimum grade
is defined as the most common class assignment of the five
runs of each board which means that the optimum grade for
a particular board is not necessarily represented by a posi-
tion within any of the four large diagonal squares of the grid
indicated in Fig. 6. Of course, the risk that a board, in one or
several runs, is graded into a different grade than the opti-
mum grade is higher if the IP value of the board is close to a
border between two classes, i.e. close to one of the vertical
lines in Fig. 6. The size matrix, the elementary cost matrix
and the global cost matrix corresponding to the repeatability
check shown in Fig. 6 are shown in Table 5. Each red
square in Fig. 6 contributes to an increased number in one of
the off-diagonal cells of the size matrix. Since no cell in the
global cost matrix exceeds 0.1 the repeatability check shows
an acceptable result.
Regarding the significance of the scanning speed, 200 or
450 m/minute, comparisons showed that there was no
Table 4 Summary of grade
determining properties of the
timber sample
Sub-sample fm,corr (N/mm2) Elocal,corr (N/mm2) Eglobal,corr (N/mm2) qcorr (kg/m3)
m s CoV m s CoV m s CoV m s CoV
1 46.1 9.7 0.21 12,500 2300 0.18 11,500 1920 0.17 451 43 0.10
2 44.1 11.1 0.25 11,600 1950 0.17 11,000 1620 0.15 430 37 0.09
3 38.1 11.2 0.29 11,300 2540 0.22 10,700 2020 0.19 445 39 0.09
4 41.3 11.9 0.29 11,500 2680 0.23 11,000 1890 0.17 445 46 0.10
5 41.7 9.3 0.22 11,800 2100 0.18 11,400 1630 0.14 442 38 0.09
All 42.1 11.3 0.27 11,600 2370 0.20 11,000 1840 0.17 441 41 0.09
m mean value, s standard deviation and CoV coefficient of variation
Fig. 6 Result of a repeatability check on IPfb. On the horizontal axis
each board’s average value of five runs through the machine is
displayed and on the vertical axis the value of each run of each board
is displayed. The vertical lines mark the borders between fictitious
strength classes. Blue marks (?) indicate boards graded to its
optimum grade while red marks (h) indicate boards graded
differently
26 Eur. J. Wood Prod. (2017) 75:17–31
123

significant difference in results when the 120 boards were
scanned in these two different speeds. When the boards
were scanned in 200 and 450 m/min, respectively, in the
same orientation through the scanner, and the same set of
resonance frequencies and masses were used for calculat-
ing IPfb, then the coefficient of determination between the
two sets was as high as 0.998. This can be compared with
the coefficients of determination between any two runs in
the repeatability check presented above where the speed
450 m/min was used and the boards were oriented in dif-
ferent ways and associated with different sets of measured
resonance frequencies and masses. Then the coefficients of
determination between two runs were in the range of
0.97–0.98. Thus, it was proved that the scanning speed of
450 m/min gives the same values of IPfb as the speed
200 m/min does. Thus, 450 m/min is a verified speed.
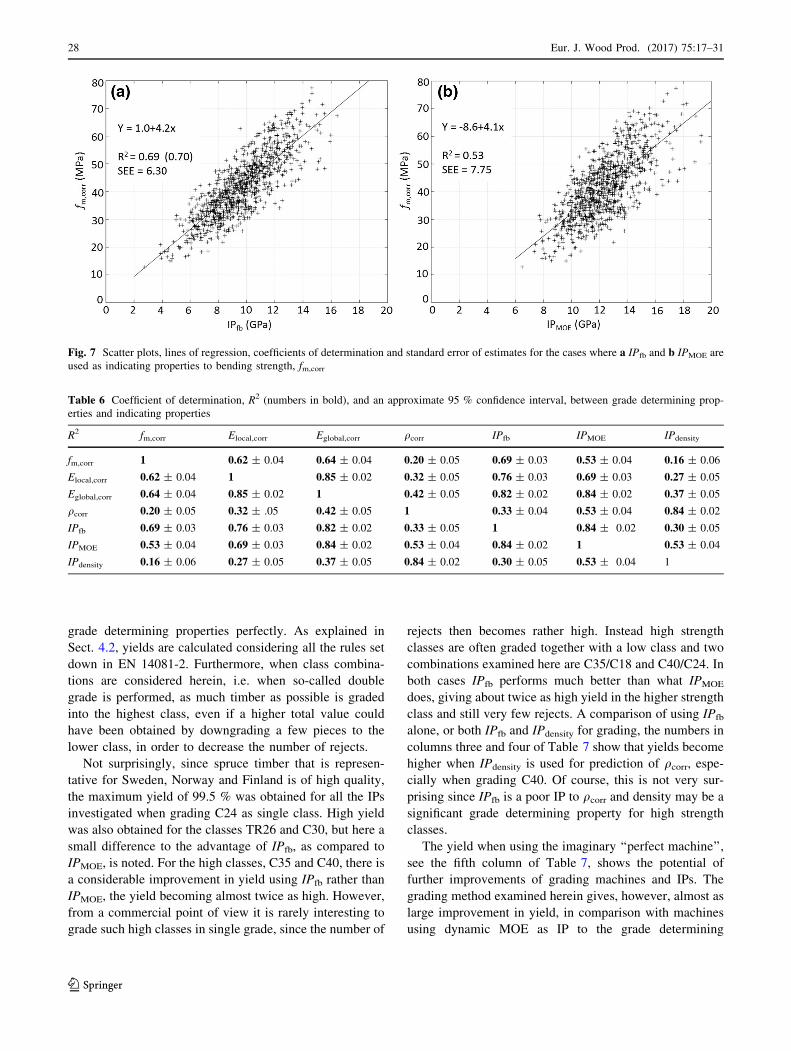
5.3 Regression analysis
The relationships and coefficients of determination
between IPfb and fm,corr, and between dynamic MOE,
denoted as IPMOE, and fm,corr are presented in Fig. 7. For
the relationship between IPfb and fm,corr a linear regression
coefficient of determination of 0.69 was achieved. For a
slightly curved, exponential function of the relationship
R2 = 0.70 was reached. The linear regression coefficient of
determination between IPMOE and fm,corr was R2 = 0.53.
Table 6 shows R2 (numbers in bold), including an
approximate 95 % confidence interval, between each of the
grade determining properties and the indicating properties
involved. The R2 of 0.69 (0.70) between IPfb and fm,corr for
this large and representative sample of Norway spruce was
even slightly higher than the corresponding R2 of 0.68
reported for the small sample of 105 boards investigated
when this IP was first introduced by Olsson et al. (2013). A
comparison with the R2 of 0.53 for IPMOE is relevant since
dynamic MOE are used by Precigrader and several other
grading machines on the market for prediction of bending
strength. Furthermore, the R2 between fm,corr and Elocal,corr
was R2 = 0.62 and between fm,corr and Eglobal,corr it was
R2 = 0.64, which means that IPfb gives better prediction of
fm,corr than either of these static bending MOEs. Thus, IPfb
is indeed an effective IP for prediction of bending strength
of Norway spruce. The scatter plot displayed in Fig. 7a,
and the inserted equation representing the line of regres-
sion, also show that there is an almost direct proportion-
ality between IPfb and predicted bending strength.
As shown by the results presented in Table 6, IPfb can
be used for prediction of Elocal,corr and Eglobal,corr with
approximately the same accuracy as when IPMOE is used
for this purpose. IPMOE, which represents a global measure
of MOE, is slightly more effective for prediction of
Eglobal,corr (R2 = 0.84) than what IPfb is (R
2 = 0.82), while
IPfb, which is a local measure of MOE, is more effective
for prediction of Elocal,corr (R2 = 0.76) than what IPMOE is
(R2 = 0.69). It should be noted, however, that IPfb is a very
poor IP for prediction of qcorr (R2 = 0.33). For the purpose
of predicting density IPMOE is much better (R2 = 0.53)
and, of course, IPdensity is the best one of the three IPs
investigated (R2 = 0.84).
5.4 Yield in strength classes
From a practical and commercial point of view, a grading
method is judged by the yield obtainable in different
strength classes, given the quality of the assessed timber.
Table 7 shows, for the investigated timber, examples of
yield in some different single and combined strength
classes using the IPs defined herein. The first column
specifies the strength class or class combination consid-
ered. The second column gives the yield obtained using
IPMOE, i.e. axial dynamic MOE, as IP to all three grade
determining properties. The third column gives the yield
obtained using IPfb for prediction of all the grade deter-
mining properties, and the fourth column gives the yield
obtained using IPfb as IP to both fm,corr and to Eglobal,corr
(the latter one determines the grade determining property�E, see Eq. 5) but IPdensity for prediction of qcorr. The fifth
column shows the yield that could be obtained with a
‘‘perfect machine’’, i.e. a machine able to predict all the
Table 5 Size matrix, elementary cost matrix and global cost matrix
for a repeatability check on IPfb where four fictitious strength classes
(including rejects) are graded simultaneously
Optimum grade Assigned grade
4 3 2 1
Size matrix
4 142 3 0 0
3 8 141 1 0
2 0 6 144 5
1 0 0 5 145
Elementary cost matrix
4 0 1 2 3
3 1 0 1 2
2 2 1 0 1
1 3 2 1 0
Global cost matrix
4 0 0.020 0 0
3 0.053 0 0.067 0
2 0 0.040 0 0.033
1 0 0 0.033 0
Eur. J. Wood Prod. (2017) 75:17–31 27
123
grade determining properties perfectly. As explained in
Sect. 4.2, yields are calculated considering all the rules set
down in EN 14081-2. Furthermore, when class combina-
tions are considered herein, i.e. when so-called double
grade is performed, as much timber as possible is graded
into the highest class, even if a higher total value could
have been obtained by downgrading a few pieces to the
lower class, in order to decrease the number of rejects.
Not surprisingly, since spruce timber that is represen-
tative for Sweden, Norway and Finland is of high quality,
the maximum yield of 99.5 % was obtained for all the IPs
investigated when grading C24 as single class. High yield
was also obtained for the classes TR26 and C30, but here a
small difference to the advantage of IPfb, as compared to
IPMOE, is noted. For the high classes, C35 and C40, there is
a considerable improvement in yield using IPfb rather than
IPMOE, the yield becoming almost twice as high. However,
from a commercial point of view it is rarely interesting to
grade such high classes in single grade, since the number of
rejects then becomes rather high. Instead high strength
classes are often graded together with a low class and two
combinations examined here are C35/C18 and C40/C24. In
both cases IPfb performs much better than what IPMOE
does, giving about twice as high yield in the higher strength
class and still very few rejects. A comparison of using IPfb
alone, or both IPfb and IPdensity for grading, the numbers in
columns three and four of Table 7 show that yields become
higher when IPdensity is used for prediction of qcorr, espe-cially when grading C40. Of course, this is not very sur-
prising since IPfb is a poor IP to qcorr and density may be a
significant grade determining property for high strength
classes.
The yield when using the imaginary ‘‘perfect machine’’,
see the fifth column of Table 7, shows the potential of
further improvements of grading machines and IPs. The
grading method examined herein gives, however, almost as
large improvement in yield, in comparison with machines
using dynamic MOE as IP to the grade determining
Fig. 7 Scatter plots, lines of regression, coefficients of determination and standard error of estimates for the cases where a IPfb and b IPMOE are
used as indicating properties to bending strength, fm,corr
Table 6 Coefficient of determination, R2 (numbers in bold), and an approximate 95 % confidence interval, between grade determining prop-
erties and indicating properties
R2 fm,corr Elocal,corr Eglobal,corr qcorr IPfb IPMOE IPdensity
fm,corr 1 0.62 ± 0.04 0.64 ± 0.04 0.20 ± 0.05 0.69 ± 0.03 0.53 ± 0.04 0.16 ± 0.06
Elocal,corr 0.62 ± 0.04 1 0.85 ± 0.02 0.32 ± 0.05 0.76 ± 0.03 0.69 ± 0.03 0.27 ± 0.05
Eglobal,corr 0.64 ± 0.04 0.85 ± 0.02 1 0.42 ± 0.05 0.82 ± 0.02 0.84 ± 0.02 0.37 ± 0.05
qcorr 0.20 ± 0.05 0.32 ± .05 0.42 ± 0.05 1 0.33 ± 0.04 0.53 ± 0.04 0.84 ± 0.02
IPfb 0.69 ± 0.03 0.76 ± 0.03 0.82 ± 0.02 0.33 ± 0.05 1 0.84 ± 0.02 0.30 ± 0.05
IPMOE 0.53 ± 0.04 0.69 ± 0.03 0.84 ± 0.02 0.53 ± 0.04 0.84 ± 0.02 1 0.53 ± 0.04
IPdensity 0.16 ± 0.06 0.27 ± 0.05 0.37 ± 0.05 0.84 ± 0.02 0.30 ± 0.05 0.53 ± 0.04 1
28 Eur. J. Wood Prod. (2017) 75:17–31
123
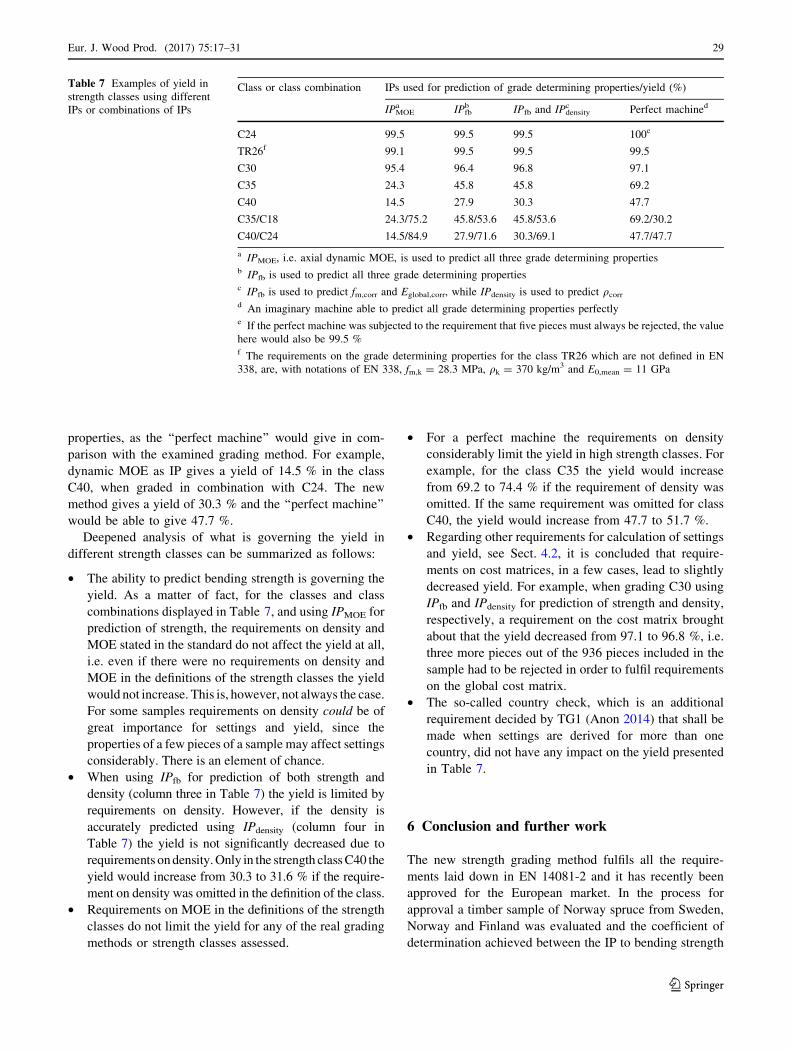
properties, as the ‘‘perfect machine’’ would give in com-
parison with the examined grading method. For example,
dynamic MOE as IP gives a yield of 14.5 % in the class
C40, when graded in combination with C24. The new
method gives a yield of 30.3 % and the ‘‘perfect machine’’
would be able to give 47.7 %.
Deepened analysis of what is governing the yield in
different strength classes can be summarized as follows:
• The ability to predict bending strength is governing the
yield. As a matter of fact, for the classes and class
combinations displayed in Table 7, and using IPMOE for
prediction of strength, the requirements on density and
MOE stated in the standard do not affect the yield at all,
i.e. even if there were no requirements on density and
MOE in the definitions of the strength classes the yield
would not increase. This is, however, not always the case.
For some samples requirements on density could be of
great importance for settings and yield, since the
properties of a few pieces of a sample may affect settings
considerably. There is an element of chance.
• When using IPfb for prediction of both strength and
density (column three in Table 7) the yield is limited by
requirements on density. However, if the density is
accurately predicted using IPdensity (column four in
Table 7) the yield is not significantly decreased due to
requirements ondensity.Only in the strength classC40 the
yield would increase from 30.3 to 31.6 % if the require-
ment on density was omitted in the definition of the class.
• Requirements on MOE in the definitions of the strength
classes do not limit the yield for any of the real grading
methods or strength classes assessed.
• For a perfect machine the requirements on density
considerably limit the yield in high strength classes. For
example, for the class C35 the yield would increase
from 69.2 to 74.4 % if the requirement of density was
omitted. If the same requirement was omitted for class
C40, the yield would increase from 47.7 to 51.7 %.
• Regarding other requirements for calculation of settings
and yield, see Sect. 4.2, it is concluded that require-
ments on cost matrices, in a few cases, lead to slightly
decreased yield. For example, when grading C30 using
IPfb and IPdensity for prediction of strength and density,
respectively, a requirement on the cost matrix brought
about that the yield decreased from 97.1 to 96.8 %, i.e.
three more pieces out of the 936 pieces included in the
sample had to be rejected in order to fulfil requirements
on the global cost matrix.
• The so-called country check, which is an additional
requirement decided by TG1 (Anon 2014) that shall be
made when settings are derived for more than one
country, did not have any impact on the yield presented
in Table 7.
6 Conclusion and further work
The new strength grading method fulfils all the require-
ments laid down in EN 14081-2 and it has recently been
approved for the European market. In the process for
approval a timber sample of Norway spruce from Sweden,
Norway and Finland was evaluated and the coefficient of
determination achieved between the IP to bending strength
Table 7 Examples of yield in
strength classes using different
IPs or combinations of IPs
Class or class combination IPs used for prediction of grade determining properties/yield (%)
IPMOEa IPfb
b IPfb and IPdensityc Perfect machined
C24 99.5 99.5 99.5 100e
TR26f 99.1 99.5 99.5 99.5
C30 95.4 96.4 96.8 97.1
C35 24.3 45.8 45.8 69.2
C40 14.5 27.9 30.3 47.7
C35/C18 24.3/75.2 45.8/53.6 45.8/53.6 69.2/30.2
C40/C24 14.5/84.9 27.9/71.6 30.3/69.1 47.7/47.7
a IPMOE, i.e. axial dynamic MOE, is used to predict all three grade determining propertiesb IPfb is used to predict all three grade determining propertiesc IPfb is used to predict fm,corr and Eglobal,corr, while IPdensity is used to predict qcorrd An imaginary machine able to predict all grade determining properties perfectlye If the perfect machine was subjected to the requirement that five pieces must always be rejected, the value
here would also be 99.5 %f The requirements on the grade determining properties for the class TR26 which are not defined in EN
338, are, with notations of EN 338, fm,k = 28.3 MPa, qk = 370 kg/m3 and E0,mean = 11 GPa
Eur. J. Wood Prod. (2017) 75:17–31 29
123

and the measured bending strength was as high as
R2 = 0.69/0.70, while the corresponding relationship
between dynamic MOE and measured bending strength
was R2 = 0.53. A comparable study of the performance of
methods on the market was presented by Hanhijarvi and
Ranta-Maunus (2008) and although conclusions should
always be drawn with caution when comparing coefficients
of determination between IPs and grade determining
properties of different timber samples, the results of the
different investigations indicate that the performance of the
new method/procedure will surpass what is achieved by
market leading techniques of recent years.
Regarding yield in strength classes the new method gives
almost twice as high yield in high strength classes (C35 and
above) compared towhat gradingmethods based on dynamic
MOE alone does. With timber of spruce from Sweden,
Norway and Finland, gradingC40 andC24 simultaneously, a
yield as high as 30 % in the class C40 can be achieved while
the rest of the timber (except the mandatory 0.5 % to be
rejected) is graded into the class C24. This may be compared
to the yield in the class C40 using dynamic MOE as IP of
15 % and the optimum yield that could be achieved using an
imaginary ‘‘perfect machine’’ of 47 %.
Further work should comprise a large study on the
performance of the new method when grading Norway
spruce timber into T-classes, i.e. for prediction of tension
strength of laminations for production of glulam, and also
studies on the performance of the method for other species.
Possibilities for further improvements of the method, e.g.
as suggested by Hu et al. (2015) and Briggert et al. (2015)
should also be developed, evaluated and possibly imple-
mented in production.
Open Access This article is distributed under the terms of the
Creative Commons Attribution 4.0 International License (http://
creativecommons.org/licenses/by/4.0/), which permits unrestricted
use, distribution, and reproduction in any medium, provided you give
appropriate credit to the original author(s) and the source, provide a
link to the Creative Commons license, and indicate if changes were
made.
References
Anon (2012) Guidelines for sampling a growth area for deriving
machine settings. 6th DRAFT, 18 October. European Committee
for Standardization/TC124/WG2/TG1
Anon (2014) TG1 decisions, 5 March. European Committee for
Standardization/TC124/WG2/TG1
Bacher M (2008) Comparison of different machine strength grading
principles. COST E53, 29–30 October 2008, Delft, The Nether-
lands, pp 183–193
Briggert A, Olsson A, Oscarsson J (2015) Three dimensional knot
models based on surface laser scanning. In: Proceedings of the
19th international nondestructive testing and evaluation of wood
symposium, 22–25 September 2015, Rio de Janeiro, Brazil
Dinwoodie JM (2000) Timber: its nature and behaviour. E & FN
Spon, New Fetter Lane, London
Dynalyse AB (2015) Precigrader. http://dynalyse.se/precigrader/.
Accessed 25 Jul 2015
EN 14081-1 (2005) Timber structures—strength graded structural
timber with rectangular cross section—Part 1: general
requirements
EN 14081-2 (2010) Timber structures—strength graded structural
timber with rectangular cross section—Part 2: Machine grading;
additional requirements for initial type testing. European Com-
mittee for Standardization
EN 338 (2009) Structural timber—strength classes. European Com-
mittee for Standardization
EN 384 (2010) Structural timber—determination of characteristic
values of mechanical properties and density. European Com-
mittee for Standardization
EN 408 (2010) ? A1 (2012) Timber structures—structural timber
and glued laminated timber—determination of some physical
and mechanical properties. European Committee for
Standardization
Hanhijarvi A, Ranta-Maunus A (2008) Development of strength
grading of timber using combined measurement techniques.
Report of the Combigrade-project—phase 2. VTT Publication
686
Hu M, Johansson M, Olsson A, Oscarsson J, Enquist B (2015) Local
variation of modulus of elasticity in timber determined on the
basis of non-contact deformation measurement and scanned fibre
orientation. Eur J Wood Prod 73(1):17–27
Johansson C-J (2003) Grading of timber with respect to mechanical
properties. In: Thelandersson S, Larsen HJ (eds) Timber
engineering. Wiley, Chichester, pp 23–43
Johansson C-J, Brundin J, Gruber R (1992) Stress Grading of Swedish
and German Timber—a comparison of machine stress grading
and three visual grading systems. SP Swedish National Testing
and Research Institute, SP REPORT 1992:23
Lukacevic M, Fussl J, Eberhardsteiner J (2015) Discussion of
common and new indicating properties for the strength grading
of wooden boards. Wood Sci Technol 49(3):551–576
Matthews PC, Beech BH (1976) Method and apparatus for detecting
timber defects. US Patent no. 3676384A
Microtec (2015). http://microtec.eu/. Accessed 25 Jul 2015
Nocetti M, Bacher M, Brunetti M, Crivellaro A, van de Kuilen
J-W (2010) Machine grading of Italian structural timber:
preliminary results on different wood species. In: Proceedings
of the 11th world conference on timber engineering, Trentino,
Italy 2010
Olsson A, Oscarsson J, Serrano E, Kallsner B, Johansson M,
Enquist B (2013) Prediction of timber bending strength and
in-member cross-sectional stiffness variation on the basis of
local wood fibre orientation. Eur J Wood Prod 71(3):319–
333
Oscarsson, J (2014) Strength grading of structural timber and EWP
laminations of Norway spruce—development potentials and
industrial applications. Doctoral dissertation, no 170/2014,
Linnaeus University, Vaxjo, Sweden
Oscarsson J, Olsson A, Enquist B (2014) Localized modulus of
elasticity in timber and its significance for the accuracy of
machine strength grading. Wood Fiber Sci 46(4):489–501
Petersson H (2010) Use of optical and laser scanning techniques as
tools for obtaining improved FE-input data for strength and
shape stability analysis of wood and timber. In: Proceedings of V
European Conference on Computational Mechanics, Paris,
France, May 16–21
Rais A, Van de Kuilen J-W (2015) Critical section effect during
derivation of settings for grading machines based on dynamic
30 Eur. J. Wood Prod. (2017) 75:17–31
123

modulus of elasticity. Wood Mat Sci Eng. doi:10.1080/
17480272.2015.1109546
Soest J, Matthews PC, Wilson B (1993) A simple optical scanner for
grain defects. In: Proceedings of 5th international conference on
scanning technology and process control for the wood products
industry, Atlanta, USA, October 25–27
Viguier J, Jehl A, Collet R, Bleron L, Meriaudeau F (2015) Improving
strength grading of timber by grain angle measurement and
mechanical modelling. Wood Mat Sci Eng 10(1):145–156
WoodEye AB (2015) WoodEye. http://woodeye.se/en/. Accessed 26
Aug 2015
Eur. J. Wood Prod. (2017) 75:17–31 31
123