Embed Size (px)
Citation preview

Strength in NumbersThe Relative Concentration of Iranian AmericansAcross the United States
Iran Census ReportBy Soraya Fata and Raha Rafii September 2003
Foreword
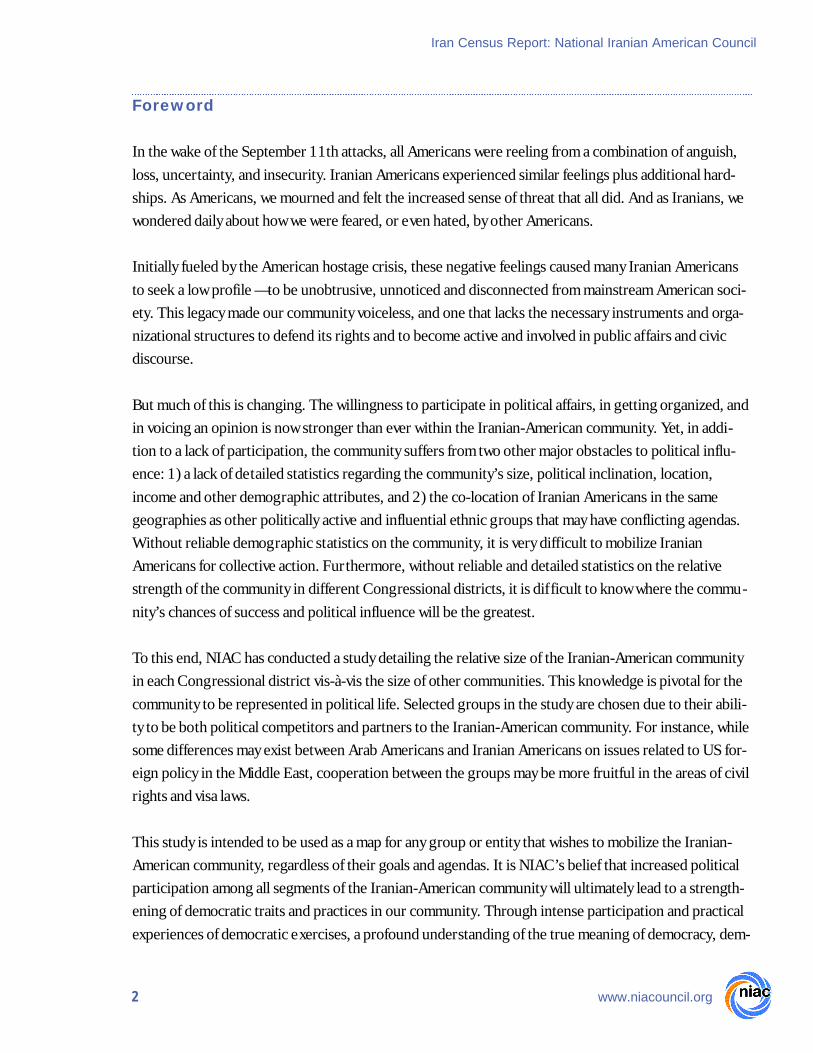
In the wake of the September 11th attacks, all Americans were reeling from a combination of anguish,loss, uncertainty, and insecurity. Iranian Americans experienced similar feelings plus additional hard-ships. As Americans, we mourned and felt the increased sense of threat that all did. And as Iranians, wewondered daily about how we were feared, or even hated, by other Americans.
Initially fueled by the American hostage crisis, these negative feelings caused many Iranian Americansto seek a low profile — to be unobtrusive, unnoticed and disconnected from mainstream American soci-ety. This legacy made our community voiceless, and one that lacks the necessary instruments and orga-nizational structures to defend its rights and to become active and involved in public affairs and civicdiscourse.
But much of this is changing. The willingness to participate in political affairs, in getting organized, andin voicing an opinion is now stronger than ever within the Iranian-American community. Yet, in addi-tion to a lack of participation, the community suffers from two other major obstacles to political influ-ence: 1) a lack of detailed statistics regarding the community’s size, political inclination, location,income and other demographic attributes, and 2) the co-location of Iranian Americans in the samegeographies as other politically active and influential ethnic groups that may have conflicting agendas.Without reliable demographic statistics on the community, it is very difficult to mobilize IranianAmericans for collective action. Furthermore, without reliable and detailed statistics on the relativestrength of the community in different Congressional districts, it is dif ficult to know where the commu-nity’s chances of success and political influence will be the greatest.
To this end, NIAC has conducted a study detailing the relative size of the Iranian-American communityin each Congressional district vis-à-vis the size of other communities. This knowledge is pivotal for thecommunity to be represented in political life. Selected groups in the study are chosen due to their abili-ty to be both political competitors and partners to the Iranian-American community. For instance, whilesome differences may exist between Arab Americans and Iranian Americans on issues related to US for-eign policy in the Middle East, cooperation between the groups may be more fruitful in the areas of civilrights and visa laws.
This study is intended to be used as a map for any group or entity that wishes to mobilize the Iranian-American community, regardless of their goals and agendas. It is NIAC’s belief that increased politicalparticipation among all segments of the Iranian-American community will ultimately lead to a strength-ening of democratic traits and practices in our community. Through intense participation and practicalexperiences of democratic exercises, a profound understanding of the true meaning of democracy, dem-
2
Iran Census Report: National Iranian American Council
www.niacouncil.org
ocratic approaches and a democratic mindset will emerge in our community, enabling healthy internalcompetition for the leadership of the community and an ability for strong external competition in theface of obstacles that confront us all, irrespective of our political orientations.
Furthermore, this study is preliminary in the sense that the number of Iranian Americans is underesti-mated by the US Census, and the existing data is yet to be fully analyzed. We are currently investigatingthe possibility of conducting a census that would rectify the systemic errors present in the US Censusdata, as well as including more ethnic groups in the study for comparison. In the meantime, this studywill serve as an excellent guide for anyone wishing to mobilize the Iranian-American community on thestate or national level.
This project has come to fruition under the insightful leadership of NIAC’s Executive team MarjanEhsassi and Dokhi Fassihian, and the untiring work of NIAC staffers Raha Rafii and Soraya Fata.
Trita ParsiPresident September 2003
3
Iran Census Report: National Iranian American Council
www.niacouncil.org

Goal
In order to determine the relative political strength of the Iranian-American community in the UnitedStates, it is necessary to measure not only the population of the community but its population as a per-centage of the general population, and compared to other important ethnic minorities.
The geographic concentrations of Iranian Americans are compared to ethnic minorities of Armenian,Greek, Arab, Turkish, and Israeli descent — communities that may have competing or complementarypolitical agendas. While they may be potential competitors in the political arena, the aforementionedgroups may also ser ve as a boon in helping the Iranian-American community achieve its goals. We haveselected these ethnic communities as the major political entities to study Iranian Americans againstbecause of shared history, ancestral geog raphic proximity, and cultural closeness. These factors contin-ue to relate these g roups to Iranian Americans either in shared interests or competition for politicalinfluence and power. The Jewish-American community, which is very relevant to our study, could how-ever not be included in the study since the US Census Bureau does not list religious minorities.
Method
The Iranian1 population by Congressional district has been obtained as reported by the United StatesCensus Bureau (www.census.gov) in the 108th Congressional District as of July 2003. As such, the USCensus Bureau does not offer a designation for individuals of Iranian descent, though it does so for avariety of other groups.2 As a result, it is estimated that only a fraction of the total number of Iranians inthe United States chose to write in “Iranian” as their ancestry, underestimating the size and impor tanceof the Iranian-American community. The US Census estimates that the Iranian-American communitynumbers around 330,000, whereas the Iranian Interest Section in Washington, DC claims to hold pass-port information for approximately 900,000 Iranians in the US.
The problem lies partly with the 2000 census form. Only two questions deal with ancestry: the firstwhich asks if an individual is Spanish/Hispanic/Latino, and a second which asks a person’s race. Thechoices provided under the category of race are “white”; “black, African Am., or Neg ro”; “AmericanIndian or Alaska Native”; “Asian Indian”; “Chinese”; “Filipino”; “Japanese”; “Korean”; “Vietnamese”;“Other Asian--Print race”; “Native Hawaiian”; “Guamanian or Chamorro”; “Samoan”; “Other Pacific
4
Iran Census Report: National Iranian American Council
www.niacouncil.org
1. The terms “Iranian” and “Iranian American” are used interchangeably throughout this document to denote individuals who registerwith the U.S. Census as being of Iranian ancestry.2. See short-form questionnaire at http://www.census.gov/dmd/www/pdf/d61a.pdf

Islander – Print race”; and “Some other race – Print race”. The confusion between race and ethnicity inthis question makes it unclear for Iranians whether to write in “Iranian” under the race category choiceof “Some other race — print race,” or to with some choose to mark “white” instead.3
Though the numbers of Iranian Americans reported in the census are most likely inaccurate in absoluteterms, the error tends to be systematic across different states and districts. Since the proportion of peo-ple failing to write in “Iranian” as their ancestry is randomly distributed, the error does not vary acrossthe nation.
The relative strength of the Iranian-American community is measured per Congressional district. Thisbreakup is particularly helpful when speaking to members of Congress, governors, and other electedofficials on behalf of the community. It is also a helpful guide for electing Iranian Americans to politicaloffice.
In order to know geog raphically where to focus the community’s political efforts, the relative strength ofthe Iranian-American community is first determined by state, and then by cong ressional district withineach state (See Tables 1 and 2). The numbers repor ted by the US Census represent the absolute mini-mum Iranian population for each district, but most likely, the figures are still inaccurate for the reasonspreviously mentioned.4
Findings
California
According to the US Census, the largest community of Iranian descent in the United Statesresides in California, concentrated in the Los Angeles and Beverly Hills area, with 159,016 resi-dents — a number g reater than the Iranian populations in the next 20 states combined. ThoughIranian residents in California are very affluent, much of it a result of technological firms in
Silicon Valley, this wealth has not yet been translated into political clout.
Though a relatively large number, it is important to note that Iranian Americans are only 0.469% of thegeneral population and are vastly outnumbered by the more sizeable Hispanic/Latino population(10,969,132, or 32.384% of the general population of California). A politically well-organized group,
5
Iran Census Report: National Iranian American Council
www.niacouncil.org
CA 159,016 Iranian-Americans 0.469% of the state’s population
3. There has been no major change in this question affecting Iranian Americans since the 1990 census, although changes have affectedother groups.4. Though projections of the actual population have been upwards of 1 million, without an informational source, it remains as speculation.Therefore, the numbers reported have not been corrected for estimated “actual” numbers, though it would be of interest to pay particularattention to districts where the numbers of the Iranian populations are close to those of other ethnic groups.

the Hispanic community has recently reached the ranking of the nation’s single largest minority group.
District 30 in California (Henry Waxman-D) has the single largest Iranian population in the nation,with 35,547 (5.557% of the general population of California). It is in this geography that Iranians arestrongest relative to their populations elsewhere in California. They outnumber all listed ethnic groupsand are closest in number to the Hispanic/Latino population (53,083). The sheer number of Iranianresidents in this area, combined with their affluence, makes it a prime target for political mobilization.These characteristics also mark District 48 (Christopher Cox-R), which has the next single largest pop-ulation of Iranians at 13,599 (2.129%).
District 27 (Brad Sherman-D) with 10,585 (1.658%), is the third most populous district, but Iranianshere are outnumbered by Armenians (17,421). District 15 (Michael Honda-D) with 6,631 (1.038%), isthe next most populous district, and may become even more effective if Honda — his family having beeninterned in a concentration camp during World War II — proves sensitive to ethnic discriminationagainst Iranians.
Besides District 30 (Henry Waxman-D), District 48 (Christopher Cox-R), and District 27 (BradSherman-D), all other populations of Iranians in California drop below 7,000 and average 2,000 perdistrict. The highest cong ressional district population of Armenian-Americans in California (District29, Adam Schiff-D) is about double the highest population of Iranian Americans in District 30.
Of the general population of Iranians in California, Armenians and Arabs outnumber Iranians, withArmenians numbering the highest (204,631). Iranians are outnumbered by at least two of the listedethnic groups in all of California’s districts except 9 (Barbara Lee-D), 10 (Ellen Tauscher-D), 12 (TomLantos-D), 14 (Anna Eshoo-D), 15 (Michael Honda-D), 16 (Zoe Lofgren-D), 30 (Henry Waxman-D),36 (Jane Harman-D), 46 (Dana Rohrabacher-R), and 48 (Christopher Cox-R). Iranians outnumber alllisted ethnic groups in Districts 10 (Ellen Tauscher-D), 14 (Anna Eshoo-D), 15 (Michael Honda-D), 16(Zoe Lofgren-D), 27 (Brad Sherman -D), 28 (Howard Berman-D), 30 (Henry Waxman-D), and 48(Christopher Cox-R).
New York
Ranking after California, New York's Iranian-American population is reported at 22,856.District 5 (Gary Ackerman-D) consists of the most Iranian Americans by far, with a popula-tion of 8,079 (1.235%). This is followed by District 9(Anthony Weiner-D) with 2,308(0.352%) and District 14 (Carolyn Maloney-D) with 1,994 0.305%). Besides District 2
(Steve Israel-D) and District 4 (Carolyn McCarthy-D), the populations drop below 1,000. Iranians are
6
Iran Census Report: National Iranian American Council
www.niacouncil.org
NY 22,856 Iranian Americans 0.120% of the state’s population

heavily outnumbered by Greeks in every district, most notably in District 5 (Gary Ackerman-D) andDistrict 14 (Carolyn Maloney-D), which contain the two single largest Greek populations in the state.There are also significant populations of Israelis in District 5 (2,267, Gary Ackerman-D) and District 9(1,243, Anthony Weiner-D). Iranians are outnumbered by at least two of the listed ethnic groups(mainly Greek, Arab, and Turkish) in every New York Congressional district.
Texas
Coming a close third, Texas reports 22,590 Iranian Americans. The two highest popula-tions in this state are in District 7 (3,944, 0.605%, John Culberson-R) and District 3(3,363, 0.516%, Sam Johnson-R). The next highest are District 32 (Pete Sessions, R) andDistrict 22(represented by the powerful House Majority Leader Tom Delay), with popula-
tions of 1,676 and 1,642,respectively. Other than District 10 (Lloyd Doggett-D) and District 26(Michael Burgess-R), the populations drop below 1,000, with six districts below 100. Iranians are out-numbered by Arabs in all of these districts, with the difference being the least in District 3 (SamJohnson-R, 0.819 Iranian to Arab ratio) and the most in District 7 (John Culberson, 0.470). Except forDistrict 24 (Martin Frost-D), Iranians are outnumbered by at least two of the listed ethnic groups,namely Greeks and Arabs.
Maryland
The state of Maryland's Iranian-American population is stated to be 12,935, mostlyconcentrated in Washington, DC's immediate suburbs. The highest single popula-tion in Maryland is in District 8 (Chris Van Hollen-D) with a population of 8,313
(1.204% of the general district population), exceeding the next two highest districts — District 2 (C.A.Ruppersberger-D) and District 3 (Benjamin Cardin-D) — by more than 7,000. District 8 is also the onlycongressional district in the country where Iranians outnumber all listed ethnic groups.
Virginia
Virginia reports 14,970, also concentrated in districts within the Washington, DCmetropolitan area. The three g reatest Iranian populations in Virginia are in District11 (Tom Davis-R, 5,278, 0.813%), District 10 (Frank Wolf-R, 4,822, 0.608%),
7
Iran Census Report: National Iranian American Council
www.niacouncil.org
MD 12,935 Iranian Americans 0.244% of the state’s population
VA 14,970 Iranian Americans 0.211% of the state’s population
TX 22,590 Iranian Americans 0.108% of the state’s population

and District 8 (Jim Moran-D, 2,514, 0.400%), with other districts averaging approximately 270. Arabsvastly outnumber Iranians in Districts 8 and 11 (with populations of 10,166 and 12,251, respectively),and Iranians are outnumbered by two or more listed ethnic groups in all districts except 10 and 11.
Washington
The state of Washington reports 6,351 Iranian Americans. The highest single popu-lation in the state of Washington is in District 1 (Jay Inslee-D) with 2,154, (0.341%of the population), followed by District 8 (Jennifer Dunn-R) with 1,520 (0.218%)and District 7 (Jim McDermott-D) with 781 (0.132%). However, Iranians are out-
numbered by at least two listed ethnic groups (Greek and Arabs) in all districts except District 8(Jennifer Dunn-R).
8
Iran Census Report: National Iranian American Council
www.niacouncil.org
WA 6,351 Iranian Americans 0.108% of the state’s population

Other StatesThe following are statistics on other states and districts where relatively large concentrations of IranianAmericans can be found (>=0.15%):
9
Iran Census Report: National Iranian American Council
www.niacouncil.org
Georgia - District 6 (Johnny Isakson-R): 2,701(0.429%); District 7 (John Linder-R): 1,172(0.186%). Outnumbered by Greeks and Arabs inDistrict 6 and slightly outnumbered by Arabs inDistrict 7.
Arizona - District 5 (J.D. Hayworth-R): 1,791(0.279%). Outnumbered by Greeks and Arabs.
Oregon - District 1 (David Wu-D): 2148(0.2148%). Outnumbered by Greeks and Arabs.
Illinois - District 9 (Janice Schakowsky-D): 1,319(0.202%); District 10 (Mark Kirk-R): 1,285,0.196%; District 13 (Judy Biggert-R): 1,056(0.162%). Outnumbered by Armenians, Greek s(heavily), and Arabs in Districts 9 and 10, and byGreeks (heavily) and Arabs in District 13. District9 has the single highest Greek population inIllinois.
Oklahoma - District 5 (Ernest Istook-R): 1,359(0.197%). Outnumbered by Arabs 2 to 1.
New Jersey - District 5 (Scott Gar rett-R):1,234 (0.194%); District 9 (Steven Rothman-D):1,329 (0.205%); District 11 (RodneyFrelinghuysen-R): 1,079 (0.162%). Outnumberedby Armenians, Greeks, and Israelis in District 5,by Armenians, Greeks, Arabs, Turks, and Israelisin District 9 and 11. The single largest Arab popu-lation in New Jersey resides in District 9(12,053).
Massachusetts - District 7 (Edward Markey-D): 1,053 (0.171%); District 8 (MichaelCapuano-D): 1,107 (0.178%). Heavily outnum-bered by Armenian, Greek, and Arabs in both dis-tricts, with Israelis and Turks very close to theIranian population in District 8.
Michigan - District 9 (Joseph Knollenberg-R):1,130 (0.170%). Heavily outnumbered byArmenians, Greeks, and Arabs in every district.Arabs outnumber Iranians in District 9 almost 11to 1.
Nevada - District 1 (Shelley Berkley-D): 1,474(0.157%). Outnumbered by Greeks and Arabs.
Kansas - District 3 (Dennis Moore-D): 1,204(0.164%). Outnumbered by Greeks and Arabs.
Florida - District 20 (Peter Deutsch-D): 1,004(0.157%). Outnumbered by Greeks, Arabs, Turks,and Israelis.

ConclusionThe following conclusions have been made based on the assumption that a low ratio of Iranians (<0.1%)to more than one listed ethnic group indicates a lack of political strength.
It is clear from the findings that the Iranian population of California has both the numbers and the per-centages needed to ef fectively project its voice in American politics. The Iranian population in 32 ofCalifornia's 53 districts exceeds 0.15%. In five districts, the population exceeds 1%.
New York is important in its overall population and district concentrations, with District 5 (GaryAckerman-D, Great Neck: 8,079) being one of the larger district populations in the nation.
While the Iranian population of Texas is very large, it is spread out across the state. Concentrations insix of its districts exceed 0.15%, with two exceeding 0.5%. Of those, Iranians are outnumbered only byArabs. The gap between the two populations is narrowest in District 3 (Sam Johnson-R), which also hasa fairly high proportion of Iranians to the general population (0.516%), and District 10 (Lloyd Doggett-D), where the Iranian population is able to exercise some political influence. Iranians in District 7(John Culberson-R) and District 22 (Tom DeLay-R) have high percentages (0.252% and 0.605%,respectively) and are outnumbered only by Arabs. It thus seems that Texas is second only to Californiain the number of Cong ressional districts prime for political mobilization, albeit to a lesser degree. It isimportant to discern the populations of South Asian Indians in these Congressional districts — mostnotably in the Houston area — to more accurately determine the relative political strength of Iranianpopulations in Texas.
Iranians in Maryland’s District 8 (Chris Van Hollen-D) could exercise considerable political powersince their numbers are among the highest in the nation and they outnumber all listed ethnic groups inthat district. Though Virginia boasts fairly high numbers as well, Iranians are outnumbered in the mostpopulous districts except for District 10 (Frank Wolf-R, 4,822, 0.608%), making that district prime forpolitical mobilization.
District 1 (Jay Inslee-D) and 8 (Jennifer Dunn-R) in Washington state have relatively small populationsbut high percentages (0.341% and 0.218%, respectively). District 8 displays the most political poten-tial because of the strength of the Iranian community relative to the other mentioned ethnic groups.However, the difference between the Arab and Greek populations is not great, so District 1 may alsobecome politically effective for Iranians.
Of the other states mentioned with low overall populations but high district concentrations, Georgia’sDistrict 7 (John Linder-R) seems to be the only district that can prove politically potent, claiming0.816% of the district population and only slightly outnumbered by Arabs.
1 0
Iran Census Report: National Iranian American Council
www.niacouncil.org

1) CA 0.469% 33,871,648 159,016 27) MO 0.041% 5,595,211 2,267
2) MD 0.244% 5,296,486 12,935 28) NH 0.040% 1,235,786 491
3) VA 0.211% 7,078,515 14,970 29) KY 0.039% 4,041,769 1,581
4) DC 0.130% 572, 059 746 30) PA 0.038% 12,281,054 4,657
5) NY 0.120% 18,976,457 22,856 31) NC 0.037% 8,049,313 3,000
6) TX 0.108% 20,851,820 22,590 32) OH 0.035% 11,353,140 3,927
7) WA 0.108% 5,894,121 6,351 33) WI 0.034% 5,363,675 1,823
8) OR 0.103% 3,421,399 3,538 34) NE 0.033% 1,711,263 561
9) NV 0.101% 2,663,602 2,702 35) HI 0.030% 1,211,537 363
10) NJ 0.093% 8,414,350 7,790 36) SD 0.027% 754,844 201
11) MA 0.091% 6,349,097 5,764 37) LA 0.026% 4,468,976 1,180
12) CO 0.087% 4,301,261 3,738 38) ND 0.025% 642,200 161
13) AZ 0.082% 5,130,632 4,222 39) IN 0.024% 6,080,485 1,476
14) OK 0.081% 3,450,654 2,798 40) AL 0.024% 4,447,100 1,069
15) GA 0.078% 8,186,453 6,377 41) AR 0.023% 2,673,400 616
16) KS 0.075% 2,688,418 2,004 42) VT 0.023% 608.827 139
17) CT 0.071% 3,405,565 2,428 43) ID 0.021% 1,293,953 272
18) UT 0.068% 2,233,169 1,526 44) MS 0.021% 2,844,658 588
19) IL 0.066% 12,419,293 8,184 45) WV 0.021% 1,808,344 374
20) FL 0.060% 15,982,378 9,625 46) SC 0.020% 4,012,012 802
21) NM 0.057% 1,819,046 1,039 47) ME 0.018% 1,274,923 228
22) MN 0.051% 4,919,479 2,500 48) AK 0.012% 626, 932 70
23) MI 0.047% 9,938,444 4,673 49) WY 0.012% 493,782 57
24) DE 0.047% 783,600 372 50) MT 0.008% 902,195 74
25) RI 0.046% 1,048,319 485 51) PR 0.0001% 3,808,610 56
26) TN 0.042% 5,689,283 2,362
1 1
Iran Census Report: National Iranian American Council
www.niacouncil.org
State
Table 1 (In Order of Percentage)
Pop. ofIranianDescent
TotalPopulation
Populationof IranianDescent
State Pop. ofIranianDescent
TotalPopulation
Populationof IranianDescent

1 2
Iran Census Report: National Iranian American Council
www.niacouncil.org
Table 2 (In Order of Population)
California 159,016 Kentucky 1,581
New York 22,856 Utah 1,526
Texas 22,590 Indiana 1,476
Virginia 14,970 Louisiana 1,180
Maryland 12,935 Alabama 1,069
Florida 9,625 New Mexico 1,039
Illinois 8,184 South Carolina 802
New Jersey 7,790 Washington, DC 746
Georgia 6,377 Arkansas 616
Washington 6,351 Mississippi 588
Massachusetts 5,764 Nebraska 561
Michigan 4,673 New Hampshire 491
Pennsylvania 4,657 Rhode Island 485
Arizona 4,222 West Virginia 374
Ohio 3,927 Delaware 372
Colorado 3,738 Hawaii 363
Oregon 3,538 Idaho 272
North Carolina 3,000 Maine 228
Oklahoma 2,798 South Dakota 201
Nevada 2,702 North Dakota 161
Minnesota 2,500 Vermont 139
Connecticut 2,428 Montana 74
Tennessee 2,362 Alaska 70
Missouri 2,267 Wyoming 57
Kansas 2,004 Puerto Rico 56
Wisconsin 1,823
State Populationof IranianDescent
State Populationof IranianDescent

Iranian Total Rel to Armenian Greek Arab Turkish Israeli Popul. Popul. pop. ratio ratio ratio ratio ratio
ArizonaDistrict 5 J.D. Hayworth R 1,791 641,348 0.279% 2.05 0.57 0.47 3.89 5.02
CaliforniaDistrict 3 Doug Ose R 2,408 639,374 0.377% 1.38 0.64 0.86 12.61 11.98
District 23 Lois Capps D 1,242 638,854 0.194% 1.12 0.68 0.60 4.10 5.15
District 24 Elton Gallegly R 2,506 639,060 0.392% 1.71 0.83 0.76 12.11 4.47
District 26 David Dreier R 2,649 639,913 0.414% 0.51 1.06 0.33 7.50 18.02,
District 27 Brad Sherman D 10585 638,532 1.658% 0.61 3.78 1.23 18.57 3.12
District 30 Henry A. Waxman D 35,547 639,700 5.557% 7.09 7.72 4.62 27.34 6.52
District 36 Jane Harman D 5,248 639,168 0.821% 2.47 1.56 0.99 8.89 6.02
District 40 Ed Royce R 2,230 638,671 0.349% 1.37 0.87 0.36 14.58 18.90
District 42 Gary G. Miller R 5,462 640,090 0.853% 2.02 1.78 0.85 21.50 23.34
District 46 Dana Rohrabacher R 4,199 639,245 0.657% 1.78 1.14 0.67 6.03 7.62
District 48 Christopher Cox R 13,599 638,848 2.129% 4.93 3.76 1.96 20.39 28.69
District 50 Randy Cunningham R 4,153 639,437 0.649% 3.47 1.15 0.94 6.09 6.51
District 52 Duncan Hunter R 2,565 639,329 0.401% 2.78 0.74 0.34 8.22 9.29
District 53 Susan A. Davis D 2,308 638,703 0.361% 2.22 0.78 0.64 5.86 6.04
GeorgiaDistrict 6 Johnny Isakson R 2,701 630,087 0.429% 3.81 0.57 0.56 3.31 7.44
District 7 John Linder R 1,172 629,851 0.186% 11.16 1.06 0.96 9.85 11.96
MarylandDistrict 8 Chris Van Hollen, Jr. D 8,313 690,698 1.204% 5.10 1.12 1.26 6.85 4.24
New YorkDistrict 5 Gary L. Ackerman D 8,079 654,253 1.235% 3.66 0.46 2.21 6.28 3.62
OregonDistrict 1 David Wu D 2,148 743,388 0.289% 3.49 0.83 0.63 4.25 12.79
TexasDistrict 32 Pete Sessions R 1676 652,266 0.257% 6.12 0.94 0.38 5.11 2.95
VirginiaDistrict 8 James P. Moran D 2,514 627,723 0.400% 2.66 0.64 0.25 2.13 21.49
District 10 Frank R. Wolf R 4,822 792,605 0.608% 5.83 1.22 0.83 6.53 65.16
District 11 Thomas M. Davis III R 5,278 649,477 0.813% 6.12 1.31 0.43 5.37 34.95
WashingtonDistrict 1 Jay Inslee D 2,154 632,282 0.341% 2.30 0.78 0.82 6.14 7.58
District 8 Jennifer Dunn R 1,520 695,709 0.218% 2.00 0.61 1.09 3.20 6.01
1 3
Iran Census Report: National Iranian American Council
www.niacouncil.org
Table 3: Hot Seats

Revised US Census Data – Presenting a hypothetical situation
As previously stated, the reported numbers for the Iranian population are most likely far lower thanthe actual population. Although it is widely believed that the Iranian-American population numbersno less than 1 million nationwide, the Census only reports a figure of approximately 330,000, aslittle as a third of the most commonly quoted figure.
If it is true that the community is three times, or at least twice, the amount reported by the census,what does it mean in terms of political influence? To answer that, we have made the assumptionsthat the error in the US Census has 1) only affected the Iranian-American community and 2) onlycounted one out of every two Iranian Americans. Thus, in this hypothetical case, we have revised thedata by increasing the number of Iranian Americans in each Congressional district by a factor oftwo. The revised figures give us an idea of what the relative strength of the community may be, givenan underestimation of the Iranian-American population resulting from one out of two IranianAmericans failing to register themselves as individuals of Iranian descent.
It should be very clear, however, that the following is just a hypothetical case. Although there arestrong suspicions that the US Census data is flawed, there is no evidence that our revision of thedata is more accurate. However, we present this hypothetical situation in order to emphasize thenecessity of having accurate statistics on the size and strength of the Iranian-American community.
FINDINGSAssuming revisions of the census data by amultiplier of two, Arizona’s District 5 (J.D.Hayworth-R) emerges as a potentially viabledistrict with an Iranian-American populationof 0.559%, outnumbered only by ArabAmericans.
Of California’s eighteen districts with politicalpotential, thirteen rank above their earlieranalysis in the study. In District 3, RepublicanCongressman Doug Ose represents anIranian-American population measuring0.753% of the district’s total population,leading all other ethnic groups in this study.Iranians also lead in size in District 23 (Lois
1 4
Iran Census Report: National Iranian American Council
www.niacouncil.org
NIAC will launch a public education campaign
aimed at achieving a more accurate account-
ing of the Iranian-American community by the
2010 US Census. Absent a revision of the
census form to include “Iranian”, NIAC will
encourage all Iranian Americans to write in
their ethnicity on the forms.
An accurate census population report will
enable Iranian Americans to realize the impor-
tance of their numbers, and tap their potential
to mobilize politically. NIAC is currently seek-
ing funding to conduct a more comprehensive
census that will rectify the flaws that currently
exist in the US Census data.
NIAC Public Education Campaign

Capps-D, 0.389%,) District 24 (Elton Gallegly-R, 0.784%,), District 42 (G. Miller-R, 1.707%),District 50 (Randy Cunningham-R, 1.299%), and District 53 (Susan A. Davis-D, 0.723%).
In District 8, represented by House Minority leader Nancy Pelosi, Iranian Americans constitute0.373% of the district population and are outnumbered by Greeks and Arabs. In District 19(George P. Radanovich-R), Iranians are outnumbered by Armenians only and measure 0.449% ofthe district population. Iranian Americans are outnumbered by Armenians only in District 25(Howard McKeon-R, 0.582%) and by Arabs in District 26 (David Dreier-R, 0.828%), District 40(Ed Royce-R, 0.698%), District 44 (Ken Calvert-R, 0.439%) and District 52 (Duncan Hunter-R,0.802%). Statewide, Iranian Americans are very strong in California, constituting 1.749% of thestate’s total population; Iranians are not outnumbered by any other ethnic groups included in thisstudy.
Iranian Americans are also very strong in the state of Maryland, amounting to 0.488% of its popula-tion, outnumbered only by Greeks. As mentioned earlier, District 8 (Chris Van Hollen, Jr.-D) holdsthe vast majority of the Iranian-American population in the state, amounting to 2.407% of the dis-trict population, outnumbered by no other ethnic groups in the study.
The Iranian population is stronger in Virginia, with 1.219% of the state population, but is outnum-bered there by Arab Americans. Although the Iranian population in the state of Washington(0.553% of state population) is smaller than that of Virginia, it is stronger in relative terms since noother ethnic group there outnumbers it statewide. Iranian-Americans are strong in both District 1(Jay Inslee-D) and District 8 (Jennifer Dunn-R) with 0.681% and 0.437% of the district popula-tion, respectively. No other ethnic group in this study outnumbers Iranians in these two districts.
In Georgia, revised data does not result in the emergence of any new politically ripe districts, butleaves Iranian Americans in District 6 (Johnny Isakson-R) and District 7 (John Linder-R) unchal-lenged by the other ethnic groups in this study. The same is true for Oregon’s District 1 (DavidWu-D).
However, revisions in the data cause Oklahoma’s District 5 (Ernest Istook, Jr.-R) to emerge as apotentially ripe district with a population ratio of 0.394%, outnumbered only by Arabs.
1 5
Iran Census Report: National Iranian American Council
www.niacouncil.org

Donation and Membership Form
NIAC receives all its financial support from private Iranian-American donors, Iranian-Americanbusinesses and American foundations. We need your support to continue to serve the interests ofthe Iranian-American community and to conduct a comprehensive study on the relative concentra-tion of Iranian Americans across the United States. Such a study will entail information on the exactnumbers of Iranian Americans in each congressional district in relation to other key ethnic minori-ties such as Armenians, Arabs and Jewish Americans, as well as data on educational levels andincome.
Please make a tax-deductible contribution towards NIAC’s activities using the form below.
ENCLOSED IS MY TAX-DEDUCTIBLE GIFT OF:
____ $250 ____ $500 ____ $750 ____ $1,000 ____ $1,500 ____ $2500 ____ $5000
$______other amount
MEMBERSHIP FEE:____ Standard membership $40/year ____ Senate Club $40/month
____ Congressional Club $250/year ____ President’s Club $1,000
NAME
MAILING ADDRESS
CITY: STATE ZIP
TEL FAX
Please mail completed form with check to: NIAC, 2451 18th St. NW, 2nd Fl, Washington DC 20009