Embed Size (px)
Citation preview
Rational Bureau of Standards
ybrary. E-01 Admin. Bldg. l^r.^
APR 2 3 1971
BUILDING SCIENCE SERIES 34
Strength
of Masonry Walls
Under Compressive andTransverse Loads
The Building Science Series
The Building Science Series disseminates technical information developed at the National Bureau of Standards on
building materials, components, systems and whole structures. The Series presents research results, test methods and per-
formance criteria related to the structural and environmental functions and the durability and safety characteristics of
building elements and systems.
These publications, similar in style and content to the NBS Building Materials and Structures Reports (1938-59), are
directed toward the manufacturing, design, construction and research segments of the building industry, standards orga-
nizations and officials responsible for building codes.
The material for this Series originates principally in the Building Research Division of the XBS Institute for Applied
Technology. The publications are divided into three general groups: Building Systems and Processes: Health. Safety and
Comfort; and Structures and Materials. Listed below are other publications in the category of—
Structures and Materials
• Interrelations Between,Cement md Concrete Properties: Part 1, Materials and Techniques. \^'ater Requirements and
Trace ttements. (C13.29/2:2) 35 cents
• Weather Resistance of Porcelain Enamels: Effect of Exposure Site and Other \ ariables After Seven Years. (C13. 29/2:4)
20 cents
• Interrelations Between Cement and Concrete Properties: Part 2. Sulfate Expansion. Heat of Hydration, and Autoclave
Expansion. (CIS.29/2:5) 35 cents
• Some Properties of the Calcium .\luminoferrite Hydrates. (C13.29/2:6) 20 cents
• Organic Coatings. Properties, Selection, and Use. (Cl3.29/2:7) S2.50
• Interrelations Between Cement and Concrete Properties: Part 3. Compressive Strengths of Portland Cement Test
Mortars and Steam-Cured Mortars. (C13.29/2:8) 55 cents
• Thermal-Shock Resistance for Built-Up Membranes (Cl3.29/2:9) 20 cents
• Shrinkage and Creep in Prestressed Concrete. (C13.29/2:13) 15 cents
• Experimental Determination of Eccentricity of Floor Loads Applied to a Bearing Wall. (C 13.29/2: 14) 15 cents
• Interrelations Between Cement and Concrete Properties: Part 4. Shrinkage of Hardened Portland Cement Pastes.
(C13.29/2:15) 75 cents
• Causes of Variation in Chemical Analyses and Physical Tests of Portland Cement. (C13.29/2:17) 40 cents
• A Study of the Variables Involved in the Saturating of Roofing Felts. (C13.29/2:19) 30 cents
• Proceedings of a Seminar on the Durability of Insulating Glass. (C 13.29/2:20) 75 cents
• Hail Resistance of Roofing Products. (013.29/2:23) 25 cents
• Natural Weathering of Mineral Stabilized Asphalt Coatings on Organic Felt. (C 13.29/2:24) 30 cents
• Structural Performance Test of a Building System. iC 13.29/2:25) S1.25
• Exploratory Studies of Early Strength Development in Portland Cement Pastes and Mortars. (013.29/2:28) 25 cents
• 1964 Exposure Test of Porcelain Enamels on Aluminum— Three Year Inspection. (013.29/2.29) 25 cents
• Flexural Behavior of Prestressed Concrete Composite Tee— Beams (013.29/2:31) 25 cents
• Compressive Strength of Slender Concrete Masonry \^ aUs (013.29/2:33) 40 cents
Send orders (use Superintendent of Documents Catalog Nos.) with remittance to: Superintendent of Documents.
L".S. Government Printing Office, Washington, D.C. 20402. Remittance from foreign countries
should include an additionsd one-fourth of the purchase price for postage.
[See mailing list announcement on last page.]
UNITED STATES DEPARTMENT OF COMMERCE • Maurice H. Stans, Secretary
NATIONAL BUREAU OF STANDARDS • Lewis M. Branscomb, Director
Strength of Masonry Walls
Under Compressive and Transverse Loads
F. Y. Yokel, R. G. Mathey, and R. D. Dikkers
Building Research DivisionInstitute for Applied TechnologyNational Bureau of StandardsWashington, D.C. 20234
Building Science Series 34.'
Nat. Bur. Stand. (U.S.), Bldg. Sci. Ser. 34, 74 pages (Mar. 1971)CODEN: BSSNB
Issued March 1971
For sale by the Superintendent of Documents, U.S. Government Printing Office
Washington, D.C. 20402 (Order by SD Catalog No. C 13.29/2:34). Price 70 cents
MAY 7 km
The contents of this report are not to be used for advertising or promotional purposes. Citation of
proprietary products does not constitute an official endorsement or approval by the National Bureau of
Standards for the use of such commercial products.
Library of Congress Catalog Card Number: 77-608986
ContentsPage
List of symbols V
SI conversion units VI
Abstract 1
1. Introduction and objective 1
2. Scope 1
3. Materials 2
3.1. Brick 2
3.2. Concrete masonry units 2
3.3. Mortar 3
4. Test specimens 3
4.1. Description of walls 3
4.2. Fabrication of walls 6
4.3. Description and fabrication of prisms 6
5. Testing procedures 7
5.1. WaU tests 7
5.2. Instrumentation for wall tests 8
5.3. Prism tests 9
5.4. Instrumentation for prism tests 9
6. Test results 9
6.1. Wall test results 9
6.2. Description of wall failures 13
6.3. Prism test results 21
7. Theoretical discussion 23
7.1. Introduction 23
7.2. Interaction between vertical loads and moments 23
7.2.1. General discussion "23
7.2.2. Cross-sectional moment capacity. 25
7.2.2.1. Solid prismatic sections 25
7.2.2.2. Symmetrical hollow sections 29
7.2.2.3. Asymmetric sections 30
7.3. Slenderness effects 32
8. Analysis of test results 35
8.1. Introduction 35
8.2. Stress-strain relationships 35
8.3. Cross-sectional capacity 35
8.4. Wall strength 38
8.4.1. General discussion of the test conditions 38
8.4.2. Concrete block walls 39
8.4.2.1. 8-in hollow concrete block walls 39
8.4.2.2. 8-in solid concrete block walls 43
8.4.2.3. Conclusions 44
8.4.3. Brick walls 44
8.4.3.1. Comparison of brick wall systems 44
8.4.3.2. Correlation of test results with theory 48
8.4.3.3. Conclusions 51
8.4.4. Cavity and composite walls 51
8.4.4.1. Comparative strength of walls 51
III
Page
8.4.4.2. 4-2-4-in cavity walls of hollow concrete block 52
8.4.4.3. 4-2-4-in cavity walls of brick and hollow concrete block 54
8.4.4.4. 8-in composite brick and hollow concrete block walls 58
8.4.4.5. Conclusions 60
9. Recommendations and discussion of present design practice 61
9.1. Determination of transverse strength of masonry walls 61
9.2. Discussion of present design practice 62
9.2.1. ANSI building code requirements 62
9.2.2. SCPI standard for engineered brick masonry 63
9.2.3. NCMA and ACT recommendations 65
9.3. Recommended research 66
10. Summary 67
10.1. Conclusions from test results 67
10.2. Comparison of test results with existing design practice 67
11. Acknowledgment 68
12. References 68
IV
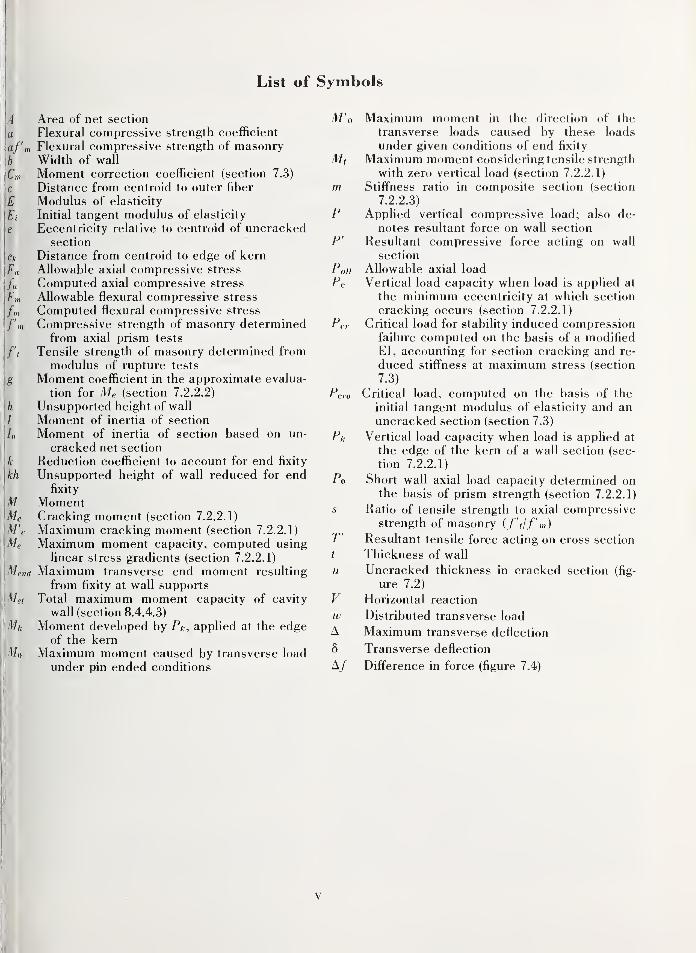
List of Symbols
A Area of net section
a Flexural compressive strength coefficient
af'm Flexural compressive strength of masonry
b Width of wall
Cm Moment correction coefficient (section 7.3)
c Distance from centroid to outer fiber
E Modulus of elasticity
Ei Initial tangent modulus of elasticity
e Eccentricity relative to centroid of uncrackedsection
ca- Distance from centroid to edge of kern
Fa Allowable axial compressive stress
fa Computed axial compressive stress
Fm Allowable flexural compressive stress
/,„ Computed flexural compressive stress
f'm Compressive strength of masonry determinedfrom axial prism tests
/'( Tensile strength of masonry determined frommodulus of rupture tests
g Moment coefficient in the approximate evalua-
tion for Me (section 7.2.2.2)
Ti Unsupported height of wall
/ Moment of inertia of section
/„ Moment of inertia of section based on un-
cracked net section
k Reduction coefficient to account for end fixity
kh Unsupported height of wall reduced for endfixity
M MomentMc Cracking moment (section 7.2.2.1)
M'c Maximum cracking moment (section 7.2.2.1)
Me Maximum moment capacity, computed using
linear stress gradients (section 7.2.2.1)
Mend Maximum transverse end moment resulting
from fixity at wall supports
Met Total maximum moment capacity of cavity
wall (section 8.4.4.3)
Mk Moment developed by Pk, applied at the edgeof the kern
Mo Maximum moment caused by transverse load
under pin ended conditions
M'o Maximum moment in the direction of the
transverse loads caused by these loads
under given conditions of end fixity
Ml Maximum moment considering tensile strength
with zero vertical load (section 7.2.2.1)
m Stiffness ratio in composite section (section
7.2.2.3)
P Applied vertical compressive load; also de-
notes resultant force on wall section
P' Resultant compressive force acting on wall
section
Pall Allowable axial load
Pc Vertical load capacity when load is applied at
the minimum eccentricity at which section
cracking occurs (section 7.2.2.1)
Per Critical load for stability induced compressionfailure computed on the basis of a modified
EI, accounting for section cracking and re-
duced stiffness at maximum stress (section
7.3)
Pcro Critical load, computed on the basis of the
initial tangent modulus of elasticity and anuncracked section (section 7.3)
Pk Vertical load capacity when load is applied at
the edge of the kern of a wall section (sec-
tion 7.2.2.1)
P0 Short wall axial load capacity determined onthe basis of prism strength (section 7.2.2.1)
s Ratio of tensile strength to axial compressivestrength of masonry (f'tlf'm)
T' Resultant tensile force acting on cross section
t Thickness of wall
u Uncracked thickness in cracked section (fig-
ure 7.2)
V Horizontal reaction
w Distributed transverse load
A Maximum transverse deflection
8 Transverse deflection
A/ Difference in force (figure 7.4)
V
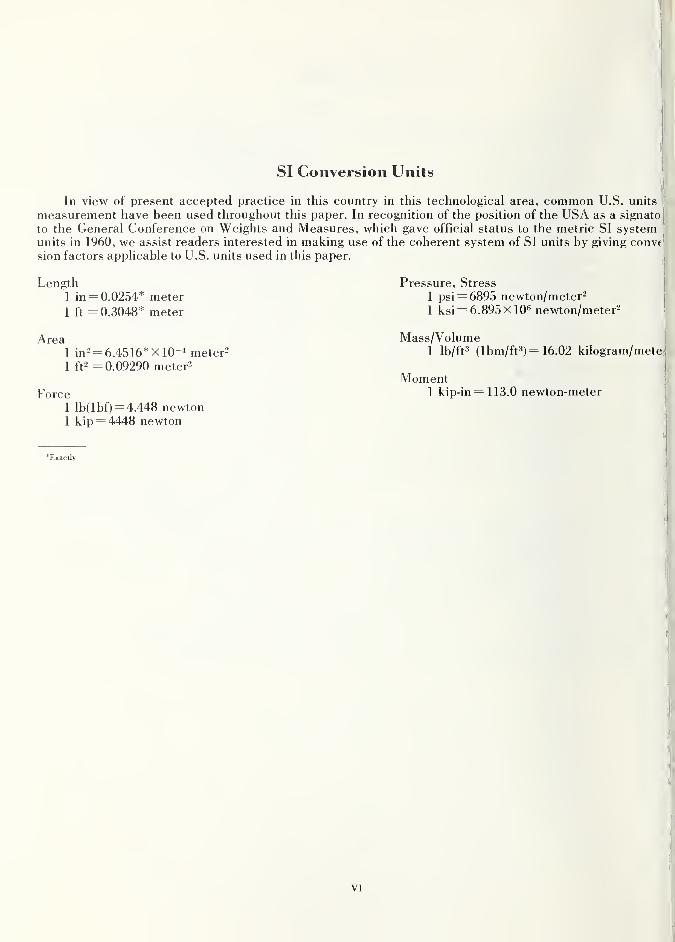
SI Conversion Units
In view of present accepted practice in this country in this technological area, common U.S. units
measurement have been used throughout this paper. In recognition of the position of the USA as a signato
to the General Conference on Weights and Measures, which gave official status to the metric SI systemunits in 1960, we assist readers interested in making use of the coherent system of SI units by giving convf
sion factors applicable to U.S. units used in this paper.
Length1 in = 0.0254*
1 ft = 0.3048* meter
meterPressure, Stress
1 psi = 6895 newton/meter-1 ksi = 6.895X10⁶ newton/meter^
Area1 in2 = 6.4516* X 10-^ meter-'
1 ft- =0.09290 meter^
Mass/Volume1 lb/ft3 (lbm/ft3) = 16.02 kilogram/mete
MomentForce 1 kip-in = 113.0 newton-meter
1 lb(lbf) = 4.448 newton1 kip = 4448 newton
'Exactly
VI
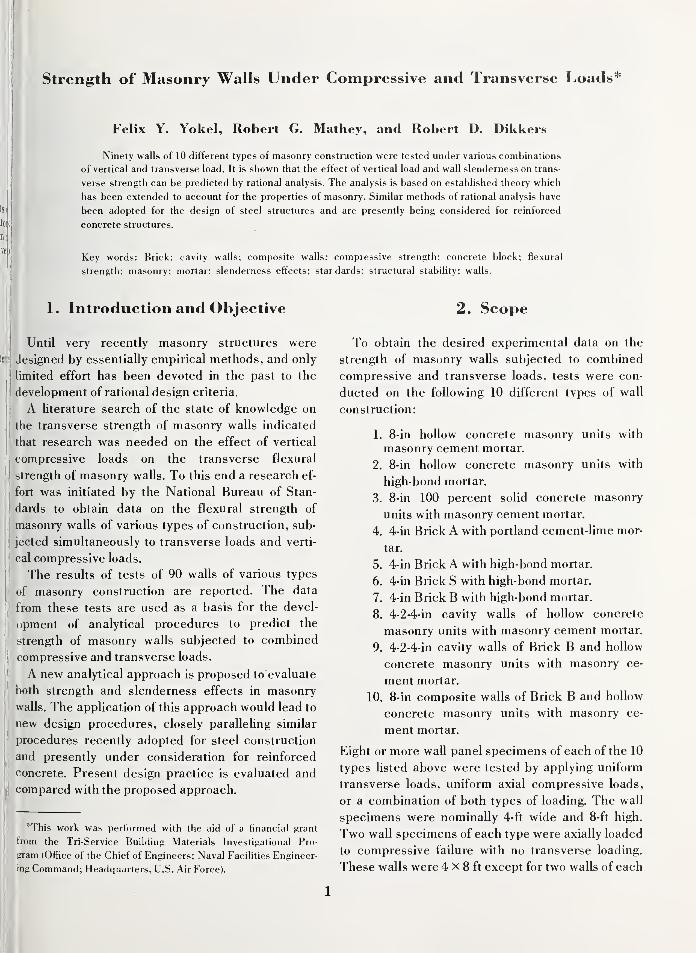
Strength of Masonry Walls Under Compressive and Transverse Loads
Felix Y. Yokel, Robert G. Mathey, and Robert D. Dikkers
Ninety walls of 10 different types of masonry construction were tested under various combinations
of vertical and transverse load. It is shown that the effect of vertical load and wall slenderness on trans-
verse strength can be predicted by rational analysis. The analysis is based on established theory which
has been extended to account for the properties of masonry. Similar methods of rational analysis have
been adopted for the design of steel structures and are presently being considered for reinforced
concrete structures.
Key words: Brick; cavity walls; composite walls; compressive strength; concrete block; flexural
strength; masonry; mortar; slenderness effects; star dards; structural stability; walls.
1. Introduction and Objective
Until very recently masonry structures were
designed by essentially empirical methods, and only
limited effort has been devoted in the past to the
development of rational design criteria.
A literature search of the state of knowledge on
the transverse strength of masonry walls indicated
that research was needed on the effect of vertical
compressive loads on the transverse flexural
strength of masonry walls. To this end a research ef-
fort was initiated by the National Bureau of Stan-
dards to obtain data on the flexural strength of
masonry walls of various types of construction, sub-
jected simultaneously to transverse loads and verti-
cal compressive loads.
The results of tests of 90 walls of various types
of masonry construction are reported. The data
|i from these tests are used as a basis for the devel-
i
opment of analytical procedures to predict the
' strength of masonry walls subjected to combined
< ompressive and transverse loads.
A new analytical approach is proposed to evaluate
both strength and slenderness effects in masonry
walls. The application of this approach would lead to
new design procedures, closely paralleling similar
procedures recently adopted for steel construction
and presently under consideration for reinforced
concrete. Present design practice is evaluated and' compared with the proposed approach.
*This work was performed with the aid of a financial grant
from the Tri-Service Building Materials Investigational Pro-
gram (Office of the Chief of Engineers; Naval Facilities Engineer-
ing Command; Headquarters, U.S. Air Force).
2. Scope
To obtain the desired experimental data on the
strength of masonry walls subjected to combined
compressive and transverse loads, tests were con-
ducted on the following 10 different tvpes of wall
construction:
1. 8-in hollow concrete masonry units with
masonry cement mortar.
2. 8-in hoUow concrete masonry units with
high-bond mortar.
3. 8-in 100 percent solid concrete masonry
units with masonry cement mortar.
4. 4-in Brick A with portland cement-lime mor-
tar.
5. 4-in Brick A with high-bond mortar.
6. 4-in Brick S with high-bond mortar.
7. 4-in Brick B with high-bond mortar.
8. 4-2-4-in cavity walls of hollow concrete
masonry units with masonry cement mortar.
9. 4-2-4-in cavity walls of Brick B and hollow
concrete masonry units with masonry ce-
ment mortar.
10. 8-in composite walls of Brick B and hollow
concrete masonry units with masonry ce-
ment mortar.
Eight or more wall panel specimens of each of the 10
types listed above were tested by applying uniform
transverse loads, uniform axial compressive loads,
or a combination of both types of loading. The wall
specimens were nominally 4-ft wide and 8-ft high.
Two wall specimens of each type were axially loaded
to compressive failure with no transverse loading.
These walls were 4 X 8 ft except for two walls of each
1
of the 4 types of brick walls given in the preceding
list, which were nominally 2-ft wide and 8-ft high.
The capacity of the testing machine used in the tests
was not sufficient to develop the compressive
strength of 4 X 8-ft brick wall panels.
For the 10 wall systems listed above, companion
prism specimens were constructed. These prisms
were tested to determine their strength in compres-
sion and in flexure.
In the subsequent analysis in section 8, wall panel
strength is compared to prism strength. The data
from both the wall and prism tests are used to
develop analytical methods for the determination of
the transverse strength of various types of masonry
wall construction.
The conclusions from this investigation are com-
pared with present design practice in section 9.
3. Materials
All materials used in the wall panel construction
were available commercially and were representa-
tive of those commonly used in building construc-
tion.
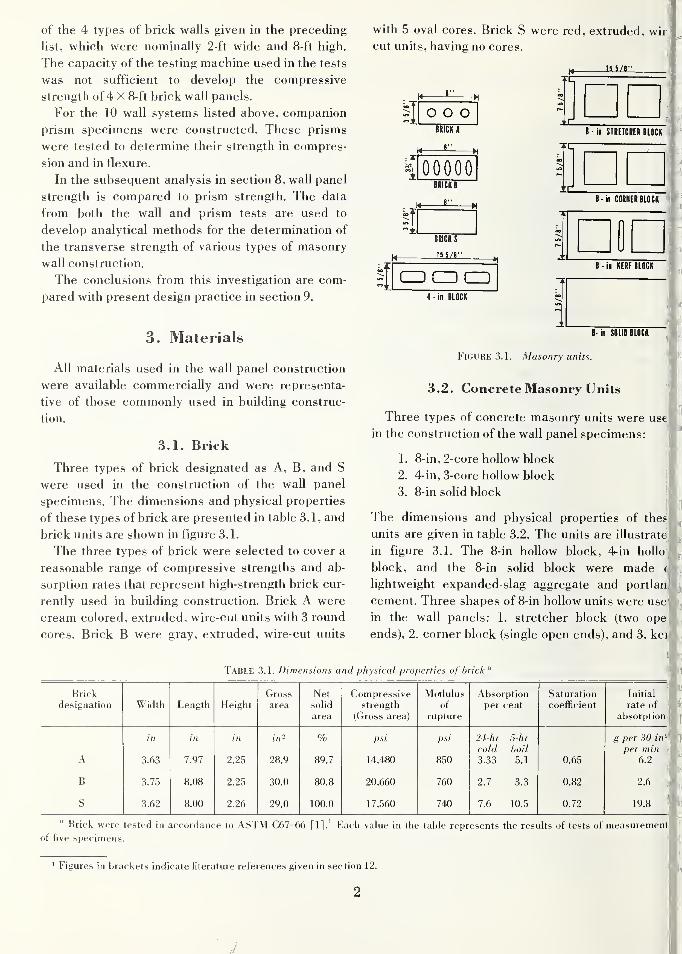
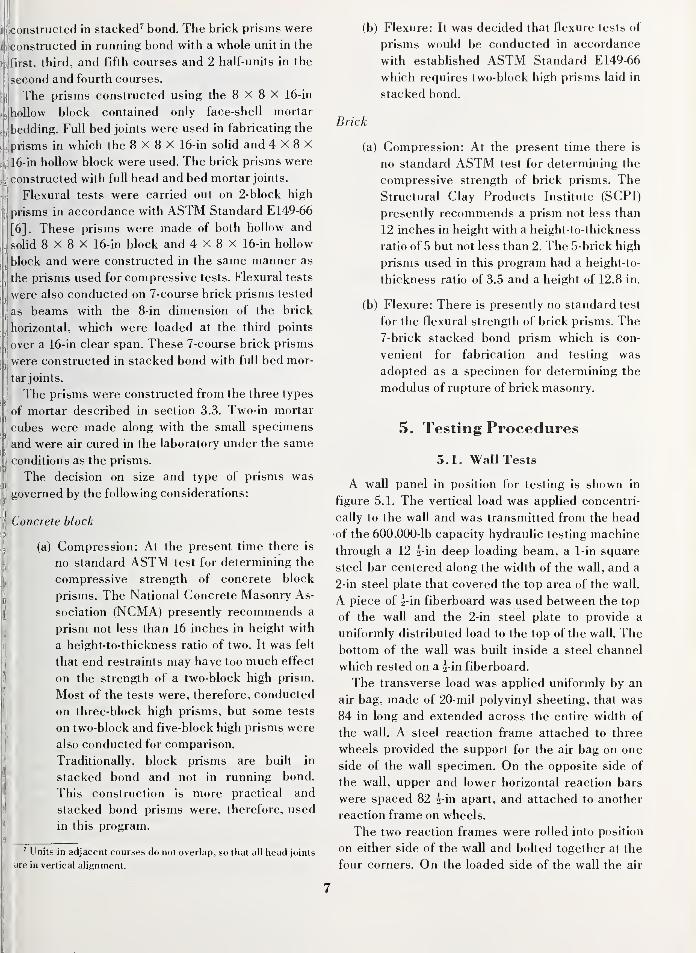
3.1. Brick
Three types of brick designated as A, B, and S
were used in the construction of the wall panel
specimens. The dimensions and physical properties
of these types of brick are presented in table 3.1, and
brick units are shown in figure 3.1.
The three types of brick were selected to cover a
reasonable range of compressive strengths and ab-
sorption rates that represent high-strength brick cur-
rently used in building construction. Brick A were
cream colored, extruded, wire-cut units with 3 round
cores. Brick B were gray, extruded, wire-cut units
with 5 oval cores. Brick S were red, extruded, wir
cut units, having no cores.
15 5/8"
o o oBUCK (
K '"
h
id' in STRETCHED BISCK
lloooooBUCK I
8' in CORNER BLOCK
iis
BRICKS
15 5/8"
CD CD CIDe in KERF BLOCK
4 in BLOCK
:i
I
III
k
1
8- in SOLID BLOCK
Figure 3.1. Masonry units. '
3.2. Concrete Masonry Units ['
Three types of concrete masonry units were use
in the construction of the wall panel specimens:^
1. 8-in, 2-core hollow block
2. 4-in, 3-core hollow block
3. 8-in solid block
The dimensions and physical properties of thes
units are given in table 3.2. The units are illustrate
in figure 3.1. The 8-in hollow block, 4-in hollo
block, and the 8-in solid block were made c
lightweight expanded-slag aggregate and portlan|
cement. Three shapes of 8-in hollow units were use
in the wall panels: 1. stretcher block (two ope
ends), 2. corner block (single open ends), and 3. ke\
Table 3.1. Dimensions and physical properties oj brick '
Brick Gross Net Compressive Motlulus Absorption Saturation!
Initial
designation Width Length Height area sohd strength of per cent coefficient rate of 1-
area (Gross area) rupture absorption
in in in in- % psi psi 24 -hr 5-hr g per 30 ira^
cold boil per min\
A 3.63 7.97 2.25 28.9 89.7 14,480 850 3.33 5.1 0.65 6.2s
B 3.75 8.08 2.25 30.0 80.8 20,660 760 2.7 3.3 0.82 2.6j
S 3.62 8.00 2.26 29.0 100.0 17,560 740 7.6 10.5 0.72 19.8 ^
9
if
i
Brick were tested in accordance to ASTM C67-66 [1].' Each value in the table represents the results of tests of measuremenl
of five specimens. <
' Figures in brackets indicate literature references given in sec tion 12.
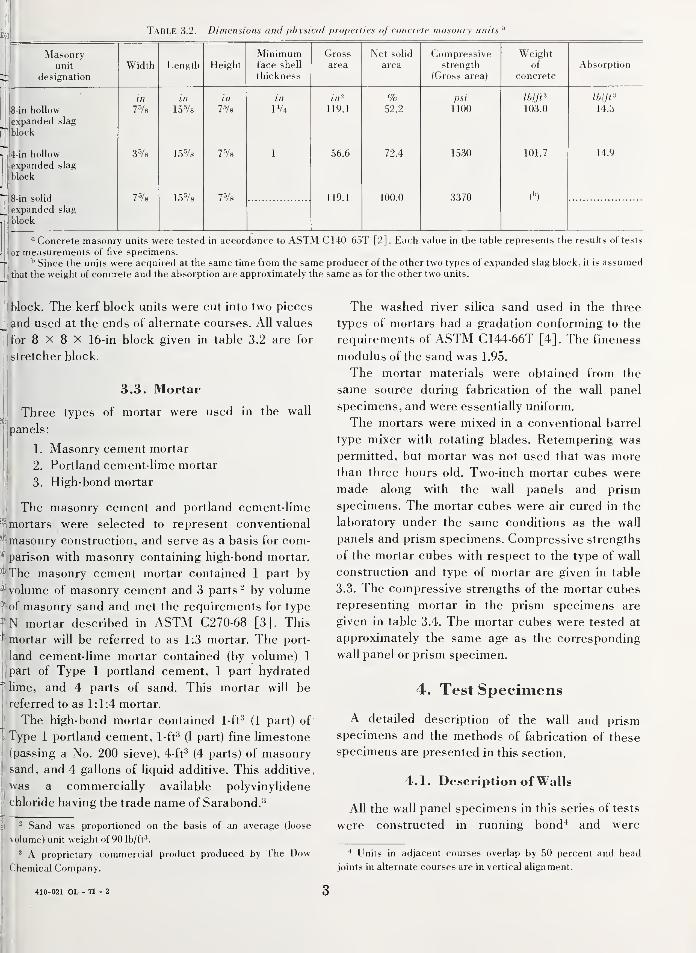
Table 3.2. Dimensions and physical properties of concrete masonry units '
Masonryunit
designation
Width ?th Height
Minimumface shell
thickness
Grossarea
Net solid
area
Compressivestrength
(Gross area)
Weightof
concrete
Absorption
in hollow
expanded slag
[Tlblock
jj4-in hollow
jexpanded slag
I block
^Is-in solid
Jexpanded slag
,1 block
75/8
3-V8
75/8
mI5S/8
15-^8
15=/8
in
7^8
75/8
r/4
in-
119.1
56.6
119.1
%.52.2
72.4
100.0
psi
1100
1.530
3370
103.0
101.7
14.3
14.9
(")
" Concrete masonry units were tested in accordance to ASTM C140-65T [2]. Each value in the table represents the results of tests
or measurements of five specimens.'' Since the units were acquired at the same time from the same producer of the other two types of expanded slag block, it is assumed
that the weight of concrete and the absorption are approximately the same as for the other two units.
block. The kerf block units were cut into two pieces
jand used at the ends of alternate courses. All values
Ifor 8 X 8 X 16-in block given in table 3.2 are for
stretcher block.
I
3.3. MortarI
' Three types of mortar were used in the wall
panels:
' 1. Masonry cement mortar
2. Portland cement-lime mortar
3. High-bond mortar
|i The masonry cement and portland cement-lime
1-imortars were selected to represent conventional
j'Imasonry construction, and serve as a basis for com-
parison with masonry containing high-bond mortar.
"1^ The masonry cement mortar contained 1 part by
"([volume of masonry cement and 3 parts - by volume
f of masonry sand and met the requirements for type
J-N mortar described in ASTM C270-68 [3]. This
f^mortar will be referred to as 1:3 mortar. The port-
j
land cement-lime mortar contained (by volume) 1
I, part of Type 1 portland cement, 1 part hydrated
lime, and 4 parts of sand. This mortar will be
referred to as 1:1:4 mortar.
' The high-bond mortar contained 1-ft-^ (1 part) of
Type 1 Portland cement, 1-ft' (1 part) fine limestone
(passing a No. 200 sieve), 4-ft'^ (4 parts) of masonry
sand, and 4 gallons of liquid additive. This additive,
was a commercially available polyvinylidene
chloride having the trade name of Sarabond.-'
il!^ Sand was proportioned on the basis of an average (loose
volume) unit weight of 90 lb/ft'.
A proprietary commercial product produced by fhe Dow
Chemical Company.
The washed river silica sand used in the three
types of mortars had a gradation conforming to the
requirements of ASTM C144-66T [4]. The fineness
modulus of the sand was 1.95.
The mortar materials were obtained from the
same source during fabrication of the wall panel
specimens, and were essentially uniform.
The mortars were mixed in a conventional barrel
type mixer with rotating blades. Retempering was
permitted, but mortar was not used that was more
than three hours old. Two-inch mortar cubes were
made along with the wall panels and prism
specimens. The mortar cubes were air cured in the
laboratory under the same conditions as the wall
panels and prism specimens. Compressive strengths
of the mortar cubes with respect to the type of wall
construction and type of mortar are given in table
3.3. The compressive strengths of the mortar cubes
representing mortar in the prism specimens are
given in table 3.4. The mortar cubes were tested at
approximately the same age as the corresponding
wall panel or prism specimen.
4. Test Specimens
A detailed description of the wall and prism
specimens and the methods of fabrication of these
specimens are presented in this section.
4.1. Description of Walls
AU the wall panel specimens in this series of tests
were constructed in running bond^ and were
* Units in adjacent courses overlap by 50 percent and head
joints in alternate courses are in vertical alignment.
410-021 OL - 71 - 2
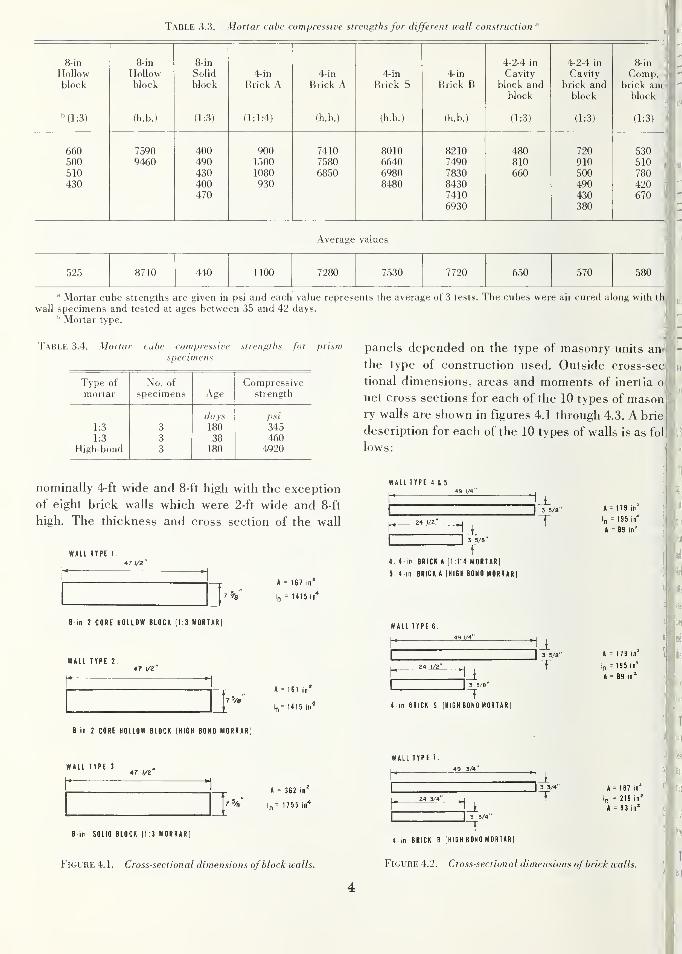
Table 3.3. Mortar cube compressive strengths for different wall construction '
8-in 8-in 8-in 4-2-4 in 4-2-4 in
1
8-in'
Hollow Hollow Solid 4-in 4-in 4-in 4-in Cavity Cavity Comp.block block block Brick A Brick A Brick S Brick B block and brick and brick anc-
block block block
"(1:3) (h.b.) (1:3) (1:1:4) (h.b.) (h.b.) (h.b.) (1:3) (1:3) (1:3)'
660 7590 400 900 7410 8010 8210 480 720 530)
500 9460 490 1500 7580 6640 7490 810 910 510(
510 430 1080 6850 6980 7830 660 500 780430 400 930 8480 8430 490 420
i
470 7410 430 670)
6930 380
Average values (
525 8710 440 1100 7280 7530 7720 650 570 580 '
" Mortar cube strengths are given in psi and each value represents the average of 3 tests. The cubes were air cured along with th|
wall specimens and tested at ages between 35 and 42 days.'' Mortar type.
Table 3.4. Mortar cube compressive strengths for prism
specimens
Type of No. of Compressivemortar specimens Age strength
(lays psi
1:3 3 180 3451:3 3 38 460
High-bond 3 180 4920
panels depended on the type of masonry units anti
the type of construction used. Outside cross-sec
tional dimensions, areas and moments of inertia o)
net cross sections for each of the 10 types of mason'
ry walls are shown in figures 4.1 through 4.3. A brie
description for each of the 10 types of walls is as fol
lows:
nominally 4-ft wide and 8-ft high with the exception
of eight brick walls which were 2-ft wide and 8-ft
high. The thickness and cross section of the wall
WALt TYPE 4 i 5
* = 179 in
In = 195 in'
A = 89 in'
WALL TYPE 1.
A = 167 in^
In = 1415 in"*
8-in 2 CORE HOLLOW BLOCK |1:3 MORTAR)
WALL TYPE 2
4. 4-in BRICK A |1:1:4 MORTARI
5.4'in BRICKA |HIGH BOND MORTARj
WALL TYPE 6,
A = 167 in'
ln= 1415 in"*
J 3 5/e
A = 179 in'
In =195 in'
A = 89 in^
8 in 2 CORE HOLLOW BLOCK |HIGH BONO MORTAR]
WALL TYPE 3.
T4'in BRICK S |HIGH BONO MORTARI
WALL TYPE 7
7%A = 362 in
l„= 1 755 in"*
J 3 3/4 A = 187 in
Ip = 219 in*
A = 93 in'
8'in SOLIO BLOCK |1 3 MORTAR]
Figure 4.1. Cross-sectional dimensions ofblock walls.
14. in BRICK B (HIGH BOND MORTAR]
Figure 4.2. Cross-sectional dimensions ofbrick walls.
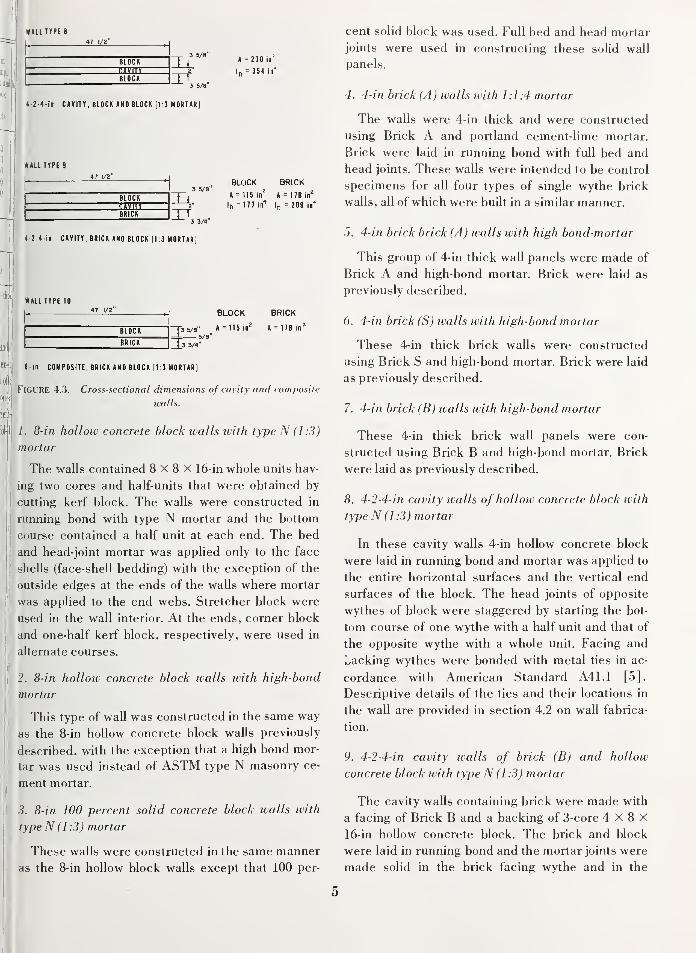
WALITYPE 8
47 1/2"
BLOCKriVIT V
BLOCK
1±.
XT
t = 230 in
In = 354 in*
4 2-4-in CAVITY. BLOCK AND BLOCK 11:3 MORTARI
WALL TYPE 9
BLOCK
BRICK
BLOCK BRICK
A = 115 in' A = 178 in^
In = 177 in"* = 209 in'
4-2-4 in CAVITY, BRICK ANO BLOCK |1:3 MORTARI
WALL TYPE 10
BLOCK
BRICK
BLOCK BRICK
A = 115in^ A = 178in^
8-in composite, brick and block |1:3 mortar]
Figure 4.3 Cross-sectional dimensions of cavity and composite
walls.
1. 8-in hollow concrete block walls with type N (1:3)
mortar
The walls contained 8 X 8 X 16-in whole units hav-
ing two cores and half-units that were obtained by
cutting kerf block. The walls were constructed in
running bond with type N mortar and the bottom
course contained a half unit at each end. The bed
and head-joint mortar was applied only to the face
shells (face-shell bedding) with the exception of the
outside edges at the ends of the walls where mortar
was applied to the end webs. Stretcher block were
used in the wall interior. At the ends, corner block
and one-half kerf block, respectively, were used in
alternate courses.
2. 8-in hollow concrete block walls with high-bond
mortar
This type of wall was constructed in the same way
as the 8-in hollow concrete block walls previously
described, with the exception that a high bond mor-
tar was used instead of ASTM type N masonry ce-
ment mortar.
3. 8-in 100 percent solid concrete block walls with
type N (1 :3 ) mortar
These walls were constructed in the same manner
as the 8-in hollow block walls except that 100 per-
cent solid block was used. Full bed and head mortar
joints were used in constructing these solid wall
panels.
4. 4-in brick (A) walls with 1:1:4 mortar
The walls were 4-in thick and were constructed
using Brick A and Portland cement-lime mortar.
Brick were laid in running bond with full bed and
head joints. These walls were intended to be control
specimens for all four types of single wythe brick
walls, all of which were built in a similar manner.
5. 4-in brick brick (A) walls with high bond-mortar
This group of 4-in thick wall panels were made of
Brick A and high-bond mortar. Brick were laid as
previously described.
6. 4-in brick (S) walls with high-bond mortar
These 4-in thick brick walls were constructed
using Brick S and high-bond mortar. Brick were laid
as previously described.
7. 4-in brick (B) walls with high-bond mortar
These 4-in thick brick wall panels were con-
structed using Brick B and high-bond mortar. Brick
were laid as previously described.
8. 4-2-4-in cavity walls of hollow concrete block with
type N (1:3) mortar
In these cavity walls 4-in hollow concrete block
were laid in running bond and mortar was applied to
the entire horizontal surfaces and the vertical end
surfaces of the block. The head joints of opposite
wythes of block were staggered by starting the bot-
tom course of one wythe with a half unit and that of
the opposite wythe with a whole unit. Facing and
Lacking wythes were bonded with metal ties in ac-
cordance with American Standard A41.1 [5].
Descriptive details of the ties and their locations in
the wall are provided in section 4.2 on wall fabrica-
tion.
9. 4-2-4-in cavity walls of brick (B) and hollow
concrete block with type N (1 :3 ) mortar
The cavity walls containing brick were made with
a facing of Brick B and a backing of 3-core 4 X 8 X
16-in hollow concrete block. The brick and block
were laid in running bond and the mortar joints were
made solid in the brick facing wythe and in the
5
concrete block backing as previously described.
Metal ties were provided as in the previous wall
system.
10. 8-in composite brick (B) and hollow concrete
block walls ivith type N (1:3) mortar
In the 8-in composite wall panels the facing was
made of Brick B and the backing of 4-in hollow
concrete block. Bonding consisted of a brick header
course in every seventh brick course.
Full head and bed joints were used in the brick
facing and 4-in block backing. The back of the brick
facing was pargeted'' with mortar and when the
backup block was laid a conscious effort was made
to fill the gap between brick and block with mortar.
4.2. Fabrication of Walls
The masonry wall panels measuring nominally 4
X 8-ft and 2 X 8-ft were fabricated and air cured in a
controlled environment laboratory that was main-
tained at 73 °F±3 °F and 50 percent ±5 percent
relative humidity. All of the wall specimens were
constructed by the same experienced mason using
techniques representative of good workmanship.
The walls were built in running bond with the mortar
joints on both faces of the walls cut flush and not
tooled.
The bottom course of masonry was laid in a full
bed of mortar in a steel channel of suitable width and
length to facilitate moving and placement of the test
panel in the testing machine. Walls were erected
between wooden frames that were braced in two
planes to keep them perpendicular to the floor. The
bed joint locations were marked on the wooden
frames in order to control the thickness of these
joints through the entire series of tests.
In controlling the bed joints for the various types
of walls made of concrete block or clay brick at a
thickness of f in, the height of 3 brick and 3 joints
was taken as 8 in. In a similar manner the height of
one concrete masonry unit and one joint was also
taken as 8 in.
The mason kept the face of the wall which was
away from him in alignment using a horizontal line
and level. This face was designated as the outer face
of the wall. The near face of the wall to the mason
was designated as the inner face.
In aU walls the first unit was laid at the end of the
course without head joint mortar. Head joints were
subsequently formed by buttering one end of a unirl*
just before placing it in the wall. In this way all heac *
joints were "shoved" and there were no closure
units or slushed head joints. i
Two series of cavity walls were constructed with
a 2-in space between inner and outer wythes. One^
series was built of one wythe of brick and one wythe''
of 4 X 8 X 16-in hollow concrete units. The other se^
ries was built with two wythes of 4 X 8 X 16-in hollow^
concrete units. The first course of each wythe wasj
set in a common bed of mortar and for the remaindei
of the wall construction the cavity was kept clear ol
mortar droppings.
The top course of the cavity walls to be tested witF
no vertical load was bridged with a 2-in thick course
of 8 X 10-in solid units laid in a full bed of mortar, sc'
that the upper courses of the wythes as well as th^
lower courses would be connected during the flexu'
ral tests. Cavity walls which were tested in flexure
under vertical load had their upper courses held ir*
place by the application of the vertical load and didj*'
not require bridging.j
The facing and backing wythes of the cavity wall^
were tied together in accordance with American
Standard A41.1. The commercial ties used in these
walls were ^-in diameter steel rods bent into a
completely closed rectangle measuring 2 X 6 in with^
the ends of the rod meeting at the middle of the 2-in
sides. The two 6-in sides of the ties contained a i-ir
drip crimp** at mid-length. Ties were placed in al:
ternate bed joints of block courses starting with the
joint above the second course. Lateral spacing of the!
ties along a bed joint was 30-in on centers starting at'
points 2 i-in from opposite ends in alternate tied
joints. This spacing resulted in a pattern of 2 ties in
alternate joints staggered by 15 inches. The waE
panels contained 10 metal ties; therefore, there wa;
nominally one tie for each 3.2 ft^ of wall area.
Two-inch mortar cubes were made along with the
wall specimen's and were air cured in the laboratory
under the same conditions as the wall specimens.|
4.3. Description and Fabrication of Prisms
Tests were carried out on a large number of small
specimens in order to determine the properties of
the various types of masonry. Compression tests
were conducted on 2-, 3-, and 5-block high prisms
and on 5-brick high prisms. The block prisms were.
^ A coat of mortar was applied to the vertical face. " A triangular vertical dent which drains accumulated water.
6
il ([constructed in stacked'' bond. The brick prisms were
constructed in running bond with a whole unit in the
first, third, and fifth courses and 2 half-units in the
second and fourth courses.
The prisms constructed using the 8 X 8 X 16-in
hollow block contained only face-shell mortar
bedding. Full bed joints were used in fabricating the
, prisms in which the 8 X 8 X 16-in solid and 4 X 8 X
d 16-in hollow block were used. The brick prisms were
constructed with full head and bed mortar joints.
Flexural tests were carried out on 2-block high
prisms in accordance with ASTM Standard E149-66
[6]. These prisms were made of both hollow and
solid 8 X 8 X 16-in block and 4 X 8 X 16-in hollow
block and were constructed in the same manner as
the prisms used for compressive tests. Flexural tests
were also conducted on 7-course brick prisms tested
as beams with the 8-in dimension of the brick
j horizontal, which were loaded at the third points
over a 16-in clear span. These 7-course brick prisms
were constructed in stacked bond with full bed mor-
tar joints.
The prisms were constructed from the three types
of mortar described in section 3.3. Two-in mortar
I
cubes were made along with the small specimens
and were air cured in the laboratory under the same
jconditions as the prisms.
I The decision on size and type of prisms was
j
governed by the following considerations:
Concrete block
(a) Compression: At the present time there is
no standard ASTM test for determining the
compressive strength of concrete block
prisms. The National Concrete Masonry As-
sociation (NCMA) presently recommends a
prism not less than 16 inches in height with
a height-to-thickness ratio of two. It was felt
that end restraints may have too much effect
on the strength of a two-block high prism.
Most of the tests were, therefore, conducted
on three-block high prisms, but some tests
on two-block and five-block high prisms were
also conducted for comparison.
Traditionally, block prisms are built in
stacked bond and not in running bond.
This construction is more practical and
stacked bond prisms were, therefore, used
in this program.
' Units in adjacent courses do not overlap, so that all head joints
are in vertical alignment.
(b) Flexure: It was decided that flexure tests of
prisms would be conducted in accordance
with estabhshed ASTM Standard E149-66
which requires two-block high prisms laid in
stacked bond.
Brick
(a) Compression: At the present time there is
no standard ASTM test for determining the
compressive strength of brick prisms. The
Structural Clay Products Institute (SCPI)
presently recommends a prism not less than
12 inches in height with a height-to-thickness
ratio of 5 but not less than 2. The 5-brick high
prisms used in this program had a height-to-
thickness ratio of 3.5 and a height of 12.8 in.
(b) Flexure: There is presently no standard test
for the flexural strength of brick prisms. The
7-brick stacked bond prism which is con-
venient for fabrication and testing was
adopted as a specimen for determining the
modulus of rupture of brick masonry.
5. Testing Procedures
5.1. Wall Tests
A wall panel in position for testing is shown in
figure 5.1. The vertical load was applied concentri-
cally to the wall and was transmitted from the head
of the 600,000-lb capacity hydraulic testing machine
through a 12 i-in deep loading beam, a 1-in square
steel bar centered along the width of the wall, and a
2-in steel plate that covered the top area of the wall.
A piece of i-in fiberboard was used between the top
of the wall and the 2-in steel plate to provide a
uniformly distributed load to the top of the wall. Thebottom of the wall was built inside a steel channel
which rested on a i-in fiberboard.
The transverse load was applied uniformly by an
air bag, made of 20-mil polyvinyl sheeting, that was
84 in long and extended across the entire width of
the wall. A steel reaction frame attached to three
wheels provided the support for the air bag on one
side of the wall specimen. On the opposite side of
the wall, upper and lower horizontal reaction bars
were spaced 82 i-in apart, and attached to another
reaction frame on wheels.
The two reaction frames were rolled into position
on either side of the wall and bolted together at the
four corners. On the loaded side of the wall the air
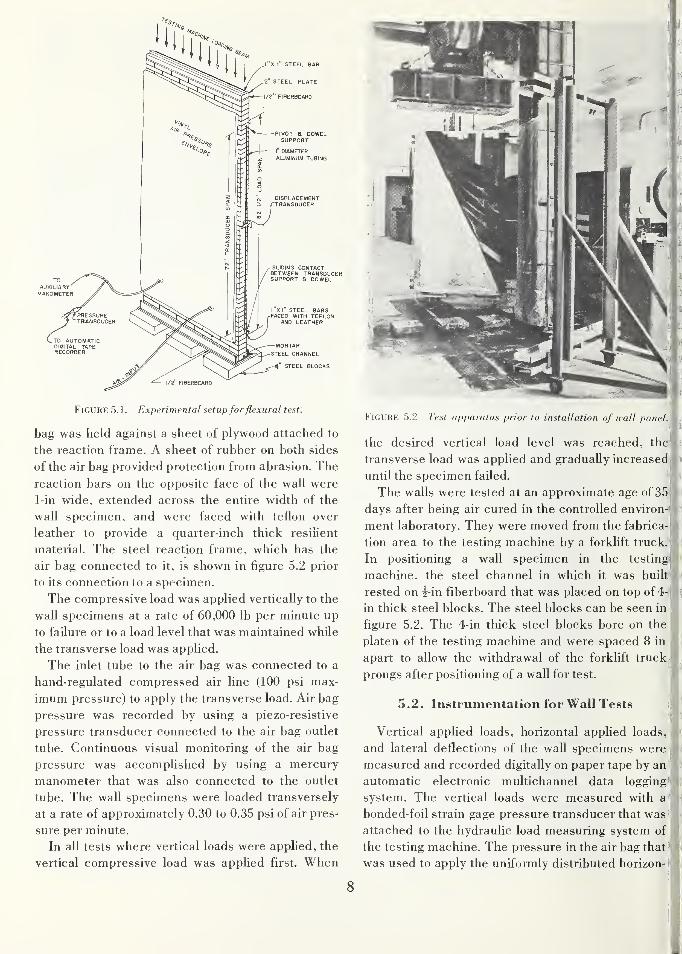
Figure 5.1. Experimental setupforflexural test.
bag was held against a sheet of plywood attached to
the reaction frame. A sheet of rubber on both sides
of the air bag provided protection from abrasion. The
reaction bars on the opposite face of the wall were
1-in wide, extended across the entire width of the
wall specimen, and were faced with teflon over
leather to provide a quarter-inch thick resilient
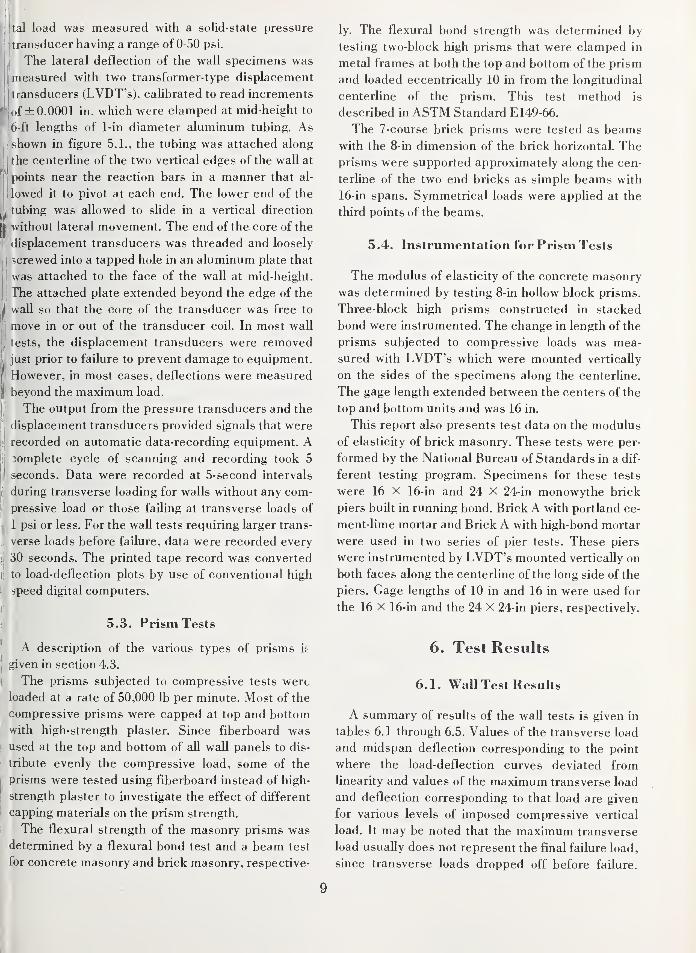
material. The steel reaction frame, which has the
air bag connected to it, is shown in figure 5.2 prior
to its connection to a specimen.
The compressive load was applied vertically to the
wall specimens at a rate of 60,000 lb per minute up
to failure or to a load level that was maintained while
the transverse load was appUed.
The inlet tube to the air bag was connected to a
hand-regulated compressed air line (100 psi max-
imum pressure) to apply the transverse load. Air bag
pressure was recorded by using a piezo-resistive
pressure transducer connected to the air bag outlet
tube. Continuous visual monitoring of the air bag
pressure was accomplished by using a mercury
manometer that was also connected to the outlet
tube. The wall specimens were loaded transversely
at a rate of approximately 0.30 to 0.35 psi of air pres-
sure per minute.
In all tests where vertical loads were applied, the
vertical compressive load was applied first. When
the desired vertical load level was reached, theji »
transverse load was applied and gradually increasedi
until the specimen failed.
The walls were tested at an approximate age of 35
days after being air cured in the controlled environ-'
ment laboratory. They were moved from the fabrica-
tion area to the testing machine by a forklift truck.
In positioning a wall specimen in the testing)
machine, the steel channel in which it was built
rested on i-in fiberboard that was placed on top of 4^
in thick steel blocks. The steel blocks can be seen in
figure 5.2. The 4-in thick steel blocks bore on the
platen of the testing machine and were spaced 8 in
apart to allow the withdrawal of the forklift truck;
prongs after positioning of a wall for test.
y
5.2. Instrumentation for Wall Testsj
Vertical applied loads, horizontal applied loads,
and lateral deflections of the wall specimens were
measured and recorded digitally on paper tape by an
'
automatic electronic multichannel data logging"
system. The vertical loads were measured with a.^
bonded-foil strain gage pressure transducer that was'
attached to the hydraulic load measuring system of
the testing machine. The pressure in the air bag that^
was used to apply the uniformly distributed horizon- i
tal load was measured with a solid-state pressure
1 transducer having a range of 0-50 psi.
The lateral deflection of the wall specimens was
i measured with two transformer-type displacement
transducers (LVDT's), calibrated to read increments
f* of ±0.0001 in. which were clamped at mid-height to
6-ft lengths of 1-in diameter aluminum tubing. As
shown in figure 5.1., the tubing was attached along
the centerline of the two vertical edges of the wall at
• points near the reaction bars in a manner that al-
I lowed it to pivot at each end. The lower end of the
^jtubing was allowed to slide in a vertical direction
||jwithout lateral movement. The end of the core of the
j!displacement transducers was threaded and loosely
I
screwed into a tapped hole in an aluminum plate that
j
was attached to the face of the wall at mid-height,
j
The attached plate extended beyond the edge of the
|!wall so that the core of the transducer was free to
j
move in or out of the transducer coil. In most wall
tests, the displacement transducers were removed
i:
just prior to failure to prevent damage to equipment.
! However, in most cases, deflections were measured
beyond the maximum load.
The output from the pressure transducers and the
I
displacement transducers provided signals that were
fj recorded on automatic data-recording equipment. A
[j
complete cycle of scanning and recording took 5
,jseconds. Data were recorded at 5-second intervals
ij during transverse loading for walls vdthout any com-' pressive load or those failing at transverse loads of
Ij
1 psi or less. For the wall tests requiring larger trans-
j verse loads before failure, data were recorded every
ij 30 seconds. The printed tape record was converted
1 to load-deflection plots by use of conventional high
||speed digital computers.
I
5.3. Prism Tests
\ A description of the various types of prisms it
j
given in section 4.3.
I The prisms subjected to compressive tests were
loaded at a rate of 50,000 lb per minute. Most of the
compressive prisms were capped at top and bottom
i| with high-strength plaster. Since fiberboard wasi used at the top and bottom of all wall panels to dis-
tribute evenly the compressive load, some of the
j;
prisms were tested using fiberboard instead of high-
i strength plaster to investigate the effect of different
capping materials on the prism strength.
I The flexural strength of the masonry prisms wasdetermined by a flexural bond test and a beam test
for concrete masonry and brick masonry, respective-
ly. The flexural bond strength was determined by
testing two-block high prisms that were clamped in
metal frames at both the top and bottom of the prism
and loaded eccentrically 10 in from the longitudinal
centerline of the prism. This test method is
described in ASTM Standard E149-66.
The 7-course brick prisms were tested as beams
with the 8-in dimension of the brick horizontal. Theprisms were supported approximately along the cen-
terline of the two end bricks as simple beams with
16-in spans. Symmetrical loads were applied at the
third points of the beams.
5.4. Instrumentation for Prism Tests
The modulus of elasticity of the concrete masonry
was determined by testing 8-in hollow block prisms.
Three-block high prisms constructed in stacked
bond were instrumented. The change in length of the
prisms subjected to compressive loads was mea-
sured with LVDT's which were mounted vertically
on the sides of the specimens along the centerline.
The gage length extended between the centers of the
top and bottom units and was 16 in.
This report also presents test data on the modulus
of elasticity of brick masonry. These tests were per-
formed by the National Bureau of Standards in a dif-
ferent testing program. Specimens for these tests
were 16 X 16-in and 24 X 24-in monowythe brick
piers built in running bond. Brick A with portland ce-
ment-lime mortar and Brick A with high-bond mortar
were used in two series of pier tests. These piers
were instrumented by LVDT's mounted vertically on
both faces along the centerline of the long side of the
piers. Gage lengths of 10 in and 16 in were used for
the 16 X 16-in and the 24 X 24-in piers, respectively.
6. Test Results
6.1. Wall Test Results
A summary of results of the wall tests is given in
tables 6.1 through 6.5. Values of the transverse load
and midspan deflection corresponding to the point
where the load-deflection curves deviated from
linearity and values of the maximum transverse load
and deflection corresponding to that load are given
for various levels of imposed compressive vertical
load. It may be noted that the maximum transverse
load usually does not represent the final failure load,
since transverse loads dropped off before failure.
9
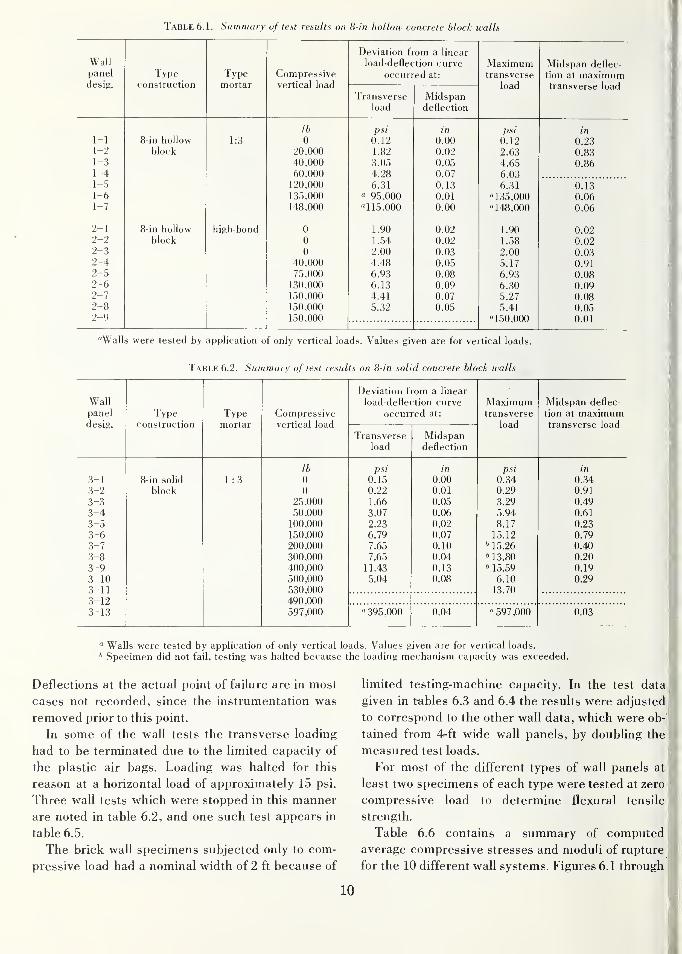
Table 6.1. Summary of test results on 8-in hollow concrete block walls
Wallpanel
desig.
Typeconstruction
Typemortar
Compressivevertical load
Deviation from a linear
load-deflection curve
occurred at:
Maximumtransverse
load
Midspan deflec-
tion at maximumtransverse load
Transverseload
Midspandeflection
lb psi in psi in1-1 o-in liollow 1:3
AU 0.12 0.00 0. 12 0.231 — '> block Z\).\)\J\) 1.82 0.02 2.63 0.83
/I A AAA 3.05 0.05 4.65 0.861-4 60,000 4.28 0.07 6.03l-.S 120.000 6.31 0.13 6.31 0.131—0 1 Q C AAA " 95.000 0.01 "135,000 0.061 71 /
1 /I O AAA14-o,UUU "115,000 0.00 "148,000 0.06
Z 1 o-in hollow 111high-bond AU 1.90 0.02 1 .90 0.02z z DloCK A
1.54 0.02 1.58 0.02z—
0
AU 2.00 0.03 2.00 0.03z—
4
40,000 4.48 0.05 5.17 0.91Z— .D 75,000 6.93 0.08 6.93 0.082-6 130,000 6.13 0.09 6.30 0.092-7 150.000 4.41 0.07 5.27 0.082-8 150,000 5.32 0.05 5.41 0.052-9 150,000 "150,000 0.01
"Walls were tested by application of only vertical loads. Values given are for vertical loads.
Table 6.2. Summary of test results on 8-in solid concrete block walls
Wallpanel
desig.
Typeconstruction
Typemortar
Compressivevertical load
Deviation from a linear
load-deflection curve
occurred at:
Transverseload
Midspandeflection
Maximumtransverse
load
Midspan deflec-
tion at maximumtransverse load
3-13-23-33-43-53-63-73-83-93-103-113-123-13
-in solid
block1 :3
lb
0
0
25,000
50,000
100,000
150,000
200,000
300,000
400,000
500,000
530,000
490,000
597,000
psi
0.15
0.22
1.66
3.07
2.23
6.79
7.65
7.65
11.43
5.04
in
0.00
0.01
0.05
0.06
0.02
0.07
0.10
0.04
0.13
0.08
psi
0.34
0.29
3.29
5.94
8.17
15.12
15.26" 13.80" 15.59
6.10
13.70
" 395,000 0.04 "597,000
in
0.34
0.91
0.49
0.61
0.23
0.79
0.40
0.20
0.19
0.29
0.03
" WaOs were tested by application of only vertical loads. Values given are for vertical loads.
' Specimen did not fail, testing was halted because the loading mechanism capacity was exceeded.
Deflections at the actual point of failure are in most
cases not recorded, since the instrumentation was
removed prior to this point.
In some of the wall tests the transverse loading
had to be terminated due to the limited capacity of
the plastic air bags. Loading was halted for this
reason at a horizontal load of approximately 15 psi.
Three wall tests which were stopped in this manner
are noted in table 6.2, and one such test appears in
table 6.5.
The brick wall specimens subjected only to com-
pressive load had a nominal width of 2 ft because of
limited testing-machine capacity. In the test data
given in t-ables 6.3 and 6.4 the results were adjusted
to correspond to the other wall data, which were ob-
tained from 4-ft wide wall panels, by doubling the
measured test loads.
For most of the different types of wall panels at
least two specimens of each type were tested at zero
compressive load to determine flexural tensile
strength.
Table 6.6 contains a summary of computed
average compressive stresses and moduli of rupture
for the 10 different wall systems. Figures 6.1 through
10
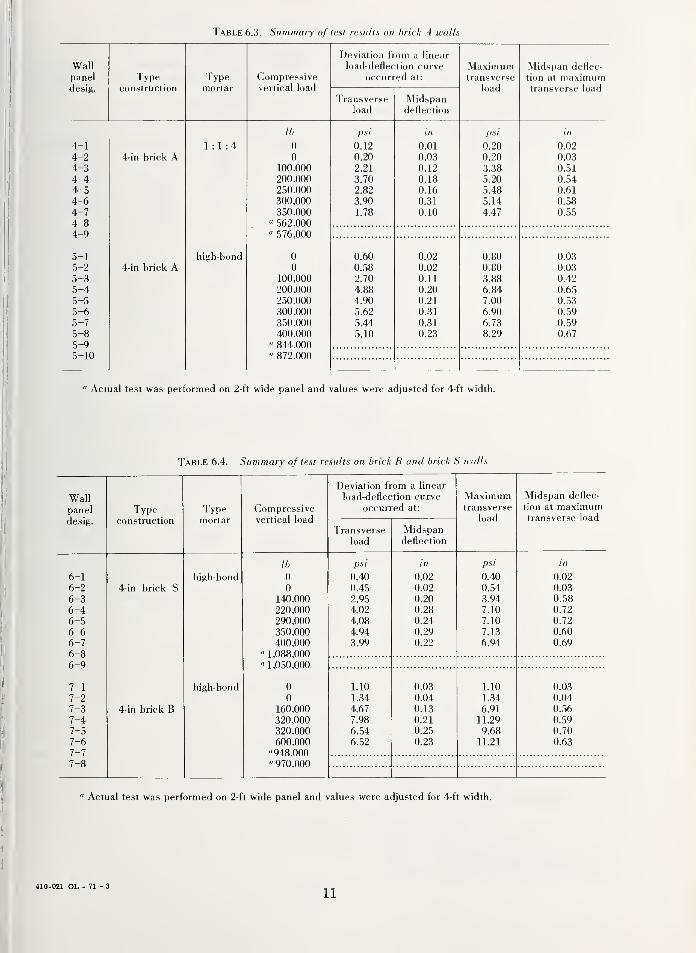
Table 6.3. Summary of test results on brick A walls
WaU
desig.
Typeconstruction
Typemortar
UI II JJI "S5l V tr
vertical load
Deviation from a linear
load-deflection curveoccurred at:
Maximumtransverse
load
Midspan deflec-
tion at maximumtransverse load
Transverseload
Midspandeflection
lb psi in psi in
4-1 1:1:4 0 0.12 0.01 0.20 0.024-2 4-in brick A 0 0.20 0.03 0.20 0.03
4-3 100.000 2.21 0.12 3.38 0.51
4-4 200.000 3.70 0.18 5.20 0.544-5 250,000 2.82 0.16 5.48 0.61
4-6 300.000 3.90 0.31 5.14 0.584-7 350,000 1.78 0.10 4.47 0.554-8 " 562.0004-9 " 576.000
5-1 high-bond 0 0.60 0.02 0.80 0.03
5-2 4-in brick A 0 0.58 0.02 0.80 0.035-3 100.000 2.70 0.11 3.88 0.42
5-4 200.000 4.88 0.20 6.84 0.655-5 250,000 4.90 0.21 7.00 0.53
5-6 300,000 5.62 0.31 6.90 0.595-7 350,000 5.44 0.31 6.73 0.595-8 400,000 5.10 0.23 8.29 0.67
5-9 " 844,0005-10 " 872,000
" Actual test was performed on 2-ft wide panel and values were adjusted for 4-ft width.
Table 6.4. Summary of test results on brick B and brick S walls
Wall
Deviation from a linear
load-deflection curve Maximum Midspan deflec-
panel Typeconstruction
Type Compressivevertical load
occurred at: transverse
load
tion at maximumtransverse load
desig. mortarTransverse
load
Midspandeflection
//, psi ;>! psi in
6-1 high-bond 0 0.40 0.02 0.40 0.02
6-2 4-in brick S 0 0.45 0.02 0.54 0.03
6-3 140,000 2.95 0.20 3.94 0.,S8
6-4 220,000 4.02 0.28 7.10 0.72
6-5 290,000 4.08 0.24 7.10 0.72
6-6 350,000 4.94 0.29 7.13 0.60
6-7 400.000 3.99 0.22 6.94 0.69
6-8 " 1.088,000" 1,050.000
0
6-9
7-1 high-bond 1.10 0.03 1.10 0.03
7-2 0 1.34 0.04 1.34 0.047-3 4-in brick B 160.000 4.67 0.13 6.91 0.56
7-4 320.000 7.98 0.21 11.29 0.597-5 320.000 6.54 0.25 9.68 0.70
7-6 600.000 6.52 0.23 11.21 0.637-7 "948.0007-8 " 970.000
" Actual test was performed on 2-ft wide panel and values were adjusted for 4-ft width.
410-021 OL - 71 - 3
11
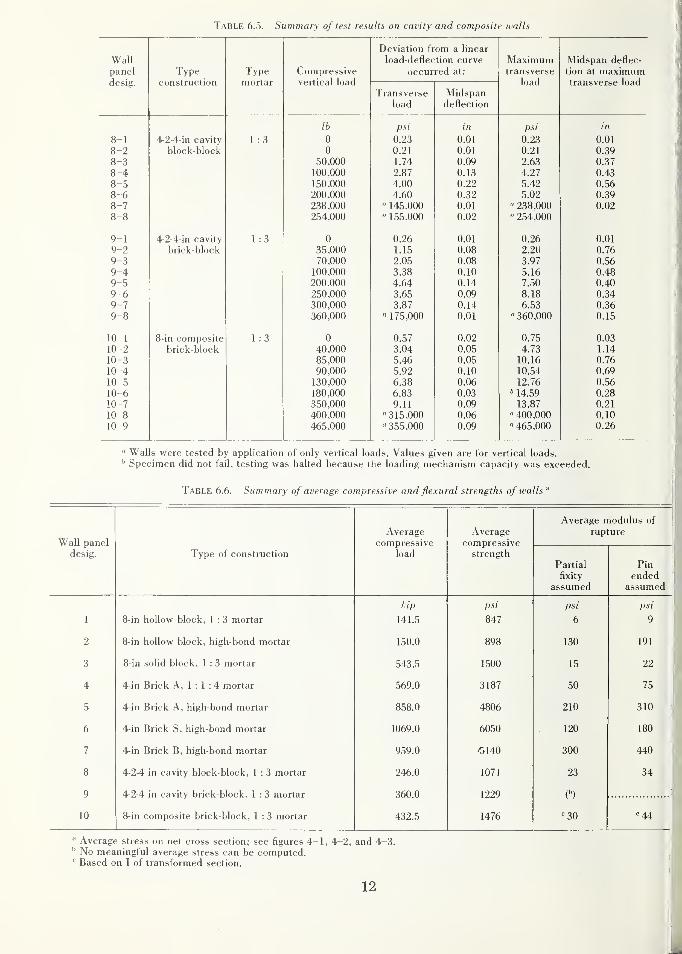
Table 6.5. Summary of test results on cavity and composite walls
Wallpanel
desig.
Typeconstruction
Typemortar
Compressivevertical load
Deviation from a linear
load-deflection curve
occurred at:
Maximumtransverse
load
Midspan deflec-
tion at maximumtransverse load
Transverseload
Midspandeflection
/6 psi / /? psi in
O 1 /l- V in /^Qi/itvTP-Z. T" 111 LdVliy 1 . o 0 0.23 0.01 0 23 0 01
o z block-block 0 0.21 0.01 0 91 0 39
o o 1 7/1 0 OQU.UV 0 '^7o.o t
fl—d.O 4- Z.o /n 1
Q
d. 97 0 d^U.40
8-5 150,000 /I on n 90 5.42 0.568-6 200,000 /I ^^0 n Q9u.oz 5.02 0.39ft-
7
O (
93Q 000 o ni ^' 9^8 000 0 02ft-So o 9i;d, 000 '/ 1 ono n 09 " 9=^4 000Z04',WVJO
y L /I. V /l in /^Qi/it^rT' T" 111 CdVliy 1 • ^ Q 0.26 0.01 0 26 0 01
0—9 brick-block 000 1.15 0.08 9 90 0 7fi
7 O 70 000i u,vwo 9 01^ 0 Oft ^ Q7
Q—d. 1 00 000 o.oo 0 10 1ftO. iO 0 dSU.409-5 200,000 n 1 /I 7.50 0.409-6 250,000 o.oo n no 8.18 0.349-7 •^00 000 o.o / U.l'* 6.53 0.36Q-ft7 o ^fXS 000 f/ 1 7Q 000 n niU.Ul " ^(SO OOfl 0 11^O. lO
Ifl—
1
IVJ 1 o-in composite n U.o /n n9U.UZ 0 7^ 0 0^
1 0—9 bnck-block AO 000 3.04 0.05 d 7^4. 4 O 1 Id1.14"
ft^ 000 5.46 0.05 10.16 0.76QO 000 5.92 0.10 10 "^d10.04 0 M
10— 1 ^0 000 6.38 0.06 1 9 7fi u.oo
10-6 180,000 6.83 0.03 " 14.59 0.28
10-7 OCn AAA 9.11 0.09 13.87 0.21
10-8 400,000 "315.000 0.06 " 400,000 0.10
10-9 465,000 "355,000 0.09 " 465,000 0.26
" Walls were tested by application of only vertical loads. Values given are for vertical loads.
Specimen did not fail, testing was halted because the loading mechanism capacity was exceeded.
Table 6.6. Summary of average compressive and flexural strengths of walls "
Wall panel
desig.
Averagecompressive
load
Averagecompressive
strength
Average modulus of
rupture
Type of construction
Partial
fixity
assumed
Pinended
assumed
1 8-in hollow block, 1 : 3 mortar
l.,p
141.5
l>si
847
psi
6
psi
9
2 8-in hollow block, high-bond mortar 150.0 898 130 191
3 8-in solid block. 1 : 3 mortar 543.5 1500 15 22
4 4-in Brick A, 1 : 1 : 4 mortar 569.0 3187 50 75
5 4-in Brick A, high-bond mortar 858.0 4806 210 310
6 4-in Brick S, high-bond mortar 1069.0 6050 120 180
7 4-in Brick B, high-bond mortar 959.0 6140 300 440
8 4-2-4 in cavity block-block, 1 : 3 mortar 246.0 1071 23 34
9 4-2-4 in cavity brick-block, 1 : 3 mortar
8-in composite brick-block, 1 : 3 mortar
360.0 1229 (")
10 432.5 1476 '30 '44
" Average stress on net cross section; see figures 4-1, 4-2, and 4-3.* No meaningful average stress can be computed.Based on I of transformed section.
12
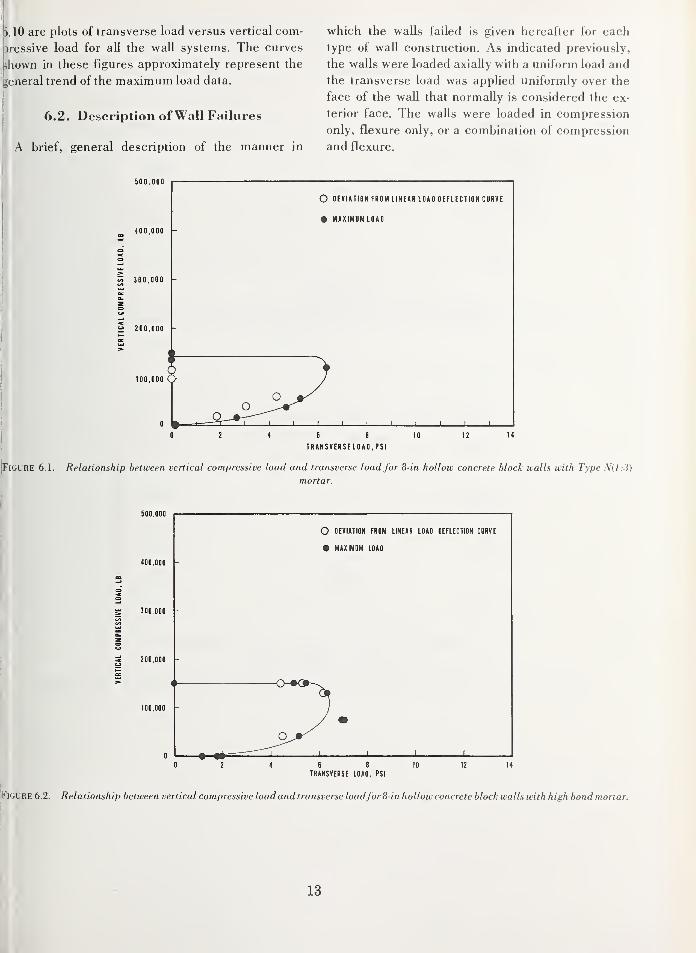
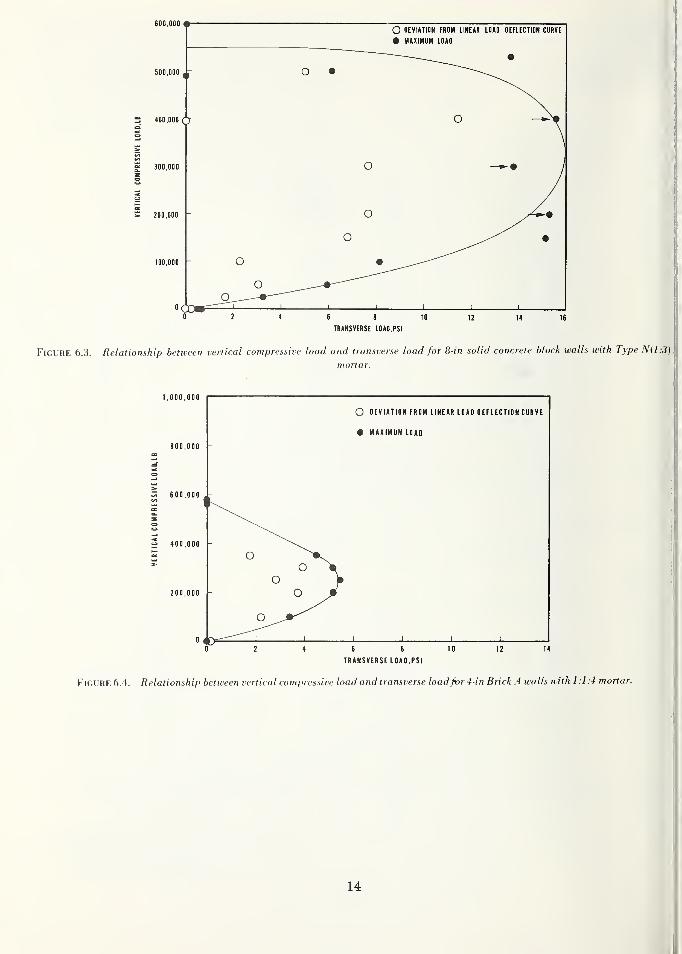
li.lO are plots of transverse load versus vertical com-
pressive load for aU the wall systems. The curves
jjhown in these figures approximately represent the
general trend of the maximum load data.
6.2. Description of Wall Failures
A brief, general description of the manner in
which the walls failed is given hereafter for each
type of waU construction. As indicated previously,
the walls were loaded axially with a uniform load and
the transverse load was applied uniformly over the
face of the wall that normally is considered the ex-
terior face. The walls were loaded in compression
only, flexure only, or a combination of compression
and flexure.
500,000
400.000
300,000
200,000
100,000
O DEVIATION FROM LINEAR LOAD DEFLECTION CURVE
• MAXIMUM LOAD
J t I I I I L6 8 10
TRANSVERSELOAD.PSI
12 14
|Figure 6.1. Relationship between vertical compressive load and transverse load for 8-in hollow concrete block walls with Type N{1:3)
500,000
400,000
300,000
200,000
100,000
O DEVIATION FROM LINEAR LOAD DEFLECTION CURVE
• MAXIMUM LOAD
10 12 14
TRANSVERSE LOAD, PSI
Figure 6.2. Relationship between vertical compressive loadand transverse loadfor8-in hollow concrete blockwalls with high bond mortar.
13
600,000 I
500,000,
O DEVIATION FROM lINEtR LOAD DEFLECTION CURVE
• MAXIMUM LOAD
52 400,000 Q
300,000
200,000
Figure 6.3. Relationship between vertical compressive load and transverse load for 8-in solid concrete block walls with Type N(l:3)
mortar.
1,000.000
800,000
600,000
^ 400,000
200,000
o DEVIATION FROM LINEAR LOAD DEFLECTION CURVE
• MAXIMUM LOAD
oO i
oo
^1 1 1 1 1 1
6 8 10 12
TRANSVERSE LOAD,P$l
Figure 6.4. Relationship between vertical compressive load and transverse loadfor 4-in Brick A walls with 1:1:4 mortar.
14
1,000.000
800.000
600.000-
400.000
200,000
0 2 4 6 8 10 12
TRUNSVERSE L0*D,PSI
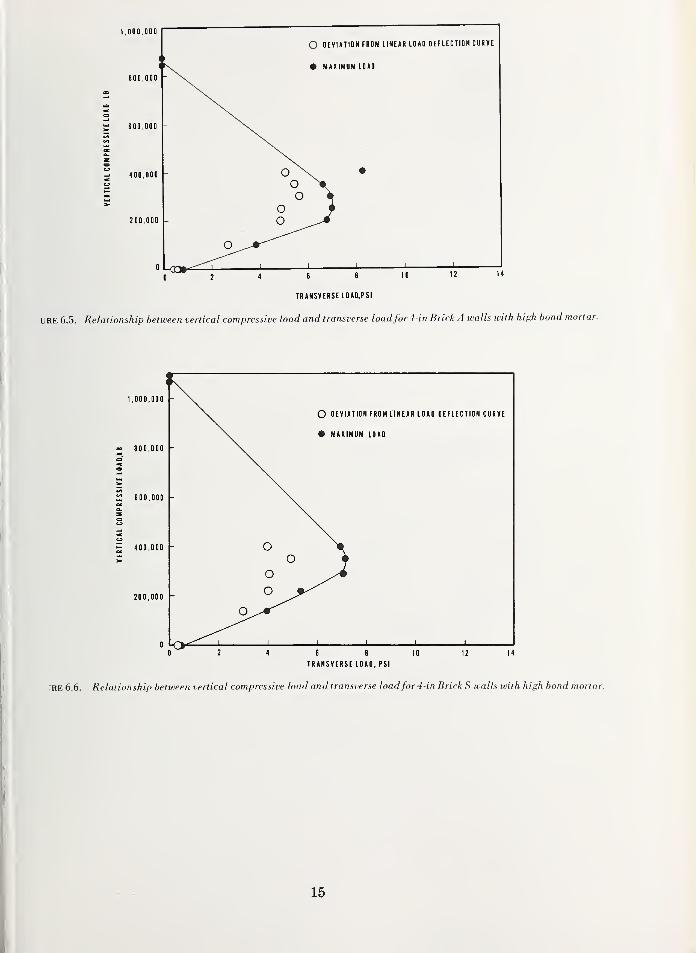
LIRE 6.5. Relationship between vertical compressive load and transverse loadfor 4-in Brick A walls with high bond mortar.
1,000.000
800.000
600,000
^ 400,000
200,000
O DEVIATION FROMLINEARLOAD DEFLECTION CURVE
• MAXIMUM LOAD
6 8 10
TRANSVERSE LOAD, RSI
IRE 6.6. Relationship between vertical compressive load and transverse loadfor 4-in Brick S walls with high bond mortar.
15
500,000
400,000
"S, 300,000 -
200,000
100,000
O DEVIATION FROM LINEAR LOAD DEFLECTION CURVE
• MAXIMUM LOAD
6 8 10
TRANSVERSE LOAD. PSI
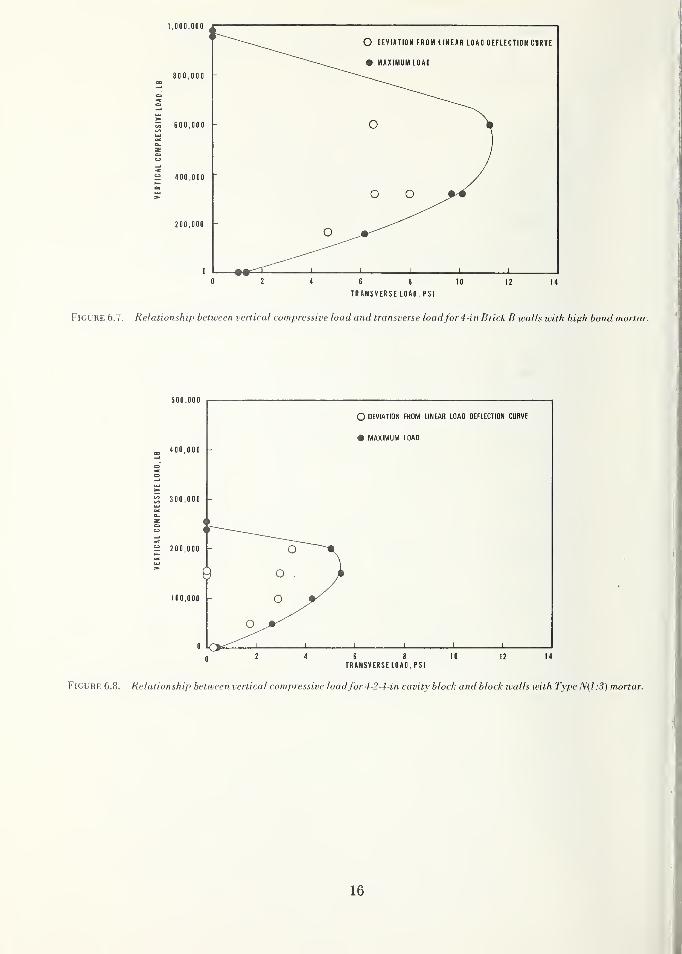
Figure 6.8. Relationship between vertical compressive loadfor 4-2-4-in cavity block and block walls with Type N(l -.3) mortar.
16
]
900,000
O DEVIATION FROM LINEAR LOAD DEFLECTION CURVE
• MAXIMUM LOAD
400.000-
TRANSVERSE LOAD. PSI
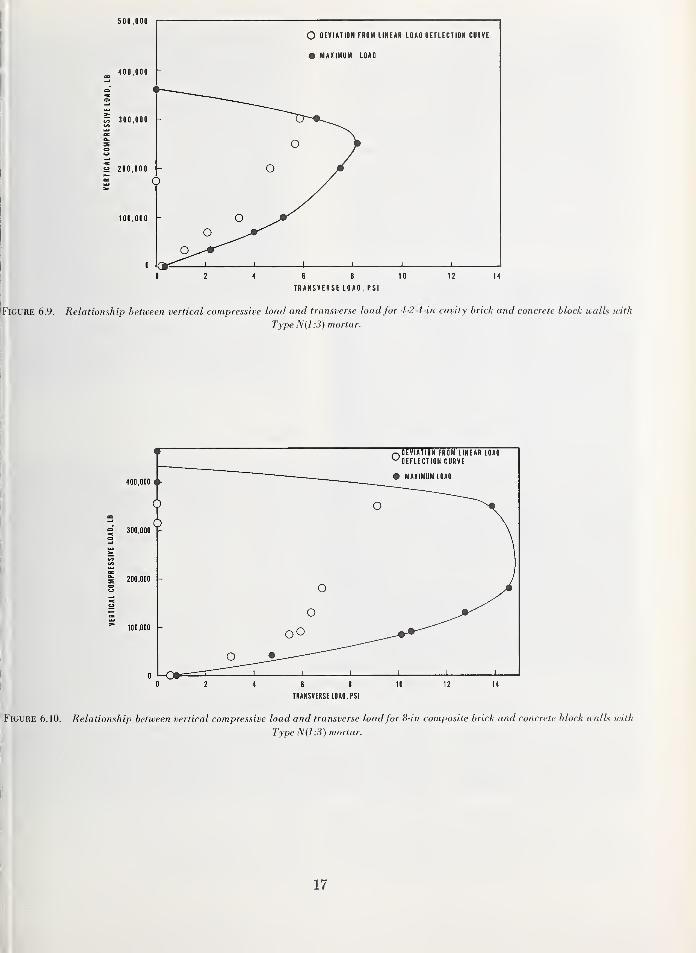
Figure 6.9. Relationship between vertical compressive load and transverse load for 4-2-4-in cavity brick and concrete block walls with
Type N(l :3) mortar.
0 2 4 6 e 10 12 14
TRANSVERSE LOAD, PSI
Figure 6.10. Relationship between vertical compressive load and transverse loadfor 8-in composite brick and concrete block walls with
Type N(1 :3 ) mortar.
17
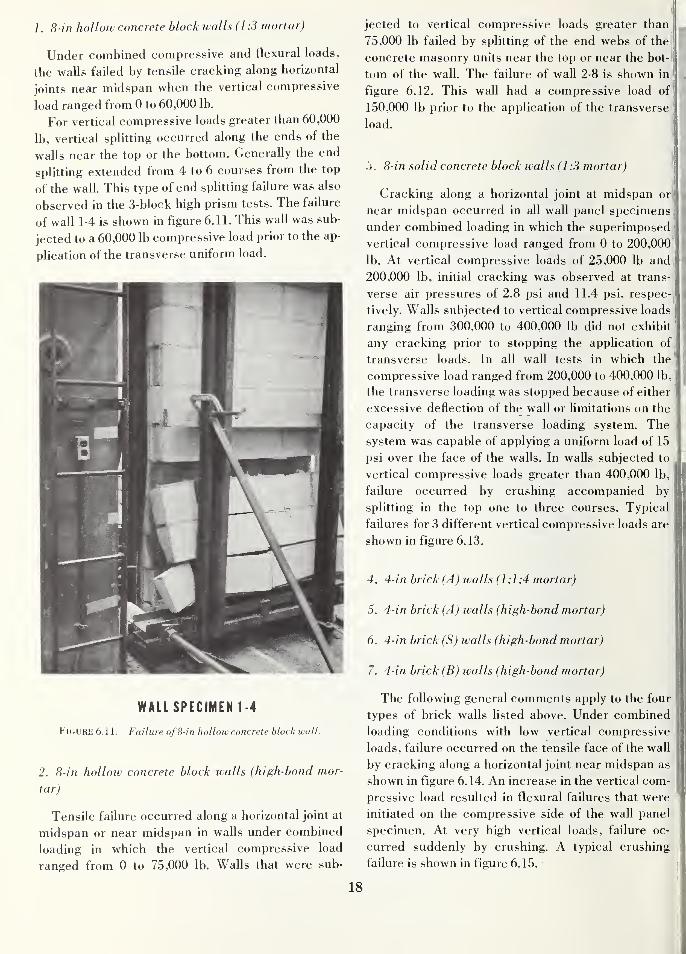
1 . 8-in hollow concrete block walls ( 1 :3 mortar)
Under combined compressive and flexural loads,
the walls failed by tensile cracking along horizontal
joints near midspan when the vertical compressive
load ranged from 0 to 60,000 lb.
For vertical compressive loads greater than 60,000
lb, vertical splitting occurred along the ends of the
walls near the top or the bottom. Generally the end
splitting extended from 4 to 6 courses from the top
of the wall. This type of end splitting failure was also
observed in the 3-block high prism tests. The failure
of wall 1-4 is shown in figure 6.11. This wall was sub-
jected to a 60,000 lb compressive load prior to the ap-
plication of the transverse uniform load.
WALL SPECIMEN 1-4
Figure 6.11. Failure of8-in hollow concrete block wall.
2. 8-in hollow concrete block walls (high-bond mor-
tar)
Tensile failure occurred along a horizontal joint at
midspan or near midspan in walls under combined
loading in which the vertical compressive load
ranged from 0 to 75,000 lb. Walls that were sub-
jected to vertical compressive loads greater than
'
75,000 lb failed by splitting of the end webs of the
concrete masonry units near the top or near the bot-
tom of the wall. The failure of wall 2-8 is shown in
figure 6.12. This wall had a compressive load of
150,000 lb prior to the application of the transverse
load.
j. 8-in solid concrete block walls (1:3 mortar)
Cracking along a horizontal joint at midspan or^
near midspan occurred in all wall panel specimens
under combined loading in which the superimposed
vertical compressive load ranged from 0 to 200,000
lb. At vertical compressive loads of 25,000 lb and
200,000 lb, initial cracking was observed at trans-
verse air pressures of 2.8 psi and 11.4 psi, respec-
tively. Walls subjected to vertical compressive loads
ranging from 300,000 to 400,000 lb did not exhibit
any cracking prior to stopping the application of
transverse loads. In all wall tests in which the
compressive load ranged from 200,000 to 400,000 lb,
the transverse loading was stopped because of either
excessive deflection of the wall or limitations on the
capacity of the transverse loading system. The
system was capable of applying a uniform load of 15
psi over the face of the walls. In walls subjected to
vertical compressive loads greater than 400,000 lb,
failure occurred by crushing accompanied by
splitting in the top one to three courses. Typical
failures for 3 different vertical compressive loads are
shown in figure 6.13.
4. 4-in brick (A ) walls (1 :1 :4 mortar)
5. 4-in brick (A) walls (high-bond mortar)
6. 4-in brick (S) walls (high-bond mortar)
7. 4-in brick (B) ivalls (high-bond mortar)
The following general comments apply to the four
types of brick walls listed above. Under combined
loading conditions with low vertical compressive
loads, failure occurred on the tensile face of the waU
by cracking along a horizontal joint near midspan as
shown in figure 6.14. An increase in the vertical com-
pressive load resulted in flexural failures that were
initiated on the compressive side of the wall panel
specimen. At very high vertical loads, failure oc-
curred suddenly by crushing. A typical crushing
failure is shown in figure 6.15.
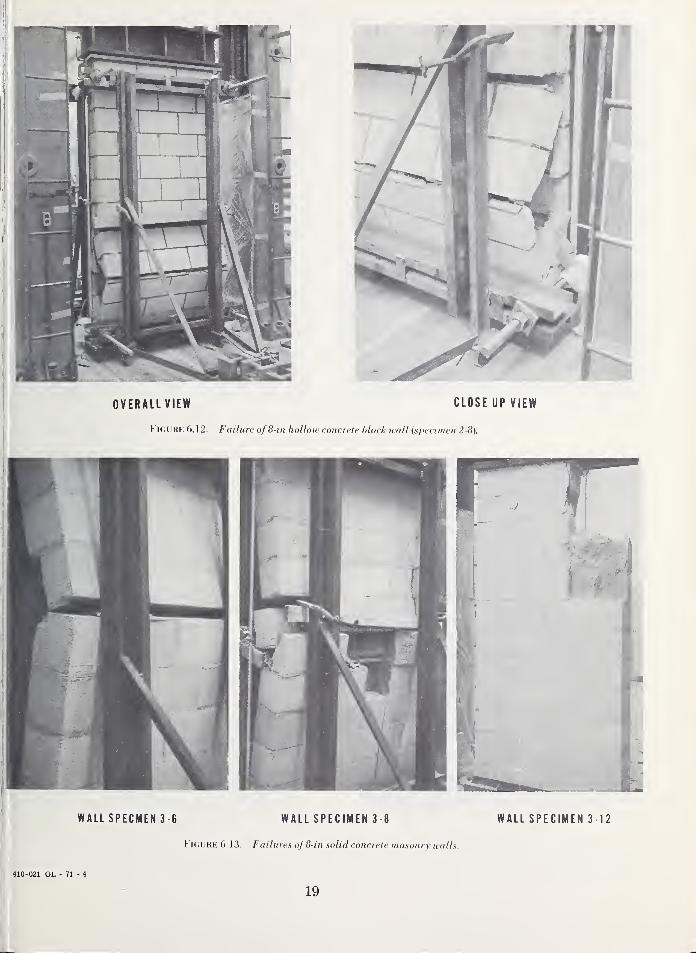
OVERALLVIEW CLOSE UP VIEW
Figure 6.12. Failure of8-in hollow concrete block wall {specimen 2-8).
WALL SPECMEN 3-6 WALL SPECIMEN 3-8
Figure 6.13. Failures oj 8-in solid concrete masonry walls.
WALL SPECIMEN 3 12
410-021 OL - 71 - 4
19
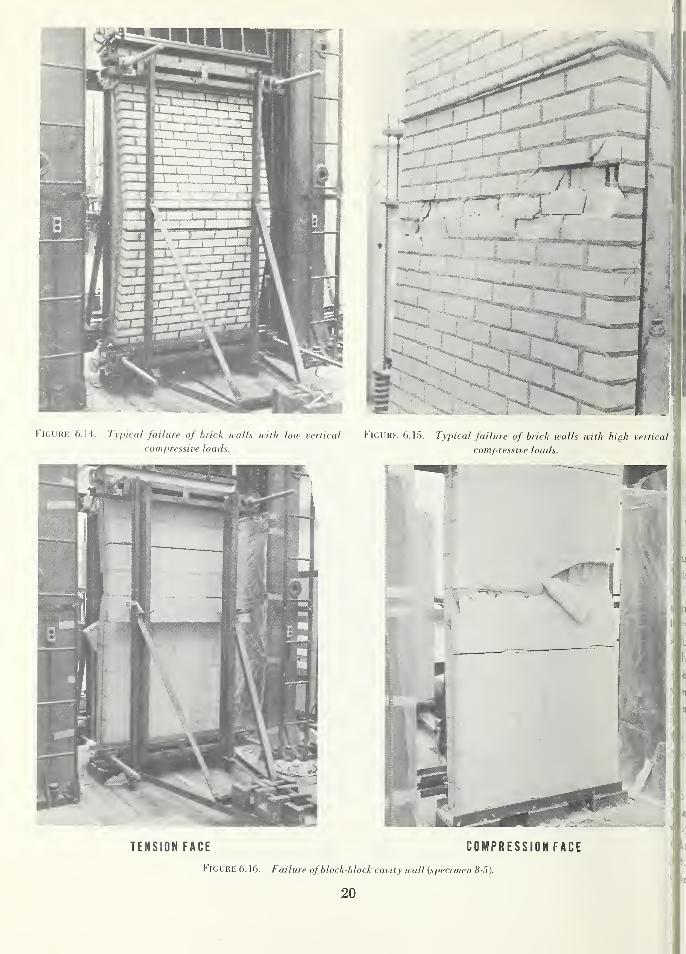
Figure 6.14. Typical failure of brick walls with low vertical FIGURE 6.1S. Typical failure of brick walls with h
compressive loads. compressive loads.
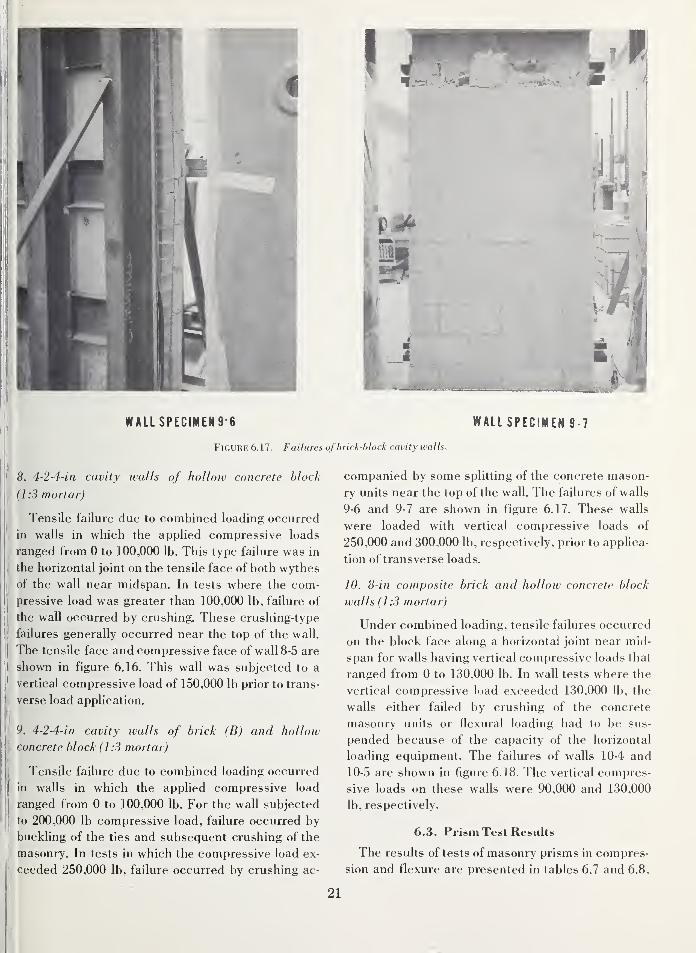
WALLSPECIMEN9-6 WALL SPECIMEN 9-7
Figure 6.17. Failures of brick-block cavity walls.
\ 8. 4-2-4-in cavity walls of hollow concrete block
I
(1:3 mortar)
Tensile failure due to combined loading occurred
I
in walls in which the applied compressive loads
I
ranged from 0 to 100,000 lb. This type failure was in
the horizontal joint on the tensile face of both wythes
ij of the wall near midspan. In tests where the com-
jj
pressive load was greater than 100,000 lb, failure of
ithe wall occurred by crushing. These crushing-type
failures generally occurred near the top of the wall.
The tensile face and compressive face of wall 8-5 are
shown in figure 6.16. This wall was subjected to a
I
vertical compressive load of 150,000 lb prior to trans-
' verse load application.
I|
j:9. 4-2-4-in cavity walls of brick (B) and hollow
j|
concrete block (1:3 mortar)
ij
I
Tensile failure due to combined loading occurred
Iin walls in which the applied compressive load
ranged from 0 to 100,000 lb. For the wall subjected
to 200,000 lb compressive load, failure occurred by
buckling of the ties and subsequent crushing of the
masonry. In tests in which the compressive load ex-
ceeded 250,000 lb, failure occurred by crushing ac-
companied by some splitting of the concrete mason-
ry units near the top of the wall. The failures of walls
9-6 and 9-7 are shown in figure 6.17. These walls
were loaded with vertical compressive loads of
250,000 and 300,000 lb, respectively, prior to applica-
tion of transverse loads.
10. 8-in composite brick and holloiv concrete block
walls (1:3 mortar)
Under combined loading, tensile failures occurred
on the block face along a horizontal joint near mid-
span for walls having vertical compressive loads that
ranged from 0 to 130,000 lb. In wall tests where the
vertical compressive load exceeded 130.000 lb. the
walls either failed by crushing of the concrete
masonry units or flexural loading had to be sus-
pended because of the capacity of the horizontal
loading equipment. The failures of walls 10-4 and
10-5 are shown in figure 6.18. The vertical compres-
sive loads on these walls were 90,000 and 130,000
lb, respectively.
6.3. Prism Test Results
The results of tests of masonry prisms in compres-
sion and flexure are presented in tables 6.7 and 6.8,
21
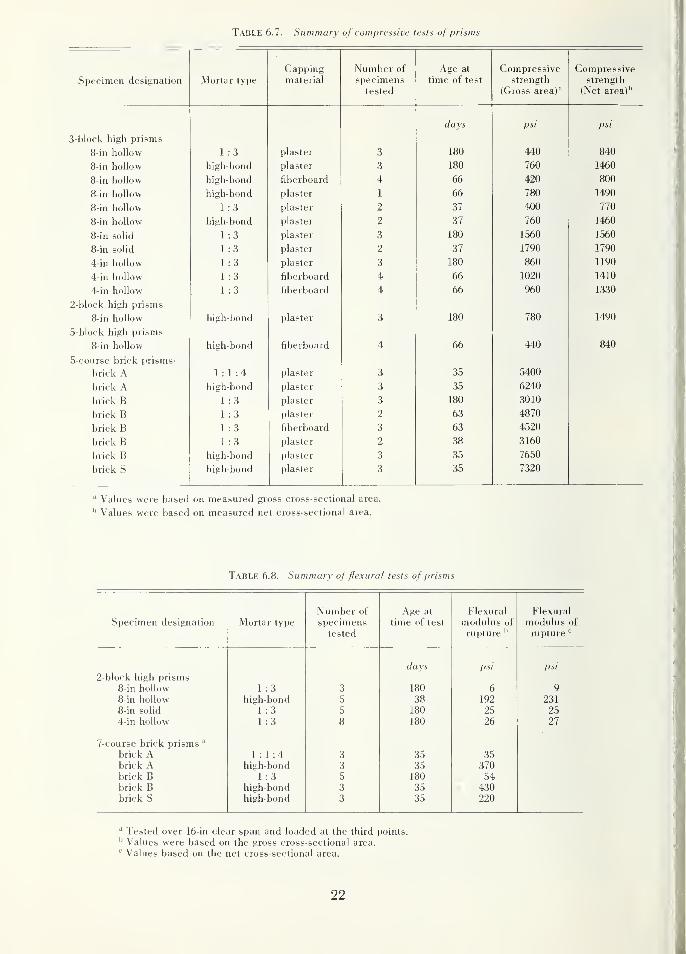
Table 6.7. Summary of compressive tests of prisms
Cappingmaterial
Number of Age at Compressive CompressiveSpecimen designation Mortar type specimens
tested
time of test strength
(Gross area)"
strength
(Net area)''
davs psi psi
3 "b 1 ck li 1§ li prisms
ft-iii nnllnwyj 111 injinjvv 1 : 3 plaster 3 180 440 840
8-in hollow high-bond plaster 3 180 760 1460
8"in liollow high-bond fiberboard 4 66 420 800
8-in hollow higli-bond plaster 1 66 780 1490
8-in hollow 1 : 3 plaster 2 37 400 770
8-in hollow hi*^h-bond plaster 2 37 760 1460
8-in <;nliriO III oUlIU 1 : 3 plaster 3 180 1560 1560
8-in solid 1 : 3 plaster 2 37 1790 1790
4-in hollow 1 : 3 plaster 3 180 860 1190
^-in hollow 1 : 3 fiberboard 4 66 1020 1410
4'-m hollow 1 : 3 fiberboard 4 66 960 1330
2-block high prisms
8-in hollow high-bond plaster 3 180 780 1490
5"block high prisms
8-in hollow hi^'^h-bond fiberboard 4 66 440 840
5 -course brick pnsms'
brick A, 1:1:4 plaster 3 35 5400
Krlnl: A 11 1 cTn- nitn H11^11 ij\JiiyA plaster 3 35 6240
1 : 3 plaster 3 180 3010
1 : 3 plaster 2 63 4870
brick B 1 :3 fiberboard 3 63 4520
brick B 1 : 3 plasterOZ OO 1 (^nOlOU
brick B high-bond plaster 3 35 7650
brick S high-bond plaster 3 35 7320
Values were based on measured gross cross-sectional area.
'' Values were based on measured net cross-sectional area.
Table 6.8. Summary offlexural tests of prisms
Number of Age at Flexural Flexural
Specimen designation Mortar type specimens time of test modulus of modulus of
tested rupture '' rupture^'
(lays psi psi
2-block high prisms8-in hollow 1 :3 3 180 6 9
8-in hollow high-bond 5 38 192 231
8-in solid 1 :3 5 180 25 25
4-in hollow 1 :3 8 180 26 27
7-course brick prisms "
brick A 1:1:4 3 35 35brick A high-bond 3 35 370brick B 1:3 5 180 54brick B high-bond 3 35 430brick S high-bond 3 35 220
" Tested over 16-in clear span and loaded at the third points.'' Values were based on the gross cross-sectional area.^' Values based on the net cross-sectional area.
22
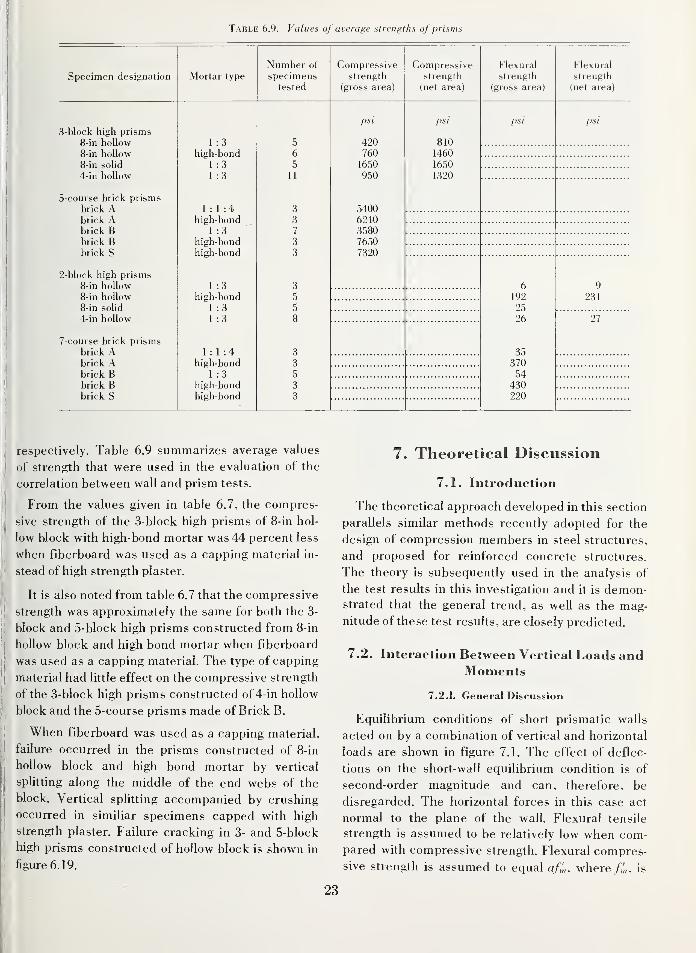
Table 6.9. Values of average strengths of prisms
Specimen designation Mortar type
Number of
specimenstested
Compressivestrength
(gross area)
Compressivestrength
(net area)
Flexural
strength
(gross area)
Flexural
strength
(net area)
3-block high prisms
8-in hollow
8-in hollow
8-in solid
4-in hollow
5-course brick prisms
brick Abrick Abrick Bbrick Bbrick S
2-block high prisms8-in hollow
8-in hollow
8-in solid
4-in hollow
7-course brick prismsbrick Abrick Abrick Bbrick Bbrick S
1 :3
high-bond
1 :3
1 :3
1:1:4high-bond
1:3high-bondhigh-bond
1 :3
high-bond
1 :3
1 :3
1:1:4high-bond
1 :3
high-bondhigh-bond
5
6
5
11
3
3
7
3
3
3
5
5
8
3
3
5
3
3
psi
4207601650
950
54006240358076507320
psi
8101460
1650
1320
psi [>si
6
192
25
26
3537054
430220
9
231
27
respectively. Table 6.9 summarizes average values
of strength that were used in the evaluation of the
correlation between wall and prism tests.
From the values given in table 6.7, the compres-
sive strength of the 3-block high prisms of 8-in hol-
low block with high-bond mortar was 44 percent less
when fiberboard was used as a capping material in-
stead of high strength plaster.
It is also noted from table 6.7 that the compressive
strength was approximately the same for both the 3-
block and 5-block high prisms constructed from 8-in
hollow block and high bond mortar when fiberboard
was used as a capping material. The type of capping
material had little effect on the compressive strength
of the 3-block high prisms constructed of 4-in hollow
block and the 5-course prisms made of Brick B.
When fiberboard was used as a capping material,
failure occurred in the prisms constructed of 8-in
hollow block and high bond mortar by vertical
splitting along the middle of the end webs of the
block. Vertical splitting accompanied by crushing
occurred in similiar specimens capped with high
strength plaster. Failure cracking in 3- and 5-block
high prisms constructed of hollow block is shown in
figure 6.19.
7. Theoretical Discussion
7.1. Introduction
The theoretical approach developed in this section
parallels similar methods recently adopted for the
design of compression members in steel structures,
and proposed for reinforced concrete structures.
The theory is subsequently used in the analysis of
the test results in this investigation and it is demon-strated that the general trend, as well as the mag-nitude of these test results, are closely predicted.
7.2. Interaction Between Vertical Loads andMoments
7.2.1. General Discussion
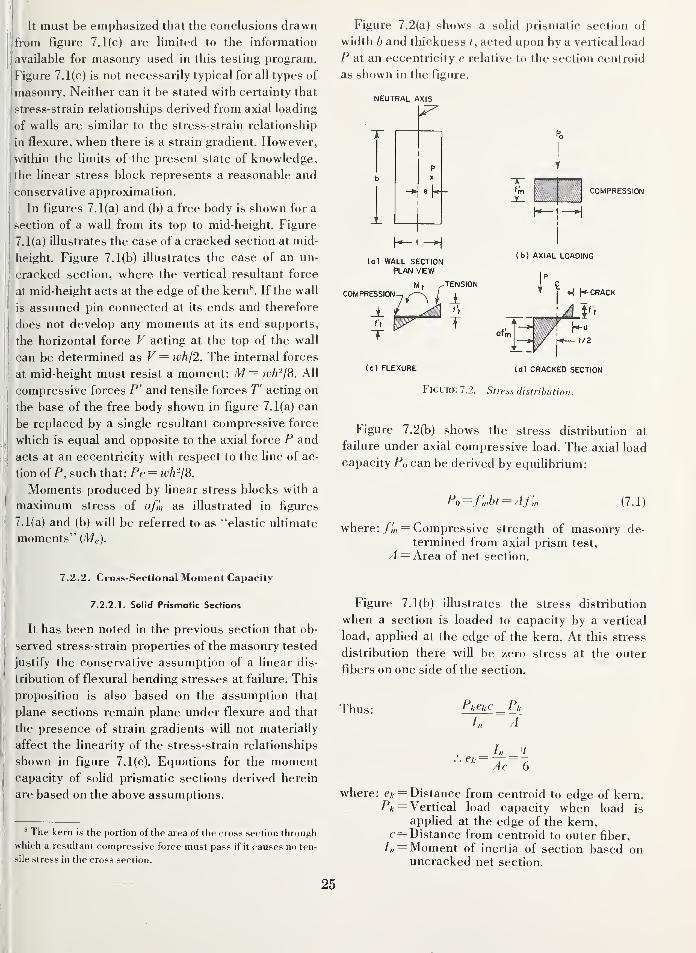
Equilibrium conditions of short prismatic walls
acted on by a combination of vertical and horizontal
loads are shown in figure 7.1. The effect of deflec-
tions on the short-wall equilibrium condition is of
second-order magnitude and can, therefore, be
disregarded. The horizontal forces in this case act
normal to the plane of the wall. Flexural tensile
strength is assumed to be relatively low when com-
pared with compressive strength. Flexural compres-
sive strength is assumed to equal af,'„, where f,'„, is
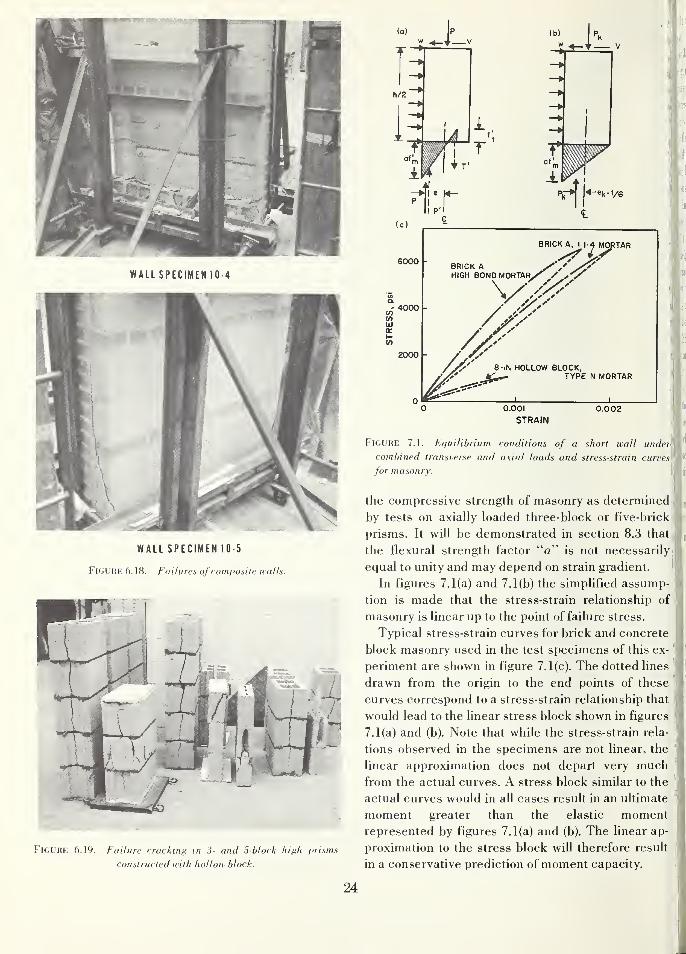
WALL SPECIMEN10-4
WALL SPECIMEN 10-5
Figure 6.18. Failures ofcomposite walls.
Figure 6.19. Failure cracking in 3- and 5-block high prisms
constructed with hollow block.
I iires
ek = t/6
6000
4000
2000
BRICK A, 1:14 MORTAR
BRICK AHIGH BOND MORTAR,
K A, 114 MOR
/A'' e-iN HOLLOW BLOCK,TYPE N MORTAR
0.001
STRAIN0.002
Figure 7.1. Equilibrium conditions of a short wall under'
combined transnerse and axial loads and stress-strain curves
for masonry.
the compressive strength of masonry as determined
by tests on axially loaded three-block or five-brick
prisms. It will be demonstrated in section 8.3 that
the flexural strength factor "o" is not necessarily
equal to unity and may depend on strain gradient.
In figures 7.1(a) and 7.1(b) the simplified assump-
tion is made that the stress-strain relationship of
masonry is linear up to the point of failure stress.
Typical stress-strain curves for brick and concrete
block masonry used in the test specimens of this ex-
periment are shown in figure 7.1(c). The dotted lines
drawn from the origin to the end points of these
curves correspond to a stress-strain relationship that
would lead to the linear stress block shown in figures
7.1(a) and (b). Note that while the stress-strain rela-
tions observed in the specimens are not linear, the
linear approximation does not depart very muchfrom the actual curves. A stress block similar to the
actual curves would in all cases result in an ultimate
moment greater than the elastic momentrepresented by figures 7.1(a) and (b). The linear ap-
proximation to the stress block will therefore result
in a conservative prediction of moment capacity.
24
It must be emphasized that the conclusions drawn
from figure 7.1(c) are hmited to the information
available for masonry used in this testing program.
Figure 7.1(c) is not necessarily typical for all types of
masonry. Neither can it be stated with certainty that
stress-strain relationships derived from axial loading
of walls are similar to the stress-strain relationship
in flexure, when there is a strain gradient. However,
within the limits of the present state of knowledge,
the linear stress block represents a reasonable and
conservative approximation.
In figures 7.1(a) and (b) a free body is shown for a
section of a wall from its top to mid-height. Figure
7.1(a) illustrates the case of a cracked section at mid-
height. Figure 7.1(b) illustrates the case of an un-
cracked section, where the vertical resultant force
at mid-height acts at the edge of the kern". If the wall
is assumed pin connected at its ends and therefore
does not develop any moments at its end supports,
the horizontal force V acting at the top of the wall
can be determined as V = whl2. The internal forces
at mid-height must resist a moment: M = wh-jS. All
compressive forces P' and tensile forces T' acting on
the base of the free body shown in figure 7.1(a) can
be replaced by a single resultant compressive force
which is equal and opposite to the axial force P and
acts at an eccentricity with respect to the line of ac-
tion of P, such that: Pe = wh'-j8.
Moments produced by linear stress blocks with a
maximum stress of afm as illustrated in figures
7.1(a) and (b) will be referred to as "elastic ultimate
moments" (Me).
7.2.2. Cross-Sectional Moment Capacity
7.2.2.1. Solid Prismatic Sections
It has been noted in the previous section that ob-
served stress-strain properties of the masonry tested
justify the conservative assumption of a linear dis-
tribution of flexural bending stresses at failure. This
proposition is also based on the assumption that
plane sections remain plane under flexure and that
the presence of strain gradients will not materially
affect the linearity of the stress-strain relationships
shown in figure 7.1(c). Equations for the momentcapacity of solid prismatic sections derived herein
are based on the above assumptions.
* The kern is the portion of the area of the cross section through
which a resultant compressive force must pass if it causes no ten-
sile stress in the cross section.
Figure 7.2(a) shows a solid prismatic section of
width b and thickness t, acted upon by a vertical load
P at an eccentricity e relative to the section centroid
as shown in the figure.
NEUTRAL AXIS
fm COMPRESSION
(o) WALL SECTIONPLAN VIEW
I b) AXIAL LOADING
COMPRESSIONM, ^
> piT
TENSION
ft
TOfjr
I K- CRACK
t/2
(c) FLEXURE (d) CRACKED SECTION
Figure 7.2. Stress distrib ution.
Figure 7.2(b) shows the stress distribution at
failure under axial compressive load. The axial load
capacity Po can be derived by equihbrium:
Po =f'mbt = Af',n (7.1)
where: /m = Compressive strength of masonry de-
termined from axial prism test,
^ = Area of net section.
Figure 7.1(b) illustrates the stress distribution
when a section is loaded to capacity by a vertical
load, applied at the edge of the kern. At this stress
distribution there will be zero stress at the outer
fibers on one side of the section.
Thus: PkCkC ^PkIn A
In
Ac 6
where: e/, = Distance from centroid to edge of kern.Pa = Vertical load capacity when load is
apphed at the edge of the kern,c= Distance from centroid to outer fiber,
/„ = Moment of inertia of section based onuncracked net section.
25
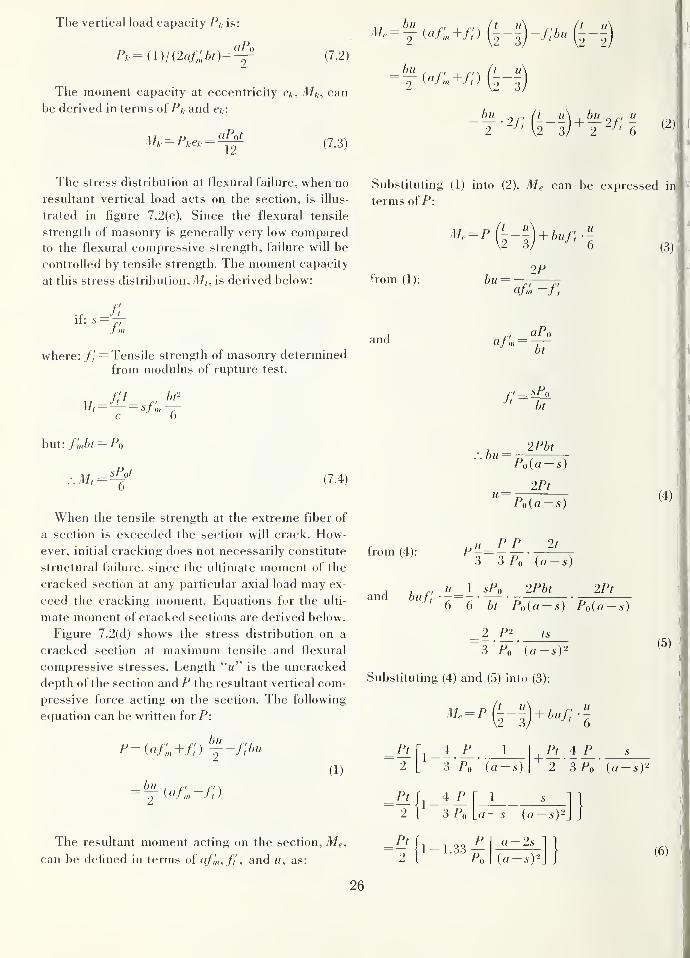
The vertical load capacity Pk is:
(7.2)
The moment capacity at eccentricity e^, M^, can
be derived in terms of f*A and eA-:
Ma- kekaPpt
12(7.3)
bu
The stress distribution at flexural failure, when no
resultant vertical load acts on the section, is illus-
trated in figure 7.2(c). Since the flexural tensile
strength of masonry is generally very low comparedto the flexural compressive strength, failure will be
controlled by tensile strength. The moment capacity
at this stress distribution, M^, is derived below:
• c ftii: 5 = TT
/"I
where: f\= Tensile strength of masonry determined
from modulus of rupture test.
/// he-
c 6
Substituting (1) into (2), Me can be expressed inf
terms of P:
("rom (1):
and
M,=/'(|^;;)+6./;,, u
6
IP
afr'n -ft
,_aPo
bt
^' ~ ht
(3)l'i
but: f'mbt^Po
:. M,_sPot
(7.4)
When the tensile strength at the extreme fiber of
a section is exceeded the section will crack. How-
ever, initial cracking does not necessarily constitute
structural failure, since the ultimate moment of the
cracked section at any particular axial load may ex-
ceed the cracking moment. Equations for the ulti-
mate moment of cracked sections are derived below.
Figure 7.2(d) shows the stress distribution on a
cracked section at maximum tensile and flexural
compressive stresses. Length "u" is the uncracked
depth of the section and P the resultant vertical com-
pressive force acting on the section. The following
equation can be written for P:
p= (of:„+/;) j-fbu(1)
bu , //
=Y("y,-/;)
from (4):
•. bu2Pbt
Po(a-s)
2Pt
Po{a-s)
and buf^
3 3Po {a-s)
, u 1 sPo 2Pbt
(4)
2Pt
6 6 bt Po(a-s) Poia-s)
2 P2 ts
3 Po {a-sy-
Substituting (4) and (5) into (3):
(5)
Pi'
2
Pt
4 P 1
3 Po ia-s)
1
2 3Po {a-sY
4P3Po a — s {(i — s)-
The resultant moment acting on the section. Me,
can be defined in terms oi afm-, ft , and w, as:
Pt P1.33-r 0
a — 2s
_{a-sy-_(6)
26
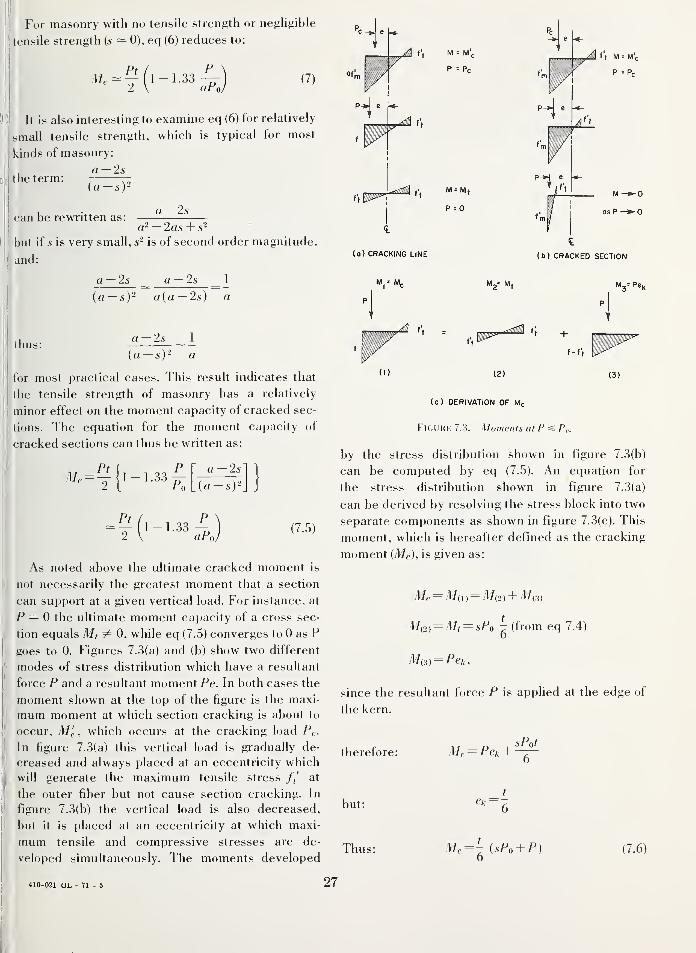
I For masonry with no tensile strength or negligible
tensile strength {s — 0), eq (6) reduces to:
(7)
It is also interesting to examine eq (6) for relatively
small tensile strength, which is typical for most
kinds of masonry:
a -2sthe term:
a-2scan be rewritten as:
fl2 — 2as + 5^
but if s is very small, s'- is of second order magnitude,
and:
a — 2s ^ a — 2s _ 1
(a — s)- a(a — 2s) a
thus:25
( a — 5 ) a
for most practical cases. This result indicates that
the tensile strength of masonry has a relatively
minor effect on the moment capacity of cracked sec-
tions. The equation for the moment capacity of
cracked sections can thus be written as:
Pt i P a — 2s
Pi
21-1.33
(a-s)2j
aPo(7.5)
As noted above the ultimate cracked moment is
not necessarily the greatest moment that a section
can support at a given vertical load. For instance, at
P = 0 the ultimate moment capacity of a cross sec-
tion equals Mt 0, while eq (7.5) converges to 0 as P
goes to 0. Figures 7.3(a) and (b) show two different
modes of stress distribution which have a resultant
force P and a resultant moment Pe. In both cases the
moment shown at the top of the figure is the maxi-
mum moment at which section cracking is about to
occur, Mc , which occurs at the cracking load Pc-
In figure 7.3(a) this vertical load is gradually de-
creased and always placed at an eccentricity which
will generate the maximum tensile stress // at
the outer fiber but not cause section cracking. In
figure 7.3(b) the vertical load is also decreased,
but it is placed at an eccentricity at which maxi-
mum tensile and compressive stresses are de-
veloped simultaneously. The moments developed
(c) DERIVATION OF Mc
Figure 7.3. Moments at P s P,..
by the stress distribution shown in figure 7.3(b)
can be computed by eq (7.5). An equation for
the stress distribution shown in figure 7.3(a)
can be derived by resolving the stress block into two
separate components as shown in figure 7.3(c). This
moment, which is hereafter defined as the cracking
moment {Mc), is given as:
Mc = M(i,= M(2) + M(3)
M^2)= Mr = sPQ ^ (from eq 7.4)
since the resultant force P is applied at the edge of
the kern.
therefore:
but:
Thus:
Mc = Pe,+sPiit
Mc = 2 isPo + P)0
(7.6)
410-021 OL - 71 - 5 27
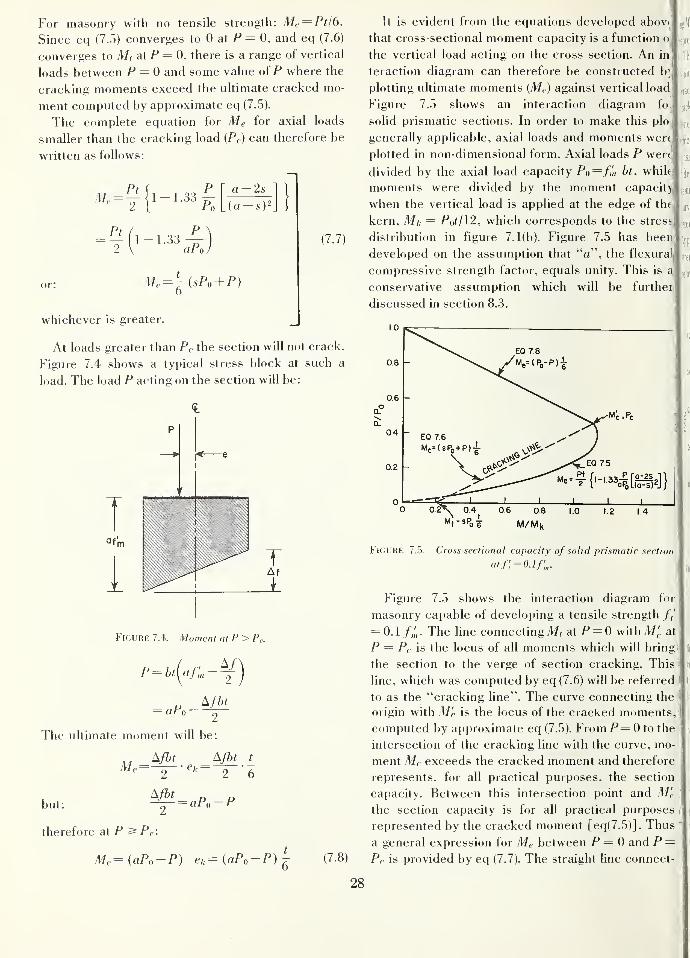
For masonry with no tensile strengtli: Mc = f^tl6.
Since eq (7.5) converges to 0 at P = 0, and eq (7.6)
converges to M, al P = 0, there is a range of vertical
loads between P = 0 and some value of P where the
cracking moments exceed the ultimate cracked mo-
ment computed by approximate eq (7.5).
The complete equation for Me for axial loads
smaller than the cracking load (Pc) can therefore be
written as follows:
Mp =— 1-1.33-5-2 [ Po lia-s)-
Pt1-1.33
aPo
or: Me = 2 (sPo + P)o
(7.7)
whichever is greater.
At loads greater than P,- the section will not crack.
Figure 7.4 shows a typical stress block at such a
load. The load P acting on the section will be:
T
JL
Figure 7.4. Moment at P > Pc.
p=bt{<if;n-Y)
= aPo—The ultimate moment will be:
/\fbt ^.fbt t
but:
2 2 6
aPo-P
therefore at P ^ Pc:
M.= (aPo-P) eA-(aPo-P)^ (7.8)
It is evident from the equations developed abovi
that cross-sectional moment capacity is a function o
the vertical load acting on the cross section. An in
teraction diagram can therefore be constructed b'
plotting ultimate moments (Me) against vertical load
Figure 7.5 shows an interaction diagram foj
solid prismatic sections. In order to make this plo
generally applicable, axial loads and moments wert
plotted in non-dimensional form. Axial loads P wer^
divided by the axial load capacity Po=//h bt, while
moments were divided by the moment capacit)|
when the vertical load is applied at the edge of the
kern, M/, = Po?/12, which corresponds to the stress,
distribution in figure 7.1(b). Figure 7.5 has been;
developed on the assumption that "a", the flexural
compressive strength factor, equals unity. This is c(|
conservative assumption which will be further
discussed in section 8.3.
10
0.8 -
wad
aluf
»[
0.6 -
CL
Q.
0.4 -
0.2 -
0.2^ 04 0.6 0.8 1.0 1.2 1.4
M/Mk
Figure 7.5. Cross-sectional capacity of solid prismatic section
at f; =0.1/:,^.
Figure 7.5 shows the interaction diagram for
masonry capable of developing a tensile strength //
= 0.1 /,;,. The hne connecting/!/, at P = 0 with M;; at
P = Pc is the locus of all moments which will bring
the section to the verge of section cracking. This
line, which was computed by eq (7.6) will be referred
to as the "cracking line". The curve connecting the
origin with M'c is the locus of the cracked momentscomputed by approximate eq (7-5). From P= 0 to the
intersection of the cracking line with the curve, moment Mc exceeds the cracked moment and therefore
represents, for all practical purposes, the section
capacity. Between this intersection point and M'e
the section capacity is for all practical purposes
represented by the cracked moment [eq(7.5)]. Thus
a general expression for Me between P = 0 and P =Pc is provided by eq (7.7). The straight line connect-
28
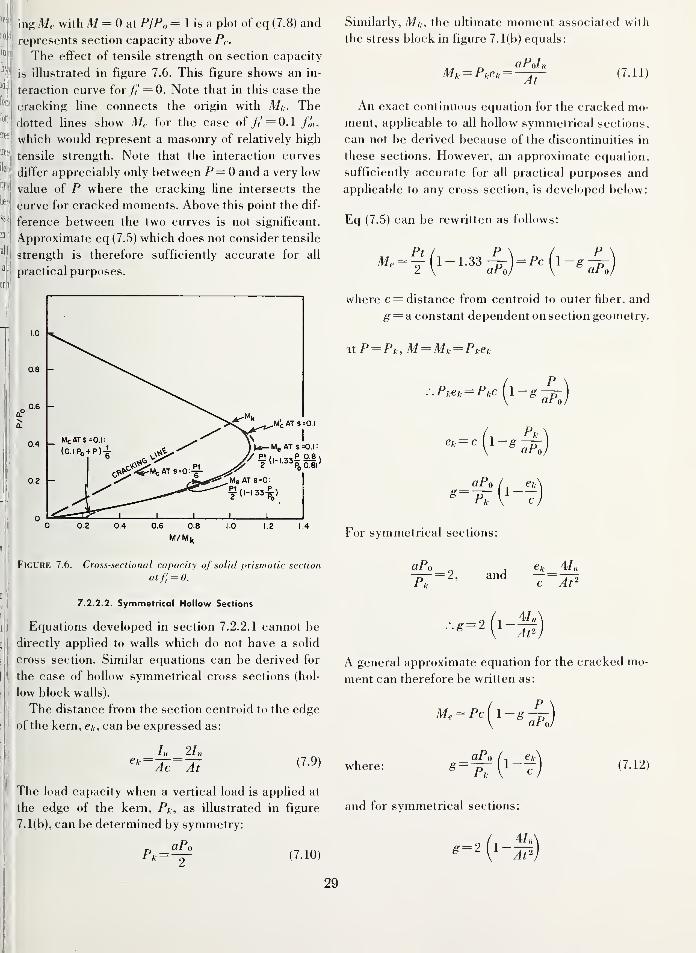
ing Mc with A/ = 0 at P/Po = 1 is a plot of eq (7.8) and
represents section capacity above Pc-
The efifect of tensile strength on section capacity
is illustrated in figure 7.6. This figure shows an in-
teraction curve forfi' — O. Note that in this case the
cracking line connects the origin with Ma. The
dotted lines show M,. for the case of // = 0.1
which would represent a masonry of relatively high
tensile strength. Note that the interaction curves
differ appreciably only between P=0 and a very low
value of P where the cracking line intersects the
curve for cracked moments. Above this point the dif-
ference between the two curves is not significant.
Approximate eq (7.5) which does not consider tensile
strength is therefore sufficiently accurate for all
practical purposes.
Mr AT s =0 1
Me AT S=0.|:
V P!(|.|33P OJ)
Figure 7.6. Cross-sectional capacity of solid prismatic section
atf; = 0.
7.2.2.2. Symmetrical Hollow Sections
Equations developed in section 7.2.2.1 cannot be
directly applied to walls which do not have a solid
cross section. Similar equations can be derived for
the case of hollow symmetrical cross sections (hol-
low block walls).
The distance from the section centroid to the edge
of the kern, e^, can be expressed as:
Ac2hAt (7.9)
The load capacity when a vertical load is applied at
the edge of the kern, P/,, as illustrated in figure
7.1(b), can be determined by symmetry:
2(7.10)
Similarly, A//,, the ultimate moment associated with
the stress block in figure 7.1(b) equals:
Mk= Pkek =aPJnAt
(7.11)
An exact continuous equation for the cracked mo-
ment, applicable to all hollow symmetrical sections,
can not be derived because of the discontinuities in
these sections. However, an approximate equation,
sufficiently accurate for all practical purposes and
applicable to any cross section, is developed below:
Eq (7.5) can be rewritten as follows:
TIT =''Ml-«aPf)/
where c = distance from centroid to outer fiber, and
^= a constant dependent on section geometry.
Jt />= />,, M = M, =/>Ki
eA = c l-gaPo
aPo [ ., Ck
For symmetrical sections:
aP,
Pa-' and —=
At^
^=2 1-4̂^Af^
A general approximate equation for the cracked mo-
ment can therefore be written as:
Me Pc l-gaPo,
/here:gPo
Pa(7.12)
and for symmetrical sections:
g=2 14^
'At^
29
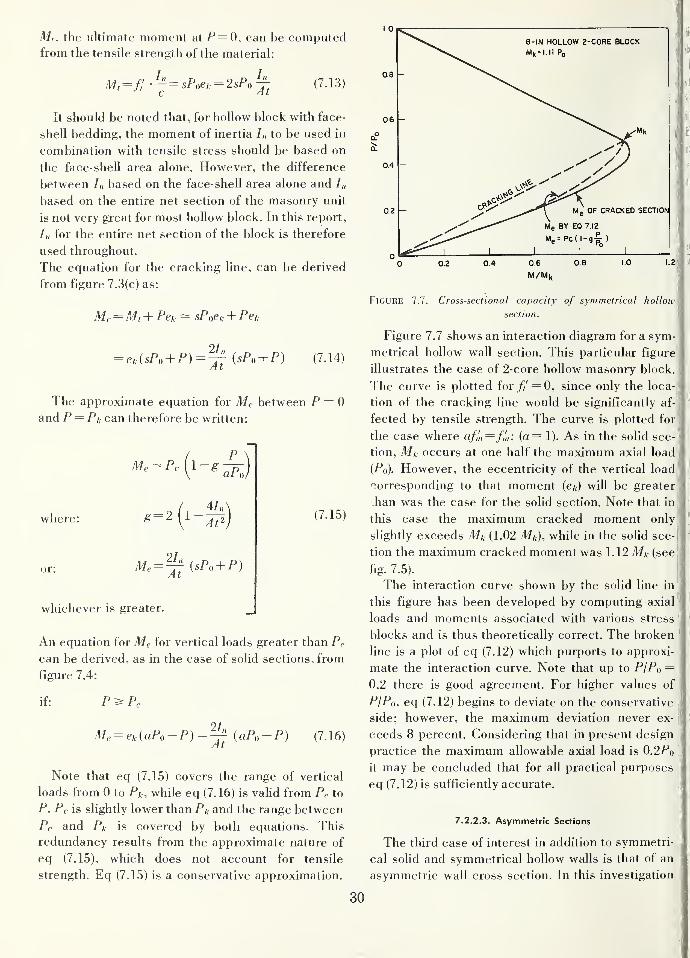
Ml, the ultimate moment at P = 0, can be computedfrom the tensile strength of the material:
M,=f;^-f
= sP,e, = 2sP,j-^ (7.13)
It should be noted that, for hollow block with face-
shell bedding, the moment of inertia /„ to be used in
combination with tensile stress should be based on
the face-shell area alone. However, the difference
between /„ based on the face-shell area alone and /„
based on the entire net section of the masonry unit
is not very great for most hollow block. In this report,
/„ for the entire net section of the block is therefore
used throughout.
The equation for the cracking line, can be derived
from figure 7.3(c) as:
Mc= M> + Pek - sPoek + Pe,
^e,{sPo +P)=^ [sPo + P] (7.14)
The approximate equation for M(. between P = 0
and P— Pi; can therefore be written:
where: ^=2 1- 4^
or:/xt
(7.15)
whichever is greater.
An equation for Me for vertical loads greater than P(
can be derived, as in the case of solid sections, from
figure 7.4:
if: P^Pr
2InMe = e,{aPo-P)^^ iaPo-P) (7.16)
Note that eq (7.15) covers the range of vertical
loads from 0 to Pk, while eq (7.16) is valid from Pc to
P. Pc is slightly lower than Pa and the range between
Pr and Ph is covered by both equations. This
redundancy results from the approximate nature of
eq (7.15), which does not account for tensile
strength. Eq (7.15) is a conservative approximation.
8-IN HOLLOW 2-CORE BLOCK
Mk = I,II Po
M. OF CRACKED SECTION
Figure 7.7.
1.2s
Cross-sectional capacity of symmetrical hollow
section.
Figure 7.7 shows an interaction diagram for a sym-
metrical hollow wall section. This particular figure
illustrates the case of 2-core hollow masonry block.
The curve is plotted for // = 0, since only the loca-
tion of the cracking line would be significantly af-
fected by tensile strength. The curve is plotted for
the case where a/»', =/,',: {a= 1). As in the soHd sec-
tion. Ml; occurs at one half the maximum axial load
(Po). However, the eccentricity of the vertical load
'corresponding to that moment (e^) will be greater
han was the case for the solid section. Note that in
this case the maximum cracked moment only
slightly exceeds Mk (1.02 Mk), while in the solid sec-
tion the maximum cracked moment was 1.12 Ma- (see
fig. 7.5).
The interaction curve shown by the solid line in
this figure has been developed by computing axial
loads and moments associated with various stress
blocks and is thus theoretically correct. The broken
line is a plot of eq (7.12) which purports to approxi-
mate the interaction curve. Note that up to P/Po =0.2 there is good agreement. For higher values of
P/Po, eq (7.12) begins to deviate on the conservative
side; however, the maximum deviation never ex-
ceeds 8 percent. Considering that in present design
practice the maximum allowable axial load is 0.2Po
it may be concluded that for all practical purposes
eq (7.12) is sufficiently accurate.
7.2.2.3. Asymmetric Sections
The third case of interest in addition to symmetri-
cal solid and symmetrical hollow walls is that of an
asymmetric wall cross section. In this investigation
30
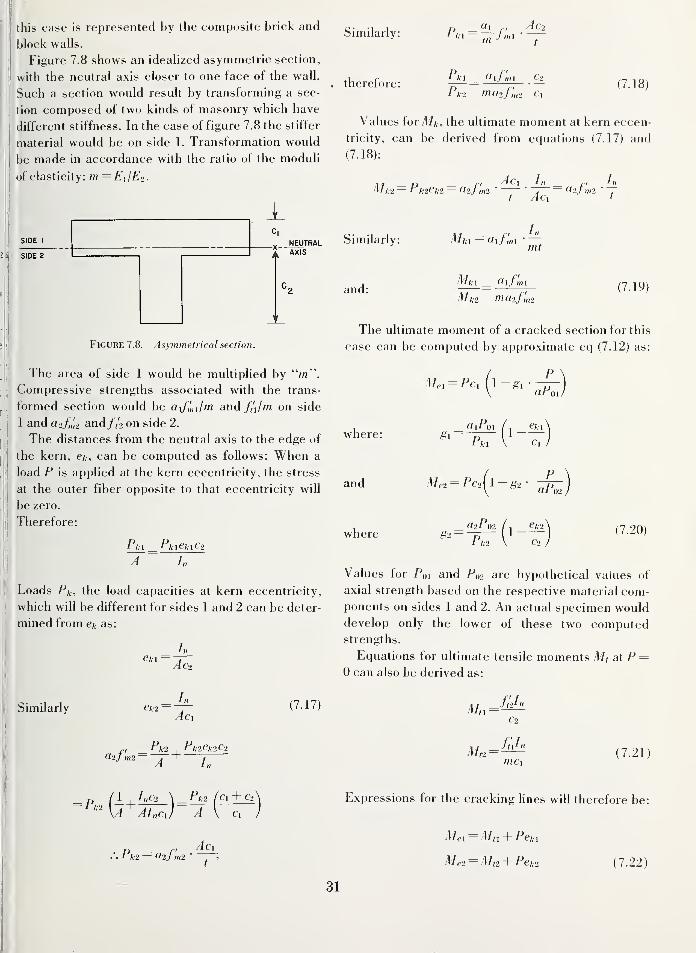
this case is represented by the composite brick and
block walls.
Figure 7.8 shows an ideahzed asymmetric section,
with the neutral axis closer to one face of the wall.
Such a section would result by transforming a sec-
tion composed of two kinds of masonry which have
different stiffness. In the case of figure 7.8 the stiffer
material would be on side 1. Transformation would
be made in accordance with the ratio of the moduli
of elasticity: m = E]IE2.
SIDE I
SIDE 2
NEUTRALAXIS
Figure 7.8. Asymmetrical section.
The area of side 1 would be multiplied by "m".
Compressive strengths associated with the trans-
formed section would be aif,'„Jm and fn/m on side
1 and a2f,n2 and ft'2 on side 2.
The distances from the neutral axis to the edge of
the kern, Ck-, can be computed as follows: When a
load P is applied at the kern eccentricity, the stress
at the outer fiber opposite to that eccentricity will
be zero.
Therefore:
A In
Loads Pa, the load capacities at kern eccentricity,
which will be different for sides 1 and 2 can be deter-
mined from ca as:
eA i
'Jn_AC2
Similarly:
therefore:
n ri Ac2' ~ m ~T
Pin ^ aifnn_£2
Pb2 muzf'mt Cx(7.18)
Values for Ma , the ultimate moment at kern eccen-
tricity, can be derived from equations (7.17) and
(7.18):
MD // AC\ In // III
k2 = Pk2eh2 = a2j ml -7—— OLij m2—
t Aci '
Similarly:
and:
mt
Cllfml
Mk2 mciif'nri
(7.19)
The ultimate moment of a cracked section for this
case can be computed by approximate eq (7.12) as:
M,, = Pc, [l-gxaP,n
^here:fliPoi /i ek\=
I i^'
PkX \ c,
and M.2-Pc2(l-g2 - ^)
^here('2P02 ,
1ek:
Co
(7.20)
Values for Poi and Po^ are hypothetical values of
axial strength based on the respective material com-ponents on sides 1 and 2. An actual specimen woulddevelop only the lower of these two computedstrengths.
Equations for ultimate tensile moments M, at P =0 can also be derived as:
Similarly ek2'
Aci
,., _ Pk2 ,Pk2ek2C2
«2/m2— ^ +J
(7.17)
Mr.
C2
__f;jn
mCl(7.21)
p ,Ir,C2 \_Pk2(Cx + C2
^''^A^AIncJ- A [ cx
. 1^2 — (IZJ m2
Expressions for the cracking lines will therefore be:
Mci^Mn + Peki
Mc2^M,2 + Pek2 (7.22)
31
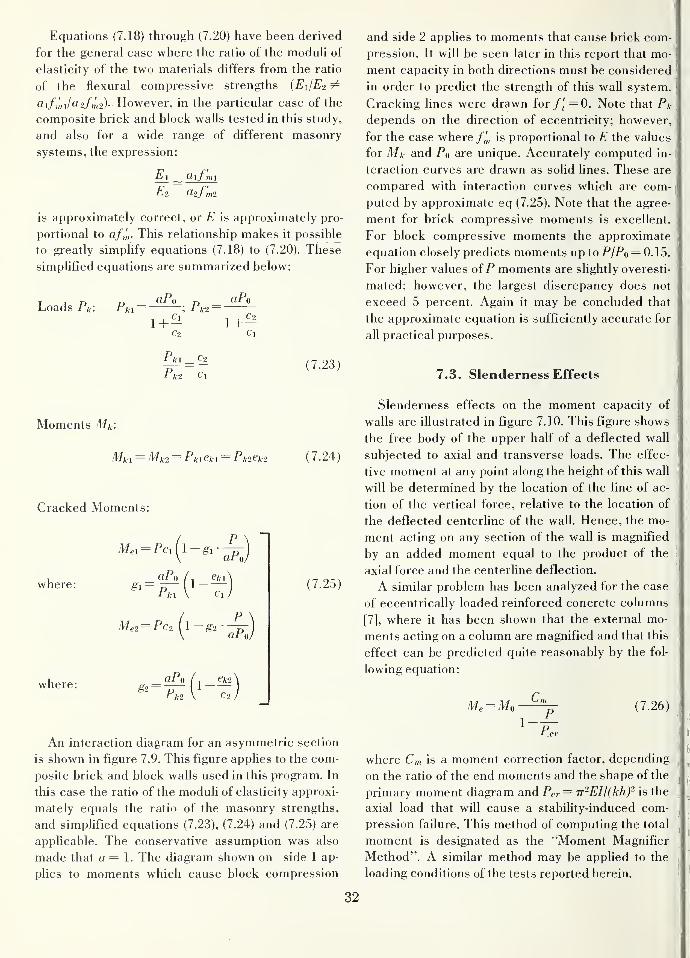
Equations (7.18) through (7.20) have been derived
for the general case where the ratio of the moduh of
elasticity of the two materials differs from the ratio
of the flexural compressive strengths (EJE-z 7^
difmilo-^fm-z)- However, in the particular case of the
composite brick and block walls tested in this study,
and also for a wide range of different masonry
systems, the expression:
E2
a\f'm
a^fm
is approximately correct, or E is approximately pro-
portional to a/„',.. This relationship makes it possible
to greatly simplify equations (7.18) to (7.20). These
simplified equations are summarized below:
Loads Pk: Pki =aPo
1 + (A
C-2
1 +C2
Cl
Pjn.
Pk2
£2
Cl(7.23)
and side 2 applies to moments that cause brick com-
pression. It will be seen later in this report that mo-
ment capacity in both directions must be considered
in order to predict the strength of this wall system.
Cracking lines were drawn for f't=0. Note that Pkdepends on the direction of eccentricity; however,
for the case where //„ is proportional to E the values
for Mk and Po are unique. Accurately computed in-
teraction curves are drawn as solid lines. These are
compared with interaction curves which are com-
puted by approximate eq (7.25). Note that the agree-
ment for brick compressive moments is excellent.
For block compressive moments the approximate
equation closely predicts moments up to P/Po = 0.15.
For higher values of P moments are slightly overesti-
mated; however, the largest discrepancy does not
exceed 5 percent. Again it may be concluded that
the approximate equation is sufficiently accurate for
all practical purposes.
7.3. Slenderness Effects
Moments Ma-:
Mki = Mk2 = Pkieki = Pk2ek2
Cracked Moments:
wnere:
/ PMei^PcAl-gi--^
\ Clio
aPo 1-
where:
rki
M.2= PC2
aPo /, ek2
''=-h:2V'~2
(7.24)
7.25)
An interaction diagram for an asymmetric section
is shown in figure 7.9. This figure applies to the com-
posite brick and block walls used in this program. In
this case the ratio of the moduli of elasticity approxi-
mately equals the ratio of the masonry strengths,
and simplified equations (7.23), (7.24) and (7.25) are
applicable. The conservative assumption was also
made that a = 1. The diagram shown on side 1 ap-
plies to moments which cause block compression
Slenderness effects on the moment capacity of
walls are illustrated in figure 7.10. This figure shows
the free body of the upper half of a deflected wall
subjected to axial and transverse loads. The effec-
tive moment at any point along the height of this wall
will be determined by the location of the line of ac-
tion of the vertical force, relative to the location of
the deflected centerline of the wall. Hence, the mo-
ment acting on any section of the wall is magnified
by an added moment equal to the product of the
axial force and the centerline deflection.
A similar problem has been analyzed for the case
of eccentrically loaded reinforced concrete columns
[7], where it has been shown that the external mo-
ments acting on a column are magnified and that this
effect can be predicted quite reasonably by the fol-
lowing equation:
Cn
1P_
Per
(7.26)
where Cm is a moment correction factor, depending
on the ratio of the end moments and the shape of the
primary moment diagram and Pcr = Tr''EII(kh)'- is the
axial load that will cause a stability-induced com-
pression failure. This method of computing the total
moment is designated as the "Moment Magnifier
Method". A similar method may be applied to the
loading conditions of the tests reported herein.
32
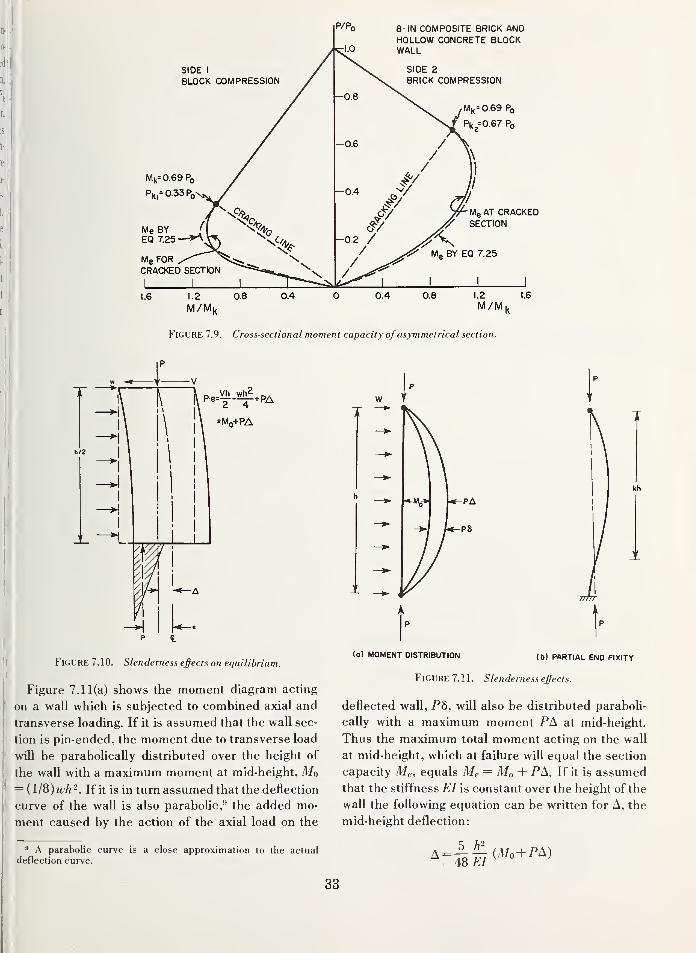
p/p,
SIDE I
BLOCK COMPRESSION
M|^= 0.69 Pq
Pk,= 0.33Po
Me BYEQ 7.25
8- IN COMPOSITE BRICK ANDHOLLOW CONCRETE BLOCKWALL
SIDE 2
BRICK COMPRESSION
Mk=0.69 Po
Me FORCRACKED SECTION
I \ L
Me AT CRACKEDSECTION
Me BY EQ 7.25
1.6 1.2 0.8 0.4 0.4 0.8 1.2 1.6
Figure 7.9. Cross-sectional moment capacity of asymmetrical section.
T p.e=|l-W§i.PA
=Mo+PA
j!Figure 7.10. Slendemess efiects on equilibrium.
Figure 7.11(a) shows the moment diagram acting
jljon a wall which is subjected to combined axial and
' transverse loading. If it is assumed that the wall sec-
tion is pin-ended, the moment due to transverse load
)| will be parabolicaUy distributed over the height of
the wall with a maximum moment at mid-height, Mo= {ll8)wh'-. If it is in turn assumed that the deflection
curve of the waU is also parabolic,^ the added mo-
ment caused by the action of the axial load on the
' A parabolic curve is a close approximation to the actualdeflection curve.
w—>p
fv
kh
-PA
-P8
(o) MOMENT DISTRIBUTION (b) PARTIAL END FIXITY
Figure 7.11. Slenderness effects.
deflected wall, PS, will also be distributed paraboli-
caUy with a maximum moment PA at mid-height.
Thus the maximum total moment acting on the waUat mid-height, which at failure will equal the section
capacity Me, equals Me = Mo + PA. If it is assumed
that the stiffness EI is constant over the height of the
wall the following equation can be written for A, the
mid-height deflection:
^=11 (*'«+''^'
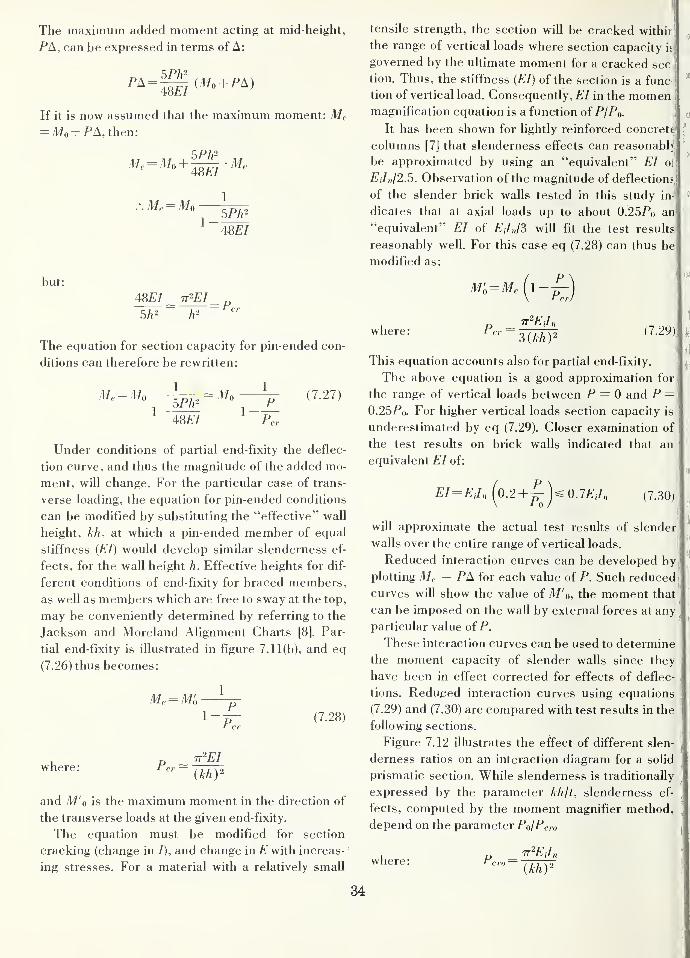
The maximum added moment acting at mid-height,
PA, can be expressed in terms of A:
If it is now assumed that the maximum moment: Me= Mo + PA, then:
48£/
.-. Me = Mo
but:
48£/
5/? 2
1
5Ph^
48£/
The equation for section capacity for pin-ended con-
ditions can therefore be rewritten:
Me^Mo1
5Ph^
48£/
Mo [1:21]
1-
Under conditions of partial end-fixity the deflec-
tion curve, and thus the magnitude of the added mo-
ment, will change. For the particular case of trans-
verse loading, the equation for pin-ended conditions
can be modified by substituting the "effective" wall
height, kh, at which a pin-ended member of equal
stiffness {EI) would develop similar slenderness ef-
fects, for the wall height h. Effective heights for dif-
ferent conditions of end-fixity for braced members,
as well as members which are free to sway at the top,
may be conveniently determined by referring to the
Jackson and Moreland Alignment Charts [8]. Par-
tial end-fixity is illustrated in figure 7.11(b), and eq
(7.26) thus becomes:
Me= M'o-1
1P_
Per(7.28)
^here: Per —n-EI
{khV
and M'o is the maximum moment in the direction of
the transverse loads at the given end-fixity.
The equation must be modified for section
cracking (change in /), and change in E with increas-
ing stresses. For a material with a relatively small
tensile strength, the section will be cracked withir
the range of vertical loads where section capacity h
governed by the ultimate moment for a cracked sec
tion. Thus, the stiffness (EI) of the section is a func
tion of vertical load. Consequently, EI in the momenmagnification equation is a function of P/Po.
It has been shown for lightly reinforced concret<i
columns [7] that slenderness effects can reasonablt
be approximated by using an "equivalent" EI ol
P;/h/2.5. Observation of the magnitude of deflections
of the slender brick walls tested in this study in-
dicates that at axial loads up to about 0.25Po an
"equivalent" EI of £',7»/3 will fit the test results
reasonably well. For this case eq (7.28) can thus be
modified as:
M,;=M„(i-£)
where: Per -TT^EJ,,
(7.29)Sikh)''
This equation accounts also for partial end-fixity.
The above equation is a good approximation for
the range of vertical loads between P — 0 and P =0.25Po. For higher vertical loads section capacity is
underestimated by eq (7.29). Closer examination of
the test results on brick walls indicated that an
equivalent EI of:
EI Eil„ (0.2 +^ O.lEJn (7.30)
will approximate the actual test results of slender
walls over the entire range of vertical loads.
Reduced interaction curves can be developed by
plotting Me — PA for each value of P. Such reduced
curves will show the value of M'o, the moment that
can be imposed on the wall by external forces at any^
particular value of P.
These interaction curves can be used to determine
the moment capacity of slender walls since they
have been in effect corrected for effects of deflec-
tions. Reduced interaction curves using equations
(7.29) and (7.30) are compared with test results in the
following sections.
Figure 7.12 illustrates the effect of different slen-
derness ratios on an interaction diagram for a solid
prismatic section. While slenderness is traditionally
expressed by the parameter khjt, slenderness ef-
fects, computed by the moment magnifier method,
depend on the parameter PojPcro
where: Pcro(kh)'
34
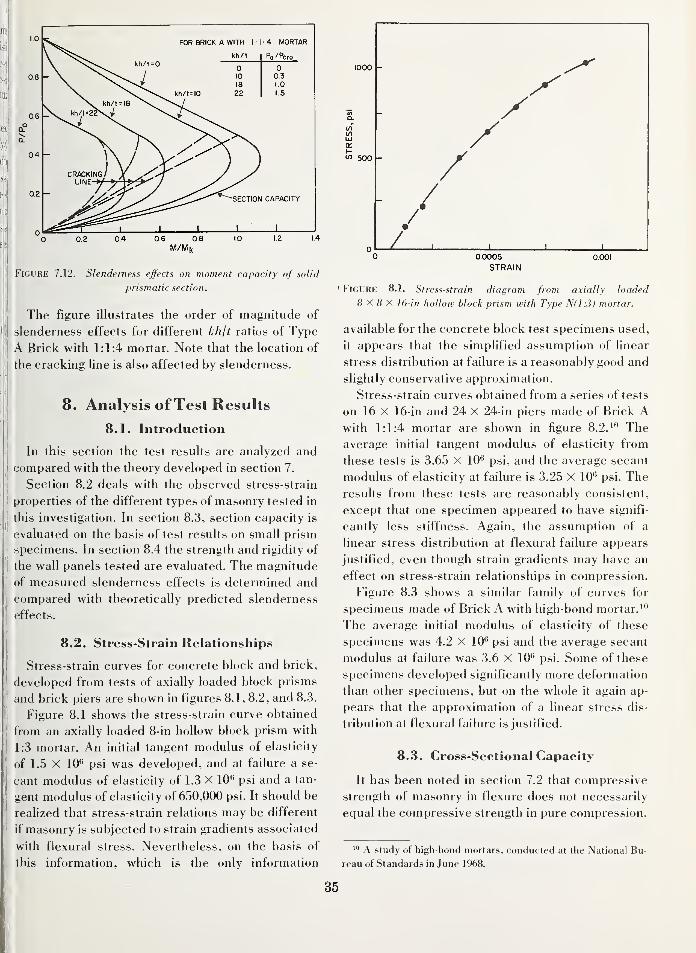
FOR BRICK A WITH I M 4 MORTAR
kh/t
0 010 0318 1.0
22 1.5
SECTION CAPACITY
Figure 7.12. Slenderness effects on moment capacity of solid
prismatic section.
The figure illustrates the order of magnitude of
slenderness effects for different kh/t ratios of Type
A Brick with 1:1:4 mortar. Note that the location of
the cracking line is also affected by slenderness.
8. Analysis ofTest Results
8.1. Introduction
In this section the test results are analyzed and
compared with the theory developed in section 7.
Section 8.2 deals with the observed stress-strain
properties of the different types of masonry tested in
this investigation. In section 8.3, section capacity is
evaluated on the basis of test results on small prism
specimens. In section 8.4 the strength and rigidity of
the wall panels tested are evaluated. The magnitude
of measured slenderness effects is determined and
compared with theoretically predicted slenderness
effects.
8.2. Stress-Strain Relationships
Stress-strain curves for concrete block and brick,
developed from tests of axially loaded block prisms
and brick piers are shown in figures 8.1, 8.2, and 8.3.
Figure 8.1 shows the stress-strain curve obtained
from an axially loaded 8-in hollow block prism with
1:3 mortar. An initial tangent modulus of elasticity
of 1.5 X 10** psi was developed, and at failure a se-
cant modulus of elasticity of 1.3 X lO** psi and a tan-
gent modulus of elasticity of 650,000 psi. It should be
reaUzed that stress-strain relations may be different
if masonry is subjected to strain gradients associated
with flexural stress. Nevertheless, on the basis of
this information, which is the only information
' Figure 8.1. Stress-strain diagram from axially loaded
8 X 8 X 16-in hollow block prism with Type N(l:3) mortar.
available for the concrete block test specimens used,
it appears that the simplified assumption of linear
stress distribution at failure is a reasonably good and
slightly conservative approximation.
Stress-strain curves obtained from a series of tests
on 16 X 16-in and 24 X 24-in piers made of Brick Awith 1:1:4 mortar are shown in figure 8.2.'"' Theaverage initial tangent modulus of elasticity from
these tests is 3.65 X 10** psi, and the average secant
modulus of elasticity at failure is 3.25 X 10** psi. The
results from these tests are reasonably consistent,
except that one specimen appeared to have signifi-
cantly less stiffness. Again, the assumption of a
linear stress distribution at flexural failure appears
justified, even though strain gradients may have an
effect on stress-strain relationships in compression.
Figure 8.3 shows a similar family of curves for
specimens made of Brick A with high-bond mortar.*"
The average initial modulus of elasticity of these
specimens was 4.2 X 10^ psi and the average secant
modulus at failure was 3.6 X 10'' psi. Some of these
specimens developed significantly more deformation
than other specimens, but on the whole it again ap-
pears that the approximation of a linear stress dis-
tribution at flexural failure is justified.
8.3. Cross-Sectional Capacity
It has been noted in section 7.2 that compressive
strength of masonry in flexure does not necessarily
equal the compressive strength in pure compression.
A study of high-bond mortars, conducted at the National Bu-
reau of Standards in June 1968.
35
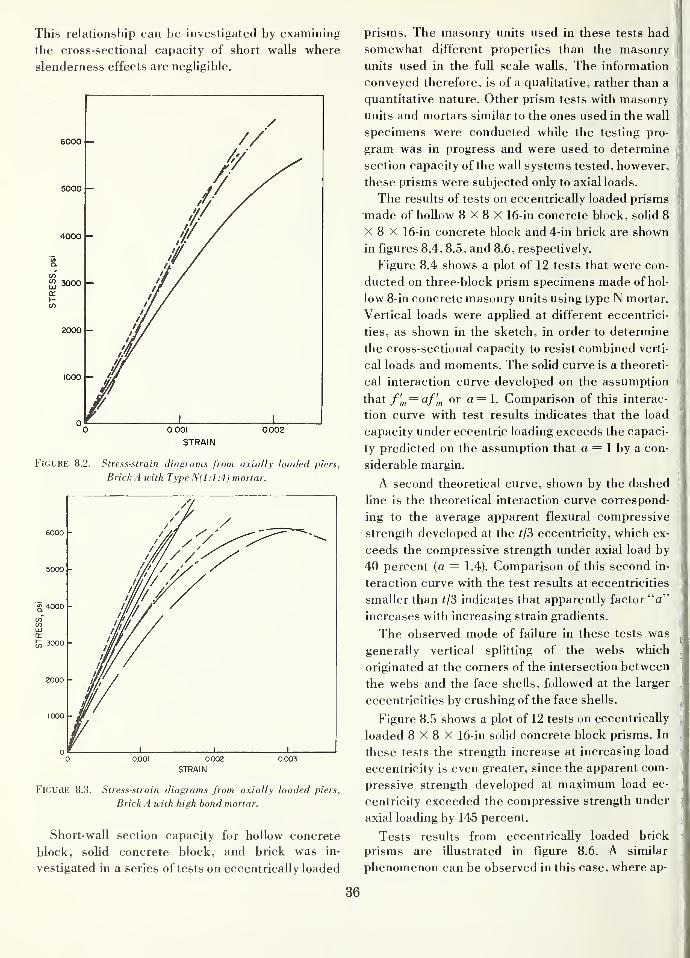
This relationship can be investigated by examining
the cross-sectional capacity of short walls where
slenderness effects are negligible.
STRAIN
Figure 8.2. Stress-strain diagrams from axially loaded piers.
Brick A with Type N(l:l:4) mortar.
STRAIN
FiGUrtE 8.3. Stress-strain diagrams from axially loaded piers.
Brick A with high bond mortar.
Short-wall section capacity for hollow concrete
block, solid concrete block, and brick was in-
vestigated in a series of tests on eccentrically loaded
prisms. The masonry units used in these tests had
somewhat different properties than the masonry
units used in the full scale walls. The information
conveyed therefore, is of a qualitative, rather than a
quantitative nature. Other prism tests with masonry
units and mortars similar to the ones used in the wall
specimens were conducted while the testing pro-
gram was in progress and were used to determine
section capacity of the wall systems tested, however,
these prisms were subjected only to axial loads.
The results of tests on eccentrically loaded prisms
made of hollow 8 X 8 X 16-in concrete block, solid 8
X 8 X 16-in concrete block and 4-in brick are shown
in figures 8.4, 8.5, and 8.6, respectively.
Figure 8.4 shows a plot of 12 tests that were con-
ducted on three-block prism specimens made of hol-
low 8-in concrete masonry units using type N mortar.
Vertical loads were applied at different eccentrici-
ties, as shown in the sketch, in order to determine
the cross-sectional capacity to resist combined verti-
cal loads and moments. The solid curve is a theoreti-
cal interaction curve developed on the assumption
that f'm = af'm or o.= \. Comparison of this interac-
tion curve with test results indicates that the load
capacity under eccentric loading exceeds the capaci-
ty predicted on the assumption that a = 1 by a con-
siderable margin.
A second theoretical curve, shown by the dashed
line is the theoretical interaction curve correspond-
ing to the average apparent flexural compressive
strength developed at the tjdi eccentricity, which ex-
ceeds the compressive strength under axial load by
40 percent [a = 1.4). Comparison of this second in-
teraction curve with the test results at eccentricities
smaller than ?/3 indicates that apparently factor "a"
increases with increasing strain gradients.
The observed mode of failure in these tests was
generally vertical splitting of the webs which
originated at the corners of the intersection between
the webs and the face shells, followed at the larger
eccentricities by crushing of the face shells.
Figure 8.5 shows a plot of 12 tests on eccentrically
loaded 8 X 8 X 16-in solid concrete block prisms. In
these tests the strength increase at increasing load
eccentricity is even greater, since the apparent com-
pressive strength developed at maximum load ec-
centricity exceeded the compressive strength under
axial loading by 145 percent.
Tests results from eccentrically loaded brick
prisms are illustrated in figure 8.6. A similar
phenomenon can be observed in this case, where ap-
36
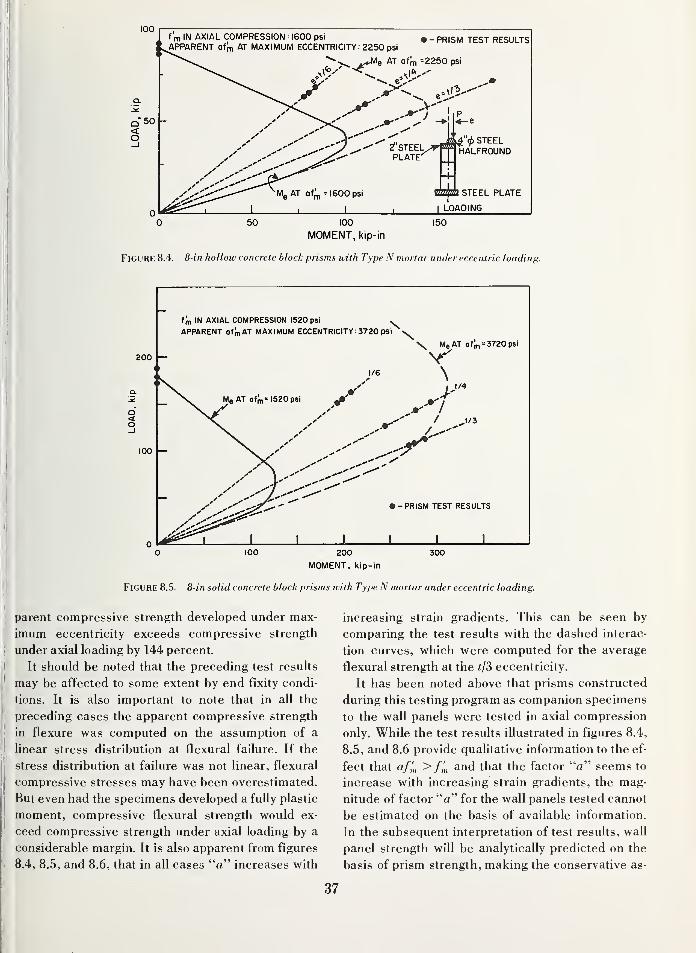
100f m IN AXIAL COMPRESSION 1600 psi
APPARENT afm AT MAXIMUM ECCENTRICITY 2250 psi
"^>^ AT afm =
• -PRISM TEST RESULTS
=2250 psi
2 STEEL
.
PLATE^
AT af '= 1600 psi
^"<^ STEELHALFROUND
STEEL PLATE
LOADING
100
MOMENT, kip-in
150
Figure 8.4. 8-in holloiv concrete block prisms with Type N mortar under eccentric loading.
200
fm IN AXIAL COMPRESSION 1520 psi
APPARENT afm AT MAXIMUM ECCENTRICITY: 3720 pSiX
M, AT aim' 1520 psi
t/6
\ Me AT afm '3720 psi
\
-PRISM TEST RESULTS
200
MOMENT, kip-in
300
Figure 8.5. 8-in solid concrete block prisms with Type N mortar under eccentric loading.
parent compressive strength developed under max-
imum eccentricity exceeds compressive strength
under axial loading by 144 percent.
It should be noted that the preceding test results
may be affected to some extent by end fixity condi-
tions. It is also important to note that in all the
preceding cases the apparent compressive strength
in flexure was computed on the assumption of a
linear stress distribution at flexural failure. If the
stress distribution at failure was not linear, flexural
compressive stresses may have been overestimated.
But even had the specimens developed a fuUy plastic
moment, compressive flexural strength would ex-
ceed compressive strength under axial loading by a
considerable margin. It is also apparent from figures
8.4, 8.5, and 8.6, that in all cases "a" increases with
increasing strain gradients. This can be seen by
comparing the test results with the dashed interac-
tion curves, which were computed for the average
flexural strength at the tl3 eccentricity.
It has been noted above that prisms constructed
during this testing program as companion specimens
to the wall panels were tested in axial compression
only. While the test results illustrated in figures 8.4,
8.5, and 8.6 provide qualitative information to the ef-
fect that a/,'„ > /,'„ and that the factor "a" seems to
increase with increasing strain gradients, the mag-
nitude of factor "a" for the wall panels tested cannot
be estimated on the basis of available information.
In the subsequent interpretation of test results, wall
panel strength will be analytically predicted on the
basis of prism strength, making the conservative as-
37
I
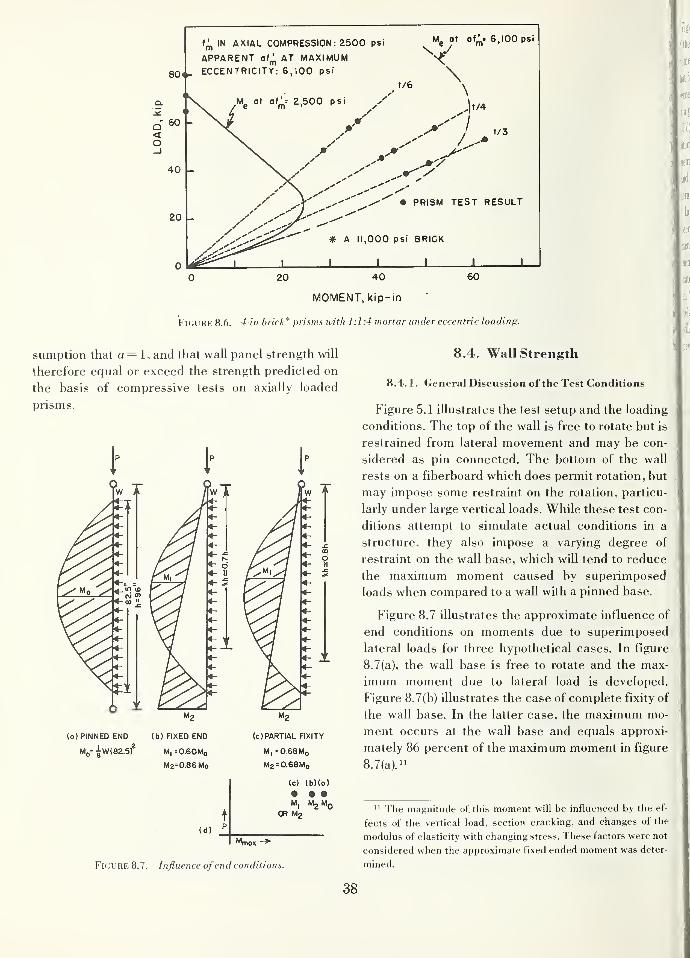
80(1-
IN AXIAL COMPRESSION; 2500 psi
APPARENT of^ AT MAXIMUMECCENTRICITY: 6,100 psi
<" of'= 2,500 psi yt/6
M„ of af'" 6,100 psi
\\
lt/4
t/3
• PRISM TEST RESULT
* A 11,000 psi BRICK
J I I _L
0 20 40 60
MOMENT, kip-in
Figure 8.6. 4-m brick* prisms with 1 :1 :4 mortar under eccentric loading.
sumption that a = 1, and that wall panel strength will
therefore equal or exceed the strength predicted on
the basis of compressive tests on axially loaded
prisms.
(a) PINNED END (b) FIXED END
M, =060Mo
M2=0.e6Mo
(d)
(c) PARTIAL FIXITY
M| =0.68 Mo
Mg^O.eSMo
(c) (b)(a)
• • •M,
OR M2
p
''ma*
8.4. Wall Strength
8.4.1. General Discussion of the Test Conditions
Figure 5.1 illustrates the test setup and the loading
conditions. The top of the wall is free to rotate but is
restrained from lateral movement and may be con-
sidered as pin connected. The bottom of the wall
rests on a fiberboard which does permit rotation, but
may impose some restraint on the rotation, particu-
larly under large vertical loads. While these test con-
ditions attempt to simulate actual conditions in a
structure, they also impose a varying degree of
restraint on the wall base, which will tend to reduce
the maximum moment caused by superimposed
loads when compared to a wall with a pinned base.
Figure 8.7 illustrates the approximate influence of
end conditions on moments due to superimposed
lateral loads for three hypothetical cases. In figure
8.7(a), the wall base is free to rotate and the max-
imum moment due to lateral load is developed.
Figure 8.7(b) illustrates the case of complete fixity of
the wall base. In the latter case, the maximum mo-
ment occurs at the wall base and equals approxi-
mately 86 percent of the maximum moment in figure
8.7(a)."
Figure 8.7. Influence ofend conditions.
" The magnitude of, this moment will be influenced by the ef-
fects of the vertical load, section cracking, and changes of the
modulus of elasticity with changing stress. These factors were not
considered when the approximate fixed ended moment was deter-
mined.
38
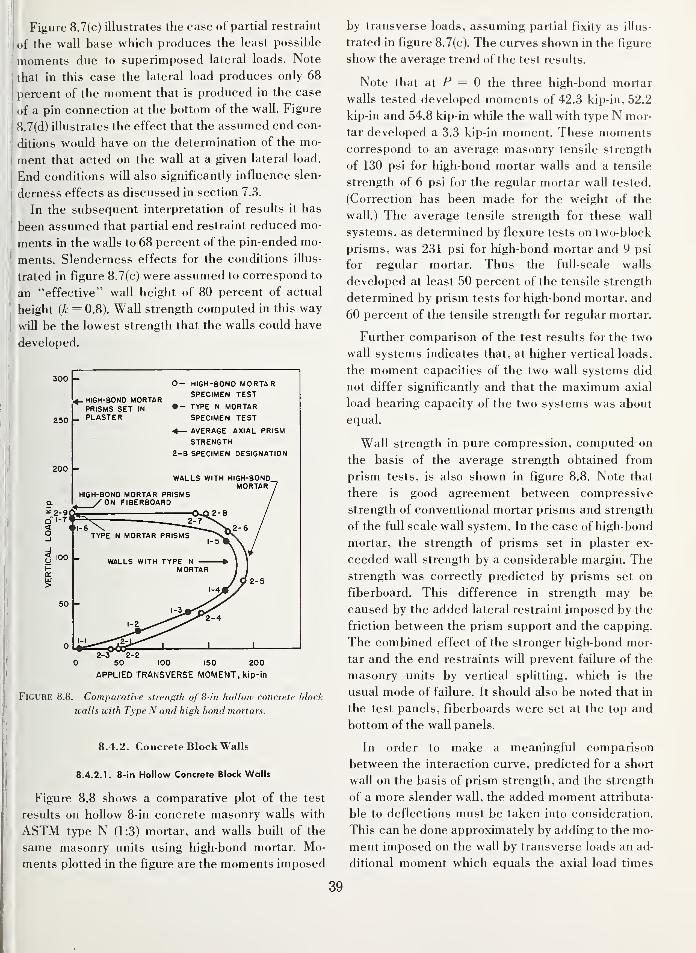
Figure 8.7(c) illustrates the case of partial restraint
of the wall base which produces the least possible
moments due to superimposed lateral loads. Note
that in this case the lateral load produces only 68
percent of the moment that is produced in the case
of a pin connection at the bottom of the wall. Figure
8.7(d) illustrates the effect that the assumed end con-
ditions would have on the determination of the mo-
ment that acted on the waU at a given lateral load.
End conditions will also significantly influence slen-
derness effects as discussed in section 7.3.
In the subsequent interpretation of results it has
been assumed that partial end restraint reduced mo-
ments in the walls to 68 percent of the pin-ended mo-
ments. Slenderness effects for the conditions illus-
trated in figure 8.7(c) were assumed to correspond to
an "effective" wall height of 80 percent of actual
height (A- = 0.8). WaU strength computed in this way
wUl be the lowest strength that the walls could have
developed.
300 -
200
O- HIGH-BOND MORTARSPECIMEN TEST
HIGH-BOND MORTARPRISMS SET IN •- TYPE N MORTAR
_ PLASTER SPECIMEN TEST
<4— AVERAGE AXIAL PRISM
STRENGTH
2-8 SPECIMEN DESIGNATION
WALLS WITH HIGH-BOND_MORTAR
HIGH-BONO MORTAR PRISMSON FI6ERB0AR0
:-8
100 150 200
APPLIED TRANSVERSE MOMENT, kip-in
Figure 8.8. Comparative strength of 8-in hollow concrete block
walls with Type N and high bond mortars.
8.4.2. Concrete Block Walls
8.4.2.1. 8-in Hollow Concrete Block Walls
Figure 8.8 shows a comparative plot of the test
results on hoUow 8-in concrete masonry walls with
ASTM type N (1:3) mortar, and walls built of the
same masonry units using high-bond mortar. Mo-
ments plotted in the figure are the moments imposed
by transverse loads, assuming partial fixity as illus-
trated in figure 8.7(c). The curves shown in the figure
show the average trend of the test results.
Note that at P = 0 the three high-bond mortar
walls tested developed moments of 42.3 kip-in, 52.2
kip-in and 54.8 kip-in while the wall with type N mor-
tar developed a 3.3 kip-in moment. These momentscorrespond to an average masonry tensile strength
of 130 psi for high-bond mortar walls and a tensile
strength of 6 psi for the regular mortar wall tested.
(Correction has been made for the weight of the
wall.) The average tensile strength for these wall
systems, as determined by flexure tests on two-block
prisms, was 231 psi for high-bond mortar and 9 psi
for regular mortar. Thus the full-scale walls
developed at least 50 percent of the tensile strength
determined by prism tests for high-bond mortar, and
60 percent of the tensile strength for regular mortar.
Further comparison of the test results for the two
wall systems indicates that, at higher vertical loads,
the moment capacities of the two wall systems did
not differ significantly and that the maximum axial
load bearing capacity of the two systems was about
equal.
Wall strength in pure compression, computed on
the basis of the average strength obtained from
prism tests, is also shown in figure 8.8. Note that
there is good agreement between compressive
strength of conventional mortar prisms and strength
of the full scale wall system. In the case of high-bond
mortar, the strength of prisms set in plaster ex-
ceeded wall strength by a considerable margin. The
strength was correctly predicted by prisms set on
fiberboard. This difference in strength may be
caused by the added lateral restraint imposed by the
friction between the prism support and the capping.
The combined effect of the stronger high-bond mor-
tar and the end restraints will prevent failure of the
masonry units by vertical splitting, which is the
usual mode of failure. It should also be noted that in
the test panels, fiberboards were set at the top and
bottom of the waU panels.
In order to make a meaningful comparison
between the interaction curve, predicted for a short
wall on the basis of prism strength, and the strength
of a more slender wall, the added moment attributa-
ble to deflections must be taken into consideration.
This can be done approximately by adding to the mo-
ment imposed on the wall by transverse loads an ad-
ditional moment which equals the axial load times
39
J
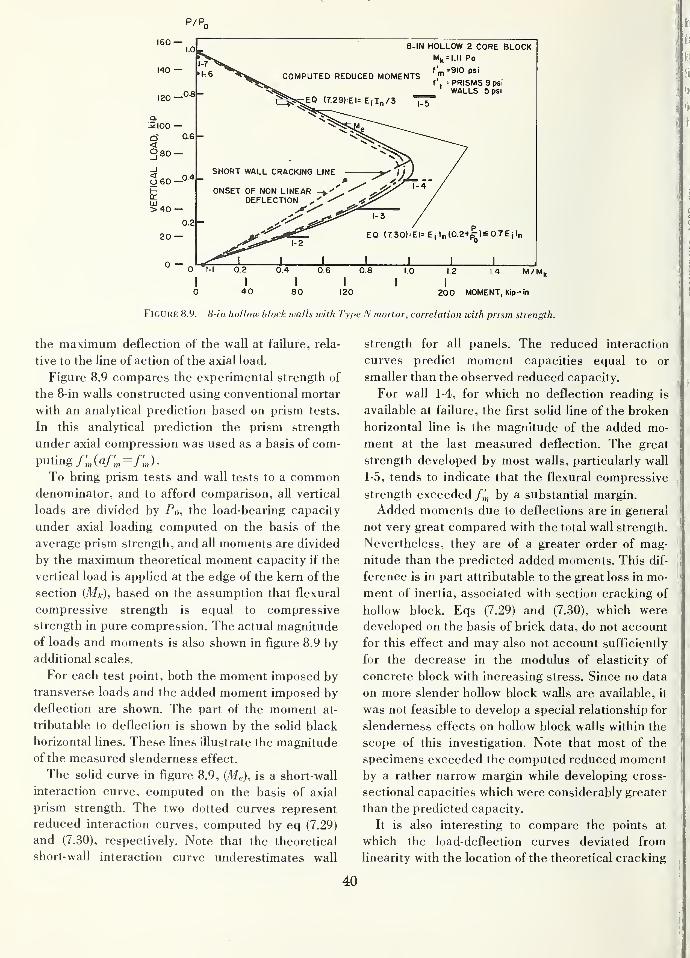
p/p.
160 —
140 —
120 —
^\oo —
<980-
<O60 •
HtrUJ>40
20 —
0 —
COMPUTED REDUCED MOMENTS
8-IN HOLLOW 2 CORE BLOCKM,, = l.ll Po
f' =910 psi
1\ : PRISMS 9 psi
WALLS 5 psi
EQ (730) El= Ej in(0.2+^)£0.7Ejln
12 14 M/M|,
I I I I I
0 4 0 80 120 200 MOMENT, kip- In
Figure 8.9. 8-in hollow block u>alls with Type N mortar, correlation with prism strength.
the maximum deflection of the wall at failure, rela-
tive to the line of action of the axial load.
Figure 8.9 compares the experimental strength of
the 8-in walls constructed using conventional mortar
with an analytical prediction based on prism tests.
In this analytical prediction the prism strength
under axial compression was used as a basis of com-
puting /;„(a/;„ =/J.To bring prism tests and wall tests to a common
denominator, and to afford comparison, all vertical
loads are divided by Po, the load-bearing capacity
under axial loading computed on the basis of the
average prism strength, and aU moments are divided
by the maximum theoretical moment capacity if the
vertical load is applied at the edge of the kern of the
section (Ma), based on the assumption that flexural
compressive strength is equal to compressive
strength in pure compression. The actual magnitude
of loads and moments is also shown in figure 8.9 by
additional scales.
For each test point, both the moment imposed by
transverse loads and the added moment imposed by
deflection are shown. The part of the moment at-
tributable to deflection is shown by the solid black
horizontal lines. These lines illustrate the magnitude
of the measured slenderness effect.
The soHd curve in figure 8.9, (Me), is a short-wall
interaction curve, computed on the basis of axial
prism strength. The two dotted curves represent
reduced interaction curves, computed by eq (7.29)
and (7.30), respectively. Note that the theoretical
short-waU interaction curve underestimates wall
strength for all panels. The reduced interaction
curves predict moment capacities equal to or
smaller than the observed reduced capacity.
For wall 1-4, for which no deflection reading is
available at failure, the first solid line of the broken
horizontal line is the magnitude of the added mo-
ment at the last measured deflection. The great
strength developed by most walls, particularly wall
1-5, tends to indicate that the flexural compressive
strength exceeded f,'„ by a substantial margin.
Added moments due to deflections are in general
not very great compared with the total wall strength.
Nevertheless, they are of a greater order of mag-
nitude than the predicted added moments. This dif-
ference is in part attributable to the great loss in mo-
ment of inertia, associated with section cracking of
hoUow block. Eqs (7.29) and (7.30), which were
developed on the basis of brick data, do not account
for this effect and may also not account sufficiently
for the decrease in the modulus of elasticity of
concrete block with increasing stress. Since no data
on more slender hollow block walls are available, it
was not feasible to develop a special relationship for
slenderness effects on hollow block walls within the
scope of this investigation. Note that most of the
specimens exceeded the computed reduced momentby a rather narrow margin while developing cross-
sectional capacities which were considerably greater
than the predicted capacity.
It is also interesting to compare the points at
which the load-deflection curves deviated from
linearity with the location of the theoretical cracking
40
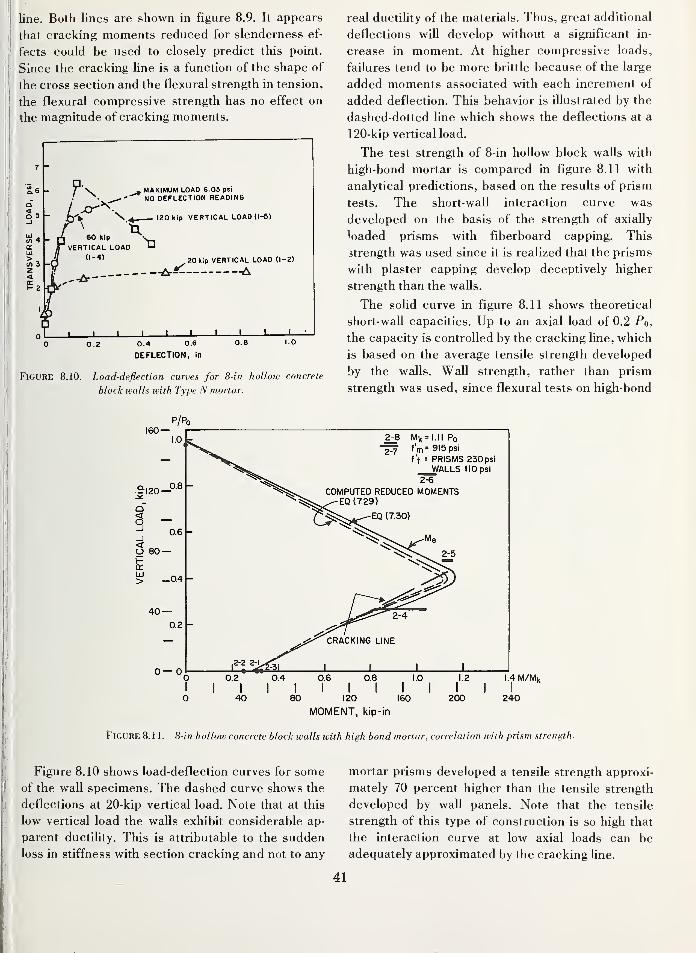
line. Both lines are shown in figure 8.9. It appears
that cracking moments reduced for slenderness ef-
fects could be used to closely predict this point.
Since the cracking line is a function of the shape of
the cross section and the flexural strength in tension,
the flexural compressive strength has no effect on
the magnitude of cracking moments.
XT N
, MAXIMUM LOAD 6.03 psi
NO DEFLECTION READING
120 Kip VERTICAL LOAD (1-5)
60 kip
VERTICAL LOAD(1-4) 20 kip VERTICAL LOAD (1-2)
0.2 0.4 0.6 0.8 1.0
DEFLECTION, in
Figure 8.10. Load-deflection curves for 8-in hollow concrete
block walls with Type N mortar.
real ductility of the materials. Thus, great additional
deflections will develop without a significant in-
crease in moment. At higher compressive loads,
failures tend to be more brittle because of the large
added moments associated with each increment of
added deflection. This behavior is illustrated by the
dashed-dotted line which shows the deflections at a
120-kip vertical load.
The test strength of 8-in hollow block walls with
high-bond mortar is compared in figure 8.11 with
analytical predictions, based on the results of prism
tests. The short-wall interaction curve was
developed on the basis of the strength of axiaUy
loaded prisms with fiberboard capping. This
strength was used since it is realized that the prisms
with plaster capping develop deceptively higher
strength than the walls.
The solid curve in figure 8.11 shows theoretical
short-waU capacities. Up to an axial load of 0.2 Po,
the capacity is controlled by the cracking hne, which
is based on the average tensile strength developed
by the walls. Wall strength, rather than prism
strength was used, since flexural tests on high-bond
160—P/Po
0—0
2^ Mk = l.ll Po
f'm= 915 psi
f't = PRISMS 230 psi
WALLS 110 psi
2-6
COMPUTED REDUCED MOMENTSEQ (7.29)
EQ (7.30)
0.2 0.4
I I I
40 80
0.6 0.8 1.0 1.2 l.4M/MkI I I I I I I I
120 160 200 240
MOMENT, kip-in
Figure 8.11. 8-in hollow concrete block walls with high bond mortar, correlation with prism strength.
Figure 8.10 shows load-deflection curves for some
of the wall specimens. The dashed curve shows the
deflections at 20-kip vertical load. Note that at this
low vertical load the walls exhibit considerable ap-
parent ductility. This is attributable to the sudden
loss in stiffness with section cracking and not to any
mortar prisms developed a tensile strength approxi-
mately 70 percent higher than the tensile strength
developed by wall panels. Note that the tensile
strength of this type of construction is so high that
the interaction curve at low axial loads can be
adequately approximated by the cracking line.
41
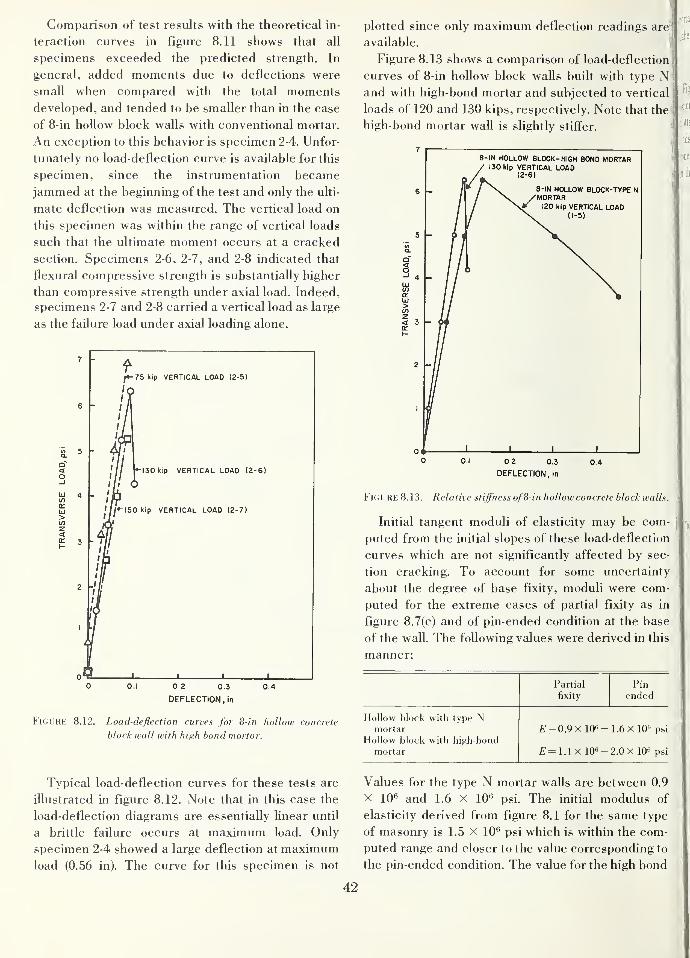
Comparison of test results with the theoretical in-
teraction curves in figure 8.11 shows that all
specimens exceeded the predicted strength. In
general, added moments due to deflections were
small when compared with the total momentsdeveloped, and tended to be smaller than in the case
of 8-in hoUow block walls with conventional mortar.
An exception to this behavior is specimen 2-4. Unfor-
tunately no load-deflection curve is available for this
specimen, since the instrumentation became
jammed at the beginning of the test and only the ulti-
mate deflection was measured. The vertical load on
this specimen was within the range of vertical loads
such that the ultimate moment occurs at a cracked
section. Specimens 2-6, 2-7, and 2-8 indicated that
flexural compressive strength is substantially higher
than compressive strength under axial load. Indeed,
specimens 2-7 and 2-8 carried a vertical load as large
as the failure load under axial loading alone.
_ /
75 kip VERTICAL LOAD (2-5)
/(
/
-130 kip VERTICAL LOAD (2-6)
I h 6
-150 kip VERTICAL LOAD (2-7)
plotted since only maximum deflection readings are*
available. '
Figure 8.13 shows a comparison of load-deflection
curves of 8-in hollow block walls built with type Nand with high-bond mortar and subjected to vertical
loads of 120 and 130 kips, respectively. Note that the
high-bond mortar wall is slightly stiffen
8-IN HOLLOW BLOCK- HIGH BONO MORTAR130 kIp VERTICAL LOAD
8-IN HOLLOW BLOCK-TYPE NMORTAR120 kip VERTICAL LOAD
(1-5)
a I 02 03DEFLECTION, in
Figure 8.13. Relative stiffness of8-in hollow concrete block walls.
Initial tangent moduli of elasticity may be com-
puted from the initial slopes of these load-deflection
curves which are not significantly affected by sec-
tion cracking. To account for some uncertainty
about the degree of base fixity, moduli were com-
puted for the extreme cases of partial fixity as in
figure 8.7(c) and of pin-ended condition at the base
of the wall. The following values were derived in this
manner:
0«-0
1 1 1 1
0.1 0 2 0.3 0.4
DEFLECTION, in
Partial
fixity
Pin
ended
8.12. Load-deflection curves for 8-in hollow concrete
block wall with high bond mortar.
Hollow block with type Nmortar
Hollow block with high-bondE = 0.9x 10«- 1.6 X 10" psi
mortar E = 1.1 X 10"- 2.0 X 10<^ psi
Typical load-deflection curves for these tests are
illustrated in figure 8.12. Note that in this case the
load-deflection diagrams are essentially linear until
a brittle failure occurs at maximum load. Only
specimen 2-4 showed a large deflection at maximumload (0.56 in). The curve for this specimen is not
Values for the type N mortar walls are between 0.9
X 10*^ and 1.6 X 10« psi. The initial modulus of
elasticity derived from figure 8.1 for the same type
of masonry is 1.5 X 10'' psi which is within the com-
puted range and closer to the value corresponding to
the pin-ended condition. The value for the high bond
42
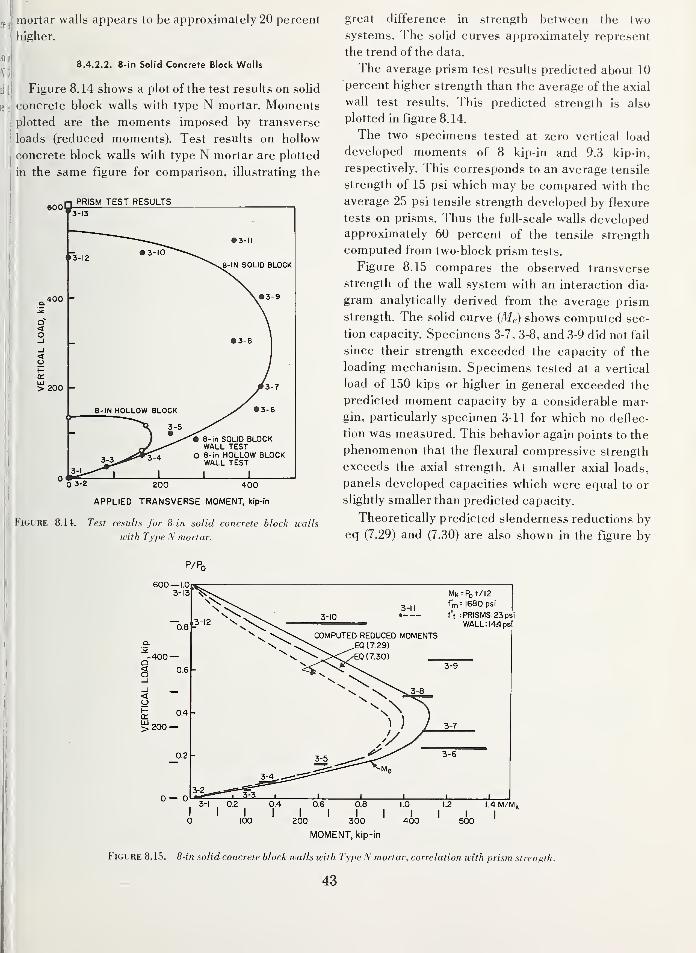
mortar walls appears to be approximately 20 percent
higher.
8.4.2.2. 8-in Solid Concrete Block Walls
Figure 8.14 shows a plot of the test results on solid
concrete block walls with type N mortar. Momentsplotted are the moments imposed by transverse
loads (reduced moments). Test results on hollow
concrete block walls with type N mortar are plotted
in the same figure for comparison, illustrating the
„„„n PRISM TEST RESULTS
APPLIED TRANSVERSE MOMENT, kip-in
Figure 8.14. Test results for 8-in solid concrete block walls
with Type N mortar.
great difference in strength between the two
systems. The solid curves approximately represent
the trend of the data.
The average prism test results predicted about 10
percent higher strength than the average of the axial
wall test results. This predicted strength is also
plotted in figure 8.14.
The two specimens tested at zero vertical load
developed moments of 8 kip-in and 9.3 kip-in,
respectively. This corresponds to an average tensile
strength of 15 psi which may be compared with the
average 25 psi tensile strength developed by flexure
tests on prisms. Thus the fuU-scalp walls developedapproximately 60 percent of the tensile strength
computed from two-block prism tests.
Figure 8.15 compares the observed transverse
strength of the wall system with an interaction dia-
gram analytically derived from the average prism
strength. The solid curve (Me) shows computed sec-
tion capacity. Specimens 3-7, 3-8, and 3-9 did not fail
since their strength exceeded the capacity of the
loading mechanism. Specimens tested at a vertical
load of 150 kips or higher in general exceeded the
predicted moment capacity by a considerable mar-
gin, particularly specimen 3-11 for which no deflec-
tion was measured. This behavior again points to the
phenomenon that the flexural compressive strength
exceeds the axial strength. At smaller axial loads,
panels developed capacities which were equal to or
slightly smaller than predicted capacity.
Theoretically predicted slenderness reductions by
eq (7.29) and (7.30) are also shown in the figure by
43
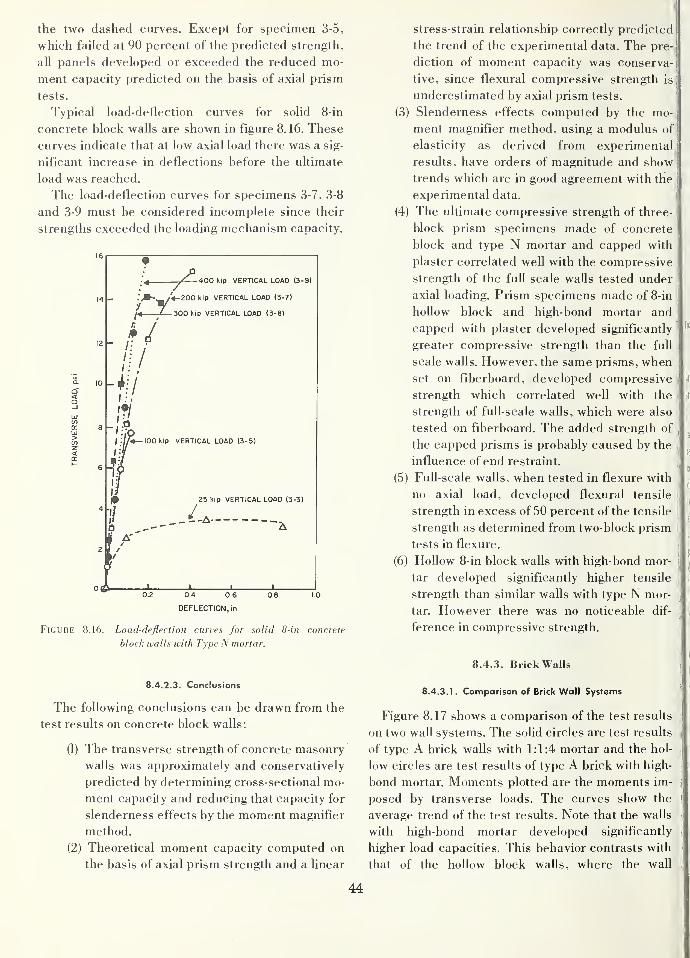
the two dashed curves. Except for specimen 3-5,
which failed at 90 percent of the predicted strength,
all panels developed or exceeded the reduced mo-
ment capacity predicted on the basis of axial prism
tests.
Typical load-deflection curves for solid 8-in
concrete block walls are shown in figure 8.16. These
curves indicate that at low axial load there was a sig-
nificant increase in deflections before the ultimate
load was reached.
The load-deflection curves for specimens 3-7, 3-8
and 3-9 must be considered incomplete since their
strengths exceeded the loading mechanism capacity.
400 kip VERTICAL LOAD (3-9)
./~_/^200 kip VERTICAL LOAD (3-7)
y T1_ 300 kip VERTICAL LOAD (3-8)
-100 kip VERTICAL LOAD (3-5)
25 kip VERTICAL LOAD (3-3)
^
04 0.6
DEFLECTION, in
Figure 8.16. Load-deflection curves for solid 8-in concrete
block walls with Type N mortar.
8.4.2.3. Conclusions
The following conclusions can be drawn from the
test results on concrete block walls:
(1) The transverse strength of concrete masonry
walls was approximately and conservatively
predicted by determining cross-sectional mo-
ment capacity and reducing that capacity for
slenderness effects by the moment magnifier
method.
(2) Theoretical moment capacity computed on
the basis of axial prism strength and a linear
stress-strain relationship correctly predicted
the trend of the experimental data. The pre-
diction of moment capacity was conserva-
tive, since flexural compressive strength is
underestimated by axial prism tests.
(3) Slenderness effects computed by the mo-
ment magnifier method, using a modulus of
elasticity as derived from experimental
results, have orders of magnitude and show
trends which are in good agreement with the
experimental data.
(4) The ultimate compressive strength of three-
block prism specimens made of concrete
block and type N mortar and capped with
plaster correlated well with the compressive
strength of the full scale walls tested under
axial loading. Prism specimens made of 8-in
hollow block and high-bond mortar and
capped with plaster developed significantly
greater compressive strength than the full
scale walls. However, the same prisms, whenset on fiberboard, developed compressive
strength which correlated well with the
strength of full-scale walls, which were also
tested on fiberboard. The added strength of
the capped prisms is probably caused by the
influence of end restraint.
(5) Full-scale walls, when tested in flexure with
no axial load, developed flexural tensile
strength in excess of 50 percent of the tensile
strength as determined from two-block prism
tests in flexure.
(6) Hollow 8-in block walls with high-bond mor-
tar developed significantly higher tensile
strength than similar walls with type N mor-
tar. However there was no noticeable dif-
ference in compressive strength.
8.4.3. Brick Walls
8.4.3.1. Comparison of Brick Wall Systems
Figure 8.17 shows a comparison of the test results
on two wall systems. The solid circles are test results
of type A brick walls with 1:1:4 mortar and the hol-
low circles are test results of type A brick with high-
bond mortar. Moments plotted are the moments im-
posed by transverse loads. The curves show the
average trend of the test results. Note that the walls
with high-bond mortar developed significantly
higher load capacities. This behavior contrasts with
that of the hollow block walls, where the wall
44
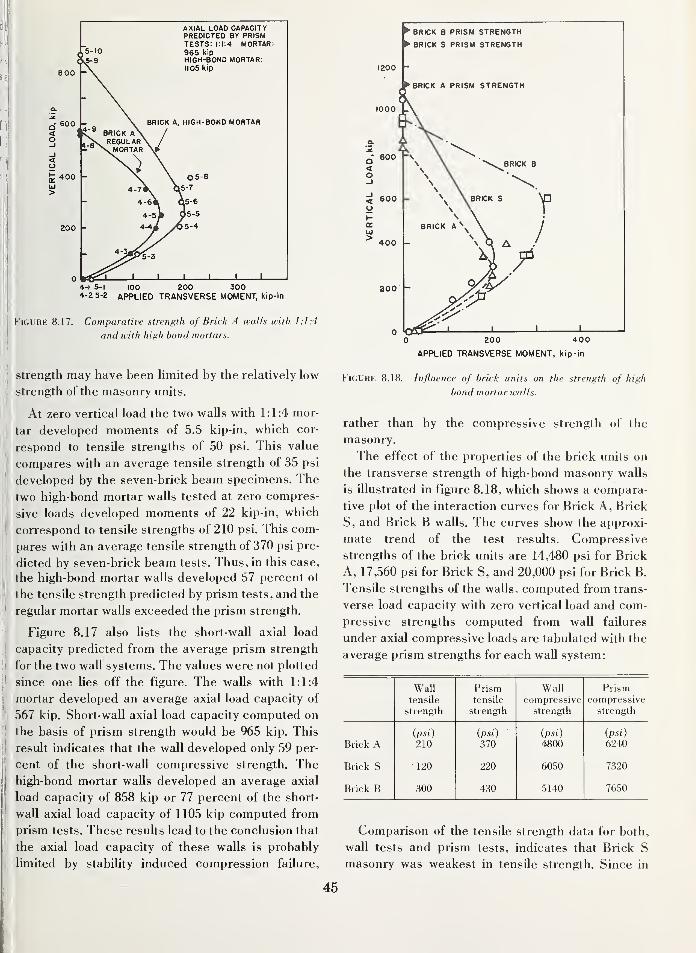
800 -
600 -
400 -
4-1 5-1 100 200 3004-2 5-2 APPLIED TRANSVERSE MOMENT, kip-in
Figure 8.17. Comparative strength of Brick A walls with 1:1:4
and with high bond mortars.
Strength may have been limited by the relatively low
strength of the masonry units.
At zero vertical load the two walls with 1:1:4 mor-
tar developed moments of 5.5 kip-in, which cor-
respond to tensile strengths of 50 psi. This value
compares with an average tensile strength of 35 psi
developed by the seven-brick beam specimens. The
two high-bond mortar walls tested at zero compres-
sive loads developed moments of 22 kip-in, which
correspond to tensile strengths of 210 psi. This com-
pares with an average tensile strength of 370 psi pre-
dicted by seven-brick beam tests. Thus, in this case,
the high-bond mortar walls developed 57 percent of
the tensile strength predicted by prism tests, and the
regular mortar walls exceeded the prism strength.
Figure 8.17 also lists the short-wall axial load
capacity predicted from the average prism strength
for the two waU systems. The values were not plotted
since one lies off the figure. The walls with 1:1:4
mortar developed an average axial load capacity of
567 kip. Short-wall axial load capacity computed on
the basis of prism strength would be 965 kip. This
result indicates that the wall developed only 59 per-
cent of the short-wall compressive strength. The
high-bond mortar walls developed an average axial
load capacity of 858 kip or 77 percent of the short-
wall axial load capacity of 1105 kip computed from
prism tests. These results lead to the conclusion that
the axial load capacity of these walls is probably
limited by stability induced compression failure.
brick b prism strength
brick s prism strength
1200 -
1000
800 -\
600 -
400 -
aoo -
0 200 400
APPLIED TRANSVERSE MOMENT, kip-in
Figure 8.18. Influence of brick units on the strength of high
bond mortar walls.
rather than by the compressive strength of the
masonry.
The effect of the properties of the brick units on
the transverse strength of high-bond masonry walls
is illustrated in figure 8.18, which shows a compara-
tive plot of the interaction curves for Brick A, Brick
S, and Brick B walls. The curves show the approxi-
mate trend of the test results. Compressive
strengths of the brick units are 14,480 psi for Brick
A, 17,560 psi for Brick S, and 20,000 psi for Brick B.
Tensile strengths of the walls, computed from trans-
verse load capacity with zero vertical load and com-
pressive strengths computed from wall failures
under axial compressive loads are tabulated with the
average prism strengths for each wall system:
Walltensile
strength
Prismtensile
strength
Wallcompressive
strength
Prismcompressive
strength
(psi) (psi) {psi) (psi)
Brick A 210 370 4800 6240
Brick S 120 220 60.50 7320
Brick B 300 430 5140 7650
Comparison of the tensile strength data for both,
wall tests and prism tests, indicates that Brick S
masonry was weakest in tensile strength. Since in
45
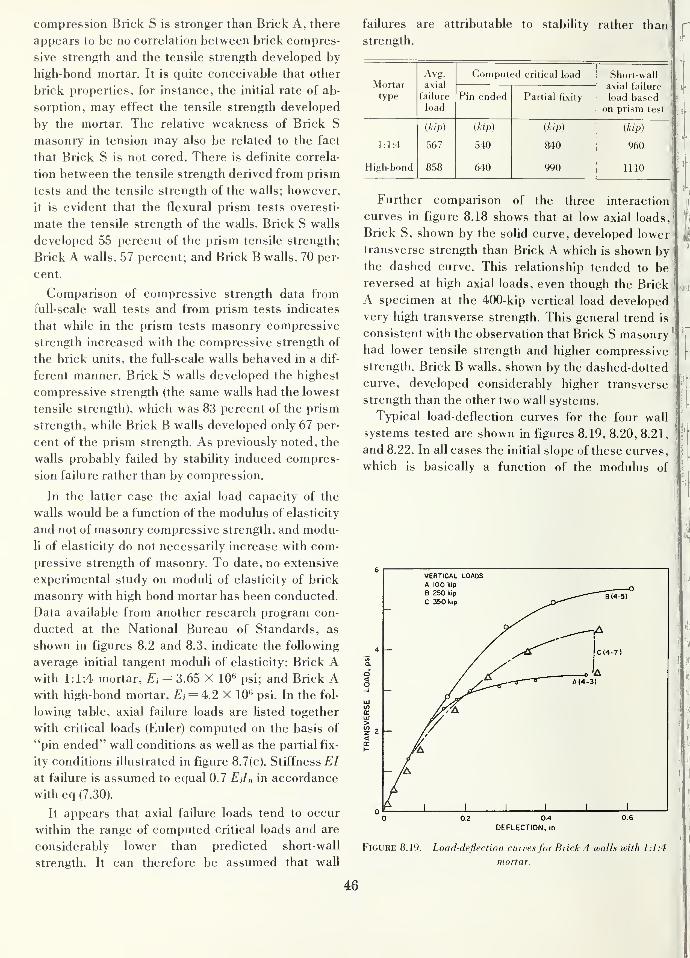
compression Brick S is stronger than Brick A, there
appears to be no correlation between brick compres-
sive strength and the tensile strength developed by
high-bond mortar. It is quite conceivable that other
brick properties, for instance, the initial rate of ab-
sorption, may effect the tensile strength developed
by the mortar. The relative weakness of Brick S
masonry in tension may also be related to the fact
that Brick S is not cored. There is definite correla-
tion between the tensile strength derived from prism
tests and the tensile strength of the walls; however,
it is evident that the flexural prism tests overesti-
mate the tensile strength of the walls. Brick S walls
developed 55 percent of the prism tensile strength;
Brick A walls, 57 percent; and Brick B walls, 70 per-
cent.
Comparison of compressive strength data from
full-scale wall tests and from prism tests indicates
that while in the prism tests masonry compressive
strength increased with the compressive strength of
the brick units, the full-scale walls behaved in a dif-
ferent manner. Brick S waUs developed the highest
compressive strength (the same walls had the lowest
tensile strength), which was 83 percent of the prism
strength, while Brick B walls developed only 67 per-
cent of the prism strength. As previously noted, the
walls probably failed by stability induced compres-
sion failure rather than by compression.
In the latter case the axial load capacity of the
walls would be a function of the modulus of elasticity
and not of masonry compressive strength, and modu-
li of elasticity do not necessarily increase with com-
pressive strength of masonry. To date, no extensive
experimental study on moduli of elasticity of brick
masonry with high bond mortar has been conducted.
Data available from another research program con-
ducted at the National Bureau of Standards, as
shown in figures 8.2 and 8.3, indicate the following
average initial tangent moduli of elasticity: Brick Awith 1:1:4 mortar, Ei = 3.65 X lO*' psi; and Brick Awith high-bond mortar, Ei = 4.2 X 10'' psi. In the fol-
lowing table, axial failure loads are listed together
with critical loads (Euler) computed on the basis of
"pin ended" wall conditions as well as the partial fix-
ity conditions illustrated in figure 8.7(c). Stiffness EI
at failure is assumed to equal 0.7 EJ,, in accordance
with eq (7.30).
It appears that axial failure loads tend to occur
within the range of computed critical loads and are
considerably lower than predicted short-wall
strength. It can therefore be assumed that wall
failures are attributable to stability rather than
strength.
Mortartype
Avg.
axial
load
Computed critical load Short-wall
axial failure
load basedon prism test
Pin ended Partial fixity
a-ip) (kip) ikip)
1:1:4 567 540 840 960
High-bond 858 640 990 1110
Further comparison of the three interaction
curves in figure 8.18 shows that at low axial loads
Brick S, shown by the solid curve, developed lower
transverse strength than Brick A which is shown by
the dashed curve. This relationship tended to be
reversed at high axial loads, even though the Brick
A specimen at the 400-kip vertical load developed
very high transverse strength. This general trend is
consistent with the observation that Brick S masonryhad lower tensile strength and higher compressive
strength. Brick B walls, shown by the dashed-dotted
curve, developed considerably higher transverse
strength than the other two wall systems.
Typical load-deflection curves for the four wall
systems tested are shown in figures 8.19, 8.20, 8.21,
and 8.22. In all cases the initial slope of these curves,
which is basically a function of the modulus of
VERTICAL LOADSA 100 kip
B 250 kip
C 350 kip^ BM-5)
!c(4-7)
. XA (4-3)
- /- ft.
A 1 1 1
1 11
0 0.2 0.4 0.6
DEFLECTION, in
Figure 8.19. Load-deflection curves for Brick A walls with 1:1:4
mortar.
46
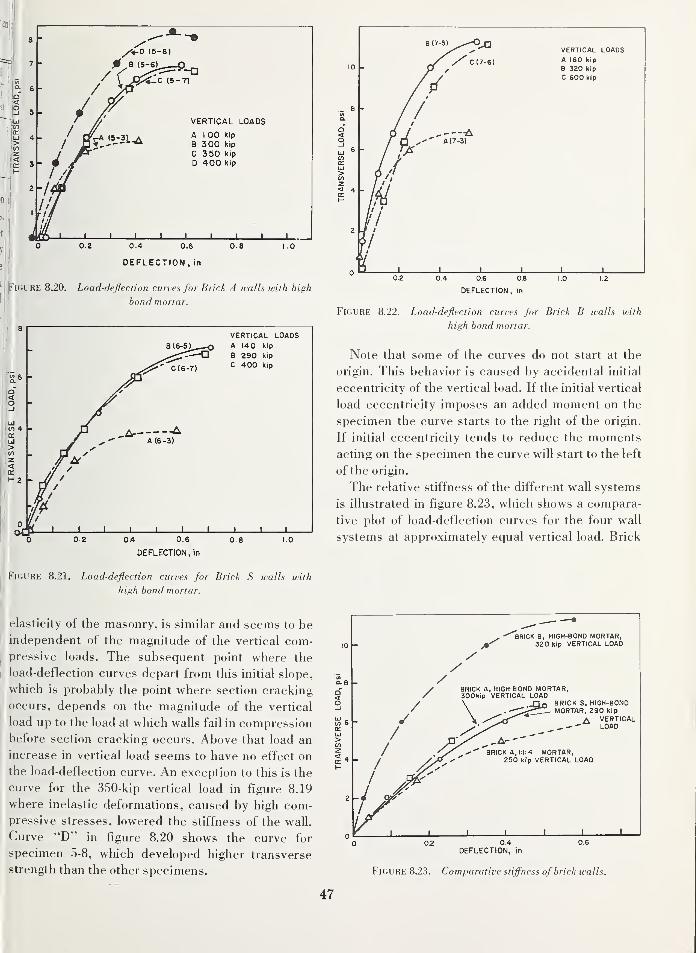
0.4 0.6
DEFLECTION , in
1 .0
Figure 8.20. Load-deflection curves for Brick A walls with high
bond mortar.
VERTICAL LOADSA 140 kip
B 290 kip
C(6-7) ^ "'P
0.4 0.6
DEFLECTION, in
Figure 8.21. Load-deflection curves for Brick S walls with
high bond mortar.
._ 8
S 4 -
VERTICAL LOADSA 160 kip
B 320 kip
C 600 kip
0.2 0 4 06 OB 1.0 1.2
DEFLECTION, in
Figure 8.22. Load-deflection cun>es for Brick B walls with
high bond mortar.
Note that some of the curves do not start at the
origin. This behavior is caused by accidental initial
eccentricity of the vertical load. If the initial vertical
load eccentricity imposes an added moment on the
specimen the curve starts to the right of the origin.
If initial eccentricity tends to reduce the moments
acting on the specimen the curve will start to the left
of the origin.
The relative stiffness of the different wall systems
is illustrated in figure 8.23, which shows a compara-
tive plot of load-deflection curves for the four wall
systems at approximately equal vertical load. Brick
Ielasticity of the masonry, is similar and seems to be
jl independent of the magnitude of the vertical com-
I
pressive loads. The subsequent point where the
I
load-deflection curves depart from this initial slope,
which is probably the point where section cracking
occurs, depends on the magnitude of the vertical
load up to the load at which walls fail in compression
before section cracking occurs. Above that load an
increase in vertical load seems to have no effect on
the load-deflection curve. An exception to this is the
curve for the 350-kip vertical load in figure 8.19
where inelastic deformations, caused by high com-pressive stresses, lowered the stiffness of the wall.
Curve "D" in figure 8.20 shows the curve for
specimen 5-8. which developed higher transverse
strength than the other specimens.
BRICK B, HIGH-BOND MORTAR,320 kip VERTICAL LOAD
/ BRICK A, HIGH-BOND MORTAR,300kip VERTICAL LOAD
BRICK S, HIGH-BONDMORTAR, 290 kip
A VERTICALLOAD
0.4
DEFLECTION, in
Figure 8.23. Comparative stiffness of brick ivalls.
47
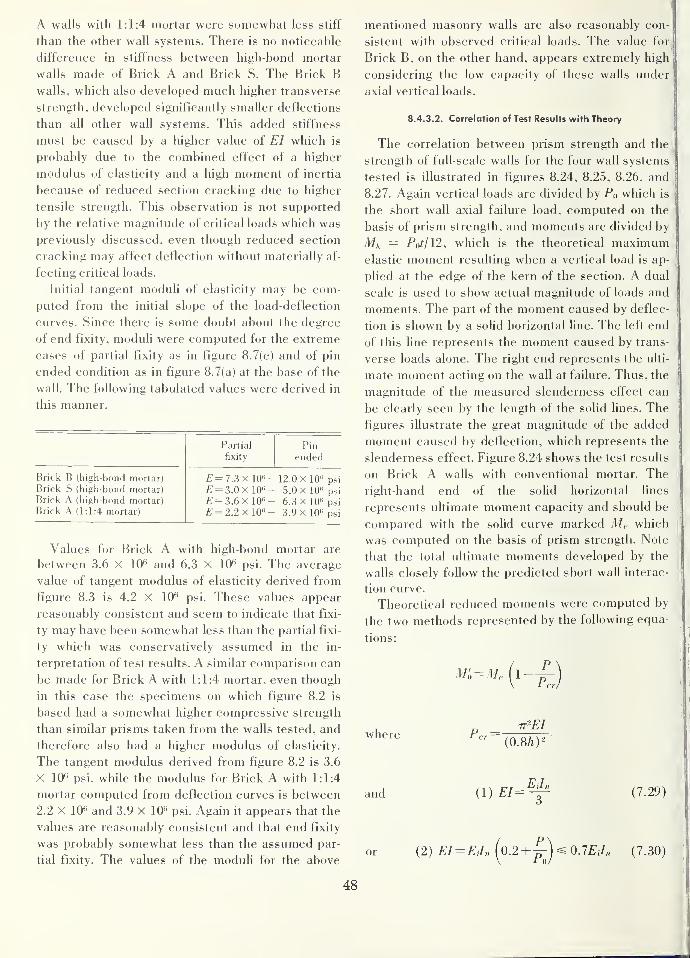
I
A walls with 1:1:4 mortar were somewhat less stiff
than the other wall systems. There is no noticeable
difference in stiffness between high-bond mortar
walls made of Brick A and Brick S. The Brick Bwalls, which also developed much higher transverse
strength, developed significantly smaller deflections
than all other wall systems. This added stiffness
must be caused by a higher value of EI which is
probably due to the combined effect of a higher
modulus of elasticity and a high moment of inertia
because of reduced section cracking due to higher
tensile strength. This observation is not supported
by the relative magnitude of critical loads which was
previously discussed, even though reduced section
cracking may affect deflection without materially af-
fecting critical loads.
Initial tangent moduli of elasticity may be com-
puted from the initial slope of the load-deflection
curves. Since there is some doubt about the degree
of end fixity, moduli were computed for the extreme
cases of partial fixity as in figure 8.7(c) and of pin
ended condition as in figure 8.7(a) at the base of the
wall. The following tabulated values were derived in
this manner.
Partial
fixity
Pin
ended
Brick B (liigh-bond mortar)
Brick S (high-bond mortar)
Brick A (high-bond mortar)
Brick A (1:1:4 mortar)
£' = 7.3x 10'=-12.0X 10'= psi£' = 3.0x 10'=- 5.0 X 10'= psi£' = 3.6x 10'=- 6.3 X 10'= psi
E = 2.2x 10'=- 3.9 X 10'= psi
Values for Brick A with high-bond mortar are
between 3.6 X 10'' and 6.3 X 10" psi. The average
value of tangent modulus of elasticity derived from
figure 8.3 is 4.2 X 10" psi. These values appear
reasonably consistent and seem to indicate that fixi-
ty may have been somewhat less than the partial fixi-
ty which was conservatively assumed in the in-
terpretation of test results. A similar comparison can
be made for Brick A with 1:1:4 mortar, even though
in this case the specimens on which figure 8.2 is
based had a somewhat higher compressive strength
than similar prisms taken from the walls tested, and
therefore also had a higher modulus of elasticity.
The tangent modulus derived from figure 8.2 is 3.6
X 10" psi, while the modulus for Brick A with 1:1:4
mortar computed from deflection curves is between
2.2 X 10" and 3.9 X 10" psi. Again it appears that the
values are reasonably consistent and that end fixity
was probably somewhat less than the assumed par-
tial fixity. The values of the moduli for the above
mentioned masonry walls are also reasonably con-
sistent with observed critical loads. The value for
Brick B, on the other hand, appears extremely high
considering the low capacity of these walls under
axial vertical loads.
8.4.3.2. Correlation of Test Results with Theory
The correlation between prism strength and the
strength of full-scale walls for the four wall systems
tested is illustrated in figures 8.24, 8.25, 8.26, and
8.27. Again vertical loads are divided by Po which is
the short wall axial failure load, computed on the
basis of prism strength, and moments are divided by
Ml; = Po^/12, which is the theoretical maximumelastic moment resulting when a vertical load is ap-
plied at the edge of the kern of the section. A dual
scale is used to show actual magnitude of loads and
moments. The part of the moment caused by deflec-
tion is shown by a sohd horizontal line. The left end
of this line represents the moment caused by trans-
verse loads alone. The right end represents the ulti-
mate moment acting on the wall at failure. Thus, the
magnitude of the measured slenderness effect can
be clearly seen by the length of the solid lines. The
figures illustrate the great magnitude of the added
moment caused by deflection, which represents thej
slenderness effect. Figure 8.24 shows the test results
on Brick A walls with conventional mortar. The
right-hand end of the solid horizontal lines
represents ultimate moment capacity and should be
compared with the solid curve marked Me which
was computed on the basis of prism strength. Note
that the total ultimate moments developed by the
walls closely follow the predicted short wall interac-
tion curve.
Theoretical reduced moments were computed by
the two methods represented by the following equa-
tions:
M.;=M.(i-£)
and (1) EI=^ (7.29)
or (2) EI= EiI„ (o.2 + ^^^0.7EiI„ (7.30)
48
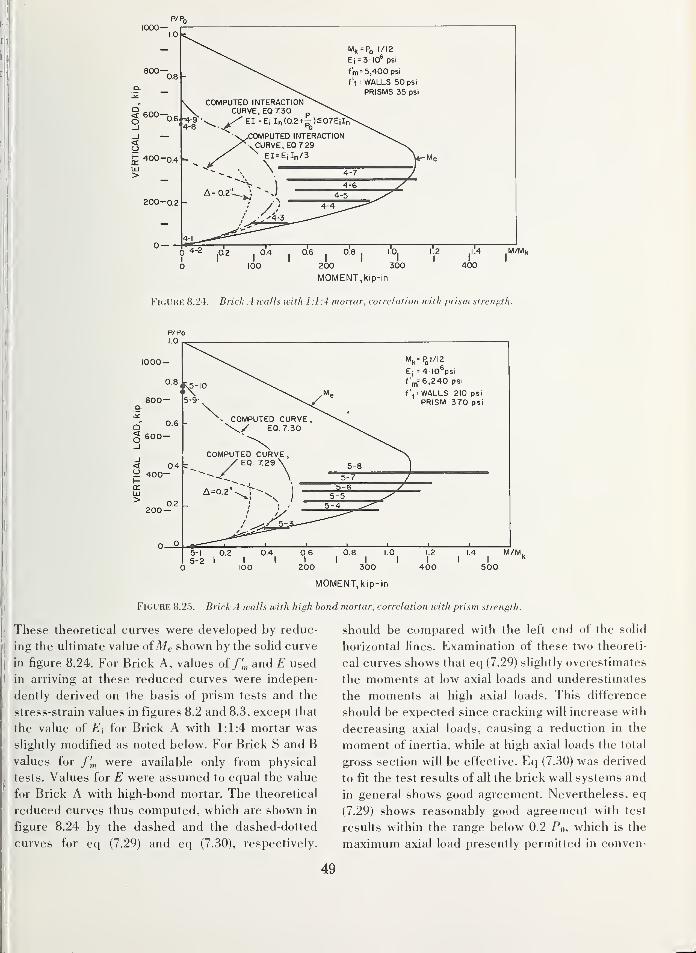
P/Po
MOMENT, kip-in
Figure 8.24. Brick A walls with 1:1:4 monar, correlation with prism strength.
P„t/I2
4 lO^psi
6,240 psi
f', = WALLS 210 psi
PRISM 370 psi
300
MOMENT, kip-in
500
Figure 8.2.5. Brick A walls with high bond mortar, correlation with prism strength.
These theoretical curves were developed by reduc-
ing the ultimate value ofMe shown by the solid curve
in figure 8.24. For Brick A, values of /,'„ and E used
in arriving at these reduced curves were indepen-
dently derived on the basis of prism tests and the
stress-strain values in figures 8.2 and 8.3, except that
the value of E; for Brick A with 1:1:4 mortar was
slightly modified as noted below. For Brick S and B
values for were available only from physical
tests. Values for E were assumed to equal the value
for Brick A with high-bond mortar. The theoretical
reduced curves thus computed, which are shown in
figure 8.24 by the dashed and the dashed-dotted
curves for eq (7.29) and eq (7.30), respectively.
should be compared with the left end of the solid
horizontal lines. Examination of these two theoreti-
cal curves shows that eq (7.29) slightly overestimates
the moments at low axial loads and underestimates
the moments at high axial loads. This difference
should be expected since cracking will increase with
decreasing axial loads, causing a reduction in the
moment of inertia, while at high axial loads the total
gross section will be effective. Eq (7.30) was derived
to fit the test results of all the brick wall systems and
in general shows good agreement. Nevertheless, eq
(7.29) shows reasonably good agreement with test
results within the range below 0.2 Po, which is the
maximum axial load presently permitted in conven-
49
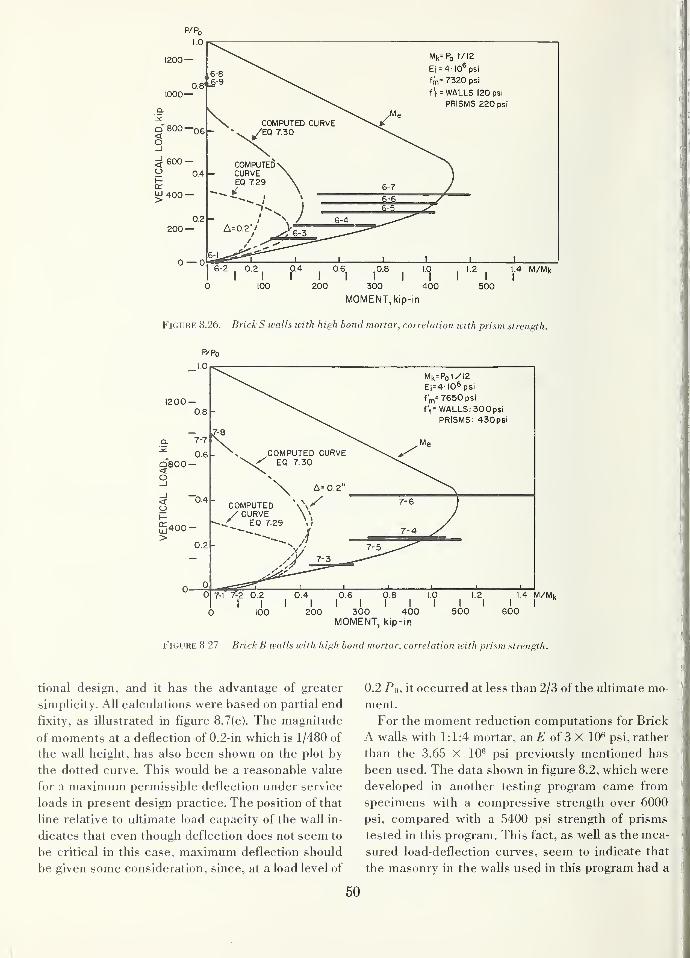
Figure 8.26. Brick S walls with high bond mortar, correlation with prism strength.
1200-
Ei=4-I0®psi
t'n,= 7650 psi
f't= WALLS: 300psiPRISMS; 430psi
7-1 7-2 0.2 0.4 0.6 0.8 10I I I I I I I I I I
100 200 300 400 500MOMENT, kip-in
1.4 M/Mi<
600
Figure 8.27. Brick B walls with high bond mortar, correlation with prism strength.
tional design, and it has the advantage of greater
simphcity. All calculations were based on partial end
fixity, as illustrated in figure 8.7(c). The magnitude
of moments at a deflection of 0.2-in which is 1/480 of
the wall height, has also been shown on the plot by
the dotted curve. This would be a reasonable value
for a maximum permissible deflection under service
loads in present design practice. The position of that
line relative to ultimate load capacity of the wall in-
dicates that even though deflection does not seem to
be critical in this case, maximum deflection should
be given some consideration, since, at a load level of
0.2 fo, it occurred at less than 2/3 of the ultimate mo-
ment.
For the moment reduction computations for Brick
A walls with 1:1:4 mortar, an of 3 X 10" psi, rather
than the 3.65 X 10'' psi previously mentioned has
been used. The data shown in figure 8.2, which were
developed in another testing program came from
specimens with a compressive strength over 6000
psi, compared with a 5400 psi strength of prisms
tested in this program. This fact, as weU as the mea-
sured load-deflection curves, seem to indicate that
the masonry in the waUs used in this program had a
50
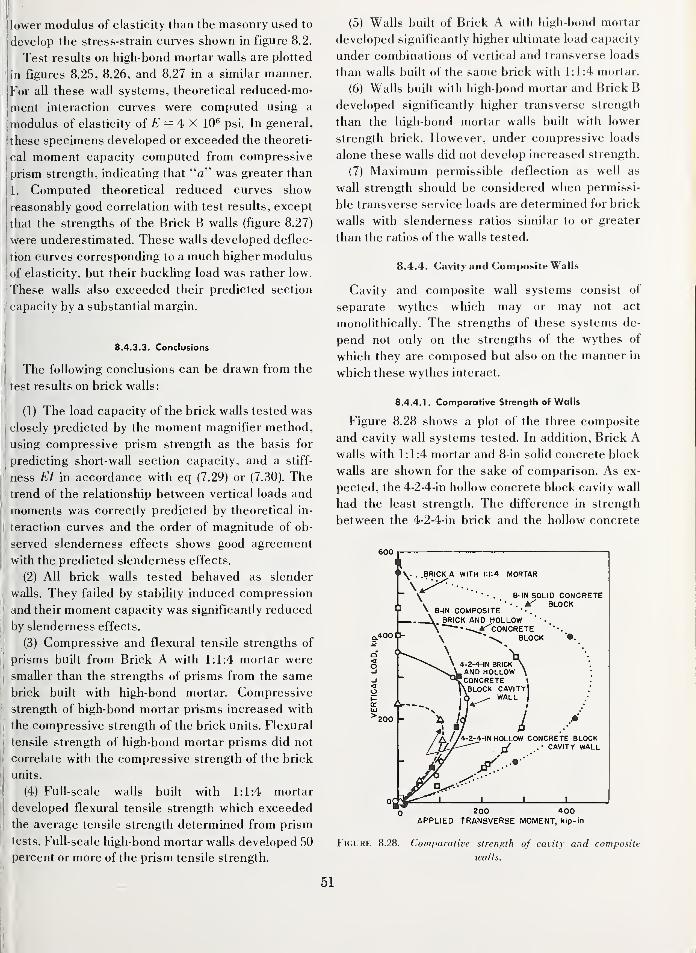
lower modulus of elasticity than the masonry used to
develop the stress-strain curves shown in figure 8.2.
Test results on high-bond mortar walls are plotted
in figures 8.25, 8.26, and 8.27 in a similar manner.
For all these wall systems, theoretical reduced-mo-
ment interaction curves were computed using a
modulus of elasticity of = 4 X 10** psi. In general,
these specimens developed or exceeded the theoreti-
cal moment capacity computed from compressive
prism strength, indicating that "a" was greater than
1. Computed theoretical reduced curves show
reasonably good correlation with test results, except
that the strengths of the Brick B walls (figure 8.27)
were underestimated. These walls developed deflec-
tion curves corresponding to a much higher modulus
of elasticity, but their buckHng load was rather low.
These walls also exceeded their predicted section
capacity by a substantial margin.
8.4.3.3. Conclusions
The following conclusions can be drawn from the
test results on brick walls:
(1) The load capacity of the brick walls tested was
closely predicted by the moment magnifier method,
using compressive prism strength as the basis for
predicting short-wall section capacity, and a stiff-
ness EI in accordance with eq (7.29) or (7.30). The
trend of the relationship between vertical loads and
moments was correctly predicted by theoretical in-
teraction curves and the order of magnitude of ob-
served slenderness effects shows good agreement
with the predicted slenderness effects.
(2) All brick walls tested behaved as slender
walls. They failed by stability induced compression
and their moment capacity was significantly reduced
by slenderness effects.
(3) Compressive and flexural tensile strengths of
prisms built from Brick A with 1:1:4 mortar were
smaller than the strengths of prisms from the same
brick built with high-bond mortar. Compressive
strength of high-bond mortar prisms increased with
the compressive strength of the brick units. Flexural
tensile strength of high-bond mortar prisms did not
correlate with the compressive strength of the brick
units.
(4) FuU-scale walls built with 1:1:4 mortar
developed flexural tensile strength which exceeded
the average tensile strength determined from prism
tests. FuU-scale high-bond mortar walls developed 50
percent or more of the prism tensile strength.
(5) Walls built of Brick A with high-bond mortar
developed significantly higher ultimate load capacity
under combinations of vertical and transverse loads
than walls built of the same brick with 1:1:4 mortar.
(6) Walls built with high-bond mortar and Brick B
developed significantly higher transverse strength
than the high-bond mortar walls built with lower
strength brick. However, under compressive loads
alone these walls did not develop increased strength.
(7) Maximum permissible deflection as well as
wall strength should be considered when permissi-
ble transverse service loads are determined for brick
walls with slenderness ratios similar to or greater
than the ratios of the walls tested.
8.4.4. Cavity and Composite Wails
Cavity and composite wall systems consist of
separate wythes which may or may not act
monolithically. The strengths of these systems de-
pend not only on the strengths of the wythes of
which they are composed but also on the manner in
which these wythes interact.
8.4.4.1. Comparative Strength of Walls
Figure 8.28 shows a plot of the three composite
and cavity wall systems tested. In addition. Brick Awalls with 1:1:4 mortar and 8-in solid concrete block
walls are shown for the sake of comparison. As ex-
pected, the 4-2-4-in hollow concrete block cavity wall
had the least strength. The difference in strength
between the 4-2-4-in brick and the hollow concrete
. BLOCK
,400 0-
\. . .BRICK A WITH 1. 1:4 MORTAR
'^"^^^8-IN SOLID CONCRETE
\ 8-IN COMPOSITE\ BRICK AND HOLLOW\ ---....^CONCRETE\ ' BLOCK
\
\
4-IN HOLLOW CONCRETE BLOCK.• CAVITY WALL
200 400APPLIED TRANSVERSE MOMENT, kip- in
Figure 8.28. Comparative strerifith of cavity and composite
walls.
51
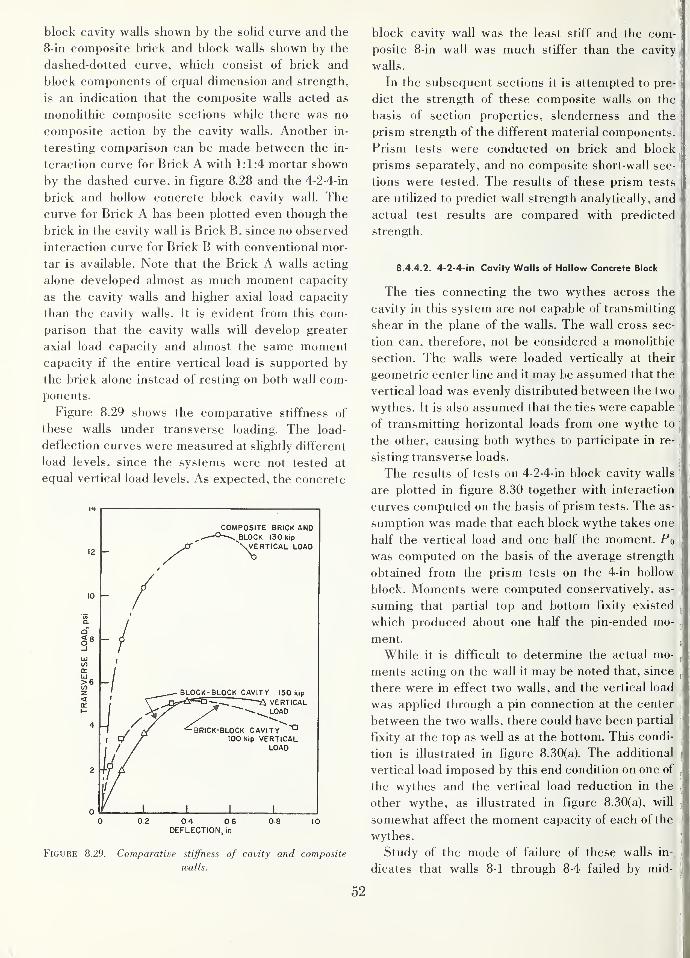
block cavity walls shown by the solid curve and the
8-in composite brick and block walls shown by the
dashed-dotted curve, which consist of brick and
block components of equal dimension and strength,
is an indication that the composite walls acted as
monoHthic composite sections while there was no
composite action by the cavity walls. Another in-
teresting comparison can be made between the in-
teraction curve for Brick A with 1:1:4 mortar shown
by the dashed curve, in figure 8.28 and the 4-2-4-in
brick and hollow concrete block cavity wall. The
curve for Brick A has been plotted even though the
brick in the cavity wall is Brick B, since no observed
interaction curve for Brick B with conventional mor-
tar is available. Note that the Brick A walls acting
alone developed almost as much moment capacity
as the cavity walls and higher axial load capacity
than the cavity walls. It is evident from this com-
parison that the cavity walls will develop greater
axial load capacity and almost the same momentcapacity if the entire vertical load is supported by
the brick alone instead of resting on both wall com-
ponents.
Figure 8.29 shows the comparative stiffness of
these walls under transverse loading. The load-
deflection curves were measured at shghtly different
load levels, since the systems were not tested at
equal vertical load levels. As expected, the concrete
0 0.2 0 4 0.6 0 8 1.0
DEFLECTION, in
Figure 8.29. Comparative stiffness of cavity and composite
walls.
block cavity wall was the least stiff and the com-
posite 8-in wall was much stiffer than the cavity
walls.
In the subsequent sections it is attempted to pre-
dict the strength of these composite walls on the
basis of section properties, slenderness and the
prism strength of the different material components.
Prism tests were conducted on brick and block
prisms separately, and no composite short-wall sec-
tions were tested. The results of these prism tests
are utilized to predict wall strength analytically, andf
actual test results are compared with predictedj
strength.
8.4.4.2. 4-2-4-in Cavity Walls of Hollow Concrete Block
The ties connecting the two wythes across the
cavity in this system are not capable of transmitting
shear in the plane of the walls. The wall cross sec-
tion can, therefore, not be considered a monolithic
section. The walls were loaded vertically at their
geometric center line and it may be assumed that the
vertical load was evenly distributed between the two|^ j
wythes. It is also assumed that the ties were capablej
of transmitting horizontal loads from one wythe to
the other, causing both wythes to participate in re-
sisting transverse loads.,
The results of tests on 4-2-4-in block cavity walls^
are plotted in figure 8.30 together with interaction
curves computed on the basis of prism tests. The as-,
sumption was made that each block wythe takes one
half the vertical load and one half the moment. Po.
was computed on the basis of the average strength
obtained from the prism tests on the 4-in hollow
block. Moments were computed conservatively, as-,
suming that partial top and bottom fixity existed
which produced about one half the pin-ended mo-
ment.
While it is difficult to determine the actual mo-,
ments acting on the wall it may be noted that, since,
there were in effect two walls, and the vertical load
was applied through a pin connection at the center^
between the two walls, there could have been partialj
fixity at the top as well as at the bottom. This condi-,
tion is illustrated in figure 8.30(a). The additional|
vertical load imposed by this end condition on one of,
the wythes and the vertical load reduction in the
other wythe, as illustrated in figure 8.30(a), will|
somewhat affect the moment capacity of each of the ,
wythes.;
Study of the mode of failure of these walls in-,
dicates that walls 8-1 through 8-4 failed by mid-
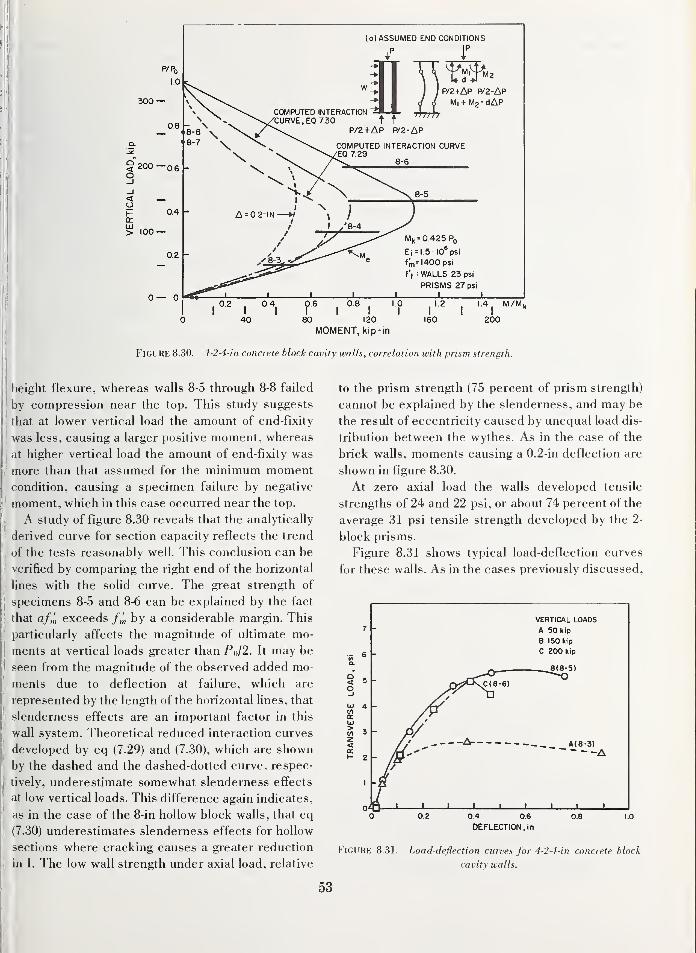
300 —
§ 200 •
O
<OI-a:LU> 100-
0 —
(a) ASSUMED END CONDITIONS
M2
P/2+AP P/2-AP
M|+ M2 = dAP
MOMENT, kip-in
Figure 8.30. 4-2-4-in concrete block cavity walls, correlation with prism strength.
height flexure, whereas walls 8-5 through 8-8 failed
by compression near the top. This study suggests
that at lower vertical load the amount of end-fixity
was less, causing a larger positive moment, whereas
at higher vertical load the amount of end-fixity was
more than that assumed for the minimum momentcondition, causing a specimen failure by negative
moment, which in this case occurred near the top.
A study of figure 8.30 reveals that the analytically
derived curve for section capacity reflects the trend
of the tests reasonably well. This conclusion can be
verified by comparing the right end of the horizontal
lines with the solid curve. The great strength of
specimens 8-5 and 8-6 can be explained by the fact
that a/m exceeds /„', by a considerable margin. This
particularly affects the magnitude of ultimate mo-
ments at vertical loads greater than Po/2. It may be
seen from the magnitude of the observed added mo-
ments due to deflection at failure, which are
represented by the length of the horizontal Hnes, that
slenderness effects are an important factor in this
wall system. Theoretical reduced interaction curves
developed by eq (7.29) and (7.30), which are shown
by the dashed and the dashed-dotted curve, respec-
tively, underestimate somewhat slenderness effects
at low vertical loads. This difference again indicates,
as in the case of the 8-in hollow block walls, that eq
(7.30) underestimates slenderness effects for hollow
sections where cracking causes a greater reduction
in I. The low wall strength under axial load, relative
to the prism strength (75 percent of prism strength)
cannot be explained by the slenderness, and may be
the result of eccentricity caused by unequal load dis-
tribution between the wythes. As in the case of the
brick walls, moments causing a 0.2-in deflection are
shown in figure 8.30.
At zero axial load the walls developed tensile
strengths of 24 and 22 psi, or about 74 percent of the
average 31 psi tensile strength developed by the 2-
block prisms.
Figure 8.31 shows typical load-deflection curves
for these walls. As in the cases previously discussed,
VERTICAL LOADS
A 50 kip
B ISO kip
C 200 kip
0.4 0.6
DEFLECTION, in
Figure 8.31. Load-deflection curves for 4-2-4-in concrete block
cavity walls.
53
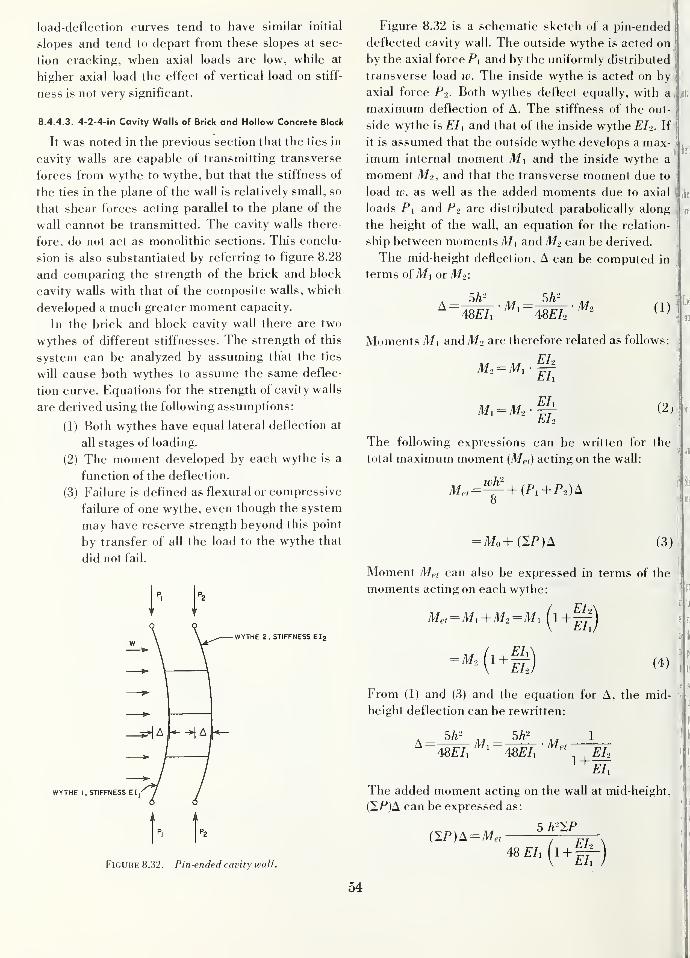
load-deflection curves tend to have similar initial
slopes and tend to depart from these slopes at sec-
tion cracking, when axial loads are low, while at
higher axial load the effect of vertical load on stiff-
ness is not very significant.
8.4.4.3. 4-2-4-in Cavity Walls of Brick and Hollow Concrete Block
It was noted in the previous section that the ties in
cavity walls are capable of transmitting transverse
forces from wythe to wythe, but that the stiffness of
the ties in the plane of the wall is relatively small, so
that shear forces acting parallel to the plane of the
wall cannot be transmitted. The cavity walls there-
fore, do not act as monolithic sections. This conclu-
sion is also substantiated by referring to figure 8.28
and comparing the strength of the brick and block
cavity walls with that of the composite walls, which
developed a much greater moment capacity.
In the brick and block cavity wall there are two
wythes of different stiffnesses. The strength of this
system can be analyzed by assuming that the ties
will cause both wythes to assume the same deflec-
tion curve. Equations for the strength of cavity walls
are derived using the following assumptions:
(1) Both wythes have equal lateral deflection at
all stages of loading.
(2) The moment developed by each wythe is a
function of the deflection.
(3) Failure is defined as flexural or compressive
failure of one wythe, even though the system
may have reserve strength beyond this point
by transfer of all the load to the wythe that
did not fail.
WYTHE I, STIFFNESS EI
WYTHE 2 . STIFFNESS Elg
Figure 8.32. Pin-ended cavity wall.
Figure 8.32 is a schematic sketch of a pin-ended
deflected cavity wall. The outside wythe is acted on
by the axial force Pi and by the uniformly distributed
transverse load w. The inside wythe is acted on by
axial force Pi. Both wythes deflect equally, with a
maximum deflection of A. The stiffness of the out-
side wythe is EI\ and that of the inside wythe EI2. If
it is assumed that the outside wythe develops a max-
imum internal moment Mx and the inside wythe a
moment M-?, and that the transverse moment due to
load w, as well as the added moments due to axial \ %loads Pl and P2 are distributed parabolically along
the height of the wall, an equation for the relation-
ship between moments Af 1 and M-z can be derived.
The mid-height deflection, A can be computed in
terms of Mi or Mo:
\ llien
A =5h'
4SEh
5h'
48£/2
Moments Mi andM2 are therefore related as follows:
EI2M. = Mi
Eh
EhEh
i2n
The following expressions can be written for the
total maximum moment (Met) acting on the wall:
M,,=^+(Pi+P2)Ao
=Mo+aP)^
Moment Met can also be expressed in terms of the
moments acting on each wythe:
Eh'Me, = Mi + Mo=Mi 1 +
Eh
(4)
From (1) and (3) and the equation for A, the mid-
height deflection can be rewritten:
A= Mi = • Met1
48£/i 48£/i1 + Eh
Eh
The added moment acting on the wall at mid-height,
(SP)A can be expressed as:
5 h'lPaP)A = Me,
48 Eh[l +EhEh
54
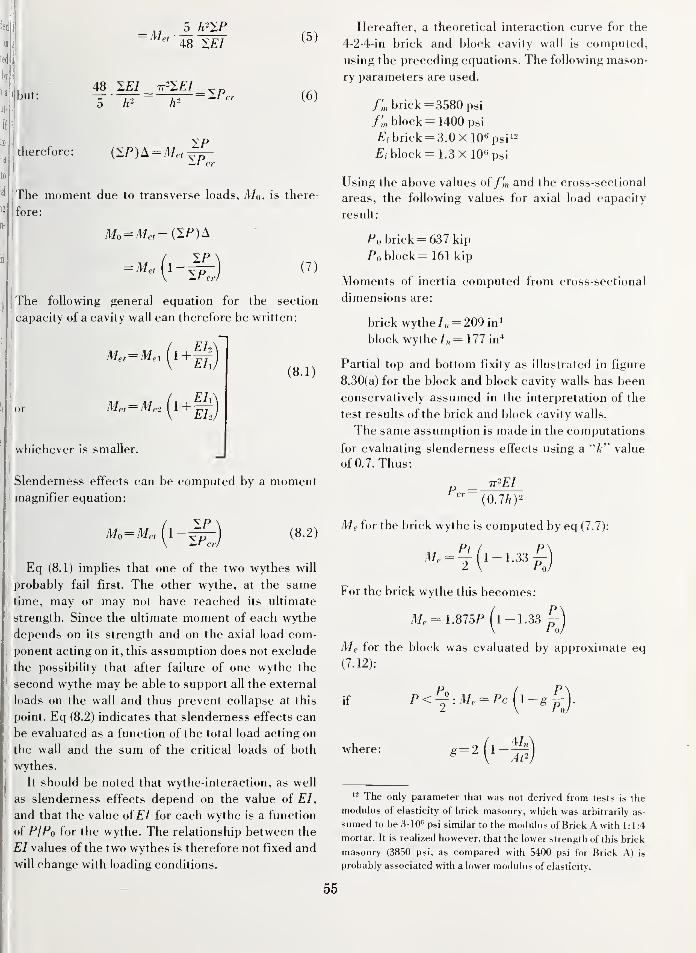
5 A-SP
48 lEI
but:48 ^EI tt'XEI
h- h-
= VP
(5)
(6)
therefore: {^P)^ = MettPIPcr
The moment due to transverse loads, Mo, is there-
fore:
Mo= Me,-aP)A
(7)
The following general equation for the section
capacity of a cavity wall can therefore be written:
Met^Me, 1 +
or Met= Me2 1 +
EhEh
EhEh
whichever is smaller.
(8.i;
Slenderness effects can be computed by a momentmagnifier equation:
Mo= Met l-IPIPc,
(8.2)
Eq (8.1) impUes that one of the two wythes will
probably fail first. The other wythe, at the same
time, may or may not have reached its ultimate
strength. Since the ultimate moment of each wythe
depends on its strength and on the axial load com-
ponent acting on it, this assumption does not exclude
the possibihty that after failure of one wythe the
second wythe may be able to support all the external
loads on the wall and thus prevent collapse at this
point. Eq (8.2) indicates that slenderness effects can
be evaluated as a function of the total load acting on
the wall and the sum of the critical loads of both
wythes.
It should be noted that wythe-interaction, as well
as slenderness effects depend on the value of Ehand that the value ofEI for each wythe is a function
of P/Po for the wythe. The relationship between the
EI values of the two wythes is therefore not fixed and
will change with loading conditions.
Hereafter, a theoretical interaction curve for the
4-2-4-in brick and block cavity wall is computed,
using the preceding equations. The following mason-
ry parameters are used.
/,'„ brick = 3580 psi
/;„ block = 1400 psi
£"/ brick = 3.0 X 10«psii^
block = 1.3 X 10« psi
Using the above values of /,'„ and the cross-sectional
areas, the following values for axial load capacity
result:
Po brick = 637 kip
Po block = 161 kip
Moments of inertia computed from cross-sectional
dimensions are:
brick wythe /„ = 209 in*
block wythe /„ =177 in*
Partial top and bottom fixity as illustrated in figure
8.30(a) for the block and block cavity walls has been
conservatively assumed in the interpretation of the
test results of the brick and block cavity walls.
The same assumption is made in the computations
for evaluating slenderness effects using a "A" value
of 0.7. Thus:
TT'^EIP =1 cr
(0.7/!)2
Me for the brick wythe is computed by eq (7.7):
Pt ( P
For the brick wythe this becomes:
Me^ 1.875P fl-1.33Po
Me for the block was evaluated by approximate eq
(7.12):
if (1-^.0
where:
The only parameter that was not derived from tests is the
modulus of elasticity of brick masonry, which was arbitrarily as-
sumed to be 3-10'' psi similar to the modulus of Brick A with 1:1:4
mortar. It is realized however, that the lower strength of this brick
masonry (3850 psi, as compared with 5400 psi for Brick A) is
probably associated with a lower modulus of elasticity.
55
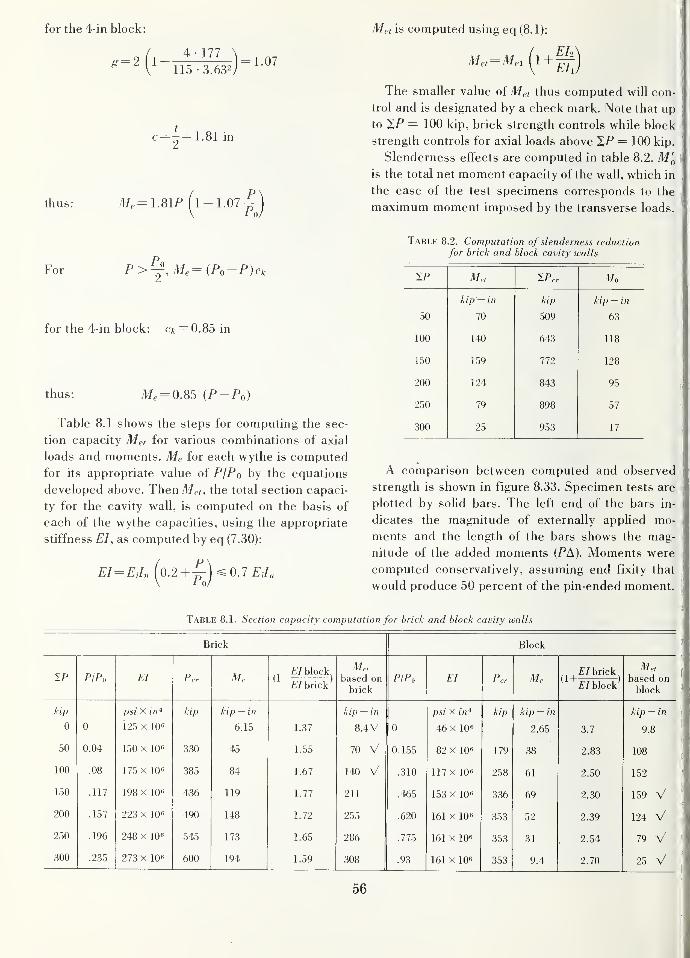
for the 4-in block:
thus:
c=-= 1.81 in
M^=1.81P 1-1.07
Met is computed using eq (8.1):
Met= Mei fl+l^
The smaller value of Met thus computed will con-
trol and is designated by a check mark. Note that up
to XP — 100 kip, brick strength controls while block
strength controls for axial loads above 2P= 100 kip.
Slenderness effects are computed in table 8.2. M'q
is the total net moment capacity of the wall, which in
the case of the test specimens corresponds to the
maximum moment imposed by the transverse loads.
For F>^, Me^{Po-P)ek
for the 4-in block: e/c = 0.85in
thus: Me-0.85 {P-Po
Table 8.1 shows the steps for computing the sec-
tion capacity Met for various combinations of axial
loads and moments. Me for each wythe is computed
for its appropriate value of PjPo by the equations
developed above. Then Me,, the total section capaci-
ty for the cavity wall, is computed on the basis of
each of the wythe capacities, using the appropriate
stiffness EI, as computed by eq (7.30):
EI= EiIn 0.2 +Po
0.7 EJn
Table 8.2. Computation of slenderness reduction
for brick and block cavity tvalls
IP M,, ^Pcr 'V/o
kip — in kip kip — in
50 70 509 63
100 140 643 118
150 159 772 128
200 124 843 95
250 79 898 57
300 25 953 17
A comparison between computed and observed
strength is shown in figure 8.33. Specimen tests are
plotted by soHd bars. The left end of the bars in-
dicates the magnitude of externally applied mo-
ments and the length of the bars shows the mag-
nitude of the added moments {PA). Moments were
computed conservatively, assuming end fixity that
would produce 50 percent of the pin-ended moment.
Table 8.1.. Section capacity computation for brick and block cavity walls
B rick Block
IP PlPo EI Per Mr, EI block
EI brick
Mr,
based on
brick
PlPo EI Pr, MrEI brick
* £•/ block*
Me,based onblock
kip psi X in-* k,p kip — in kip — in psi X in^ kip kip — in kip — in
0 0 125 X lOe 6.15 1.37 8.4V 0 46 X 106 2.65 3.7 9.8
50 0.04 150 X 106 330 45 1.55 70 V 0.1,55 82 X 106 179 38 2.83 108
100 .08 175 X lO** 385 84 1.67 140 V .310 117X 106 2.58 61 2.50 1,52
150 .117 198 X 10** 436 119 1.77 211 .465 1.53 X 10⁶ 336 69 2.30 1,59 V200 .157 223 X 106 490 148 1.72 255 .620 161 X 106 353 52 2.39 124 V250 .196 248 X 106 545 173 1.65 286 .775 161 X 106 353 31 2..54 79 v'
300 .235 273 X 106 600 194 1.59 308 .93 161 X 106 353 9.4 2.70 25 V
56
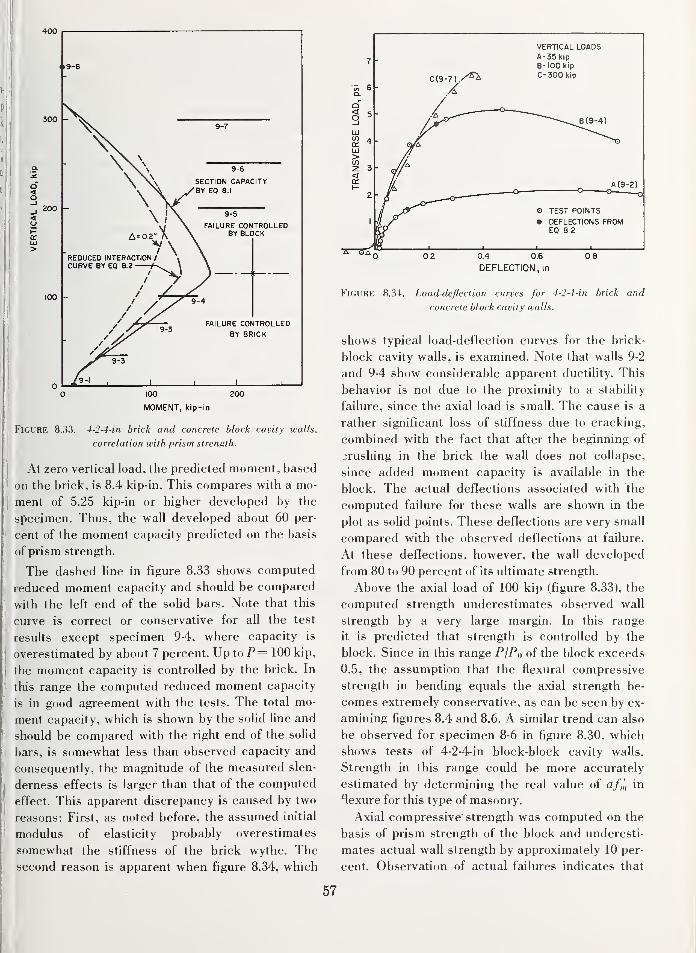
400
100 200
MOMENT, kip-in
I
Figure 8.33. 4-2-4-in brick and concrete block cavity walls,
j
correlation with prism strength.
At zero vertical load, the predicted moment, based
on the brick, is 8.4 kip-in. This compares with a mo-
jment of 5.25 kip-in or higher developed by the
specimen. Thus, the wall developed about 60 per-
il cent of the moment capacity predicted on the basis
I
of prism strength.
I
The dashed Hne in figure 8.33 shows computed
jreduced moment capacity and should be compared
j
with the left end of the sohd bars. Note that this
J
curve is correct or conservative for all the test
;!results except specimen 9-4, where capacity is
Ioverestimated by about 7 percent. Up to P= 100 kip,
j the moment capacity is controlled by the brick. In
I this range the computed reduced moment capacity
is in good agreement with the tests. The total mo-
, ment capacity, which is shown by the solid hne and
!! should be compared with the right end of the solid
l| bars, is somewhat less than observed capacity and
consequently, the magnitude of the measured slen-
Iderness effects is larger than that of the computed
effect. This apparent discrepancy is caused by two
reasons: First, as noted before, the assumed initial
I modulus of elasticity probably overestimates
I somewhat the stiffness of the brick wythe. The
j second reason is apparent when figure 8.34, which
7
tfi 6a.
q'
o ^_]
LUCO 4LiJ
>
<trI-
2
-
/ ^ — -
VERTICAL LOADSA-35kipB-iOO kip
C-300 kip
A
' ~~— (9-4)
/A (9-2)
O T_
lljO^^'^ o test points
il^r • DEFLECTIONS FROMEQ 8 2
Q 1 1 1 1'lo I I I I—0 0.2 0.4 0.6 0.8
DEFLECTION, in
Figure 8.34. Load-deflection curves for 4-2^-in brick and
concrete block cavity walls.
shows typical load-deflection curves for the brick-
block cavity walls, is examined. Note that walls 9-2
and 9-4 show considerable apparent ductility. This
behavior is not due to the proximity to a stability
failure, since the axial load is small. The cause is a
rather significant loss of stiffness due to cracking,
combined with the fact that after the beginning of
crushing in the brick the wall does not collapse,
since added moment capacity is available in the
block. The actual deflections associated with the
computed failure for these walls are shown in the
plot as solid points. These deflections are very small
compared with the observed deflections at failure.
At these deflections, however, the wall developed
from 80 to 90 percent of its ultimate strength.
Above the axial load of 100 kip (figure 8.33), the
computed strength underestimates observed wall
strength by a very large margin. In this range
it is predicted that strength is controlled by the
block. Since in this range PIPq of the block exceeds
0.5, the assumption that the flexural compressive
strength in bending equals the axial strength be-
comes extremely conservative, as can be seen by ex-
amining figures 8.4 and 8.6. A similar trend can also
be observed for specimen 8-6 in figure 8.30, which
shows tests of 4-2-4-in block-block cavity waUs.
Strength in this range could be more accurately
estimated by determining the real value of a/„', in
*lexure for this type of masonry.
Axial compressive' strength was computed on the
basis of prism strength of the block and underesti-
mates actual wall strength by approximately 10 per-
cent. Observation of actual failures indicates that
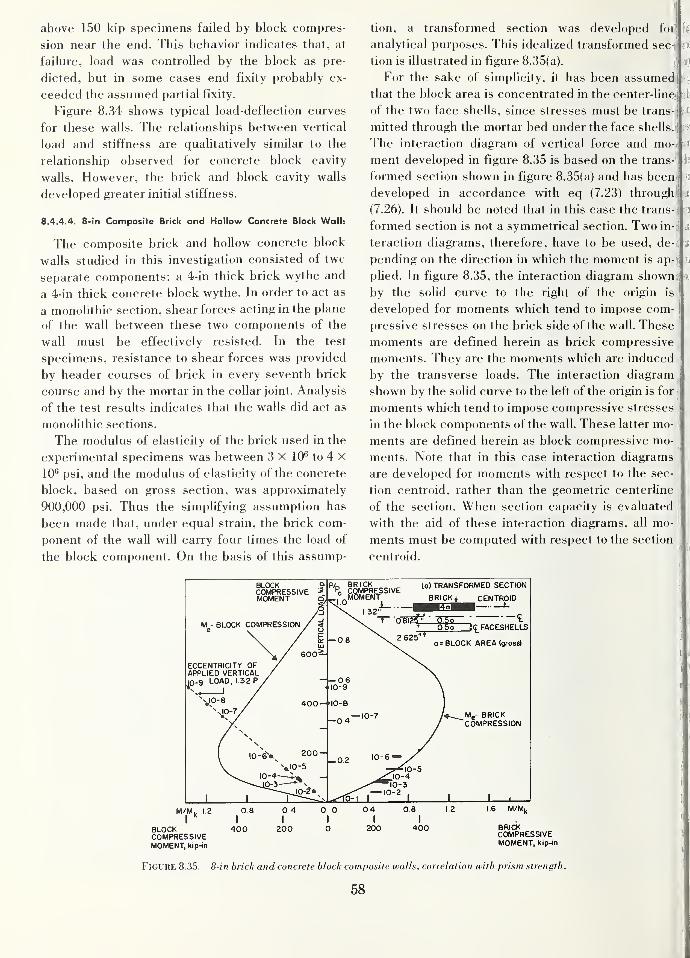
above 150 kip specimens failed by block compres-
sion near the end. This behavior indicates that, at
failure, load was controlled by the block as pre-
dicted, but in some cases end fixity probably ex-
ceeded the assumed partial fixity.
Figure 8.34 shows typical load-deflection curves
for these walls. The relationships between vertical
load and stiffness are quahtatively similar to the
relationship observed for concrete block cavity
walls. However, the brick and block cavity walls
developed greater initial stiffness.
8.4.4.4. 8-in Composite Brick and Hollow Concrete Block Wall:
The composite brick and hollow concrete block
walls studied in this investigation consisted of twc
separate components: a 4-in thick brick wythe and
a 4-in thick concrete block wythe. In order to act as
a monoHthic section, shear forces acting in the plane
of the wall between these two components of the
wall must be effectively resisted. In the test
specimens, resistance to shear forces was provided
by header courses of brick in every seventh brick
course and by the mortar in the collar joint. Analysis
of the test results indicates that the walls did act as
monoUthic sections.
The modulus of elasticity of the brick used in the
experimental specimens was between 3 X 10^ to 4 X
10^ psi, and the modulus of elasticity of the concrete
block, based on gross section, was approximately
900,000 psi. Thus the simplifying assumption has
been made that, under equal strain, the brick com-
ponent of the wall will carry four times the load of
the block component. On the basis of this assump-
tion, a transformed section was developed foi
analytical purposes. This idealized transformed sec-|
tion is illustrated in figure 8.35(a).i
For the sake of simplicity, it has been assumed
that the block area is concentrated in the center-line^
of the two face shells, since stresses must be trans-i
mitted through the mortar bed under the face shells.
The interaction diagram of vertical force and mo-
ment developed in figure 8.35 is based on the trans-
formed section shown in figure 8.35(a) and has been
developed in accordance with eq (7.23) throughl s
(7.26). It should be noted that in this case the trans- »
formed section is not a symmetrical section. Two in-:
teraction diagrams, therefore, have to be used, de-i ppending on the direction in which the moment is ap
plied. In figure 8.35, the interaction diagram shownj
by the solid curve to the right of the origin is
developed for moments which tend to impose com-
pressive stresses on the brick side of the wall. These
moments are defined herein as brick compressive
moments. They are the moments which are induced
by the transverse loads. The interaction diagram
shown by the solid curve to the left of the origin is for
moments which tend to impose compressive stresses
in the block components of the wall. These latter mo-
ments are defined herein as block compressive mo-
ments. Note that in this case interaction diagrams
are developed for moments with respect to the sec-
tion centroid, rather than the geometric centerline
of the section. When section capacity is evaluated
with the aid of these interaction diagrams, all mo-
ments must be computed with respect to the section
centroid.
BLOCKCOMPRESSIVEMOMENT
M - BLOCK COMPRESSION
ECCENTRICITY OFAPPLIED VERTICAL
jO-9 LOAD, I 32 P^
\l0-8"niO-7,
P/„ BRICKPq compressive
MOMENT(o) transformed section
BRICKl CENTROID
M/M^ 12
I
'
BLOCKCOMPRESSIVEMOMENT, kip-in
3({^FACESHELLS
0 = BLOCK AREA (gross)
Mg- BRICKCOMPRESSION
BRICKCOMPRESSIVEMOMENT, kip-in
Figure 8.35. 8-in brick and concrete block composite walls, correlation with prism strength.
58
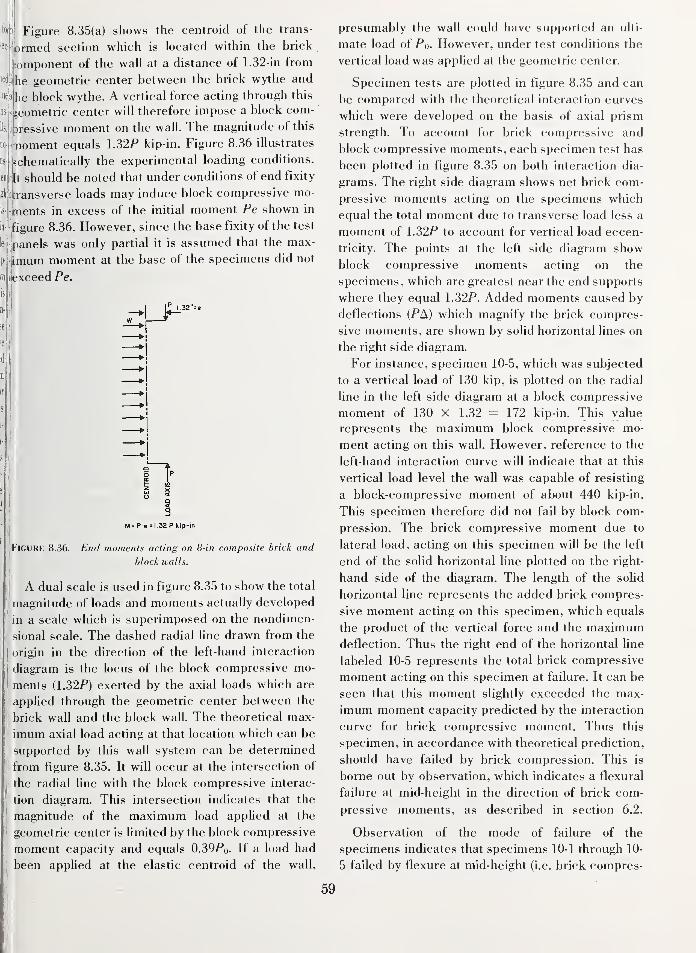
fori Figure 8.35(a) shows the centroid of the trans-
^wjormed section which is located within the brick
lomponent of the wall at a distance of 1.32 -in from
he geometric center between the brick wythe and
'it^he block wythe. A vertical force acting through this
geometric center will therefore impose a block com-
Dressive moment on the wall. The magnitude of this
iioment equals 1.32P kip-in. Figure 8.36 illustrates
ichematically the experimental loading conditions,
t should be noted that under conditions of end fixity
ransverse loads may induce block compressive mo-
•|ments in excess of the initial moment Pe shown in
Eigure 8.36. However, since the base fixity of the test
)anels was only partial it is assumed that the max-
imum moment at the base of the specimens did not
iiexceed Pe.
Figure 8.36.
M= P e =1 32 P kip-in
End moments acting on 8-in composite brick and
block walls.
A dual scale is used in figure 8.35 to show the total
magnitude of loads and moments actually developed
in a scale which is superimposed on the nondimen-
sional scale. The dashed radial Hne drawn from the
origin in the direction of the left-hand interaction
diagram is the locus of the block compressive mo-
ments (1.32P) exerted by the axial loads which are
applied through the geometric center between the
brick wall and the block wall. The theoretical max-
I
imum axial load acting at that location which can be
I
supported by this wall system can be determined
j
from figure 8.35. It will occur at the intersection of
the radial hne with the block compressive interac-
tion diagram. This intersection indicates that the
magnitude of the maximum load applied at the
geometric center is limited by the block compressive
moment capacity and equals 0.39Po- If a load had
been applied at the elastic centroid of the wall,
y
presumably the wall could have supported an ulti-
mate load of However, under test conditions the
vertical load was applied at the geometric center.
Specimen tests are plotted in figure 8.35 and can
be compared with the theoretical interaction curves
which were developed on the basis of axial prism
strength. To account for brick compressive and
block compressive moments, each specimen test has
been plotted in figure 8.35 on both interaction dia-
grams. The right side diagram shows net brick com-
pressive moments acting on the specimens which
equal the total moment due to transverse load less a
moment of 1.32P to account for vertical load eccen-
tricity. The points at the left side diagram show
block compressive moments acting on the
specimens, which are greatest near the end supports
where they equal 1.32P. Added moments caused by
deflections (PA) which magnify the brick compres-
sive moments, are shown by solid horizontal lines on
the right side diagram.
For instance, specimen 10-5, which was subjected
to a vertical load of 130 kip, is plotted on the radial
hne in the left side diagram at a block compressive
moment of 130 X 1.32 = 172 kip-in. This value
represents the maximum block compressive mo-
ment acting on this wall. However, reference to the
left-hand interaction curve will indicate that at this
vertical load level the wall was capable of resisting
a block-compressive moment of about 440 kip-in.
This specimen therefore did not fail by block com-
pression. The brick compressive moment due to
lateral load, acting on this specimen wiU be the left
end of the solid horizontal line plotted on the right-
hand side of the diagram. The length of the solid
horizontal line represents the added brick compres-
sive moment acting on this specimen, which equals
the product of the vertical force and the maximumdeflection. Thus the right end of the horizontal line
labeled 10-5 represents the total brick compressive
moment acting on this specimen at failure. It can be
seen that this moment slightly exceeded the max-
imum moment capacity predicted by the interaction
curve for brick compressive moment. Thus this
specimen, in accordance with theoretical prediction,
should have failed by brick compression. This is
borne out by observation, which indicates a flexural
failure at mid-height in the direction of brick com-
pressive moments, as described in section 6.2.
Observation of the mode of failure of the
specimens indicates that specimens 10-1 through 10-
5 failed by flexure at mid-height (i.e. brick compres-
59
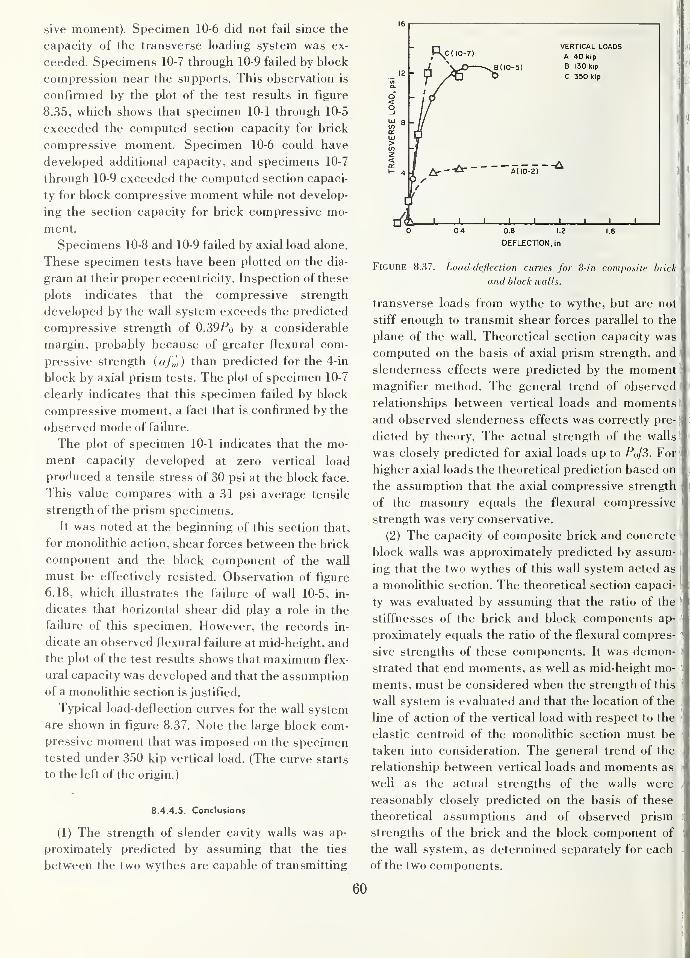
sive moment). Specimen 10-6 did not fail since the
capacity of the transverse loading system was ex-
ceeded. Specimens 10-7 through 10-9 failed by block
compression near the supports. This observation is
confirmed by the plot of the test results in figure
8.35, which shows that specimen 10-1 through 10-5
exceeded the computed section capacity for brick
compressive moment. Specimen 10-6 could have
developed additional capacity, and specimens 10-7
through 10-9 exceeded the computed section capaci-
ty for block compressive moment while not develop-
ing the section capacity for brick compressive mo-
ment.
Specimens 10-8 and 10-9 failed by axial load alone.
These specimen tests have been plotted on the dia-
gram at their proper eccentricity. Inspection of these
plots indicates that the compressive strength
developed by the wall system exceeds the predicted
compressive strength of 0.39f*o by a considerable
margin, probably because of greater flexural com-
pressive strength (a/,/,) than predicted for the 4-in
block by axial prism tests. The plot of specimen 10-7
clearly indicates that this specimen failed by block
compressive moment, a fact that is confirmed by the
observed mode of failure.
The plot of specimen 10-1 indicates that the mo-
ment capacity developed at zero vertical load
produced a tensile stress of 30 psi at the block face.
This value compares with a 31 psi average tensile
strength of the prism specimens.
It was noted at the beginning of this section that,
for monolithic action, shear forces between the brick
component and the block component of the wall
must be effectively resisted. Observation of figure
6.18, which illustrates the failure of wall 10-5, in-
dicates that horizontal shear did play a role in the
failure of this specimen. However, the records in-
dicate an observed flexural failure at mid-height, and
the plot of the test results shows that maximum flex-
ural capacity was developed and that the assumption
of a monolithic section is justified.
Typical load-deflection curves for the wall system
are shown in figure 8.37. Note the large block com-
pressive moment that was imposed on the specimen
tested under 350 kip vertical load. (The curve starts
to the left of the origin.)
8.4.4.5. Conclusions
(1) The strength of slender cavity walls was ap-
proximately predicted by assuming that the ties
between the two wythes are capable of transmitting
DEFLECTION, in
Figure 8.37. Load-deflection curves for 8-in composite brick
and block walls.
transverse loads from wythe to wythe, but are not
stiff enough to transmit shear forces parallel to the
plane of the wall. Theoretical section capacity was
computed on the basis of axial prism strength, and
slenderness effects were predicted by the moment '
magnifier method. The general trend of observed I
relationships between vertical loads and moments |i
and observed slenderness effects was correctly pre-
;
dieted by theory. The actual strength of the walls 'i
was closely predicted for axial loads up to ^0/3. For|5
higher axial loads the theoretical prediction based on
the assumption that the axial compressive strength
of the masonry equals the flexural compressive
strength was very conservative.
(2) The capacity of composite brick and concrete
block walls was approximately predicted by assum-
ing that the two wythes of this wall system acted as
a monolithic section. The theoretical section capaci-
ty was evaluated by assuming that the ratio of the
stiffnesses of the brick and block components ap-
proximately equals the ratio of the flexural compres-
sive strengths of these components. It was demon-
strated that end moments, as well as mid-height mo-
ments, must be considered when the strength of this
wall system is evaluated and that the location of the
line of action of the vertical load with respect to the
elastic centroid of the monolithic section must be
taken into consideration. The general trend of the
relationship between vertical loads and moments as
well as the actual strengths of the walls were
reasonably closely predicted on the basis of these
theoretical assumptions and of observed prism
strengths of the brick and the block component of
the wall system, as determined separately for each
of the two components.
60
(3) All of the walls tested at zero vertical compres-
'sive load developed tensile strength which equaled
or exceeded 50 percent of the tensile strength pre-
I dieted on the basis of flexural tests on prisms.
9. Recommendations and Discussionof Present Design Practice
j 9.1.Determination ofTransverse Strength of
I
Masonry Walls
Two wall properties must be evaluated in order to
determine the transverse strength of masonry walls:
1. The capacity of the wall cross section to re-
sist combined bending and axial loads.
2. The effect of wall slenderness on load
capacity.
It has been shown in section 7.2 that the moment
capacity of a wall cross section is not only a function
of the tensile and compressive strength of the
masonry but also of the vertical load acting on the
cross section. Thus an interaction curve can be
jdeveloped which shows the maximum momentcapacity as a function of vertical load. Such an in-
teraction curve can be developed if flexural tensile
and compressive strengths and the stress-strain pro-
perties of the masonry are known.
It has been shown that cross-sectional capacity
can be conservatively determined by assuming a
flexural compressive strength equal to the compres-
sive strength of prisms under axial loading, a linear
stress-strain relationship for masonry, and a flexural
tensile strength equal to 50 percent of the modulus
of rupture as determined by prism tests. This
procedure is conservative since it appears that most
specimens developed flexural compressive strengths
in excess of the strength of axially loaded prisms,
and that the assumption of a linear stress-strain rela-
tionship will underestimate the moment that the
cross section is actually capable of developing.
In this study, the capacity of wall cross sections
has been evaluated directly by testing eccentrically
loaded prism specimens and indirectly by adding the
moment exerted by the axial load on the deflected
wall to the moment exerted by transverse loads.
Slenderness effects are caused by the additional
moments which the vertical loads impose on the
deflected waU. Not only will the vertical load impose
added moments on the walls, which will equal the
product of the vertical load and transverse deflec-
tions relative to the line of action of the vertical load,
but the vertical load will also act to increase the mag-
nitude of transverse deflections. These slenderness
effects, which will magnify the moments acting on
the walls, can be approximately predicted by the mo-
ment magnifier method, provided that EI, the stiff-
ness of the wall, is correctly estimated.
Slenderness effects have been successfully and
conservatively predicted for slender brick walls by
using the moment magnifier equation with an
equivalent stiffness which may be predicted either
by eq (7.29) or by (7.30). Equation (7.29) is somewhat
simpler, while eq (7.30) shows better agreement with
test results for the entire range of vertical loads that
the wall can support. No extensive data are available
on slender concrete block walls. Transverse strength
can be reasonably weU predicted, however, by using
eq (7.29) or (7.30) to predict slenderness effects for
solid block walls, and by conservatively assuming for
hollow block that the cracking line represents ulti-
mate strength.
The moment magnifier equation [eq (7.28)] uses
a coefficient Cm, which accounts for the shape of the
deflection curve and a coefficient k, which accounts
for end fixity. In the special case where moments are
caused by transverse loads, the coefficient C,n is
taken as 1. However, in the case where transverse
moments are caused by eccentric vertical loads, a
case which was not covered by this investigation, the
moment magnifier equation is also applicable, with
a factor C,„ which will depend on the relationship
between vertical load eccentricities at the wall sup-
ports. Thus the moment magnifier method could be
applied to determine transverse strength under all
practical loading conditions.
The practical procedure in an actual design
problem would be to determine cross-sectional
capacity on the basis of flexural compressive and
tensile strengths, cross-sectional geometry, and the
vertical load at which transverse strength is to be
determined, and then to reduce this capacity to ac-
count for slenderness, on the basis of wall length,
end-support conditions, and wall stiffness "fT' at the
design vertical load.
The following equations may be used to predict ul-
timate and cracking strength. The ultimate trans-
verse moment imposed on the wall in the direction
of transverse loads. Mo', can be taken as:
61
The maximum end moment opposite to the direction
of transverse loads. Mend, will be: Mend— Me
where:
Me — maximum moment capacity of the wall in
the direction of transverse loads,
Me = maximum moment capacity of the waUopposite to the direction of transverse
load,
P — applied axial load,
Per — critical load for stability-induced com-
pressive failure, computed on the basis of
a modified EI, accounting for section
cracking and reduced stiffness at maxi-
mum stress, where:
EI= EiIn-(o:2 + y^^0.7 EJn or EI=^Ei = initial tangent modulus of elasticity of
masonry.
In = moment of inertia based on uncracked
net section,
Po = short-wall axial load capacity (section
7.2.2.1).
The transverse cracking strength of a wall, Mc,
can be determined by the following equation:
where:
Mc = moment at which cracking occurs (sec-
tion 7.2.2.1),
Mt = maximum moment considering tensile
strength with zero vertical load (section
7.2.2.1),
Ck = distance from centroid to edge of kern,
Pero = critical load for stabihty-induced com-
pression failure computed on the basis
of Ei and /« (section 7.3); 0.7 Pero is rec-
ommended as critical load for uncracked
walls.
In view of the loss of moment of inertia after
cracking of hollow block walls, it is recommended
that the ultimate strength of slender hollow concrete
block walls equal the cracking strength.
9.2. Discussion of Present Design Practice
Present masonry design is based entirely on work-
ing stresses. Even though design provisions were
developed with specific margins of safety relative tj
ultimate strength in mind, comparison of hypothet
cal ultimate strength computed on the basis i
design practice standards with ultimate strength a^
tually achieved is not necessarily the only criteric
by which these should be judged.
Three different design standards will be coi
sidered:
(1) The ANSI Standard Building Code Requin
ments for Masonry [5]
(2) Building Code Requirements for Engineere
Brick Masonry developed by SCPI [9]
(3) Design Specifications for Load-Bearin{
Concrete Masonry developed by NCM!
[10] and proposed recommendatioi
developed by ACI Committee 531 [11;
9.2.1. ANSI Standard Building Code RequirementsI
The ANSI building code requirements (A41.]i
1953) limit allowable slenderness as follows:
Type of masonry hjt Ratio (based onnominal dimensions)
Hollow unit walls 18
Solid unit walls 20
Cavity walls 18 '3
These limits may be
24 for the brick wall
compared with a nominal hjt c
5, and a nominal hjt of 12 for th
block walls as well as the cavity walls tested in thi
!
program. Consequently, these design requirement
j
permit the construction of walls that will be subjecl
to considerable slenderness effects, particularly ii
the case of cavity walls. On the other hand, this star
dard does not contain any provisions for stres
reduction to account for these slenderness effects
To assure a safe design, permitted allowabL
stresses are extremely low, compensating for poten
tial slenderness effects. Such a procedure, whicl
does not account for such an important variable
requires a very high margin of safety which penal
izes short walls and therefore leads to uneconomica
design.
For composite waUs, this standard limits the al
lowable stress to that permitted for the weakest o
the combinations of units and mortars of which tht
member is composed. There are no provisions foil
considering the location of the vertical load witl
respect to the weakest wall materials.
t in cavity walls is the sum of both wythe thicknesses.
62
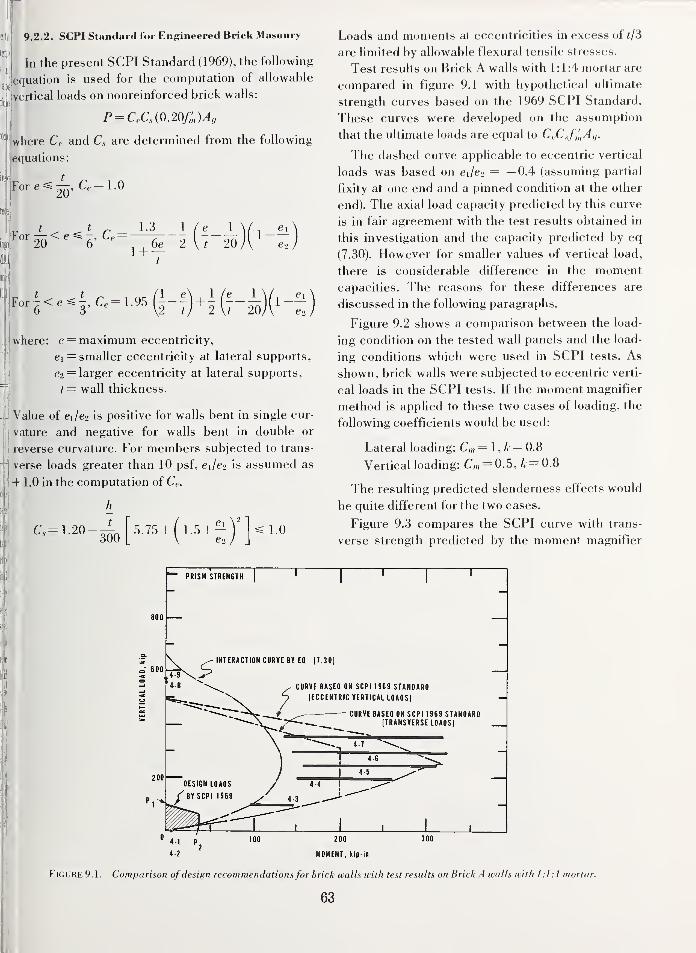
9.2.2. SCPl Standard for Engineered Brick Masonry
In the present SCPI Standard (1969), the following
equation is used for the computation of allowable
vertical loads on nonreinforced brick walls:
P = CeCsi0.20f,:,)A>,
-where Ce and Cs are determined from the following
equations:
For e
For-<e - r =6'
1^16e 2
1 +20
1-
0 6 t)'^2{t 20
where: e = maximum eccentricity,
ei = smaller eccentricity at lateral supports,
^2 = larger eccentricity at lateral supports,
t= wall thickness.
Value of ei/e2 is positive for walls bent in single cur-
vature and negative for walls bent in double or
reverse curvature. For members subjected to trans-
""Iverse loads greater than 10 psf, Ci/e-z is assumed as
+ 1.0 in the computation of Cp.
Cs=1.20
h
t
3005.75+ ( 1.5 +— 1.0
Loads and moments at eccentricities in excess of i/3
are Hmited by allowable flexural tensile stresses.
Test results on Brick A walls with 1:1:4 mortar are
compared in figure 9.1 with hypothetical ultimate
strength curves based on the 1969 SCPI Standard.
These curves were developed on the assumption
that the ultimate loads are equal to CeCsf,'„A,i.
The dashed curve applicable to eccentric vertical
loads was based on eje-i — —0.4 (assuming partial
fixity at one end and a pinned condition at the other
end). The axial load capacity predicted by this curve
is in fair agreement with the test results obtained in
this investigation and the capacity predicted by eq
(7.30). However for smaller values of vertical load,
there is considerable difference in the moment
capacities. The reasons for these differences are
discussed in the following paragraphs.
Figure 9.2 shows a comparison between the load-
ing condition on the tested wall panels and the load-
ing conditions which were used in SCPI tests. As
shown, brick walls were subjected to eccentric verti-
cal loads in the SCPI tests. If the moment magnifier
method is apphed to these two cases of loading, the
following coefficients would be used:
Lateral loading: C,„ =l,k — 0.8
Vertical loading: C„, = 0.5, A'= 0.8
The resulting predicted slenderness effects would
be quite different for the two cases.
Figure 9.3 compares the SCPI curve with trans-
verse strength predicted by the moment magnifier
800
600
PRISM STRENGTH T
INTERACTION CURVE BY EQ |7.30|
CURVE BASED ON SCPI 1969 STANDARD
(ECCENTRIC VERTICAL LOADS!
r ^ CURVE BASED ON SCPI 1969 STANDARD(TRANSVERSE LOADS!
2002
4-2 MOMENT, l(ip in
Figure 9.1. Comparison of design recommendations for brick walls with test results on Brick A walls with 1 :1 :4 mortar.
63
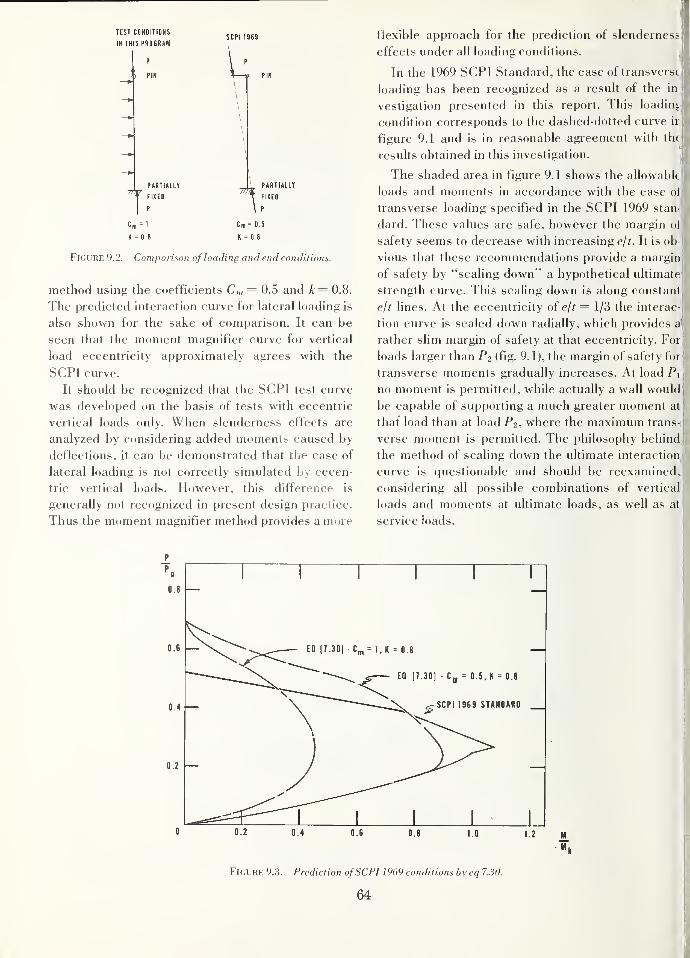
TEST CONOITIOKS
IN THIS PROCRAM
P
'
> PIK
SCPI 1969
PARTIALLY
FIXED
P
PIN
1PARTIALLY
FIXED
K = 0,8
Cm = 0,5
K = 0 8
Figure 9.2. Comparison of loading and end conditions.
method using the coefficients Cm = 0.5 and k = 0.8.
The predicted interaction curve for lateral loading is
also shown for the sake of comparison. It can be
seen that the moment magnifier curve for vertical
load eccentricity approximately agrees with the
SCPI curve.
It should be recognized that the SCPI test curve
was developed on the basis of tests with eccentric
vertical loads only. When slenderness effects are
analyzed by considering added moments caused by
deflections, it can be demonstrated that the case of
lateral loading is not correctly simulated by eccen-
tric vertical loads. However, this difference is
generally not recognized in present design practice.
Thus the moment magnifier method provides a more
flexible approach for the prediction of slenderness
effects under all loading conditions.|
In the 1969 SCPI Standard, the case of transverse
loading has been recognized as a result of the in
vestigation presented in this report. This loading
condition corresponds to the dashed-dotted curve ir
figure 9.1 and is in reasonable agreement with the.L
results obtained in this investigation. i
The shaded area in figure 9.1 shows the allowable
loads and moments in accordance with the case oil
transverse loading specified in the SCPI 1969 stanJ
dard. These values are safe, however the margin of
safety seems to decrease with increasing e/t. It is ob-
vious that these recommendations provide a margin
of safety by "scaling down" a hypothetical ultimate
strength curve- This scaling down is along constant
elt lines. At the eccentricity of elt = 1/3 the interac-
tion curve is scaled down radially, which provides a''
rather slim margin of safety at that eccentricity. For
loads larger than P> (fig. 9.1), the margin of safety for
transverse moments gradually increases. At load Pi
no moment is permitted, while actually a wall wouldji
be capable of supporting a much greater moment at!
that load than at load P2, where the maximum trans-j
verse moment is permitted. The philosophy behind
the method of scaling down the ultimate interaction
curve is questionable and should be reexamined,
considering all possible combinations of vertical
loads and moments at ultimate loads, as well as at
service loads.
EQ 17.301 • C„ = l.K = 0.8
EQ |7.30| • = 0.5, K = 0.8
SCPI 1969 STANDARD
.2 M
Figure 9.3. Prediction ofSCPI 1969 conditions byeq 7.30.
64
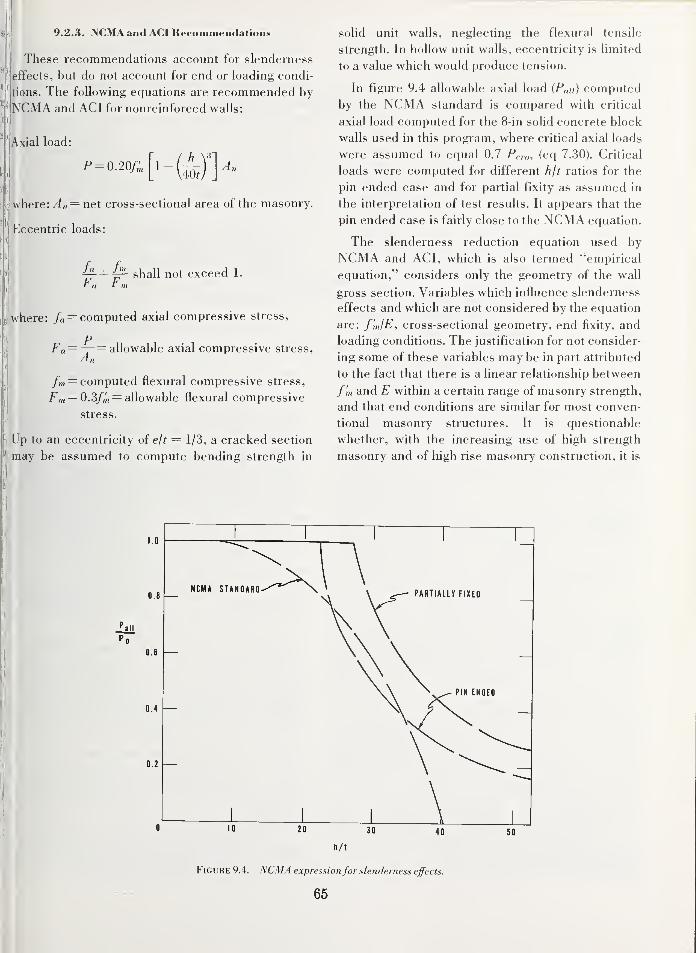
9.2.3. NCMA and ACI Recommendations
These recommendations account for slenderness
effects, but do not account for end or loading condi-
tions. The following equations are recommended by
NCMA and ACI for nonreinforced walls:
Axial load:
p=o.20/; An
where: A„ = net cross-sectional area of the masonry.
Eccentric loads:
^+^ shall not exceed 1.
where: /« = computed axial compressive stress,
pFa=—= allowable axial compressive stress,
An
/m = computed flexural compressive stress,
Fm = 0.3/ni = allowable flexural compressive
stress.
Up to an eccentricity of e/t = 1/3, a cracked section
^may be assumed to compute bending strength in
solid unit walls, neglecting the flexural tensile
strength. In hollow unit walls, eccentricity is limited
to a value which would produce tension.
In figure 9.4 allowable axial load {P,iii) computed
by the NCMA standard is compared with critical
axial load computed for the 8-in solid concrete block
walls used in this program, where critical axial loads
were assumed to equal 0.7 Pco, (eq 7.30). Critical
loads were computed for different h/t ratios for the
pin ended case and for partial fixity as assumed in
the interpretation of test results. It appears that the
pin ended case is fairly close to the NCMA equation.
The slenderness reduction equation used by
NCMA and ACI, which is also termed "empirical
equation," considers only the geometry of the wall
gross section. Variables which influence slenderness
effects and which are not considered by the equation
are: f'mIE, cross-sectional geometry, end fixity, and
loading conditions. The justification for not consider-
ing some of these variables may be in part attributed
to the fact that there is a linear relationship between
f'm and E within a certain range of masonry strength,
and that end conditions are similar for most conven-
tional masonry structures. It is questionable
whether, with the increasing use of high strength
masonry and of high rise masonry construction, it is
[ill
1.0
0.8
0.6
0.4
0.2
NCMA STANDARD
Figure 9.4. NCMA expression for slenderness effects.
65
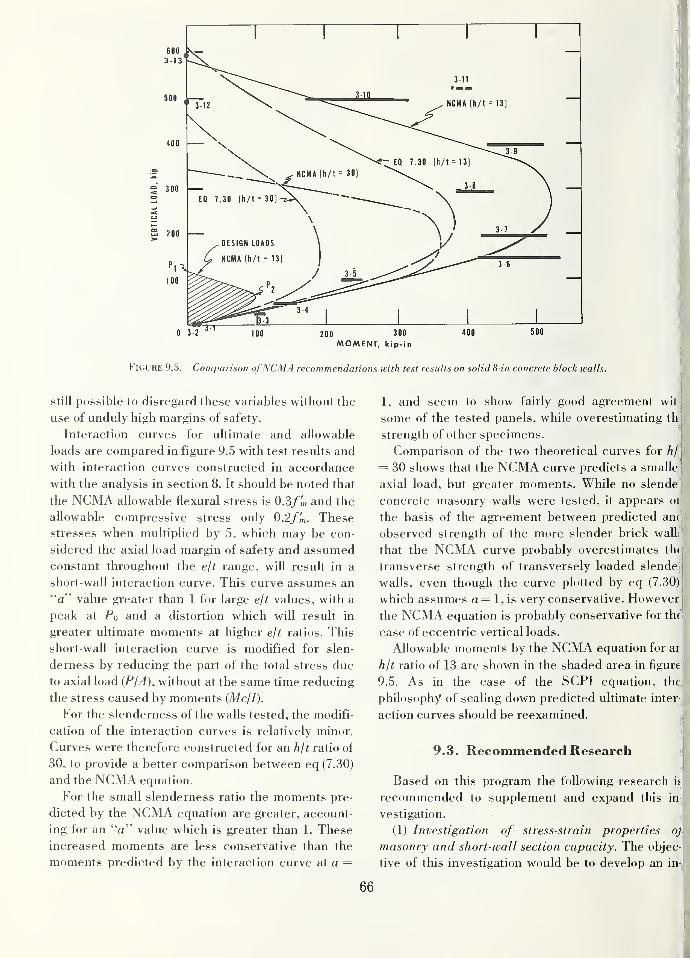
0 3-2 200 300
MOMENT, kip-in
i
i
Figure 9.5. Comparison ofNCMA recommendations with test results on solid 8-in concrete block walls.
still possible to disregard these variables without the
use of unduly high margins of safety.
Interaction curves for ultimate and allowable
loads are compared in figure 9.5 with test results and
with interaction curves constructed in accordance
with the analysis in section 8. It should be noted that
the NCMA allowable flexural stress is O.S/m and the
allowable compressive stress only 0.2/,'n. Thesestresses when multiplied by 5, which may be con-
sidered the axial load margin of safety and assumed
constant throughout the elt range, will result in a
short-wall interaction curve. This curve assumes an
"a" value greater than 1 for large ejt values, with a
peak at fo and a distortion which will result in
greater ultimate moments at higher ejt ratios. This
short-wall interaction curve is modified for slen-
derness by reducing the part of the total stress due
to axial load {PIA), without at the same time reducing
the stress caused by moments (Mcll).
For the slenderness of the walls tested, the modifi-
cation of the interaction curves is relatively minor.
Curves were therefore constructed for an h/t ratio ol
30. to provide a better comparison between eq (7.30)
and the NCMA equation.
For the small slenderness ratio the moments pre-
dicted by the NCMA equation are greater, account-
ing for an "a" value which is greater than 1. These
increased moments are less conservative than the
moments predicted by the interaction curve at a =
1, and seem to show fairly good agreement wit
some of the tested panels, while overestimating th
strength of other specimens.
Comparison of the two theoretical curves for h/
= 30 shows that the NCMA curve predicts a smalle
axial load, but greater moments. While no slende
concrete masonry walls were tested, it appears oi
the basis of the agreement between predicted amobserved strength of the more slender brick wall
that the NCMA curve probably overestimates thi
transverse strength of transversely loaded slende
walls, even though the curve plotted by eq (7.30)
which assumes a= l,is very conservative. However
the NCMA equation is probably conservative for the'
case of eccentric vertical loads.
Allowable moments by the NCMA equation for ar
hit ratio of 13 are shown in the shaded area in figure
9.5. As in the case of the SCPI equation, the,
philosophy of scaling down predicted ultimate inter
action curves should be reexamined.
9.3. Recommended Research
Based on this program the following research is
recommended to supplement and expand this in^,
vestigation.
(1) Investigation of stress-strain properties q/(
masonry and short-wall section capacity. The objec-
tive of this investigation would be to develop an in
66
leraction curve for short-wall section capacity on the
basis of short specimen tests. This study should in-
clude a thorough investigation of the relationship
between compressive strength in one-dimensional
compression and in flexure and investigation of the
stress distribution corresponding to linear strain
gradients.
(2) Investigation of slenderness effects on trans-
verse strength with particular emphasis on concrete
masonry. The purpose of this investigation would be
to study the strength of slender walls with the slen-
derness ratio as a variable.
(3) A mathematical study of the effects of section
cracking and the change in E with increasing stress.
The purpose of this investigation would be to mathe-
matically determine the relationship between stiff-
ness EI and the level of vertical loading at failure for
different wall systems.
(4) Investigation ofwalls resisting transverse loads
as two-way slabs, by studying walls supported along
three andfour edges.
(5) Investigation of walls subjected to a combina-
tion of transverse and eccentric vertical loads. The
purpose of this investigation would be to evaluate
the difference between slenderness effects on walls
loaded by eccentric vertical loads, by combined axial
vertical and transverse loads and by combinations of
these two modes of loading. The feasibility of using
the moment magnifier method to predict wall
strength under all these modes of loading would also
be investigated.
10. Summary
The following conclusions can be drawn from this
investigation:
10.1. Conclusions from Test Results
(1) Transverse strength of masonry walls is
reasonably predicted by evaluating the cross-sec-
tional capacity and reducing that capacity to account
for the added moment caused by wall deflection.
The general trend of the test results is in good agree-^
ment with theory, and the magnitude of individual
test results is conservatively predicted.
(2) Cross-sectional moment capacity of wall
panels was conservatively predicted by a theoretical
interaction curve which was based on compressive
prism strength and linear strain gradients.
(3) Slenderness effects, computed by the momentmagnifier method as modified to account for section
cracking, predicted closely the slenderness effects
observed in the 4-in thick brick walls, and
reasonably predicted these effects for concrete
masonry walls, concrete block cavity walls, and
brick and block cavity walls.
(4) The qualitative observation was made that at
large eccentricities, the flexural compressive
strength of masonry exceeds the compressive
strength developed in pure one-dimensional com-
pression by a significant margin, and that flexural
compressive strength increases with increasing
strain gradients.
(5) The transverse strength of cavity walls was
conservatively predicted by assuming that each
wythe carries its proportional share of vertical loads
and moments, and that transverse loads, but not
shear forces parallel to the plane of the wall, are
transmitted by the ties.
(6) The transverse strength of composite brick
and block walls was approximately predicted by as-
suming that the walls act monolithically.
(7) Whenever walls did not fail by stability-in-
duced compression failure, their axial compressive
strength was reasonably predicted by prism tests. In
the case of concrete masonry with high-bond mortar,
compressive tests with prisms capped with high
strength plaster overestimated wall strength, while
prisms set on fiberboard showed good correlation
with wall strength.
(8) Flexural tensile strength of all the wall panels
tested equaled or exceeded 1/2 of the flexural
strength as determined by prism tests.
10.2. Comparison ofTest Results with
Existing Design Practice
(1) The ANSI American Standard Building CodeRequirements for Masonry do not take into account
slenderness and end-conditions and compensate for
variability in wall strengths by high margins of
safety.
(2) The design equations in the 1969 SCPI Stan-
dard account for end conditions as well as slen-
derness. The equations were developed on the basis
of eccentric vertical load tests but also provide for
the case of transverse loading.
(3) The NCMA and ACI recommendations con-
sider slenderness but not end conditions. TheNCMA equations probably overestimate wall
strength under transverse loading conditions.
(4) The interaction diagrams for ultimate trans-
verse strength as a function of lateral loads.
67
developed by SCPI and NCMA were scaled dowii
radially to determine allowable working load. This
scaling down in some cases results in extremely low
factors of safety in bending, while the factor of safety
under vertical loads is very high.
(5) Neither the NCMA nor the SCPI standard pro-
vide for the design of composite (brick and block)
walls. This type of construction is widely used.
(6) While existing design standards are primarily
intended for the case of eccentric vertical loads, and
in most cases do not account for end conditions, the
moment magnifier method, if used for the prediction
of transverse wall strength, could cover both the
case of eccentric vertical loading and the case of
transverse loading and could also account for end
conditions.
11. Acknowledgment
The contribution of the following persons is
acknowledged:
Louis E. Cattaneo, Research Engineer, was in
charge of the laboratory testing program.
Dallas G. Grenley, Research Associate from The
Dow Chemical Company, at the National Bureau of
Standards, 1966-67, was in charge of construction
and testing of the high bond mortar specimens.
Frank A. Rankin, was the Mason Contractor in
charge of construction of the specimens.
Timothy Miles, Jr. and Harvey M. Shirley, Labora-
tory Technicians, assisted in the preparation of
specimens for testing.
James W. Raines, was the Electronic Technician
in charge of instrumentation.
Edward O. Pfrang, Chief of the Structures Sec-
tion, participated in the analysis of test results and
made many contributions to this report.
John E. Breen, Professor of Civil Engineering, at
the University of Texas, critically reviewed this re-
port and contributed to the analysis of test results.
12. References
[ 1] Standard Methods of Sampling and Testing of Brick, ASTMDesignation C67-66 (1966).
[2] Tentative Methods of Sampling and Testing Concrete
Masonry Units, ASTM Designation C140-65 (1965).
[3] Standard Specifications for Mortar for Unit Masonry, ASTMDesignation C270-68 (1968).
[4] Tentative Specifications for Aggregate for Masonry Mortar,
ASTM Designation C144-66T (1966).
[5] American National Standards Institute, American Standard
Building Code Requirements for Masonry (National Bu-
reau of Standards, 1953).
[6] Standard Method of Test for Bond Strength of Mortar to'
Masonry Units, ASTM Designation E149-66 (1966).
[7] McGregor, J. G., Breen, J. E., Pfrang, E. O., Design of;
Slender Concrete Columns, Journal of the American|
Concrete Institute, V. 67, No. 1, pp. 6-28 (January 1970). \
[8] Column Research Council, Guide to Design Criteria for'
Metal Compression Members (John Wiley and Sons, Inc.,
New York, 1966).;
[9] Structural Clay Products Institute, Building Code Require-
ments for Engineered Brick Masonry (August 1969).
[10] Natiorial Concrete Masonry Association, Specification for
the Design and Construction of Load-Bearing Concrete
Masonry (1968).
[11] American Concrete Institute, Committee 531, Concrete
Masonry Structures — Design and Construction, Journal
of the American Concrete Institute, V. 67, No. 5, pp. 380-
403, (May 1970), and V. 67, No. 6, pp. 442-460, (June 1970).
68
Latest developments in the subject area of this publication, as well as
in other areas where the National Bureau of Standards is active, are
reported in the NBS Technical News Bulletin. See following page.
U. S. GOVERNMENT PRINTING OFFICE : 1971 OL - 410-021
HOW TO KEEP ABREAST OF NBS ACTIVITIES
Your purchase of this publication indicates an interest in the research,
development, technology, or service activities of the National Bureau of
Standards.
The best source of current awareness in your specific area, as well as in
other IMBS programs of possible interest, is the TECHNICAL NEWS BULLETIN,
a monthly magazine designed for engineers, chemists, physicists, research
and product development managers, librarians, and company executives.
If you do not now receive the TECHNICAL NEWS BULLETIN and would like to
subscribe, and/or to review some recent issues, please fill out and return the
form below.
Mail to: Office of Technical Information and Publications
National Bureau of Standards
Washington, D. C. 20234
Name
Affiliation
Address
City State Zip
I I
Please send complimentary past issues of the Technical News Bulletin.
I I
Please enter my 1-yr subscription. Enclosed is my check or moneyorder for $3.00 (additional $1.00 for foreign mailing).
Check is made payable to: SUPERINTENDENT OF DOCUMENTSBSS 34
Announcement of New Publications in
Building Science Series
Superintendent of Documents,
Government Printing Office,
Washington, D. C. 20402
Dear Sir:
Please add my name to the announcement list of new publications to be issued
in the series: National Bureau of Standards Building Science Series.
Name
Company
Address
City State Zip Code
(Notification key N-339)
.5
I

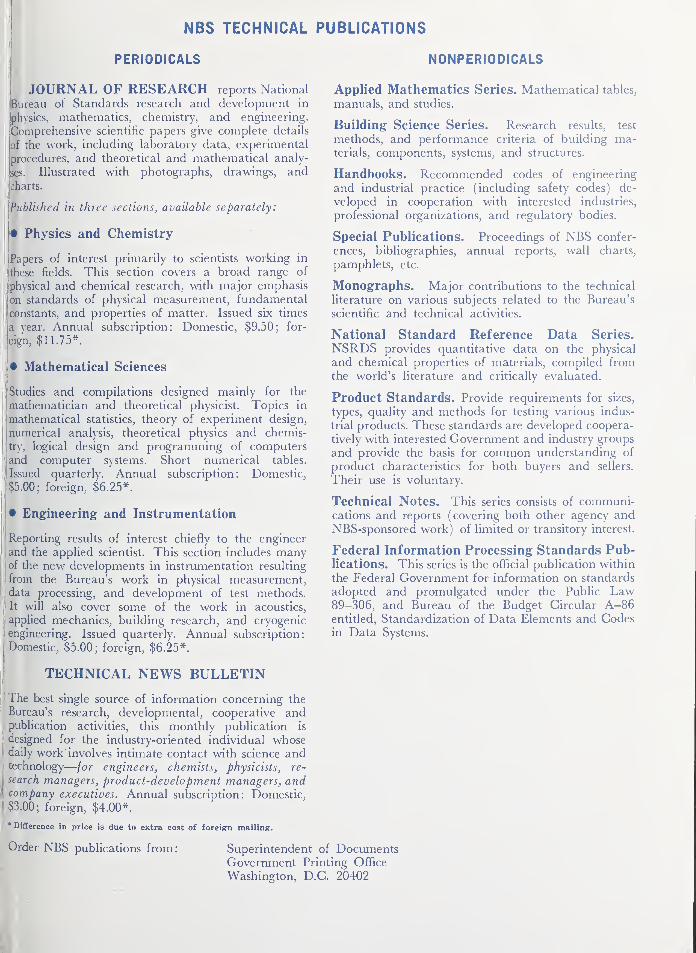
NBS TECHNICAL PUBLICATIONS
PERIODICALS NONPERIODICALS
JOURNAL OF RESEARCH reports National
Bureau of Standards research and development in
physics, mathematics, chemistry, and engineering.
Comprehensive scientific papers give complete details
of the work, including laboratory data, experimental
procedures, and theoretical and mathematical analy-
ses. Illustrated with photographs, drawings, andcharts.
Published in three sections, available separately:
• Physics and Chemistry
Papers of interest primarily to scientists working in
these fields. This section covers a broad range of
physical and chemical research, with major emphasis
on standards of physical measurement, fundamental
constants, and properties of matter. Issued six times
a year. Annual subscription: Domestic, $9.50; for-
eign, $11.75*.
• Mathematical Sciences
Studies and compilations designed mainly for the
mathematician and theoretical physicist. Topics in
jmathematical statistics, theory of experiment design,
j numerical analysis, theoretical physics and chemis-
|try, logical design and programming of computersand computer systems. Short numerical tables.
Issued quarterly. Annual subscription: Domestic,
$5.00; foreign, $6.25*.
• Engineering and Instrumentation
I
Reporting results of interest chiefly to the engineer
land the applied scientist. This section includes manyj
of the new developments in instrumentation resulting
from the Bureau's work in physical measurement,
I
data processing, and development of test methods,
ii It will also cover some of the work in acoustics,
li applied mechanics, building research, and cryogenic
I engineering. Issued quarterly. Annual subscription:
!
Domestic, $5.00; foreign, $6.25*.
TECHNICAL NEWS BULLETIN
The best single source of information concerning the
Bureau's research, developmental, cooperative and;publication activities, this monthly publication is
:
designed for the industry-oriented individual whosedaily work involves intimate contact with science andtechnology
—
for engineers, chemists, physicists, re-
jsearch managers, product-development managers, and
\company executives. Annual subscription : Domestic,
$3.00; foreign, $4.00*.
Difference in price is due to extra cost of foreign mailing.
Applied Mathematics Series. Mathematical tables,
manuals, and studies.
Building Science Series. Research results, test
methods, and performance criteria of building ma-terials, components, systems, and structures.
Handbooks. Recommended codes of engineering
and industrial practice (including safety codes) de-
veloped in cooperation with interested industries,
professional organizations, and regulatory bodies.
Special Publications. Proceedings of NBS confer-
ences, bibliographies, annual reports, wall charts,
pamphlets, etc.
Monographs. Major contributions to the technical
literature on various subjects related to the Bureau's
scientific and technical activities.
National Standard Reference Data Series.
NSRDS provides quantitative data on the physical
and chemical properties of materials, compiled fromthe world's literature and critically evaluated.
Product Standards. Provide requirements for sizes,
types, quality and methods for testing various indus-
trial products. These standards are developed coopera-
tively with interested Government and industry groups
and provide the basis for common understanding of
product characteristics for both buyers and sellers.
Their use is voluntary.
Technical Notes. This series consists of communi-cations and reports (covering both other agency andNBS-sponsored work) of limited or transitory interest.
Federal Information Processing Standards Pub-lications. This series is the official publication within
the Federal Government for information on standards
adopted and promulgated under the Public Law89-306, and Bureau of the Budget Circular A-86entitled, Standardization of Data Elements and Codesin Data Systems.
Order NBS publications from: Superintendent of DocumentsGovernment Printing Office
Washington, D.C. 20402
U.S. DEPARTMENT OF COMMERCEWashington, D.C. 20230
OFFICIAL BUSINESS
Penalty for Private Use, $300
i
POSTAGE AND FEES PAIl
U.S. DEPARTMENT OF COMMERCI