Embed Size (px)
DESCRIPTION
Bending and thrust
Citation preview

,
STRENGTH OF COLm.lN3 ID'rDER COMBIN1~D BEr:IDING AND lrHRUs1r:
by
Robert L. Ketter
c. E. 213
Structural Research
AUgust 31,. 1951
•
•
I.
II.
III.
IV.
V.
VI.
VII.
VIII.
Table of Contents
Introduction
The Interaction Curve Concept
Derivation of Interaction Curves
Comparison with Existing Specifications
Experimental Investigation
Discussion of Test Results and Summary.
Acknowledgements
Bibliography
page
1
2
7
26
28
39
45
45
Appendix
B. . Properties of Sections Investigated•
•
A. Nomenclature 47
50
. ,."
,.
-1-
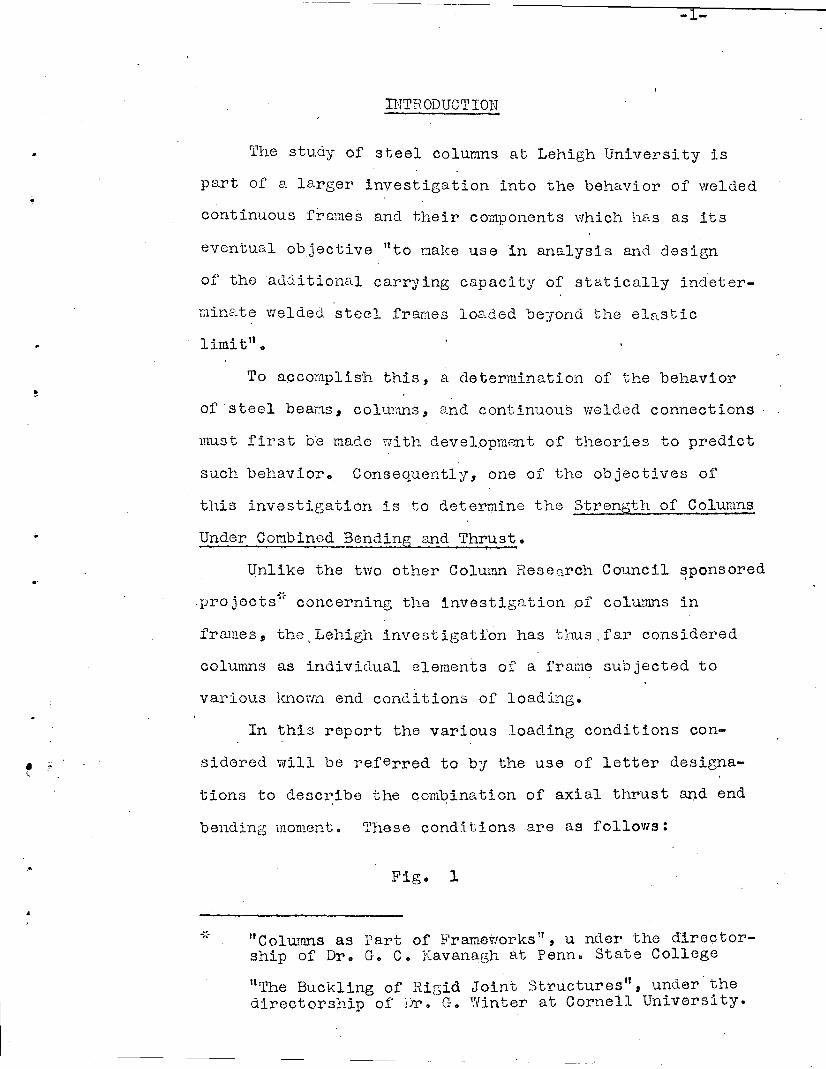
INTRODUCTION.
rEhe study of steel columns at Lehigh Universi ty is
part of a larger investigation into the behavior of welded
continuous frames and their components which hE!.S as its
eventual objective "to nake use 'in analysis and design
of' the additional carrying capacity of statically indeter-
minate welded steel franles loaded beyond the el~stic
limit".
To accon~lish this, a determination of the behavior
of 'steel beaI:lS, columns, and continuous vlelded connections
must first be made with devel,opmen t of theories to predict
such behavior. Consequently, one of the objectives of
this investigation is to determine the Str>ength of Columns
Under Combined Bending and Thrust.
Unlike the two other Column Research Council sponsoredI
pro jects·;;· concerning the investige,tion of columns in
frames, the" Lehigh invest igati'on has thus. far considered
C01UTIlnS as individual elements of a frame subjected to
various lcnoym end coneli tions of loading.
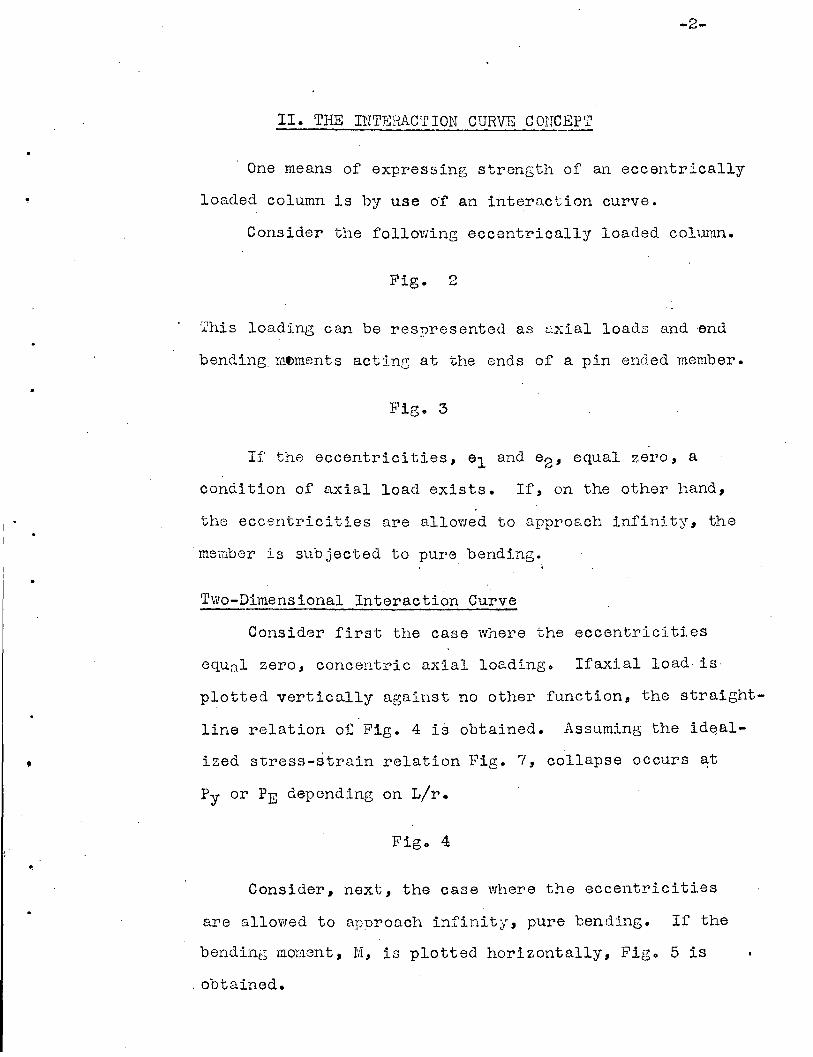
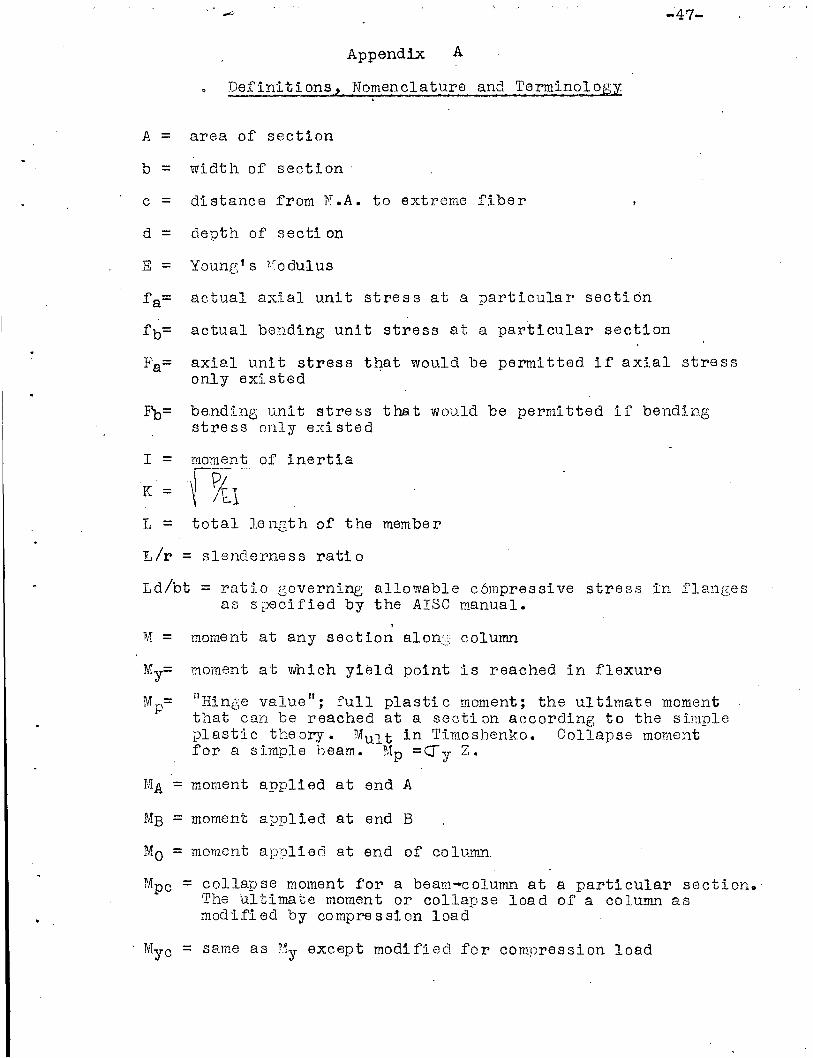
In this report the various loading conditions con-
sidered will be referred to by the use of letter designa
tions to describe the combination of axial thrust and end. '
bending moment. These conditions are as follows:
Fig. 1
"Columns as Part of F'ramevlorks lf, u neler the director
ship of Dr. Go C. Kavanagh at Penno State College
liThe Buckling of Rigid Joint Structures", under'thedirectorship of Dr. Go Winter at Cornell University.
.
•
-2-
II. THE IU'rEHACrrION CURVE COHCEprr
One means of expressing strength of an eccentrically
loaded column is by use 0'1' an interaction curve •
Consider the folloYling eccentrically loaded column.
Fig. 2
This loading can be respresented as e.xial loads and 'end
bending mfnnents acting at the ends of a pin ended member.
Fig. 3
Ii' the eccentricities, e1 and e2' equal Z.ero, a
condi tion of [L"'\:ial load exists. If, on the other hand,
the eccentricities are alloYled to approach infinity, the
member is SUbjected to pure bending.
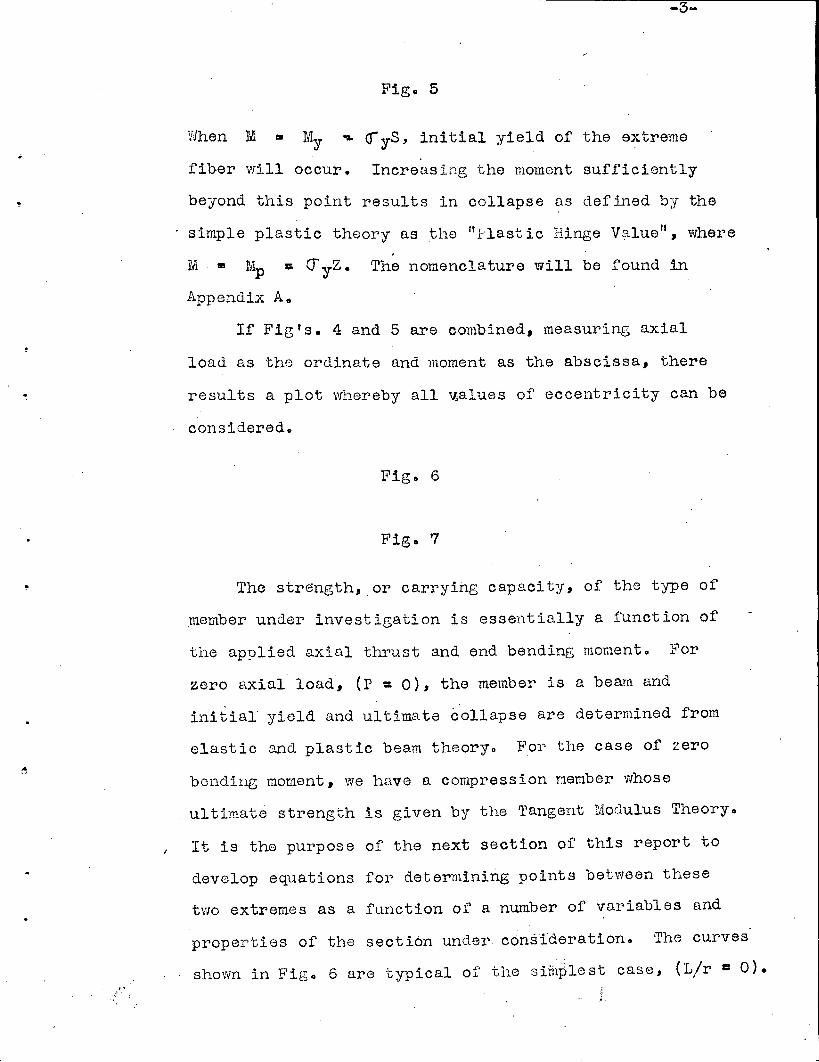
Two-Dimensional Interaction Curve
Consider first the ca.se where the eccentricities
equn.l zero" concentric axial loading. Ifaxial load· is
plotted vertically against no other function, the straight
line relation of Fig. 4 i~ obtained. Assuming the id~a.l
ized stress-strain relation Pig. '7, collapse occurs at
Py or PE depending on L/r.
Fig. 4
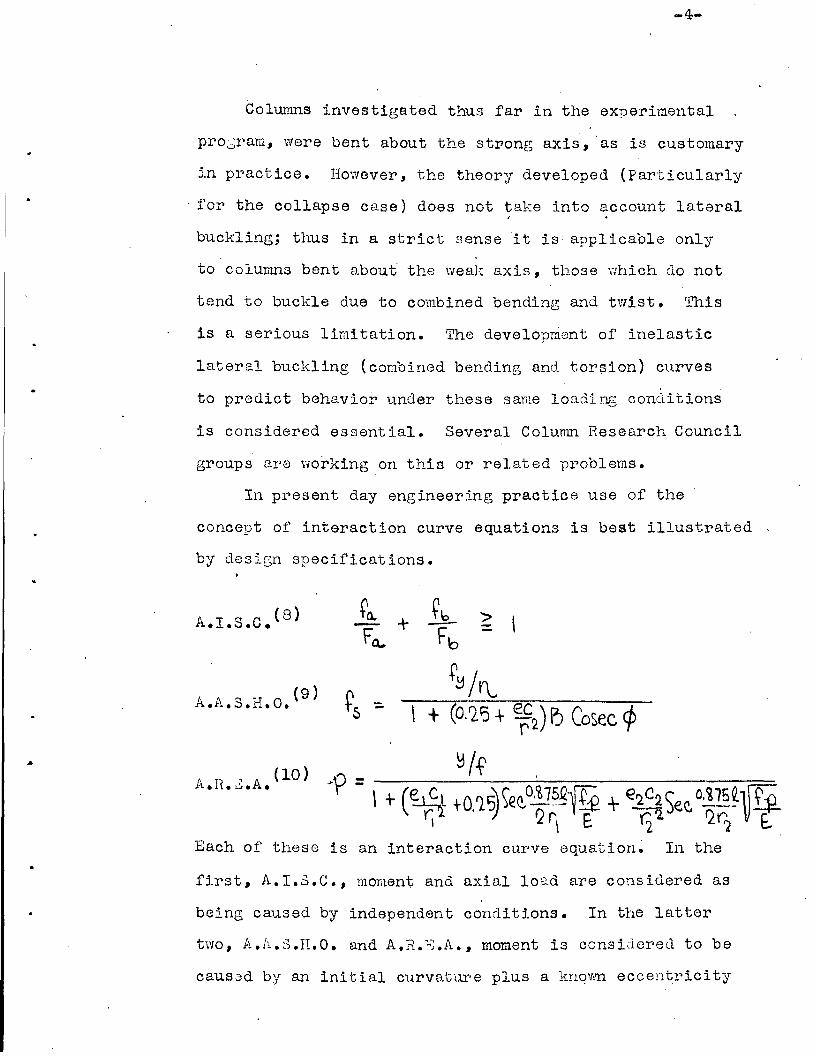
Consider, next, the case ~lere the eccentricities
are allowed to approach infinity, pure bending. If the
bending moment, M, is plotted horizontally, Fig. 5 is
. obtained.
-3-
Figo 5
When M III My "'" <r yS, initial yield of the extreme
fiber will occur. Increasing the moment sufficiently
beyond this point results in collapse as defined by the
simple plastic theory as the "J:lastic Hinge Value", where
IiI III Mp r:: (J' yZ. The nomenclature will be found in
Appendix A.
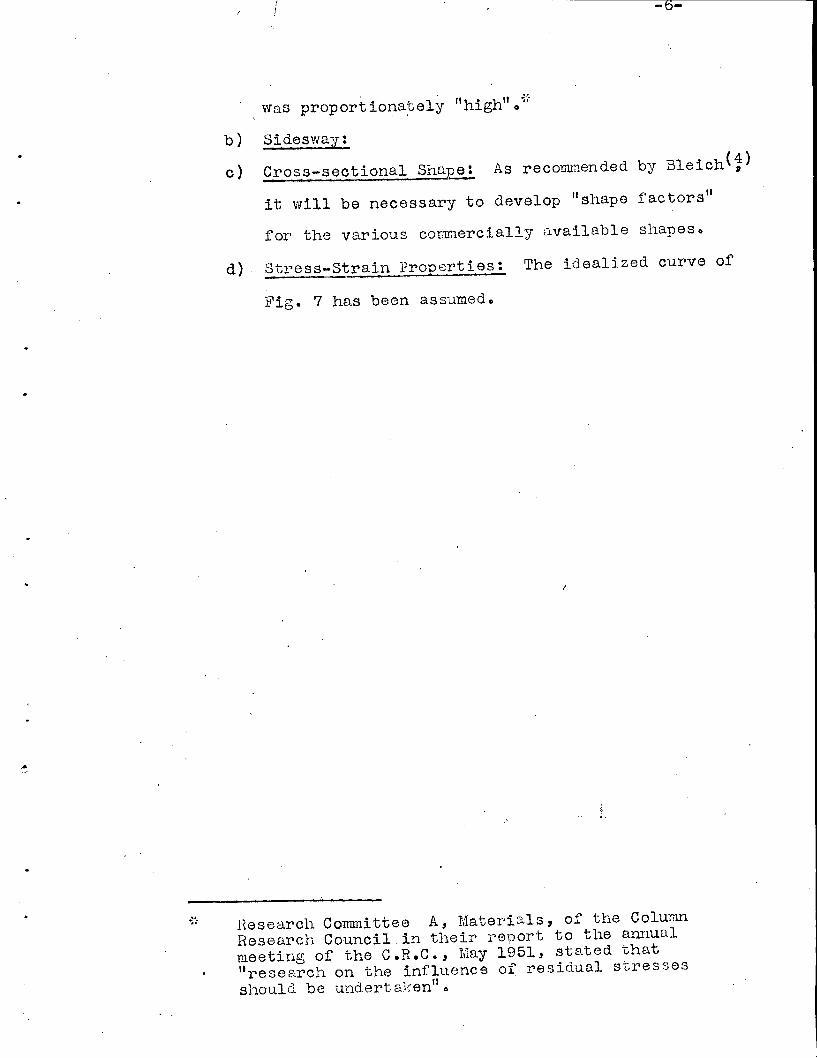
If Fig's. 4 and 5 are combined, measuring axial
load as tho ordinate and moment as the abscissa, there
results a plot vnlereby all ~alues of eccentricity can be
considered.
Fig. 6
Fig. 7
The strength, or carrying capacity, of the type of
member under investigation is essentially a function of
the applied axial thrust and end bending moment. For
zero axial load', (p : 0), the member is a beam and
initial yield and ultimate collapse are determined from
elastic and plastic beam theory. For the case of zero
bendir~ moment, we have a compression nember whose
. ultimate strength is given by the Tangent Modulus Theory.
It is the purpose of the next section of this report to
develop equations for determining points beh"een these
two extremes as a function of a number of variables and
properties of the section under consideration. The curves
shown in Fig. 6 are typical of the siniplest case, (L/r I: 0) •
.. .
-4-
Columns investigated thus far in the experimental
pro::;ram, were bent about the stFong axis, 'as is customary
in practice. However, the theory developed (particularly
for the collapse case) does not ~ake into ~ccount lateral
buckling; thus in a strict sense it is' applicable only
to columns bent about' the weal\: axis, those Vlhich do not
tend to buckle due to combined bending and twist. This
is a serious limitation. The development of inelastic
lateral buckling (combined bending and tor~ion) curves
to predict behavior under these same loading conditions
is considered essential. Several Colu~n Research Council
groups ar'e working on this or related problems.
In present day engineering practice use of the
concept of interaction curve equations is best illustrated
by desiGn specifications.
..
(8)A.I.S.C •
. ~ ,.., -H 0 (9)A.l-•• ::J •••
A.R.S.A. (10)
Each of these is an interaction curve equation~ In the
first, A. I..3.C., moment and axial lO~ld are considered as
being caused by independent conditlons. In the latter
two, A.A.S.H.O. and A.?..~<;.A., moment is considered to be
caus3d by an initial curvature plus a known eccentricity

- 5-
of loading mUltiplied by the axial load, Po These
equations will be discussed more in detail in later'
sections of this report.
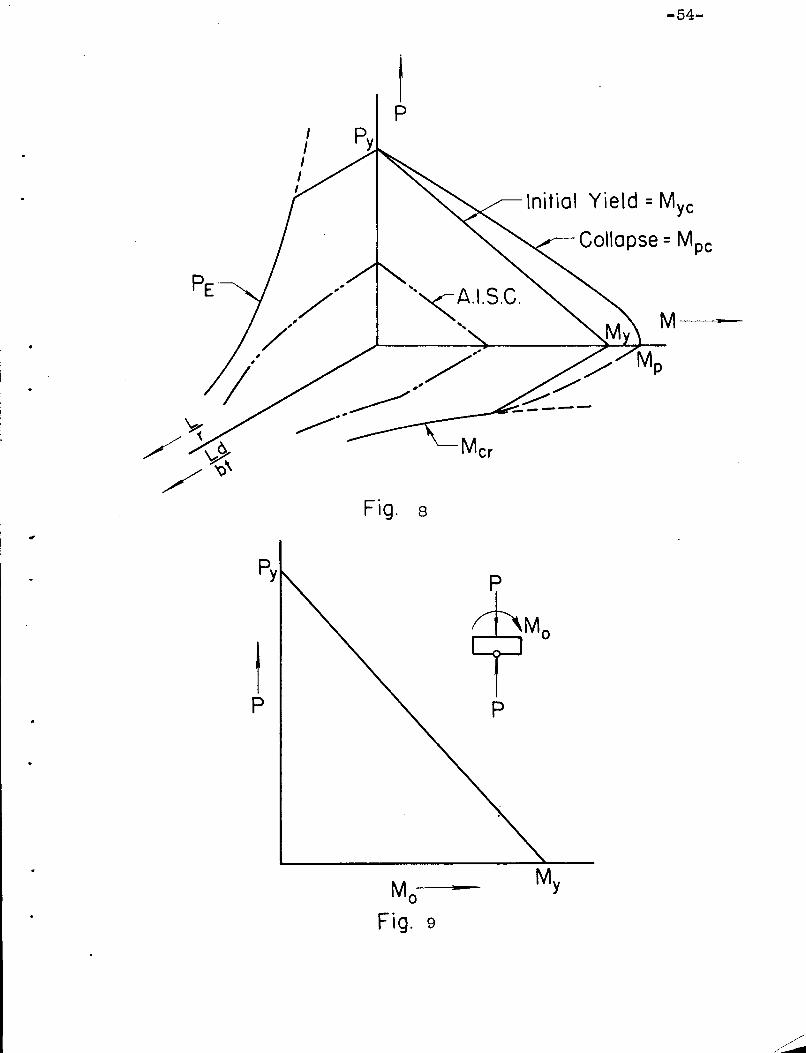
The interaction curve previously defined may. be
expanded to include another important variable, length.
Fig. 8
If the z-coordinate axis is added, upon which are
plotted functions of length (for illustration plot
L/r as the abscissa in the (length)-axial load plane,.
and Ld/bt as the abscissa in the (length)-moment plane),
then for anyone rolled shape under a particl.l,lar loading
condition, the surface in space describes the carrying
capaCity of the colump. (Since the "Ld/bt Tl formula was
developed for uniformly-loaded, simply supported beams,
it is not completely justified to (<lake the comparison
indi.catedo However , it serves to illustrate the idea.
Test condition lIe" approaches this case.)
Other Influencing Factors
In addition to later~l buckling, some of the other
factors that ·wil·l influence the results but which have
not been considered in this paper are:
a) Residual Stress: At higher axial loads this
may be a serious problem. Already in the ex-
perimental program it has been found that the
initial yield value predicted by small coup~n
.tests has not been reached when the axial load
-b-
was proportiona~e1y "high" o~:-
b) Sidesway:
c) Cross-sectional Shape: As recommended by Bleich(1)
it will be necessary to develop "shape factors"
for the various cOTI~ercially available shapes.
d) Stress-Strain Properties: The idealized curve of
Fig. 7 has been assumed.
..
Hesearch Conrrnittee A, Materials, of the ColunmResearch Council.in their report to the annualmeeting of the C.R.C., May 1951, stated that"research on the influence of residual stressesshould. be undert aJ\"en" •

..
-7-
III. DERIVATION OF nrTERACTION CURVE EQU.ATIONS·::-
Initial Yield Interaction Curves:
Since end moment is a more closely defined value than
maximum moment which, for some loadhlg conditions, does
not occur at the end of the column; the moment applied
at the end of the member has been chosen as the inter-
action curve abscissa. As a consequence of this choice of
coordinates, a linear relationship between the axinl load,
P I and the Gnd lUomGn:t, MOl will not always exist because
yielding will OCCUI' at the point of maximum moment ..
As a staring point, consider a ~ery short membGr fo I'
which L/r approaches zero. Yielding will occur vn~en
.E- + MmQK. ( )cr~ = f\ S - --------------- 1
But since L approaches zero, Mo~ the mornept at the end,;.
will equal IYIznax. Therefore,
-~~~-----------(2)
Note that a linear relationship' exist between,P and Mo
since all other quantities in the above expression are
constant for anyone particular cross-section.
The, interaction curve for this case is plotted in
Fig. 9.
Fig. 9
.:~ Equations similiar to those derived herein forconditions a, c, anr1 d are shown in Reference 11.
-8-
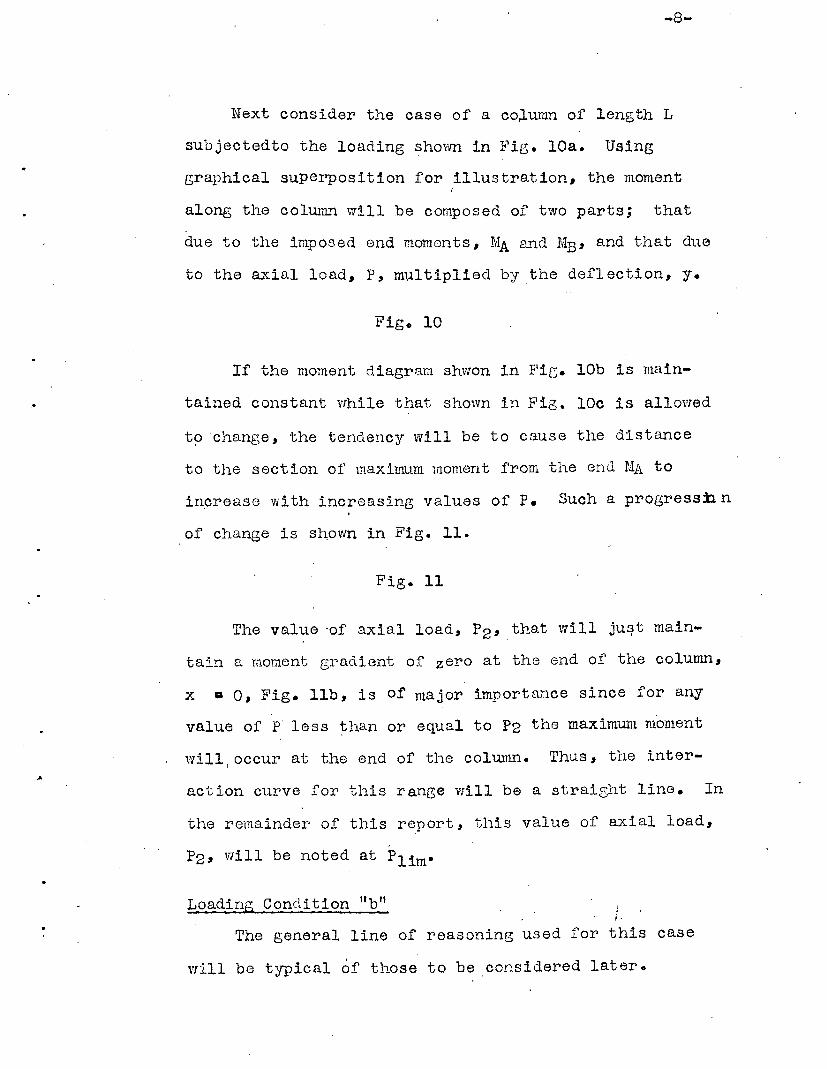
Next consider the case of a co~umn of length L
sUbjectedto the loading shown in Fig. lOa. Using
graphical superposition for illustration, the momentI
along the column will be composed of two parts; that
due to the imposed end momonts, MA and MB' and that due
to the axial load, P, multiplied by the deflection, y.
Fig. 10
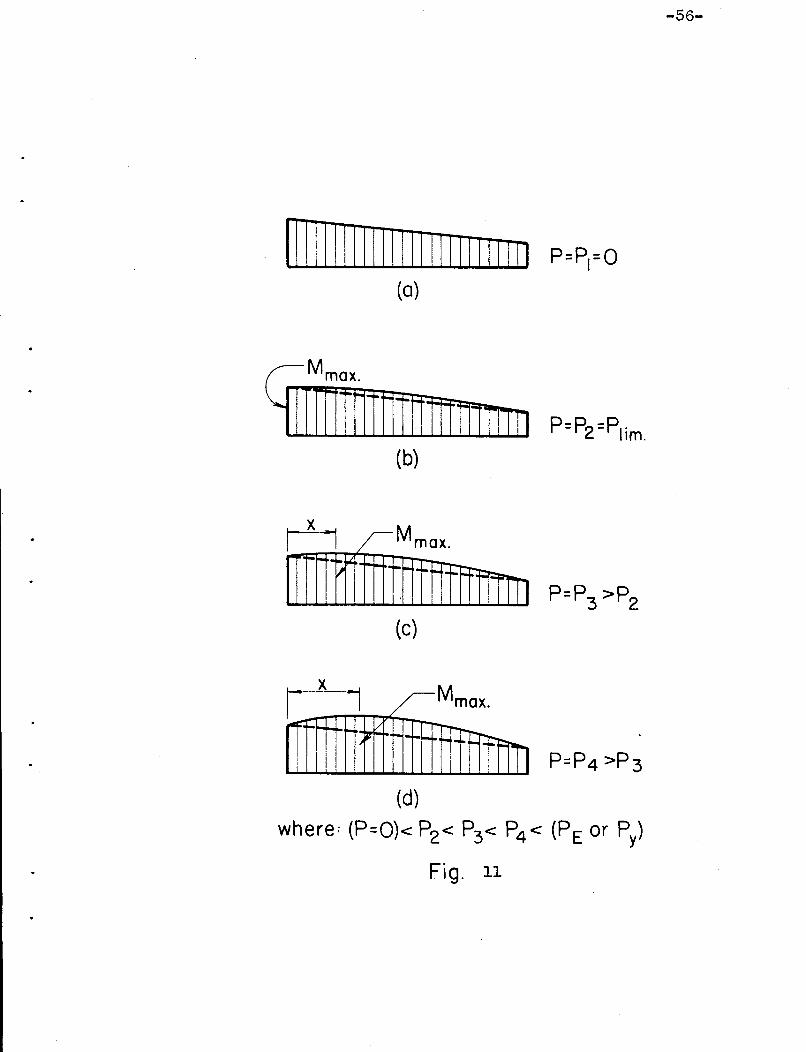
If the moment diagram shwon in PiC. lOb is main-
tained constant while that shown in Fig. 10c is allowed
t!J 'change, the terldency will be to cause the distance
to the section of maximum moment from the end lilA to
increase with increasing values of P. Such a progressbn
of change is shovm in Fig. 11.
Fig. 11
The value ·01' axial load, P2' that will ju~t main
tain a moment gradient of zero at the end of the column,
x =0, Fig. lIb, is of major importance since for any
value of p' less than or equal to P2 the maximum moment
will,occur at the end of the column. Thus, the inter-
action curve for this range will be a straight line. In
the remainder of this report, this value of axial load,
Loading Condition lib" .,~ .
The general line of reasoning used for this case
yrill be typical of those to be considered lat er.
-9-
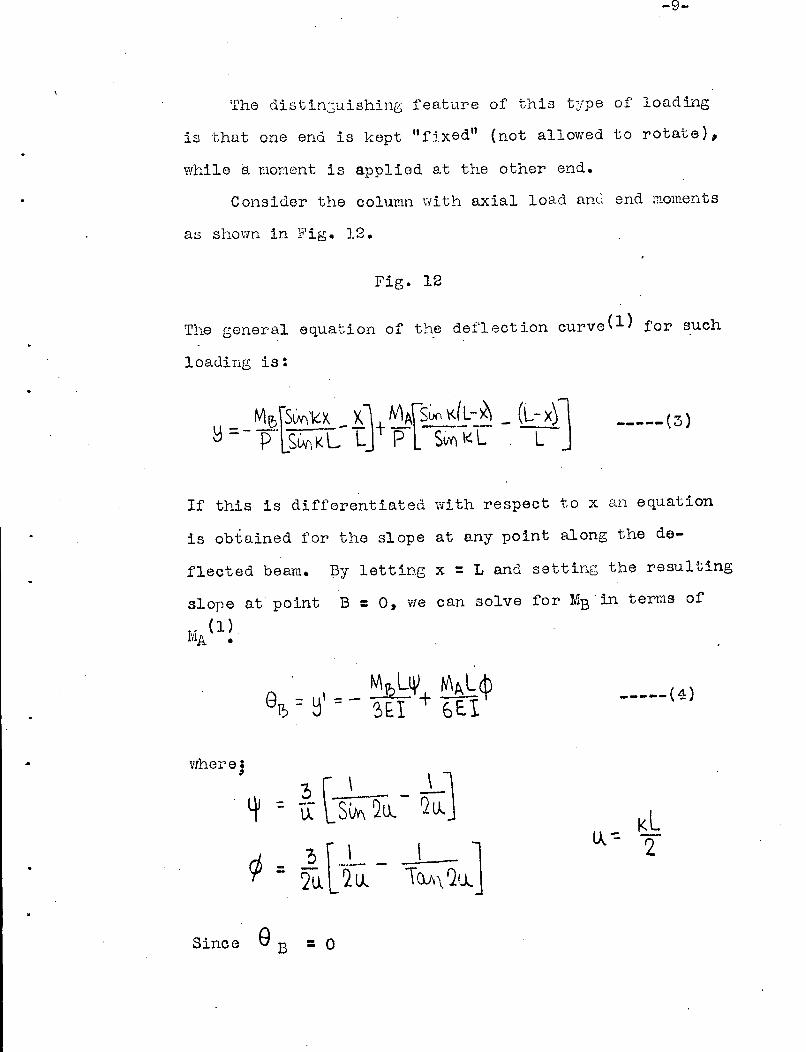
rrhe distin-::;uishing feature of this t~rpe of loading
is that one end is kept "fixedl1 (not allowed to rotate),
v1hile a l~lOr:1ent is applied at the other end.
Consider the column with axial load anei. end moments
as shown in Fig. 12.
Fig. 12
The general equation of the deflection curve(l) for such
loading is:
-----(3)
If this is differentiated Yii th respect to x an equation
is obtained for the slope at any point along the de
flected beam. By letting x =L and setting the resulting
slope at point B =0, we can solve for MB'in terms of
MA(l~
where;,b l \ - -~J
~=. tI SiM 2Ll Qu..
¢ 23ltl~- I _]= 1"Q.;\ \ '21J...
Since 9 B - 0-
-----(4)

M L M l~ III _ A ti'3E.I i - 6EI If or M -!L M
e> - 24> A
-10-
'l '=Ij
Substituting this value in the general equatt on
for deflection, an equat5_on for this pa.rticular loadin g
condition is obtained.
Differentiatine this expression for deflection, y,
twice with respect to x results in the equation for
curV$.ture along the member.
~": ~t>, ·S~ KL l-~ K(L-X) +t4! SiNI KX]
But curvature, ¢, = -~rl'herefore,
-----(5)
.'"
Since yielding occurs at; the point of maximum
moment, by differentiating the moment with respect to
x and equating to zero, it is possible to solve for
the distance to the point of maximu.In moment in terms
. 'of the applied axial load, p.
Therefo!'€) ,
or
..x=
T~-\ r-~~ -COS Kllt SCttl KL
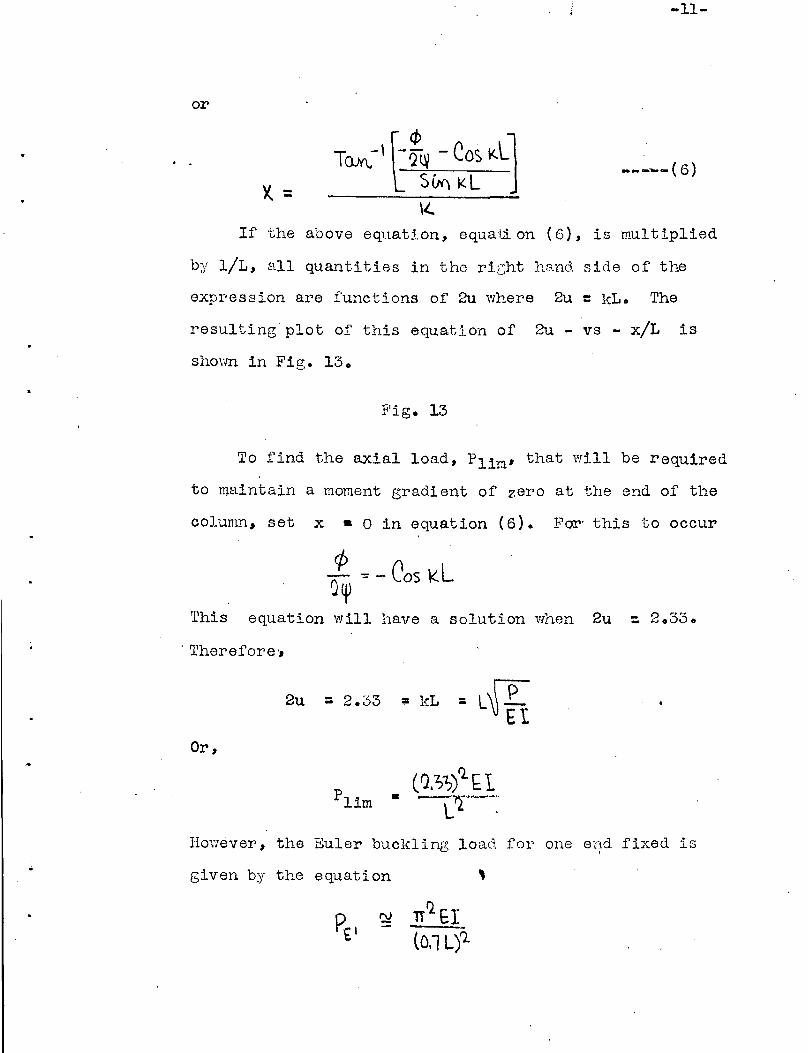
;. -11-
----- (6)
\~
If the above equation, equati on (6), is multiplied
by IlL, all quantities in the riGht hand side of the
expression are functions of 2u where 2u =leL. The
resulting plot of this equation of 2u - 'vs - x/L is
shotm in Fig. 13.
Fig. 13
To find the axial load, Pli~' that will be required
to maintain a moment gradient of zero at the end of the
column, set x • 0 in equat ion (6). POI" this to occu.r
1.. -;: - COS kLQ~
This equ.ation will have a solution when 2u : 2.33.
, Therefore-,
Or,
2u :; 2.03
•
= kL - LJ"P- ~h
However, the Euler buckling load for one el~d fixed is
given by the equation ,
-12-
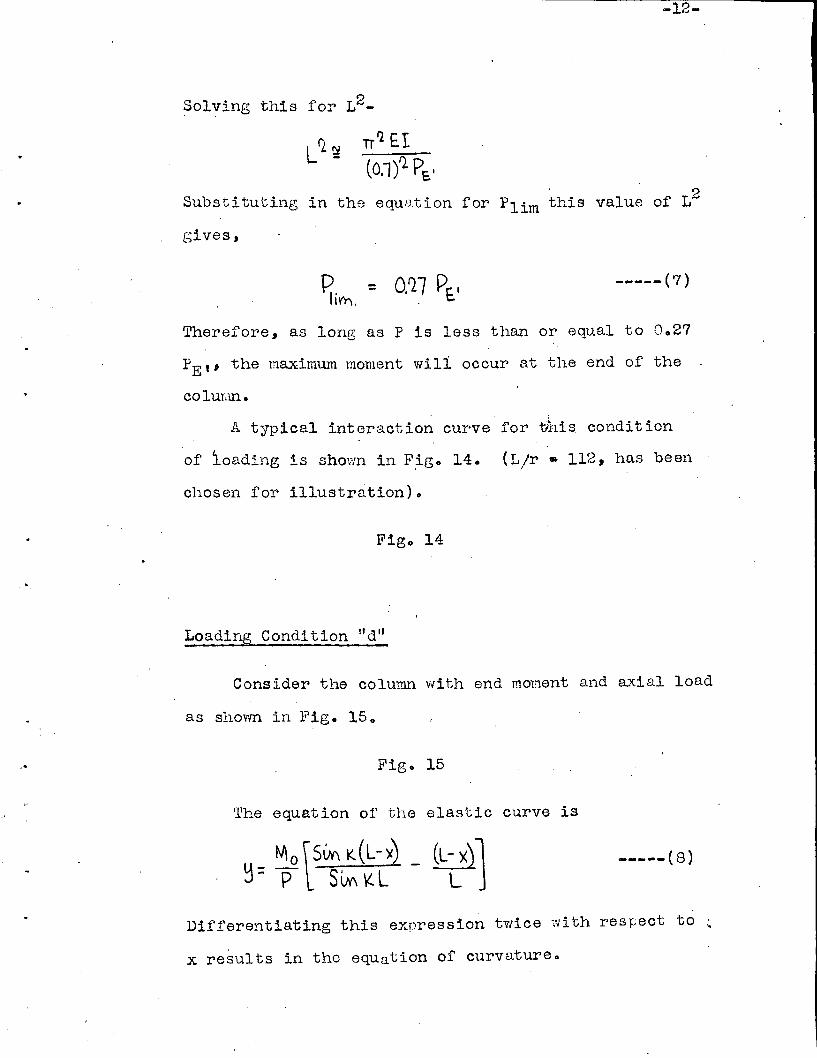
Solving this for L2_
TIllEr(0.1)'2. P~I
SUbstituting in the equation for Plim this value of L2
gives,
-----(7)
",
Therefore, as long as P is less than or equal to 0.27
PEW' the maximum moment will occur at the end of the
colufim.
A typical interaction curve for ~his condition
of loading is shown in F~g. 14. (L/r. 112, has been
chosen for illustration).
Fig. 14
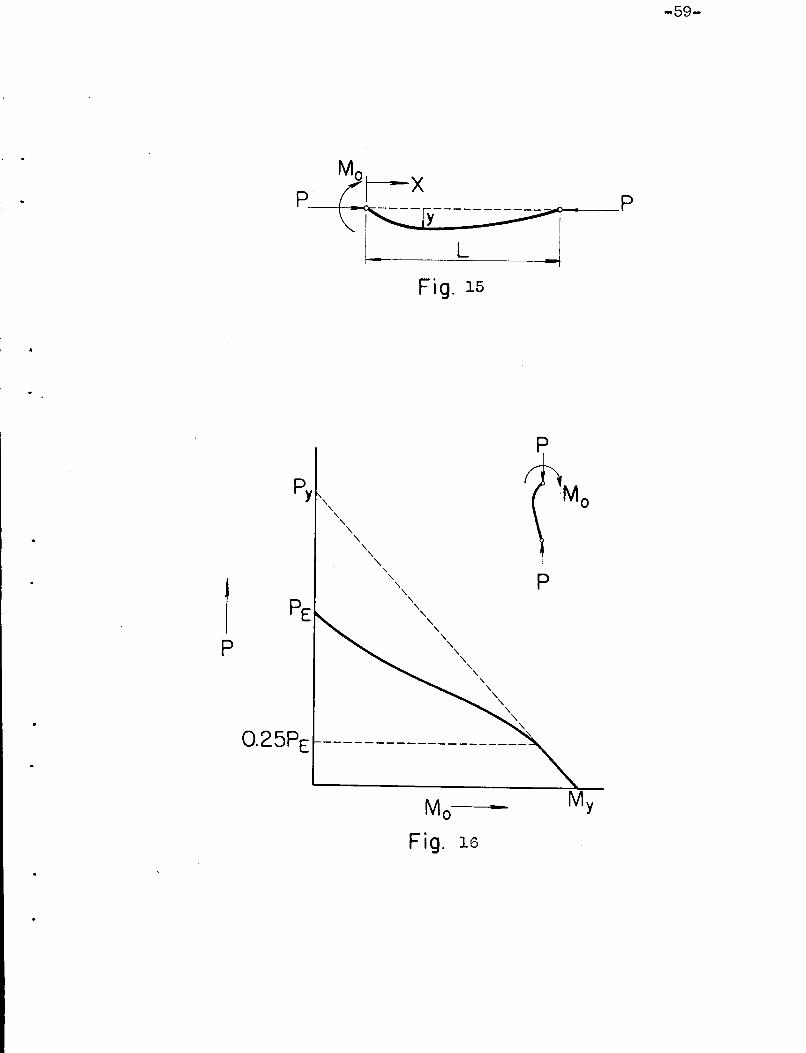
Loading Condition lid"
Consider the column with end mmnent and axial load
as shovm in Fig. 15.
Fig. 15
The equation of the elastic curve is
-----(8)
Differentiating this expression tvlice with respect to ~
x results in the equation of curvature.
",
"__ tv\O\(IJ.[)VA k(L-x)l_~ - .P SiM KL .J-
Therefore,
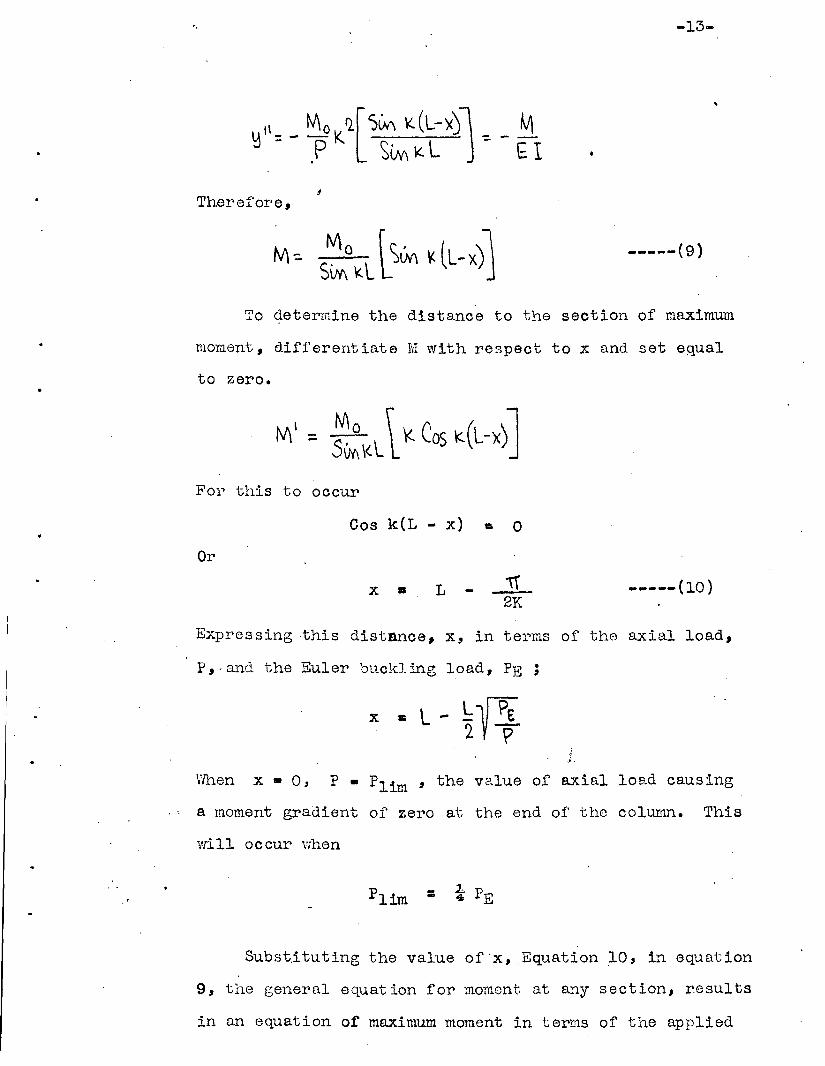
M--EI
-13-
-----(9)
To determine the distance to the section of maximum
moment, differentiate M with respect to x and set equal
to zero.
For this to occur
Cos k(L - x) c 0
Or
x • L --!L.2K
-----(10)
Expressing ,this distance. x, in terms of the axial load,
P,·illld the Euler buckling load, PE ;
.;.
Vfhen x. 0, p. Plim ' the value of axial load causing
a moment gradient of zero at the end of the column. This
vall occur vlhen
"
-- 2. P0$0 E
Subs~ituting the value of 'x, Equation ~O, in equation
9, the general equation for moment at any section, r.esults
in an equation of maximum moment in terms of the applied

-].4-
end moment and the axial load.
-----{ll)
•
Since yielding will occur at the section of maximum
moment, the initial yield interaction curve equation
is
Or
-----(12)
,A typical initial yield interaction curve for this
loading condition is shovm in Fig. 16. (L/r =112 has
been selected for illustration.)
Fig. 16
Loading Gondi tion II a lt
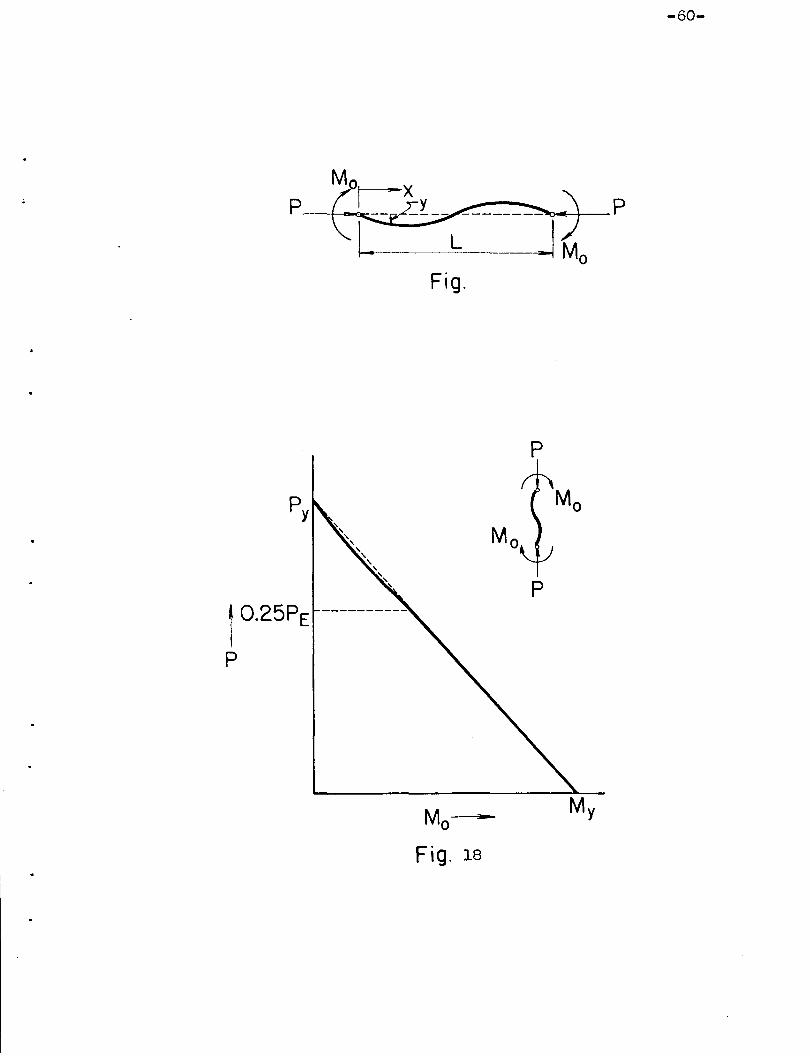
The double curvature loading condition as shown in
Fig. 17 is oftern encountered in tier buildings.
Fig. 17
'rhis condition is iJentical to condit~on "dlt with;.
iL of condition Halt equaling L of condition "d"..
Therefore,
only tho resulting equation will be given. The line of
reasoning used in solution of this problem is exactly
the same as in the previous cases.

-15-
The equation of the deflection curve is
-----(13)
Therefo,re,
-----(14)
Proceeding as before to find the distance to the section
of maximum momei1t;
L IT L _ Ll~E.1IX~2-2~~ '2. 4~P
This in t~rn deteTInines Flim-
-----(15)
Substituting the distance to the section of maximum, '
moment, x, in the general equation for moment, Equation
14, ~ives the desired interaction curve equation.
-----(16)
"
The interaction curve, (L/r • 112), for this case
is shown in Fig. 18.
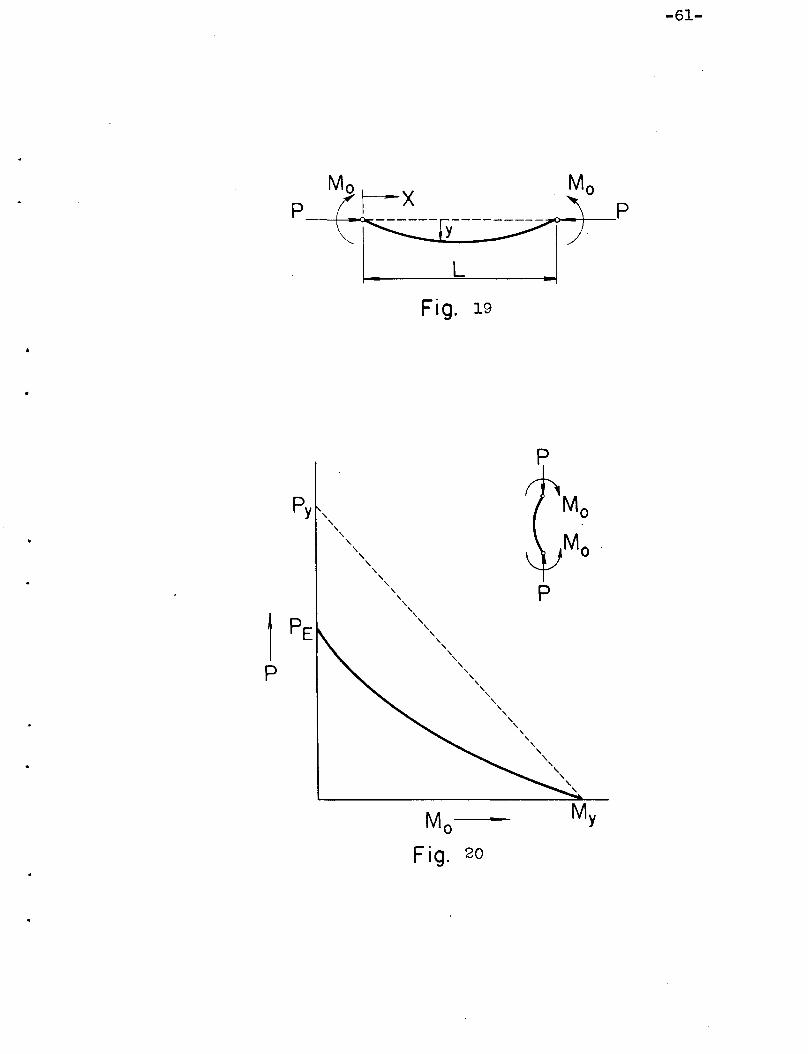
Loadin!:.!: Gondi tion II cit,~
A loading condition with moments applied at both
ends vhich impose a condition of sinsle 'curvature on a
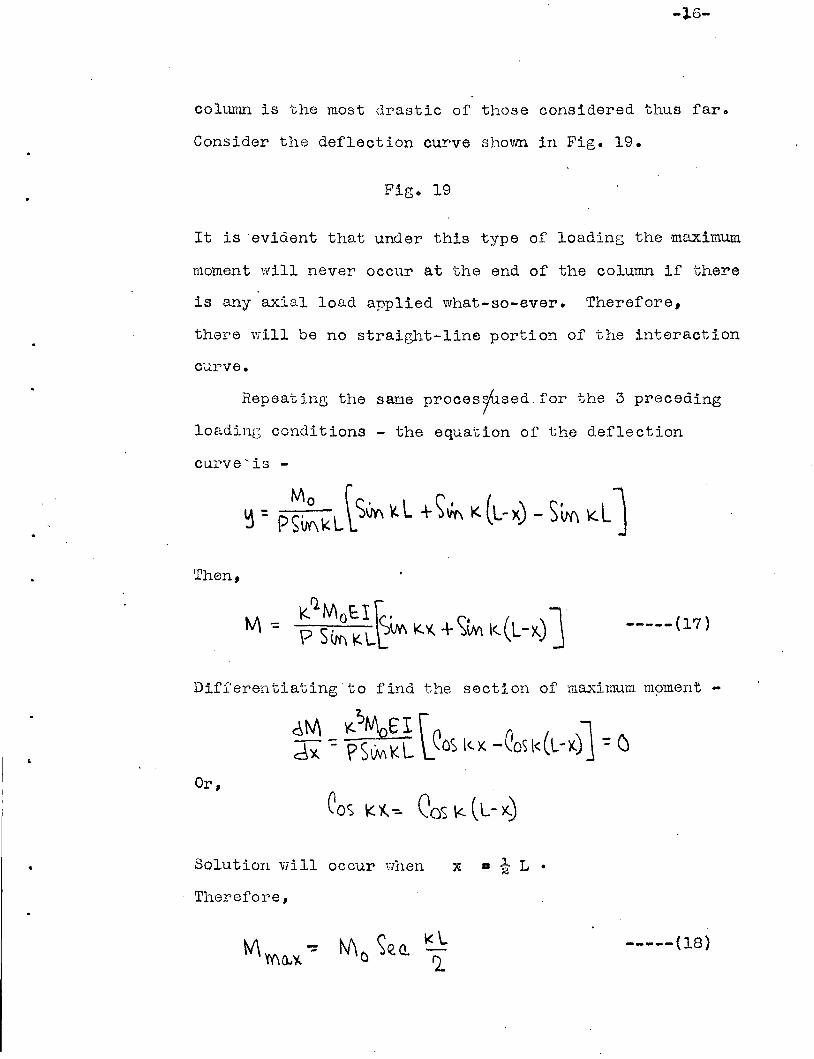
-16-
column is the most drastic of those considered thus far.
Consider the deflection curve shovm in Fig. 19.
Fig. 19
It is ·evident that under this type of' loading the maximum
moment will never occur at the end of the column if there
is any axial load applied what-so-ever. Therefore,
there ,vill be no straie;ht-line portion of the interaction
curve.
Hepeating the same procesfsed.f'or the 3 preceding
loadinG conditions - the equation of th~ deflection
curve'is -
Then,
-----(17)
Differentiating to find the section of' maximum m~)lnent
Or,
Solution Viill occur nhen x D ~ L •
Therefore,
-----(18)

-17-
;.
Substituting this into the equation for stress at a
section of maximum Tiloment will give the equation of the
initial yield interaction curve.
-----(19)
Fig. 20
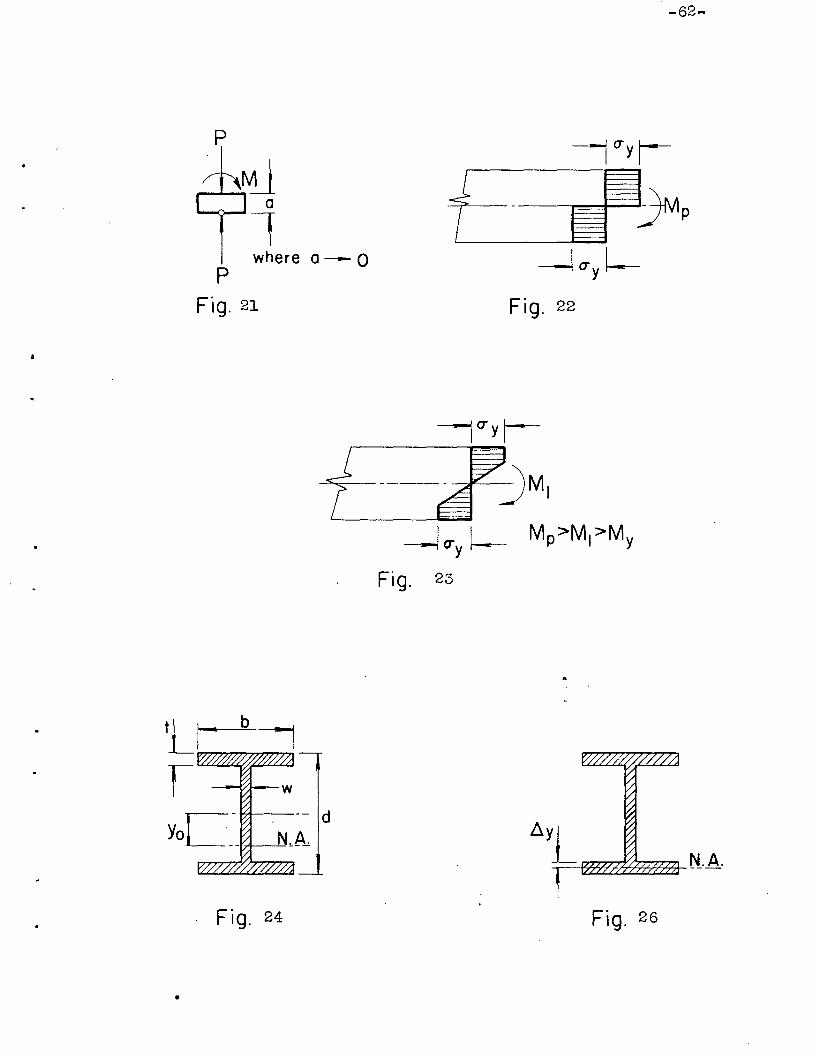
"Sinple Plastic Theory" Collapse Solution for LI..r ,. O·r.·
Since the length of the specimen unrJ.er consideratiorl.
approaches' zero, see Fig. 21, the following assumptions
a. Buckling, lateral and local, will not occur.
bo Effect of end restraint will not influeJ;lce
analysis.
c. ~ending moment caused by deflection ,is negligible
compared with that due to initial end
eccentrici ty.
Fig. 21
Consider one limit of the problem, in which the
axial load, P, is equal to zero, the ultimate moment
that could be applied to the t1colunml1 using the simple
plastic theory is
\v11.01"e Z is defi ned as the st atical mar.tont of 'the section.
A part2~1' this materia,l.: ,is reproduced from 'l:ID rk byBaker~ J and Roderick\v 2nd others.
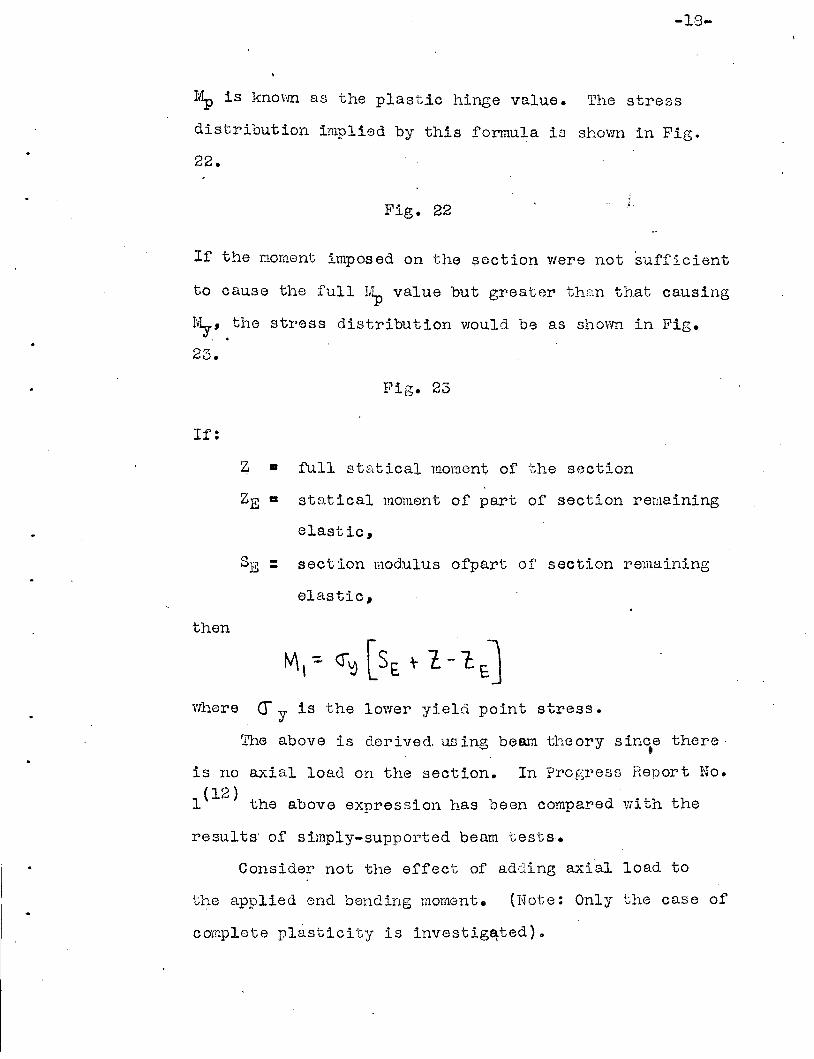
-19-
I'dp is knorm as the plastic hinge value. The stress
distribution implied by this formula is shown in Fig.
22.
Fig. 22 ,..
If the noment imposed on the section vlere not 'sufficient
to cause the full I,~ value but greater th::tn that causing
My' the stress distribution would be as shown in Fig.
23.
Fig. 23
If:
Z • full statical moment of the section
ZE a sto.tical moment of part of section remaining
elastic,
SE = section modulus ofpart of section remaining
elastic,
then
where (f y is the lower yield point stress.
rrhe above is derived. us ing beam the ory s inc.e there
is no axial load on the section. In Progress Report No.
( 12 ) ., d . th th1 the above expresslon has oeen compare Wl e
results' of simply-supported beam tests.
Consider not the effect of adding axial load to
the applied end bending mom.ent. (Note: Only the case of
cmnplete plasticity is inv0stig~ted).
..
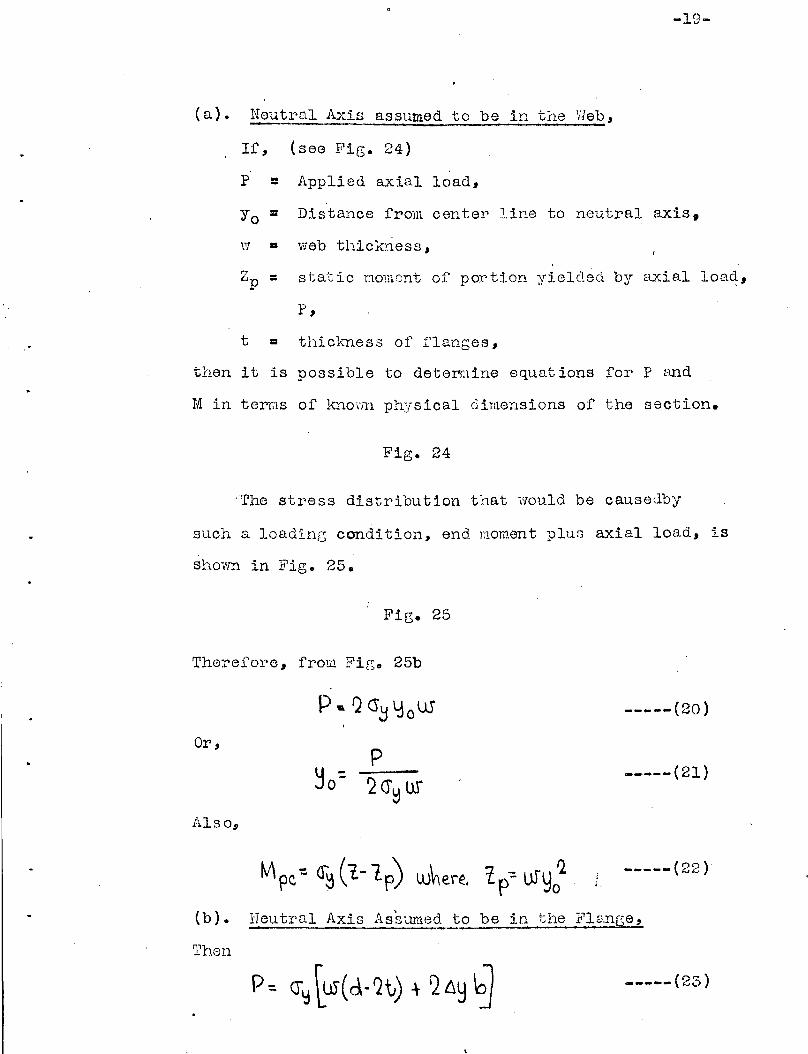
-19-
(a). Noutral Axis assumed to be in tile ':Jeb,
If, (see Fig. 24)
P = Applied axial load,
Yo = Distance from center line to neutral axis,
w • web thickriess,
Zp = static Doment of' port:ton yielded by axial load:,
P,
t III thic}mess of flanges,
then it is possible to detenline equations for P and
M in ter-ms of knorm physical dimensions of the section.
Fig. 24
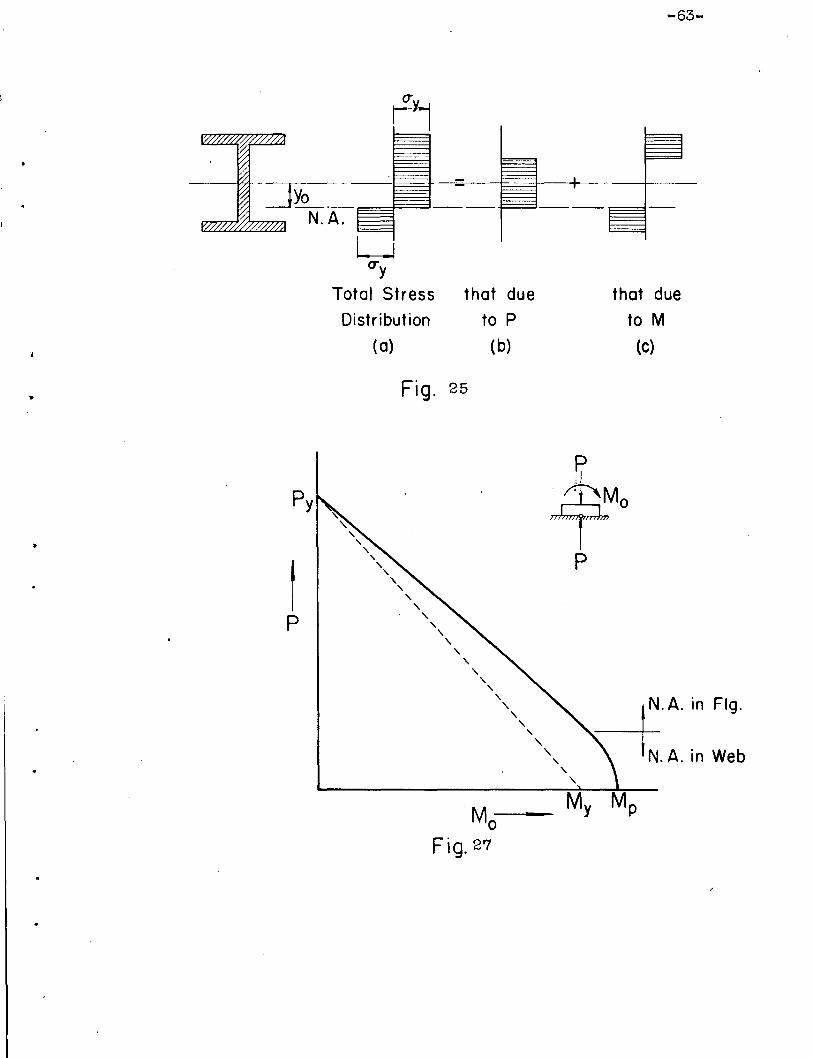
'The stress distribution that would be causedby
such a loading condition, end moment plus axial load, is
shovm in Fig. 25.
Fig. 25
Therefore, from FiBo 25b
Or,
Als 0"
p
..f.
-----(20)
-----(21)
-----(22)
(b). Neutral Axis Assumed to be in the Flange,
-----(23)
-20-
where, 6 y = dis tan~e from the inside of tlw flange
to the neutral axis, \'ihich has been assumed in the flange.
(See Jig. 26).
Fig. 26
Then,
Therefore,
•~ - US (d-2t)2'0
-----(24)
Mpr.. =b(f~ It-D~)(d- t-\- (j~) -----(25)
A typical interaction curve for this condition is
shorin in Fig. 27.
Fig. 27
It should be emphasized that this solution is only
applicable ",rhen the moment is a maximum at the end of
the colu.mn,.. Test~ of columns bent about the strong
axis sho'\7 that a "lateral bucJ:ling lt type of failure
takes place When the a.;dal load is of su.ch magni tu.de
that the moment is not a maximum at the column end ..
'l'hus, the value of extending the analysis to include
such a case appears academic unless the column is bent
about its "weak" axis.
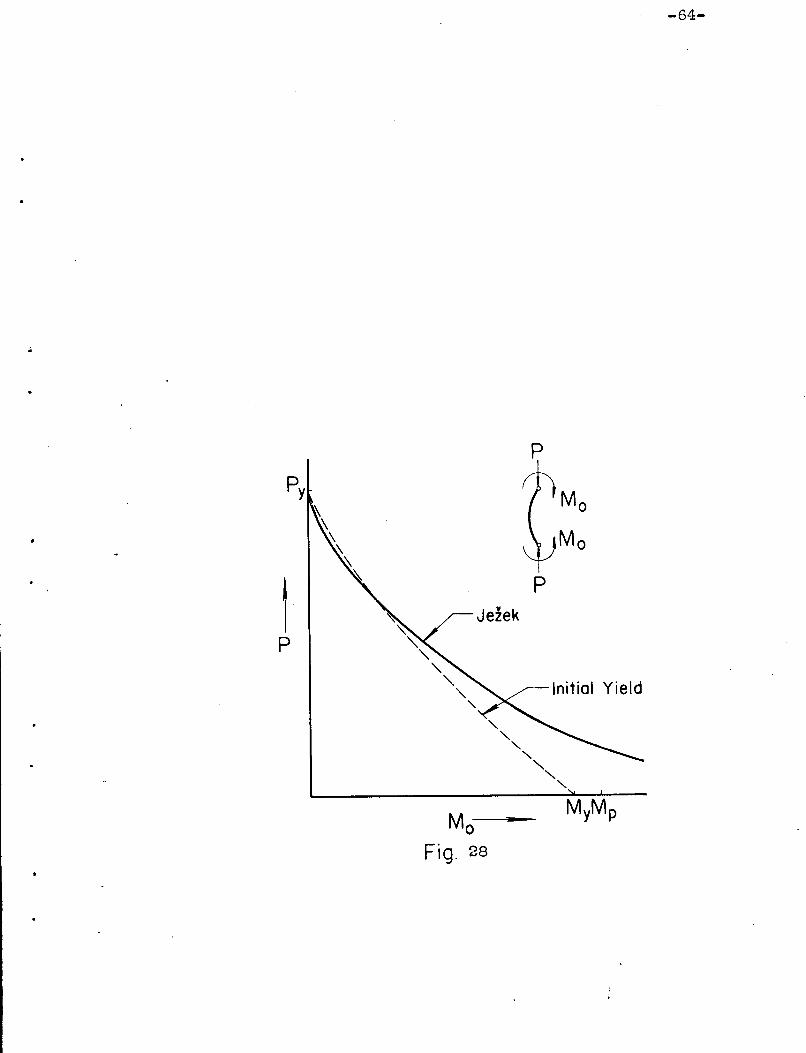
Je~ek Buckling Solution for condition~
Loading condition "c" is similar to the eccentrically
loaded column vlith equal eccentrici ties at each end ..
.,;.

Fe Ble4cl'1 (4) I" t d f 1 " for• 18 S proce ures 0 ana~ys~s
coneli tion based on the rverlc of Je~eko
-21-
this
UsinG the same notation as Bleich" \vhere (Jco = "the
critical average stress of the centrally loaded c'oluum.
derived from: an actual colunm. curve"" and cr c = It the
critical average stress of the eccentrically loaded
colw;mll•
Multiplying the right hand side of the above equation
by AlA,A. crCC =A CSc..
Approximate equations have been recommended for
Structural Steel with a lower yield point of 40 ksi.
These are:
For Llr =20 to 75, 0._( ~ ~ (l)'2IJ·· \ + '72 +- 9000 r
For Llr = 95 to 200, Q__ I +\0600 1~ ~\.J l ~)fl
-----(26)
-----(27)
\vhere X II
X =eccentricity ratioMr'2 _ er'l- --Pc C
Consider the range of Llr from 20 to 75. Intro
ducinS a shape factor, of 103, a~tentativelY reco~nended
by Bleich(4 )':l-"
. rl. -:. (\ -\- I~) + ~\I~~ (L)Q)J Q.. 9000 r
This "81'1a:1' e factor" is not the value f :. M't)/My as usedin plastic the0ry (see nomenclature), but 1.8 a factorto be applied to the terra)(.. c;ependent on the cr088sectional form and flexu.re axis 0
Solving this equation for 11;1 will give the folloi'ling
interaction fornmla.
-----(28}
The" deviation from an exact solution of equation
(28) becomes appreciable for small values of JG $ but
decreases rapidly RS ill increases.
A resulting curve of equation (28) for one
particular column, (Ljr • 56, 8~~3l) is shown in Fig.
28.
Fig. 28
..-23-
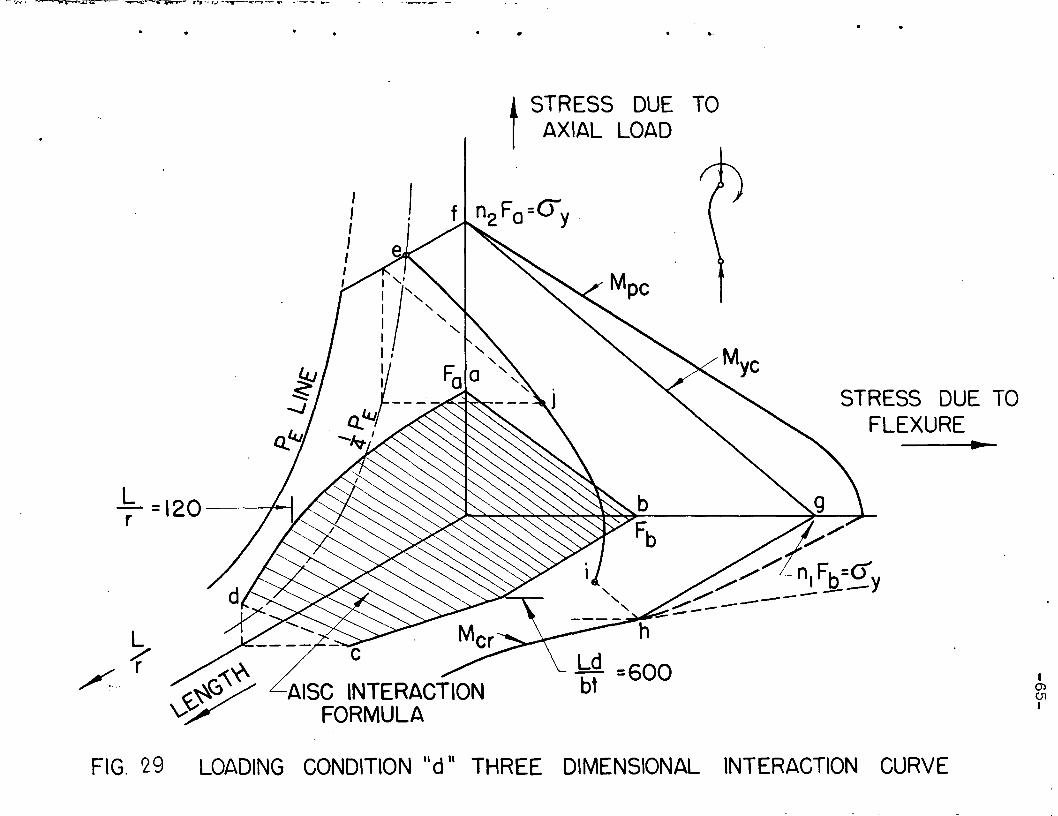
Discussion of Interaction Curves
The re1.ationship between the "interaction formula ll
and the interaction curve may be seen from Fig. 29. Here
stre:3S due to bending -vs- stress :iue .to axial load -vs-
lenGth of colunm for fi particular cross-section, (4'c}F13),
have been plotted. Loading condition IId ll has been chosen
for illustration.
If Fa and Fb are the same values as'in the AISC
formula, where these deterr:1ine the allowable loads under
axial load alone and bending alone respectively, the yield
point load or moment can be expressed as a function of
these vn.lues, (i.e" n#a. PylA' :. (Jy and nlFb =IvIy/S ::
cry) •
1'11.e surface efghij for'rlled by the straight lines ef,
gh, and hi, and the curve ije is a plane, assuming an
idealized stress strain diagram (shown in Fig. 7). For
any point on this surface, carrying capacity is not a
function of length of the column.
Fig. 29
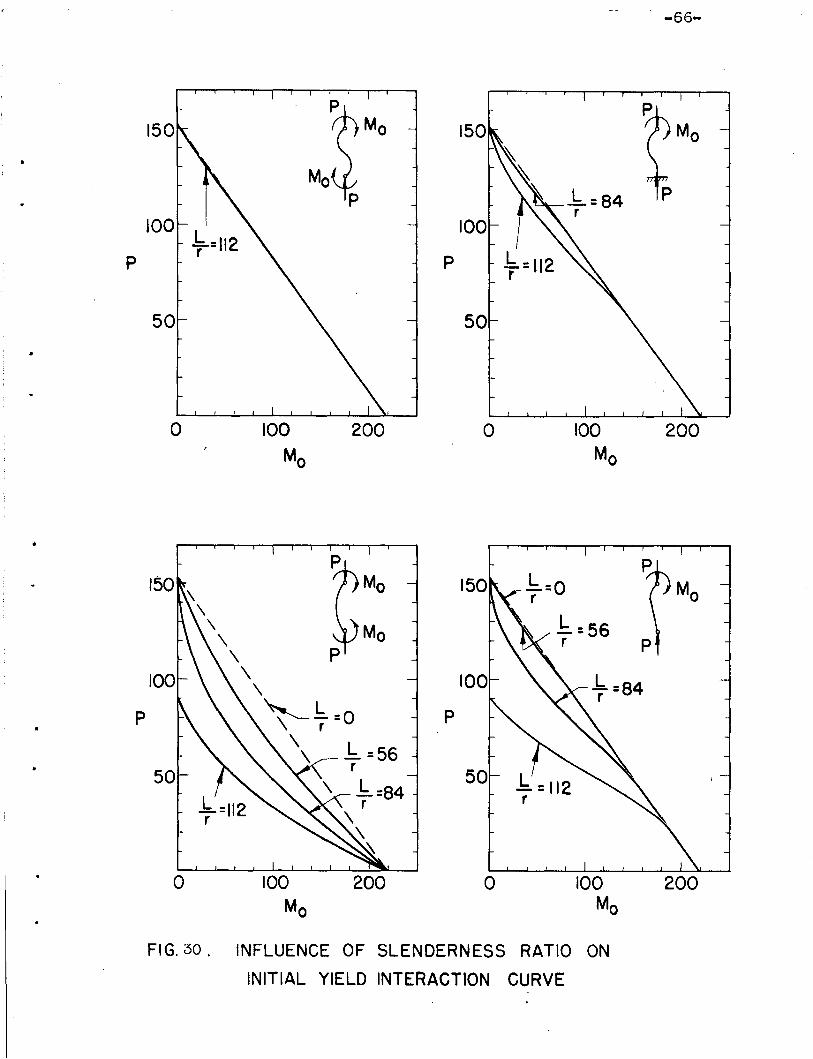
Initial yield interaction curves have been developed
for a number of standard loading conditions. The influence
of length on each condition is shown by Fig. 30, the
tendency being that ror a certain moment, the axial load
at uhich yielding will occur decreases as the slenderness
ratio increases. However, for each loading condition,
except II eli (s in[';le curvature), there is a range of axial
-24-
load vn1ich is theoretically unaffected by slenderness
ratio. This range decreases with increasing slenderness
ratio. (This range corresponds'to that range defined by
the plane efghij in Fig. 29.)
Fig. 30.~
;.
~.
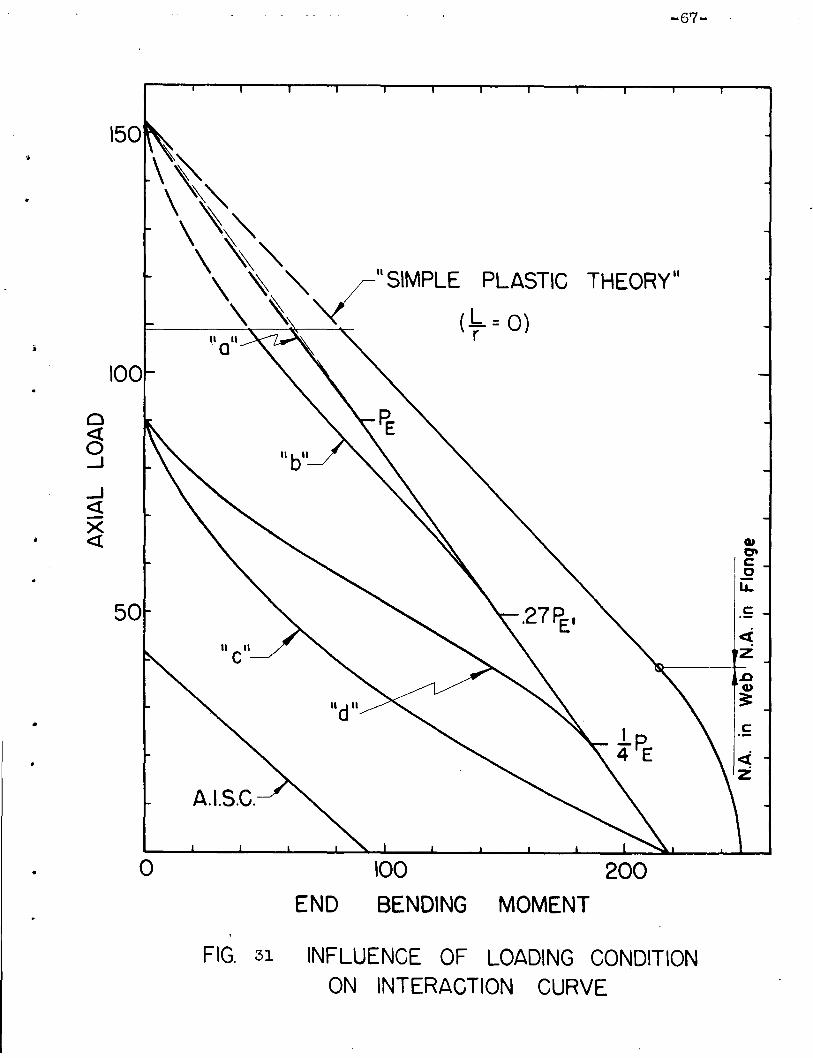
I~ comparing the strength, carrying 9apacity, for
the various conditions, (see Fig. 31), it is evident
that the severity of loading condition increases in the
ord@r II all, "b", II d" and "c". The effect of restraining
moment at one end is quite pronounced. (Compare lI a n and
lib" vlith nell and lid" 0)
Pigo 31
It is well to note that even though in Fig. 29
a curve for Mer is included, the derivations in this
report do not take into account lateral buckling, (bending
I twist). Further analytical work is needed to include
this important condition, especially in the inelastic
range.
A method for determining the collapse interaction
curve using the simple plastic theory for L(r a 0
has been reviewed. It does not take into account the
influence of slenderness' ratio. Also included, is an.
approximate buckling solution derived by Je~eko (It
is apparent that the "shape factorn as suggested by
Bleich is not &\. ,constant but varies for each member 0 )

-------------------:----,-----------------------~~------.....-25-
Collapse 'solutions for eccentrically loaded COlU~lS
based on a Clore l'igorous plastic theory, such as along../
the lines advocated by Jezek and Ch\valla,due to complexity_
h t b i 1 d 'i t1-" ~ t (6.)ave no een nc u eo_ n ._..l.~S "!'-epor .•.,,..
Non-dimensional interaction curves are of value since
they are independent of particular magnitudes dr stress,
load or moment. Such curves and their development have
been discussed by Shanley('?) and others 0 One such t:rpe
of curve, that Y'ITiere the coordinate axes have been chosen
as p/py and M/1~ respectively, will be used later in this
report in the-presentation of test results o
-26-
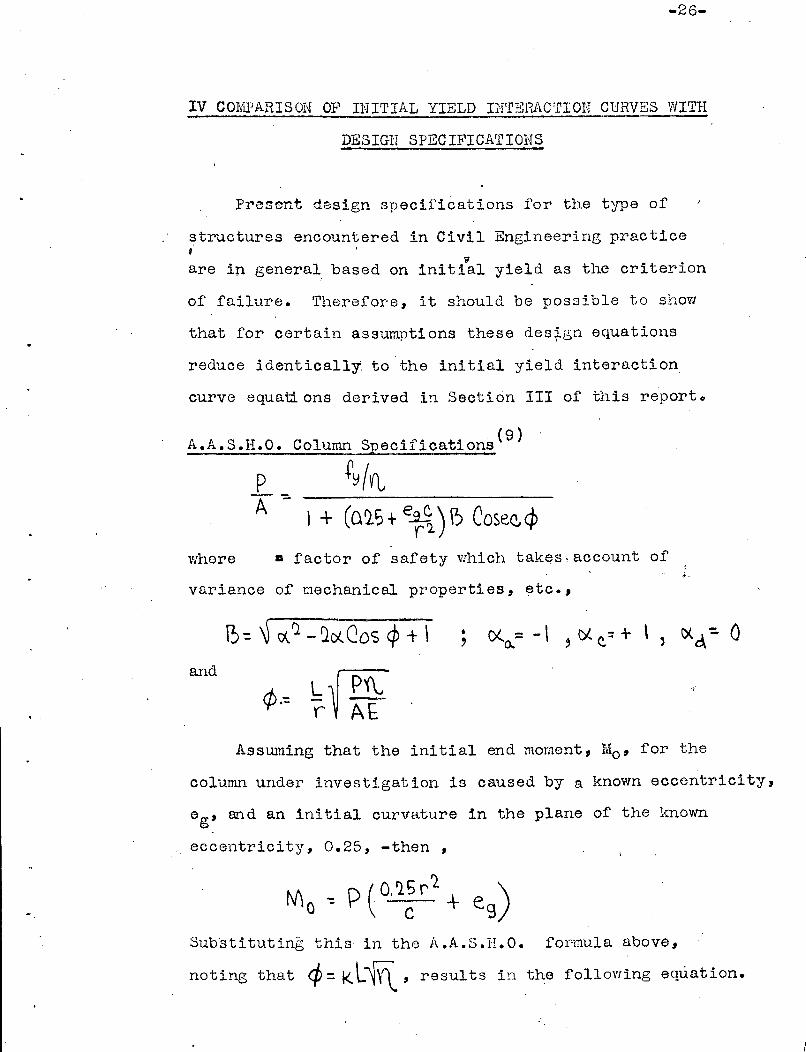
IV COMPARISON 0:£<1 INITIAL YIELD INTERACTION CURVES WITH
DESIGN SPECIFICATIONS
Present design specifications for the type of
~tructures encountered in Civil Engineering practice,VI
are in general based on initial yield as the criterion
of failure. Therefore, it should be possible to shoVl
that for certain assumptions these des~gn equations
reduce identically to the initial yield interaction
curve equations derived in Section III of this report.
A.A.S.H.O.
PA"=-
Column Specifications(9)
fy/rvI + (02.5 +~) \) Coseccj>
variance of mechanical pl'operti es, etc. J
where =factor of safety which takes,account of ,....
and
•,
Assuming that the initial end moment, 11'10 , for the
column under investigation is caused by a known eccentricity,
eg l and an initial curvature in the plane of the known
eccentricity, 0.25, -then,
SUb"stituting this in the A.A.S.Ir.O. formula above,
noting that 1; = k LiY\., results in the following equation.

-260-.
f~ _fL -
Usi. ng a safeOty factor equal to one, i'L'::. \ , this equation
reduces to
. For the various loading conditions defined by B, this
equation is identically equal to those previously derived.
A.R.E.A. Specification for Structural Steel Compression
Members (10)
PA=-
where f • factor of safety, ( in AoA.S.RoO. Spec's.)o
The major difference between this specification and
the A.A.SoR.Oo is that in this specification bending is
assumed about both axes of the section. Initial curvature
is therefore assumed to occur in the weak direction.
Making the assumption that bending in the plane
perpendicular to the web is caused by a known eccentricity,
e1' and an initial curvature, 0.25, and that bending in
the plane of the web is caused only by a knovm eccentricity,
e2' the equation for moment in each of these planes is

-27-
Therefore,
Consider the case where the factor of safety is assumed
equal to one, f =1. Then the general equation reduces
to
\VJ.1.ich is identical to our concHtion II c", (single curvature),
for the case of bending in both axes. (Use super-position
of the stresses caused by the two moments and the axial
load.)
A.I.S.C.' Interaction Formula(9)
~a..+ ~b >-F().. F\, - ,
~a. ~~
A
~b ~Me.1
(:'0. :. \7DOO- 0. 4& 5(~)?
F - I~OOOOOo~O(' Q~ /600Ia - --=-
tJ bt--k,'t
'= QOO()O ~O~- Qd <- bOObc ..
Since the Ld/bt formula was derivedfor a unifor~ly
loaded, sin~ly supported beam, it is impossible to
directly conpare it with the equations in section III.
-28-
;.
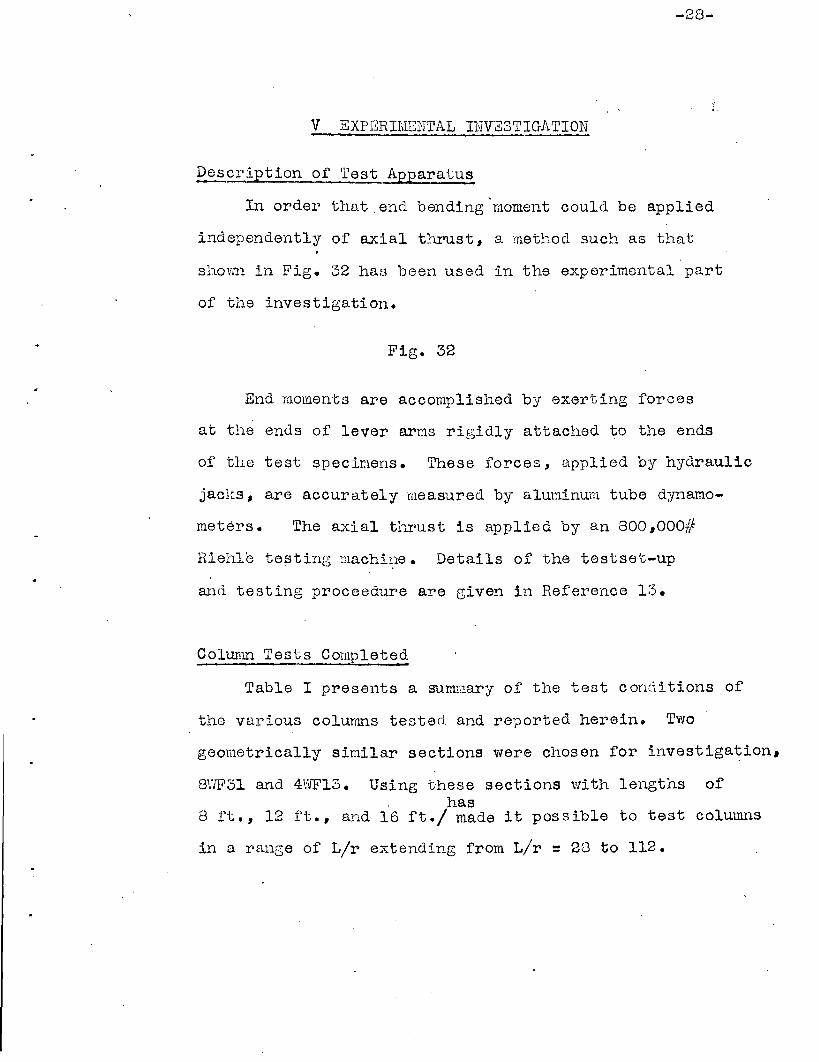
V EXPERIMENTAL INVESTIGATION
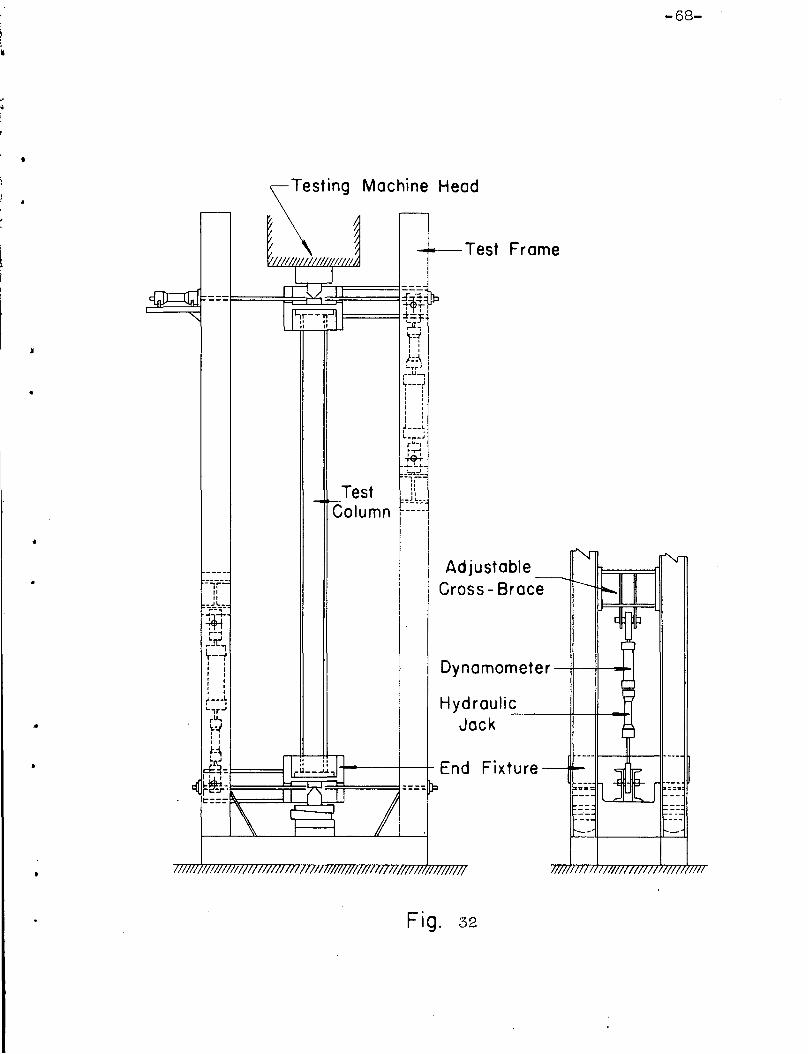
Description of Test Apparatu!
In order that.end bending moment could be applied
independently of axial thrust, a method such as that
shown in Fig. 32 has been used in the experimental part
of the investigation.
Fig. 32
End moments are accomplished by exerting forces
at the ends of lever arms rigidly attached to the ends
of the test specirlens. These forces, applied by hydraulic
jacks, are accurately measured b-:F aluminum tube dynamo-
meters. The ~cia1 thrust is applied by an 800,000#
11ie1118 testing :nachil!e. Details of the testset-up
and testing proceedure are given in Reference 1~5.
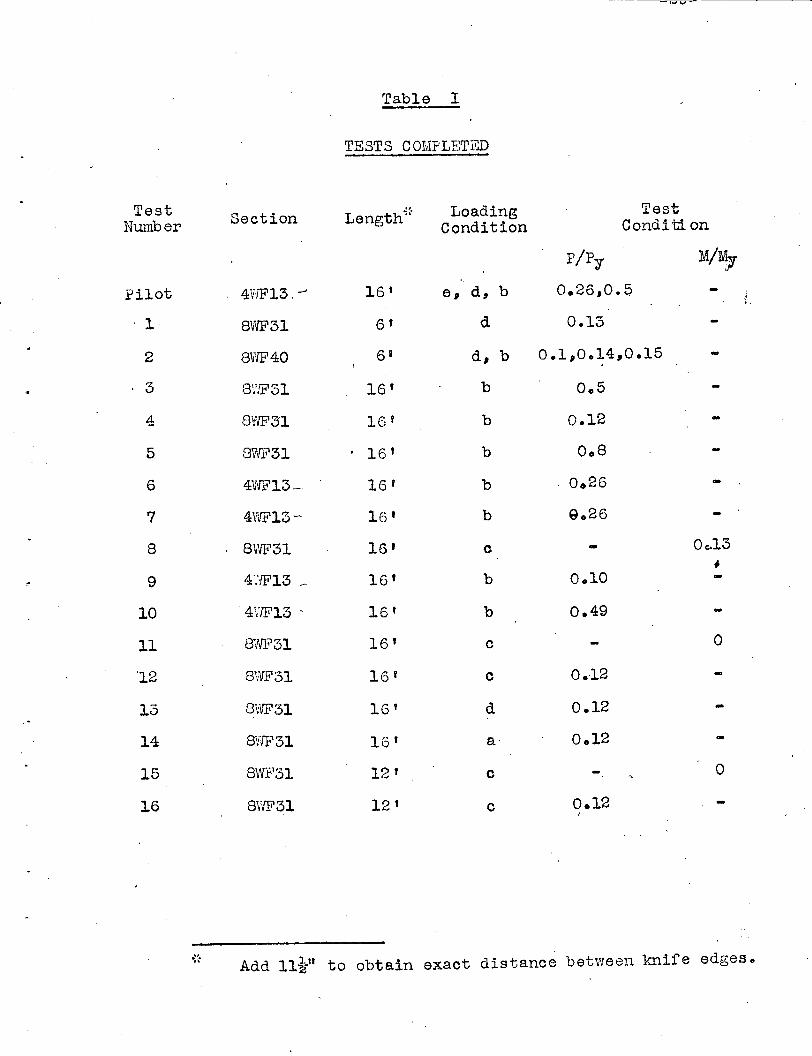
Colunm Tests Completed
Table I presents a sumnary of the test c ondi tions of
the various columns tested and reported herein. Two
geometrically similar sections were chosen for investiga~ion,
8\"JF31 and 4WF13. Using these sections with lengths of. has
8 ft., 12 ft., and 16 ft./ made it possible to test columns
in a range of L/r extending from L/r = 28 to 112.
I"",V ==
Table I
TESTS COMPLETED
Test Section Length~:' Loading TestNumber Condition Condition
p/py M/!vlY
Pilot 4VJF13 , -'-, 16' e, d, b 0.26,0.5 ,;.
-I 8WF31 6' d 0.13
2 8WF40 6 v d, b 0.1,0.14,0.15
3 B1.~'F31 16' b 0.5
4 8WF31 16' b 0.12
5 8Vf1"31 . 16' b 0.8
6 41NF13--- 16' b 0.26 -7 4VJF13-' 16' b Q026
8 8'vV!t'31 16' c 0e-13f
9 4':'JF13 ~ 16' b 0.10
10 4':lF13 - 16' b 0.49
11 SVfF31 16' c 0
'12 m1fF31 16' c 0.12
13 8Vv'F31 16' d 0.12
14 8VJ}'31 16' a 0012
15 8WP31 12 ' c 0
16 8WF31 12' c 0.12
Add llilt to obtain exact distance between knife edges.
-30-
Since end moment is applied independent of axial
thrust, it is possible to test under several different test
conditions. These are: a) holding the end moment constant
while increasing the axial thrust, b) holding the axial
load constant while allowing the end moment to increase,
and c) increase both in any desired ratio. Because of
this flexibility, any condition from a pin end axially
loaded column to one of any desired restrai.nt can be
simulated.
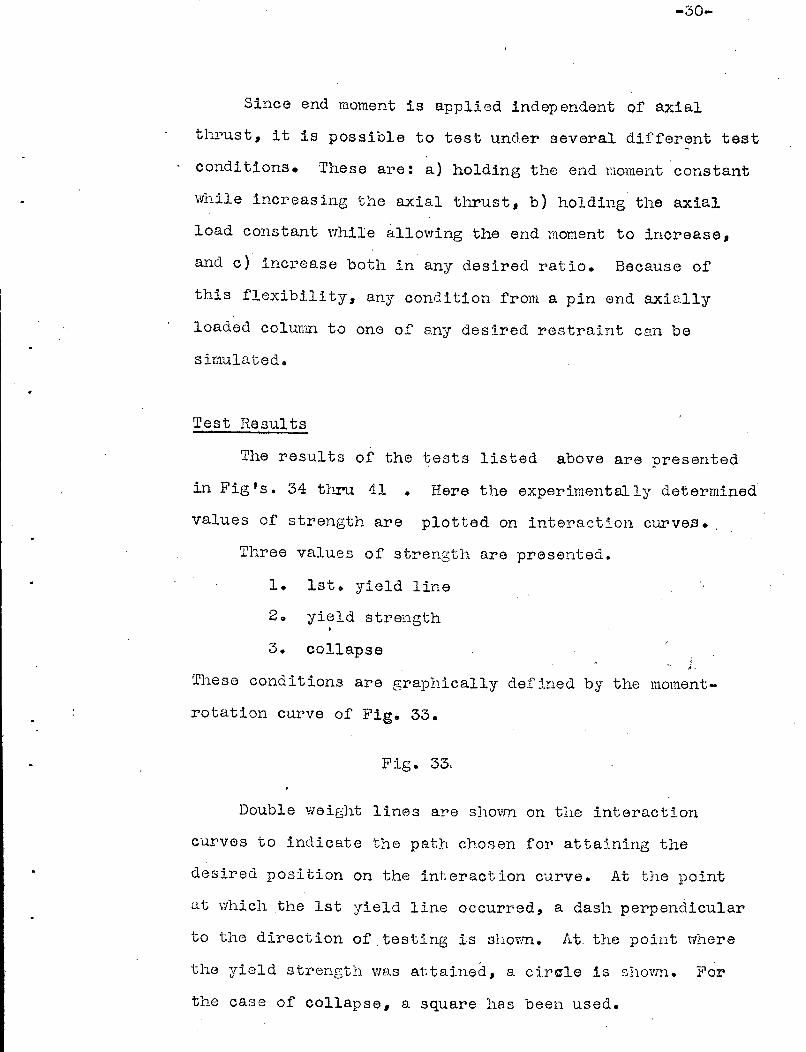
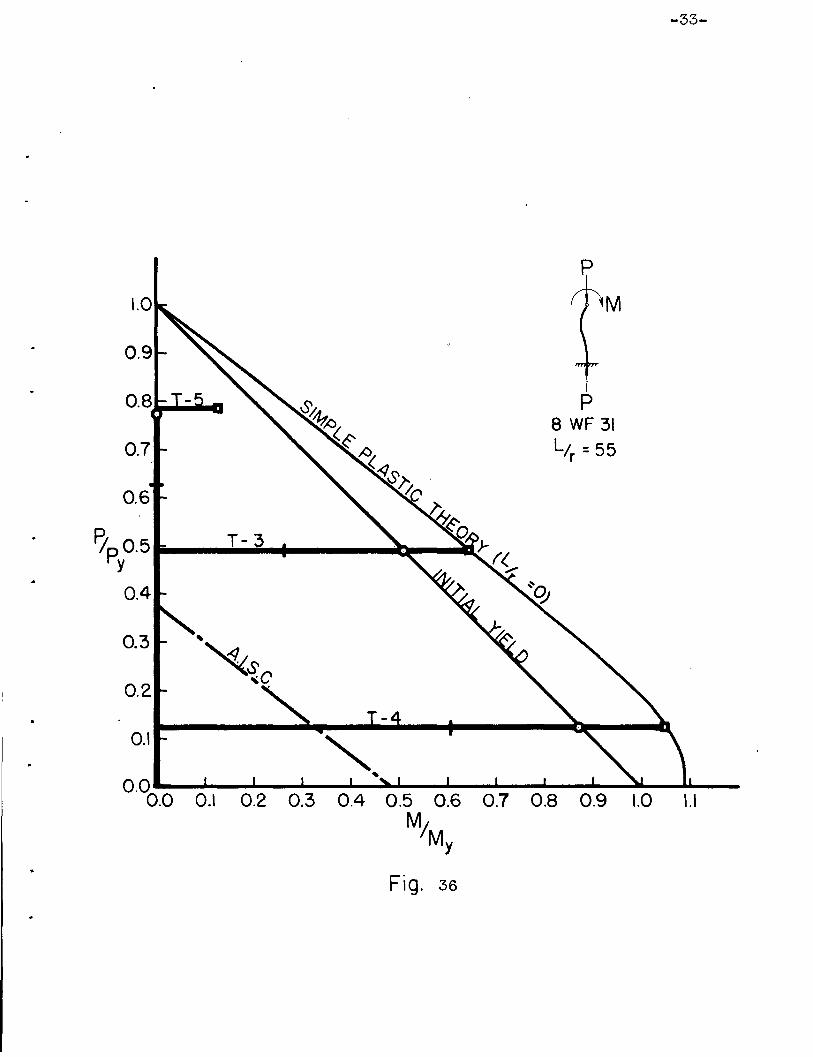
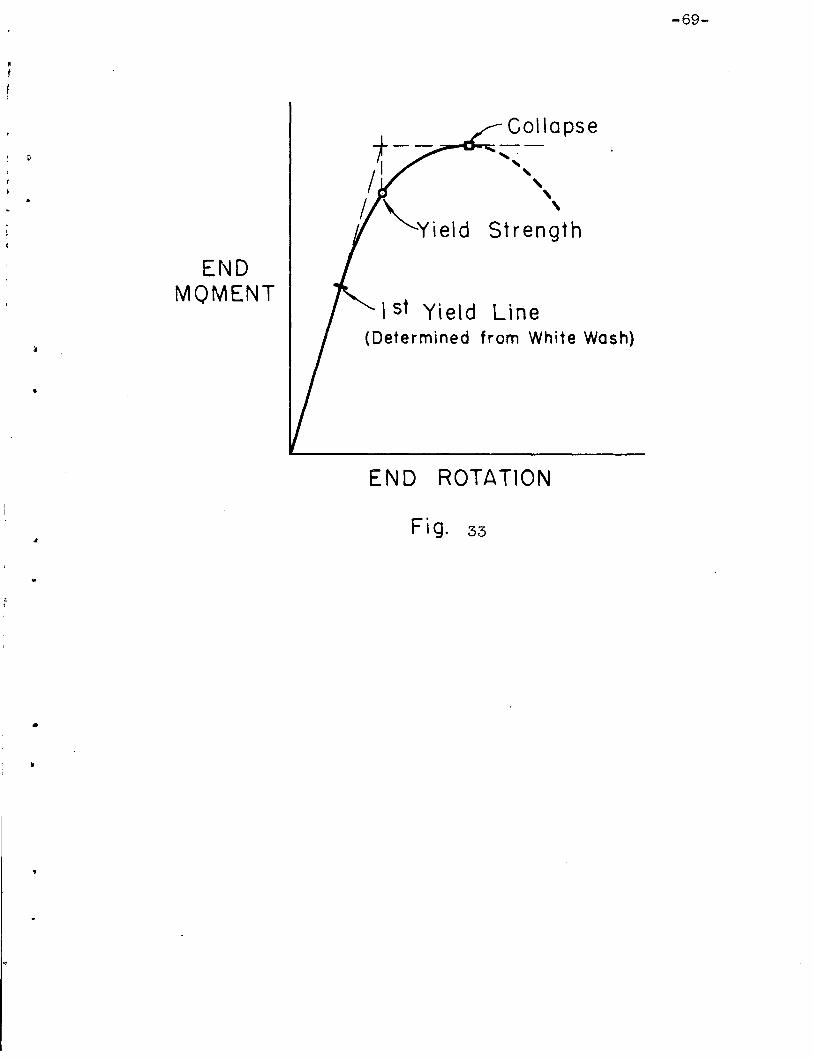
Test Hesults
'rlle results of the tests listed above are presented
in Fig's. 34 thru '11 • Here the experimentally determined'
values of strength are plotted on interaction curve3.
Three values of strength are presented.
1. 1st. yield line
20 yield strength,
3. collapse...
These conditions are graphically defined by the moment-
rotation curve of Fig. 33.
F:lg. 33.
Double wei[:;ht lines are shovm on the interaction
curves to indicate the path chosen for attaining the
desired position on the interaction curve. At the point
at \'/hic11 the 1st yield line occurred" a dash perpendicular
to the direction of, testing is shovm. At, the point where
the yield strength we.s attained, a eire-Ie is shown. For
the case of collapse, a square has been used.

-31-
P8 WF31L/r = 27
T-I *0.1
0.00.0 0.1 0.2 0.3 0.4 0.5 0.6 0.7 0.8 0.9 1.0 1.1
M/My
0.3
0.7
0.6
0.8
0.9
0.2
FlpO.5Y
0.4
)IE Length of Column T -I was 6'- 0".
Fig. 34

-32-
0.9
0.8
0.7
0.6
P/p 0.5
Y0.4
0.3
0.2
0.1
M
P8 WF 40L/ = 27r
0.0 L.-_"------L_---I-_--'-_--L-_........._......-._..L.-_.L...----...;lr...-...----J.&..-_
0.0 0.1 0.2 0.3 0.4 0.5 0.6 0.7 0.8 0.9 1.0 1.1M/
My
• Length of Column T- 2 was 61
- a..
Fig. 35
p
-33-
0.8 P8 WF 31
0.7 L/, =55r
0.6
p T-3IR O.5y
0.4
0.3 ,
~S0.2
,0
0.1
0.00.0 0.1 0.2 0.3 0.4 0.5 0.6 0.7 0.8 0.9 1.0 1.1
M~My
Fig. 36
-34-
p
1.21.1
M
P4 WFI3LI. =IIIr
1.0
0.3~---_"""-----...--e""'11
0.1t--------.......-+-----....Jlo--a
0.7
0.6
0.2
0.8
.0.00.0 0.\ 0.2 0.3 0.4 0.5 0.6 0.7 0.8 0.9 1.0
M/My
Fig. 37
Ffp 0.5 t--........-oay
0.4
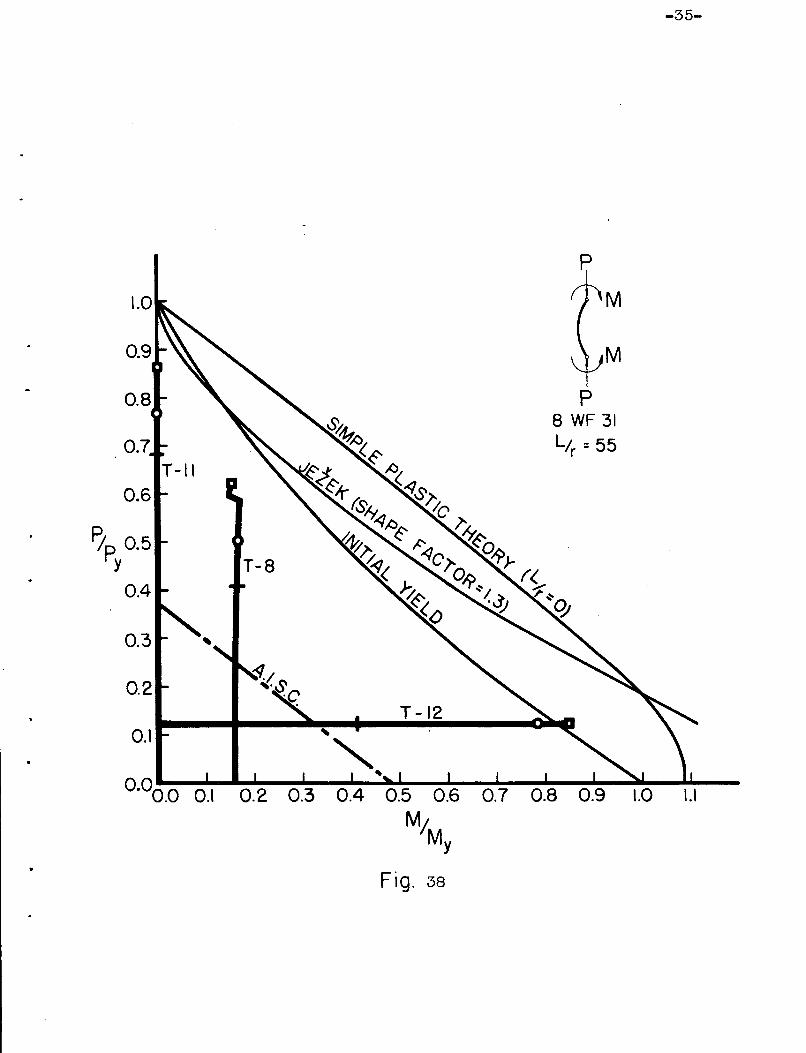
-35-
p
M
M
P8 WF 31
L/r =55
T-12
T-8
0.00.0 0.\ 0.2 0.3 0.4 0.5 0.6 0.7 0.8 0.9 \.0 1.1
M~My
Fig. 38
0.\
0.7T-II
0.6
P/p 0.5y
0.4
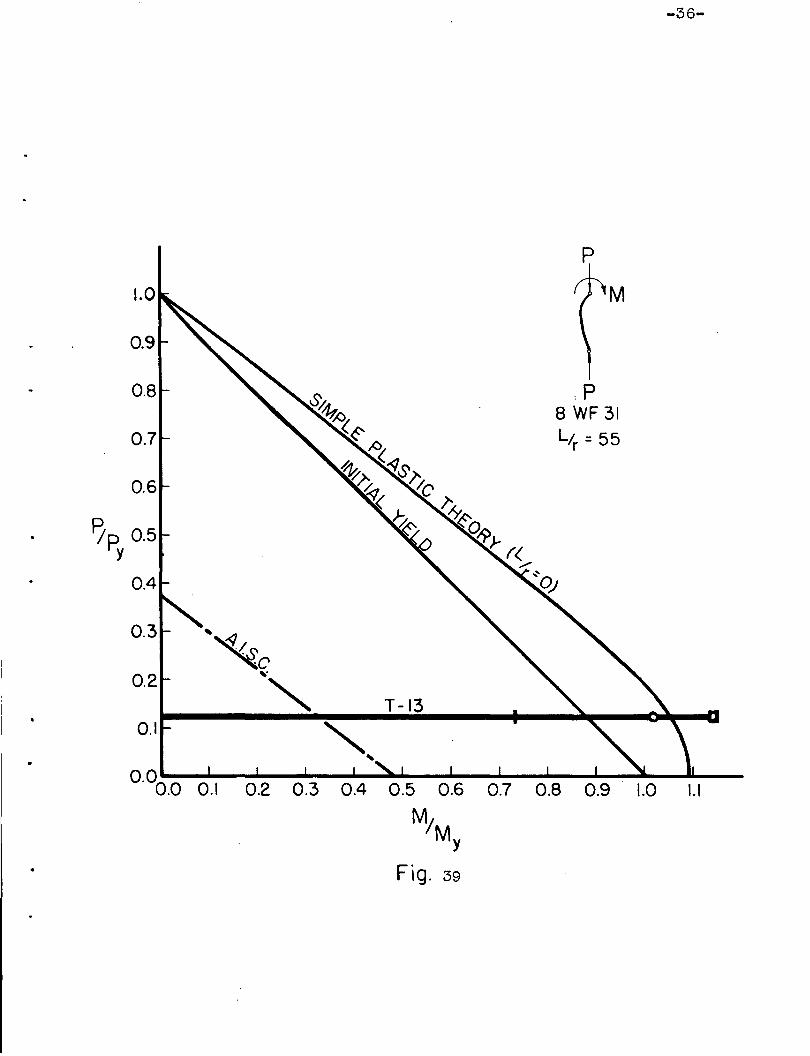
-36-
p
1.1
M
:P8 WF31
L/r =55
T-130.1
1.0
0.8
0.6
0.7
0.9
0.00 .0 0.1 0.2 0.3 0.4 0.5 0.6 0.7 0.8 0.9 1.0
M/My
Fig. 39
P/p 0.5Y
0.4
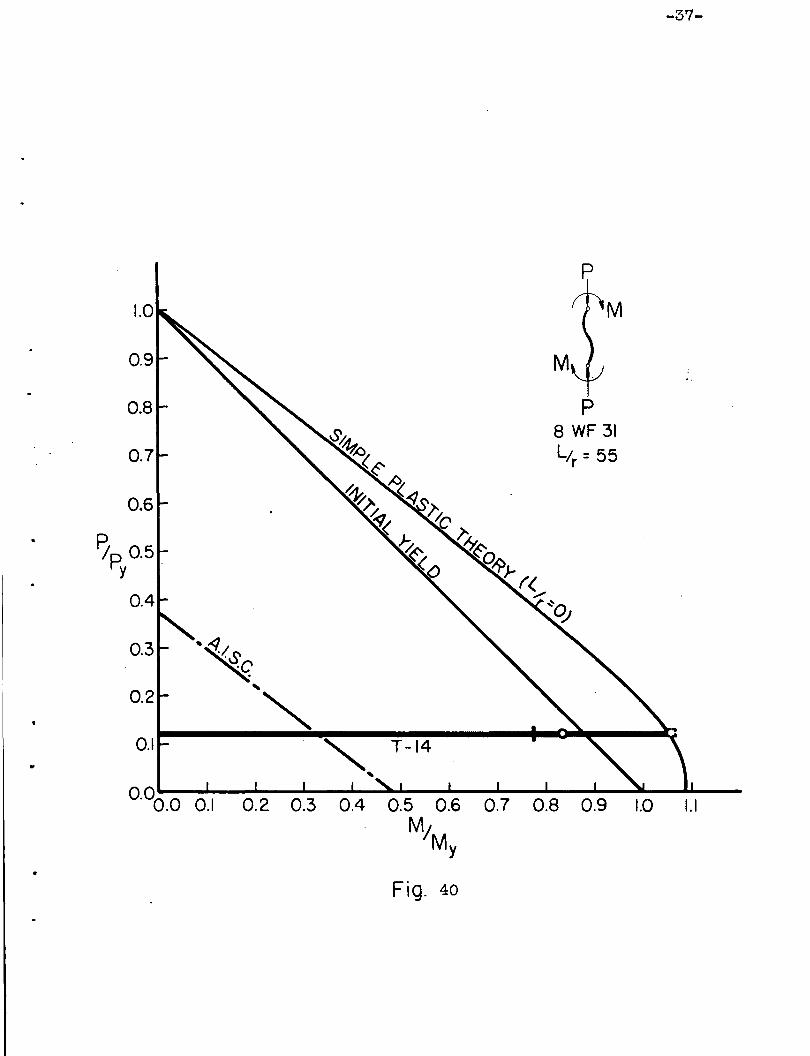
-37-
p
M
P8 WF31L/r = 55
M
0.1
0.3
0.2
0.9
0.00 .0 0.1 0.2 0.3 0.4 0.5 0.6 0.7 0.8 0.9 1.0 1.1
M/My
Fig. 40
P/R 0.5y
0.4
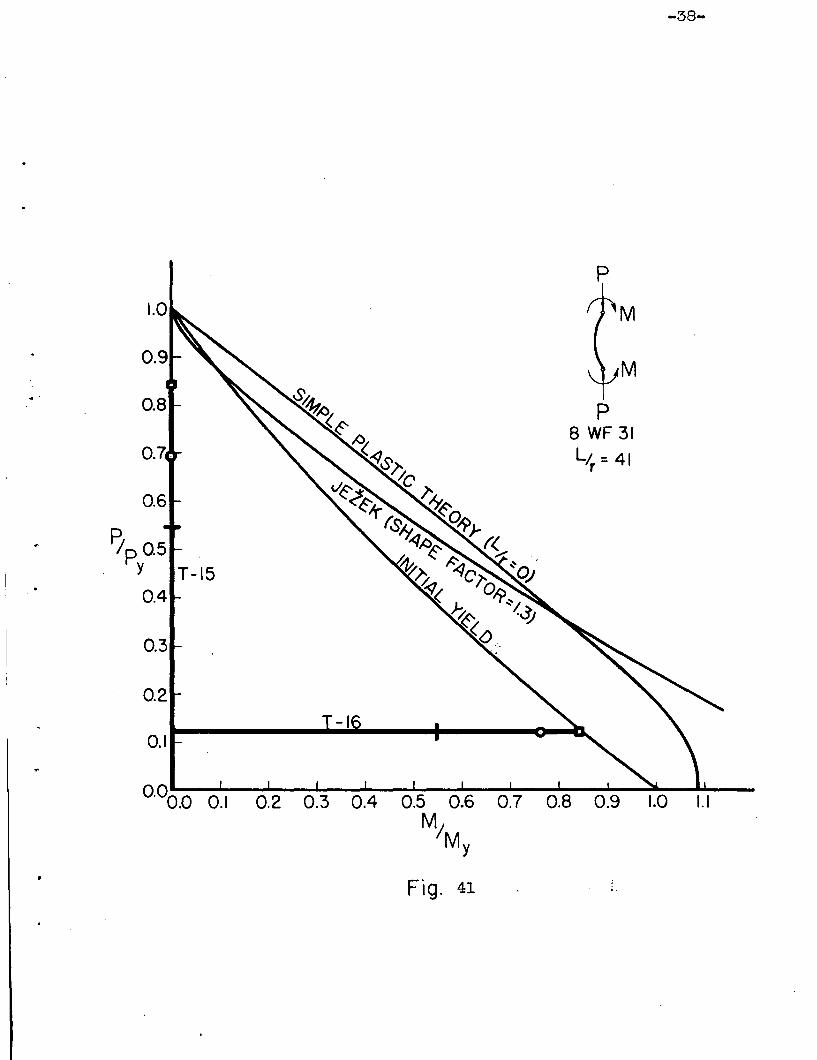
-38-
p
M
M
P8 WF 31
LI. ::: 41r
0.00 .0 0.1 0.2 0.3 0.4 0.5 0.6 0.7 0.8 0.9 1.0 1.1MJMy
.. '
0.8
0.11,
0.6
PJp 0.5y T-150.4
0.3
0.2-I
0.1
Fig. 41 .,
'-39-
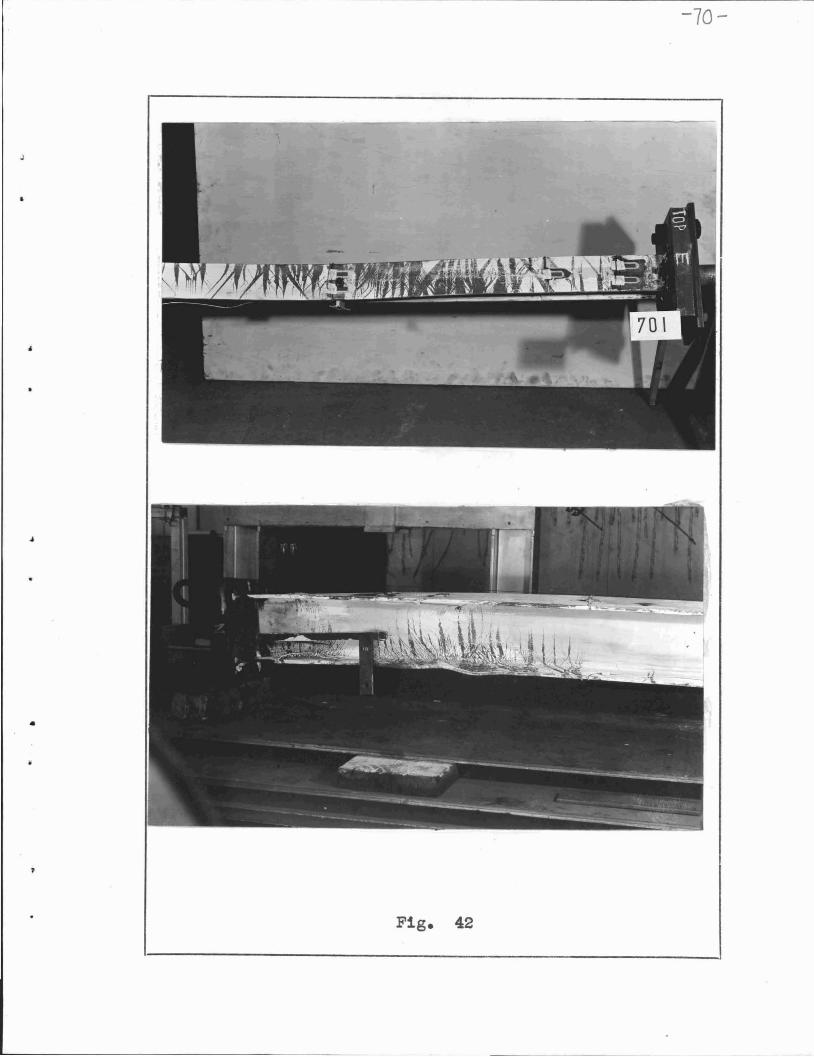
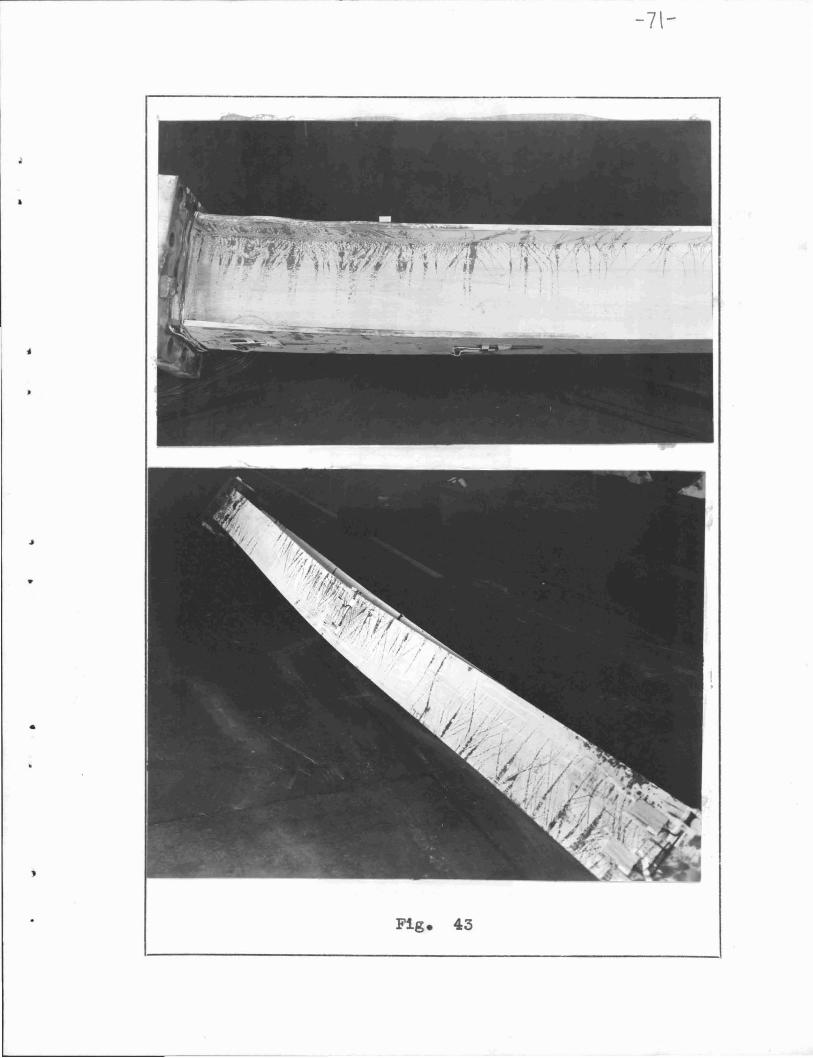
VI DISCUSSION OF TEST RESULTS AND SUW1~RY
Two general typesof failure, lateral buckling and
local buckling, were observed in the present investigation.
Examples of these are shovm in Figs. 42 and 43 ..
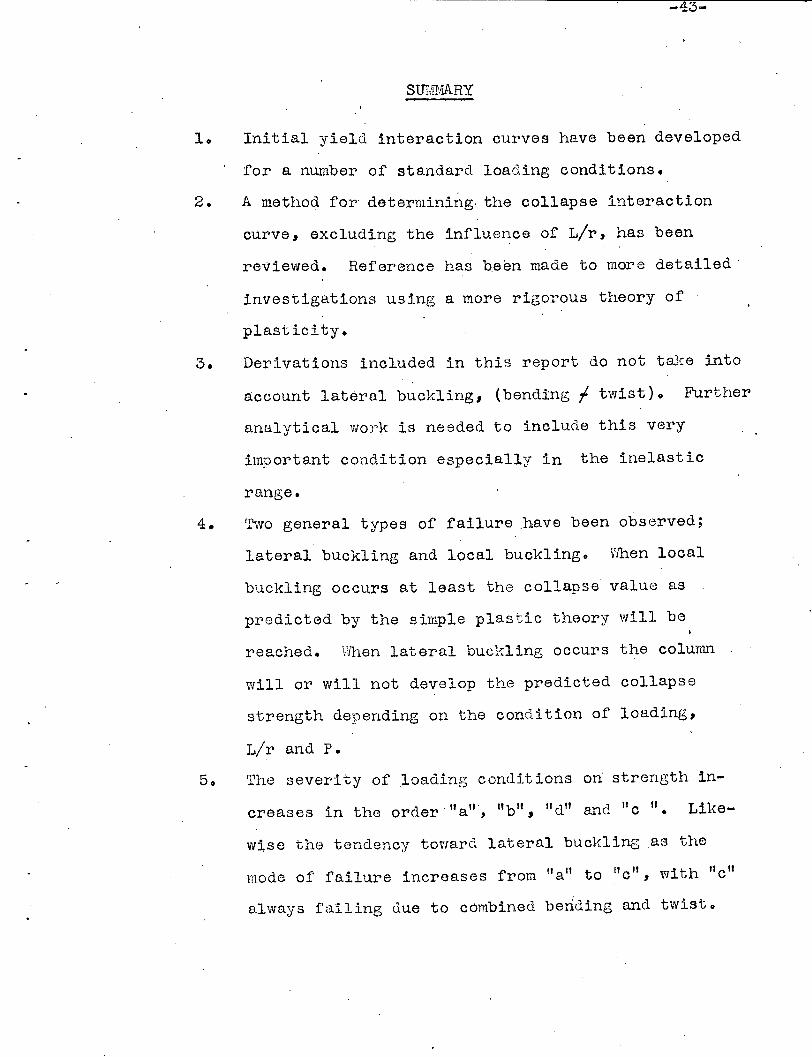
A S1.1.17I(Jary of the test re8ul ts is shown in Table
II. Here loading condition, p/py' 1/1'" and type of failure
for each sp?cimen are listed.
Except for short columns with relatively lOTI, axial
loads tested under conditions a, b, and d, failures have
been of the lateral buckling type. Tests T-4, T-13 and
T-14 are the excep tions. Test T-3 failed due to a
co~bination of both lateral and local buckling.
Loading condition c, single curvature, has in all
cases regardless of Llr or p/py failed due to a lateral
buckling type of failure. However, the carrying capacitJ
has beon a.ppreciabl~r reduced when the value of p/Py was
relatively high. This reduction is in part due to lateral
buckling, but it is a~o due to the residual stress in the
mel;lber. Present knOll/ledge indicates that a residual stTess
level of approximately 10-15 ksi ispresent in those roll'ed
sections tested. This condition of residual stress would
tend to asgravate the already present tendency toward
lateral buclcling t:nereby causing a further reduction in
strength.
In all cases wnere local buckling occured, the collapse
value as predicte d by the simple plastic theory for 1/1'" ='0 was reached. Since local buckling occured only when
the ma...xir.mnl moment occured at the end of the member for,;.
-40~ .
relatively low values of p/py and L/r,it is possible
to postulate that there is a certain ranGe <.'ihere theI
simple plastic theory \vill give collapse values sufficiently
close for design. This range decreasos vlith increasing
L/r. A similar condition has been observed by Baker in
EnGland on small model tests of colunns tested under cond-
itions similar to thos e reported herein as conditions
a, band d.
In some cases, (T-13, T-l and T-2), collapse has
exceeded that value predicted by the simple plastic
theory for L/r =O. This is attributed to strain hardening
of the steel. Each of these tests when carried to
collapse failed due to local buckling. Test T-14 viould
have also exceeded the predicted value but was stopped
after haVing exceeded this value slightly because of the
extreme difficulty of providing enough lateral force at
'.. the ends of the specimen to counteract the high shears
caused by a condition "all type of 102.dingD
Since local buckling is dependent on the length of
the yielded zone of the compression flange, and since the
length of this zone is a function of the loading condition
and length of the column; a short column under a steep
raoment gradient will have a small yielded zone therefore
less tendency to local buckle. This viould result in a
portion of the member strain hardening, thu:] increasing the
strength beyond that value predicted by the simple plastic
theory. Therefore, short columns tested urrler loading
condition "a" viould be the first expected to exceed the
-41-
predic~ed value. Th~next in line of probability would
be condition "b". Next, condition "d". Since for loading
condi tion "c", local bUclding Vlill not occur, except for
extremely short members, experimental collapse vlill
never exceed that value predicted by the simple plastic
.theory.
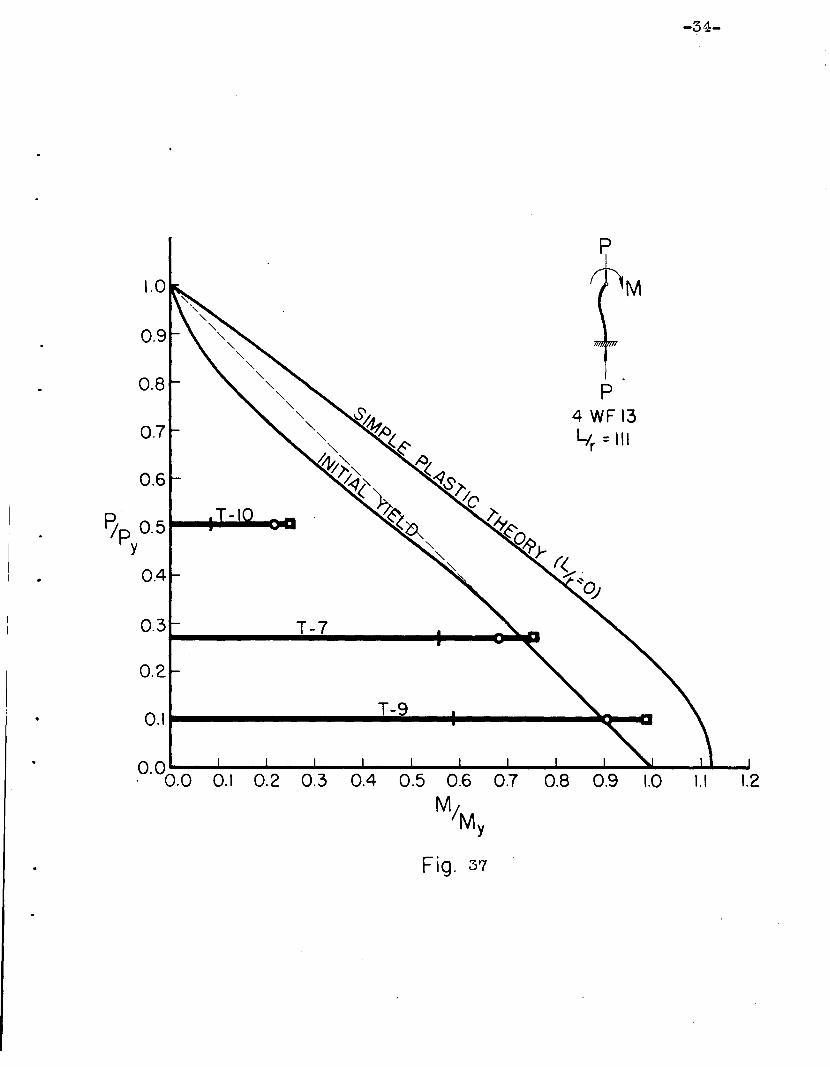
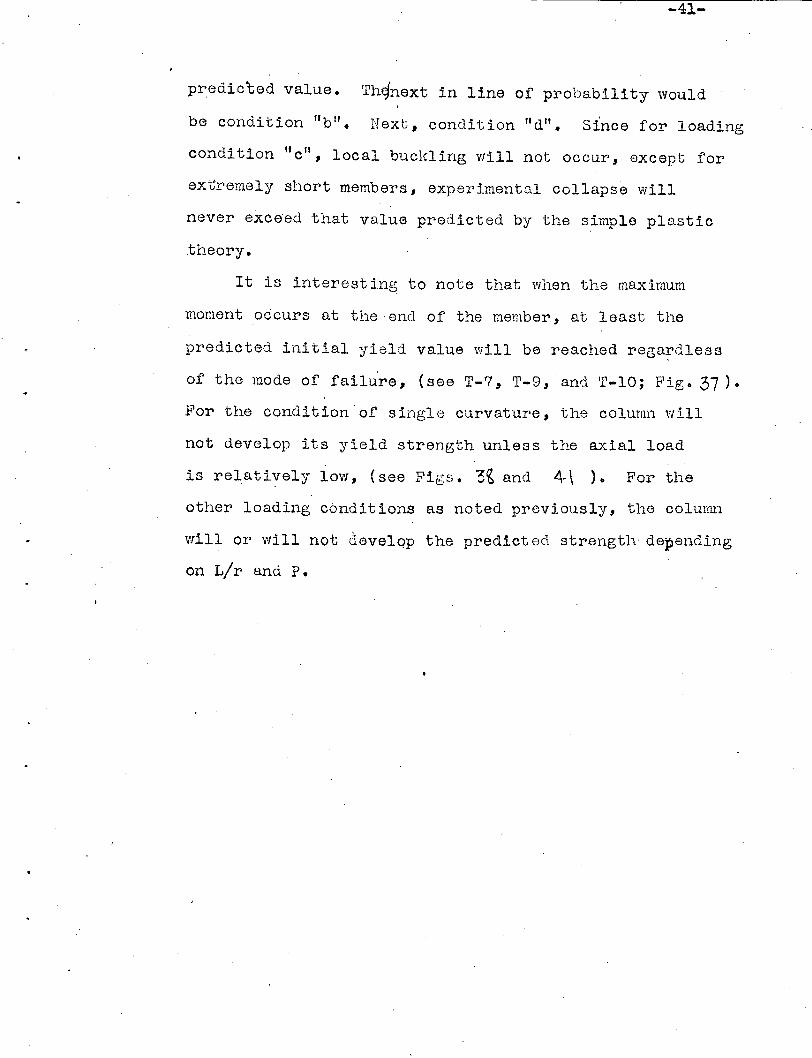
It is interesting to note that when the maximum
moment occurs at the end of the member, at least the
predie ted initial yield value will be reached rega~(lless
of the mode of failure, (see T-7, T-9, and T-IO; Fig. 37).
POI' the condition'of single curvature, the column will
pot develop its yield strength unless the axial load
is relatively iOVl, (see Figs.. "3~ and 4- \ ).. For the
other loading conditions as noted preViously, the colunm
will or will not ~evelqp the predicted strength depending
on L/r and P.

+ f +I
+ ! +I
+ '0[0
: I
i Plastic Hinge Developed**
I Plastic Hinge Developed**
I Local Buckt,ing of FIg.1& Lateralit Local Buckling of FIg.ILateral Buckling
I Lateral BucklingI
I
0.50Ii 0.121
10 •80 !10.26 l
lI
-42-TABLE II
SUMMARY OF TEST RESULTS CDII)
PoObO "0 at •Q r-I r-1M
or-I CD r-i ..........or-I OH
~~>4 0
0 "0 "0or-I
I~"CD "0
CD+J +JCD i +J <D ,H.... v.d Iv.d::1"0 ~ ~
erjV Ior-I 0M r-iQ A.t 'CJai '0 CIS.......... .... 0 .......... ........
Type of Failure I CD. <D <D<D..:l ato A.t =a I 6: t:4
Mt:4. ,1%4 IP..
+ --/ I20.6. d
fl b
55.4l b
!55.21 b
I b
Illl.7( b
I I
If these tests had been carried further l local buckling wouldhave occurred.
+ Denotes exceeding value,- Denotes not reaching value,o Just did reach.
I7 14WFl3 110.9 b [0.26 -- Lateral Buckling + - '.
!,
t8WF3lI
f8 55.11
c ~ - O.l~ Lateral Buckling I - -t I . !~ ,
10
•10 f9 l4WF13 llll.O t b -- Lateral Buckling I +
j...
flOI
U-ll.01
b!
i 4WFl3 0.49 -- • Lateral Buckling ... -tIl 8WFl3 55.2 c -- 0 ' Lateral Buckling - 'If . i:18WF3l 55.2 0.12 Lateral Buckling +j12 c --,
10
•
12 Local Buckling113 8WF3l 54.9 d -- of FIg. + + !i
-I1
8WF3l 55.2 ILocal Buckling of FIg. 0! 14 a 0.12 -- +II r: .,
I115 ! 8WF31 41.3 c !- O· Lateral Buckling - -I i ,I II
41.2 f cj
T.ateral Buckling 0116
18WF3l ~ 0.12 -- -...
MCD
~f
z ,lt,
I~,.
1 18WF3li
f 2 l8WF40r
l :3 f.8WF:31i I
I
l.
t 8WF3lII
4~
t 8WF3l5•
6 ft 4WFl3f-
..43-
SUI>I!vIARY
1. Initial yield interaction curves 11ave been developed
for a number of standard loading conditions.
2. A method for determining. the collapse interaction
curve, excluding the influence of L/r, has been
reviewed. Reference has been made to more detailed
investigations using a more rigorous theory of
plasticity.
3. Derivations included in this report do not tal'.:e into
account lateral buckling, (bending f twist). Further
analytical Vlork is needed to include this very
important condition especially in the inelastic
range.
4. 'fwo general types of failure .have been observed;
lateral buckling and local buckling. Vfuen local
buckling occurs at least the collapse value as
predicted by the simple plastic theory will be
reached. When lateral buckling occurs the colunm
will or will not develop the predicted collapse
strength depending on the condition of loading,
L/r and P.
5. The severity of loading conditions on· strength in
creases in the order·"a"·, "b", I'd" and " c It. Like
wise the tendency toward lateral buckling as the
mode of failure increases from "all to I'C", with "c"
always failing due to combined bending and twist.

-44-
G. \"}hen the maximum moment occurs away from the end
of t.he member, a more dl~astic condition is im
posed on the column.·
7., Columns loaded such as to cause single curvature,
condition "c", will not even carry the predicted
yield value unless the axial load is relatively
low. 'rhis reduct ion in strength is due to
residual stresses and lateral buckling.
8. W1'len the maximum moment occurs at the end. of the
colunm, the predicted init io.l yield value Ylill
at least be developed, rer,ardless of type of
failure.
9. Prom the experimental )7rogram it has been observed
that at relatively.hieh axial loads, residual stress
appears to have a pronounced effect.on carrying
capacity. A p~eliminary investigation to determine
the effect of residual stress in the 8WF3l section
indicates a reduction in carrying capacity at
collapse of an axially loaded member, (L/r approaching
zero), of apprpximately 8-10% due to residual stress.
-45-
VII Acknowledgements
The authors vvish to acknowledge the contributions
made in the. experimental investigation by the work of
Messrs. J. Chen,. J. Ruzek, andE. Kaminsky. The helpful'
criticisms ofrwmbers of the Lehigh Project Subcommittee,
(T. R. Higgins, chairman), Welding Research Council and
the Column Research Council Research ConwitteeD, (N~ M.
Ne",vmark, chairman), are sincerely appreciated.
This program is being carried out in the Fritz
Erl[;ineering Laboratory of which Prof. Wm. J. Eney is
Director.
VIII Bibliography
.t.
1.
3 •.
5.
6.
7.
Timoshenko, S., "Theory of Elastic Stability",McGraw-lIill, New York, 1936, p. 12 ..
Baker, J. F., "A Review of Recent Investigationsinto the Behavior of Steel Frames in the PlasticRange", Jour. of the Institution of Civil Engineers,No.3, Jan. 1949.
Roderick, J. W., "Theory of Plasticity - Elementsof the Siwple rrheoryH, Philosophical Nacazine, Ser.7, Vol. XXXIX, JUly 1948, p. 529.
Bleich, Fredrich, "The Buclding Strength of HetalStructures", A Critical Survey sponsored by theColumn Hesearch Council, Unpublished, Chapter II,distributed Oct. 29, 1947.
Reference 1, p. 499.
Bijlaard, P. P., "Investi~ation of Flexural Bucklingof Rigid Joint Structures' , Progress Report 2,Cornell University, June 1951.
Shanley, F. R., "Applied Colunm Theory" " Transactionsof the American Society of Civil Engineers, Vol.115, 1950, p. 698.
\~
-46-
8. Steel Construction Manual of the American Instituteof Steel Construction, New York, 1949.
9. Specifications for Highway Bridges of the AmericanAssociation of State HighwaY Officials, WashingtonD.C., 1949 0
10. American Railway Engineers Association Specifications.
11. Winter, G. , et al., llBuckling ofTrusses andRigidPrames", Cornell University Engineering ExperimentStation Bulletin No. 36, April, 1948. '
Selected Reports in the Lehigh Series
12 0 Luxion, \'I" W., and Jolmston, B. G., "plas,tic Behaviorof Wide Flange Beams", Progress Report No., 1,The 'delding Journal Hesearch Supplement, Nov. 1948.
13. Beedle, L. S., Ready, J. A., and Johnston, B. G.,llTests of Columns Under Combined Thrust and I':lornent",Progress Report No.2, Proceedings Society forExperimental Stress Analysis, Vol. VIII, No.1,P. 109, 19500
...
Appendix A
-47-
Defini~1ons, Nomenclature and Terminology
A = area of section
b = width of section'
c = distance from N.A. to extreme fiber
d = depth of section
E = Young' s ,''iodulus
f a= actual axial unit stress at a particular section
fb= actual bending unit stress at a particular section
Fa= axial unit stress that would be pe~litted if axial stressonly existed
Jib= be.nding unit stress that would be permitted if bendingstress only existed
I = moment of inertia
K =f/£lL = total length of the member
L/r = slenderness ratio
Ld/bt = ratio governing allowable c6mpressive stress in flangesas specified by the AlSO manual.
moment at any section alon.:; column
moment at which yield point is reached in flexure
"Hinge value"; full plastic moment; the ultimate momentthat can be reached at a section according to the simpleplastic theory. MUlt in TimoslJenko. Collapse momentfor a simple beam. Mp =ery Z.
moment applied at end A
~J[o =
moment applied at end B
moment applied at end of column
Mpc = colla:ose moment for a beam-column at a particular sectiono';Ehe ultimate moment or collapse load of- a column asmodifi eO. by compre S 81 on load
. Myc = same as f.1y except modified for compression load
II
P = an applied load
-48-
p- cr = useful column load. A load used as the IImaxi.mum colunill.
load fl in design procedures. This might by Pt, PE, ?ult.
Py =
p =E
=PE':
:
Pk'":.l...
=r =SE :
S =:
t =u =w =
x :
y =y' =
=
yl/ ==
the load at which yield point stress 1s reached wru.leunder pure axlal load.
Euler buckling load for a condi t ion where both ends of thecolumn are pinned.
1\~t:I
IIIEuler buckling load for a condl ti on of one end beinc:.: pinned,the other being fixed.
-n'l t I(0,1 L'?
Euler buckling load for a condition of both ends beingpinned but sUbjected to a landing causing double curvature.
'i1'1~1
(O,SL)'2radius of gyration
sectiop modulus of part of section remaining elastic
se cti on Modulus
Ic
flange thickness
web th:l.ckness
distance rrBasured along colwiID
deflection
first derivative of y \rlth respect to x
slope
second derivative of y with respect to x
curvature
Yo: distance from neutral axis to centroid of section
Z : plastic Lodulus
=
=static ~oment of the entire cross-section.(l:!'2j ~dA~\
statical mome nt of part yielded by axial loael, P
fUll statical moment of the section
-49-
ZE = statical moment of r:a rt ol.' secti on remaining elasti c
(f = stress
cry = yield stress
'fer = critical stress
E = strain
¢ = ? [\ \ J~u. ~Ll- ~'\ r:2 L.l
~ = ll6;1~ ~u-J--<J. - Core radius
= ~c
:x; = eccentricity rati 0
= MA.- Mr2- = pc'p

-50-
Appendix B
AVERAGE SECTION PROPERTIES.it.
t
1,
d b w t A Ix Sx r x
8 WF 31 (Average of 11 specimens)
Measured 8.069' 8.032 0.299 0.427 9.177 111.356 27.60 3.483
Handbook 8.00 . 8 0 000 0.288 0.433 9.12 10907 27,,4 3.47
%Var. +0.867~ +0.407; +3.8210 -1.39;£ +0. 63~& +1.51% +o. 73;;+D. 39%
4 WF 13 (Average of 4 Specimens)
Measured 4.139 4.140 0.258 0.337 3.759 11.215 5.419 1 .. 727
Handbook 4.16 4.06 0.28 0 .. 345 3.82 11.3 5045 1.72
c'l Var. - 5.05?0 +4.937; -7.86% -2 .. 32% -1.59ch - 0.75;~ -0.57% +0.41~b/0 I
8 VW 40 (One Specimen)
Measured 8.300 8.070 0.371 0 .. 550 11.691 146082 35.379 3.544
HandbD ol{ 3.25 8.077 0.365 0.558 11.76 146.3 35.5 3.53
~6 Variat.+O.61~b -0.087·~ +-1.64% -1.43% -0.59~& +0.36~'b -O .. 34»+0.40~t

FIGURES
-51-
-52-
II II
CII IIa
Fig. 1
p-tl ~p'A S'
. Fig. 2
Fig. 3

Per
P
CTyl
ICT
-53-
oFig. 4
!P
o
€--
Fig. 7
M--"-
Fig. 5
M Fig. 6
1p
Fig. 8
Mer
-54-
Initial Yield =Mye
Collapse =Mpc
-
!p
Mo----
Fig. 9
p

(0)
M due to P<CI11IIIDJJII[rI] I n:r,.......
(c)
M,Total
-55-
r-- ...~
rnn(d)
Fig. 10
-56-
(0)
(b)
- r max.
~ ~""'r--
III in(c)
x :1 M- max.1"""L":1"1 / r- ~
II: )
...~~1111
(d)
where: (P=o)< P2< P3< P4 < (PE or Py)
Fig. 11
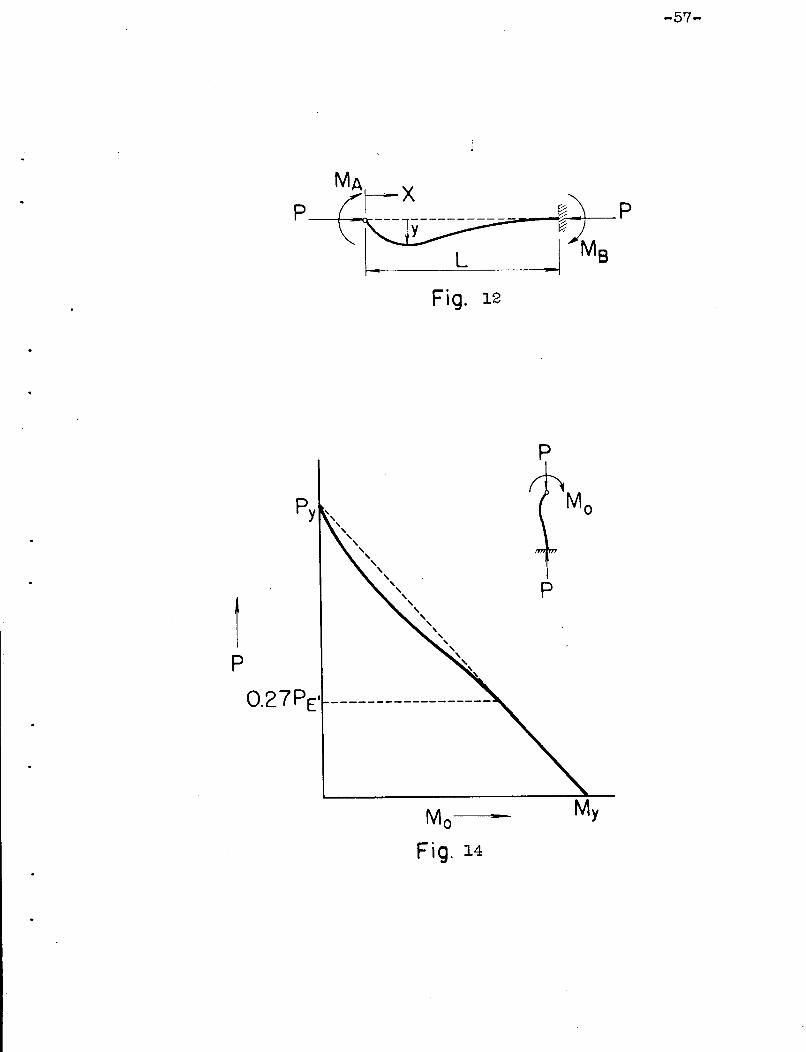
Fig. 12
p
-57-
1P
O.27PE' ------------------
P
Mo - My
Fig. 14

ICJ1enI
4.03.53.0
2u2.5
!V V
II
VI III
./II
VI [ /I
! VI./
I //,
i/i7
A/ LIftX/
/v
IL-m P'n/r
IjV
VI
0.10
0.20
0.00
XL
Fig. I~
-59-
Me
p tFfY--~----~~~~r p
Fig. 15
'Me
p
p
Ip
Me - My
Fig. 16
-60-
M
p~tF~X~~---I7-P- JMF' 0Ig,
p
p
":-:-,,,,,
::-"
IO.25PE ----------
P
Mo - My
Fig. 18
p ~--+--p
L:JFig. 19
p
-61-
"
1p
Py "",""-
""-""""""'" P,
"""",,"",,,,,
",,"",,
""","""Mo - My
Fig. 20
p
where 0- 0P
Fig. 21
-62-
Fig. 22
icrYI
ir-----7JM,--J cry l-- Mp:>M, :>M y
Fig. 23
•
Fig. 24 Fig. 26
- b_~o__- =::f==
N.A.
LJU"y
Total StressDistribution
(0)
+'---0..=1__--
that due
to P(b)
-63-
that dueto M
(c)
..
•
1p
Fig. 25
MoFig. 27
•
Ip
Jeiek
Mo -.
Fig. 28
p
p
Initial Yield
-64-
tSTRESS DUE TO
AXIAL LOAD
STRESS DUE TOFLEXURE
AISC INTERACTIONFORMULA
FIG. 29 LOADING CONDITION lid \I THREE DIMENSIONAL INTERACTION CURVE
I(j)c.nI
-66-
p
1001.=112r
50
o 100Mo
200
p
o 100Mo
200
\Mo ..b..=0 Mor
\h=56\ Mo\ r
\\
..b. =84\
~;=Or
p p
\-'=- =56\
50r
50\ -'=-=84
r\
\~
0 100 200 0 100 200Mo MO
FIG. 30. INFLUENCE OF SLENDERNESS RATIO ON
INITIAL YIELD INTERACTION CURVE
-67-
THEORY"
c:
<i.z
c:.-
Q)0'Ie
10lJ...
\I c"
100 200
END BENDING MOMENT
A.I.S.C.
o
50
100
£:)
~--l
--l<l-X<l
it
•
FIG. 31 INFLUENCE OF LOADING CONDITIONON INTERACTION CURVE
-68-I
t•
•
l\Testing Mac~ Head
~
-...-Test Frame'III//ii///i
_ ~TestColumn
bleN IV-
race r----~
[ ll~....,
eter .....=
c R
~---- -..
ure13frIs;;'-;' ---:::
-- ---- ---- ---- ----- -
1///1'1111,
Dynamom
HydrauliJack
AdjustaCross - B
'/1,'I
=;y.=;""F~~':.";.
~~-~
~L.n:'~
~--;I ,I II I, I: I• I
r--·~~'r-'
rU
'~~: II I
f·~
~~:F==~ i,.li__JlI~---+--~ End Fixt~f~-: -( L ----~
c=== \ I
Fig. 32
, Q
•
•
ENDMQMENT
Collapse,.
.... ....,,,Strength
\ st Yield Line(Determined from White Wash)
END ROTAT10N
Fig. 33
-69-
•
Fig. 42
•
•
)
-7\-
Fig. 43