Embed Size (px)
Citation preview
Peter Jones, CEODavid Bryson, SVP and CFOJohn Vincic, VP of IR and Corporate Communications
Investor Marketing September 2009
Strength to Build the Future
2 September 2009
Forward-looking statementsAll monetary amounts in Canadian dollars unless otherwise noted.
Certain statements made at this meeting and in this presentation contain “forward-looking information”, within the meaning of applicable Canadian securities legislation. Forward-looking information includes, but is not limited to, HudBay's ability to execute its strategy, the ability to secure financing, information with respect to HudBay’sexploration expenditures and activities and the possible success of such exploration activities, including at its Lalor deposit, the estimation of mineral reserves and resources, the realization of mineral estimates, the timing and amount of estimated future production, costs of production, capital expenditures, costs and timing of the development of new deposits and the ability to recommence suspended operations, mineral pricing, reclamation costs, the economic outlook, currency fluctuations, government regulation of mining operations, environmental risks, mine life projections, plans to close HudBay’s copper smelter, the availability of third party concentrate, business and acquisition strategies, and the ability to meet safety and environmental targets. Often, but not always, forward-looking information can be identified by the use of forward-looking words like “plans”, “expects”, or “does not expect”, “is expected”, “budget”, “scheduled”, “estimates”, “forecasts”, “intends”, “understands”, “anticipates”, or “does not anticipate”, or “believes” or variations of such words and phrases or statements that certain actions, events or results “may”, “could”, “would”, “might”, or “will be taken”, “occur”, or “be achieved”. Forward-looking information is based on the opinions and estimates of management as of the date such information is provided and is subject to known and unknown risks, uncertainties and other factors that may cause the actual results, level of activity, performance or achievements of HudBay to be materially different from those expressed or implied by such forward-looking information, including risks associated with the mining industry such as economic factors (including future commodity prices, currency fluctuations and energy prices), failure of plant, equipment, processes and transportation services to operate as anticipated, dependence on key personnel and employee relations, environmental risks, government regulation, actual results of current exploration activities, possible variations in ore grade or recovery rates, permitting timelines, capital expenditures, reclamation activities, land titles, and social and political developments and other risks of the mining industry as well as those risk factors discussed or referred to in HudBay’s Annual Information Form for the year ended December 31, 2008 under the heading “Risk Factors”. Although HudBay has attempted to identify important factors that could cause actual results to differ materially from those contained in forward-looking information, there may be other factors that cause results not to be as anticipated, estimated or intended. There can be no assurance that forward-looking information will prove to be accurate, as actual results and future events could differ materially from those anticipated in such information. Accordingly, readers should not place undue reliance on forward-looking information. HudBay does not undertake to update any forward-looking information, except as required by applicable securities laws, or to comment on analyses, expectations or statements made by third parties in respect of HudBay, its financial or operating results or its securities.
CAUTIONARY NOTE TO UNITED STATES INVESTORS CONCERNING ESTIMATES OF MEASURED, INDICATED AND INFERRED RESOURCESThis presentation uses the terms “Measured”, “Indicated” and “Inferred” resources. United States investors are advised that while such terms are recognized and required by Canadian regulations, the United States Securities and Exchange Commission does not recognize them. “Inferred Mineral Resources” have a great amount of uncertainty as to their existence, and as to their economic and legal feasibility. It cannot be assumed that all or any part of an Inferred Mineral Resource will ever be upgraded to a higher category. Under Canadian rules, estimates of Inferred Mineral Resources may not form the basis of feasibility or other economic studies. United States investors are cautioned not to assume that all or any part of Measured or Indicated Mineral resources will ever be converted into Mineral Reserves. United States investors are also cautioned not to assume that all or any part of an Inferred Mineral Resource exists, or is economically or legally mineable.
3 September 2009
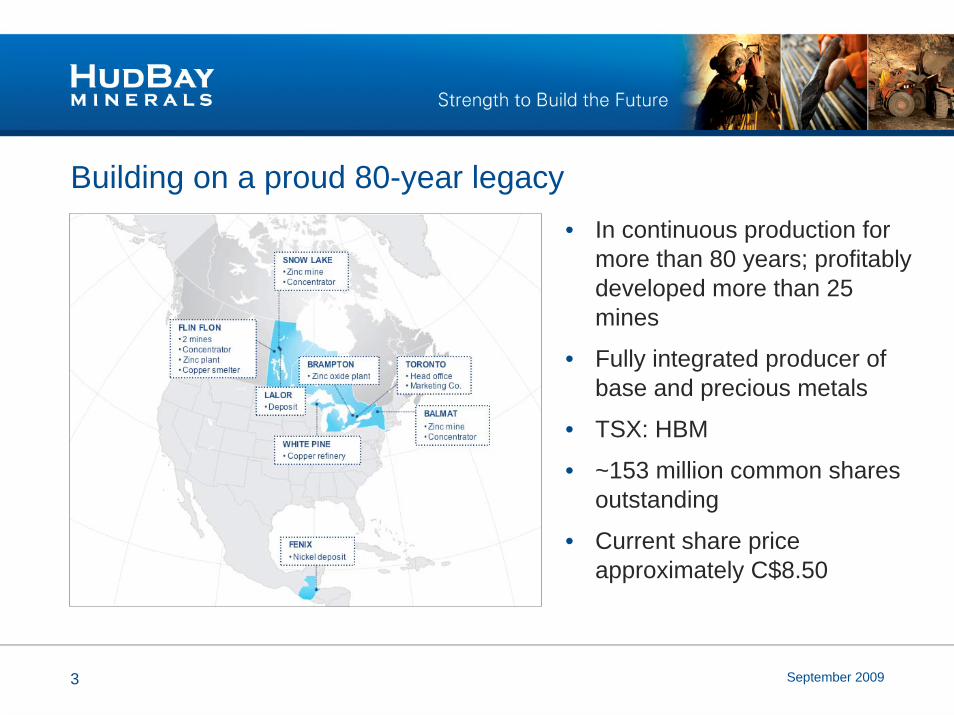
Building on a proud 80-year legacy• In continuous production for
more than 80 years; profitably developed more than 25 mines
• Fully integrated producer of base and precious metals
• TSX: HBM
• ~153 million common shares outstanding
• Current share price approximately C$8.50
4 September 2009
Investment Highlights• Fully integrated base and precious metals producer.
• Portfolio of quality assets.
• Strong management record of operational expertise.
• Long history of exploration success.
• Solid record in safety, health and environmental protection.
• Very strong financial position.
5 September 2009
Key financial results6 months ended
June 30 20096 months ended
June 30 2008
(C$ millions except per share amounts)
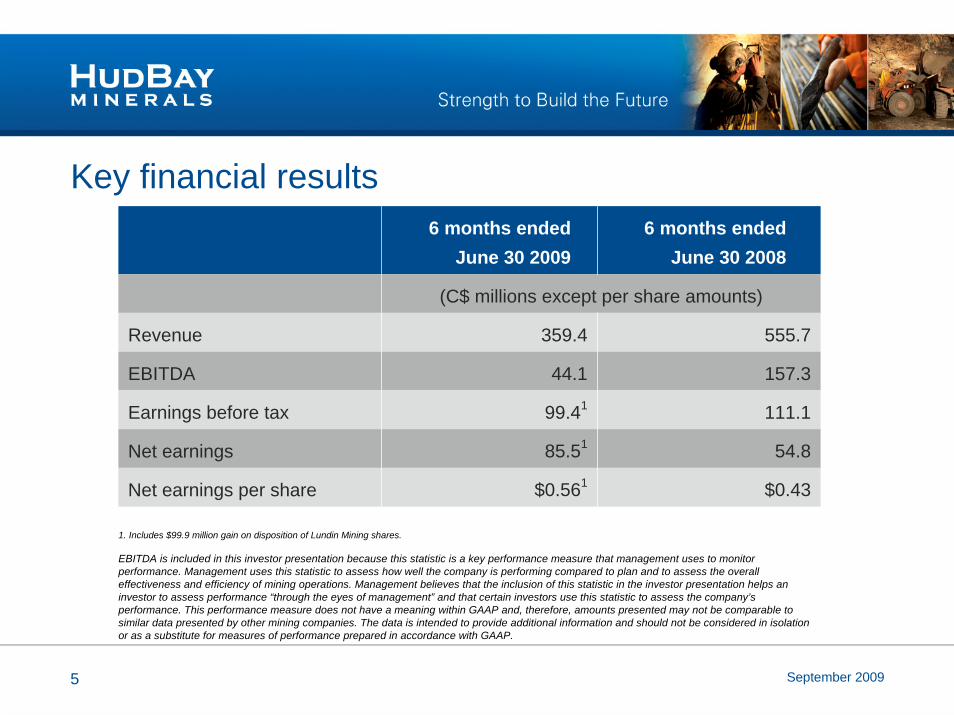
Revenue 359.4 555.7
EBITDA 44.1 157.3
Earnings before tax 99.41 111.1
Net earnings 85.51 54.8
Net earnings per share $0.561 $0.43
1. Includes $99.9 million gain on disposition of Lundin Mining shares.
EBITDA is included in this investor presentation because this statistic is a key performance measure that management uses to monitor performance. Management uses this statistic to assess how well the company is performing compared to plan and to assess the overall effectiveness and efficiency of mining operations. Management believes that the inclusion of this statistic in the investor presentation helps an investor to assess performance “through the eyes of management” and that certain investors use this statistic to assess the company’s performance. This performance measure does not have a meaning within GAAP and, therefore, amounts presented may not be comparable to similar data presented by other mining companies. The data is intended to provide additional information and should not be considered in isolation or as a substitute for measures of performance prepared in accordance with GAAP.
6 September 2009
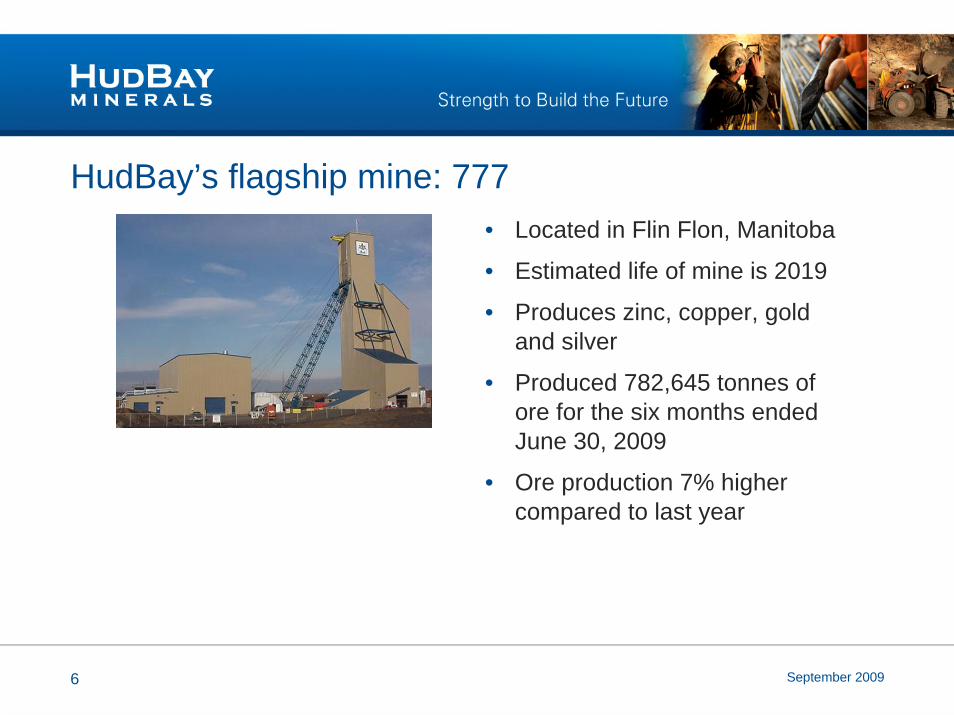
HudBay’s flagship mine: 777• Located in Flin Flon, Manitoba
• Estimated life of mine is 2019
• Produces zinc, copper, gold and silver
• Produced 782,645 tonnes of ore for the six months ended June 30, 2009
• Ore production 7% higher compared to last year
7 September 2009
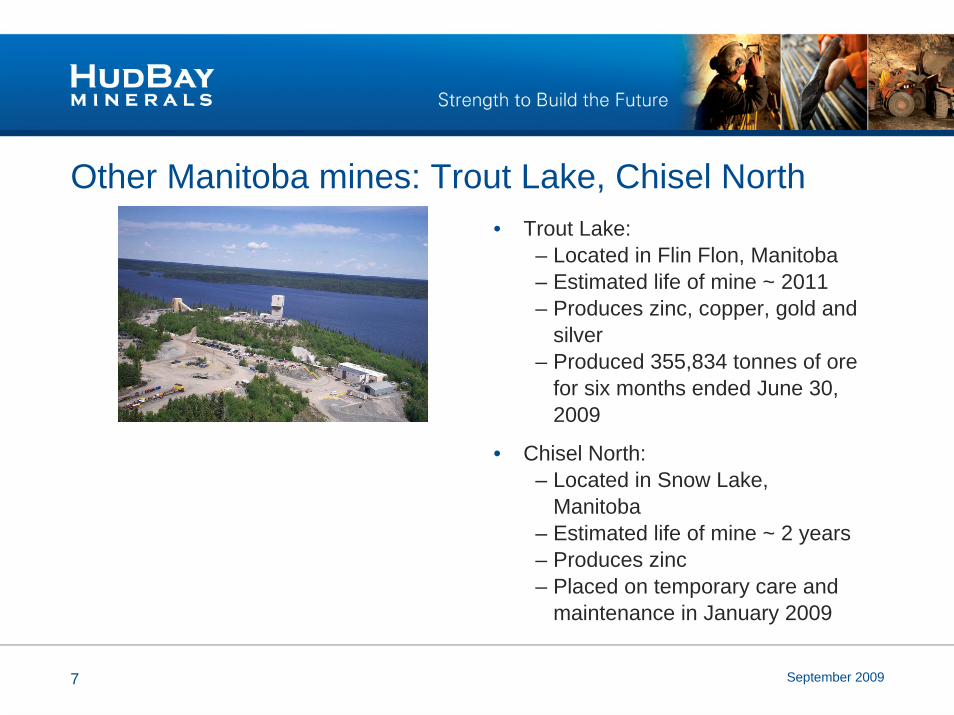
Other Manitoba mines: Trout Lake, Chisel North• Trout Lake:
– Located in Flin Flon, Manitoba– Estimated life of mine ~ 2011– Produces zinc, copper, gold and
silver– Produced 355,834 tonnes of ore
for six months ended June 30, 2009
• Chisel North:– Located in Snow Lake,
Manitoba– Estimated life of mine ~ 2 years– Produces zinc– Placed on temporary care and
maintenance in January 2009
8 September 2009
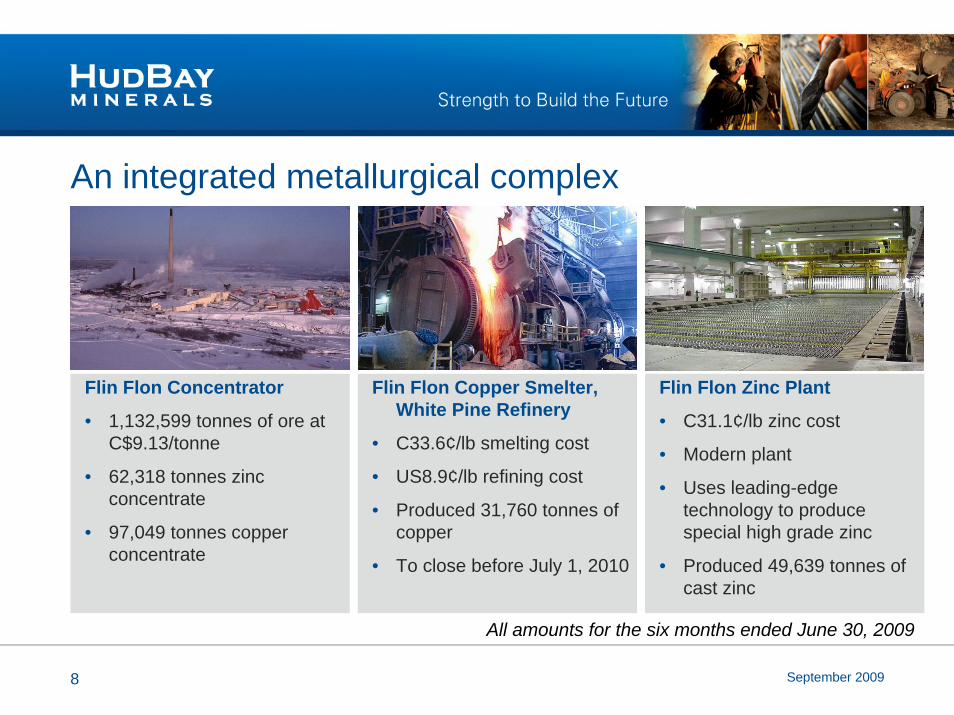
An integrated metallurgical complex
Flin Flon Concentrator
• 1,132,599 tonnes of ore at C$9.13/tonne
• 62,318 tonnes zinc concentrate
• 97,049 tonnes copper concentrate
Flin Flon Copper Smelter, White Pine Refinery
• C33.6¢/lb smelting cost
• US8.9¢/lb refining cost
• Produced 31,760 tonnes of copper
• To close before July 1, 2010
Flin Flon Zinc Plant
• C31.1¢/lb zinc cost
• Modern plant
• Uses leading-edge technology to produce special high grade zinc
• Produced 49,639 tonnes of cast zinc
All amounts for the six months ended June 30, 2009
9 September 2009
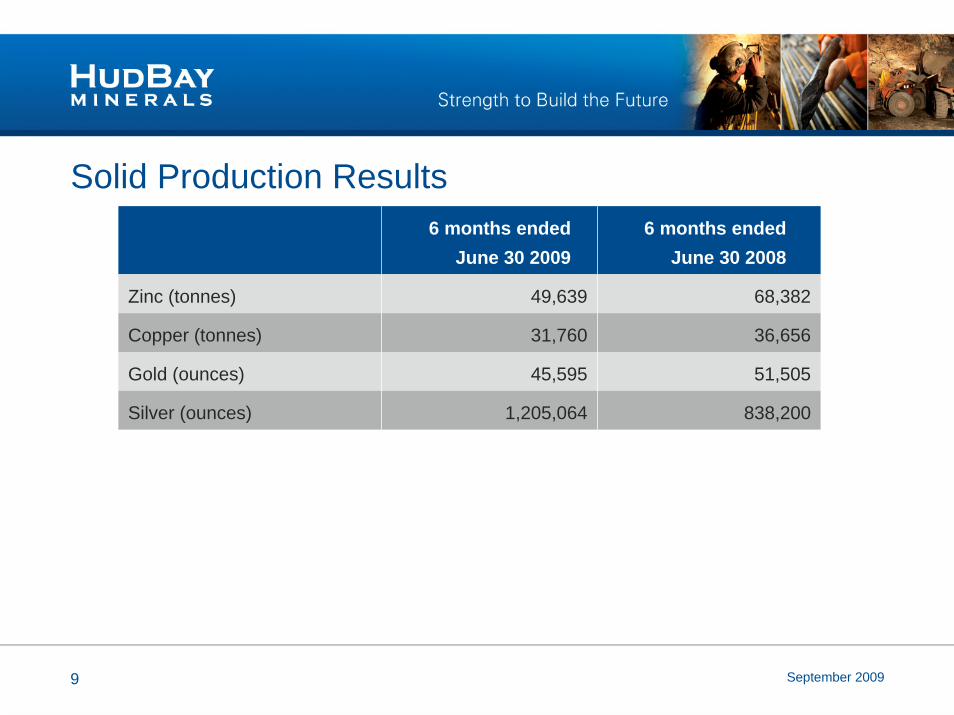
Solid Production Results6 months ended
June 30 20096 months ended
June 30 2008
Zinc (tonnes) 49,639 68,382
Copper (tonnes) 31,760 36,656
Gold (ounces) 45,595 51,505
Silver (ounces) 1,205,064 838,200
10 September 2009
Committed. Sustainable. Responsible.• Substantial contributions to
community initiatives in Manitoba and Guatemala
• Lost time accident rate 1.0 per 200,000 hours worked in 2008, a favourable comparison to industry averages
• HudBay complies with high management standards:
– ISO 14001 and 9001– OHSAS 18001– TSM (Towards Sustainable
Mining)
11 September 2009
Renewed corporate governance• Refined governance framework with updated charters and
policies available on HudBay’s website.
• Shareholder approval required before issuing common shares in excess of 25% of those outstanding to make an acquisition.
• Directors and officers have meaningful share ownershiptargets.
• Director nominees who receive more than 50% of votes as withheld must offer to resign.
• Linking equity based compensation to performance.
12 September 2009
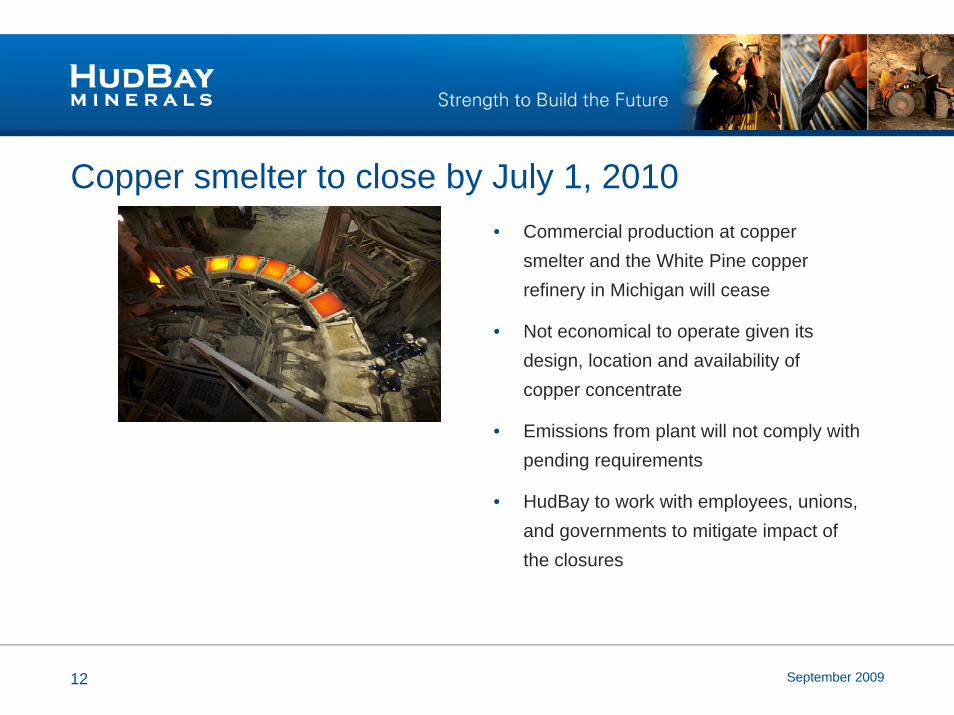
Copper smelter to close by July 1, 2010• Commercial production at copper
smelter and the White Pine copper refinery in Michigan will cease
• Not economical to operate given its design, location and availability of copper concentrate
• Emissions from plant will not comply with pending requirements
• HudBay to work with employees, unions, and governments to mitigate impact of the closures
13 September 2009
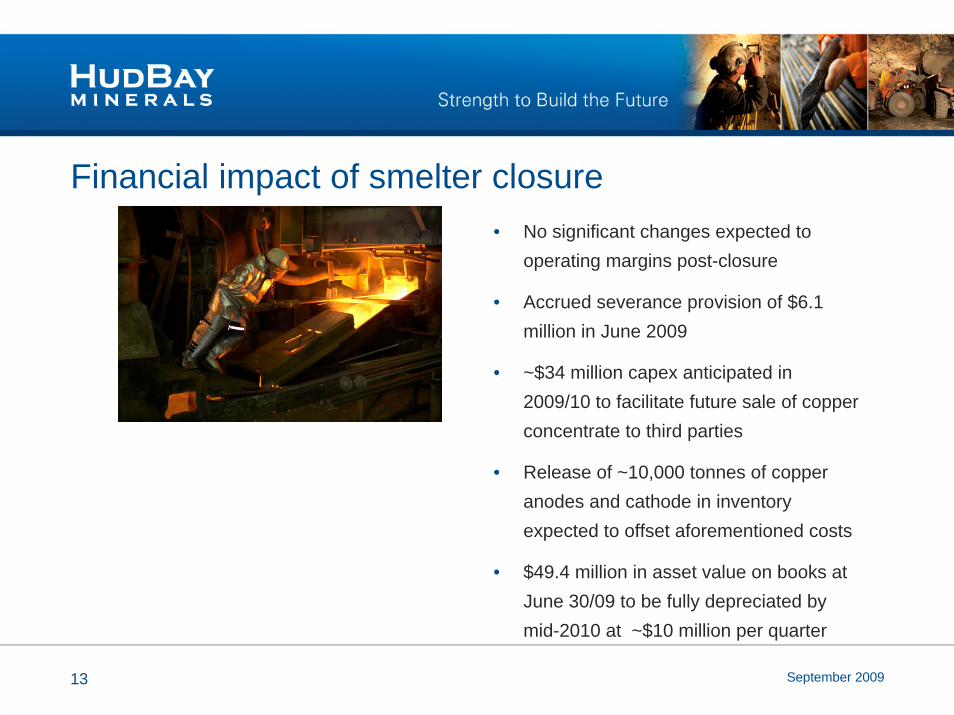
Financial impact of smelter closure• No significant changes expected to
operating margins post-closure
• Accrued severance provision of $6.1 million in June 2009
• ~$34 million capex anticipated in 2009/10 to facilitate future sale of copper concentrate to third parties
• Release of ~10,000 tonnes of copper anodes and cathode in inventory expected to offset aforementioned costs
• $49.4 million in asset value on books at June 30/09 to be fully depreciated by mid-2010 at ~$10 million per quarter
14 September 2009
Excellent project growth pipeline• Lalor Project – Large potential zinc/gold project in Flin Flon
Greenstone Belt near existing operations.
• Fenix Project – Major nickel project in Guatemala.
• Back Forty Project -- Advanced exploration-stage zinc/copper deposit in Michigan that could supply concentrate to Flin Flon
• Reed Lake Project – Small copper deposit in Flin FlonGreenstone belt
15 September 2009
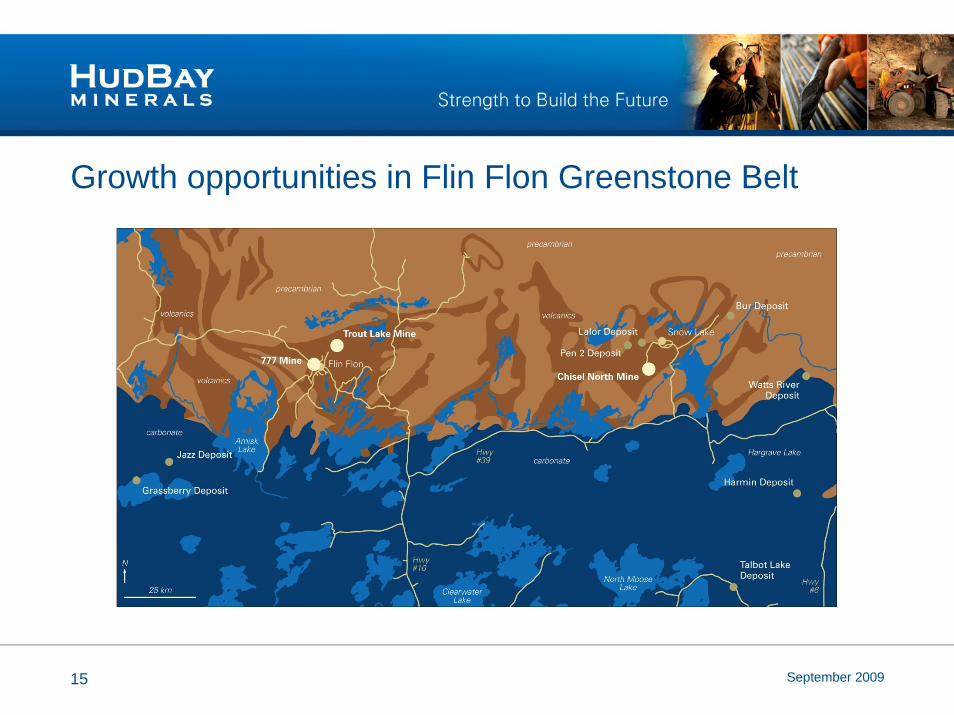
Growth opportunities in Flin Flon Greenstone Belt
16 September 2009
Growing domestically: The Lalor deposit• 100% owned deposit located in Snow Lake, Manitoba.• Winner of PDAC Bill Dennis award for a major Canadian
discovery.• Base metal zones definition drilling complete with updated 43-
101 planed• Gold zone drilling continues to define extent of gold
mineralization, open to the north • Advancing project to the feasibility stage.
17 September 2009
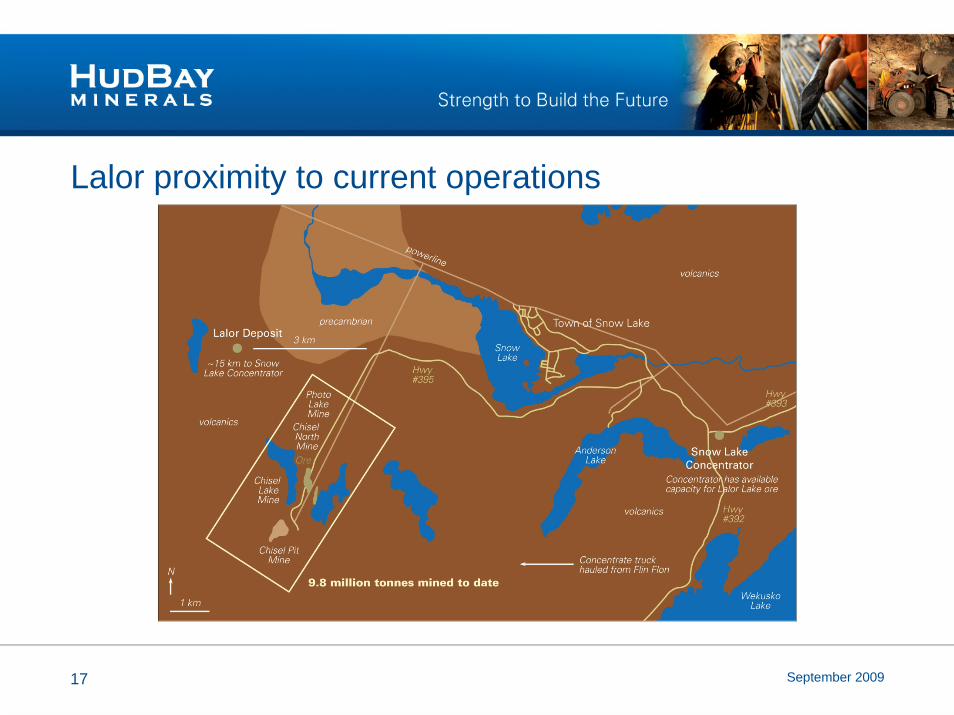
Lalor proximity to current operations
18 September 2009
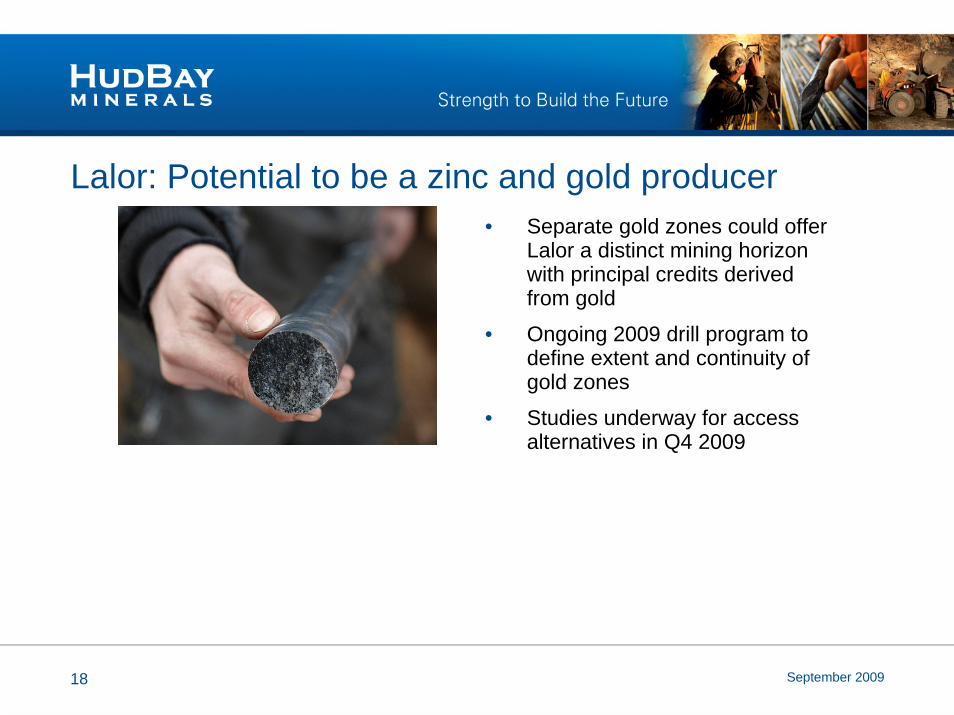
Lalor: Potential to be a zinc and gold producer• Separate gold zones could offer
Lalor a distinct mining horizon with principal credits derived from gold
• Ongoing 2009 drill program to define extent and continuity of gold zones
• Studies underway for access alternatives in Q4 2009
19 September 2009
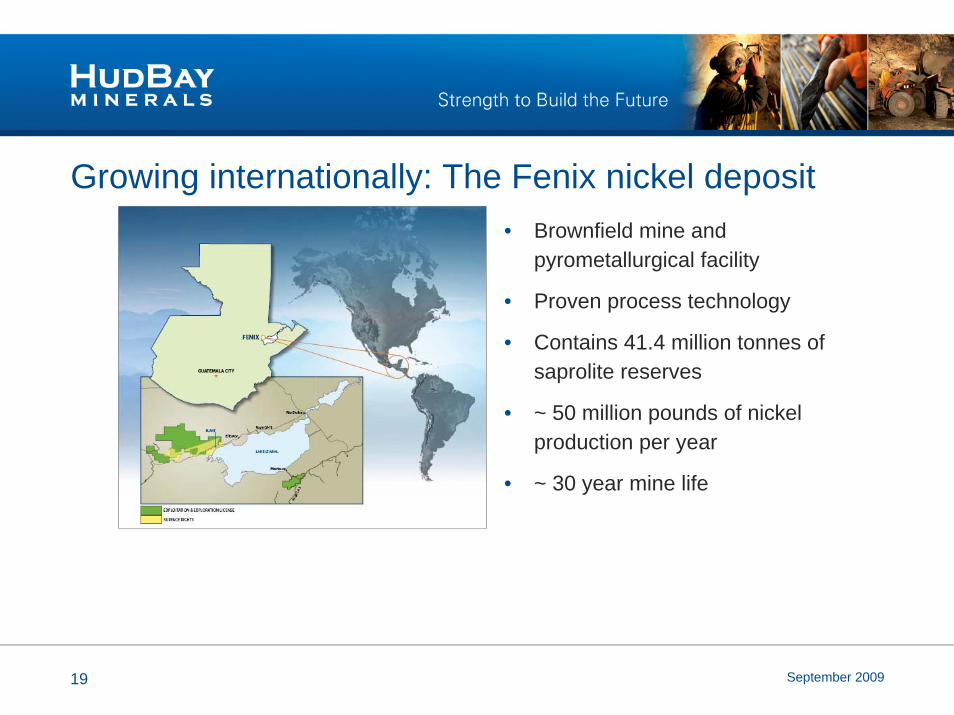
Growing internationally: The Fenix nickel deposit • Brownfield mine and
pyrometallurgical facility
• Proven process technology
• Contains 41.4 million tonnes of saprolite reserves
• ~ 50 million pounds of nickel production per year
• ~ 30 year mine life
20 September 2009
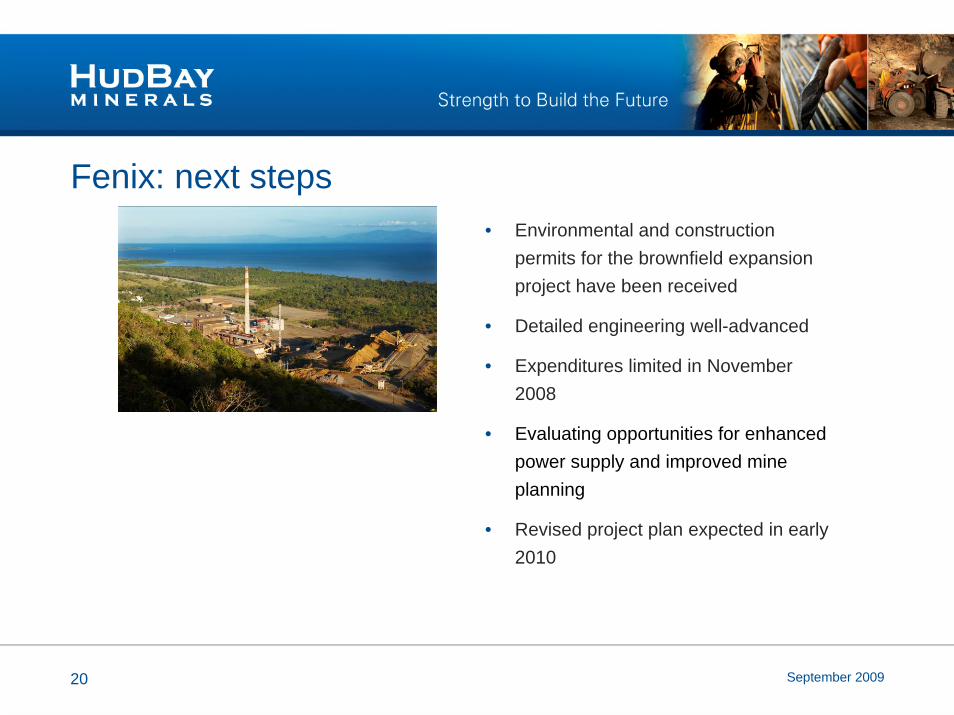
Fenix: next steps • Environmental and construction
permits for the brownfield expansion project have been received
• Detailed engineering well-advanced
• Expenditures limited in November 2008
• Evaluating opportunities for enhanced power supply and improved mine planning
• Revised project plan expected in early 2010
21 September 2009
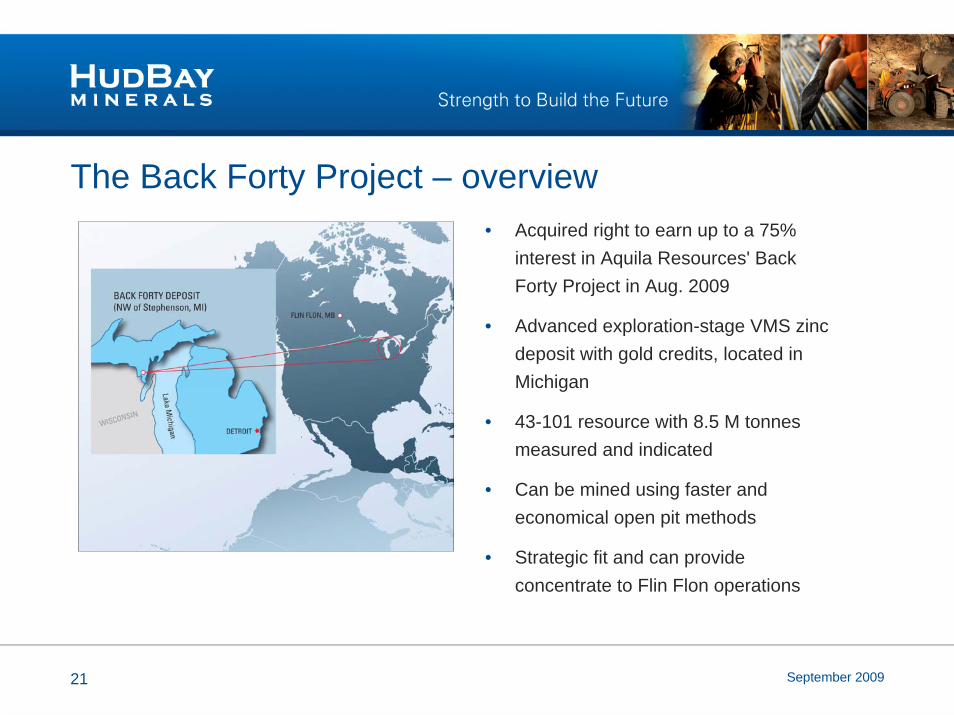
The Back Forty Project – overview• Acquired right to earn up to a 75%
interest in Aquila Resources' Back Forty Project in Aug. 2009
• Advanced exploration-stage VMS zinc deposit with gold credits, located in Michigan
• 43-101 resource with 8.5 M tonnes measured and indicated
• Can be mined using faster and economical open pit methods
• Strategic fit and can provide concentrate to Flin Flon operations
22 September 2009
Strategic context: key strengths• Highly experienced management team and workforce:
– Proven skills across integrated operations, and
– Strong metals marketing and project evaluation capabilities.
• Long history of exploration success.
• Substantial financial capacity.
• Pipeline opportunities for organic growth:
– Advanced stage development projects (Fenix),
– Early stage development projects (Lalor),
– Advanced exploration-stage project (Back Forty) and
– Mid-stage exploration project (Reed Lake)
23 September 2009
Strong cash position• Cash and cash equivalents at June 30, 2009 was $846
million.
• Cash and cash equivalents includes proceeds from the May 2009 sale of HudBay’s 16.7 per cent stake in Lundin Mining.
• The sale realized cash proceeds of approximately $236 million, representing a gain on the purchase price of approximately $100 million.
24 September 2009
Two key strategic initiatives• Optimize our Manitoba operations:
– Exploration,
– Development, and
– Acquisition.
• Grow beyond our principal operating platform in Manitoba:
– Development, and
– Acquisition.
25 September 2009
Optimize our Manitoba operations• Emphasize excellent environment, health and safety practices.
• Maintain cost containment efforts.
• Close copper smelter prior to July 1, 2010.
• Run process plants at full capacity.
• Monitor opportunities to restart Chisel North mine.
• Aggressively pursue Lalor development.
• Continue exploration in the Flin Flon Greenstone Belt.
• Undertake other development and acquisition opportunities as available to leverage existing facilities.
26 September 2009
Grow beyond our Manitoba operating platform• Evaluate Fenix economics with power strategy and consider
construction restart when metal prices and financing make good business sense.
• Pursue work plan for Back Forty project in Michigan with new mine potentially in 3 to 4 years.
• Aggressively pursue acquisition opportunities in Canada and abroad, considering:
– Disciplined approach and targeted criteria,
– Focus on copper, zinc and nickel,
– Accretive transactions,
– Target low risk opportunities, and
– Higher risk targets require higher returns.
27 September 2009
Focused next steps• Decision on advancing Lalor – expected in 2009.
• Copper concentrate sales arrangements – expected in 2009.
• Revised Fenix project plan – expected in early 2010.
• Smelter closure – expected prior to July 1, 2010.
• Reopening Chisel mine – ongoing review.
• Continue to evaluate acquisition opportunities – ongoing.
28 September 2009
HudBay's Investment Highlights• Fully integrated base metal producer.
• Portfolio of high quality assets.
• Strong management record of operational expertise.
• Long history of exploration success.
• Solid record in safety, health and environmental protection.
• Very strong financial position.
29 September 2009
APPENDIX• Reserves and Resources
• Estimated Mineral Reserves – January 1, 2009
• Estimated Inferred Mineral Resources – January 1, 2009
• Pre-development Properties – January 1, 2009
• Lalor – Mineral Resources
• Fenix Nickel Project – Saprolite Mineral Resource Estimates –all deposits (exclusive of Mineral Reserves) – February 13, 2008
30 September 2009
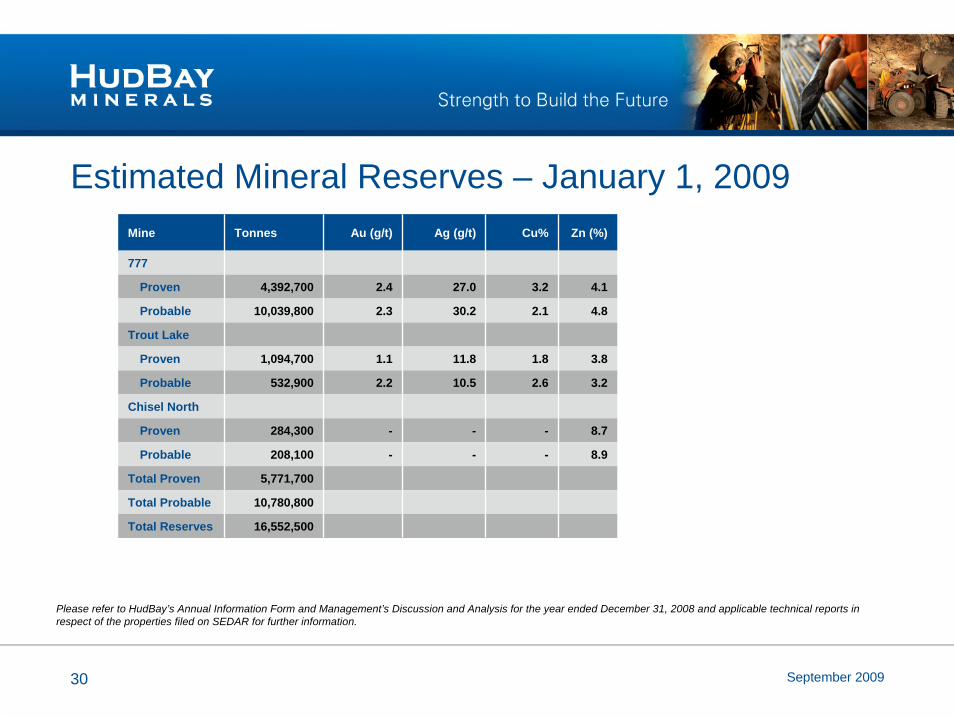
Estimated Mineral Reserves – January 1, 2009Mine Tonnes Au (g/t) Ag (g/t) Cu% Zn (%)
777
Proven 4,392,700 2.4 27.0 3.2 4.1
Probable 10,039,800 2.3 30.2 2.1 4.8
Trout Lake
Proven 1,094,700 1.1 11.8 1.8 3.8
Probable 532,900 2.2 10.5 2.6 3.2
Chisel North
Proven 284,300 - - - 8.7
Probable 208,100 - - - 8.9
Total Proven 5,771,700
Total Probable 10,780,800
Total Reserves 16,552,500
Please refer to HudBay’s Annual Information Form and Management’s Discussion and Analysis for the year ended December 31, 2008 and applicable technical reports in respect of the properties filed on SEDAR for further information.
31 September 2009
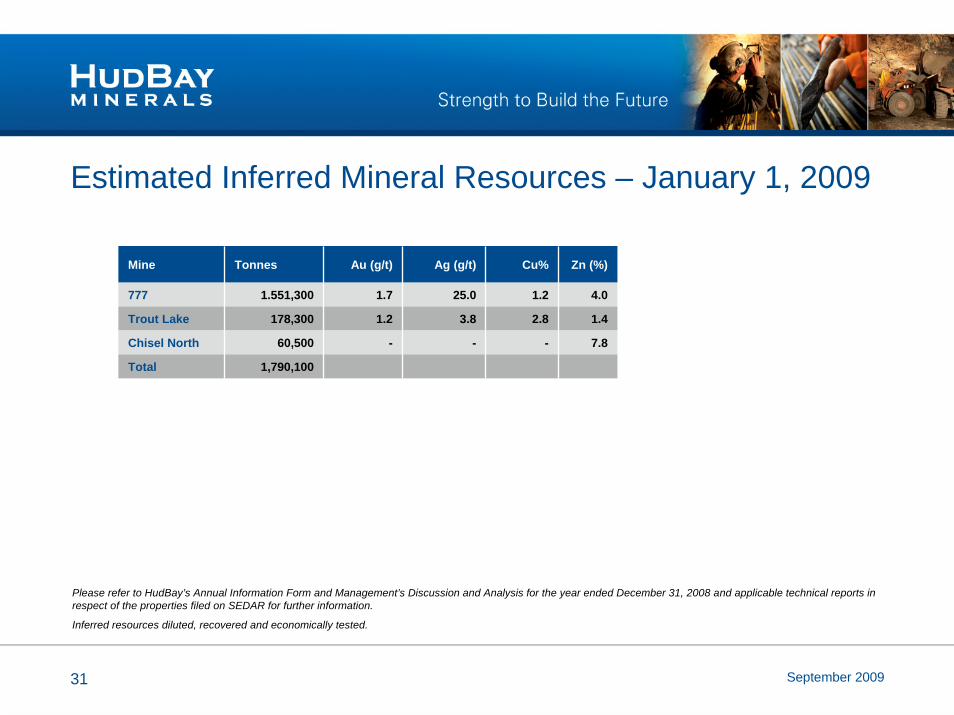
Estimated Inferred Mineral Resources – January 1, 2009
Mine Tonnes Au (g/t) Ag (g/t) Cu% Zn (%)
777 1.551,300 1.7 25.0 1.2 4.0
Trout Lake 178,300 1.2 3.8 2.8 1.4
Chisel North 60,500 - - - 7.8
Total 1,790,100
Please refer to HudBay’s Annual Information Form and Management’s Discussion and Analysis for the year ended December 31, 2008 and applicable technical reports in respect of the properties filed on SEDAR for further information.
Inferred resources diluted, recovered and economically tested.
32 September 2009
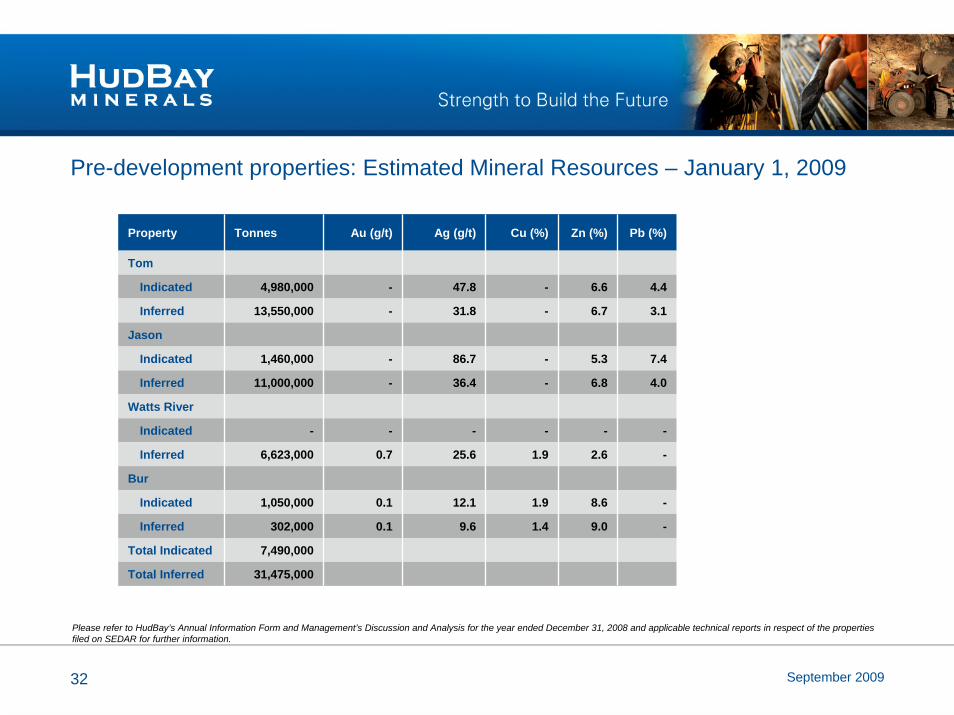
Pre-development properties: Estimated Mineral Resources – January 1, 2009
Property Tonnes Au (g/t) Ag (g/t) Cu (%) Zn (%) Pb (%)
Tom
Indicated 4,980,000 - 47.8 - 6.6 4.4
Inferred 13,550,000 - 31.8 - 6.7 3.1
Jason
Indicated 1,460,000 - 86.7 - 5.3 7.4
Inferred 11,000,000 - 36.4 - 6.8 4.0
Watts River
Indicated - - - - - -
Inferred 6,623,000 0.7 25.6 1.9 2.6 -
Bur
Indicated 1,050,000 0.1 12.1 1.9 8.6 -
Inferred 302,000 0.1 9.6 1.4 9.0 -
Total Indicated 7,490,000
Total Inferred 31,475,000
Please refer to HudBay’s Annual Information Form and Management’s Discussion and Analysis for the year ended December 31, 2008 and applicable technical reports in respect of the properties filed on SEDAR for further information.
33 September 2009
Reserves and Resources – HudBay Minerals• To estimate mineral reserves, measured and indicated mineral resources were first estimated by a 12-step process,
which includes determination of the integrity and validation of the data collected, including confirmation of specific gravity, assay results and methods of data recording. The process also includes determining the appropriate geological model, selection of data and the application of statistical models including probability plots and restrictive kriging to establish continuity and model validation. The resultant estimates of measured and indicated mineral resources are then converted to proven and probable mineral reserves by the application of mining dilution and recovery, as well as the determination of economic viability on a fully costed basis using historical operating costs. Other factors such as depletion from production are applied as appropriate. Long term metal prices, excluding premiums, used to determine economic viability of the 2009 mineral reserves were US $700 oz. gold, US $12.00 oz. silver, US $2.00 lb. copper and US $0.85 lb. zinc.
• Estimated inferred mineral resources within HudBay mines were estimated by a similar 12-step process, used to estimate measured and indicted resources. The inferred mineral resources tabulated above and contained in HudBay mines are compliant with the requirements of NI 43-101 and additionally have had dilution and recovery applied and have been economically tested on a fully costed basis using the same historical costs and long term metal prices as those used for the estimation of mineral reserves.
• The 2009 estimated measured and indicated mineral resource and the estimated inferred mineral resource were prepared under the supervision of Kimberley Proctor, B.Sc., P.Geo, who is employed by Hudson Bay Mining and Smelting Co., Limited (HBMS), a wholly-owned subsidiary of HudBay, as Superintendent, Mining Technical Services and who is a Qualified Person under NI 43-101. The 2009 estimated mineral reserve and the estimated diluted, recovered and economically tested inferred mineral resources have been prepared under the supervision of Robert Carter, B.Sc., P.Eng., who is employed by HBMS as Senior Mines Analyst and who is a Qualified Person under NI 43-101.
• Please refer to HudBay’s Annual Information Form and Management’s Discussion and Analysis for the year ended December 31, 2008 and applicable technical reports in respect of the properties filed on SEDAR for further information.
34 September 2009
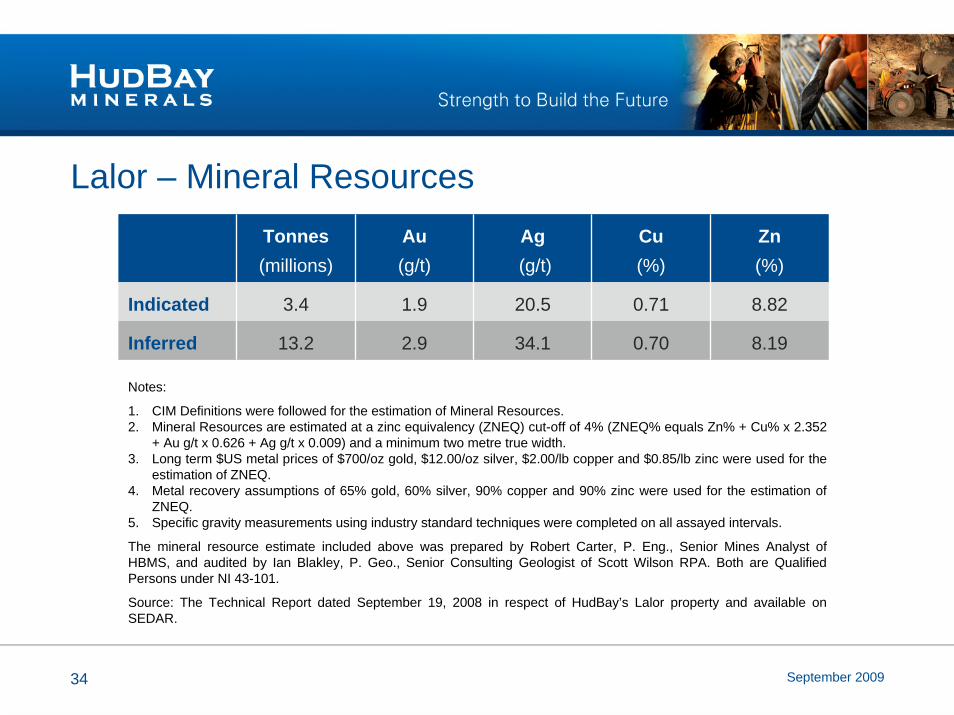
Lalor – Mineral Resources
Notes:
1. CIM Definitions were followed for the estimation of Mineral Resources.2. Mineral Resources are estimated at a zinc equivalency (ZNEQ) cut-off of 4% (ZNEQ% equals Zn% + Cu% x 2.352
+ Au g/t x 0.626 + Ag g/t x 0.009) and a minimum two metre true width. 3. Long term $US metal prices of $700/oz gold, $12.00/oz silver, $2.00/lb copper and $0.85/lb zinc were used for the
estimation of ZNEQ.4. Metal recovery assumptions of 65% gold, 60% silver, 90% copper and 90% zinc were used for the estimation of
ZNEQ.5. Specific gravity measurements using industry standard techniques were completed on all assayed intervals.
The mineral resource estimate included above was prepared by Robert Carter, P. Eng., Senior Mines Analyst of HBMS, and audited by Ian Blakley, P. Geo., Senior Consulting Geologist of Scott Wilson RPA. Both are Qualified Persons under NI 43-101.
Source: The Technical Report dated September 19, 2008 in respect of HudBay’s Lalor property and available on SEDAR.
Tonnes(millions)
Au(g/t)
Ag(g/t)
Cu(%)
Zn(%)
Indicated 3.4 1.9 20.5 0.71 8.82
Inferred 13.2 2.9 34.1 0.70 8.19
35 September 2009
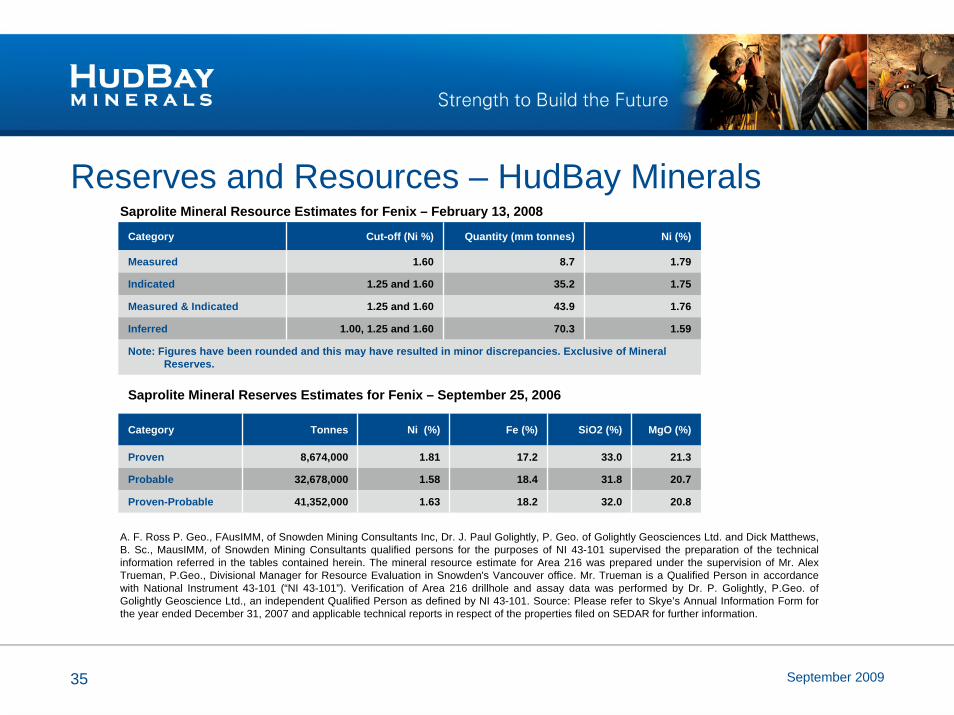
Reserves and Resources – HudBay Minerals
Category Tonnes Ni (%) Fe (%) SiO2 (%) MgO (%)
Proven 8,674,000 1.81 17.2 33.0 21.3
Probable 32,678,000 1.58 18.4 31.8 20.7
Proven-Probable 41,352,000 1.63 18.2 32.0 20.8
A. F. Ross P. Geo., FAusIMM, of Snowden Mining Consultants Inc, Dr. J. Paul Golightly, P. Geo. of Golightly Geosciences Ltd. and Dick Matthews, B. Sc., MausIMM, of Snowden Mining Consultants qualified persons for the purposes of NI 43-101 supervised the preparation of the technical information referred in the tables contained herein. The mineral resource estimate for Area 216 was prepared under the supervision of Mr. Alex Trueman, P.Geo., Divisional Manager for Resource Evaluation in Snowden's Vancouver office. Mr. Trueman is a Qualified Person in accordance with National Instrument 43-101 (“NI 43-101”). Verification of Area 216 drillhole and assay data was performed by Dr. P. Golightly, P.Geo. of Golightly Geoscience Ltd., an independent Qualified Person as defined by NI 43-101. Source: Please refer to Skye’s Annual Information Form for the year ended December 31, 2007 and applicable technical reports in respect of the properties filed on SEDAR for further information.
Category Cut-off (Ni %) Quantity (mm tonnes) Ni (%)
Measured 1.60 8.7 1.79
Indicated 1.25 and 1.60 35.2 1.75
Measured & Indicated 1.25 and 1.60 43.9 1.76
Inferred 1.00, 1.25 and 1.60 70.3 1.59
Note: Figures have been rounded and this may have resulted in minor discrepancies. Exclusive of Mineral Reserves.
Saprolite Mineral Resource Estimates for Fenix – February 13, 2008
Saprolite Mineral Reserves Estimates for Fenix – September 25, 2006

Peter Jones, CEODavid Bryson, SVP and CFOJohn Vincic, VP of IR and Corporate Communications
Investor Marketing September 2009
Strength to Build the Future