Embed Size (px)
Citation preview
Analysis of reinforced concrete slabs
strengthened with textile reinforcement
Non-linear Finite Element Analysis
Master of Science Thesis in the Master’s Programme Structural Engineering and
Building Performance Design
DRAGOS PETRE
IWONA ZAPALOWICZ
Department of Civil and Environmental Engineering
Division of Structural Engineering
Concrete Structures
CHALMERS UNIVERSITY OF TECHNOLOGY
Göteborg, Sweden 2012
Master’s Thesis 2012:87

MASTER’S THESIS 2012:87
Analysis of reinforced concrete slabs
strengthened with textile reinforcement Non-linear Finite Element Analysis
Master of Science Thesis in the Master’s Programme
DRAGOS PETRE
IWONA ZAPALOWICZ
Department of Civil and Environmental Engineering
Division of Structural Engineering
Concrete Structures
CHALMERS UNIVERSITY OF TECHNOLOGY
Göteborg, Sweden 2012
Analysis of reinforced concrete slabs strengthened with textile reinforcement
Non-linear finite element analysis
Master of Science Thesis in the Master’s Programme
DRAGOS PETRE
IWONA ZAPALOWICZ
© DRAGOS PETRE, IWONA ZAPALOWICZ, 2012
Examensarbete / Institutionen för bygg- och miljöteknik,
Chalmers tekniska högskola 2012:87
Department of Civil and Environmental Engineering
Division of Structural Engineering
Concrete Structures
Chalmers University of Technology
SE-412 96 Göteborg
Sweden
Telephone: + 46 (0)31-772 1000
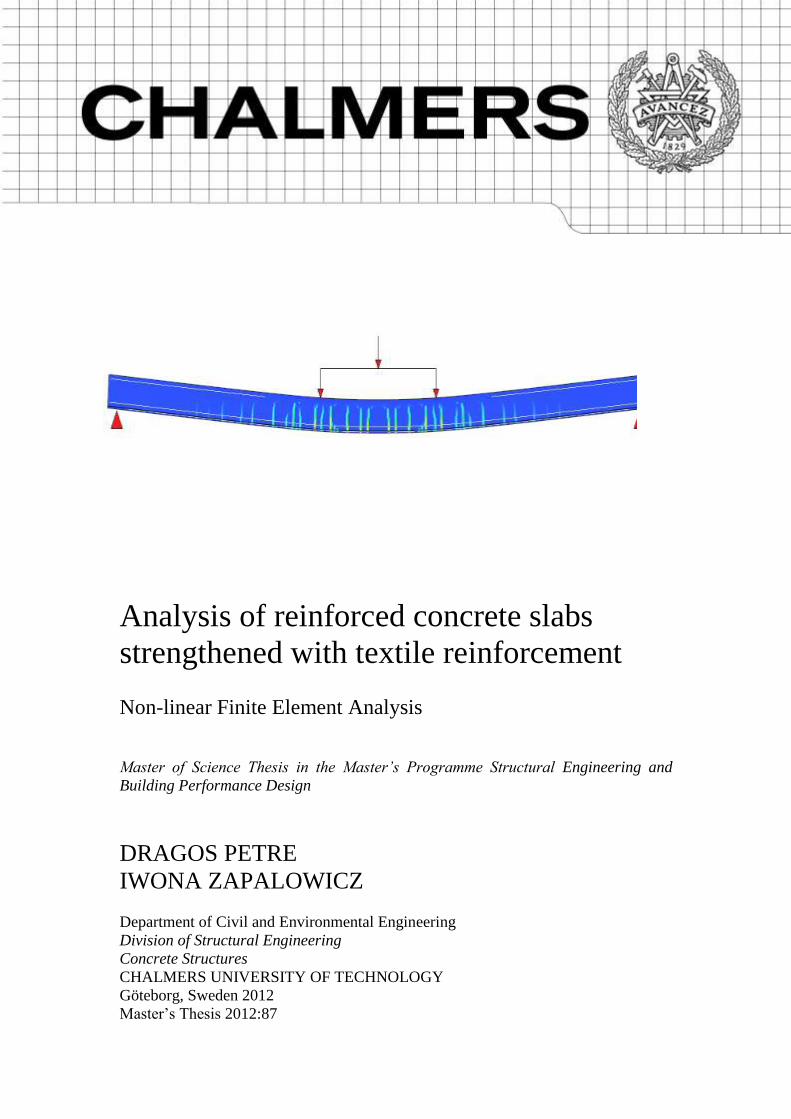
Cover:
Figure: Finite Element Analysis of bending slab at failure.
Chalmers Reproservice / Department of Civil and Environmental Engineering
Göteborg, Sweden 2012
I
Analysis of reinforced concrete slabs strengthened with textile reinforcement
Non-linear finite element analysis
Master of Science Thesis in the Master’s Programme
DRAGOS PETRE
IWONA ZAPALOWICZ
Department of Civil and Environmental Engineering
Division of Division of Structural Engineering
Concrete Structures
Chalmers University of Technology
ABSTRACT
Reinforced Concrete (RC) has become one of the most commonly used materials up
to now. Despite their efficiency, RC structures have posed some disadvantages,
primarily related to durability and corrosion of steel reinforcement. Just over a decade
ago, however, a new concept has been developed with the idea of replacing the steel
reinforcement with alkali-resistant textile fibres resulting in a new composite material
called Textile Reinforced Concrete (TRC). This new construction material offers
important advantages such as resistance to corrosion and thinner and lighter
structures. An application which has become of great interest as of late is the use of
TRC in rehabilitation, such that it can strengthen different structural elements like
slabs, beams or columns.
The main purpose of this report is to model and analyse the effects of strengthening
RC structures using TRC layers, particularly focusing on a TRC strengthened RC
slab. The main method used in this project was numerical modelling based on the
Finite Element Method (FEM). The finite element software DIANA FX+ was
utilized to develop a 2-D non-linear model of a TRC strengthened RC slab. The
verification of the developed model was accomplished by means of experimental and
numerical results from a previous study.
The results showed that the RC slabs strengthened with TRC present significant
increase in the load-bearing capacity compared to the unstrengthened RC slabs.
Furthermore, for a similar load level, the final deflection was reduced in the case of
strengthened slabs. The hand calculations of the ultimate load were consistent with the
numerical results.
This project has shown the efficiency of strengthening RC slabs with TRC layers. The
modelling of the bond-slip relation between concrete and reinforcement using
interface elements lead to a parametric study of this behaviour. This showed the
importance of implementing interface elements instead of embedded reinforcement
with full interaction in order to achieve realistic results. Further analysis of bi-
directional slabs using 3D modelling is recommended for a better representation of
the bonding behaviour between the textile reinforcement and the concrete.
Key words: Non-linear finite element analysis, textile reinforced concrete, slabs,
interface elements, bond-slip behaviour

II
CHALMERS, Civil and Environmental Engineering, Master’s Thesis 2012:87 III
Contents
1 INTRODUCTION 1
1.1 Background 1
1.2 Objectives 2
1.3 Methodology 2
1.4 Limitations 2
2 TEXTILE REINFORCED CONCRETE 3
2.1 Textiles 3 2.1.1. Applicable materials 3 2.1.1 Types of yarns 3
2.2 Concrete matrix 5
2.3 Mechanical behaviour of TRC 5
2.3.1 General load-bearing behaviour 6
2.4 Durability 7
2.5 Bonding behaviour of TRC 7
2.6 Applications of TRC 7
3 TEST DESCRIPTION 9
3.1 The strengthening process 9 3.1.1 Testing setup 10
4 FEM MODEL 13
4.1 General overview 13
4.2 Mesh 15 4.2.1 FE Model with Interface elements 15 4.2.2 Model with full interaction of the reinforcement 15
4.3 Boundary constraints 16
4.4 Materials 17 4.4.1 Concrete 17 4.4.2 Reinforcement 19
4.5 Processing 21
5 RESULTS 22
5.1 Hand calculations 22 5.1.1 Deflection calculations 22
5.1.2 Ultimate moment calculations 22
5.2 FEM results 23 5.2.1 General overview 24
CHALMERS, Civil and Environmental Engineering, Master’s Thesis 2012:87 IV
5.2.2 Behaviour during the loading process 30
5.2.3 Influence of the contact perimeter on the FE models 32 5.2.4 Analysis of failure modes 34
6 CONCLUSIONS AND OUTLOOK 37
6.1 Conclusions 37
6.2 Suggestions for further research 37
7 REFERENCES 38
APPENDIX A 39
APPENDIX B 46
APPENDIX C 48
APPENDIX D 53
CHALMERS, Civil and Environmental Engineering, Master’s Thesis 2012:87 V
Preface
In this study, numerical modelling using Finite Elements Method was effectuated. The
work in this thesis was carried out from January 2012 to June 2012 at the Department
of Civil and Environmental Engineering, Division of Structural Engineering, Concrete
Structures, Chalmers University of Technology.
It was a pleasure to do research at Chalmers under the supervision of M. Sc. Natalie
Williams Portal and Professor Karin Lundgren who also was the examiner. We would
like to thank them for guiding us through the development of this research, for their
engagement and support.
We would also like to thank M. Sc. David Fall and our office colleagues Eyrún
Gestsdóttir and Tómas Guðmundsson for their help.
Göteborg, June 2012
Dragos Petre and Iwona Zapalowicz
CHALMERS, Civil and Environmental Engineering, Master’s Thesis 2012:87 VI
Notations
Roman upper case letters
Ac Cross-section area of concrete in compression
As Cross-section area of bottom longitudinal steel reinforcement
At Cross-section area of textile reinforcement
CP Contact Perimeter
E Young’s modulus
F Force
Fc Concrete force
Fs Steel force
Ft Textile force
FE Finite Element
Gf Fracture energy in tension
Iconcrete Concrete’s moment of inertia
Isteel Steel’s moment of inertia
Itextile Textile’s moment of inertia
Kslab Rigidity of the slab
M Moment
Mu Ultimate moment
P Mid-span load
RC Reinforced Concrete
TRC Textile Reinforced Concrete
Roman lower case letter
a Longer distance from load application point to support
b Shorter distance from load application point to support
bslab Slab’s width
c Concrete cover
ds Distance from the top of the slab to textile layer
dt Distance from the top of the slab to the bottom steel reinforcement
f Ordinate value of modified Thorenfeldt’s curve
fcc Compressive stress
fcf Compressive stress function
fcm Compressive strength
fp Peak stress value
CHALMERS, Civil and Environmental Engineering, Master’s Thesis 2012:87 VII
fy Yield stress of steel reinforcement
h Height of the slab
k Parameter in Thorenfeldt’s curve
l Span of the slab
n Parameter in Thorenfeldt’s curve
q Total self-weight
qconcrete Concrete self-weight
qTRC Textile reinforced concrete self-weight
u Mid-span deflection
uself-weight Mid-span deflection caused by the self-weight
x Height of concrete compressive zone
x’ Corrected height of concrete compressive zone
zs Internal lever arm of steel reinforcement
zt Internal lever arm of textile reinforcement
Greek letters
α Strain in Thorenfeldt’s curve
αp Modified peak strain
Strain coefficient
Stress coefficient
ε Strain
εc Concrete strain
εp Peak strain
εs Steel strain
εp Textile strain
σ Stress
σbond Bond stress
σc Concrete stress
σconcrete Concrete stress
σtextile Textile stress
ρ Density
χ Attenuation coefficient

CHALMERS, Civil and Environmental Engineering, Master’s Thesis 2012:87 VIII
CHALMERS, Civil and Environmental Engineering, Master’s Thesis 2012:87 1
1 Introduction
1.1 Background
Concrete has been used effectively since ancient times. In the middle of 19th
century
Reinforced Concrete (RC) was invented and was greatly influential in the
development of new structures (Bosc et al, 2001). As a result, RC became a very
popular material and nowadays most constructions are made of this composite
material. Despite its popularity, RC structures do pose some disadvantages, which are
related to durability and corrosion of reinforcement. To avoid such deterioration,
sufficient cover layer is needed. In some cases this could lead to a significant increase
in self-weight. For example, the rehabilitation of slabs using RC could have a big
influence on the self-weight of the final structure.
Approximately over one decade ago, researchers had the idea of replacing the steel
reinforcement with alkali-resistant fibres. These high-resistance materials like glass,
carbon and aramid were used to produce these fibres and resulted in a product called
Textile Reinforced Concrete (TRC), see Brameshuber (2006). This new concept
offers important advantages such as resistance to corrosion and thinner and lighter
structures compared with traditional RC structures. These attributes enhance the
overall design of new constructions.
In rehabilitation one can utilize TRC to strengthen different structural elements such
as slabs, beams or columns. Because of its high tensile strength and resistance to
corrosion, TRC can be applied in layers much thinner than possible with RC and thus
the overall weight of the rehabilitated structure is reduced.
Until now, there are very few established laboratories which are dealing with TRC.
The biggest part of research has been undertaken with experimental testing, analytical
and numerical modeling. Currently, there are two centers in Germany which are
leading the research about this topic. One of them is “Textile Reinforced Concrete
(TRC) – Technical Basis for the Development of a New Technology” at RWTH
Aachen University and the other is "Textile Reinforcements for Structural
Strengthening and Repair" at Dresden University of Technology.
Although TRC has been extensively investigated over the past decade or so by these
research centres, there remains much to discover and define regarding its applications,
production, structural design, mechanical and structural behaviour, bonding
characteristics, durability, as well as life cycle.
CHALMERS, Civil and Environmental Engineering, Master’s Thesis 2012:87 2
1.2 Objectives
The main objective of this Master’s Thesis is to model and analyse the effects of
strengthening RC structures using TRC layers. The study particularly focuses on the
modelling of a TRC strengthened RC slab in DIANA FX+ software. A secondary
objective is to validate the developed model by means of experimental and numerical
results from literature. An investigation of the sensitivity of critical modelling
parameters is also included. Lastly, the applicability of this state-of-the-art
strengthening method in new and existing structures is discussed in this study.
1.3 Methodology
The main method used in this project is numerical modelling based on the Finite
Element Method (FEM). The finite element software DIANA FX+ was utilized to
develop a 2-D non-linear model of a TRC strengthened RC slab. The verification of
the developed model was accomplished by means of experimental and numerical
results from a previous study. Thereafter, the sensitivity of critical modelling
parameters was evaluated.
1.4 Limitations
One of the main limitations which exists in this project is the fact that experimental
testing was not possible during the time of this study and due to this reason,
experimental results from literature was used for model verification.
As such, these experimental results dictated the characteristics of the present model
(i.e. shape, loads, material properties, boundary constraints, bond slip behaviour, etc.),
as well as the researched failure type of bending.
Another limitation is that the shear behaviour was not investigated as only bending
failure is focused on in the developed model. This aspect is due to the outcome of the
experimental results, where all specimens were observed to fail in bending (e.g.
fracture of textile layers). It should be noted, however, that no bond failure (e.g.
delamination) was observed in the results. Bond slip behaviour between the
reinforcement and the concrete matrix were taken into account in the modelling.
CHALMERS, Civil and Environmental Engineering, Master’s Thesis 2012:87 3
2 Textile Reinforced Concrete
An alternative strengthening material that has become of interest as of late is Textile
Reinforced Concrete (TRC). This state-of the art composite material can be used in
new structures, as well as in strengthening of beams, slabs, columns and even walls. It
is of particular interest to discuss TRC as a strengthening material in this study.
Some alternatives to TRC as a strengthening solution, are the so called Fibre
Reinforced Concrete (FRC). In FRC, the principle is to insert short fibres in the
concrete matrix. These fibres could be metallic (steel), mineral (glass), natural
(cellulose, Jute, etc.) or polymeric (acrylic, aramid, carbon, nylon, etc.), according to
Davis (2007). One important difference between TRC and FRC is that the short fibres
in FRC are oriented in all directions, when the textile fibres in TRC behave like a
normal steel reinforcement, with the exact orientation to support the efforts. This
results in higher strengths for TRC than in FRC.
Another advantage of TRC in comparison with RC is that the reinforcement, the fibre
mesh, is lighter and easier to work with. One can work with the textile mesh easily,
bend it by hand or use it to wrap structural elements such as beams or columns. In
comparison with working with the steel reinforcement bars, TRC is easier to work
with and provides a rapid application on elements which are not strengthened.
A description of TRC is given in this section. Firstly, the type of fibres, concrete
matrix and technologies of production are presented. Thereafter, mechanical
behaviour, durability and bond behaviour are discussed. The applicability of TRC as a
strengthening solution is explored in the end.
2.1 Textiles
2.1.1. Applicable materials
Textile fibres have a great influence on the strength of composite materials, their
properties as well as their magnitude. Materials which are most applicable for use in
TRC structures are alkali-resistant glass (AR-glass), carbon and aramid fibres.
Besides the aforementioned materials, basalt, steel and polymers fibres can also be
used. Steel fibre yarns are however not economically feasible and are thus not
exploited (Brameshuber, 2006).This project will particularly focus on the carbon
fibres, because they were used in the referenced experimental testing of the slab
conducted by Schladitz et al (2012). The reason why the carbon fibres were preferred
relies on their superior tensile strength, which is more appropriate for testing a full-
scale slab. As such, this allows the research to come closer to reality.
2.1.1 Types of yarns
Textile reinforcement is composed of fibres constructed into yarns. The fabrication
method and applied size (i.e. fineness of yarn) have a significant influence on the
interaction between the filaments (i.e. adhesion) (Brameshuber, 2006). Thus, the
mechanical properties of a fibre filament decrease when in the form of a yarn.
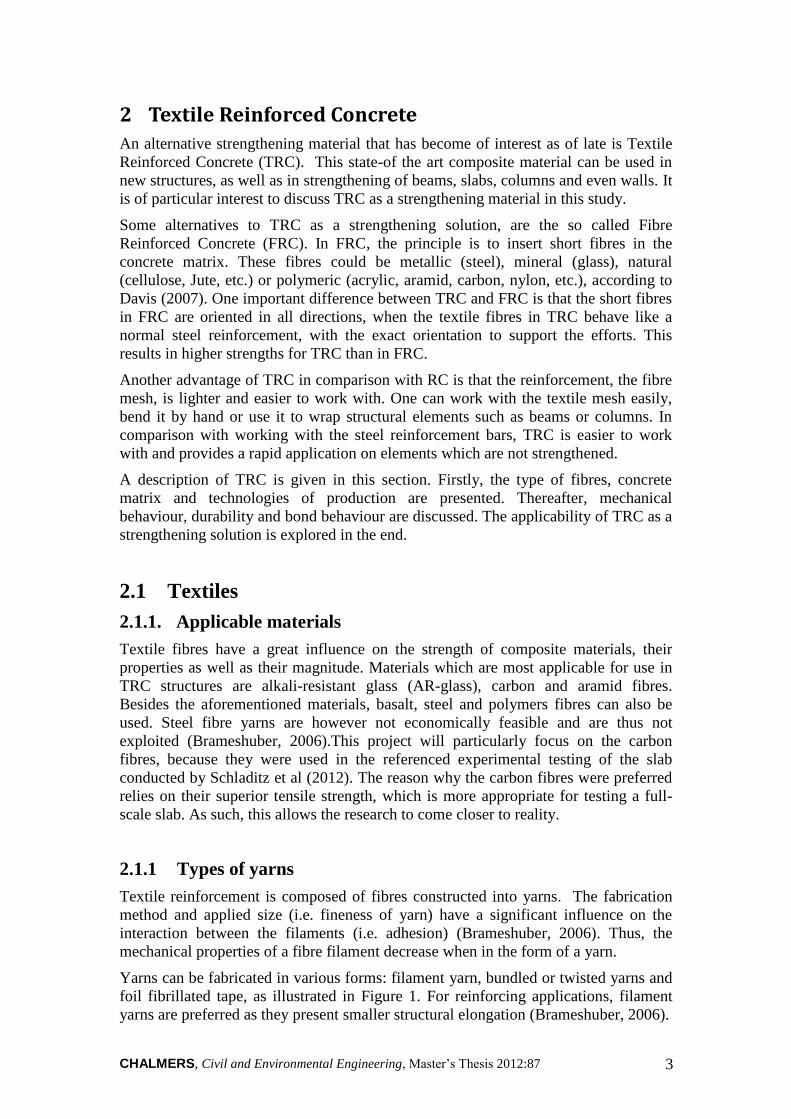
Yarns can be fabricated in various forms: filament yarn, bundled or twisted yarns and
foil fibrillated tape, as illustrated in Figure 1. For reinforcing applications, filament
yarns are preferred as they present smaller structural elongation (Brameshuber, 2006).
CHALMERS, Civil and Environmental Engineering, Master’s Thesis 2012:87 4
Figure 1 Types of yarns: a) Filament yarn b) Bundled yarn c) Foil fibrillated
type (Brameshuber,2006).
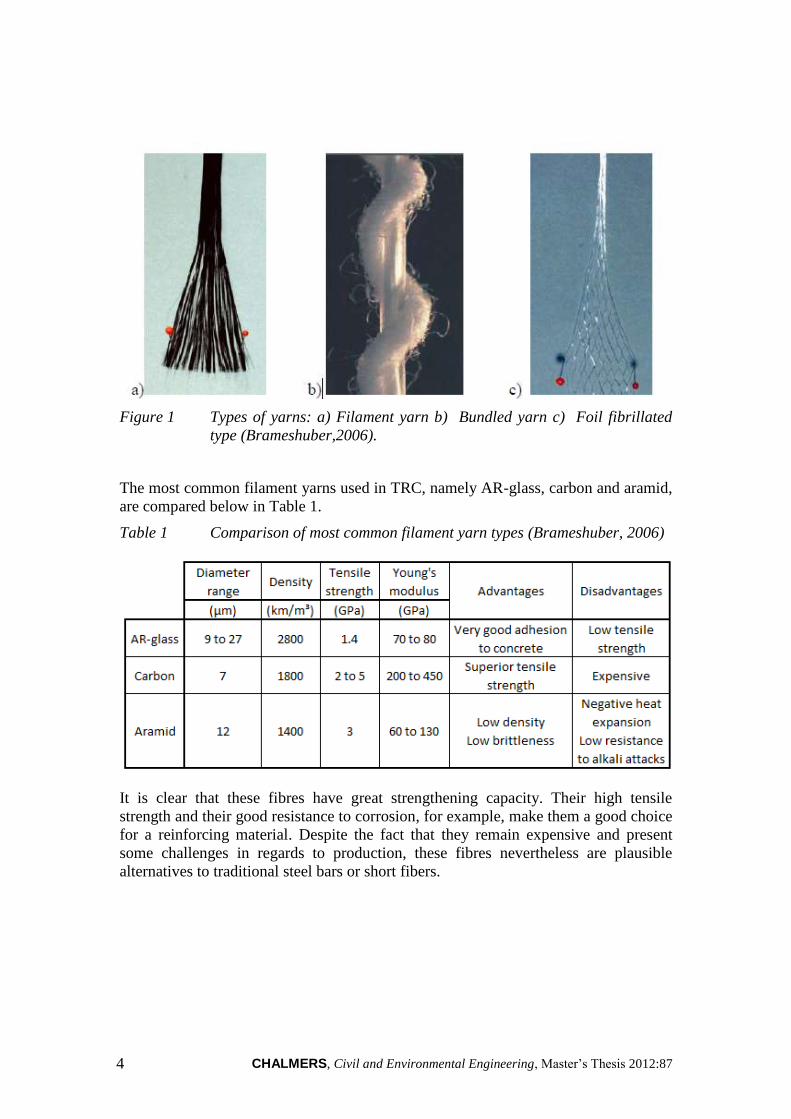
The most common filament yarns used in TRC, namely AR-glass, carbon and aramid,
are compared below in Table 1.
Table 1 Comparison of most common filament yarn types (Brameshuber, 2006)
It is clear that these fibres have great strengthening capacity. Their high tensile
strength and their good resistance to corrosion, for example, make them a good choice
for a reinforcing material. Despite the fact that they remain expensive and present
some challenges in regards to production, these fibres nevertheless are plausible
alternatives to traditional steel bars or short fibers.
CHALMERS, Civil and Environmental Engineering, Master’s Thesis 2012:87 5
2.2 Concrete matrix
The concrete used for TRC needs to fulfil demands, mechanical properties and
durability, which are necessary to get proper composite material behaviour. Usually
the maximum grain size used is less than 2mm, thus the concrete matrix is also called
fine-grained concrete.
Matrix composition should have chemical compatibility with textile reinforced
materials, consistency for full penetration, planned production process and mechanical
properties for load-carrying capacity of a TRC element.
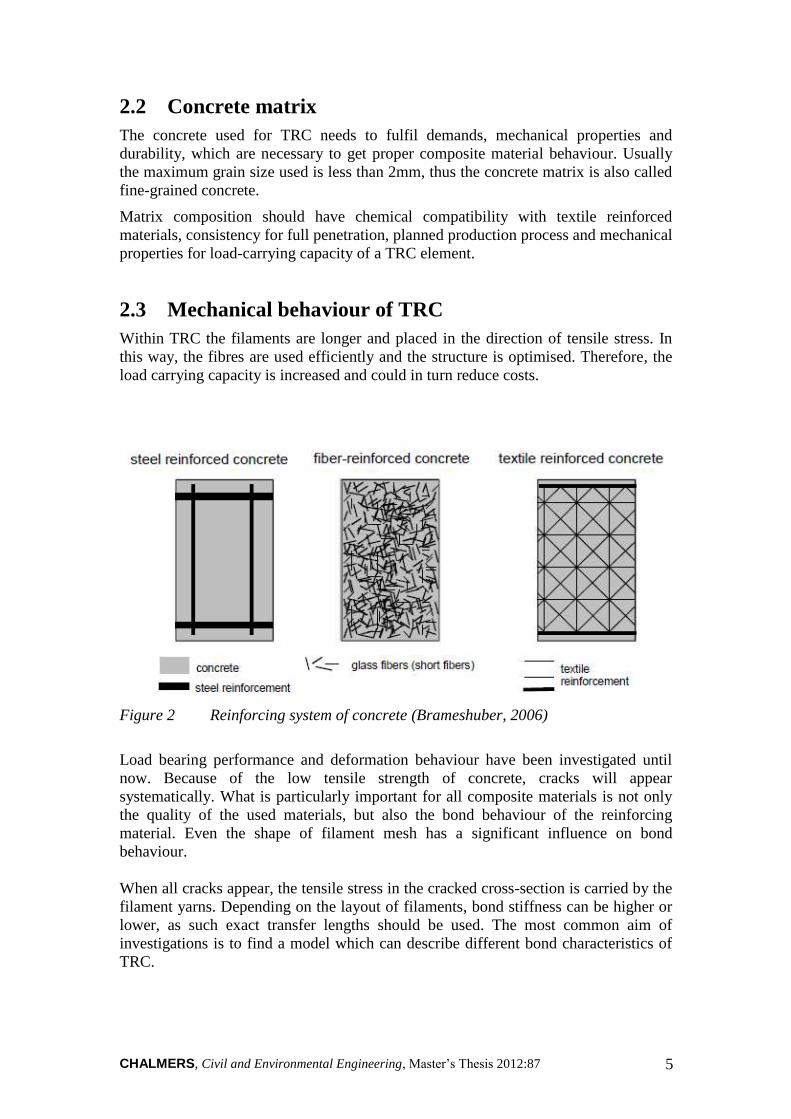
2.3 Mechanical behaviour of TRC
Within TRC the filaments are longer and placed in the direction of tensile stress. In
this way, the fibres are used efficiently and the structure is optimised. Therefore, the
load carrying capacity is increased and could in turn reduce costs.
Figure 2 Reinforcing system of concrete (Brameshuber, 2006)
Load bearing performance and deformation behaviour have been investigated until
now. Because of the low tensile strength of concrete, cracks will appear
systematically. What is particularly important for all composite materials is not only
the quality of the used materials, but also the bond behaviour of the reinforcing
material. Even the shape of filament mesh has a significant influence on bond
behaviour.
When all cracks appear, the tensile stress in the cracked cross-section is carried by the
filament yarns. Depending on the layout of filaments, bond stiffness can be higher or
lower, as such exact transfer lengths should be used. The most common aim of
investigations is to find a model which can describe different bond characteristics of
TRC.
CHALMERS, Civil and Environmental Engineering, Master’s Thesis 2012:87 6
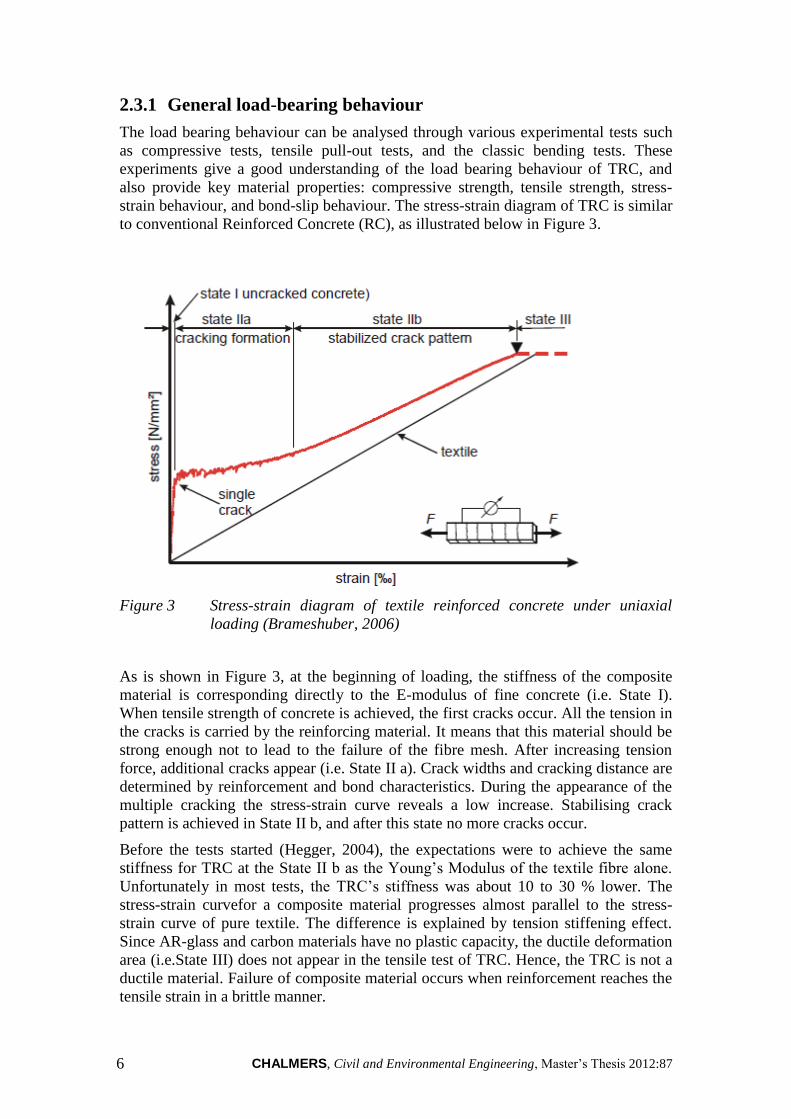
2.3.1 General load-bearing behaviour
The load bearing behaviour can be analysed through various experimental tests such
as compressive tests, tensile pull-out tests, and the classic bending tests. These
experiments give a good understanding of the load bearing behaviour of TRC, and
also provide key material properties: compressive strength, tensile strength, stress-
strain behaviour, and bond-slip behaviour. The stress-strain diagram of TRC is similar
to conventional Reinforced Concrete (RC), as illustrated below in Figure 3.
Figure 3 Stress-strain diagram of textile reinforced concrete under uniaxial
loading (Brameshuber, 2006)
As is shown in Figure 3, at the beginning of loading, the stiffness of the composite
material is corresponding directly to the E-modulus of fine concrete (i.e. State I).
When tensile strength of concrete is achieved, the first cracks occur. All the tension in
the cracks is carried by the reinforcing material. It means that this material should be
strong enough not to lead to the failure of the fibre mesh. After increasing tension
force, additional cracks appear (i.e. State II a). Crack widths and cracking distance are
determined by reinforcement and bond characteristics. During the appearance of the
multiple cracking the stress-strain curve reveals a low increase. Stabilising crack
pattern is achieved in State II b, and after this state no more cracks occur.
Before the tests started (Hegger, 2004), the expectations were to achieve the same
stiffness for TRC at the State II b as the Young’s Modulus of the textile fibre alone.
Unfortunately in most tests, the TRC’s stiffness was about 10 to 30 % lower. The
stress-strain curvefor a composite material progresses almost parallel to the stress-
strain curve of pure textile. The difference is explained by tension stiffening effect.
Since AR-glass and carbon materials have no plastic capacity, the ductile deformation
area (i.e.State III) does not appear in the tensile test of TRC. Hence, the TRC is not a
ductile material. Failure of composite material occurs when reinforcement reaches the
tensile strain in a brittle manner.
CHALMERS, Civil and Environmental Engineering, Master’s Thesis 2012:87 7
2.4 Durability
The study of durability concerning TRC is relatively new compared with FRC, which
has been the subject of considerable academic and commercial concern for the last 30
years. However, studies show that the problems related to durability are similar in
TRC and FRC according to Brameshuber (2006).
Analysing the durability of FRC or TRC is a very complex process because many
variables have to be taken into account. For example the bond between the fibres and
the concrete matrix is conditioned by the chemical treatment of the fibres, the type
cement used, and its behaviour in time is strongly related to these aspects.
One big advantage related to durability is TRC’s resistance to corrosion. This aspect
becomes important when, for example, a financial analysis is made in the conceptual
phase. Even though TRC still is a fairly expensive option, durability and maintenance
aspects are certainly not to be ignored.
Most common application is to use TRC for rehabilitation, however bridges made of
pure TRC exists, as the pedestrian bridge done in Dresden, Germany in 2005 (
Brameshuber,2006). Approximately seven years of tests and observations indicate
only a beginning of the lifetime which is expected, but conclusions about durability
are yet to be revealed.
2.5 Bonding behaviour of TRC
Many studies were dedicated to the bond behaviour within TRC. It is very important
to completely understand the interaction between the textile fibres and the fine
grained concrete, in order to foresee the behaviour of the entire structure, and
eventually its failure.
In the process of strengthening RC structures with TRC, the bond between the old
concrete and the new fine-grained concrete is also analysed according to Ortlepp et al
(2006).
The interface between textiles fibres and concrete can be described using bond-slip
diagrams. These diagrams are the result of different tests, the most popular one being
the pull-out test. In this kind of tests, uniaxial tensile loading is applied to TRC
specimens, and the shear stress as well as the slip are analysed. For more details, refer
to Häussler-Combe et al (2007).
This project focuses on the analysis of RC slabs strengthened with TRC. In order to
have realistic results, the interaction between the reinforcement and the concrete body
needs to be modelled using a bond-slip diagram.
2.6 Applications of TRC
TRC can be used in a very large variety, in new structures as well as in strengthening
and rehabilitation purposes.
Firstly, TRC can be used as a non-bearing element in:
- facade panels
CHALMERS, Civil and Environmental Engineering, Master’s Thesis 2012:87 8
- parapet sheets
- wastewater treatment plants
- noise protection wall systems
- water protection wall systems
- basement sealing
- exterior insulation systems
Secondly, the use of TRC includes some load bearing applications, such as:
- textile reinforced bridges, see Brameshuber (2006) and Groz-Beckert (2010)
- integrated formwork element for steel reinforced concrete floors
- integrated formwork element for steel reinforced walls
- balcony floor sheet
- diamond-shaped framework
In rehabilitation, TRC has proven high efficiency in strengthening structural parts of a
building.
Due to its high tensile strength, TRC can be effectively used in strengthening
elements in bending such as slabs or beams. By applying several layers of TRC at the
bottom of the element which is strengthened, the resistance in flexural loading is
substantially increased. For details, see Häussler-Combe et al (2007) and Bruckner
(2006).
Also, by wrapping the core of the beams with layers of TRC, the shear performance of
the entire structure is enhanced. Studies by Bruckner et al (2008) also include
strengthening of columns using TRC.
Focusing on the strengthening of slabs, the method used is very simple: the bottom
face of the slab is pre-wetted and roughened by sand-blasting and then the first layer
of fine-grained concrete is applied. The application of this latter material can be
effectuated by spraying or just by simple hand lay-up. The textile mesh is applied by
hand on the fresh fine-grained concrete. This process of alternating fine-grained
concrete and textile mesh can be repeated until the desired amount of reinforcement is
applied under the surface of the slab. With this technique, the slab is strengthened
with a small amount of concrete, which gives a small self-weight.
CHALMERS, Civil and Environmental Engineering, Master’s Thesis 2012:87 9
3 Test description
The tests chosen to validate the developed FEM model have been executed by
researchers from Dresden Technical University in Germany. These tests and the
analysis of their results are presented in Schladitz et al (2012). The reason why these
particular tests were chosen is that they gave full details about the testing set up, and
the results were validated by analytical and numerical analysis. Another advantage of
these tests is the size of the tested slabs, which was comparable with the size of full
scale slabs. This gives a realistic approach to the numerical model.
The purpose of these tests was to investigate the influence of TRC in strengthening
RC slabs. Variation between different numbers of TRC layers was followed during
tests, see Schladitz et al (2012). Due to the high degree of reinforcement of the slabs,
a very good tensile strength was needed, so carbon fibres were preferred to glass
fibres.
3.1 The strengthening process
For the experimental research five items of reinforced slabs were cast in the
laboratory of Dresden Technical University in Germany, as described in Schladitz et
al (2012). The TRC has the anticipated role of improving the bending capacity of the
slabs, therefore it is applied in the critical points, where the tensile stresses have
maximum values, at the bottom of the slab.
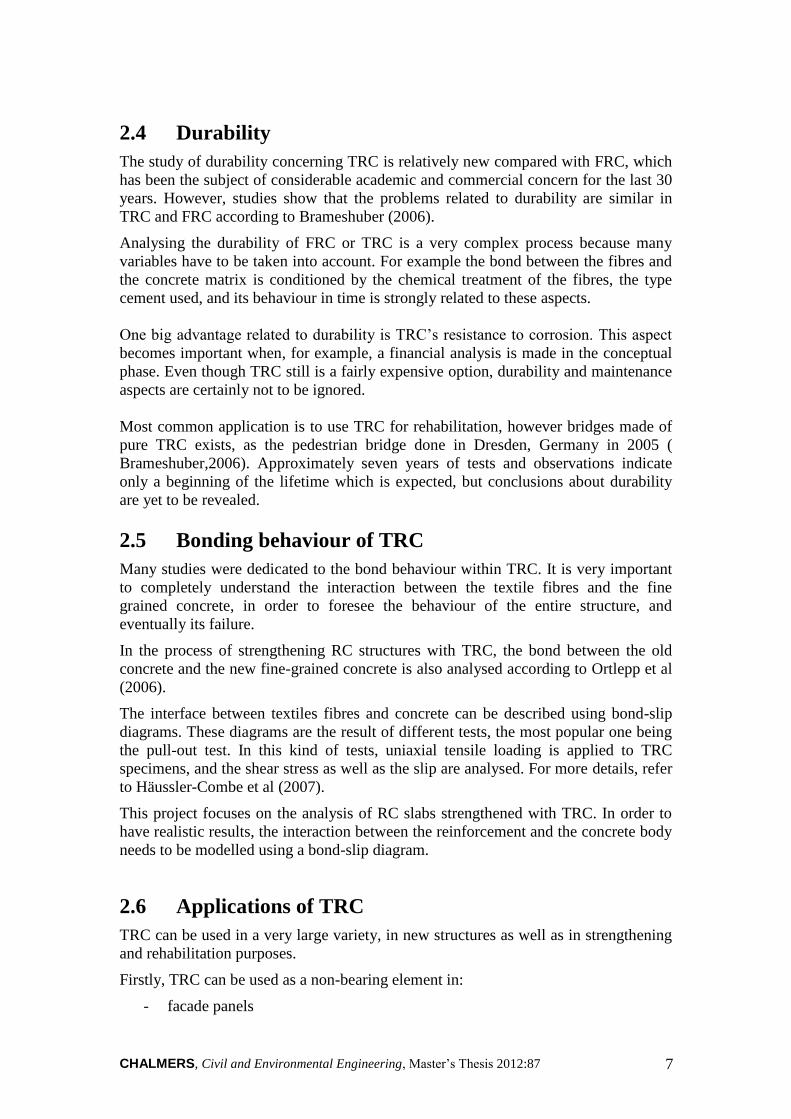
From a total of 5 RC slabs, one slab was kept unstrengthened as a reference and the
other four were strengthened with 1, 2, 3 and 4 layers of TRC.
Figure 4 Application of TRC layers.
The application of TRC layers was done by hand lay-up, on the bottom face of the
slabs, mounted vertically, as shown above in Figure 4. A layer of 3mm fine-grained
concrete was applied by hand on the slab surface which was pre-wetted and
roughened by sand blasting, Thereafter, the textile mesh alternating with the 3mm
fine-grained concrete were applied according to Figure 5.
CHALMERS, Civil and Environmental Engineering, Master’s Thesis 2012:87 10
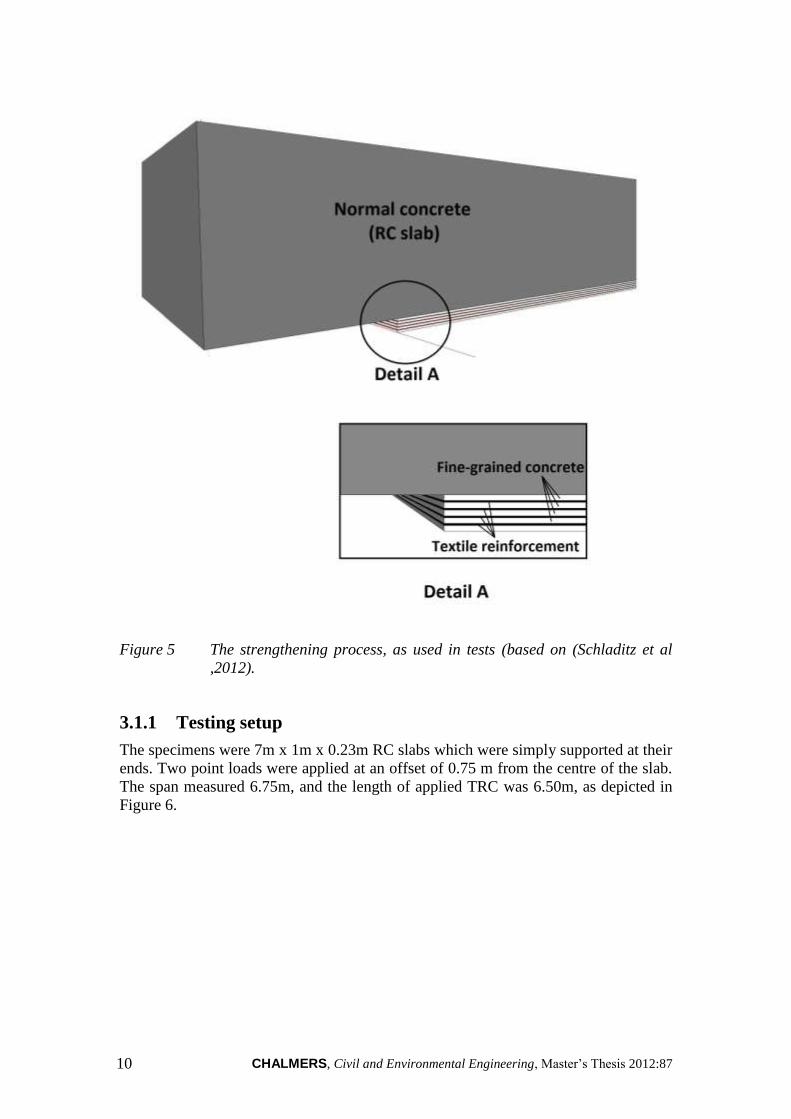
Figure 5 The strengthening process, as used in tests (based on (Schladitz et al
,2012).
3.1.1 Testing setup
The specimens were 7m x 1m x 0.23m RC slabs which were simply supported at their
ends. Two point loads were applied at an offset of 0.75 m from the centre of the slab.
The span measured 6.75m, and the length of applied TRC was 6.50m, as depicted in
Figure 6.
CHALMERS, Civil and Environmental Engineering, Master’s Thesis 2012:87 11
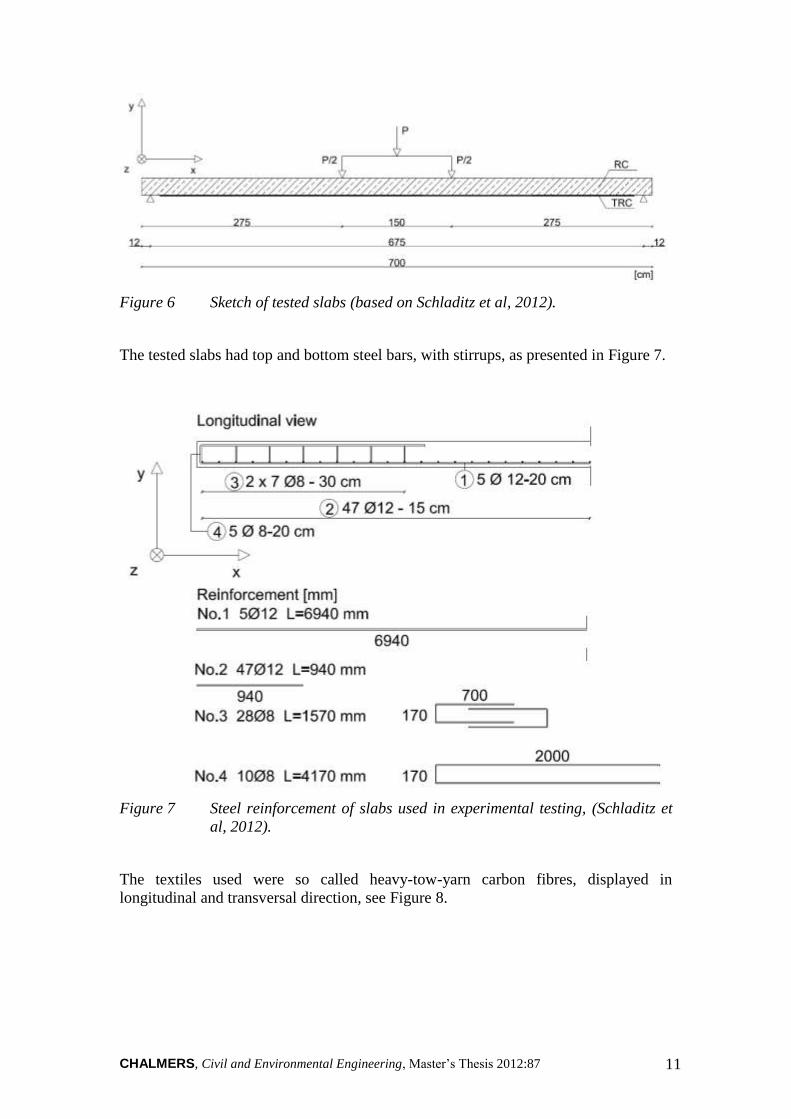
Figure 6 Sketch of tested slabs (based on Schladitz et al, 2012).
The tested slabs had top and bottom steel bars, with stirrups, as presented in Figure 7.
Figure 7 Steel reinforcement of slabs used in experimental testing, (Schladitz et
al, 2012).
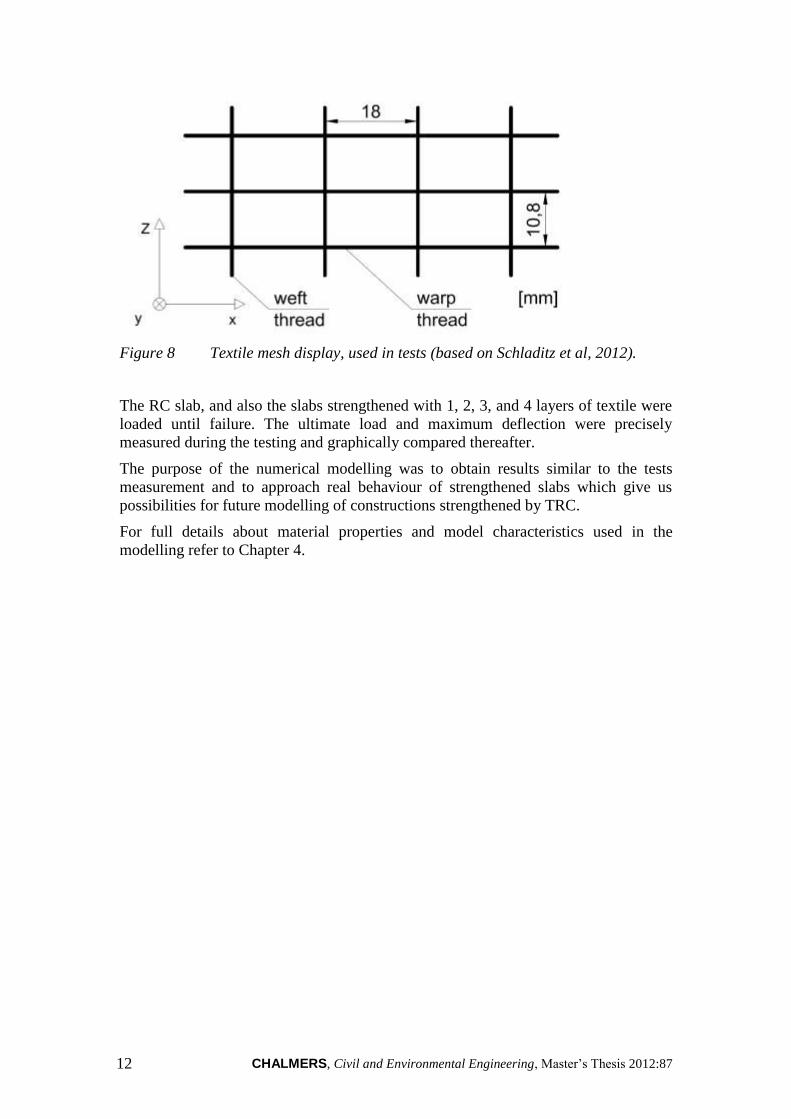
The textiles used were so called heavy-tow-yarn carbon fibres, displayed in
longitudinal and transversal direction, see Figure 8.
CHALMERS, Civil and Environmental Engineering, Master’s Thesis 2012:87 12
Figure 8 Textile mesh display, used in tests (based on Schladitz et al, 2012).
The RC slab, and also the slabs strengthened with 1, 2, 3, and 4 layers of textile were
loaded until failure. The ultimate load and maximum deflection were precisely
measured during the testing and graphically compared thereafter.
The purpose of the numerical modelling was to obtain results similar to the tests
measurement and to approach real behaviour of strengthened slabs which give us
possibilities for future modelling of constructions strengthened by TRC.
For full details about material properties and model characteristics used in the
modelling refer to Chapter 4.
CHALMERS, Civil and Environmental Engineering, Master’s Thesis 2012:87 13
4 FEM model
The main part of this project was to create a valid model of a RC slab strengthened
with TRC, using Finite Elements Method (FEM) analysis and DIANA FX+ software.
The challenge relies in the fact that TRC is a relatively new and unknown material.
FEM has nowadays become an indispensable tool for calculating complicated
structures. Using iteration methods to observe non-linear behaviour of materials, FEM
gives much faster and more precise results than the traditional hand calculations,
which are restricted to simplified calculations.
This chapter describes the analyses ran with TNO DIANA, version 9.4.3, and the pre
and post processor FX+. This program allows a good non-linear analysis for concrete,
bond-slip interactions and crack pattern analysis.
Analysis was carried out with deformation control instead of load control, which
means that the force was replaced with deflection added stepwise. The reason for this
type of loading was that deformation control analysis was more stable, and had easier
to reach convergence. The whole demeanour needed to include not only a given
applied force, P, replaced by deformation control, but also self-weight of the slab. One
phase analysis was not sufficient to yield representative results, as such two phased
analysis was needed. The first phase included the self-weight, as for the second phase,
deformation was introduced at the location where the force P was applied.
4.1 General overview
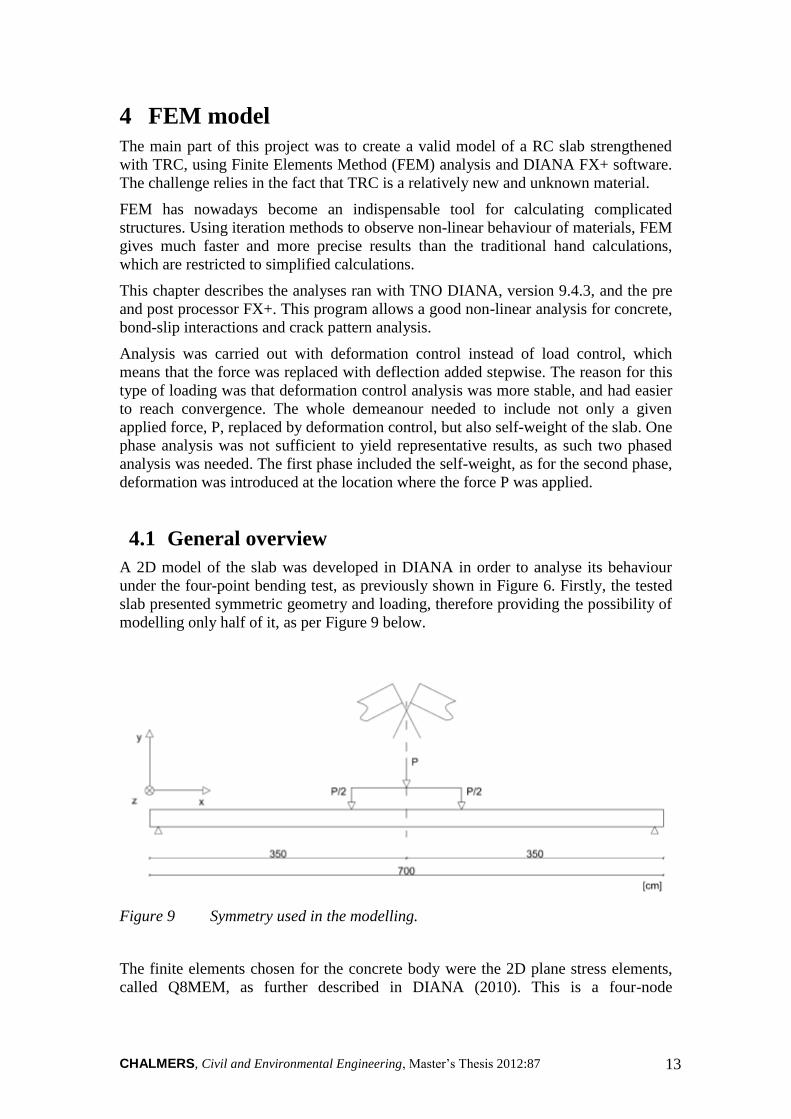
A 2D model of the slab was developed in DIANA in order to analyse its behaviour
under the four-point bending test, as previously shown in Figure 6. Firstly, the tested
slab presented symmetric geometry and loading, therefore providing the possibility of
modelling only half of it, as per Figure 9 below.
Figure 9 Symmetry used in the modelling.
The finite elements chosen for the concrete body were the 2D plane stress elements,
called Q8MEM, as further described in DIANA (2010). This is a four-node
CHALMERS, Civil and Environmental Engineering, Master’s Thesis 2012:87 14
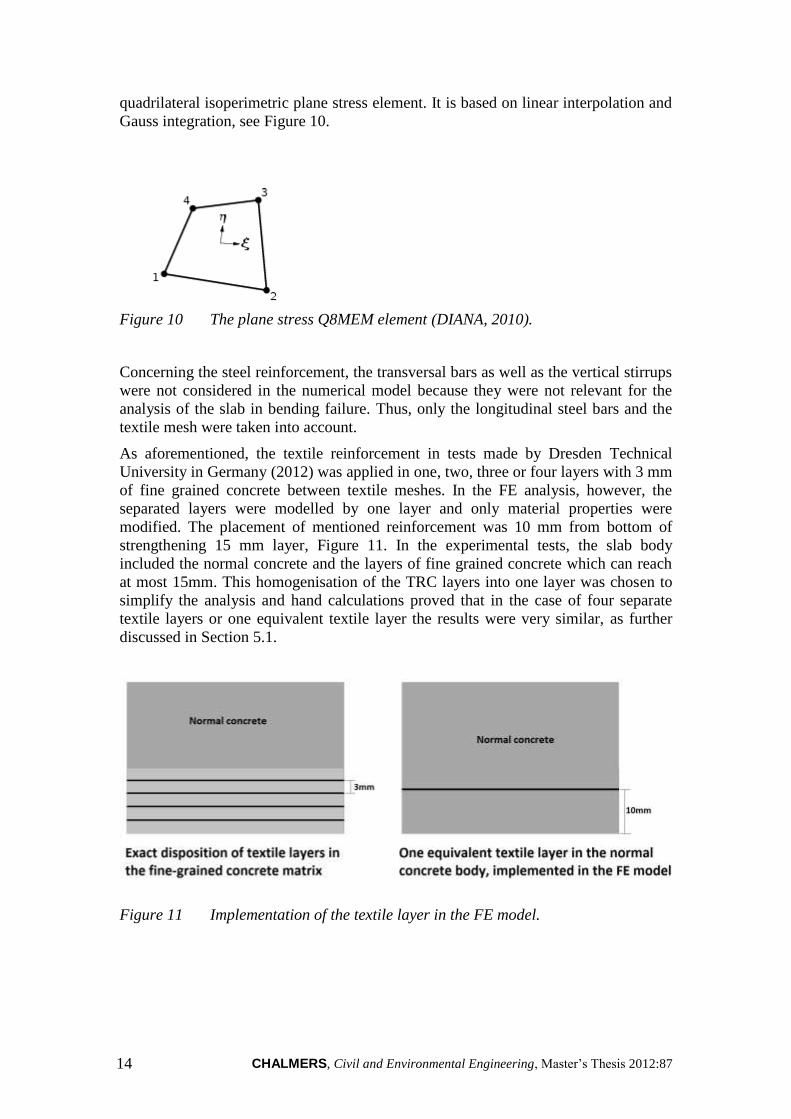
quadrilateral isoperimetric plane stress element. It is based on linear interpolation and
Gauss integration, see Figure 10.
Figure 10 The plane stress Q8MEM element (DIANA, 2010).
Concerning the steel reinforcement, the transversal bars as well as the vertical stirrups
were not considered in the numerical model because they were not relevant for the
analysis of the slab in bending failure. Thus, only the longitudinal steel bars and the
textile mesh were taken into account.
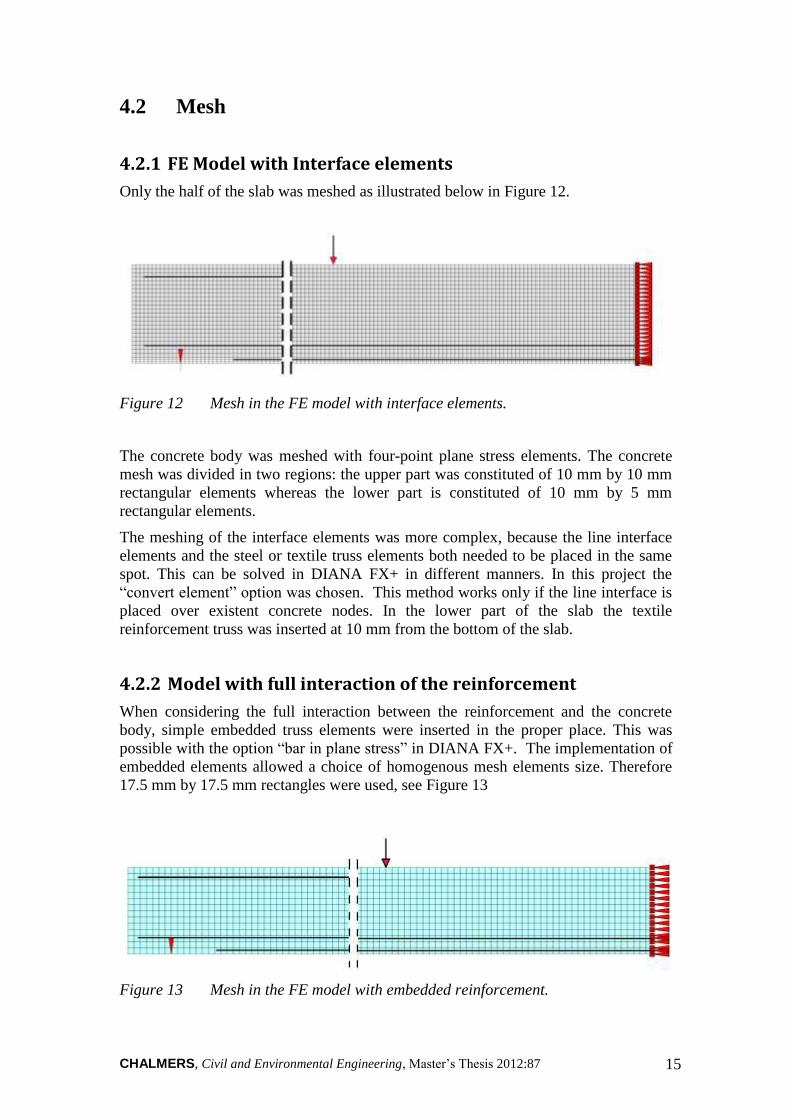
As aforementioned, the textile reinforcement in tests made by Dresden Technical
University in Germany (2012) was applied in one, two, three or four layers with 3 mm
of fine grained concrete between textile meshes. In the FE analysis, however, the
separated layers were modelled by one layer and only material properties were
modified. The placement of mentioned reinforcement was 10 mm from bottom of
strengthening 15 mm layer, Figure 11. In the experimental tests, the slab body
included the normal concrete and the layers of fine grained concrete which can reach
at most 15mm. This homogenisation of the TRC layers into one layer was chosen to
simplify the analysis and hand calculations proved that in the case of four separate
textile layers or one equivalent textile layer the results were very similar, as further
discussed in Section 5.1.
Figure 11 Implementation of the textile layer in the FE model.
CHALMERS, Civil and Environmental Engineering, Master’s Thesis 2012:87 15
4.2 Mesh
4.2.1 FE Model with Interface elements
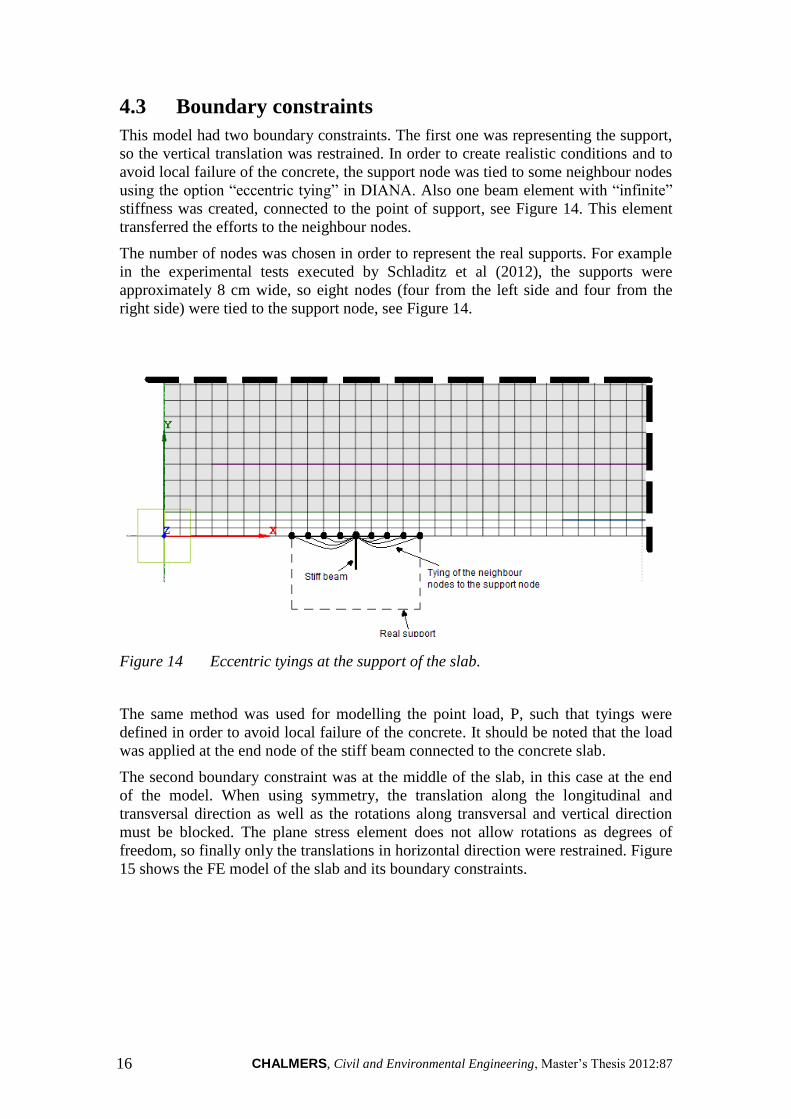
Only the half of the slab was meshed as illustrated below in Figure 12.
Figure 12 Mesh in the FE model with interface elements.
The concrete body was meshed with four-point plane stress elements. The concrete
mesh was divided in two regions: the upper part was constituted of 10 mm by 10 mm
rectangular elements whereas the lower part is constituted of 10 mm by 5 mm
rectangular elements.
The meshing of the interface elements was more complex, because the line interface
elements and the steel or textile truss elements both needed to be placed in the same
spot. This can be solved in DIANA FX+ in different manners. In this project the
“convert element” option was chosen. This method works only if the line interface is
placed over existent concrete nodes. In the lower part of the slab the textile
reinforcement truss was inserted at 10 mm from the bottom of the slab.
4.2.2 Model with full interaction of the reinforcement
When considering the full interaction between the reinforcement and the concrete
body, simple embedded truss elements were inserted in the proper place. This was
possible with the option “bar in plane stress” in DIANA FX+. The implementation of
embedded elements allowed a choice of homogenous mesh elements size. Therefore
17.5 mm by 17.5 mm rectangles were used, see Figure 13
Figure 13 Mesh in the FE model with embedded reinforcement.
CHALMERS, Civil and Environmental Engineering, Master’s Thesis 2012:87 16
4.3 Boundary constraints
This model had two boundary constraints. The first one was representing the support,
so the vertical translation was restrained. In order to create realistic conditions and to
avoid local failure of the concrete, the support node was tied to some neighbour nodes
using the option “eccentric tying” in DIANA. Also one beam element with “infinite”
stiffness was created, connected to the point of support, see Figure 14. This element
transferred the efforts to the neighbour nodes.
The number of nodes was chosen in order to represent the real supports. For example
in the experimental tests executed by Schladitz et al (2012), the supports were
approximately 8 cm wide, so eight nodes (four from the left side and four from the
right side) were tied to the support node, see Figure 14.
Figure 14 Eccentric tyings at the support of the slab.
The same method was used for modelling the point load, P, such that tyings were
defined in order to avoid local failure of the concrete. It should be noted that the load
was applied at the end node of the stiff beam connected to the concrete slab.
The second boundary constraint was at the middle of the slab, in this case at the end
of the model. When using symmetry, the translation along the longitudinal and
transversal direction as well as the rotations along transversal and vertical direction
must be blocked. The plane stress element does not allow rotations as degrees of
freedom, so finally only the translations in horizontal direction were restrained. Figure
15 shows the FE model of the slab and its boundary constraints.
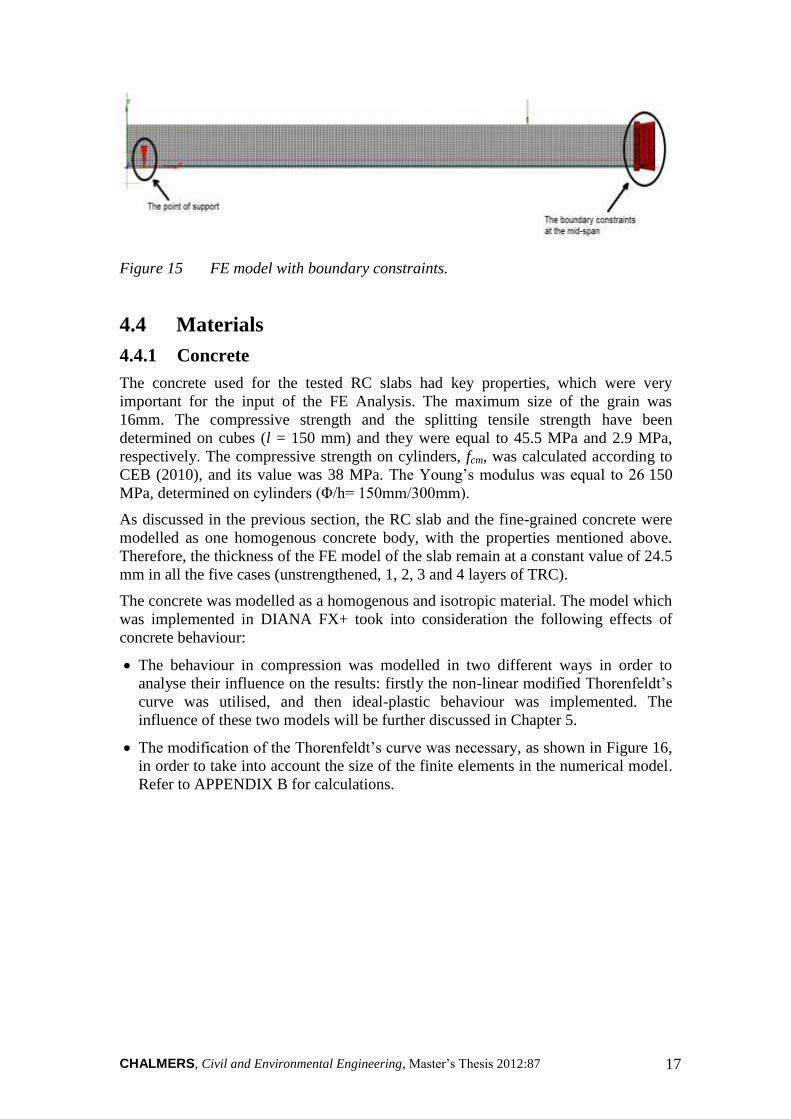
CHALMERS, Civil and Environmental Engineering, Master’s Thesis 2012:87 17
Figure 15 FE model with boundary constraints.
4.4 Materials
4.4.1 Concrete
The concrete used for the tested RC slabs had key properties, which were very
important for the input of the FE Analysis. The maximum size of the grain was
16mm. The compressive strength and the splitting tensile strength have been
determined on cubes (l = 150 mm) and they were equal to 45.5 MPa and 2.9 MPa,
respectively. The compressive strength on cylinders, fcm, was calculated according to
CEB (2010), and its value was 38 MPa. The Young’s modulus was equal to 26 150
MPa, determined on cylinders (Φ/h= 150mm/300mm).
As discussed in the previous section, the RC slab and the fine-grained concrete were
modelled as one homogenous concrete body, with the properties mentioned above.
Therefore, the thickness of the FE model of the slab remain at a constant value of 24.5
mm in all the five cases (unstrengthened, 1, 2, 3 and 4 layers of TRC).
The concrete was modelled as a homogenous and isotropic material. The model which
was implemented in DIANA FX+ took into consideration the following effects of
concrete behaviour:
The behaviour in compression was modelled in two different ways in order to
analyse their influence on the results: firstly the non-linear modified Thorenfeldt’s
curve was utilised, and then ideal-plastic behaviour was implemented. The
influence of these two models will be further discussed in Chapter 5.
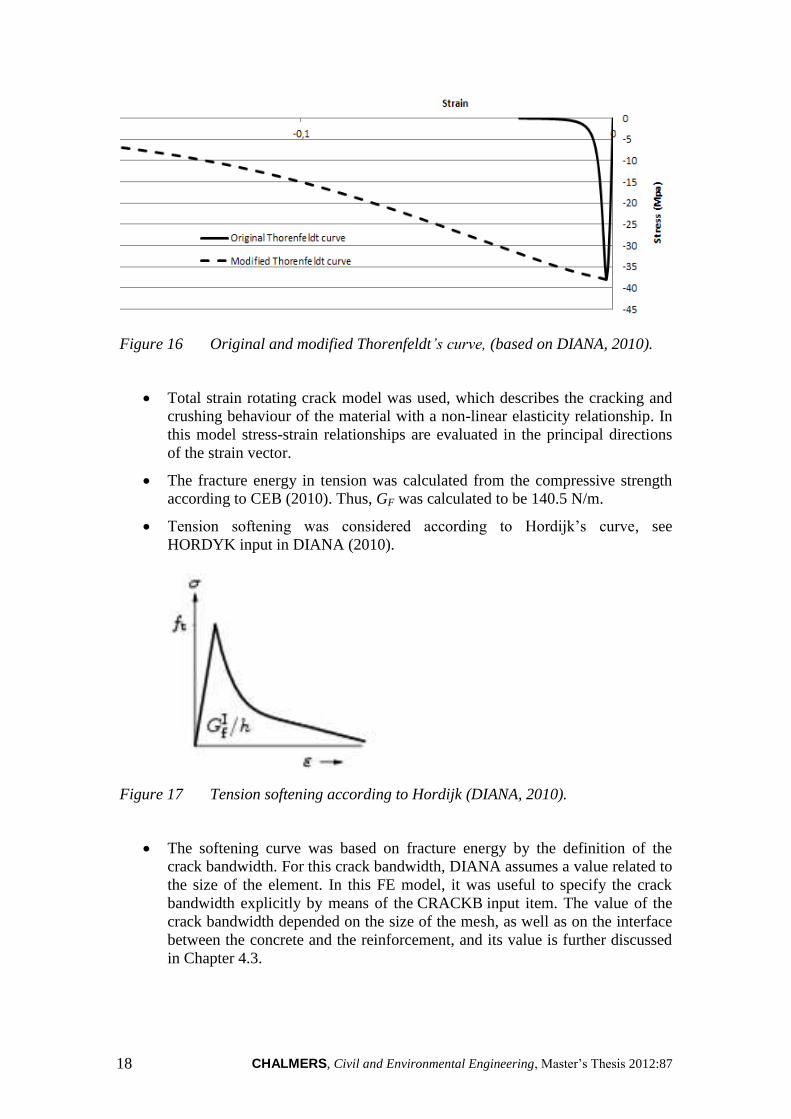
The modification of the Thorenfeldt’s curve was necessary, as shown in Figure 16,
in order to take into account the size of the finite elements in the numerical model.
Refer to APPENDIX B for calculations.
CHALMERS, Civil and Environmental Engineering, Master’s Thesis 2012:87 18
Figure 16 Original and modified Thorenfeldt’s curve, (based on DIANA, 2010).
Total strain rotating crack model was used, which describes the cracking and
crushing behaviour of the material with a non-linear elasticity relationship. In
this model stress-strain relationships are evaluated in the principal directions
of the strain vector.
The fracture energy in tension was calculated from the compressive strength
according to CEB (2010). Thus, GF was calculated to be 140.5 N/m.
Tension softening was considered according to Hordijk’s curve, see
HORDYK input in DIANA (2010).
Figure 17 Tension softening according to Hordijk (DIANA, 2010).
The softening curve was based on fracture energy by the definition of the
crack bandwidth. For this crack bandwidth, DIANA assumes a value related to
the size of the element. In this FE model, it was useful to specify the crack
bandwidth explicitly by means of the CRACKB input item. The value of the
crack bandwidth depended on the size of the mesh, as well as on the interface
between the concrete and the reinforcement, and its value is further discussed
in Chapter 4.3.
CHALMERS, Civil and Environmental Engineering, Master’s Thesis 2012:87 19
4.4.2 Reinforcement
Two types of reinforcements were modelled: steel bars and textile mesh. Both
reinforcements were modelled as truss elements, namely L2TRU in DIANA. Their
interaction with the concrete body was implemented in two different ways in order to
analyse their influence on the results:
Firstly, full interaction was considered, which means that the bond between
concrete and reinforcement was assumed to be perfect and no slip was
permitted.
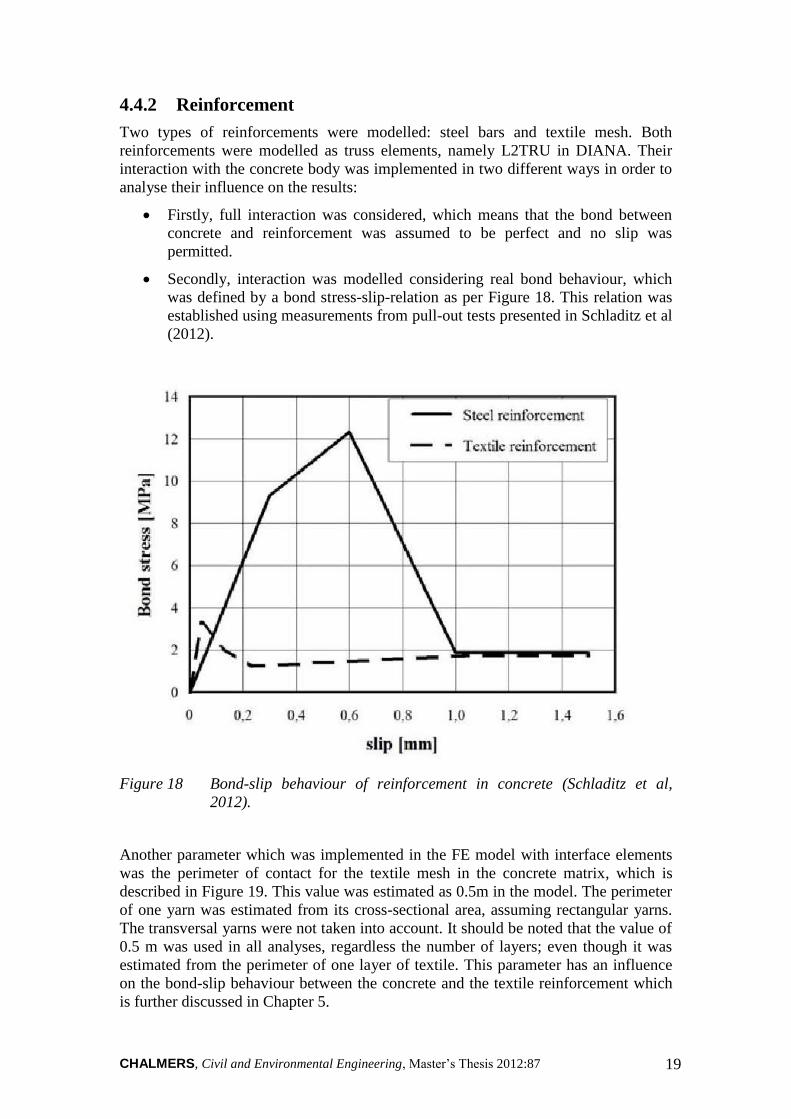
Secondly, interaction was modelled considering real bond behaviour, which
was defined by a bond stress-slip-relation as per Figure 18. This relation was
established using measurements from pull-out tests presented in Schladitz et al
(2012).
Figure 18 Bond-slip behaviour of reinforcement in concrete (Schladitz et al,
2012).
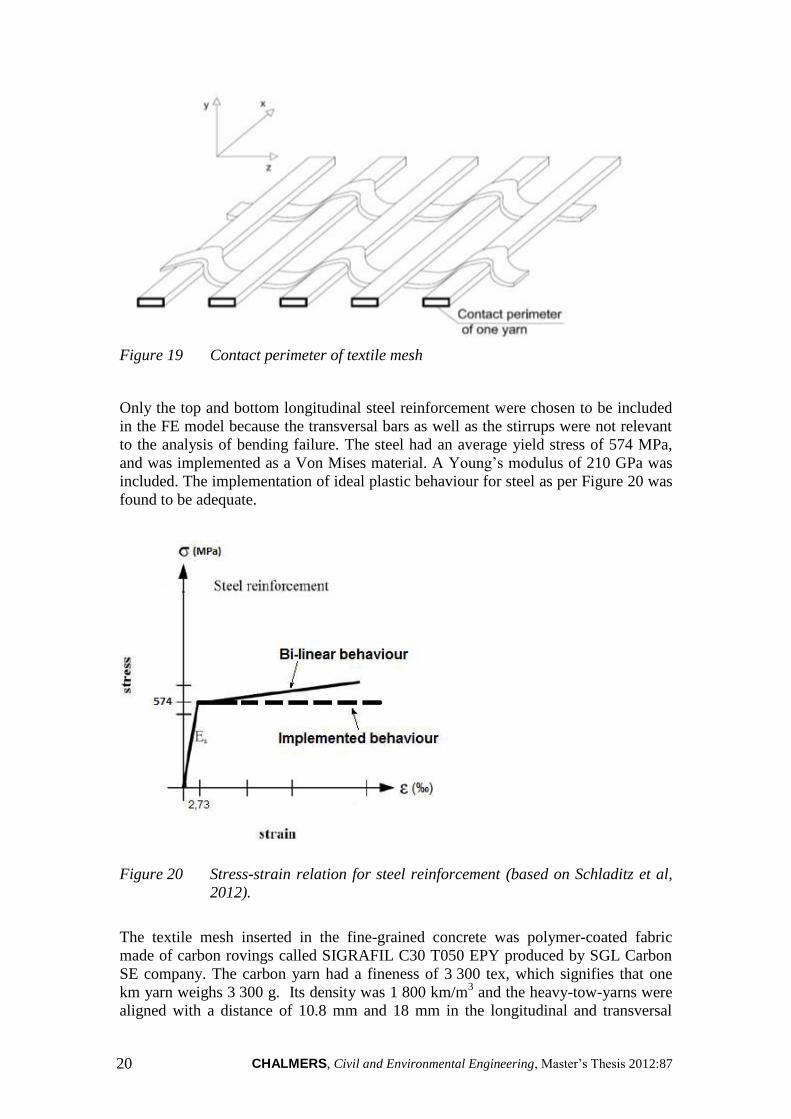
Another parameter which was implemented in the FE model with interface elements
was the perimeter of contact for the textile mesh in the concrete matrix, which is
described in Figure 19. This value was estimated as 0.5m in the model. The perimeter
of one yarn was estimated from its cross-sectional area, assuming rectangular yarns.
The transversal yarns were not taken into account. It should be noted that the value of
0.5 m was used in all analyses, regardless the number of layers; even though it was
estimated from the perimeter of one layer of textile. This parameter has an influence
on the bond-slip behaviour between the concrete and the textile reinforcement which
is further discussed in Chapter 5.
CHALMERS, Civil and Environmental Engineering, Master’s Thesis 2012:87 20
Figure 19 Contact perimeter of textile mesh
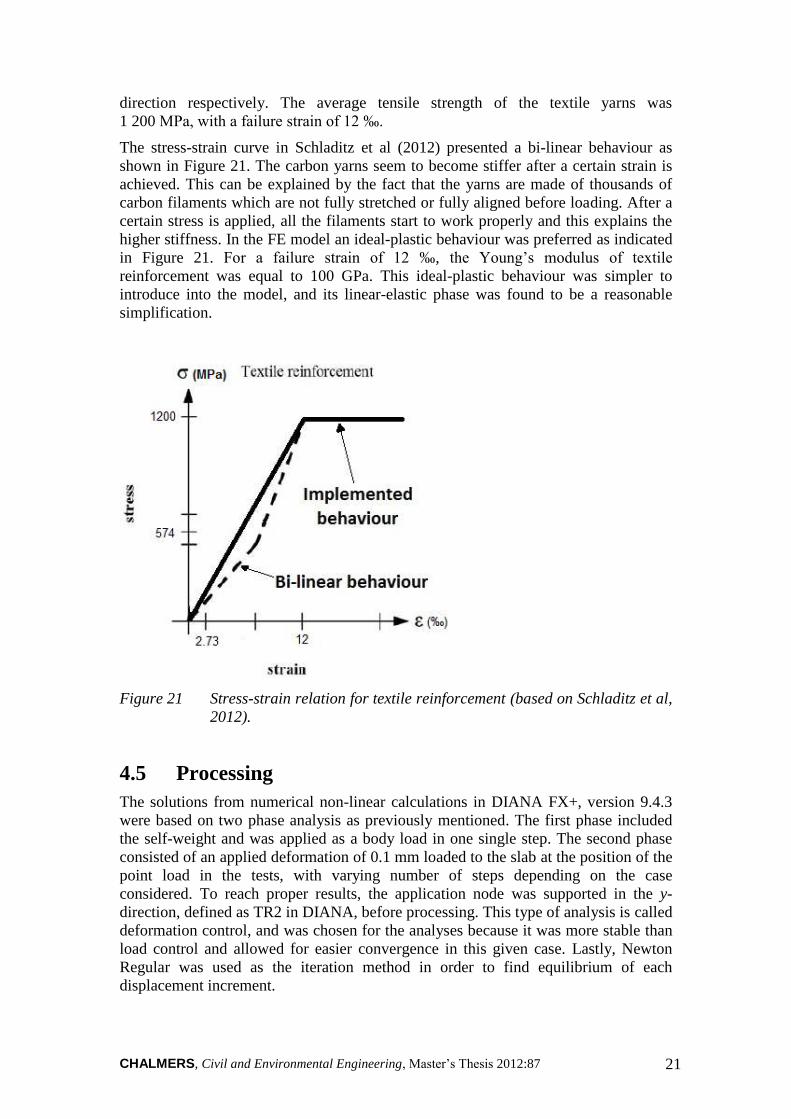
Only the top and bottom longitudinal steel reinforcement were chosen to be included
in the FE model because the transversal bars as well as the stirrups were not relevant
to the analysis of bending failure. The steel had an average yield stress of 574 MPa,
and was implemented as a Von Mises material. A Young’s modulus of 210 GPa was
included. The implementation of ideal plastic behaviour for steel as per Figure 20 was
found to be adequate.
Figure 20 Stress-strain relation for steel reinforcement (based on Schladitz et al,
2012).
The textile mesh inserted in the fine-grained concrete was polymer-coated fabric
made of carbon rovings called SIGRAFIL C30 T050 EPY produced by SGL Carbon
SE company. The carbon yarn had a fineness of 3 300 tex, which signifies that one
km yarn weighs 3 300 g. Its density was 1 800 km/m3 and the heavy-tow-yarns were
aligned with a distance of 10.8 mm and 18 mm in the longitudinal and transversal
CHALMERS, Civil and Environmental Engineering, Master’s Thesis 2012:87 21
direction respectively. The average tensile strength of the textile yarns was
1 200 MPa, with a failure strain of 12 ‰.
The stress-strain curve in Schladitz et al (2012) presented a bi-linear behaviour as
shown in Figure 21. The carbon yarns seem to become stiffer after a certain strain is
achieved. This can be explained by the fact that the yarns are made of thousands of
carbon filaments which are not fully stretched or fully aligned before loading. After a
certain stress is applied, all the filaments start to work properly and this explains the
higher stiffness. In the FE model an ideal-plastic behaviour was preferred as indicated
in Figure 21. For a failure strain of 12 ‰, the Young’s modulus of textile
reinforcement was equal to 100 GPa. This ideal-plastic behaviour was simpler to
introduce into the model, and its linear-elastic phase was found to be a reasonable
simplification.
Figure 21 Stress-strain relation for textile reinforcement (based on Schladitz et al,
2012).
4.5 Processing
The solutions from numerical non-linear calculations in DIANA FX+, version 9.4.3
were based on two phase analysis as previously mentioned. The first phase included
the self-weight and was applied as a body load in one single step. The second phase
consisted of an applied deformation of 0.1 mm loaded to the slab at the position of the
point load in the tests, with varying number of steps depending on the case
considered. To reach proper results, the application node was supported in the y-
direction, defined as TR2 in DIANA, before processing. This type of analysis is called
deformation control, and was chosen for the analyses because it was more stable than
load control and allowed for easier convergence in this given case. Lastly, Newton
Regular was used as the iteration method in order to find equilibrium of each
displacement increment.
CHALMERS, Civil and Environmental Engineering, Master’s Thesis 2012:87 22
5 Results
In this chapter, results from hand calculations, FE analysis, as well as experimental
tests derived from Schladitz et al (2012) are presented. Moreover, a detailed
comparison of these results is realised.
5.1 Hand calculations
Hand calculations were executed in order to obtain an initial behavioural prediction of
the strengthened slab. Firstly, the initial deflection of the slab was calculated, and
thereafter, calculations in the ultimate state were made. These calculations are based
on considering full interaction between the concrete and both steel and textile
reinforcements. The equations used in the hand calculations are described in
APPENDIX A.
5.1.1 Deflection calculations
The initial deflection of the slab was calculated in order to analyse the behaviour of
the slab in the non-cracked and elastic state. Due to its geometry, the slab is only one
directional in bending, which means that its behaviour can be predicted with a beam
approach. Firstly, the deflection caused by the self-weight, uself-weight, was calculated to
be 5.14 mm.
Secondly, the linear relation between the applied load, P and total deflection was
established. Thereafter, the initial stiffness of the slab, Kslab, was calculated to be
5.4×10⁶ N/m. This value is compared to the initial stiffness of the FE model in
Section 5.2.
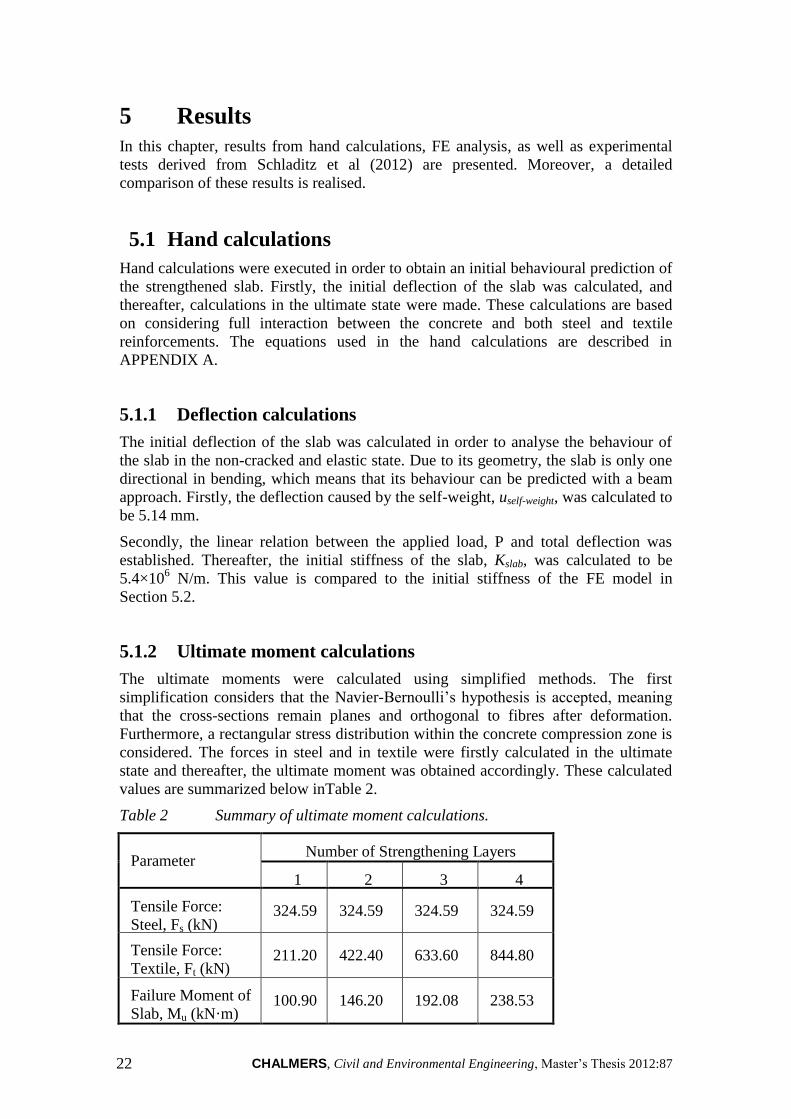
5.1.2 Ultimate moment calculations
The ultimate moments were calculated using simplified methods. The first
simplification considers that the Navier-Bernoulli’s hypothesis is accepted, meaning
that the cross-sections remain planes and orthogonal to fibres after deformation.
Furthermore, a rectangular stress distribution within the concrete compression zone is
considered. The forces in steel and in textile were firstly calculated in the ultimate
state and thereafter, the ultimate moment was obtained accordingly. These calculated
values are summarized below inTable 2.
Table 2 Summary of ultimate moment calculations.
Parameter Number of Strengthening Layers
1 2 3 4
Tensile Force:
Steel, Fs (kN) 324.59 324.59 324.59 324.59
Tensile Force:
Textile, Ft (kN) 211.20 422.40 633.60 844.80
Failure Moment of
Slab, Mu (kN·m) 100.90 146.20 192.08 238.53
CHALMERS, Civil and Environmental Engineering, Master’s Thesis 2012:87 23
These values of the ultimate moments were compared to the experimental and FE
model’s results in Section 5.2.
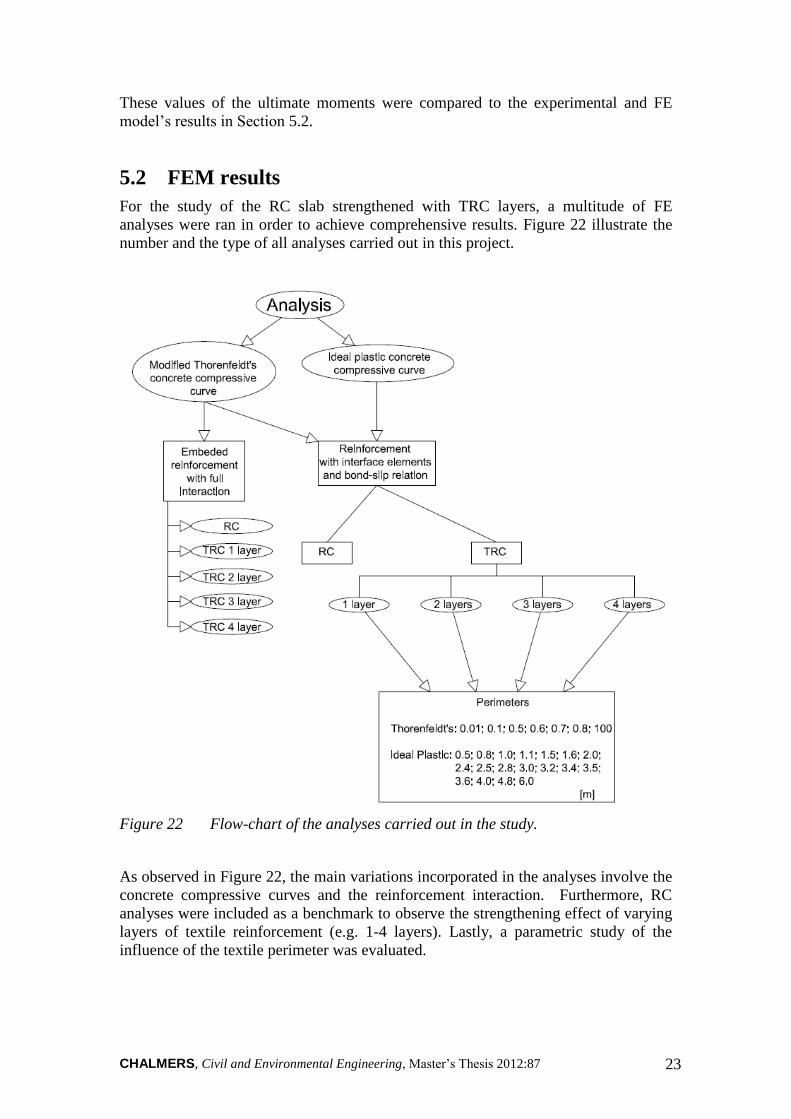
5.2 FEM results
For the study of the RC slab strengthened with TRC layers, a multitude of FE
analyses were ran in order to achieve comprehensive results. Figure 22 illustrate the
number and the type of all analyses carried out in this project.
Figure 22 Flow-chart of the analyses carried out in the study.
As observed in Figure 22, the main variations incorporated in the analyses involve the
concrete compressive curves and the reinforcement interaction. Furthermore, RC
analyses were included as a benchmark to observe the strengthening effect of varying
layers of textile reinforcement (e.g. 1-4 layers). Lastly, a parametric study of the
influence of the textile perimeter was evaluated.
CHALMERS, Civil and Environmental Engineering, Master’s Thesis 2012:87 24
5.2.1 General overview
The main objective of this project was to model and analyse the effects of
strengthening RC structures using TRC layers by means of finite element analysis. In
this section, the results from FE analysis are presented and discussed in detail.
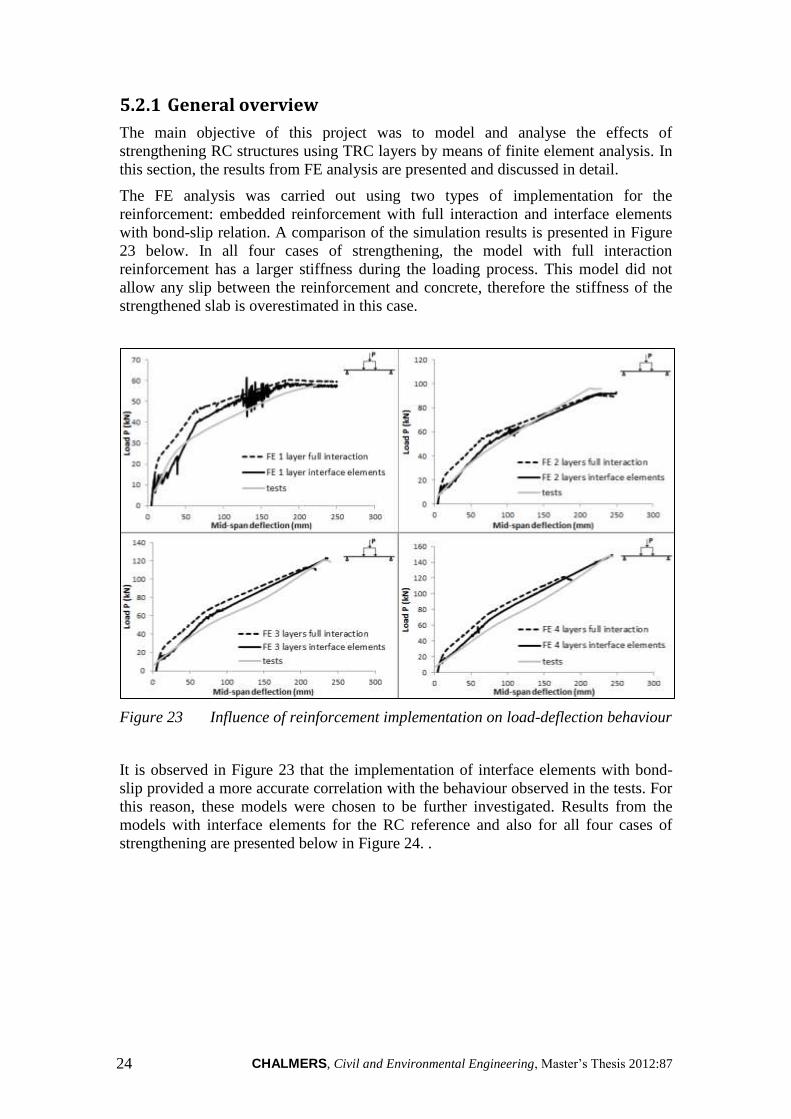
The FE analysis was carried out using two types of implementation for the
reinforcement: embedded reinforcement with full interaction and interface elements
with bond-slip relation. A comparison of the simulation results is presented in Figure
23 below. In all four cases of strengthening, the model with full interaction
reinforcement has a larger stiffness during the loading process. This model did not
allow any slip between the reinforcement and concrete, therefore the stiffness of the
strengthened slab is overestimated in this case.
Figure 23 Influence of reinforcement implementation on load-deflection behaviour
It is observed in Figure 23 that the implementation of interface elements with bond-
slip provided a more accurate correlation with the behaviour observed in the tests. For
this reason, these models were chosen to be further investigated. Results from the
models with interface elements for the RC reference and also for all four cases of
strengthening are presented below in Figure 24. .
CHALMERS, Civil and Environmental Engineering, Master’s Thesis 2012:87 25
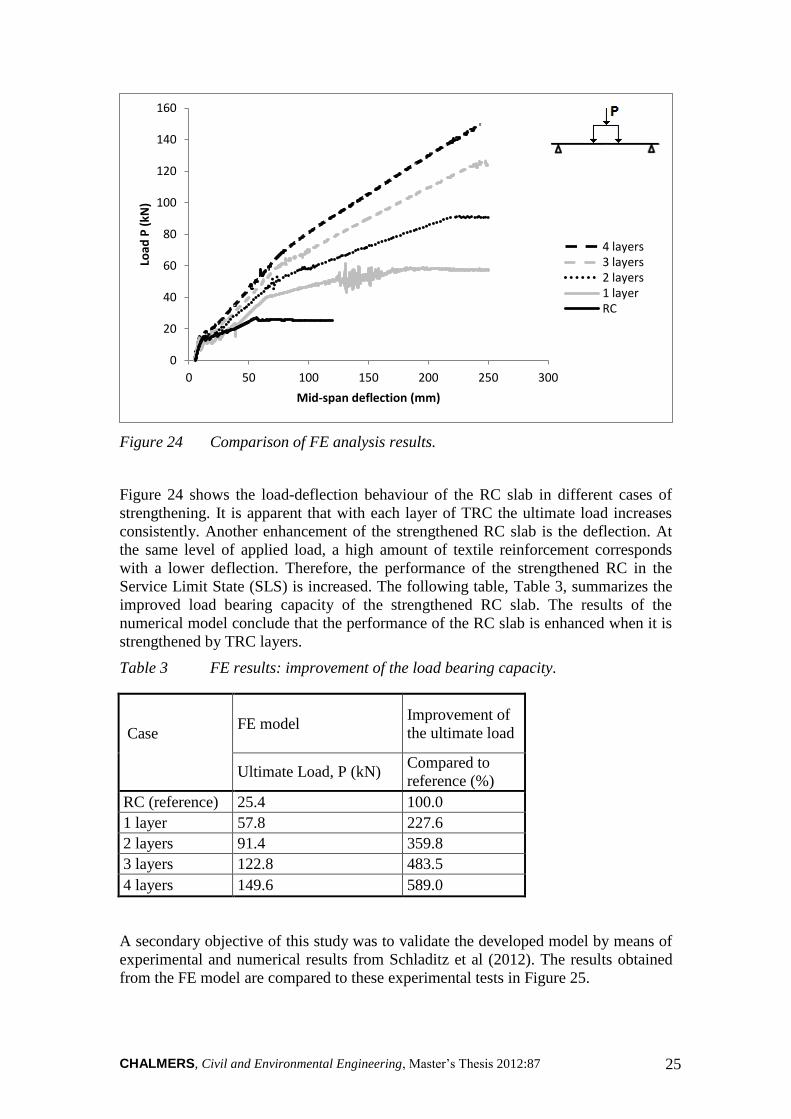
Figure 24 Comparison of FE analysis results.
Figure 24 shows the load-deflection behaviour of the RC slab in different cases of
strengthening. It is apparent that with each layer of TRC the ultimate load increases
consistently. Another enhancement of the strengthened RC slab is the deflection. At
the same level of applied load, a high amount of textile reinforcement corresponds
with a lower deflection. Therefore, the performance of the strengthened RC in the
Service Limit State (SLS) is increased. The following table, Table 3, summarizes the
improved load bearing capacity of the strengthened RC slab. The results of the
numerical model conclude that the performance of the RC slab is enhanced when it is
strengthened by TRC layers.
Table 3 FE results: improvement of the load bearing capacity.
Case
FE model Improvement of
the ultimate load
Ultimate Load, P (kN) Compared to
reference (%)
RC (reference) 25.4 100.0
1 layer 57.8 227.6
2 layers 91.4 359.8
3 layers 122.8 483.5
4 layers 149.6 589.0
A secondary objective of this study was to validate the developed model by means of
experimental and numerical results from Schladitz et al (2012). The results obtained
from the FE model are compared to these experimental tests in Figure 25.
0
20
40
60
80
100
120
140
160
0 50 100 150 200 250 300
Load
P (
kN)
Mid-span deflection (mm)
4 layers 3 layers 2 layers 1 layer RC
CHALMERS, Civil and Environmental Engineering, Master’s Thesis 2012:87 26
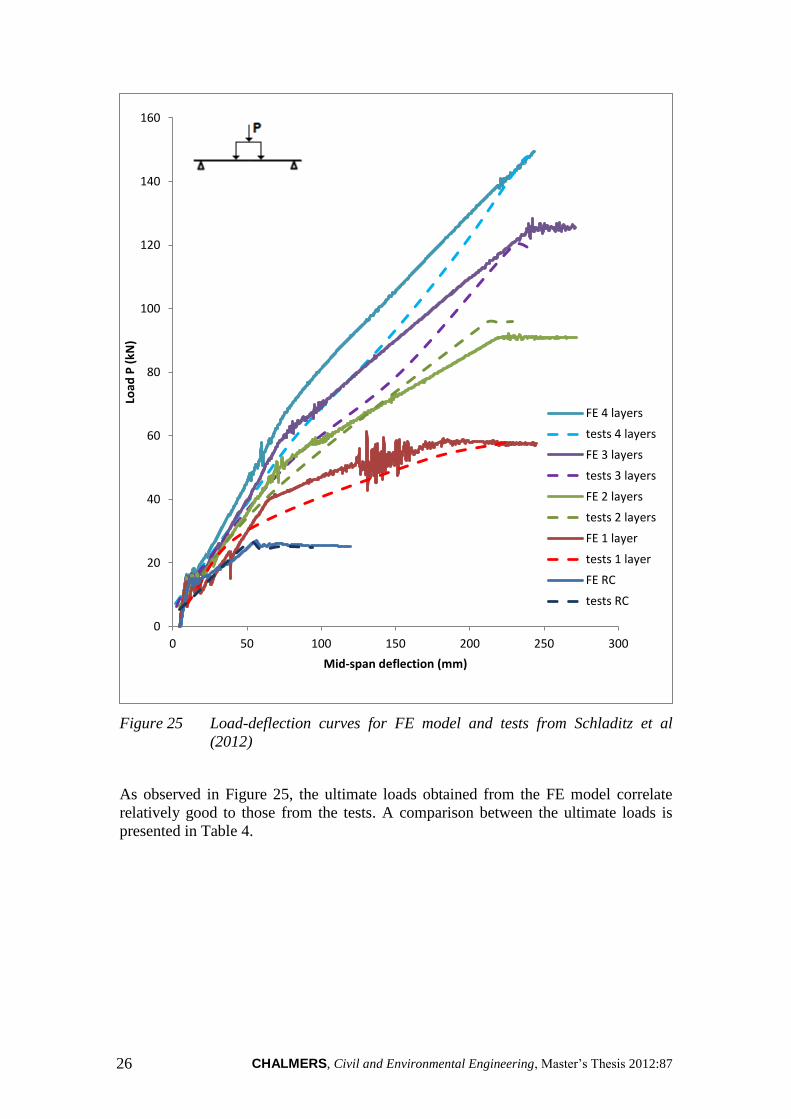
Figure 25 Load-deflection curves for FE model and tests from Schladitz et al
(2012)
As observed in Figure 25, the ultimate loads obtained from the FE model correlate
relatively good to those from the tests. A comparison between the ultimate loads is
presented in Table 4.
0
20
40
60
80
100
120
140
160
0 50 100 150 200 250 300
Load
P (
kN)
Mid-span deflection (mm)
FE 4 layers
tests 4 layers
FE 3 layers
tests 3 layers
FE 2 layers
tests 2 layers
FE 1 layer
tests 1 layer
FE RC
tests RC
CHALMERS, Civil and Environmental Engineering, Master’s Thesis 2012:87 27
Table 4 Comparison of results from FE analysis and tests from Schladitz et al
(2012).
Case
FE model Tests
Error (%)
Ultimate Load, P (kN)
RC (reference) 25.4 25.0 1.60
1 layer 57.8 58.0 -0.34
2 layers 91.4 96.0 -4.79
3 layers 122.8 119.0 3.19
4 layers 149.6 147.0 1.77
As Table 4 shows, the error of the ultimate load is small. However, the ultimate
deflection is different. This discrepancy is explained by the implementation of the
ideal-plastic behaviour of textile in the FE model, as per Figure 21. In reality the
failure of the slab is observed by the brittle fracture of the textile layer. In the FE
model, the failure is achieved when the textile layer has yielded. As such, the FE
analysis was observed to converge for all demanded load steps.
Along the graphs slight deviations from experimental results can be observed. As
Figure 25 shows, the stiffness of the model differs from experimental curves. The
reasons of this variation rely on the choice made for the implementation of the FE
model: the rotating crack model, the ideal-plastic behaviour of steel and textile, etc.
These choices influenced the behaviour of the FE model.
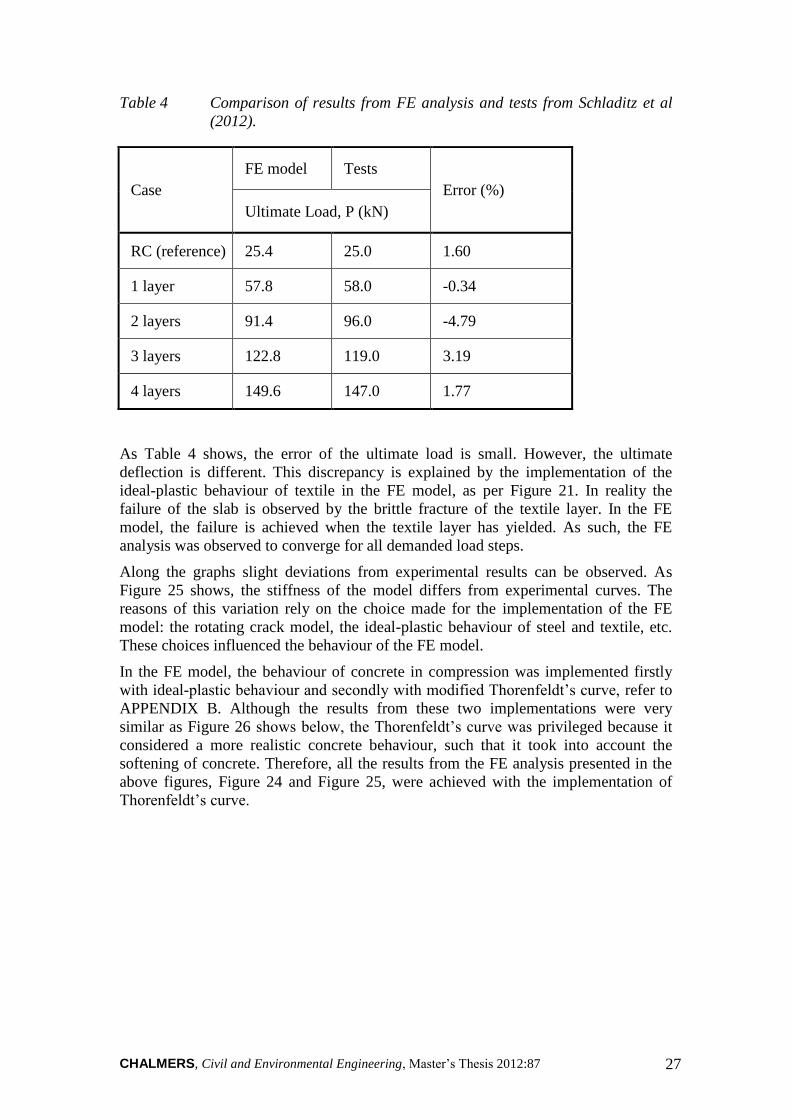
In the FE model, the behaviour of concrete in compression was implemented firstly
with ideal-plastic behaviour and secondly with modified Thorenfeldt’s curve, refer to
APPENDIX B. Although the results from these two implementations were very
similar as Figure 26 shows below, the Thorenfeldt’s curve was privileged because it
considered a more realistic concrete behaviour, such that it took into account the
softening of concrete. Therefore, all the results from the FE analysis presented in the
above figures, Figure 24 and Figure 25, were achieved with the implementation of
Thorenfeldt’s curve.
CHALMERS, Civil and Environmental Engineering, Master’s Thesis 2012:87 28
Figure 26 Influence of compressive curve on load-deflection diagram.
Furthermore, the FE results were compared with hand calculations. Firstly, as exposed
in Chapter 5.1, the implemented FE model included one homogenous textile layer
instead of four individual layers. The influence of this aspect on the results given by
hand calculations is shown in Table 5 below:
Table 5 Hand calculation comparison.
Implementation Method Ultimate moment (kN·m)
1 layer 2 layers 3 layers 4 layers
Hand calculations,
individual layers 100.9 146.2 192.1 238.5
Hand calculations, 1
homogenous layer 101.2 146.4 191.5 236.7
Error (%) -0.3 -0.1 0.3 0.8
0
10
20
30
40
50
60
70
0 50 100 150 200 250 300
Load
P (
kN)
Mid-span deflection (mm)
Modified Thorenfeldt's compressive curve
Ideal-plastic compressive curve
CHALMERS, Civil and Environmental Engineering, Master’s Thesis 2012:87 29
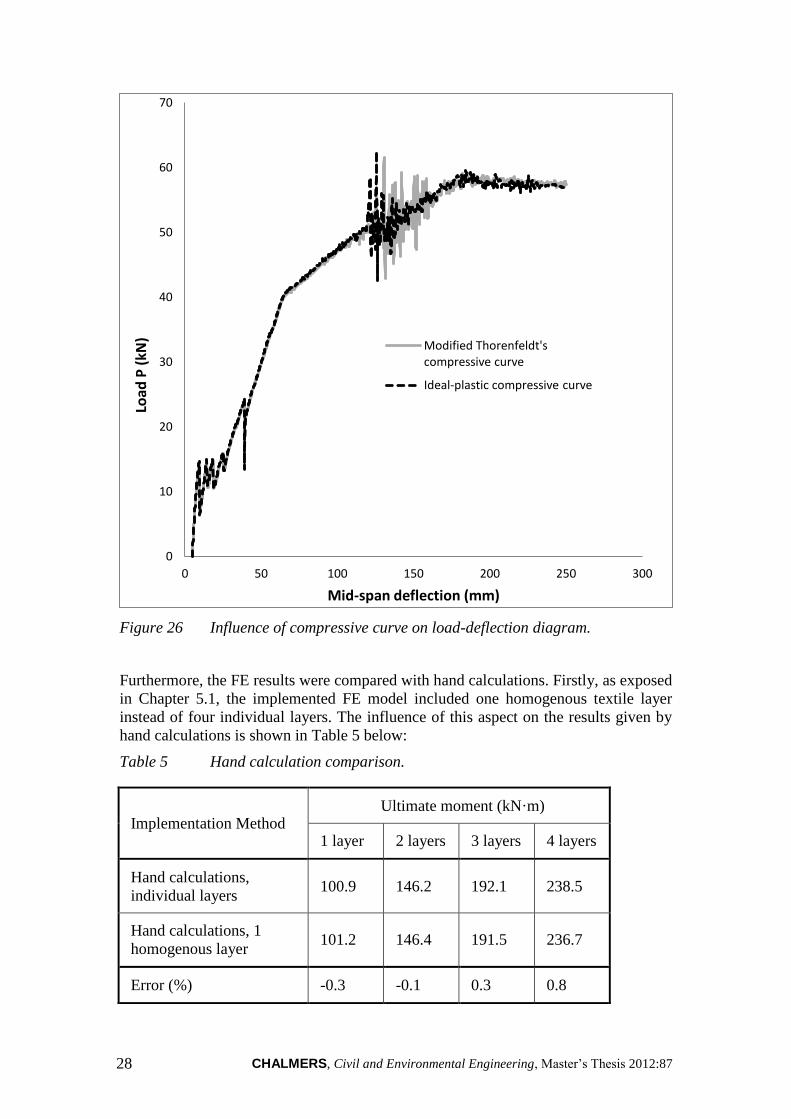
The difference between the two ways of implementing the textile reinforcement is
relatively small, which demonstrates the effectiveness of using only one homogenous
textile layer in the FE model. The initial stiffness obtained by the hand calculations is
also compared to the FE model results in Figure 27.
Figure 27 Initial stiffness of FE model compared to hand calculations.
Figure 27 shows that the hand calculations adequately estimate the behaviour of the
slab in the initial phase of loading (up to 8% error), namely the uncracked state. In the
FE model, the number of strengthening textile layers was found not to have an
important influence on the initial stiffness of the slab. This behaviour was predicted
by the hand calculations and is further described in APPENDIX A.
Hand calculations were carried out to estimate the load capacity of the slab in each
case of strengthening. The comparison with the tests results is given below in Table 6.
0
5
10
15
20
25
30
4 5 6 7 8 9 10 11
Load
P (
kN)
Mid-span deflection (mm)
FE 4 layers FE 3 layers FE 2 layers FE 1 layer Hand calculations
CHALMERS, Civil and Environmental Engineering, Master’s Thesis 2012:87 30
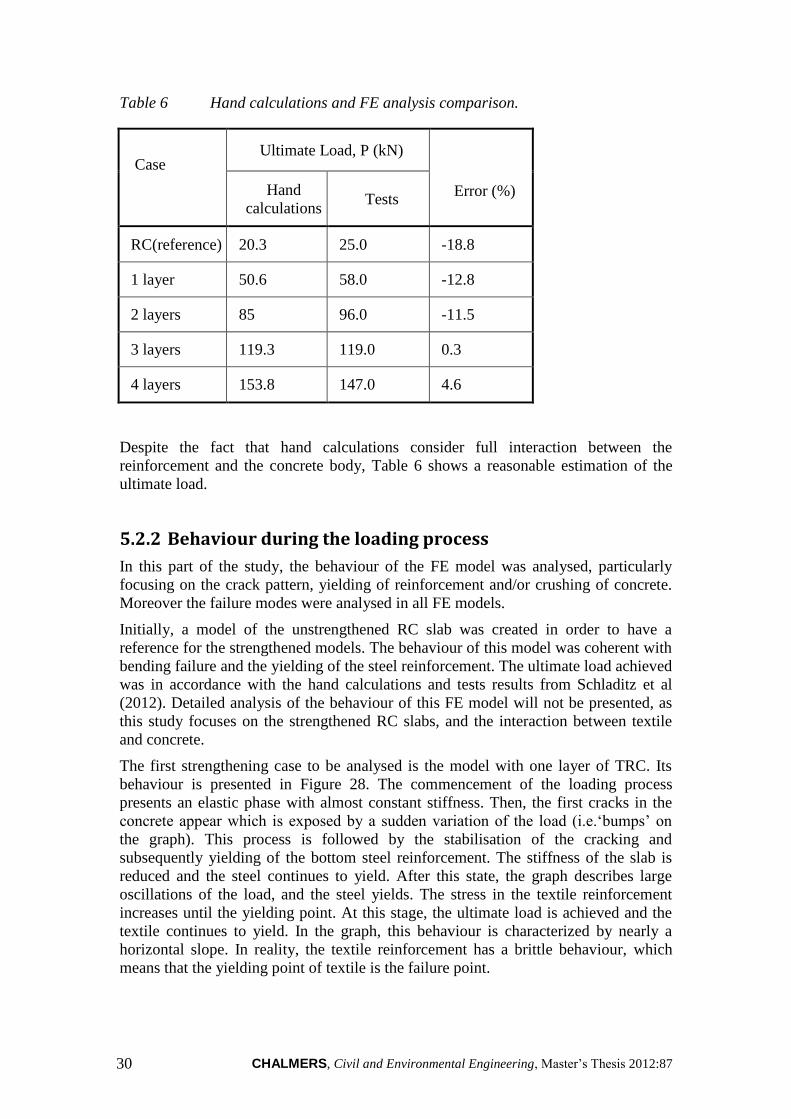
Table 6 Hand calculations and FE analysis comparison.
Case
Ultimate Load, P (kN)
Error (%) Hand
calculations Tests
RC(reference) 20.3 25.0 -18.8
1 layer 50.6 58.0 -12.8
2 layers 85 96.0 -11.5
3 layers 119.3 119.0 0.3
4 layers 153.8 147.0 4.6
Despite the fact that hand calculations consider full interaction between the
reinforcement and the concrete body, Table 6 shows a reasonable estimation of the
ultimate load.
5.2.2 Behaviour during the loading process
In this part of the study, the behaviour of the FE model was analysed, particularly
focusing on the crack pattern, yielding of reinforcement and/or crushing of concrete.
Moreover the failure modes were analysed in all FE models.
Initially, a model of the unstrengthened RC slab was created in order to have a
reference for the strengthened models. The behaviour of this model was coherent with
bending failure and the yielding of the steel reinforcement. The ultimate load achieved
was in accordance with the hand calculations and tests results from Schladitz et al
(2012). Detailed analysis of the behaviour of this FE model will not be presented, as
this study focuses on the strengthened RC slabs, and the interaction between textile
and concrete.
The first strengthening case to be analysed is the model with one layer of TRC. Its
behaviour is presented in Figure 28. The commencement of the loading process
presents an elastic phase with almost constant stiffness. Then, the first cracks in the
concrete appear which is exposed by a sudden variation of the load (i.e.‘bumps’ on
the graph). This process is followed by the stabilisation of the cracking and
subsequently yielding of the bottom steel reinforcement. The stiffness of the slab is
reduced and the steel continues to yield. After this state, the graph describes large
oscillations of the load, and the steel yields. The stress in the textile reinforcement
increases until the yielding point. At this stage, the ultimate load is achieved and the
textile continues to yield. In the graph, this behaviour is characterized by nearly a
horizontal slope. In reality, the textile reinforcement has a brittle behaviour, which
means that the yielding point of textile is the failure point.
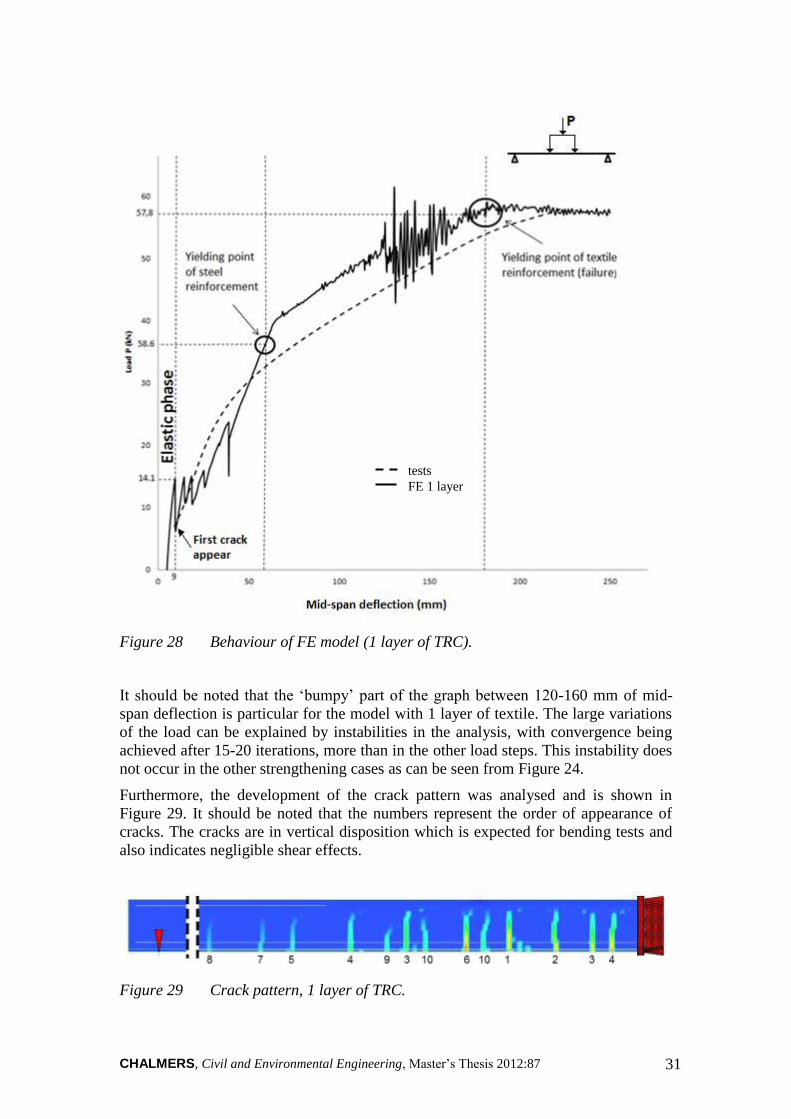
CHALMERS, Civil and Environmental Engineering, Master’s Thesis 2012:87 31
Figure 28 Behaviour of FE model (1 layer of TRC).
It should be noted that the ‘bumpy’ part of the graph between 120-160 mm of mid-
span deflection is particular for the model with 1 layer of textile. The large variations
of the load can be explained by instabilities in the analysis, with convergence being
achieved after 15-20 iterations, more than in the other load steps. This instability does
not occur in the other strengthening cases as can be seen from Figure 24.
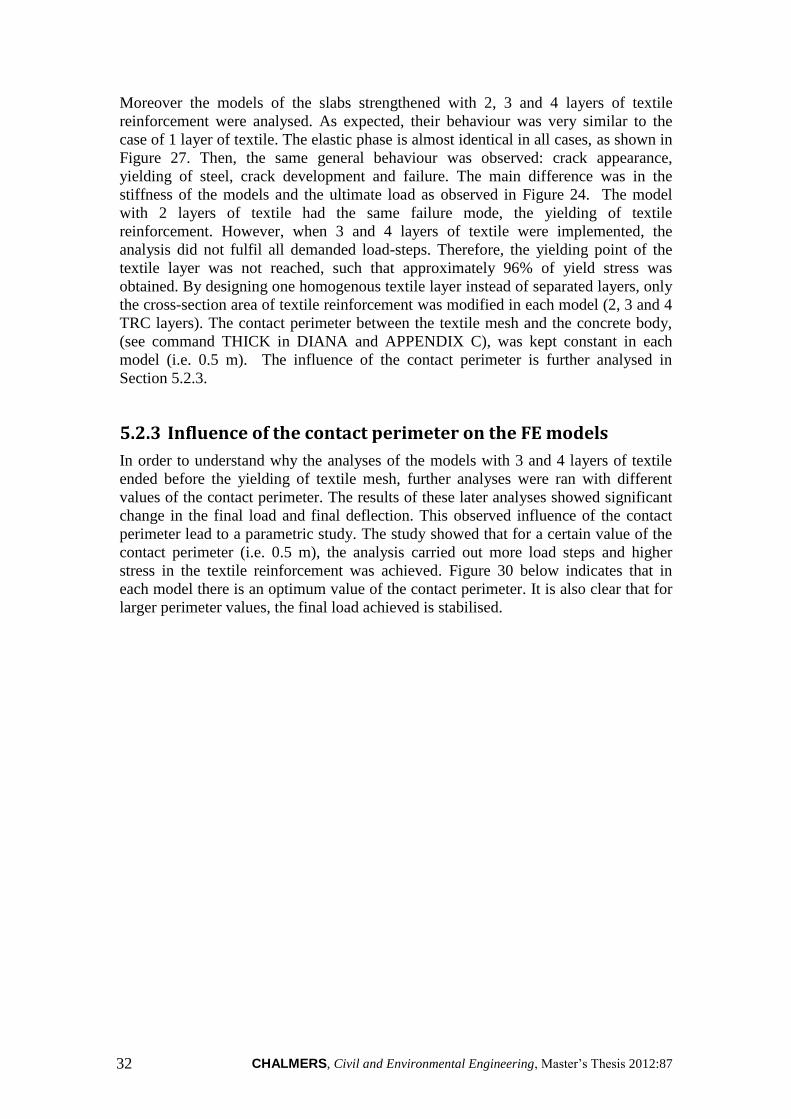
Furthermore, the development of the crack pattern was analysed and is shown in
Figure 29. It should be noted that the numbers represent the order of appearance of
cracks. The cracks are in vertical disposition which is expected for bending tests and
also indicates negligible shear effects.
Figure 29 Crack pattern, 1 layer of TRC.
tests
FE 1 layer
CHALMERS, Civil and Environmental Engineering, Master’s Thesis 2012:87 32
Moreover the models of the slabs strengthened with 2, 3 and 4 layers of textile
reinforcement were analysed. As expected, their behaviour was very similar to the
case of 1 layer of textile. The elastic phase is almost identical in all cases, as shown in
Figure 27. Then, the same general behaviour was observed: crack appearance,
yielding of steel, crack development and failure. The main difference was in the
stiffness of the models and the ultimate load as observed in Figure 24. The model
with 2 layers of textile had the same failure mode, the yielding of textile
reinforcement. However, when 3 and 4 layers of textile were implemented, the
analysis did not fulfil all demanded load-steps. Therefore, the yielding point of the
textile layer was not reached, such that approximately 96% of yield stress was
obtained. By designing one homogenous textile layer instead of separated layers, only
the cross-section area of textile reinforcement was modified in each model (2, 3 and 4
TRC layers). The contact perimeter between the textile mesh and the concrete body,
(see command THICK in DIANA and APPENDIX C), was kept constant in each
model (i.e. 0.5 m). The influence of the contact perimeter is further analysed in
Section 5.2.3.
5.2.3 Influence of the contact perimeter on the FE models
In order to understand why the analyses of the models with 3 and 4 layers of textile
ended before the yielding of textile mesh, further analyses were ran with different
values of the contact perimeter. The results of these later analyses showed significant
change in the final load and final deflection. This observed influence of the contact
perimeter lead to a parametric study. The study showed that for a certain value of the
contact perimeter (i.e. 0.5 m), the analysis carried out more load steps and higher
stress in the textile reinforcement was achieved. Figure 30 below indicates that in
each model there is an optimum value of the contact perimeter. It is also clear that for
larger perimeter values, the final load achieved is stabilised.
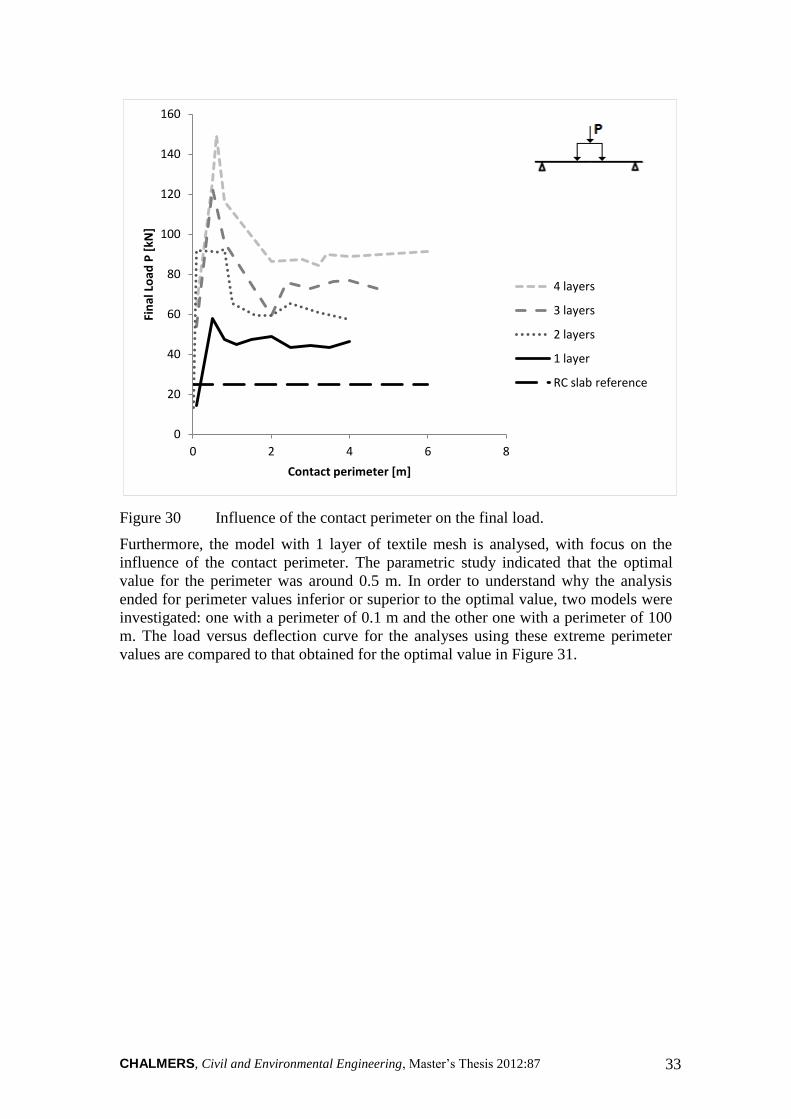
CHALMERS, Civil and Environmental Engineering, Master’s Thesis 2012:87 33
Figure 30 Influence of the contact perimeter on the final load.
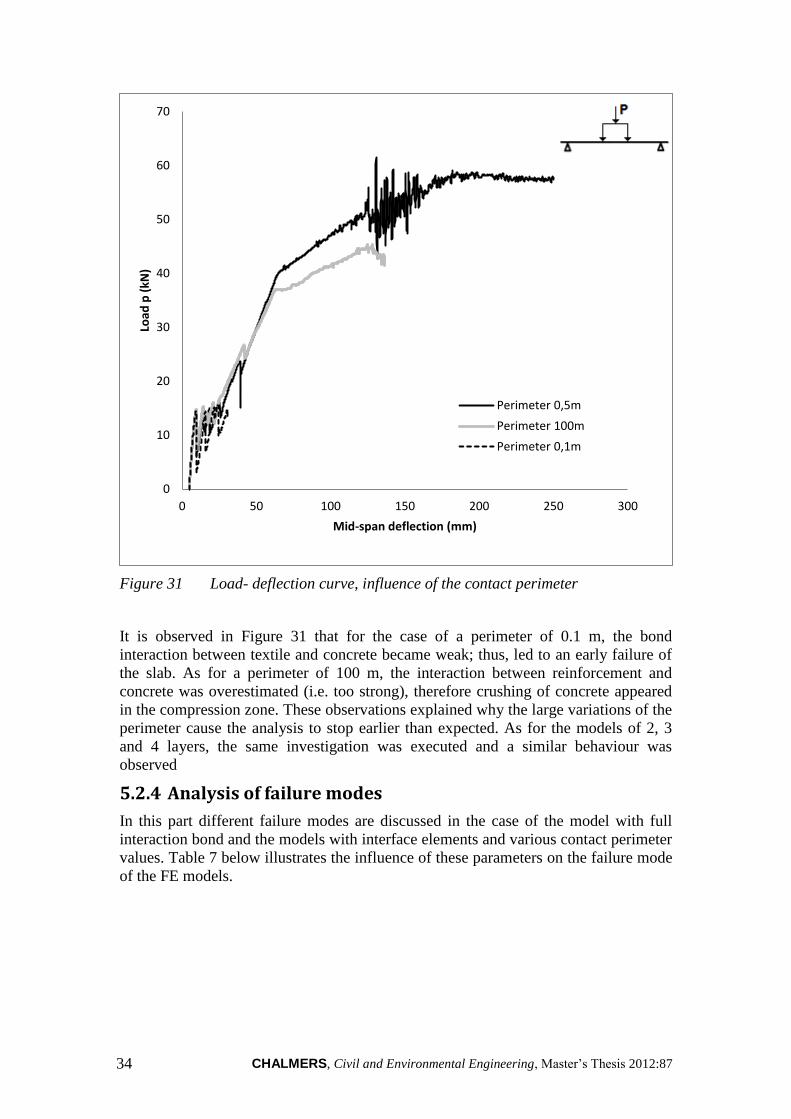
Furthermore, the model with 1 layer of textile mesh is analysed, with focus on the
influence of the contact perimeter. The parametric study indicated that the optimal
value for the perimeter was around 0.5 m. In order to understand why the analysis
ended for perimeter values inferior or superior to the optimal value, two models were
investigated: one with a perimeter of 0.1 m and the other one with a perimeter of 100
m. The load versus deflection curve for the analyses using these extreme perimeter
values are compared to that obtained for the optimal value in Figure 31.
0
20
40
60
80
100
120
140
160
0 2 4 6 8
Fin
al L
oad
P [
kN]
Contact perimeter [m]
4 layers
3 layers
2 layers
1 layer
RC slab reference
CHALMERS, Civil and Environmental Engineering, Master’s Thesis 2012:87 34
Figure 31 Load- deflection curve, influence of the contact perimeter
It is observed in Figure 31 that for the case of a perimeter of 0.1 m, the bond
interaction between textile and concrete became weak; thus, led to an early failure of
the slab. As for a perimeter of 100 m, the interaction between reinforcement and
concrete was overestimated (i.e. too strong), therefore crushing of concrete appeared
in the compression zone. These observations explained why the large variations of the
perimeter cause the analysis to stop earlier than expected. As for the models of 2, 3
and 4 layers, the same investigation was executed and a similar behaviour was
observed
5.2.4 Analysis of failure modes
In this part different failure modes are discussed in the case of the model with full
interaction bond and the models with interface elements and various contact perimeter
values. Table 7 below illustrates the influence of these parameters on the failure mode
of the FE models.
0
10
20
30
40
50
60
70
0 50 100 150 200 250 300
Load
p (
kN)
Mid-span deflection (mm)
Perimeter 0,5m
Perimeter 100m
Perimeter 0,1m
CHALMERS, Civil and Environmental Engineering, Master’s Thesis 2012:87 35
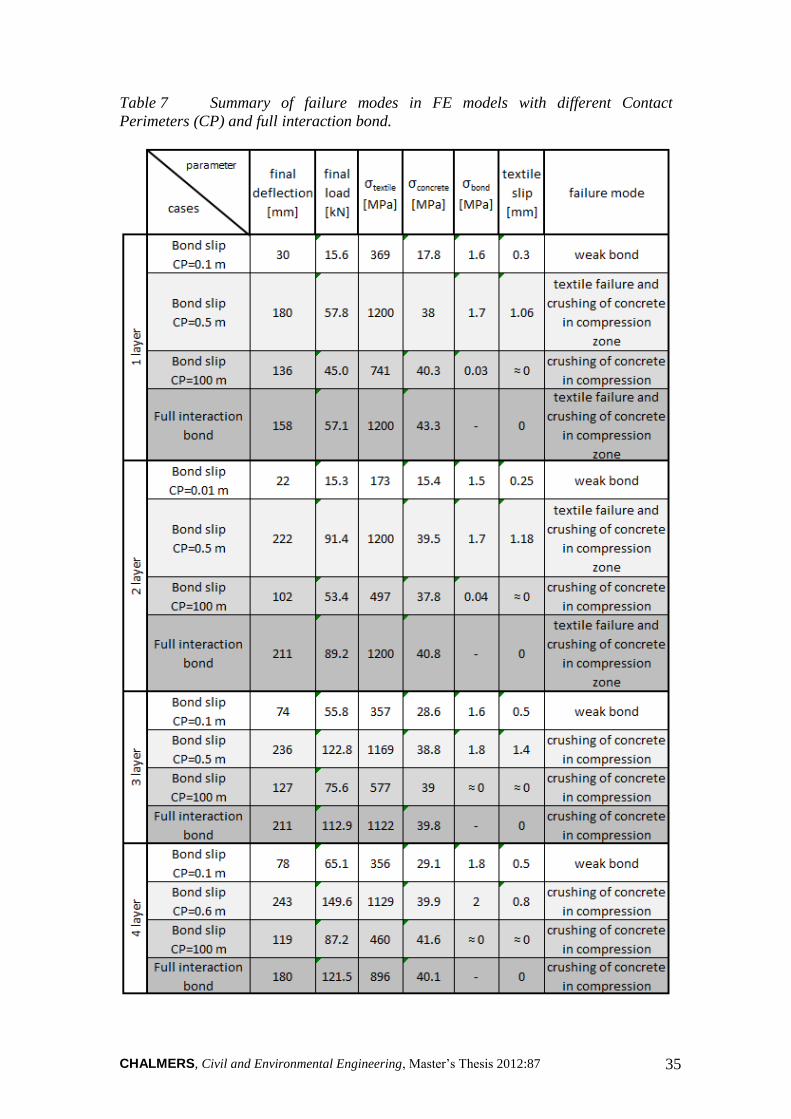
Table 7 Summary of failure modes in FE models with different Contact
Perimeters (CP) and full interaction bond.
CHALMERS, Civil and Environmental Engineering, Master’s Thesis 2012:87 36
The behaviour of the FE models showed in Table 7 can be divided into three
categories regarding the values of the contact perimeter:
Small values of the contact perimeter: the perimeter was underestimated such
that the bond between textile and concrete was too weak. Hence, the tensile
efforts cannot be entirely transferred to the textile mesh. It was assumed that
for this reason the analysis could not go further; the concrete could not reach
its compressive strength and the textile layer did not achieve its yielding point.
The exact failure mode remained uncertain.
Optimum values of the contact perimeter: the ‘peak’ value of the perimeter
was used and the bond was effective. Hence, the textile and steel
reinforcement reached their yielding point. Also, the concrete was beyond its
compressive strength. Therefore, it can be concluded that the failure of the
slab was caused by the failure of textile and the crushing of concrete in the
compression zone.
Enormous values of the contact perimeter: the bond strength was over-
estimated and the slip between textile and concrete was close to zero. Yielding
was not reached neither in textile nor steel reinforcement. Crushing of
concrete appeared in the compression zone which caused the failure of the
slab.
The model with full interaction bond shows the following particularities regarding the
failure mode:
In all four cases of strengthening the crushing of concrete occurs in the
compression zone. This failure mode was expected, due to the fact that the slip
is not allowed.
The transfer of tensile stresses from concrete to textile is adequate in the cases
of 1 and 2 layers of TRC, where the carbon yarns reached their yielding point.
Therefore, the cause of failure was observed to be the fracture of textile and
the crushing of concrete in the compression zone.
For the models with 3 and 4 layers of TRC crushing of concrete appeared in
the compression zone which caused the failure of the slab. The analysis
stopped before the yielding of textile reinforcement. The reasons of that
behaviour remained uncertain.
CHALMERS, Civil and Environmental Engineering, Master’s Thesis 2012:87 37
6 Conclusions and outlook
6.1 Conclusions
The aim of this Master’s Thesis was to model and analyse the effects of strengthening
RC structures using TRC layers. The study particularly focused on the modelling of a
TRC strengthened RC slab in DIANA FX+ software. The results showed that the RC
slabs strengthened with TRC present significant increase in the load-bearing capacity
compared to the unstrengthened RC slabs. Furthermore, for a similar load level, the
deflection was reduced in the case of strengthened slabs. The hand calculations of the
ultimate load and final deflection were consistent with the numerical results.
A secondary objective was to validate the developed model by means of experimental
and numerical results from literature. The simulation results obtained from the
developed FE models were consistent with experimental values from Schladitz
(2012), in terms of final load and deflection.
An investigation of the sensitivity of critical modelling parameters namely, bond-slip
behaviour and textile reinforcement contact perimeter, was included in this study.
Bond-slip behaviour between concrete and reinforcement using interface elements
was found to be beneficial in regards to achieving more realistic results. The contact
perimeter between the textile reinforcement and the concrete body proved to have an
important influence in the development of the FE models. Furthermore, this
parameter’s behaviour presented a peak value for which the interaction between
textile and concrete was optimal. In this case, the failure of the slab was caused by
textile fracture and crushing of concrete in the compression zone. For small values of
the contact perimeter the bond was too weak which caused the analysis to stop
prematurely. For extreme values of the contact perimeter, crushing of concrete in the
compression zone caused the failure and thus perfect bond behaviour (i.e. embedded
reinforcement) was observed.
This project has shown that strengthening RC slabs with TRC layers is an efficient
rehabilitation method. Lastly, it is anticipated that this new concept will be further
developed and become widely used for the rehabilitation of concrete structures.
6.2 Suggestions for further research
This study can be further developed by deeper investigations such as:
Modelling the strengthening textile layers separately with fine-grained
concrete included, in order to obtain an improved observation of the bonding
behaviour between new / old concrete and new concrete / textile
reinforcement.
Micro-scale modelling highlighting the influence of transversal yarns in order
to take into account the complex geometry of the textile mesh.
3D modelling of slabs with two-directional behaviour of the bond between
textile mesh and concrete.
More detailed parametric study of the contact perimeter between textile
reinforcement and concrete.
Optimising the length of TRC layers and analysis of bond-failure and
anchorage length.
CHALMERS, Civil and Environmental Engineering, Master’s Thesis 2012:87 38
7 References
Bosc, J.-L., (2001): Joseph Monier et la naissance du ciment armé, éd. du Linteau,
Paris
Brameshuber, W., (2006): Textile Reinforced Concrete - State-of-the-Art Report of
RILEM TC 201-TRC
Bruckner, A., Ortlepp, R., Curbach M., (2006): Textile reinforced concrete for
strengthening in bending and shear
Bruckner, A., Ortlepp, R., Curbach M., (2008): Anchoring of shear strengthening for
T-beams made of textile reinforced concrete (TRC)
CEB (2010) CEB-FIP Model Code 2010. Bulletin 55, Lausanne Switzerland
Davis, B., (2007): Natural fibre reinforced concrete
http://people.ce.gatech.edu/~kk92/natfiber.pdf (website consulted in June
2012)
DIANA (2010): DIANA Finite Element Analysis, User’s Manual, release 9.4.3. TNO
Building and Construction Research, Delft, Netherlands
DIN 1045-1: Concrete, reinforced and prestressed concrete structures
Groz-Beckert (2010): The Albstadt-Lautlingen bridge: https://news.groz-
beckert.com/pages/en_n3_textile_reinforced_concrete_bridge.php5 (website
consulted in May 2012)
Hegger, J., Will, N., (2004): Tragverhalten von Textilbewehrtem Beton (Load-
Bearing behaviour of TRC) Beton- und Stahlbetonbau 99, Vol. 6, p. 452-455.
Häussler-Combe, U., Hartig, J., (2007): Bond and failure mechanisms of textile
reinforced concrete (TRC) under uniaxial tensile loading
Keil, A., Cuypers, H., Raupach, M., Wastiels, J., (2008): Study of the bond in textile
reinforced concrete: influence of matrix and interface modification
MatWeb (2012): Properties of SIGRAFIL C30 T050 EPY carbon fibre:
http://www.matweb.com (website consulted in April 2012)
Ortlepp, R., Hampel, U., Curbach, M., (2006): A new approach for evaluating bond
capacity of TRC strengthening
Schladitz, F., Frenzel, M., Ehlig, D., Curbach, M., (2012): Bending load capacity
of reinforced concrete slabs strengthened with textile reinforced concrete
Zandi Hanjari, K., (2008): Load-Carrying Capacity of Damaged Concrete Structures.
Licentiate Thesis No. 2008:06, Department of Civil and Environmental
Engineering, Chalmers University of Technology, Göteborg, Sweden, 98 pp.
CHALMERS, Civil and Environmental Engineering, Master’s Thesis 2012:87 39
APPENDIX A
HAND CALCULATIONS
Deflection calculations
The initial deflection of the slab was calculated in order to analyse the behaviour of
the slab in the uncracked and elastic state.
Due to its geometry, the slab is only one directional in bending, which means that its
behaviour can be predicted with a beam approach.
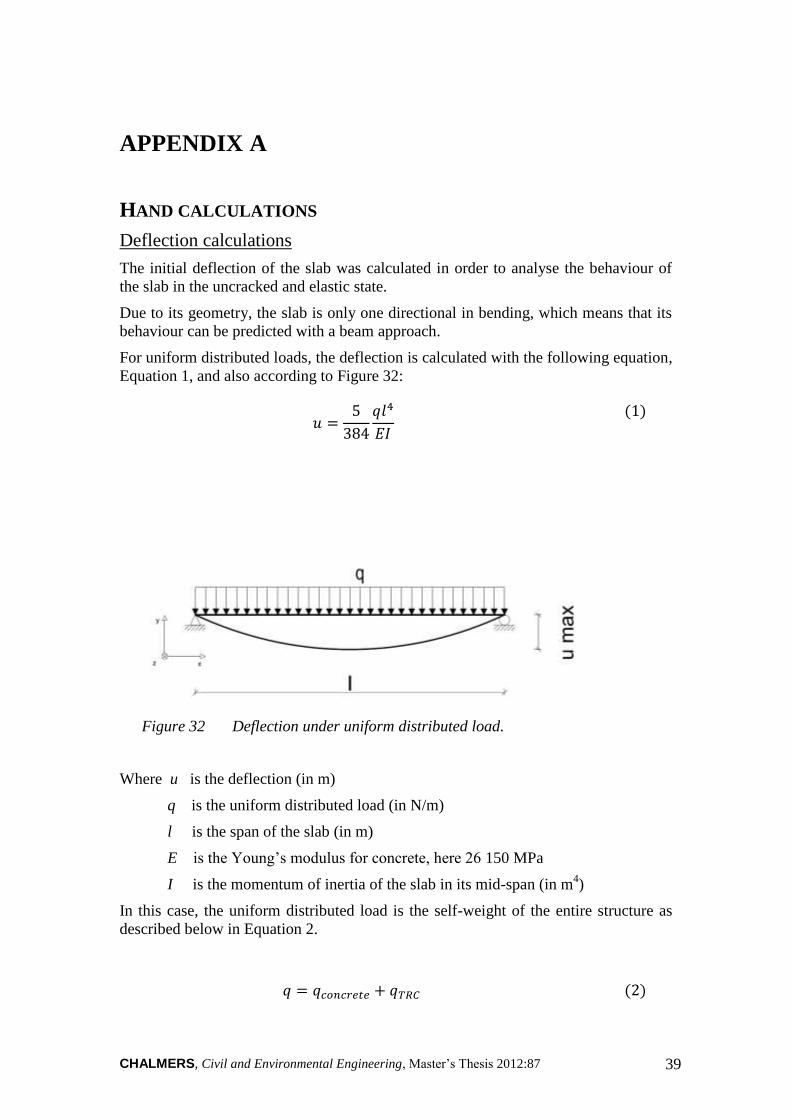
For uniform distributed loads, the deflection is calculated with the following equation,
Equation 1, and also according to Figure 32:
Where u is the deflection (in m)
q is the uniform distributed load (in N/m)
l is the span of the slab (in m)
E is the Young’s modulus for concrete, here 26 150 MPa
I is the momentum of inertia of the slab in its mid-span (in m4)
In this case, the uniform distributed load is the self-weight of the entire structure as
described below in Equation 2.
Figure 32 Deflection under uniform distributed load.
CHALMERS, Civil and Environmental Engineering, Master’s Thesis 2012:87 40
Finally,
The span of the slab, l, is calculated as the distance between the supports to be 6.75 m.
The momentum of inertia of the slab in the mid-span is calculated as the sum of three
momentums according to Equation 3:
With
It is clear that the reinforcement’s influence on the initial deflection of the slab is very
small. After the cracking of the concrete occurs, the textile as well as the steel bars
will play a more important role in the stiffness of the slab.
The deflection caused by the self-weight, uself-weight, can be calculated to be 5.14 mm.
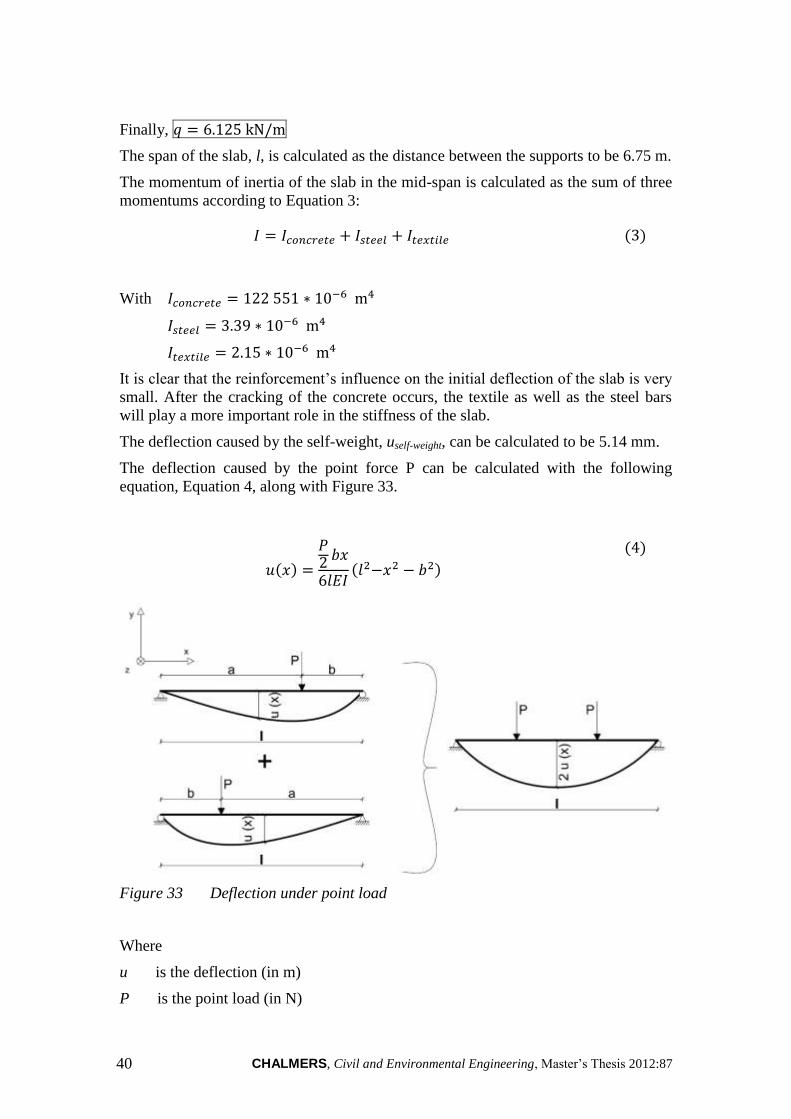
The deflection caused by the point force P can be calculated with the following
equation, Equation 4, along with Figure 33.
Figure 33 Deflection under point load
Where
u is the deflection (in m)
P is the point load (in N)
CHALMERS, Civil and Environmental Engineering, Master’s Thesis 2012:87 41
b is the distance from the application point of the load and the support, according
to Figure 29.
x is the distance from the support where the deflection is calculated, according to
Figure 29.
l is the span of the slab (in m)
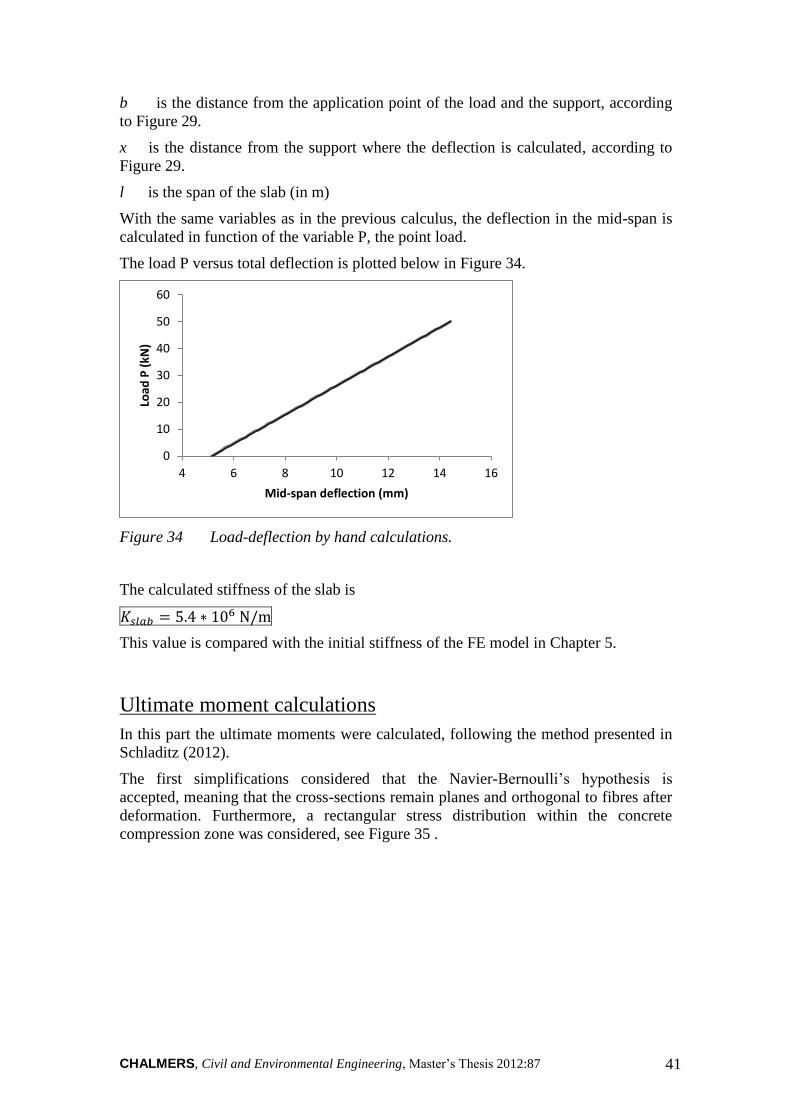
With the same variables as in the previous calculus, the deflection in the mid-span is
calculated in function of the variable P, the point load.
The load P versus total deflection is plotted below in Figure 34.
Figure 34 Load-deflection by hand calculations.
The calculated stiffness of the slab is
This value is compared with the initial stiffness of the FE model in Chapter 5.
Ultimate moment calculations
In this part the ultimate moments were calculated, following the method presented in
Schladitz (2012).
The first simplifications considered that the Navier-Bernoulli’s hypothesis is
accepted, meaning that the cross-sections remain planes and orthogonal to fibres after
deformation. Furthermore, a rectangular stress distribution within the concrete
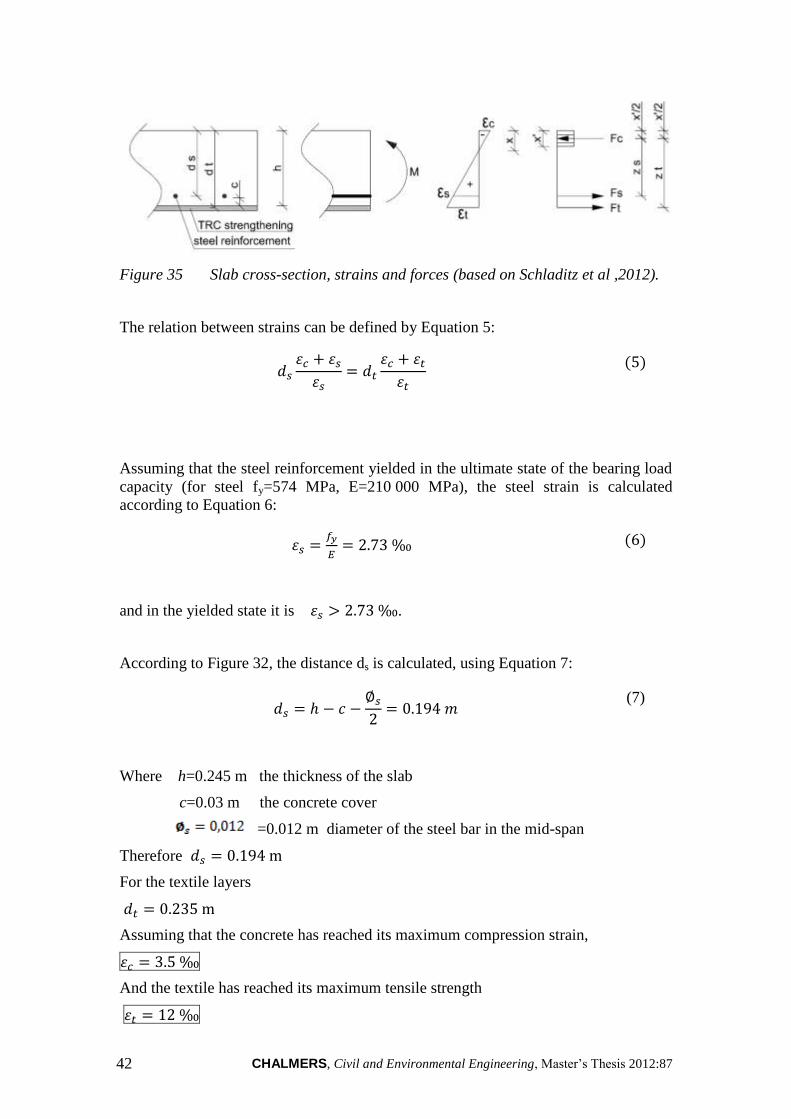
compression zone was considered, see Figure 35 .
0
10
20
30
40
50
60
4 6 8 10 12 14 16
Load
P (
kN)
Mid-span deflection (mm)
CHALMERS, Civil and Environmental Engineering, Master’s Thesis 2012:87 42
Figure 35 Slab cross-section, strains and forces (based on Schladitz et al ,2012).
The relation between strains can be defined by Equation 5:
Assuming that the steel reinforcement yielded in the ultimate state of the bearing load
capacity (for steel fy=574 MPa, E=210 000 MPa), the steel strain is calculated
according to Equation 6:
and in the yielded state it is .
According to Figure 32, the distance ds is calculated, using Equation 7:
(7)
Where h=0.245 m the thickness of the slab
c=0.03 m the concrete cover
=0.012 m diameter of the steel bar in the mid-span
Therefore
For the textile layers
Assuming that the concrete has reached its maximum compression strain,
And the textile has reached its maximum tensile strength
CHALMERS, Civil and Environmental Engineering, Master’s Thesis 2012:87 43
The height of the compression zone in concrete is calculated according to Equation 8:
Assuming a rectangular distribution of the stress, the value of this height is corrected
according to Equation (9):
(9)
The internal lever arms for steel and textile reinforcement are calculated using
Equation 10 and Equation 11, respectively:
(10)
(11)
These values are calculated for every case (i.e.1,2,3 and 4 layers of textile):
Table 8 Summary of variables in each strengthening case.
Values 1 layer 2 layers 3 layers 4 layers
x (m) 0.053 0.053 0.053 0.054
x' (m) 0.042 0.042 0.043 0.043
zs (m) 0.173 0.173 0.173 0.173
zt (m) 0.212 0.213 0.215 0.216
The tensile forces in the steel and textile reinforcements were calculated according to
Equation 12 and Equation 13, respectively:
(12)
(13)
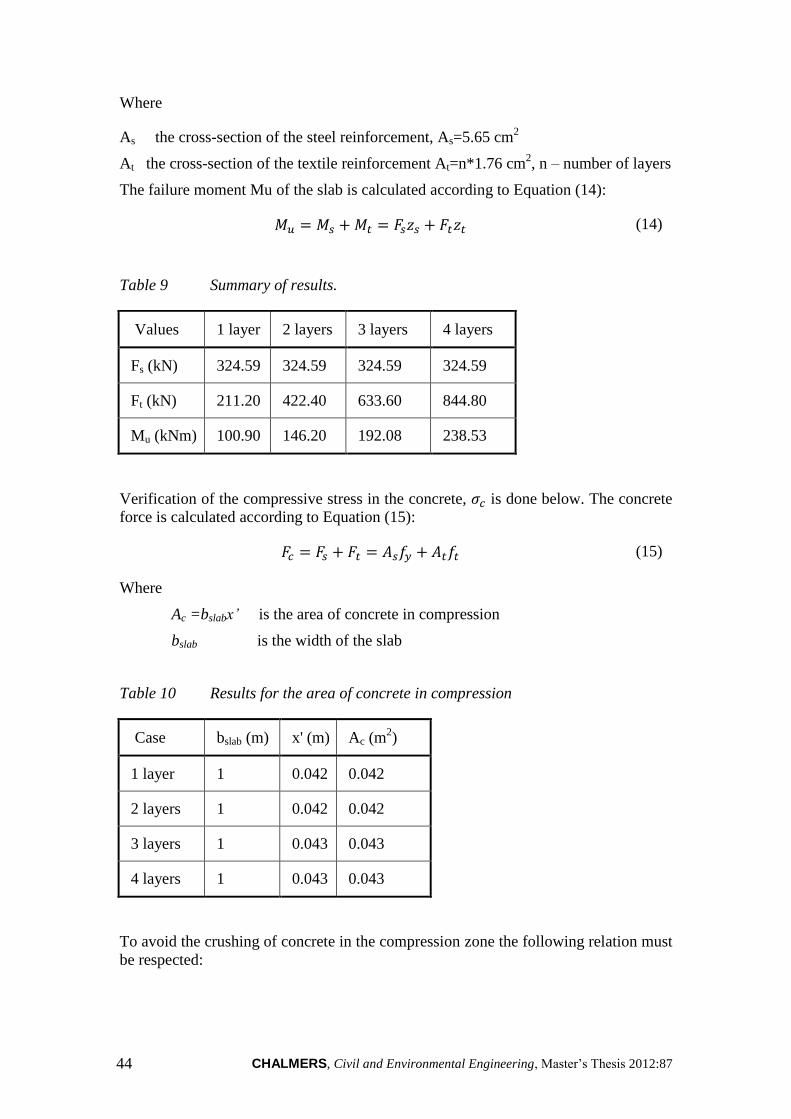
CHALMERS, Civil and Environmental Engineering, Master’s Thesis 2012:87 44
Where
As the cross-section of the steel reinforcement, As=5.65 cm2
At the cross-section of the textile reinforcement At=n*1.76 cm2, n – number of layers
The failure moment Mu of the slab is calculated according to Equation (14):
(14)
Table 9 Summary of results.
Values 1 layer 2 layers 3 layers 4 layers
Fs (kN) 324.59 324.59 324.59 324.59
Ft (kN) 211.20 422.40 633.60 844.80
Mu (kNm) 100.90 146.20 192.08 238.53
Verification of the compressive stress in the concrete, is done below. The concrete
force is calculated according to Equation (15):
(15)
Where
Ac =bslabx’ is the area of concrete in compression
bslab is the width of the slab
Table 10 Results for the area of concrete in compression
Case bslab (m) x' (m) Ac (m2)
1 layer 1 0.042 0.042
2 layers 1 0.042 0.042
3 layers 1 0.043 0.043
4 layers 1 0.043 0.043
To avoid the crushing of concrete in the compression zone the following relation must
be respected:
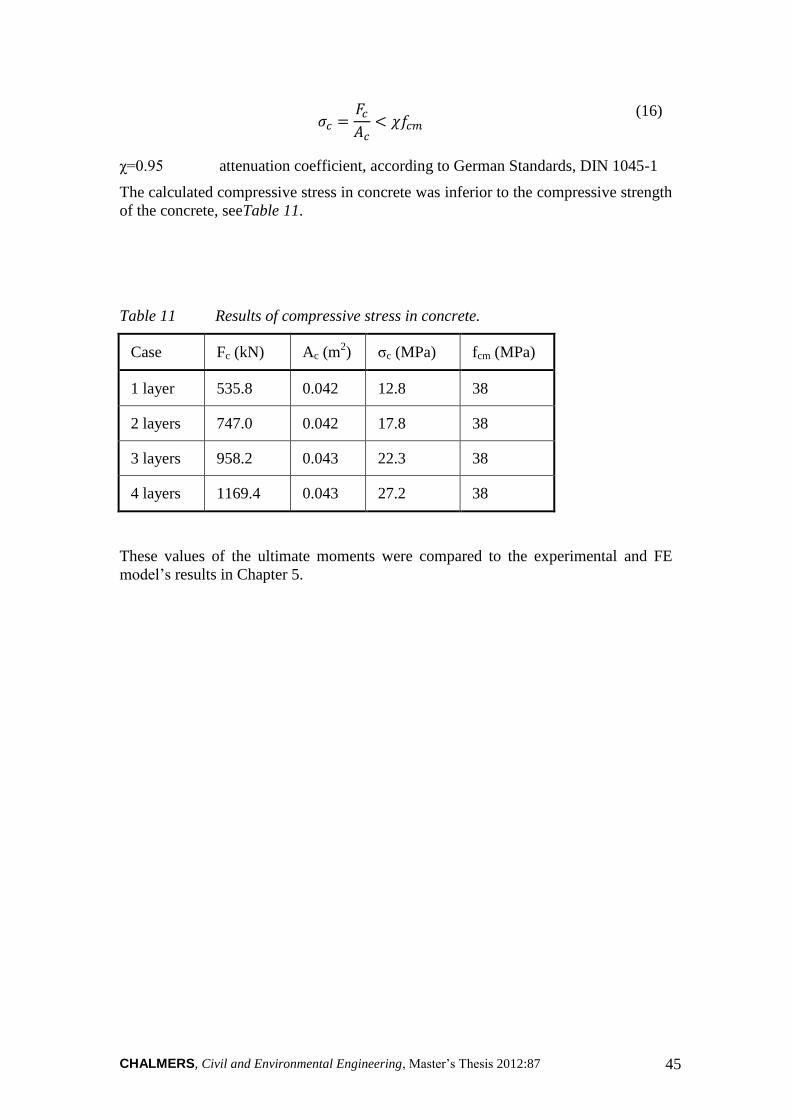
CHALMERS, Civil and Environmental Engineering, Master’s Thesis 2012:87 45
(16)
χ=0.95 attenuation coefficient, according to German Standards, DIN 1045-1
The calculated compressive stress in concrete was inferior to the compressive strength
of the concrete, seeTable 11.
Table 11 Results of compressive stress in concrete.
Case Fc (kN) Ac (m2) σc (MPa) fcm (MPa)
1 layer 535.8 0.042 12.8 38
2 layers 747.0 0.042 17.8 38
3 layers 958.2 0.043 22.3 38
4 layers 1169.4 0.043 27.2 38
These values of the ultimate moments were compared to the experimental and FE
model’s results in Chapter 5.
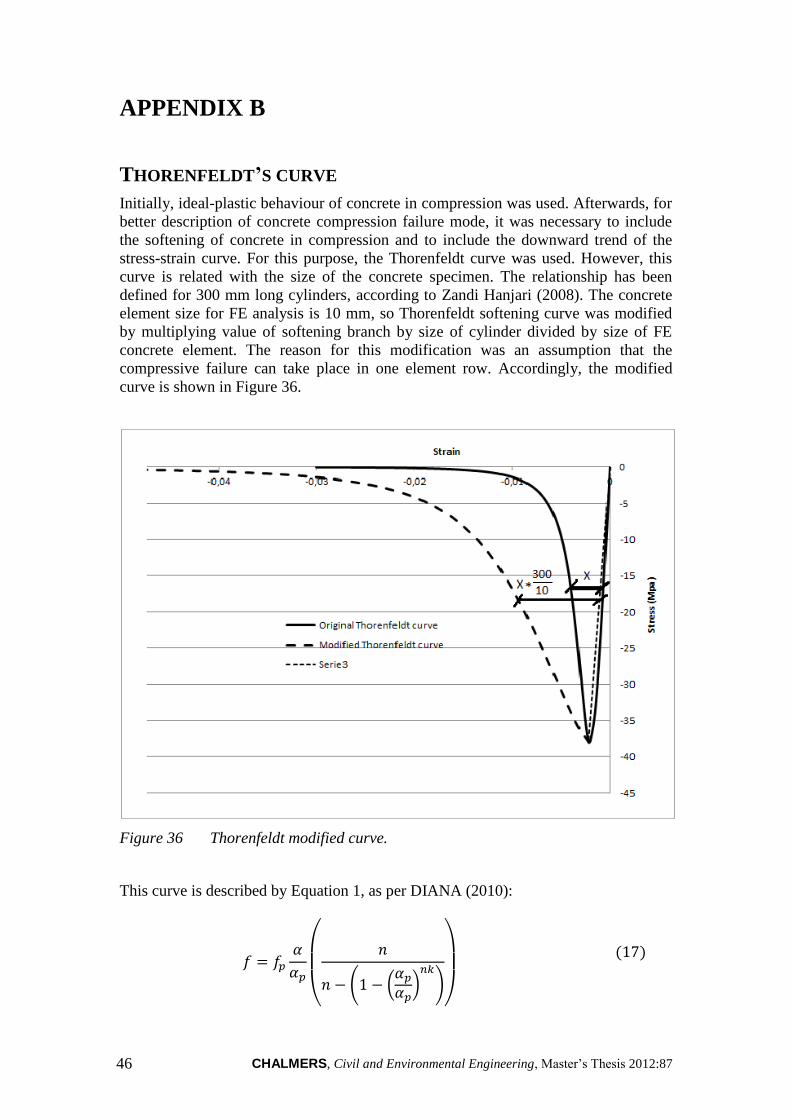
CHALMERS, Civil and Environmental Engineering, Master’s Thesis 2012:87 46
APPENDIX B
THORENFELDT’S CURVE
Initially, ideal-plastic behaviour of concrete in compression was used. Afterwards, for
better description of concrete compression failure mode, it was necessary to include
the softening of concrete in compression and to include the downward trend of the
stress-strain curve. For this purpose, the Thorenfeldt curve was used. However, this
curve is related with the size of the concrete specimen. The relationship has been
defined for 300 mm long cylinders, according to Zandi Hanjari (2008). The concrete
element size for FE analysis is 10 mm, so Thorenfeldt softening curve was modified
by multiplying value of softening branch by size of cylinder divided by size of FE
concrete element. The reason for this modification was an assumption that the
compressive failure can take place in one element row. Accordingly, the modified
curve is shown in Figure 36.
Figure 36 Thorenfeldt modified curve.
This curve is described by Equation 1, as per DIANA (2010):
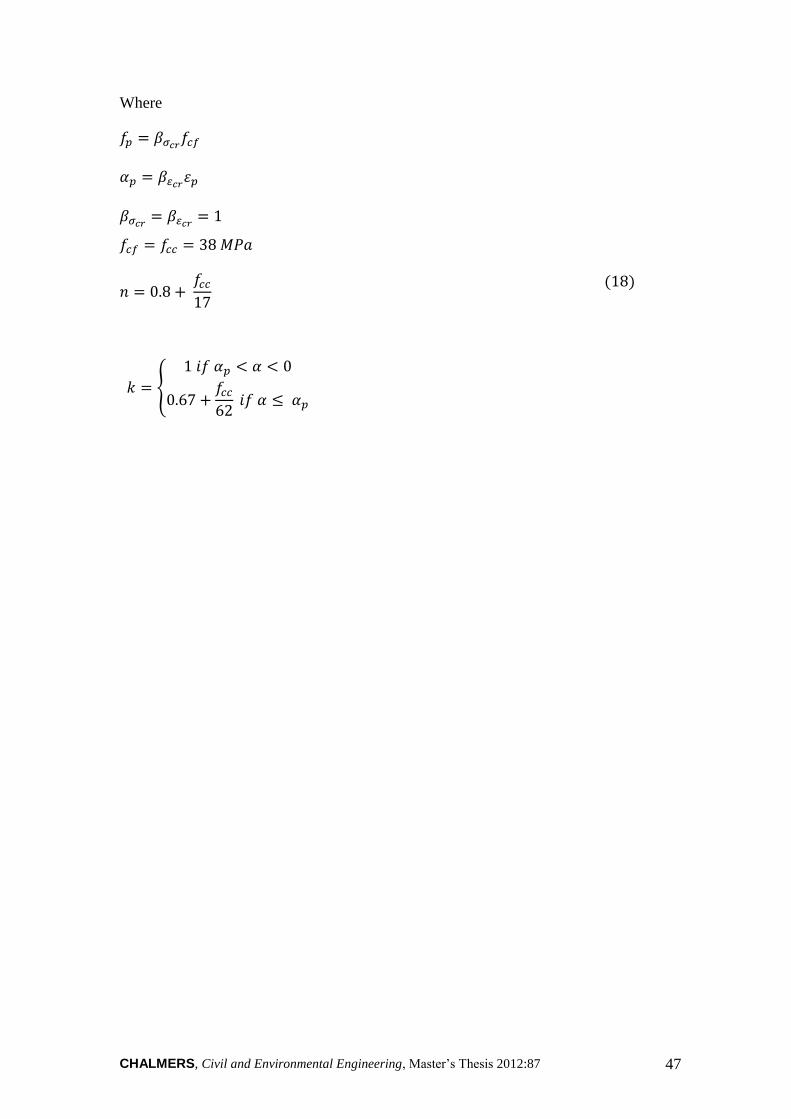
CHALMERS, Civil and Environmental Engineering, Master’s Thesis 2012:87 47
Where
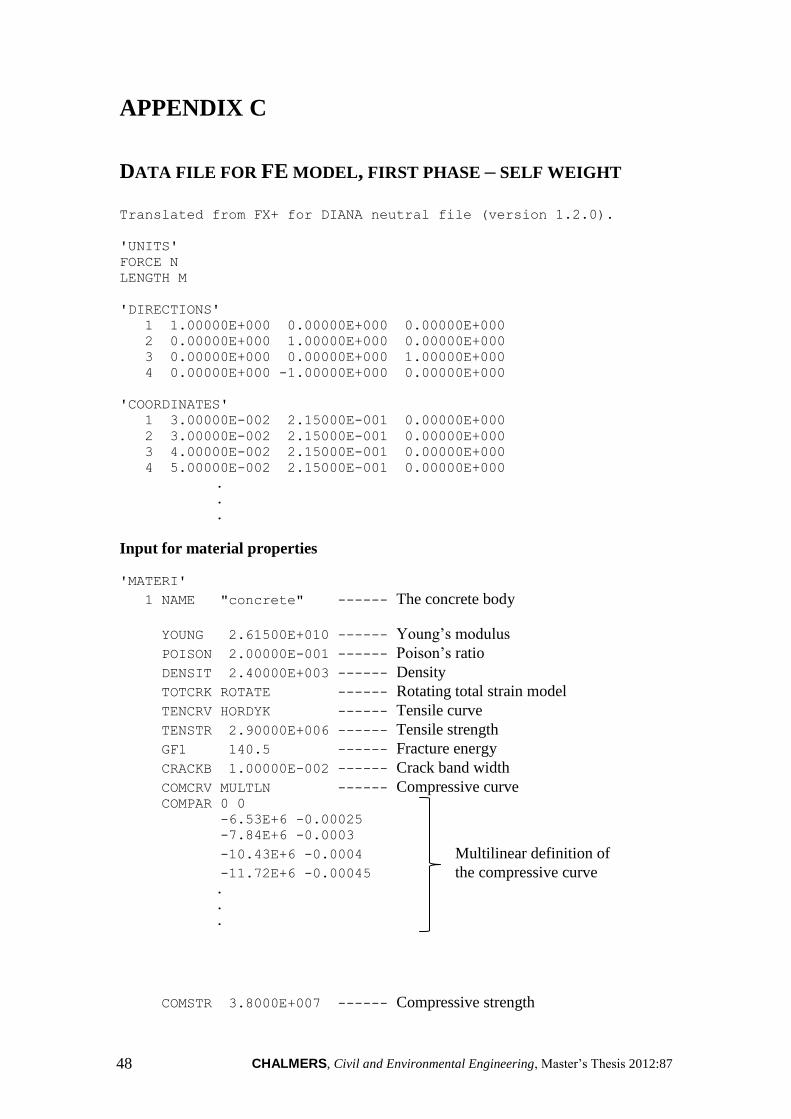
CHALMERS, Civil and Environmental Engineering, Master’s Thesis 2012:87 48
APPENDIX C
DATA FILE FOR FE MODEL, FIRST PHASE – SELF WEIGHT
Translated from FX+ for DIANA neutral file (version 1.2.0).
'UNITS'
FORCE N
LENGTH M
'DIRECTIONS'
1 1.00000E+000 0.00000E+000 0.00000E+000
2 0.00000E+000 1.00000E+000 0.00000E+000
3 0.00000E+000 0.00000E+000 1.00000E+000
4 0.00000E+000 -1.00000E+000 0.00000E+000
'COORDINATES'
1 3.00000E-002 2.15000E-001 0.00000E+000
2 3.00000E-002 2.15000E-001 0.00000E+000
3 4.00000E-002 2.15000E-001 0.00000E+000
4 5.00000E-002 2.15000E-001 0.00000E+000
.
.
.
Input for material properties
'MATERI'
1 NAME "concrete" ------ The concrete body
YOUNG 2.61500E+010 ------ Young’s modulus
POISON 2.00000E-001 ------ Poison’s ratio
DENSIT 2.40000E+003 ------ Density
TOTCRK ROTATE ------ Rotating total strain model
TENCRV HORDYK ------ Tensile curve
TENSTR 2.90000E+006 ------ Tensile strength
GF1 140.5 ------ Fracture energy
CRACKB 1.00000E-002 ------ Crack band width
COMCRV MULTLN ------ Compressive curve COMPAR 0 0
-6.53E+6 -0.00025
-7.84E+6 -0.0003
-10.43E+6 -0.0004 Multilinear definition of
-11.72E+6 -0.00045 the compressive curve .
.
.
COMSTR 3.8000E+007 ------ Compressive strength
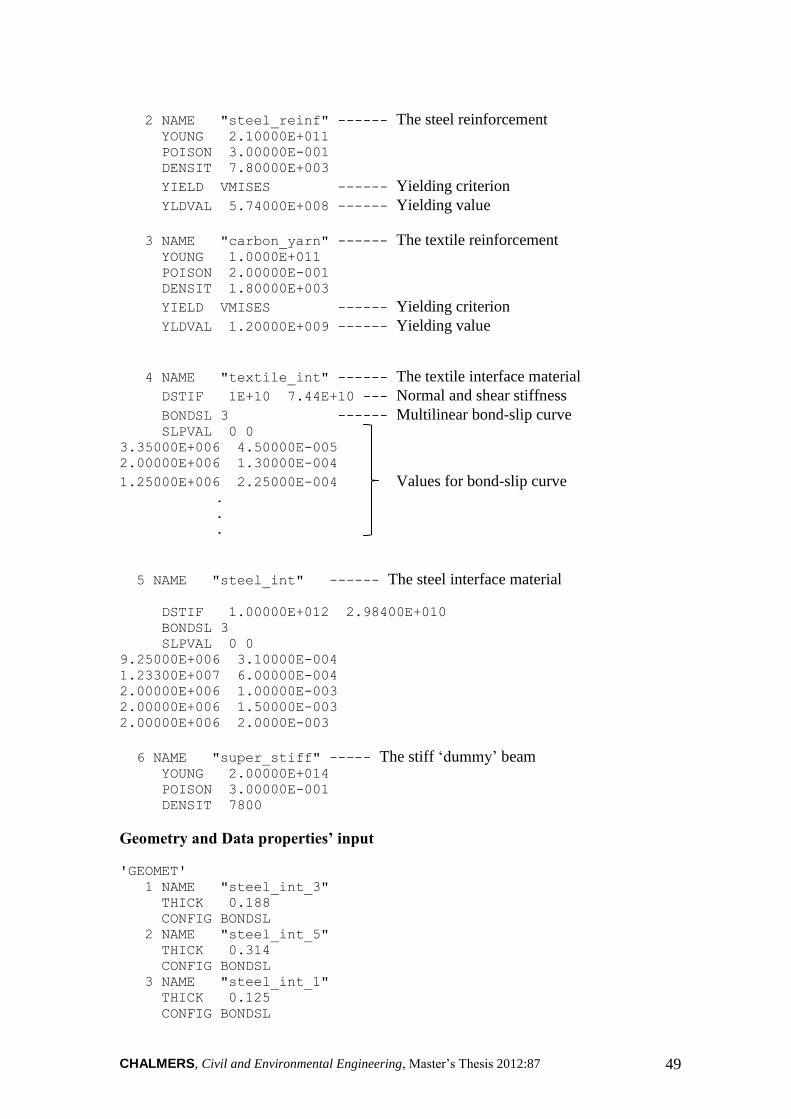
CHALMERS, Civil and Environmental Engineering, Master’s Thesis 2012:87 49
2 NAME "steel_reinf" ------ The steel reinforcement YOUNG 2.10000E+011
POISON 3.00000E-001
DENSIT 7.80000E+003
YIELD VMISES ------ Yielding criterion
YLDVAL 5.74000E+008 ------ Yielding value
3 NAME "carbon_yarn" ------ The textile reinforcement YOUNG 1.0000E+011
POISON 2.00000E-001
DENSIT 1.80000E+003
YIELD VMISES ------ Yielding criterion
YLDVAL 1.20000E+009 ------ Yielding value
4 NAME "textile_int" ------ The textile interface material
DSTIF 1E+10 7.44E+10 --- Normal and shear stiffness
BONDSL 3 ------ Multilinear bond-slip curve SLPVAL 0 0
3.35000E+006 4.50000E-005
2.00000E+006 1.30000E-004
1.25000E+006 2.25000E-004 Values for bond-slip curve .
.
.
5 NAME "steel_int" ------ The steel interface material
DSTIF 1.00000E+012 2.98400E+010
BONDSL 3
SLPVAL 0 0
9.25000E+006 3.10000E-004
1.23300E+007 6.00000E-004
2.00000E+006 1.00000E-003
2.00000E+006 1.50000E-003
2.00000E+006 2.0000E-003
6 NAME "super_stiff" ----- The stiff ‘dummy’ beam
YOUNG 2.00000E+014
POISON 3.00000E-001
DENSIT 7800
Geometry and Data properties’ input
'GEOMET'
1 NAME "steel_int_3"
THICK 0.188
CONFIG BONDSL
2 NAME "steel_int_5"
THICK 0.314
CONFIG BONDSL
3 NAME "steel_int_1"
THICK 0.125
CONFIG BONDSL
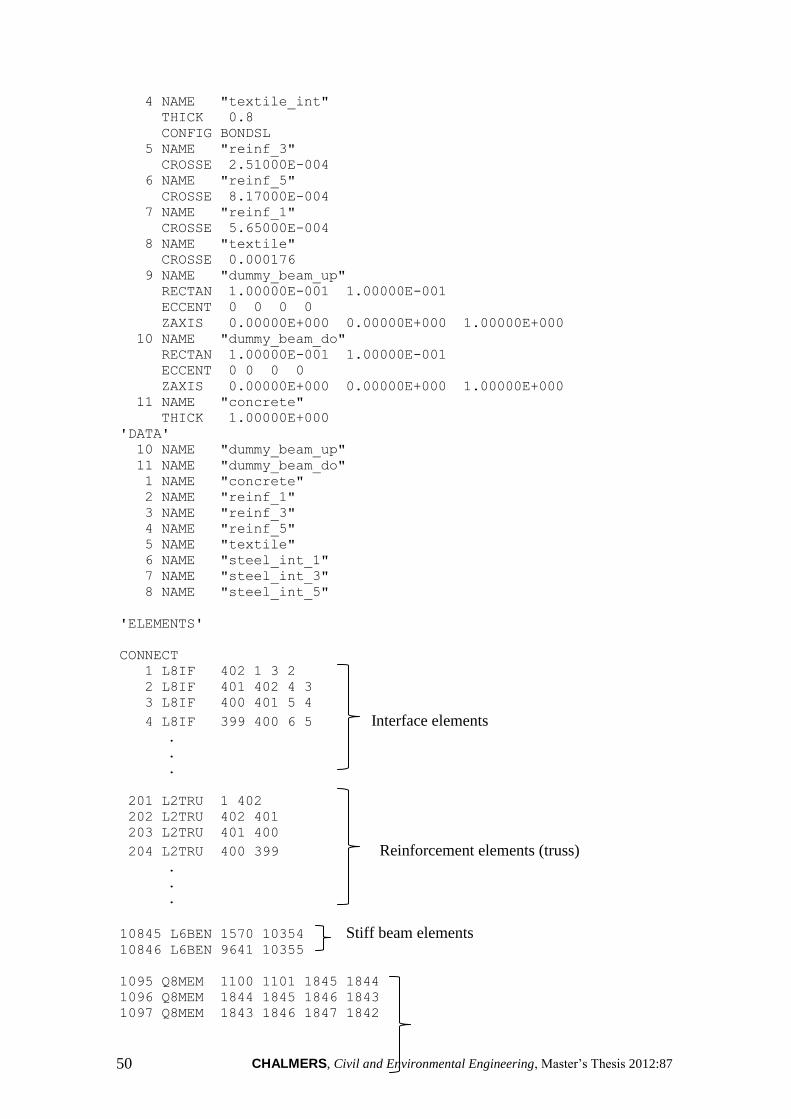
CHALMERS, Civil and Environmental Engineering, Master’s Thesis 2012:87 50
4 NAME "textile_int"
THICK 0.8
CONFIG BONDSL
5 NAME "reinf_3"
CROSSE 2.51000E-004
6 NAME "reinf_5"
CROSSE 8.17000E-004
7 NAME "reinf_1"
CROSSE 5.65000E-004
8 NAME "textile"
CROSSE 0.000176
9 NAME "dummy_beam_up"
RECTAN 1.00000E-001 1.00000E-001
ECCENT 0 0 0 0
ZAXIS 0.00000E+000 0.00000E+000 1.00000E+000
10 NAME "dummy_beam_do"
RECTAN 1.00000E-001 1.00000E-001
ECCENT 0 0 0 0
ZAXIS 0.00000E+000 0.00000E+000 1.00000E+000
11 NAME "concrete"
THICK 1.00000E+000
'DATA'
10 NAME "dummy_beam_up"
11 NAME "dummy_beam_do"
1 NAME "concrete"
2 NAME "reinf_1"
3 NAME "reinf_3"
4 NAME "reinf_5"
5 NAME "textile"
6 NAME "steel_int_1"
7 NAME "steel_int_3"
8 NAME "steel_int_5"
'ELEMENTS'
CONNECT
1 L8IF 402 1 3 2
2 L8IF 401 402 4 3
3 L8IF 400 401 5 4
4 L8IF 399 400 6 5 Interface elements .
.
.
201 L2TRU 1 402
202 L2TRU 402 401
203 L2TRU 401 400
204 L2TRU 400 399 Reinforcement elements (truss) .
.
.
10845 L6BEN 1570 10354 Stiff beam elements 10846 L6BEN 9641 10355
1095 Q8MEM 1100 1101 1845 1844
1096 Q8MEM 1844 1845 1846 1843
1097 Q8MEM 1843 1846 1847 1842
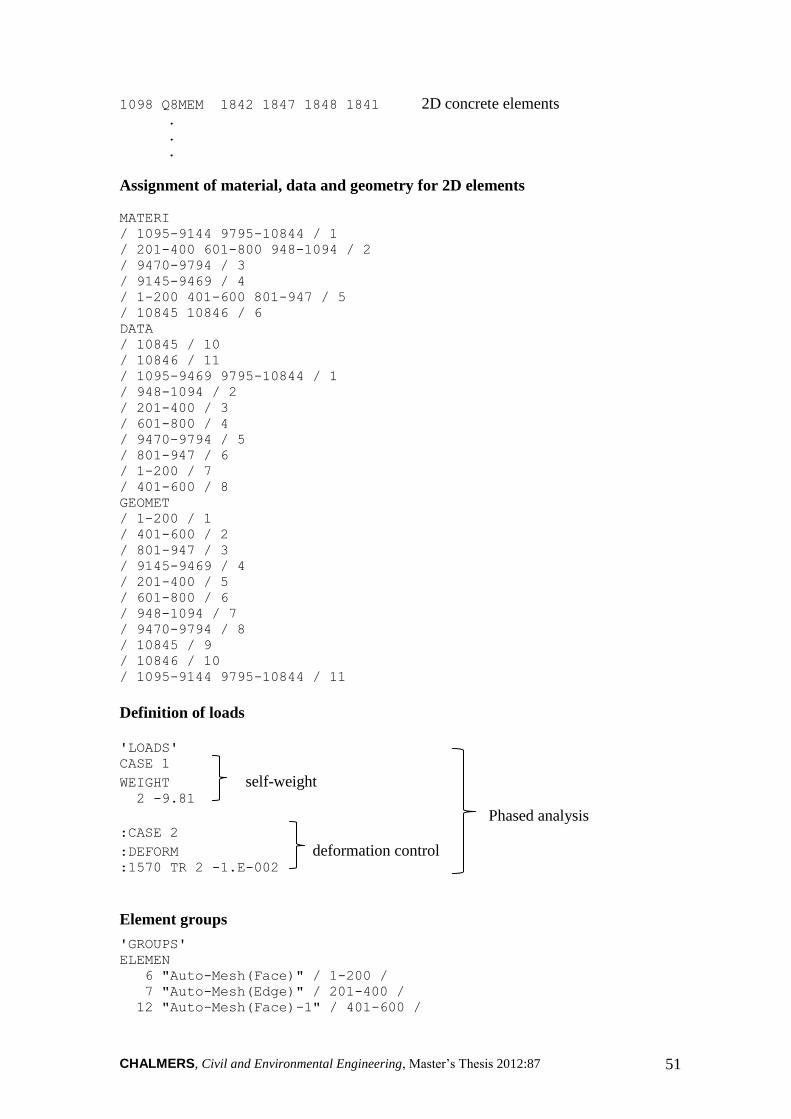
CHALMERS, Civil and Environmental Engineering, Master’s Thesis 2012:87 51
1098 Q8MEM 1842 1847 1848 1841 2D concrete elements .
.
.
Assignment of material, data and geometry for 2D elements
MATERI
/ 1095-9144 9795-10844 / 1
/ 201-400 601-800 948-1094 / 2
/ 9470-9794 / 3
/ 9145-9469 / 4
/ 1-200 401-600 801-947 / 5
/ 10845 10846 / 6
DATA
/ 10845 / 10
/ 10846 / 11
/ 1095-9469 9795-10844 / 1
/ 948-1094 / 2
/ 201-400 / 3
/ 601-800 / 4
/ 9470-9794 / 5
/ 801-947 / 6
/ 1-200 / 7
/ 401-600 / 8
GEOMET
/ 1-200 / 1
/ 401-600 / 2
/ 801-947 / 3
/ 9145-9469 / 4
/ 201-400 / 5
/ 601-800 / 6
/ 948-1094 / 7
/ 9470-9794 / 8
/ 10845 / 9
/ 10846 / 10
/ 1095-9144 9795-10844 / 11
Definition of loads
'LOADS'
CASE 1
WEIGHT self-weight 2 -9.81
Phased analysis :CASE 2
:DEFORM deformation control :1570 TR 2 -1.E-002
Element groups
'GROUPS'
ELEMEN
6 "Auto-Mesh(Face)" / 1-200 /
7 "Auto-Mesh(Edge)" / 201-400 /
12 "Auto-Mesh(Face)-1" / 401-600 /
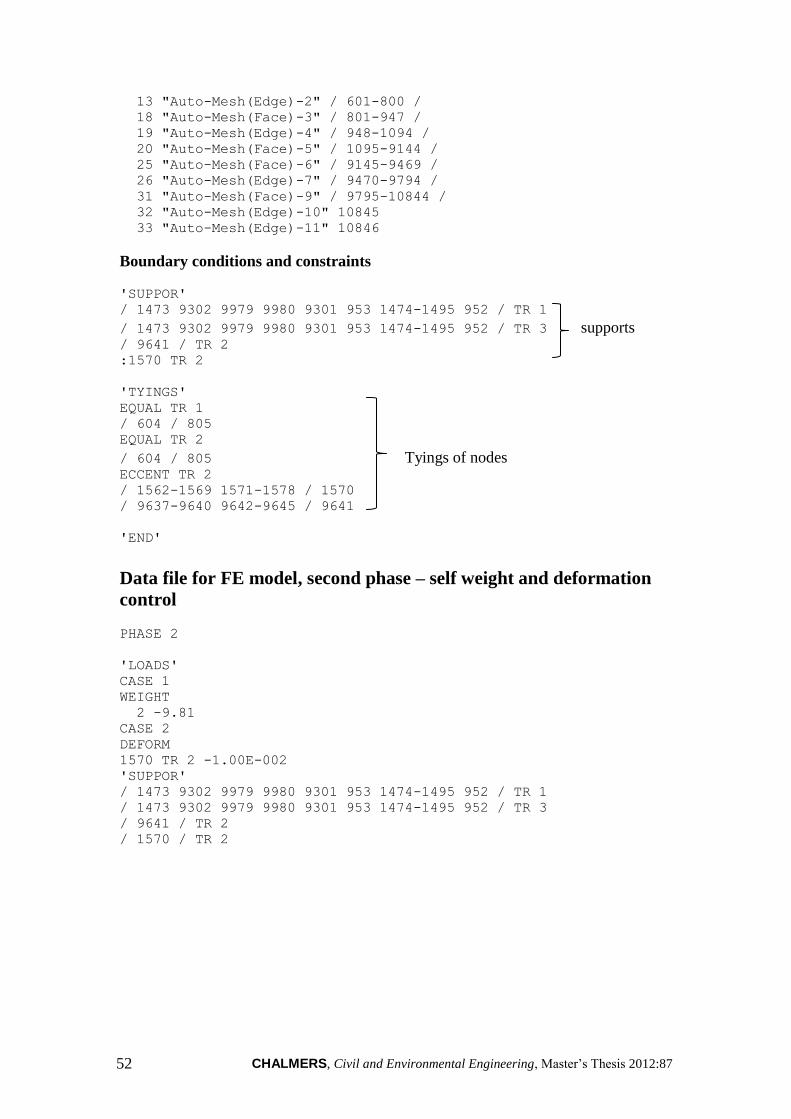
CHALMERS, Civil and Environmental Engineering, Master’s Thesis 2012:87 52
13 "Auto-Mesh(Edge)-2" / 601-800 /
18 "Auto-Mesh(Face)-3" / 801-947 /
19 "Auto-Mesh(Edge)-4" / 948-1094 /
20 "Auto-Mesh(Face)-5" / 1095-9144 /
25 "Auto-Mesh(Face)-6" / 9145-9469 /
26 "Auto-Mesh(Edge)-7" / 9470-9794 /
31 "Auto-Mesh(Face)-9" / 9795-10844 /
32 "Auto-Mesh(Edge)-10" 10845
33 "Auto-Mesh(Edge)-11" 10846
Boundary conditions and constraints
'SUPPOR'
/ 1473 9302 9979 9980 9301 953 1474-1495 952 / TR 1
/ 1473 9302 9979 9980 9301 953 1474-1495 952 / TR 3 supports / 9641 / TR 2
:1570 TR 2
'TYINGS'
EQUAL TR 1
/ 604 / 805
EQUAL TR 2
/ 604 / 805 Tyings of nodes ECCENT TR 2
/ 1562-1569 1571-1578 / 1570
/ 9637-9640 9642-9645 / 9641
'END'
Data file for FE model, second phase – self weight and deformation
control
PHASE 2
'LOADS'
CASE 1
WEIGHT
2 -9.81
CASE 2
DEFORM
1570 TR 2 -1.00E-002
'SUPPOR'
/ 1473 9302 9979 9980 9301 953 1474-1495 952 / TR 1
/ 1473 9302 9979 9980 9301 953 1474-1495 952 / TR 3
/ 9641 / TR 2
/ 1570 / TR 2
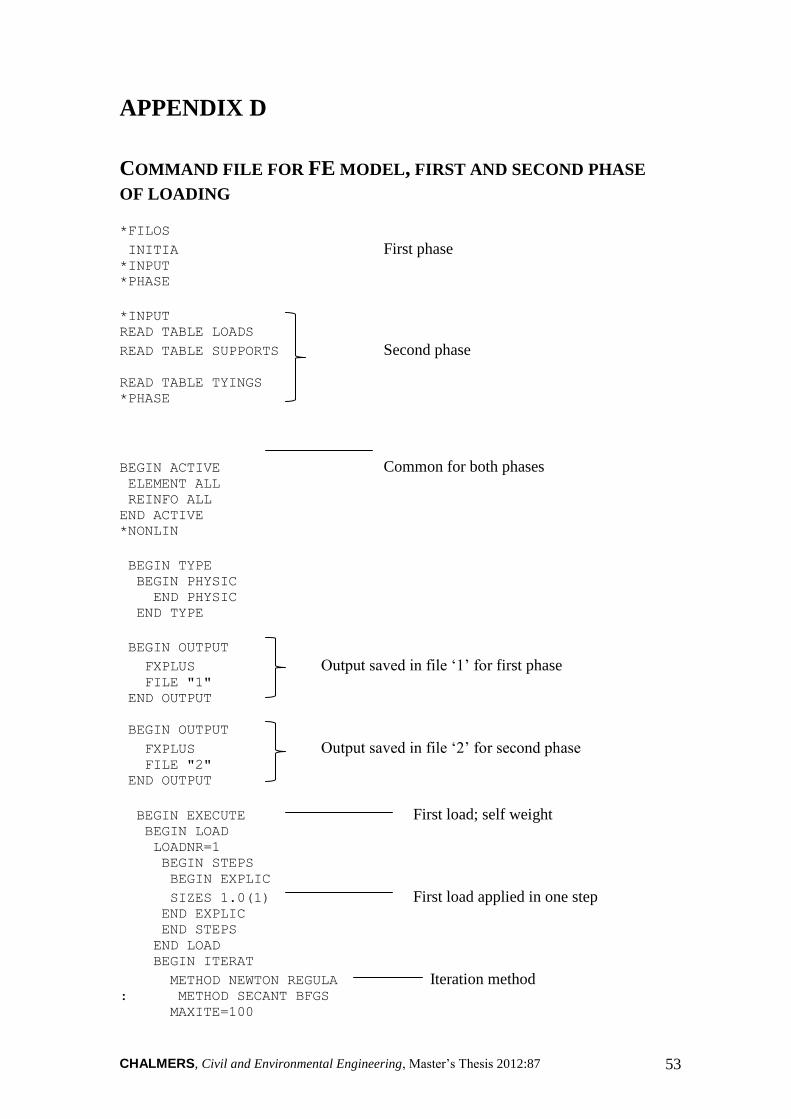
CHALMERS, Civil and Environmental Engineering, Master’s Thesis 2012:87 53
APPENDIX D
COMMAND FILE FOR FE MODEL, FIRST AND SECOND PHASE
OF LOADING
*FILOS
INITIA First phase *INPUT
*PHASE
*INPUT
READ TABLE LOADS
READ TABLE SUPPORTS Second phase
READ TABLE TYINGS
*PHASE
BEGIN ACTIVE Common for both phases ELEMENT ALL
REINFO ALL
END ACTIVE
*NONLIN
BEGIN TYPE
BEGIN PHYSIC
END PHYSIC
END TYPE
BEGIN OUTPUT
FXPLUS Output saved in file ‘1’ for first phase FILE "1"
END OUTPUT
BEGIN OUTPUT
FXPLUS Output saved in file ‘2’ for second phase FILE "2"
END OUTPUT
BEGIN EXECUTE First load; self weight BEGIN LOAD
LOADNR=1
BEGIN STEPS
BEGIN EXPLIC
SIZES 1.0(1) First load applied in one step END EXPLIC
END STEPS
END LOAD
BEGIN ITERAT
METHOD NEWTON REGULA Iteration method : METHOD SECANT BFGS
MAXITE=100
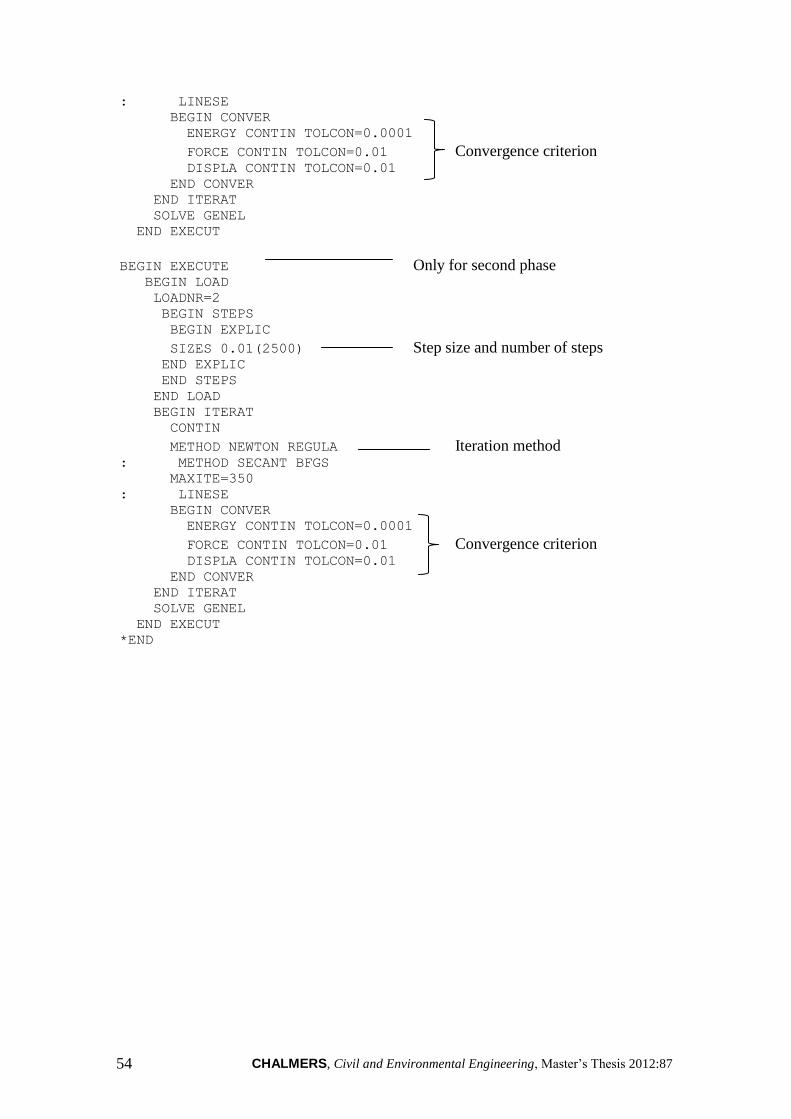
CHALMERS, Civil and Environmental Engineering, Master’s Thesis 2012:87 54
: LINESE
BEGIN CONVER
ENERGY CONTIN TOLCON=0.0001
FORCE CONTIN TOLCON=0.01 Convergence criterion DISPLA CONTIN TOLCON=0.01
END CONVER
END ITERAT
SOLVE GENEL
END EXECUT
BEGIN EXECUTE Only for second phase BEGIN LOAD
LOADNR=2
BEGIN STEPS
BEGIN EXPLIC
SIZES 0.01(2500) Step size and number of steps END EXPLIC
END STEPS
END LOAD
BEGIN ITERAT
CONTIN
METHOD NEWTON REGULA Iteration method : METHOD SECANT BFGS
MAXITE=350
: LINESE
BEGIN CONVER
ENERGY CONTIN TOLCON=0.0001
FORCE CONTIN TOLCON=0.01 Convergence criterion DISPLA CONTIN TOLCON=0.01
END CONVER
END ITERAT
SOLVE GENEL
END EXECUT
*END