Embed Size (px)
Citation preview

STRENGTHENING REGIONAL TRADE ANDPRODUCTION NETWORKS THROUGH
TRANSPORT CONNECTIVITY INSOUTH AND SOUTH-WEST ASIA
Prabir DeJuly 2014
DEVELO
PMEN
T PAPERS 1401
South and South-West Asia O!ce
ESCAP
SOUTH AND SOUTH-WEST ASIA
OFFICE
Strengthening Regional Trade and Production Networks through Transport Connectivity July 2014
2
Disclaimer: The views expressed in this Development Paper are those of the author(s) and should not necessarily be considered as reflecting the views or carrying the endorsement of the United Nations. Development Papers describe research in progress by the author(s) and are published to elicit comments and to further debate. This publication has been issued without formal editing.
For any further details, please contact: Dr. Nagesh Kumar, Director South and South-West Asia Office (SSWA) Economic and Social Commission for Asia and the Pacific (ESCAP) C-2 Qutab Institutional Area, New Delhi-110016, India Email: [email protected]
South and South-West Asia Development Papers 1401 July 2014
3
Contents
Foreword 4
Abstract 5
1 Introduction 6
2 Intra-regional Trade in SSWA: Importance and Scope of Production Networks
6
3 Production Networks in SSWA: The Case of Trade in Parts and Components
11
4 Transport Connectivity Challenges to Development of Production Networks in SSWA
16
5 A Comparative Assessment of Efficiency of Regional Transport Corridors in SSWA
18
6 Key Policies and Way Forward 22
7 Concluding Remarks 25
References 26
Annex Tables 28

Strengthening Regional Trade and Production Networks through Transport Connectivity July 2014
4
Foreword
The Development Papers series of the ESCAP South and South-West Asia Office (ESCAP-SSWA) promotes and disseminates policy-relevant research on the development challenges facing South and South-West Asia. It features policy research conducted at ESCAP-SSWA as well as by outside experts from within the region and beyond. The objective is to foster an informed debate on development policy challenges facing the subregion and sharing of development experiences and best practices. In this paper prepared for ESCAP-SSWA, Prabir De explores the potential of developing regional production networks in SSWA. In the light of his analysis of trends in intra-regional trade in ‘parts and components’ in SSWA presented he observes that a region-wide production network in the sector remains underdeveloped despite high potential. He argues that poor transport connectivity between SSWA countries was one of the main reasons for this situation. The paper finds that SSWA countries possess complementarities for development of production networks in many sectors and promoting such networks through better connectivity measures would help to collectively enhance the trade competitiveness of the region’s final outputs in world markets. The paper further undertakes a comparison of efficiency of some of the main transport corridors and modes used for cross-border trade in the SSWA region. It is found that some overland corridors, both rail and road advocated by ESCAP, exhibit certain advantages over other transport modes in connecting major production centers located across the region. Therefore, improving transport infrastructure and transit facilitation along these corridors can help production networks to develop besides other externalities for development.
We hope that this paper will contribute to the ongoing discourse on the importance of linkages between manufacturing activities in the subregion and the role of transport connectivity in fostering such linkages.
Nagesh Kumar Head, ESCAP South and South-West Asia Office
South and South-West Asia Development Papers 1401 July 2014
5
Strengthening Regional Trade and Production Networks Through Transport Connectivity in South and South-West Asia
Prabir De1
Abstract
South and South-West Asia (SSWA) region has been able to improve intra-regional trade during the last decade. However, much is left to be done to realise the full trade potential between SSWA countries, which also share important complementarities that can become the basis of region-wide production networks. Such networks would enhance the combined productivity and competitiveness of SSWA, but their development is stifled by poor intra-regional connectivity status. The quality and capacity of the subregion’s infrastructure, both on the national and cross-border levels, is certainly a matter of concern. SSWA regional economic cooperation programmes have to be made much stronger to address regional infrastructure needs and build enabling institutions and policies. This paper observes, in the light of a case study of regional trade in ‘parts and components’, that SSWA countries must improve its supply chain connectivity considerably in order to effectively link their production units with global value chains. Further, a comparative analysis of efficiency across different modes of cross-border transportation in the subregion shows that overland transport corridors such as TIPI-BM and ITI-DKD proposed by ESCAP can play important role in the development of regional production networks. In order to improve overland connectivity, a comprehensive and cooperative approach is needed to address the physical (hard) and non-physical (soft) infrastructure issues. The paper also supports the need of a regional connectivity masterplan to guide most optimal development of its connectivity requirements.
JEL Code(s): F14, F15, R58
Key words: South Asia, Trade, Regional transport connectivity, Trade facilitation, Regional integration, regional production networks.
1 Professor, Research and Information System for Developing Countries (RIS), New Delhi, e-mail: [email protected]. The author is grateful to Nagesh Kumar and Manas Bhattacharya for their useful comments on an earlier version of the paper. The author is thankful to Sreya Pan for her research assistance. This study builds upon previous research reported in a background paper for the ESCAP South and South-West Asia Development Report, 2012-13: Regional Cooperation for Inclusive and Sustainable Development. The author acknowledges the support provided by the ESCAP-SSWA Office for this study. Views expressed by the author are his personal. Usual disclaimers apply.

Strengthening Regional Trade and Production Networks through Transport Connectivity July 2014
6
Strengthening Regional Trade and Production Networks Through Transport Connectivity in South and South-West Asia
1. Introduction
Heterogeneity provides for cooperation and development.2 Geographically, South and South-West Asia’s (hereafter referred to as SSWA) is a very wide and heterogeneous subregion. On the one hand, India connects this subregion with a growing South-East Asian market, while, Turkey, on the other, links it with Europe. Its two largest economies – India and Turkey, play an important role in determining the path for sustainable development of the world economy. SSWA has four Least Developed Countries (LDCs) and five developing economies and one OECD member viz. Turkey.3 The subregion’s heterogeneity provides huge opportunities for trade, investment, and economic growth. More importantly, SSWA countries share several complementarities, which can be explored to develop production networks that will strengthen the region’s productivity and competitiveness though specialization. For developing such production networks, SSWA needs to improve connectivity within. Though transport, communications, and logistics costs in SSWA have fallen significantly owing to technological progress, connectivity status of the subregion remains way below global or regional standards. This paper examines the potential for production networks in SSWA by looking at the case of intra-regional trade in ‘parts and components’, highlights the importance of connectivity for realizing production networks, and offers certain policy perspectives for enhancing regional cooperation in the area of connectivity. The rest part of the paper is organized as follows. Section 2 outlines the importance and scope of production networks in the SSWA region in general, which is further elaborated in Section 3 with the example of potential for production networks in ‘parts and components’. Section 4 discusses the major challenges to development of production networks in SSWA in terms of poor connectivity. The connectivity options before SSWA in the form of different transport modes or corridors are compared in Section 5, and inferences are drawn by studying the relative transport efficiencies across those corridors. Some key policy proposals for improving regional connectivity based on the analysis are presented in Section 6. Finally, Section 7 offers some concluding remarks. 2. Intra-regional Trade in SSWA: Importance and Scope of Production Networks
The economic size of SSWA witnessed a massive rise in the last decade. The combined GDP of SSWA countries increased to US$ 3.5 trillion in 2011 from less than US$ 1 trillion recorded in the early last decade. Today, SSWA shares almost five per cent of world GDP and industrial value added, respectively, and four per cent of world trade (Table 1). Steady liberalization of trade has been one of the key drivers of SSWA’s economic growth. Rise in the subregion’s share in world trade from 1.93 to 4.08 percent during 1990-2011 underscores this fact.
2 See, for example, Bergeijk and Marrewijk (2013). 3 See, ESCAP-SSWA (2012: chapter 1) for more details.

South and South-West Asia Development Papers 1401 July 2014
7
Table 1. SSWA’s Share in the World (%) 1990 2000 2011
Population 23.71 24.96 25.88
Surface area 5.72 5.71 5.70
GDP1 3.07 3.05 4.86
Industry, value added2 2.57 2.96 5.14
Trade3 1.93 2.11 4.08 Source: Calculated based on WDI Online Database
Notes: 1. At current prices. 2. At current prices 3. Both merchandise and services trade. While SSWA’s overall trade has grown sharply over the years, intra-regional trade between SSWA countries has not increased to match its potential. Though the subregion hosts many forward-looking trade-led regional groupings such as ECO, SAARC and BIMSTEC, the pace of integration has been slow and varied across SSWA. There remain many challenges in the way of SSWA’s intra-regional trade liberalization, both in terms of maintaining trade competitiveness and exploiting trade complementarities. With 24.38 per cent of its population under poverty,4 SSWA countries need to find solutions for increasing the pace and volume of trade with each other, which in turn would play a key role in poverty alleviation through employment generation. In conventional wisdom, trade is extremely important to meet SSWA’s development goals. Over time, we see a positive relation (statistically significant) between per capita income and trade in SSWA (see Figure 1). The fit is robust and also statistically significant. Estimated PCTT – PCI relation appears to be elastic, elasticity being as high as 1.24, thereby showing one per cent rise in per capita trade that may lead to 1.24 per cent rise in per capita income, ceteris paribus.
Figure 1. Scatter of SSWA Countries in Per Capita Income and Per Capita Trade
Source: Calculated based on UN COMTRADE
4 Counts poverty headcount ratio at national poverty line (% of population), taken from the World Development Indicator (WDI) Online Database.
Strengthening Regional Trade and Production Networks through Transport Connectivity July 2014
8
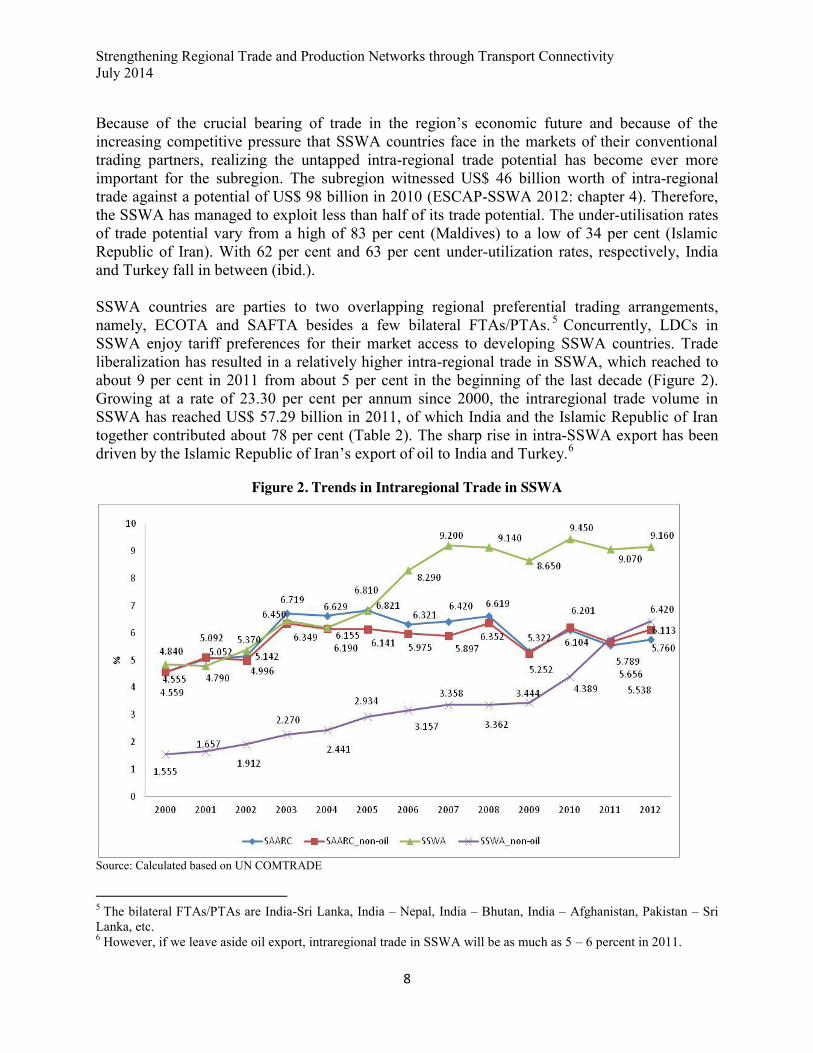
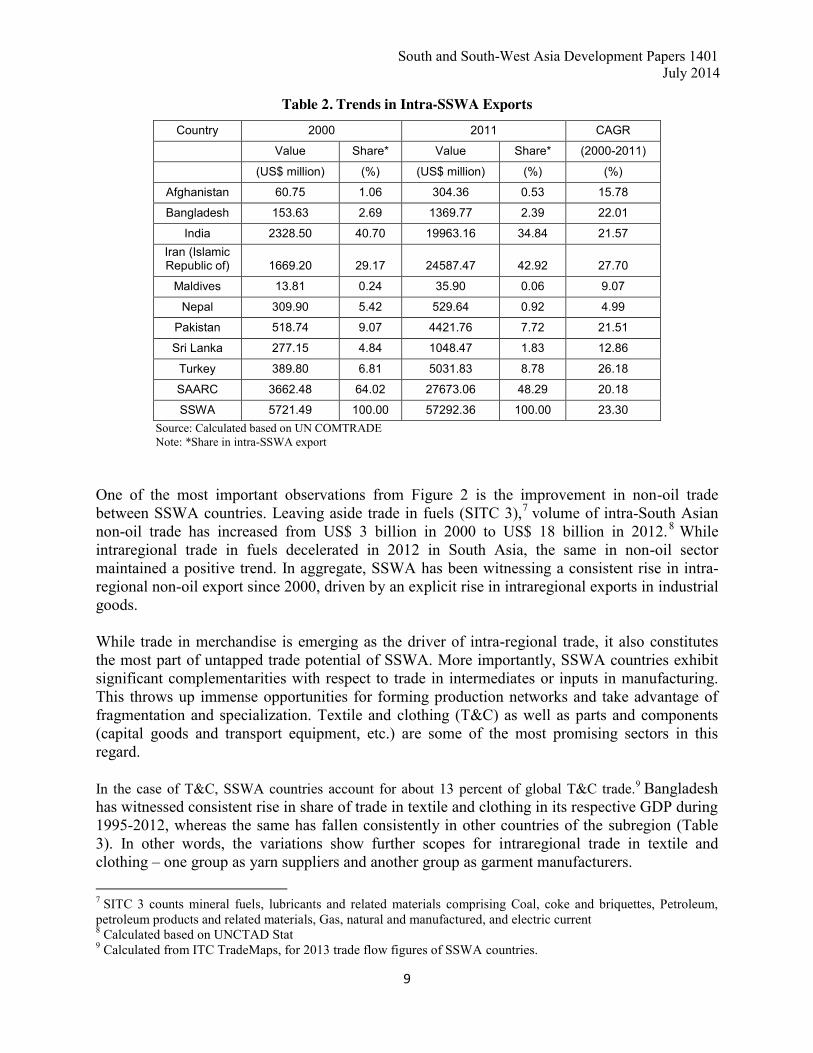
Because of the crucial bearing of trade in the region’s economic future and because of the increasing competitive pressure that SSWA countries face in the markets of their conventional trading partners, realizing the untapped intra-regional trade potential has become ever more important for the subregion. The subregion witnessed US$ 46 billion worth of intra-regional trade against a potential of US$ 98 billion in 2010 (ESCAP-SSWA 2012: chapter 4). Therefore, the SSWA has managed to exploit less than half of its trade potential. The under-utilisation rates of trade potential vary from a high of 83 per cent (Maldives) to a low of 34 per cent (Islamic Republic of Iran). With 62 per cent and 63 per cent under-utilization rates, respectively, India and Turkey fall in between (ibid.). SSWA countries are parties to two overlapping regional preferential trading arrangements, namely, ECOTA and SAFTA besides a few bilateral FTAs/PTAs. 5 Concurrently, LDCs in SSWA enjoy tariff preferences for their market access to developing SSWA countries. Trade liberalization has resulted in a relatively higher intra-regional trade in SSWA, which reached to about 9 per cent in 2011 from about 5 per cent in the beginning of the last decade (Figure 2). Growing at a rate of 23.30 per cent per annum since 2000, the intraregional trade volume in SSWA has reached US$ 57.29 billion in 2011, of which India and the Islamic Republic of Iran together contributed about 78 per cent (Table 2). The sharp rise in intra-SSWA export has been driven by the Islamic Republic of Iran’s export of oil to India and Turkey.6
Figure 2. Trends in Intraregional Trade in SSWA
Source: Calculated based on UN COMTRADE
5 The bilateral FTAs/PTAs are India-Sri Lanka, India – Nepal, India – Bhutan, India – Afghanistan, Pakistan – Sri Lanka, etc. 6 However, if we leave aside oil export, intraregional trade in SSWA will be as much as 5 – 6 percent in 2011.
South and South-West Asia Development Papers 1401 July 2014
9
Table 2. Trends in Intra-SSWA Exports Country 2000 2011 CAGR
Value Share* Value Share* (2000-2011)
(US$ million) (%) (US$ million) (%) (%)
Afghanistan 60.75 1.06 304.36 0.53 15.78
Bangladesh 153.63 2.69 1369.77 2.39 22.01
India 2328.50 40.70 19963.16 34.84 21.57 Iran (Islamic Republic of) 1669.20 29.17 24587.47 42.92 27.70
Maldives 13.81 0.24 35.90 0.06 9.07
Nepal 309.90 5.42 529.64 0.92 4.99
Pakistan 518.74 9.07 4421.76 7.72 21.51
Sri Lanka 277.15 4.84 1048.47 1.83 12.86
Turkey 389.80 6.81 5031.83 8.78 26.18
SAARC 3662.48 64.02 27673.06 48.29 20.18
SSWA 5721.49 100.00 57292.36 100.00 23.30 Source: Calculated based on UN COMTRADE Note: *Share in intra-SSWA export
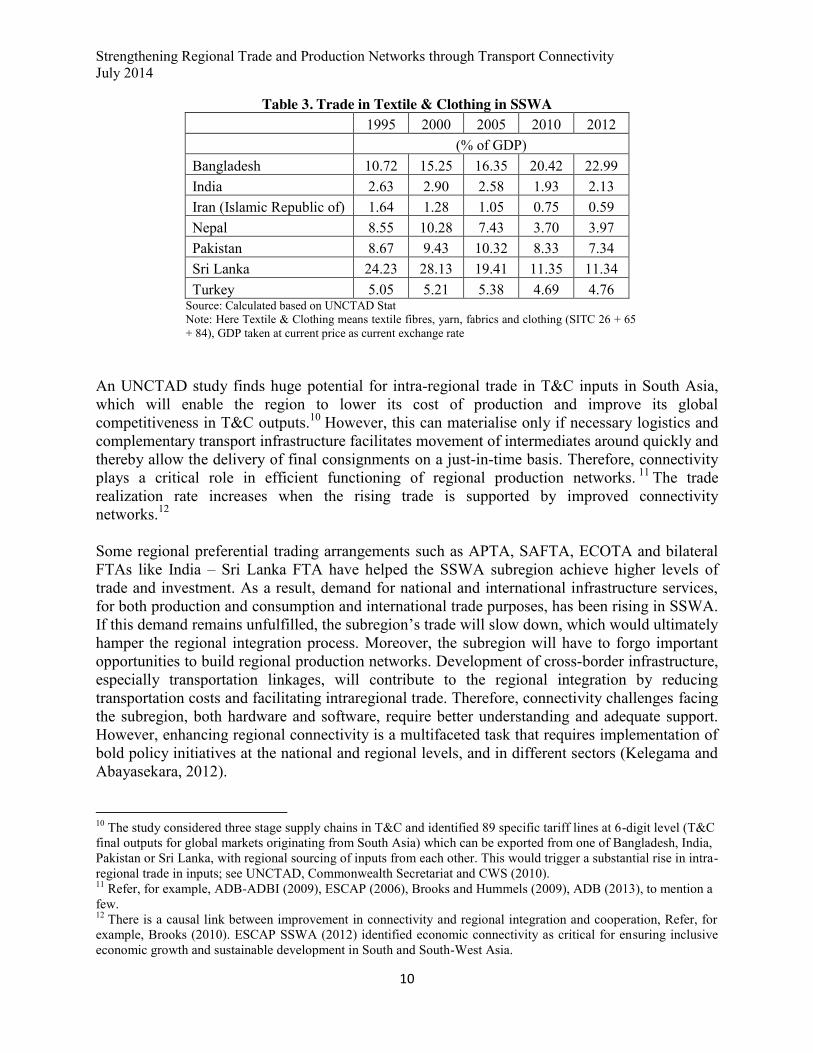
One of the most important observations from Figure 2 is the improvement in non-oil trade between SSWA countries. Leaving aside trade in fuels (SITC 3),7 volume of intra-South Asian non-oil trade has increased from US$ 3 billion in 2000 to US$ 18 billion in 2012.8 While intraregional trade in fuels decelerated in 2012 in South Asia, the same in non-oil sector maintained a positive trend. In aggregate, SSWA has been witnessing a consistent rise in intra-regional non-oil export since 2000, driven by an explicit rise in intraregional exports in industrial goods. While trade in merchandise is emerging as the driver of intra-regional trade, it also constitutes the most part of untapped trade potential of SSWA. More importantly, SSWA countries exhibit significant complementarities with respect to trade in intermediates or inputs in manufacturing. This throws up immense opportunities for forming production networks and take advantage of fragmentation and specialization. Textile and clothing (T&C) as well as parts and components (capital goods and transport equipment, etc.) are some of the most promising sectors in this regard. In the case of T&C, SSWA countries account for about 13 percent of global T&C trade.9 Bangladesh has witnessed consistent rise in share of trade in textile and clothing in its respective GDP during 1995-2012, whereas the same has fallen consistently in other countries of the subregion (Table 3). In other words, the variations show further scopes for intraregional trade in textile and clothing – one group as yarn suppliers and another group as garment manufacturers. 7 SITC 3 counts mineral fuels, lubricants and related materials comprising Coal, coke and briquettes, Petroleum, petroleum products and related materials, Gas, natural and manufactured, and electric current 8 Calculated based on UNCTAD Stat 9 Calculated from ITC TradeMaps, for 2013 trade flow figures of SSWA countries.
Strengthening Regional Trade and Production Networks through Transport Connectivity July 2014
10
Table 3. Trade in Textile & Clothing in SSWA
1995 2000 2005 2010 2012
(% of GDP)
Bangladesh 10.72 15.25 16.35 20.42 22.99 India 2.63 2.90 2.58 1.93 2.13 Iran (Islamic Republic of) 1.64 1.28 1.05 0.75 0.59 Nepal 8.55 10.28 7.43 3.70 3.97 Pakistan 8.67 9.43 10.32 8.33 7.34 Sri Lanka 24.23 28.13 19.41 11.35 11.34 Turkey 5.05 5.21 5.38 4.69 4.76
Source: Calculated based on UNCTAD Stat Note: Here Textile & Clothing means textile fibres, yarn, fabrics and clothing (SITC 26 + 65 + 84), GDP taken at current price as current exchange rate
An UNCTAD study finds huge potential for intra-regional trade in T&C inputs in South Asia, which will enable the region to lower its cost of production and improve its global competitiveness in T&C outputs.10 However, this can materialise only if necessary logistics and complementary transport infrastructure facilitates movement of intermediates around quickly and thereby allow the delivery of final consignments on a just-in-time basis. Therefore, connectivity plays a critical role in efficient functioning of regional production networks. 11 The trade realization rate increases when the rising trade is supported by improved connectivity networks.12 Some regional preferential trading arrangements such as APTA, SAFTA, ECOTA and bilateral FTAs like India – Sri Lanka FTA have helped the SSWA subregion achieve higher levels of trade and investment. As a result, demand for national and international infrastructure services, for both production and consumption and international trade purposes, has been rising in SSWA. If this demand remains unfulfilled, the subregion’s trade will slow down, which would ultimately hamper the regional integration process. Moreover, the subregion will have to forgo important opportunities to build regional production networks. Development of cross-border infrastructure, especially transportation linkages, will contribute to the regional integration by reducing transportation costs and facilitating intraregional trade. Therefore, connectivity challenges facing the subregion, both hardware and software, require better understanding and adequate support. However, enhancing regional connectivity is a multifaceted task that requires implementation of bold policy initiatives at the national and regional levels, and in different sectors (Kelegama and Abayasekara, 2012). 10 The study considered three stage supply chains in T&C and identified 89 specific tariff lines at 6-digit level (T&C final outputs for global markets originating from South Asia) which can be exported from one of Bangladesh, India, Pakistan or Sri Lanka, with regional sourcing of inputs from each other. This would trigger a substantial rise in intra-regional trade in inputs; see UNCTAD, Commonwealth Secretariat and CWS (2010). 11 Refer, for example, ADB-ADBI (2009), ESCAP (2006), Brooks and Hummels (2009), ADB (2013), to mention a few. 12 There is a causal link between improvement in connectivity and regional integration and cooperation, Refer, for example, Brooks (2010). ESCAP SSWA (2012) identified economic connectivity as critical for ensuring inclusive economic growth and sustainable development in South and South-West Asia.

South and South-West Asia Development Papers 1401 July 2014
11
3. Production Networks in SSWA: The Case of Trade in Parts and Components
In the literature a relationship is posited between intermediate goods trade and the importer country’s structure of production, expressed in terms of the capital-output ratio (Harrigan 1995). Production networks in manufacturing sector are most advanced in the world, where the international division of labor in terms of production processes and tasks has been divided across border, what is called the 2nd unbundling (Baldwin, 2011). Production blocks can move to developing countries/regions and accelerate industrialization, ending up with narrowing development gaps, with physical connectivity as the key to establishing such production networks. Jones and Kierzkowski (2005) correctly argued that the costs of fragmentation depend on the associated service link costs, which tend to be country-specific. Some countries have poor highway networks, port facilities and airports, and complicated or unfriendly regulations that may further compound the situation. Even within a country, infrastructure quality varies across geographic space. For example, SSWA countries suffer from infrastructure stock, resulting in higher cost of doing business. A stronger infrastructure facilitates production networks, within and across countries. Within infrastructure, logistics is an important determinant in sustaining a country’s (or, a region’s) competitive advantage and production network. 13 Saslavsky and Shepherd (2012) argued that trade facilitation and logistics performance matter significantly more for trade in parts and components – which typically circulate within global value chains – than for trade in final goods.
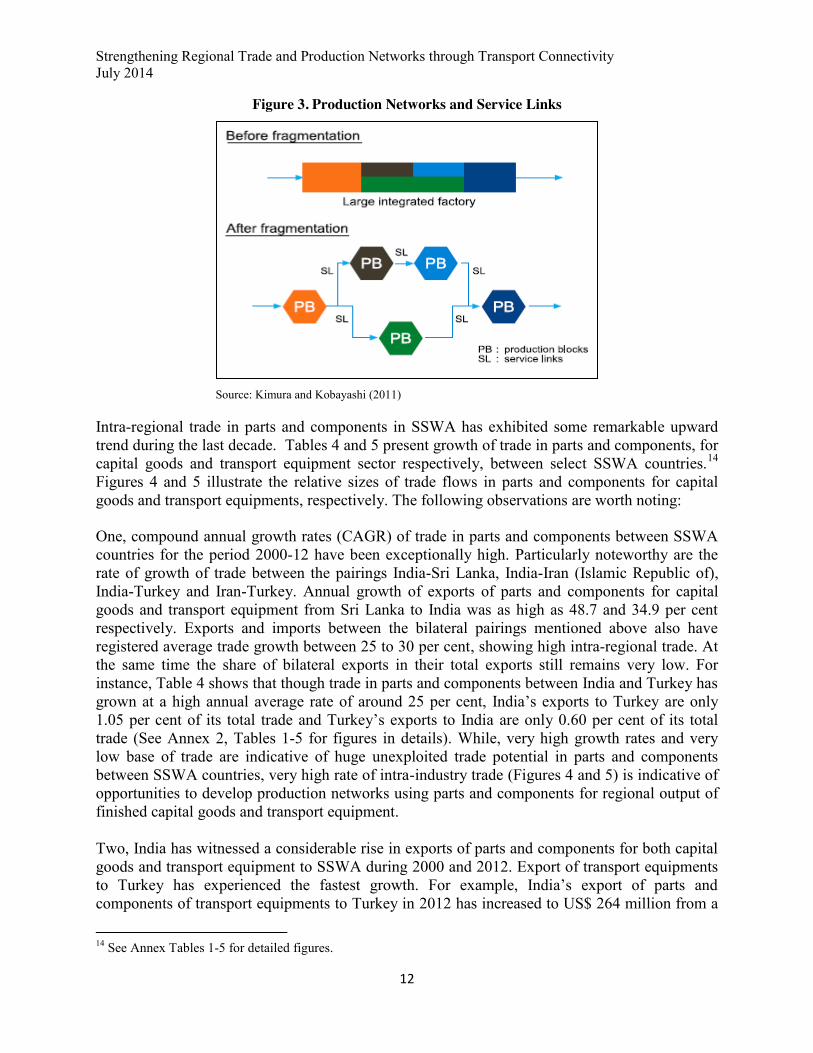
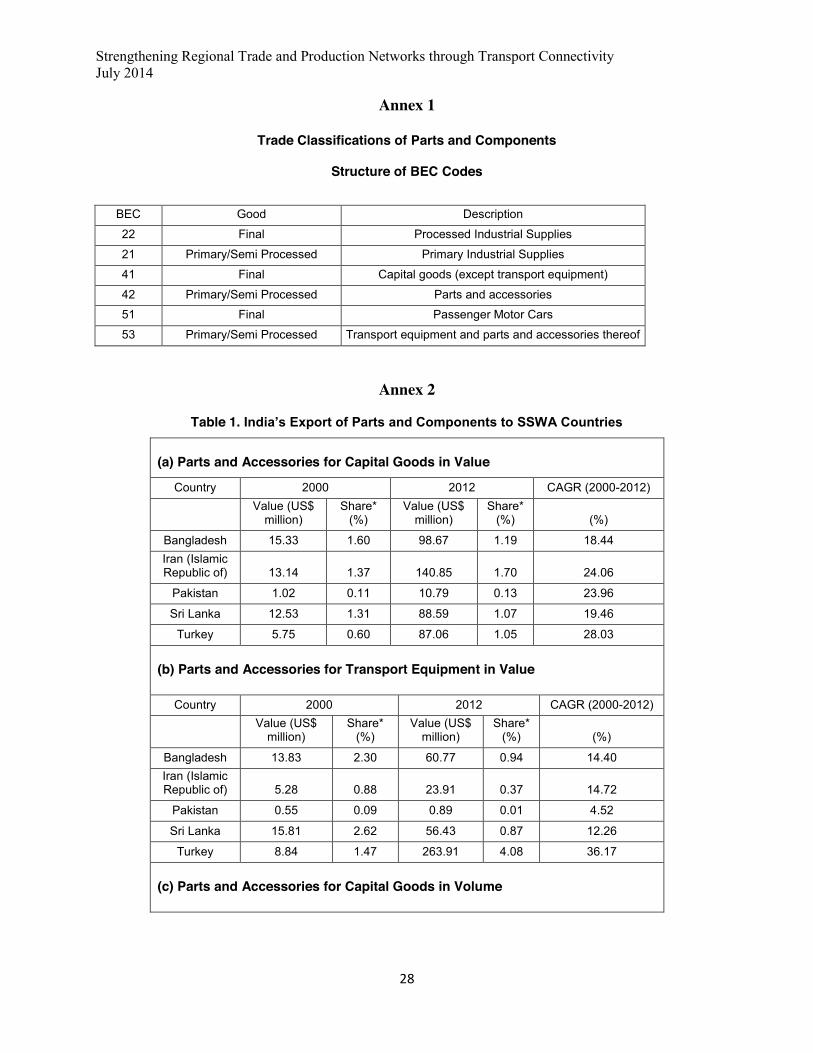
Noted in Kimura and Kobayashi (2009), the key to attract fragmented production blocks is to (a) improve locational advantages by, for example, developing special economic zones (SEZs) with at least an improved local level investment climate; and (b) reduce the cost of service links that connect remotely located production blocs by improving trade and transport facilitation. Figure 3 presents graphical links between production blocks and service links. In fragmentation of production, an efficient and improved service link is important for expansion of production networks across a region. The objective here is to analyse the volume of trade in parts and components in SSWA, which would help understand the transportation demand and specifications for the subregion. We select intra-SSWA trade in (a) parts and accessories for transport equipment, and (b) parts and accessories for capital goods. A detailed account of classifications of these two product categories is mentioned in Annex 1. The usual caveat is that while parts and components are often considered as “differentiated” products, much of this differentiation is in fact standardization on demand, and does not reflect market power of the supplier but rather of the user. From this point of view, different parts and components are homogenous across potential suppliers from potentially different source countries, and some parts and components may well be exported by more than one country.
13 Its contribution to growth, regional integration and poverty reduction has been well recognized. Refer, for example, World Bank (2012).
Strengthening Regional Trade and Production Networks through Transport Connectivity July 2014
12
Figure 3. Production Networks and Service Links
Source: Kimura and Kobayashi (2011)
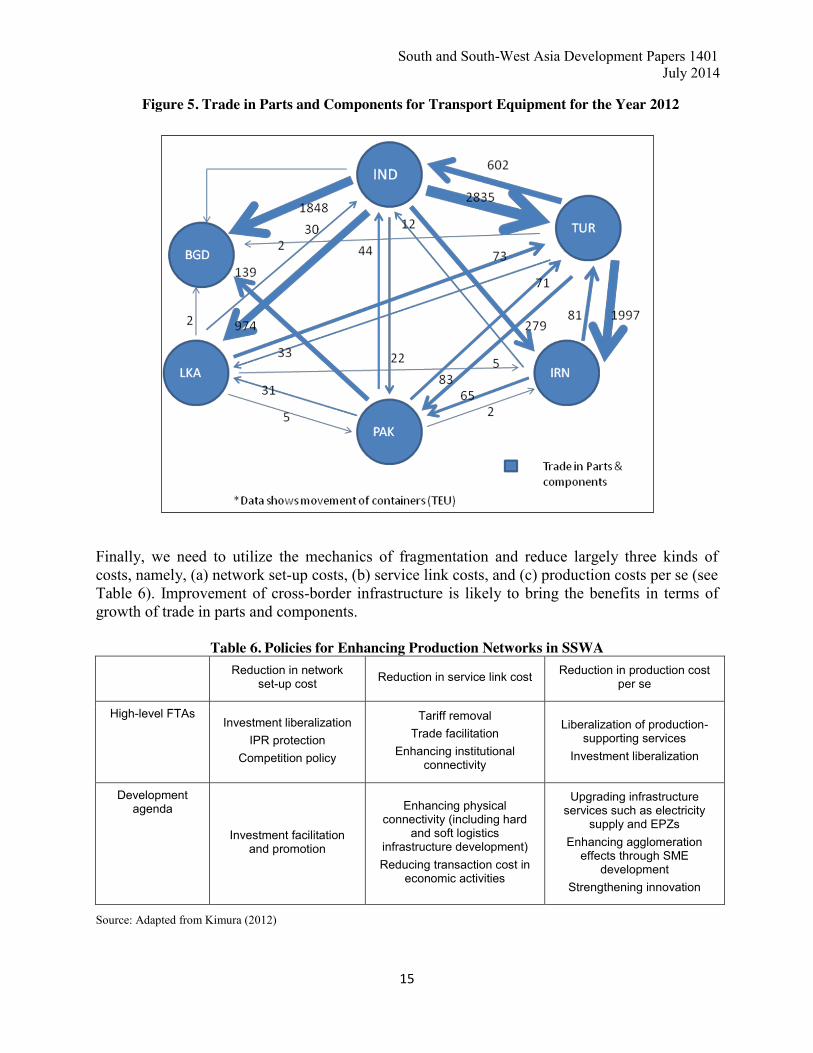
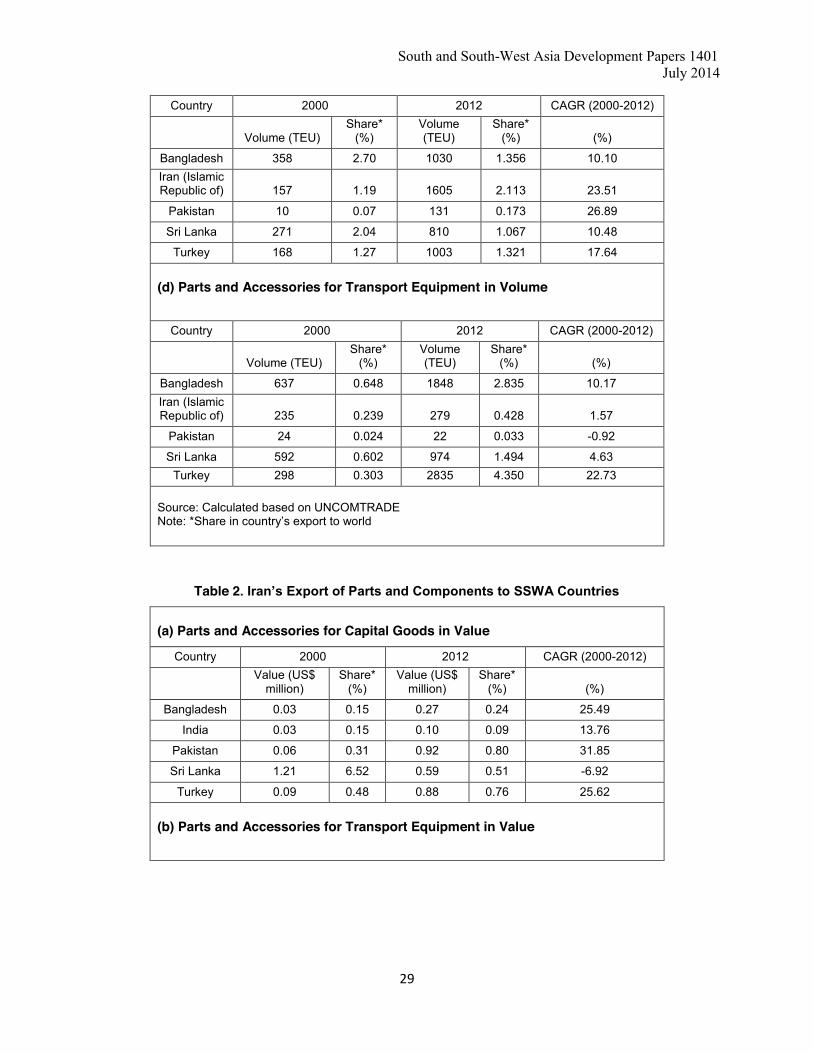
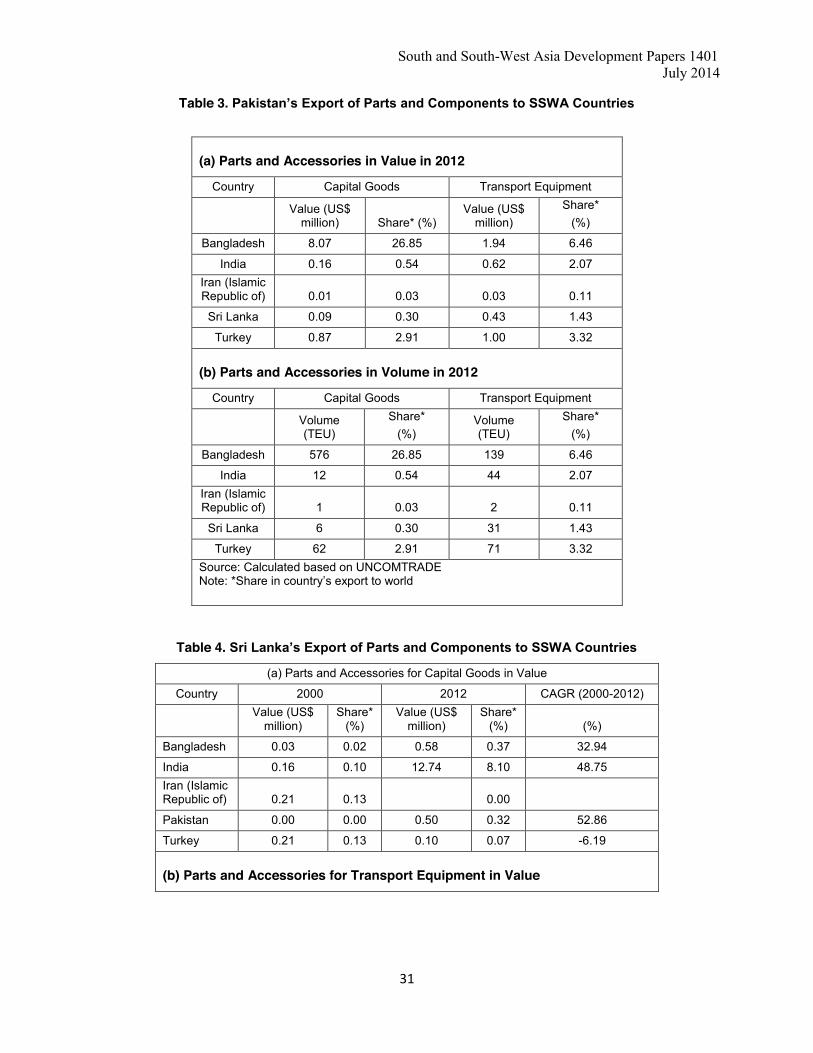
Intra-regional trade in parts and components in SSWA has exhibited some remarkable upward trend during the last decade. Tables 4 and 5 present growth of trade in parts and components, for capital goods and transport equipment sector respectively, between select SSWA countries.14 Figures 4 and 5 illustrate the relative sizes of trade flows in parts and components for capital goods and transport equipments, respectively. The following observations are worth noting: One, compound annual growth rates (CAGR) of trade in parts and components between SSWA countries for the period 2000-12 have been exceptionally high. Particularly noteworthy are the rate of growth of trade between the pairings India-Sri Lanka, India-Iran (Islamic Republic of), India-Turkey and Iran-Turkey. Annual growth of exports of parts and components for capital goods and transport equipment from Sri Lanka to India was as high as 48.7 and 34.9 per cent respectively. Exports and imports between the bilateral pairings mentioned above also have registered average trade growth between 25 to 30 per cent, showing high intra-regional trade. At the same time the share of bilateral exports in their total exports still remains very low. For instance, Table 4 shows that though trade in parts and components between India and Turkey has grown at a high annual average rate of around 25 per cent, India’s exports to Turkey are only 1.05 per cent of its total trade and Turkey’s exports to India are only 0.60 per cent of its total trade (See Annex 2, Tables 1-5 for figures in details). While, very high growth rates and very low base of trade are indicative of huge unexploited trade potential in parts and components between SSWA countries, very high rate of intra-industry trade (Figures 4 and 5) is indicative of opportunities to develop production networks using parts and components for regional output of finished capital goods and transport equipment. Two, India has witnessed a considerable rise in exports of parts and components for both capital goods and transport equipment to SSWA during 2000 and 2012. Export of transport equipments to Turkey has experienced the fastest growth. For example, India’s export of parts and components of transport equipments to Turkey in 2012 has increased to US$ 264 million from a
14 See Annex Tables 1-5 for detailed figures.

South and South-West Asia Development Papers 1401 July 2014
13
meager US$ 9 million recorded in 2000. During the same period, India’s export of parts and components in capital goods to the Islamic Republic of Iran has also witnessed a voluminous rise to US$ 141 million, contributing almost 2 per cent of India’s global export of parts and components in capital goods. Barring Pakistan, India’s export of parts and components to SSWA countries has gone up substantially during 2000 and 2012. Volume-wise export of parts and components also resonates this. India’s exports of parts and components in capital goods to Bangladesh, the Islamic Republic of Iran, Sri Lanka and Turkey have seen a strong rise between 2000 and 2012, whereas India’s export of parts and components in transport equipment to Turkey is distinctly an important development, contributing 4.35 per cent of India’s global export in volume. This trend illustrates the production networks potential in SSWA.
Table 4. Growth and Share of Intra-Regional Trade Value
of Parts and Accessories for Capital Goods Importer Exporter
India Iran (Islamic Republic of)
Sri Lanka Turkey
Share (%)
CAGR (2000-12)
Share (%)
CAGR (2000-12)
Share (%)
CAGR (2000-12)
Share (%) CAGR (2000-12)
India - - 1.70 24.06 1.07 19.46 1.05 28.03 Iran (Islamic Republic of)
0.09 13.76 - - 0.51 -6.92 0.76 25.62
Sri Lanka 8.10 48.75 0.00 0.00 - - 0.07 -6.19 Turkey 0.60 26.05 4.43 36.66 0.02 32.88 - - Source: Calculated based on UN COMTRADE
Table 5. Growth and Share of Intra-Regional Trade Value of Parts and Accessories for Transport Equipment
Importer Exporter
India Iran (Islamic Republic of)
Sri Lanka Turkey
Share (%)
CAGR (2000-12)
Share (%)
CAGR (2000-12)
Share (%)
CAGR (2000-12)
Share (%) CAGR (2000-12)
India - - 0.37 14.72 0.87 12.26 4.08 36.17 Iran (Islamic Republic of)
0.10 28.41 - - 0.00 0.00 1.15 -3.49
Sri Lanka 0.48 34.89 0.08 NA - - 1.15 32.74 Turkey 1.18 29.51 3.46 24.16 0.02 42.40 - - Source: Calculated based on UN COMTRADE
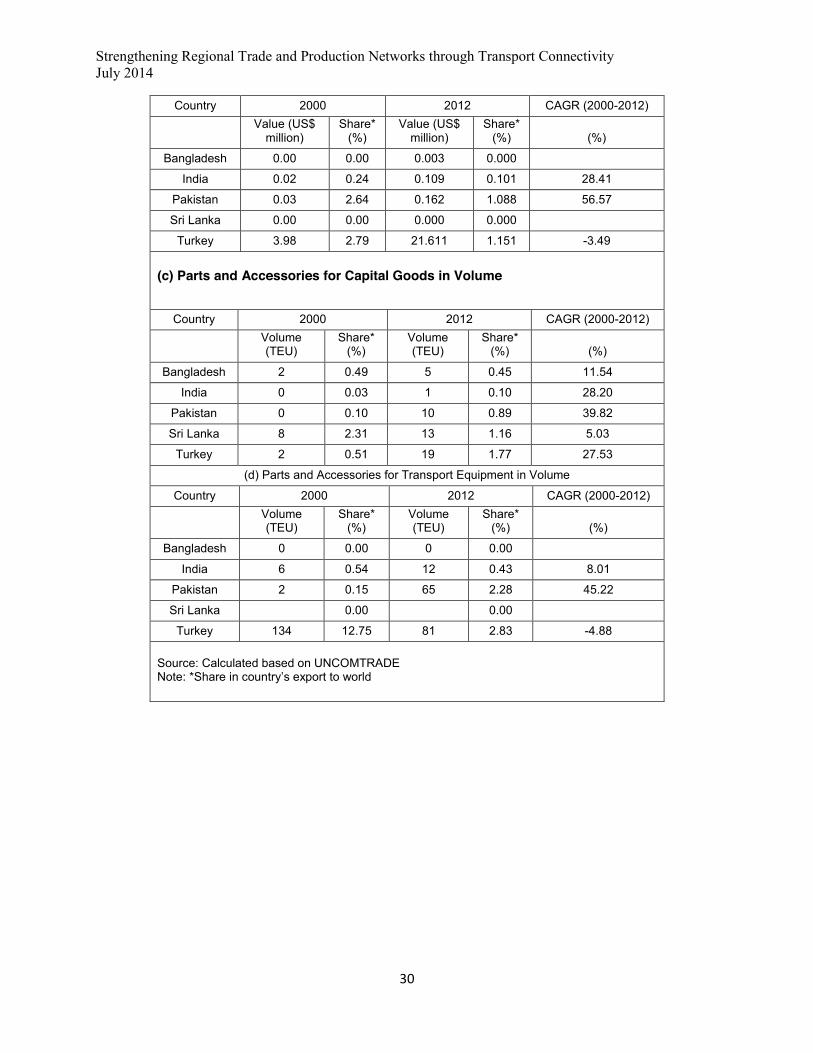
Three, trade in parts and components in other SSWA countries has seen either marginal or no rise in terms of absolute value and volume. However, Pakistan’s exports of parts and components for capital goods and transport equipment to Bangladesh and Turkey, and Turkey’s exports of parts and components for capital goods and transport equipment to the Islamic Republic of Iran and India show relatively higher volume, which indicates approaching emergence of production networks. Improvement in connectivity may unlock the trade potential in smaller economies, thereby generating greater opportunities in production networks.

Strengthening Regional Trade and Production Networks through Transport Connectivity July 2014
14
Four, rising volume/value ratio in trade in parts and components in SSWA calls for stronger transportation, preferably overland, in SSWA. Trade across overland routes in SSWA appears economically more advantageous. The success of production networks would depend on improvement of connectivity within SSWA and beyond. Connectivity improvement has the potential to bring economic benefits at least on a par with those that would come from a major round of tariff cuts in the manufacturing sector. However, it is not just the economic gains that matter, but also their distribution. Barring the Islamic Republic of Iran, any further tariff cuts would eventually lead to small or no benefits since tariff rates have already been very low in SSWA. Reduction of non-tariff costs is thus very important in SSWA in promoting trade in parts and components and the production networks.
Five, efficiency in logistics services is an important factor contributing not only to the expansion in trade and production networks within or across SSWA, but also towards building their productive capacities, particularly in SSWA LDCs.
Six, when production processes and tasks in production are increasingly fragmented across national boundaries, time-sensitive logistics along with information and communication technology and trade facilitation becomes key to facilitate production networks spanning borders in SSWA. Therefore, ESCAP’s proposal of setting up of regional corridors, such as TIPI–BM road corridor and ITI–DKD railway corridor, has ample merits. These corridors would not only facilitate production networks and strengthen global value chains but also encourage regional integration.
Figure 4. Trade in Parts and Components for Capital Goods for the Year 2012
South and South-West Asia Development Papers 1401 July 2014
15
Figure 5. Trade in Parts and Components for Transport Equipment for the Year 2012
Finally, we need to utilize the mechanics of fragmentation and reduce largely three kinds of costs, namely, (a) network set-up costs, (b) service link costs, and (c) production costs per se (see Table 6). Improvement of cross-border infrastructure is likely to bring the benefits in terms of growth of trade in parts and components.
Table 6. Policies for Enhancing Production Networks in SSWA Reduction in network
set-up cost Reduction in service link cost Reduction in production cost per se
High-level FTAs Investment liberalization
IPR protection Competition policy
Tariff removal Trade facilitation
Enhancing institutional connectivity
Liberalization of production-supporting services
Investment liberalization
Development agenda
Investment facilitation and promotion
Enhancing physical connectivity (including hard
and soft logistics infrastructure development) Reducing transaction cost in
economic activities
Upgrading infrastructure services such as electricity
supply and EPZs Enhancing agglomeration
effects through SME development
Strengthening innovation
Source: Adapted from Kimura (2012)
Strengthening Regional Trade and Production Networks through Transport Connectivity July 2014
16
In order to develop production networks institutional arrangements for hosting foreign direct investment (FDI) in SSWA need to be improved, which would reduce network set-up costs. FDI may likely bring new technology in the subregion. Logistics infrastructure/services (cost, time, reliability) need to be developed and trade liberalization/facilitation promoted, which would reduce service link costs. An exclusive trade and transport facilitation programme for SSWA covering transport and other economic infrastructure such as electricity supply through setting up of industrial zones and/or special economic zones (SEZs) would reduce production and transaction costs. 4. Transport Connectivity Challenges to Development of Production Networks in SSWA
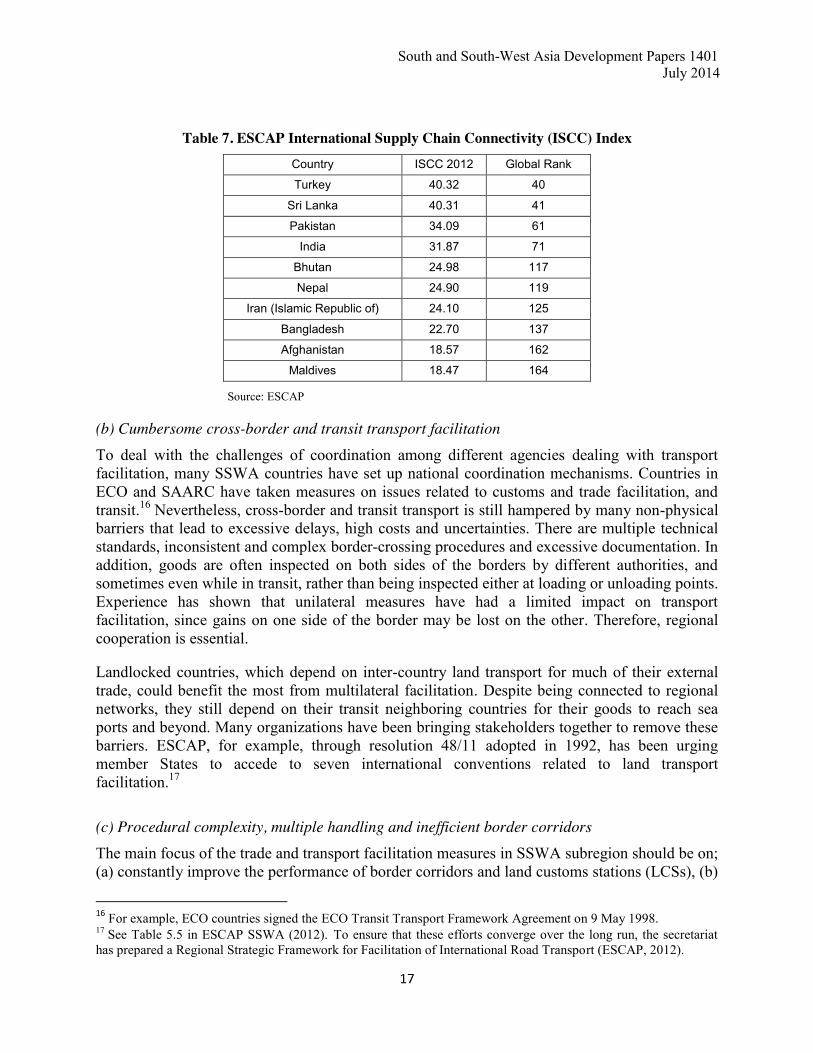
The case of intra-regional trade in parts and components in SSWA shows the immense potential for developing production network. As mentioned in the previous section, the main challenge facing SSWA in its quest for regional integration and increasing competitiveness is the poor quality and inefficiency of its cross-border infrastructure services, both hardware and software, which raise the costs of transportation and constrain the capacity of the SSWA economies to gain from a liberal trading environment. The shared objective of the regional cooperation should be then to eliminate this asymmetry between countries in SSWA and help the laggards to move ahead through deeper cooperation. Some of the most pressing connectivity challenges before SSWA countries are as follows. (a) Underdeveloped Supply Chain Connectivity: ESCAP International Supply Chain Connectivity Index The South and South-West Asia subregion suffers from inadequate international supply chain connectivity, involving movement of goods from a production facility in one country to a warehouse or distribution centre in another one. In a regional and global production network context, facilitating trade for a given country involves not only facilitating movement of final goods from a factory to the port, but also (a) facilitating import of parts and components and their movement to a production facility, as well as (b) facilitating export of the processed goods from the production facility to the port. The ESCAP International Supply Chain Connectivity (ISCC) Index was developed to measure the overall trade facilitation performance of a country along the international supply chain.15 Table 7 presents ISCC Index scores and global ranks of ESCAP SSWA member States. Performance of SSWA countries in global supply chain is nonetheless rather poor. Only two countries (Turkey and Sri Lanka) rank within the top 50 countries in 2012, whereas six countries rank below 100, with India and Pakistan falling in the middle. The ESCAP ISSC index suggests that SSWA countries need to improve their supply chain connectivity considerably in order to effectively link their production units with global value chains.
15 ISCC is based on the trading across border (TAB) indicators from the World Bank Doing Business Report and the Liner Shipping Connectivity Index (LSCI) of UNCTAD. The Index provides an overall performance score for a particular country based on its performance in terms of (1) TAB underlying import indicators (i.e. number of documents, time, and cost involved in import); (2) TAB underlying export indicators (i.e. number of documents, time, and cost involved in export); and (3) the UNCTAD LSCI score. Equal weight (one third) is given to import, export and liner shipping performance for non-landlocked countries. The current version of this database includes the data from 2006-2012 for 179 countries.
South and South-West Asia Development Papers 1401 July 2014
17
Table 7. ESCAP International Supply Chain Connectivity (ISCC) Index Country ISCC 2012 Global Rank
Turkey 40.32 40
Sri Lanka 40.31 41
Pakistan 34.09 61
India 31.87 71
Bhutan 24.98 117
Nepal 24.90 119
Iran (Islamic Republic of) 24.10 125
Bangladesh 22.70 137
Afghanistan 18.57 162
Maldives 18.47 164
Source: ESCAP
(b) Cumbersome cross-border and transit transport facilitation To deal with the challenges of coordination among different agencies dealing with transport facilitation, many SSWA countries have set up national coordination mechanisms. Countries in ECO and SAARC have taken measures on issues related to customs and trade facilitation, and transit.16 Nevertheless, cross-border and transit transport is still hampered by many non-physical barriers that lead to excessive delays, high costs and uncertainties. There are multiple technical standards, inconsistent and complex border-crossing procedures and excessive documentation. In addition, goods are often inspected on both sides of the borders by different authorities, and sometimes even while in transit, rather than being inspected either at loading or unloading points. Experience has shown that unilateral measures have had a limited impact on transport facilitation, since gains on one side of the border may be lost on the other. Therefore, regional cooperation is essential. Landlocked countries, which depend on inter-country land transport for much of their external trade, could benefit the most from multilateral facilitation. Despite being connected to regional networks, they still depend on their transit neighboring countries for their goods to reach sea ports and beyond. Many organizations have been bringing stakeholders together to remove these barriers. ESCAP, for example, through resolution 48/11 adopted in 1992, has been urging member States to accede to seven international conventions related to land transport facilitation.17 (c) Procedural complexity, multiple handling and inefficient border corridors The main focus of the trade and transport facilitation measures in SSWA subregion should be on; (a) constantly improve the performance of border corridors and land customs stations (LCSs), (b)
16 For example, ECO countries signed the ECO Transit Transport Framework Agreement on 9 May 1998. 17 See Table 5.5 in ESCAP SSWA (2012). To ensure that these efforts converge over the long run, the secretariat has prepared a Regional Strategic Framework for Facilitation of International Road Transport (ESCAP, 2012).
Strengthening Regional Trade and Production Networks through Transport Connectivity July 2014
18
eliminate the asymmetry between the LCSs pair, and (c) remove multiple handling of goods at borders. While there is no mismatch in the timing of operations of customs and immigration among the LCSs, the days of operation differ between India and Bangladesh. Apart from immigration, customs and security, which are an essential part of all LCSs, the other facilities in both the physical and non-physical categories vary across the LCSs. For example, except for Birganj in Nepal, none of the major LCSs in SSWA has an exclusive container-handling yard at the border. Similarly, except for Petrapole in India, none has effectively adopted the fast-track cargo clearance system. In the case of e-governance in customs, most of the LCSs in SSWA now use electronic data exchange platform.18 However, in many LCSs customs formalities are still handled manually. The existing Electronic Data Interchange (EDI) system also suffers from certain shortcomings that add to the transaction costs. The customs offices in some South Asian countries still require excessive documentation, especially for imports, which must be submitted in hard copy form.19 This excessive documentation often changes the composition and direction of trade in South Asia. Most of the LCSs suffer from limited warehouse capacity and the lack of banking and foreign exchange facilities.20 (d) Lack of regional transit Transit is an intrinsic element of any cross-border movement of goods and vehicles, and exercises significant influence on international trade. The foremost critical factor prohibiting SSWA in achieving its regional connectivity is the absence of any regional transit trade agreement. Unlike the European Union, SSWA does not have any comprehensive regional transit arrangement, although partial transit exists for SAARC and ECO regions as well as for landlocked countries like Afghanistan, Bhutan and Nepal. 5. A Comparative Assessment of Efficiency of Regional Transport Corridors in SSWA
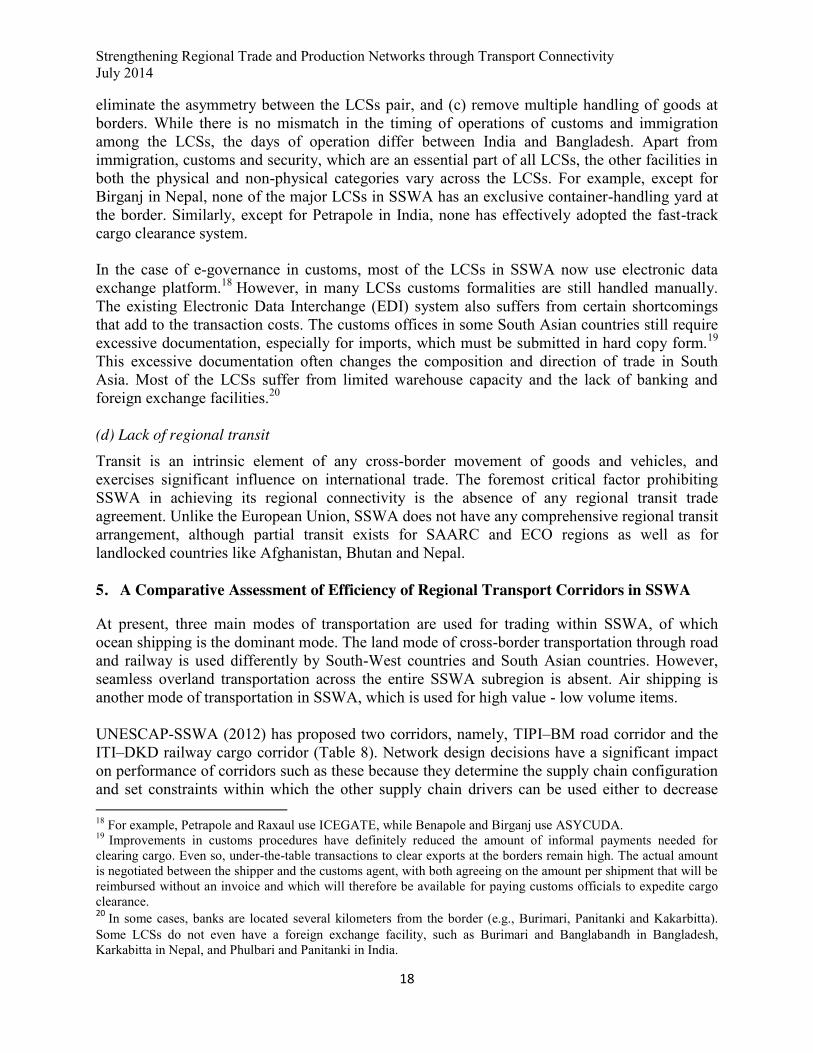
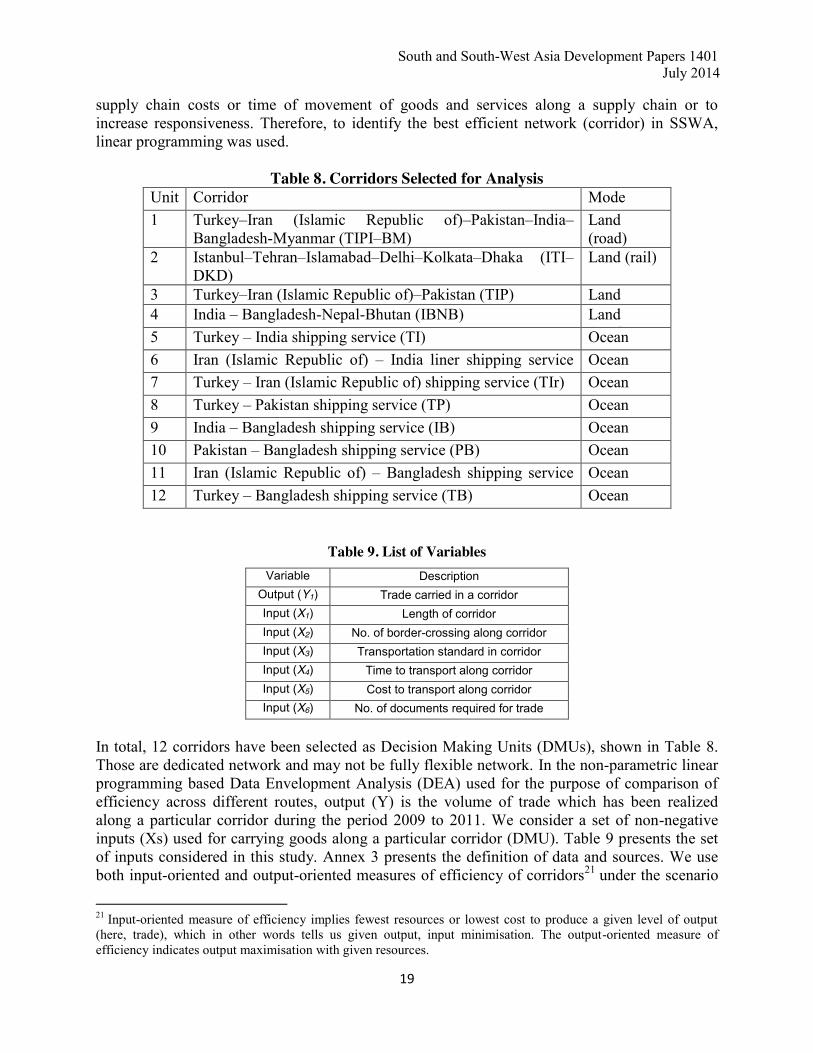
At present, three main modes of transportation are used for trading within SSWA, of which ocean shipping is the dominant mode. The land mode of cross-border transportation through road and railway is used differently by South-West countries and South Asian countries. However, seamless overland transportation across the entire SSWA subregion is absent. Air shipping is another mode of transportation in SSWA, which is used for high value - low volume items. UNESCAP-SSWA (2012) has proposed two corridors, namely, TIPI–BM road corridor and the ITI–DKD railway cargo corridor (Table 8). Network design decisions have a significant impact on performance of corridors such as these because they determine the supply chain configuration and set constraints within which the other supply chain drivers can be used either to decrease 18 For example, Petrapole and Raxaul use ICEGATE, while Benapole and Birganj use ASYCUDA. 19 Improvements in customs procedures have definitely reduced the amount of informal payments needed for clearing cargo. Even so, under-the-table transactions to clear exports at the borders remain high. The actual amount is negotiated between the shipper and the customs agent, with both agreeing on the amount per shipment that will be reimbursed without an invoice and which will therefore be available for paying customs officials to expedite cargo clearance. 20 In some cases, banks are located several kilometers from the border (e.g., Burimari, Panitanki and Kakarbitta). Some LCSs do not even have a foreign exchange facility, such as Burimari and Banglabandh in Bangladesh, Karkabitta in Nepal, and Phulbari and Panitanki in India.
South and South-West Asia Development Papers 1401 July 2014
19
supply chain costs or time of movement of goods and services along a supply chain or to increase responsiveness. Therefore, to identify the best efficient network (corridor) in SSWA, linear programming was used.
Table 8. Corridors Selected for Analysis Unit Corridor Mode 1 Turkey–Iran (Islamic Republic of)–Pakistan–India–
Bangladesh-Myanmar (TIPI–BM) Land (road)
2 Istanbul–Tehran–Islamabad–Delhi–Kolkata–Dhaka (ITI–DKD)
Land (rail)
3 Turkey–Iran (Islamic Republic of)–Pakistan (TIP) Land (road) 4 India – Bangladesh-Nepal-Bhutan (IBNB) Land (road) 5 Turkey – India shipping service (TI) Ocean
6 Iran (Islamic Republic of) – India liner shipping service (IrI)
Ocean 7 Turkey – Iran (Islamic Republic of) shipping service (TIr) Ocean 8 Turkey – Pakistan shipping service (TP) Ocean 9 India – Bangladesh shipping service (IB) Ocean 10 Pakistan – Bangladesh shipping service (PB) Ocean 11 Iran (Islamic Republic of) – Bangladesh shipping service
(IrB) Ocean
12 Turkey – Bangladesh shipping service (TB) Ocean
Table 9. List of Variables Variable Description
Output (Y1) Trade carried in a corridor Input (X1) Length of corridor Input (X2) No. of border-crossing along corridor Input (X3) Transportation standard in corridor Input (X4) Time to transport along corridor Input (X5) Cost to transport along corridor Input (X6) No. of documents required for trade
In total, 12 corridors have been selected as Decision Making Units (DMUs), shown in Table 8. Those are dedicated network and may not be fully flexible network. In the non-parametric linear programming based Data Envelopment Analysis (DEA) used for the purpose of comparison of efficiency across different routes, output (Y) is the volume of trade which has been realized along a particular corridor during the period 2009 to 2011. We consider a set of non-negative inputs (Xs) used for carrying goods along a particular corridor (DMU). Table 9 presents the set of inputs considered in this study. Annex 3 presents the definition of data and sources. We use both input-oriented and output-oriented measures of efficiency of corridors21 under the scenario
21 Input-oriented measure of efficiency implies fewest resources or lowest cost to produce a given level of output (here, trade), which in other words tells us given output, input minimisation. The output-oriented measure of efficiency indicates output maximisation with given resources.
Strengthening Regional Trade and Production Networks through Transport Connectivity July 2014
20
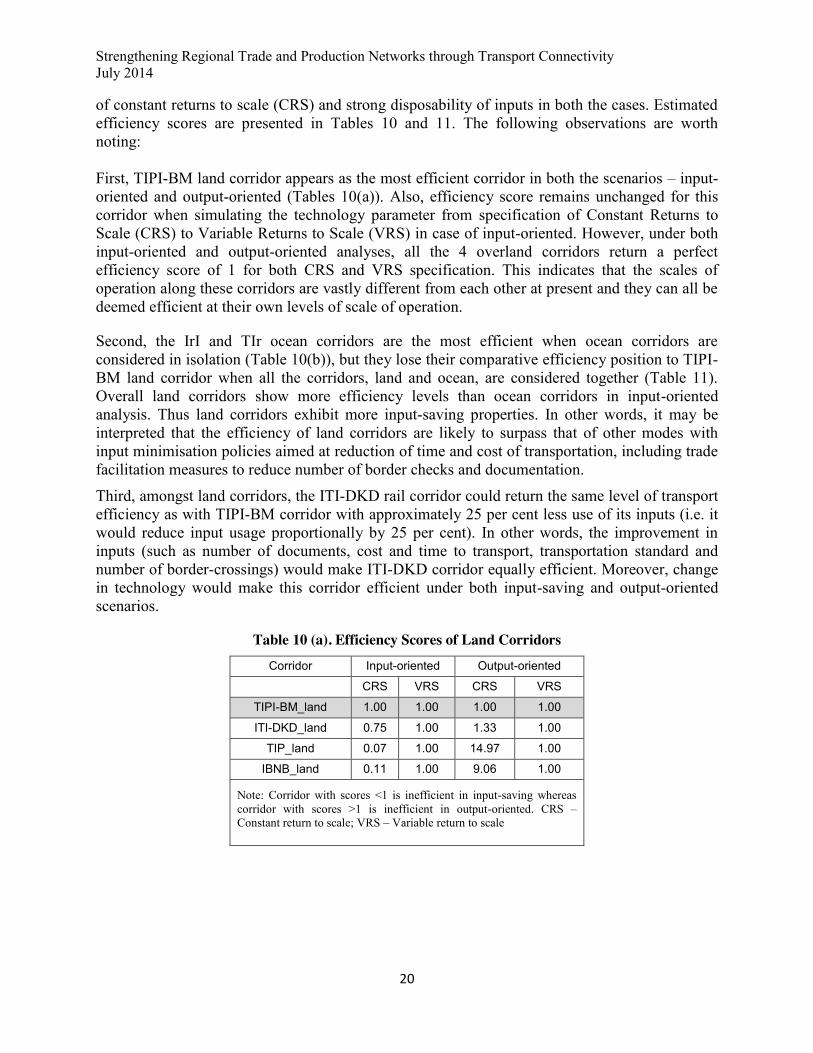
of constant returns to scale (CRS) and strong disposability of inputs in both the cases. Estimated efficiency scores are presented in Tables 10 and 11. The following observations are worth noting: First, TIPI-BM land corridor appears as the most efficient corridor in both the scenarios – input-oriented and output-oriented (Tables 10(a)). Also, efficiency score remains unchanged for this corridor when simulating the technology parameter from specification of Constant Returns to Scale (CRS) to Variable Returns to Scale (VRS) in case of input-oriented. However, under both input-oriented and output-oriented analyses, all the 4 overland corridors return a perfect efficiency score of 1 for both CRS and VRS specification. This indicates that the scales of operation along these corridors are vastly different from each other at present and they can all be deemed efficient at their own levels of scale of operation.
Second, the IrI and TIr ocean corridors are the most efficient when ocean corridors are considered in isolation (Table 10(b)), but they lose their comparative efficiency position to TIPI-BM land corridor when all the corridors, land and ocean, are considered together (Table 11). Overall land corridors show more efficiency levels than ocean corridors in input-oriented analysis. Thus land corridors exhibit more input-saving properties. In other words, it may be interpreted that the efficiency of land corridors are likely to surpass that of other modes with input minimisation policies aimed at reduction of time and cost of transportation, including trade facilitation measures to reduce number of border checks and documentation.
Third, amongst land corridors, the ITI-DKD rail corridor could return the same level of transport efficiency as with TIPI-BM corridor with approximately 25 per cent less use of its inputs (i.e. it would reduce input usage proportionally by 25 per cent). In other words, the improvement in inputs (such as number of documents, cost and time to transport, transportation standard and number of border-crossings) would make ITI-DKD corridor equally efficient. Moreover, change in technology would make this corridor efficient under both input-saving and output-oriented scenarios.
Table 10 (a). Efficiency Scores of Land Corridors Corridor Input-oriented Output-oriented
CRS VRS CRS VRS
TIPI-BM_land 1.00 1.00 1.00 1.00
ITI-DKD_land 0.75 1.00 1.33 1.00
TIP_land 0.07 1.00 14.97 1.00
IBNB_land 0.11 1.00 9.06 1.00
Note: Corridor with scores <1 is inefficient in input-saving whereas corridor with scores >1 is inefficient in output-oriented. CRS – Constant return to scale; VRS – Variable return to scale

South and South-West Asia Development Papers 1401 July 2014
21
Table 10 (b). Efficiency Scores of Ocean Corridors Corridor Input-oriented Output-oriented
CRS VRS CRS VRS
TI_ocean 0.52 1.00 1.93 1.93
IrI_ocean 1.00 1.00 1.00 1.00
TIr_ocean 1.00 1.00 1.00 1.00
TP_ocean 0.76 1.00 1.31 1.31
IB_ocean 0.68 1.00 1.47 1.00
PB_ocean 0.41 1.00 2.44 2.44
IrB_ocean 0.23 1.00 4.39 4.39
TB_ocean 0.18 1.00 5.50 5.50
Note: Corridor with scores <1 is inefficient in input-saving whereas corridor with scores >1 is inefficient in output-oriented. CRS – Constant return to scale; VRS – Variable return to scale
Table 11. Efficiency Scores of Corridors Corridor Input-oriented Output-oriented
CRS VRS CRS VRS
TIPI-BM_land 1.00 1.00 75.00 5.50
ITI-DKD_land 0.75 1.00 71.43 4.45
IBNB_land 0.11 0.89 41.12 2.53
TIr_ocean 0.11 1.00 27.27 1.95
IrI_ocean 0.08 1.00 25.43 1.00
TIP_land 0.07 1.00 19.23 1.33
TP_ocean 0.05 1.00 14.97 1.00
TI_ocean 0.04 1.00 11.84 1.00
IB_ocean 0.04 1.00 9.09 1.00
PB_ocean 0.02 1.00 9.06 3.61
IrB_ocean 0.01 1.00 1.33 1.00 TB_ocean 0.01 1.00 1.00 1.00
Note: Corridor with scores <1 is inefficient in input-saving whereas corridor with scores >1 is inefficient in output-oriented. CRS – Constant return to scale; VRS – Variable return to scale
Fourth, from the point of view of developing production networks, overland corridors look more promising as such they can help to connect inland production centres scattered across the region. In that context, both TIPI-BM and ITI-DKD can provide connectivity to specialised production clusters which participate in a supply-chain through feeder routes besides the main corridors.

Strengthening Regional Trade and Production Networks through Transport Connectivity July 2014
22
Fifth, the efficiency scores also underscore that a strong and exclusive trade and transport facilitation programme is urgently needed for the subregion. At present, high variations exist among the SSWA countries in terms of trade facilitation. Strengthening overland corridor such as ITI-DKD and TIPI-BM with investments in cross-border infrastructure and trade facilitation measures would help the subregion to improve the efficiency of transport corridor and supply chain connectivity. A framework for regional corridor development should also be based on the extent of the corridors’ rationality and their area of influence or width in the SSWA. 6. Key Policies and Way Forward
Unlocking SSWA’s trade potential and facilitating development of production networks in the subregion is a daunting task. Costs for not having uninterrupted road or railway connectivity across the subregion can offset gains from trade preferences as proposed under several preferential trade agreements and other arrangements such as ECOTA and SAFTA. A favorable climate to create a seamless infrastructure to operate in its full potential is missing in SSWA at present. The regional cooperation agenda has to go beyond “tariff-based policy” barriers and include “non-tariff policy” barriers like regional connectivity both in its hardware (transport corridors) and software (facilitation of movements of goods and vehicles across borders) dimensions. A scrutiny of subregional programmes across the world clearly shows that most of them have now undertaken exclusive projects to improve connectivity. 22 To realize the potentials of SSWA’s production networks, they need to be integrated with pan-Asian arteries such as the Trans-Asian Highway (AH) and Trans-Asian Railway (TAR). They also need to take advantage of infrastructure development initiatives by development organizations such as the World Bank and the ADB. In order to promote seamless connectivity in SSWA, development and integration of different subregional transport corridors and modes (railways, roads, air, and maritime shipping) is very important and so is prioritization of such connectivity projects based on their relative order of importance. In that context, some initiatives which should be pursued in this regard are highlighted below. (i) Building extended transport corridors As observed in the previous section, the corridors proposed by ESCAP for the SSWA region, namely, TIPI-BM corridor along the Asian Highway routes and ITI-DKD container train corridor along the Trans-Asian Railway routes have maximum potential in terms of effectiveness. They can revive Asia’s new silk routes. They would lead to huge gains associated with energy conservation besides strengthening the interdependence within the region (ESCAP-SSWA 2012). For instance, Pakistan and Afghanistan will become hubs for India’s trade with Iran, Middle East and Central Asia although that would need upgrading of infrastructure and Land Custom Stations (LCSs) at the Afghanistan’s border with the Central Asian countries (Turkmenistan, Uzbekistan and Tajikistan). Similarly, Bangladesh will become a hub for India’s trade with Myanmar and
22 Refer, for example, ADB-ADBI(2009); ESCAP(2012)
South and South-West Asia Development Papers 1401 July 2014
23
other Southeast Asian countries, besides serving as a transit for India’s North East Region (NER). Myanmar itself will become a transit hub for India’s trade with other ASEAN countries. Over time ITI-DKD corridor can also be extended further to Myanmar and link up with ASEAN corridors. For this to happen, besides standardization of the railway tracks, the major challenges for ensuring smoother connectivity of ITI-DKD on the eastern side would require India’s Manipur to be linked with India’s main railway corridor. Indian Railways is actively engaged in harmonization and construction of railway tracks in the north-eastern region of India. The Jiribam-Imphal-Moreh rail link (in Indian side) is identified for development and will link India with ASEAN. Although construction work is being carried out in –Jiribum to Tupul section, linking it with Moreh via Imphal (and thereby India with Myanmar and Thailand) depends on how fast the railway system on the Myanmar side is developed simultaneously. The Jiribam-Imphal new line will provide rail connectivity to Imphal with the national mainstream. The first phase of the railway line, Jiribam to Tupul (84 km), is slated for completion by March 2016. The other key issue would be upgrading of infrastructure and Land Custom Stations (LCSs) at the Afghanistan’s border with the Central Asian countries (Turkmenistan, Uzbekistan and Tajikistan). Thus, TIPI-BM and ITI-DKD corridors would be Asia’s new silk route, linking Central and West Asia with East Asia, where South Asia acts as the land bridge and would play as most vital corridor for expanded trade and transportation. (ii)Multimodal Transportation and Facilitation of Regional Transit For facilitating multimodal transport, SSWA countries have to eliminate some important non-physical barriers such as lack of parking, immigration and customs offices, baggage scanning equipment, telephone and warehousing at border posts. In addition, they also need to address issues related to Electronic Data Interchange (EDI)/IT, standardization of working hours and weekly holidays, as well as complicated customs procedures and the lack of transparency in inspection. In order to eliminate all such barriers and to greatly facilitate the movement of vehicles, goods and passengers across the subregion on a door-to-door basis, SSWA countries may adopt a Regional Transport and Transit Agreement (SSWARTTA) that could draw upon the existing ECO transit transport agreement (ECOTTA). With regard to maritime transport, the major barriers include capacity constraints at many of the maritime gateways, together with heavy siltation at navigation channels. Inadequate and poor maintenance of channel markings, old technology in cargo and ship handling equipment, as well as floating crafts represent additional challenges. Other barriers at port impacting port performances include lack of professional management and computerization, as well as EDI/IT to link up stakeholder. 23 Supply side constraints are posing serious threat to maritime transportation infrastructure.24 India, Turkey and the Islamic Republic of Iran can play a major role in strengthening ports and shipping sector through assistance and capacity development,
23 In addition, transshipment between India and Pakistan appears as a long-standing unresolved bilateral issue. India-Pakistan Shipping Protocol, signed in 1975 as per Shimla Agreement of 1972 restricts transshipment cargo destined for a third country carried by the vessels of either country. In order to boost up bilateral trade, the Governments of India and Pakistan should amend this Protocol. 24 Except for India, the Islamic Republic of Iran and Turkey, other SSWA countries do not have adequate fleet of vessels and manpower.

Strengthening Regional Trade and Production Networks through Transport Connectivity July 2014
24
particularly in Bangladesh, Maldives and Myanmar, in areas such as training of human resources in marine engineering, nautical science, coastal management etc.25 With regard to aviation, SSWA airports suffer from tremendous capacity constraints, on-shore and off-shore, for both passengers and cargo, in terms of runways, parking areas for aircrafts, passenger handling areas, cargo processing facilities (green channel, cold storage, etc), as well as security and baggage handling facilities. It would be useful if SSWA countries could jointly set up a regional aviation training institute in the subregion. Furthermore, an Open Sky Policy for airlines, particularly for cargo transportation, originating from within the subregion may help in strengthening connectivity. SSWA countries should jointly explore important areas related to aviation safety, cooperative development of operational safety and airworthiness, the development of infrastructure, standards, cooperation among air traffic controls, etc., and may follow the ASEAN template of regional aviation cooperation.26 (iii) Strengthening and Harmonizing Rules, Regulations and Standards In order for the infrastructure hardware of a SSWA-wide transport network to function effectively, necessary soft infrastructure, such as relevant rules, regulations, and standards, needs to be in place. Rules, regulations, and standards must meet at least a common regional structure, but preferably an international design. Participating countries need to formulate and agree on a harmonized set of rules, regulations, and standards. ECOTTA is a very important step towards harmonizing the software relating to cross-border infrastructure use and could provide a template for South and South-West Asia. There is a need for coordination among different stakeholders and agencies, such as transport, customs, immigration, and quarantine authorities. At the same time, the capacity of concerned national institutions, particularly for less developed countries, needs to be enhanced for the effective implementation of those agreements. There is also a need for a uniform or compatible standard (preferably an international standard) for the development of cross-border transport networks to make the networks effective and beneficial for all stakeholders. Establishment of an efficient management system and associated capacity building to look after the harmonization of standards relating to cross-border transportation would pave the way to better regional connectivity. This would ultimately help achieve single-stop and single-window customs across the subregion.27
25 India has also established the National Maritime University in Chennai, which may be made accessible by all SSWA countries. 26 ASEAN countries have adopted the ASEAN Multilateral Agreement on the Full Liberalization of Air Freight Services on 20 May 2009. This Agreement is one of the components of the Roadmap for Integration of Air Travel Sector and the Action Plan for ASEAN Air Transport Integration and Liberalization 2005-2015, adopted at the Tenth Transport Ministers Meeting held in Phnom Penh in 2004. 27 In this context, it may be mentioned about The ASEAN Single Window (ASW) which is designed to expedite customs clearance and release of shipments coming to and departing from ASEAN. It is broadly defined as an environment where a single window in each country in ASEAN (i.e., National Single Window, or NSW) operates and integrates. The National Single Window is a prerequisite of the ASEAN Single Window. Six ASEAN countries are now implementing ASEAN Single Window.
South and South-West Asia Development Papers 1401 July 2014
25
7. Concluding Remarks
SSWA region’s economic performance in the last decade has been commendable, but there is much left to accomplish. The region has high untapped potential to develop production networks as can be observed from the trade patterns in sectors such as parts and components for capital goods and transport equipment. The quality and capacity of SSWA’s infrastructure, both on the national and cross-border levels, is certainly a matter of concern. SSWA countries have to improve its supply chain connectivity substantially in order to effectively link its production into global value chains. In order to encourage production networks and economic integration in SSWA, a comprehensive approach is needed to address physical infrastructure issues as well as non-physical soft infrastructure issues, including cross-border transit facilitation measures; customs clearance, and other facilitating polices and regulations. SSWA cooperation programmes have to be much stronger to address the regional infrastructure needs and enabling institutions and policies. A comparison of efficiency scores across different modes of cross-border regional transportation finds that overland corridors proposed by ESCAP for SSWA region, namely, TIPI-BM and ITI-DKD, are efficient. Moreover, overland transportation is ideal for the development of regional production networks. Therefore, what is important for SSWA countries is to enhance the facilitation of trade and transport across borders along such corridors. Addressing these issues, requires collaborative efforts among SSWA countries, multilateral development banks, the United Nations agencies, intergovernmental organizations, bilateral donor agencies, private sectors and professional associations. A commonly agreed strategic regional connectivity plan can facilitate such collaborative efforts.

Strengthening Regional Trade and Production Networks through Transport Connectivity July 2014
26
References ADB-ADBI (2009). Infrastructure for a Seamless Asia, Asian Development Bank (ADB),
Manila and Asian Development Bank Institute (ADBI), Tokyo. Arvis, J.F., Duval, Yann, Shepherd, Ben, and Chorthip Utoktham (2012). Trade Costs in the
Developing World: 1995 – 2010. ARTNeT Working Paper No. 121, ESCAP, Bangkok, Available at www.artnetontrade.org.
ASEAN Secretariat (2010). Master Plan on ASEAN Connectivity, Jakarta. Baldwin , Richard (2011). Trade and Industrialisation after Globalisation’s 2nd Unbundling: How
Building and Joining a Supply Chain are Different and Why It Matters. Working Paper 17716, National Bureau of Economic Research (NBER), Cambridge, http://www.nber.org/papers/w17716
Bergeijk Peter A.G. van and Charles van Marrewijk (2013). "Heterogeneity and Development: An Agenda," Journal of International Trade & Economic Development, vol. 22, no. 1, pp. 1-9
Brooks, Douglas (2010). “Regional Cooperation, Infrastructure and Trade Costs in Asia”, in Douglas Brooks and Susan Stone (eds.), Trade Facilitation and Regional Cooperation in Asia, Edward Elgar Cheltenham and Asian Development Bank Institute (ADBI), Tokyo.
Brooks, Douglas and David Hummels (eds.) (2009). Infrastructure’s Role in Lowering Asia’s Trade Costs: Building for Trade, Edward Elgar Cheltenham and Asian Development Bank Institute (ADBI), Tokyo.
De, Prabir (2009). Regional Cooperation for Regional Infrastructure Development: Challenges and Policy Options for South Asia, Discussion Paper # 160, Research and Information System for Developing Countries (RIS), New Delhi.
De, Prabir (2011). “Why is Trade at Borders a Costly Affair in South Asia? An Empirical Investigation”, Contemporary South Asia, vol. 19, no. 4, pp. 441-464.
De, Prabir, Selim Raihan, and Sanjay Kathuria (2012). Unlocking Bangladesh-India Trade: Emerging Potential and the Way Forward, Policy Research Working Paper 6155, The World Bank, Washington, D.C.
Duval, Yann and Chorthip, Uthoktham (2011). Trade Costs in Asia and the Pacific: Improved and Sectoral Estimates, Trade and Investment Division Staff Working Paper 05/11, United Nations Economic and Social Commission for Asia and the Pacific (ESCAP), Bangkok.
ECO (2001). Memorandum of Understanding on the Opening of International Passenger Traffic on Almaty-Tashkent-Turkmenabad-Tehran-Istanbul Route, Signed on the 31st October, 2001 in Baku (Azerbaijan), Economic Cooperation Organization (ECO), Tehran.
ESCAP (2006). Enhancing Infrastructure Cooperation in Infrastructure Development Including That Related to Disaster Management, United Nations Economic and Social Commission for Asia and the Pacific (ESCAP), Bangkok.
ESCAP (2010). Economic and Social Survey of Asia and the Pacific 2010, United Nations Economic and Social Commission for Asia and the Pacific, Bangkok.
ESCAP (2012). Growing Together: Economic Integration for an Inclusive and Sustainable Asia-Pacific Century, United Nations Economic and Social Commission for Asia and the Pacific, Bangkok.
ESCAP-SSWA (2012). South and South-West Asia Development Report, UNESCAP, New Delhi Harrigan, James (1995). "The Volume of Trade in Differentiated Intermediate Goods: Theory
and Evidence," The Review of Economics and Statistics, vol. 77, no. 2, pp 283-93
South and South-West Asia Development Papers 1401 July 2014
27
Jones and H. Kierzkowski (2005). Production Fragmentation and Outsourcing: General Concerns, University of Rochester, Unpublished Paper.
Kelegama, S. and A. Abayasekara (2012). Regional Economic Cooperation and Connectivity in South and South-West Asia: Potential and Challenges, South and South-West Asia Development Papers 1205, ESCAP-SSWA, New Delhi.
Kimura, F. and I. Kobayashi (2009). Why Is the East Asia Industrial Corridor Needed? ERIA Policy Brief 2009-01, ERIA, Jakarta.
Planning Commission (2011). A New Approach to the Twelfth Five Year Plan 2012-17, Government of India, New Delhi.
RIS (2008). South Asia Development and Cooperation Report 2008, Research and Information System for Developing Countries (RIS), New Delhi and Oxford University Press (OUP), New Delhi.
SARI (2006). Impact and Benefits of Power Trading in the South Asia Growth Quadrangle, South Asia Regional Initiative for Energy Cooperation and Development (SARI), New Delhi.
Saslavsky, D. and B. Shepherd (2012). Facilitating International Production Networks: The Role of Trade Logistics, Policy Research Working Paper No. 6224, The World Bank, Washington D.C.
UNCTAD (2011). Trade and Development Report 2011, United Nations Conference on Trade and Development (UNCTAD), Geneva.
World Bank (2012). Connecting to Compete: Trade Logistics in the Global Economy, Washington, D.C.
Strengthening Regional Trade and Production Networks through Transport Connectivity July 2014
28
Annex 1
Trade Classifications of Parts and Components
Structure of BEC Codes
BEC Good Description
22 Final Processed Industrial Supplies
21 Primary/Semi Processed Primary Industrial Supplies
41 Final Capital goods (except transport equipment)
42 Primary/Semi Processed Parts and accessories
51 Final Passenger Motor Cars
53 Primary/Semi Processed Transport equipment and parts and accessories thereof
Annex 2
Table 1. India’s Export of Parts and Components to SSWA Countries
(a) Parts and Accessories for Capital Goods in Value
Country 2000 2012 CAGR (2000-2012)
Value (US$
million) Share*
(%) Value (US$
million) Share*
(%) (%)
Bangladesh 15.33 1.60 98.67 1.19 18.44 Iran (Islamic Republic of) 13.14 1.37 140.85 1.70 24.06
Pakistan 1.02 0.11 10.79 0.13 23.96
Sri Lanka 12.53 1.31 88.59 1.07 19.46
Turkey 5.75 0.60 87.06 1.05 28.03
(b) Parts and Accessories for Transport Equipment in Value
Country 2000 2012 CAGR (2000-2012)
Value (US$
million) Share*
(%) Value (US$
million) Share*
(%) (%)
Bangladesh 13.83 2.30 60.77 0.94 14.40 Iran (Islamic Republic of) 5.28 0.88 23.91 0.37 14.72
Pakistan 0.55 0.09 0.89 0.01 4.52
Sri Lanka 15.81 2.62 56.43 0.87 12.26
Turkey 8.84 1.47 263.91 4.08 36.17
(c) Parts and Accessories for Capital Goods in Volume
South and South-West Asia Development Papers 1401 July 2014
29
Country 2000 2012 CAGR (2000-2012)
Volume (TEU) Share*
(%) Volume (TEU)
Share* (%) (%)
Bangladesh 358 2.70 1030 1.356 10.10 Iran (Islamic Republic of) 157 1.19 1605 2.113 23.51
Pakistan 10 0.07 131 0.173 26.89
Sri Lanka 271 2.04 810 1.067 10.48
Turkey 168 1.27 1003 1.321 17.64
(d) Parts and Accessories for Transport Equipment in Volume
Country 2000 2012 CAGR (2000-2012)
Volume (TEU) Share*
(%) Volume (TEU)
Share* (%) (%)
Bangladesh 637 0.648 1848 2.835 10.17 Iran (Islamic Republic of) 235 0.239 279 0.428 1.57
Pakistan 24 0.024 22 0.033 -0.92
Sri Lanka 592 0.602 974 1.494 4.63 Turkey 298 0.303 2835 4.350 22.73
Source: Calculated based on UNCOMTRADE Note: *Share in country’s export to world
Table 2. Iran’s Export of Parts and Components to SSWA Countries
(a) Parts and Accessories for Capital Goods in Value
Country 2000 2012 CAGR (2000-2012)
Value (US$
million) Share*
(%) Value (US$
million) Share*
(%) (%)
Bangladesh 0.03 0.15 0.27 0.24 25.49
India 0.03 0.15 0.10 0.09 13.76
Pakistan 0.06 0.31 0.92 0.80 31.85
Sri Lanka 1.21 6.52 0.59 0.51 -6.92
Turkey 0.09 0.48 0.88 0.76 25.62
(b) Parts and Accessories for Transport Equipment in Value
Strengthening Regional Trade and Production Networks through Transport Connectivity July 2014
30
Country 2000 2012 CAGR (2000-2012)
Value (US$
million) Share*
(%) Value (US$
million) Share*
(%) (%)
Bangladesh 0.00 0.00 0.003 0.000
India 0.02 0.24 0.109 0.101 28.41
Pakistan 0.03 2.64 0.162 1.088 56.57
Sri Lanka 0.00 0.00 0.000 0.000
Turkey 3.98 2.79 21.611 1.151 -3.49
(c) Parts and Accessories for Capital Goods in Volume
Country 2000 2012 CAGR (2000-2012)
Volume (TEU)
Share* (%)
Volume (TEU)
Share* (%) (%)
Bangladesh 2 0.49 5 0.45 11.54
India 0 0.03 1 0.10 28.20
Pakistan 0 0.10 10 0.89 39.82
Sri Lanka 8 2.31 13 1.16 5.03
Turkey 2 0.51 19 1.77 27.53
(d) Parts and Accessories for Transport Equipment in Volume
Country 2000 2012 CAGR (2000-2012)
Volume (TEU)
Share* (%)
Volume (TEU)
Share* (%) (%)
Bangladesh 0 0.00 0 0.00
India 6 0.54 12 0.43 8.01
Pakistan 2 0.15 65 2.28 45.22
Sri Lanka 0.00 0.00
Turkey 134 12.75 81 2.83 -4.88 Source: Calculated based on UNCOMTRADE Note: *Share in country’s export to world
South and South-West Asia Development Papers 1401 July 2014
31
Table 3. Pakistan’s Export of Parts and Components to SSWA Countries
(a) Parts and Accessories in Value in 2012
Country Capital Goods Transport Equipment
Value (US$
million) Share* (%) Value (US$
million) Share*
(%)
Bangladesh 8.07 26.85 1.94 6.46
India 0.16 0.54 0.62 2.07 Iran (Islamic Republic of) 0.01 0.03 0.03 0.11
Sri Lanka 0.09 0.30 0.43 1.43
Turkey 0.87 2.91 1.00 3.32
(b) Parts and Accessories in Volume in 2012
Country Capital Goods Transport Equipment
Volume (TEU)
Share* (%)
Volume (TEU)
Share* (%)
Bangladesh 576 26.85 139 6.46
India 12 0.54 44 2.07 Iran (Islamic Republic of) 1 0.03 2 0.11
Sri Lanka 6 0.30 31 1.43
Turkey 62 2.91 71 3.32 Source: Calculated based on UNCOMTRADE Note: *Share in country’s export to world
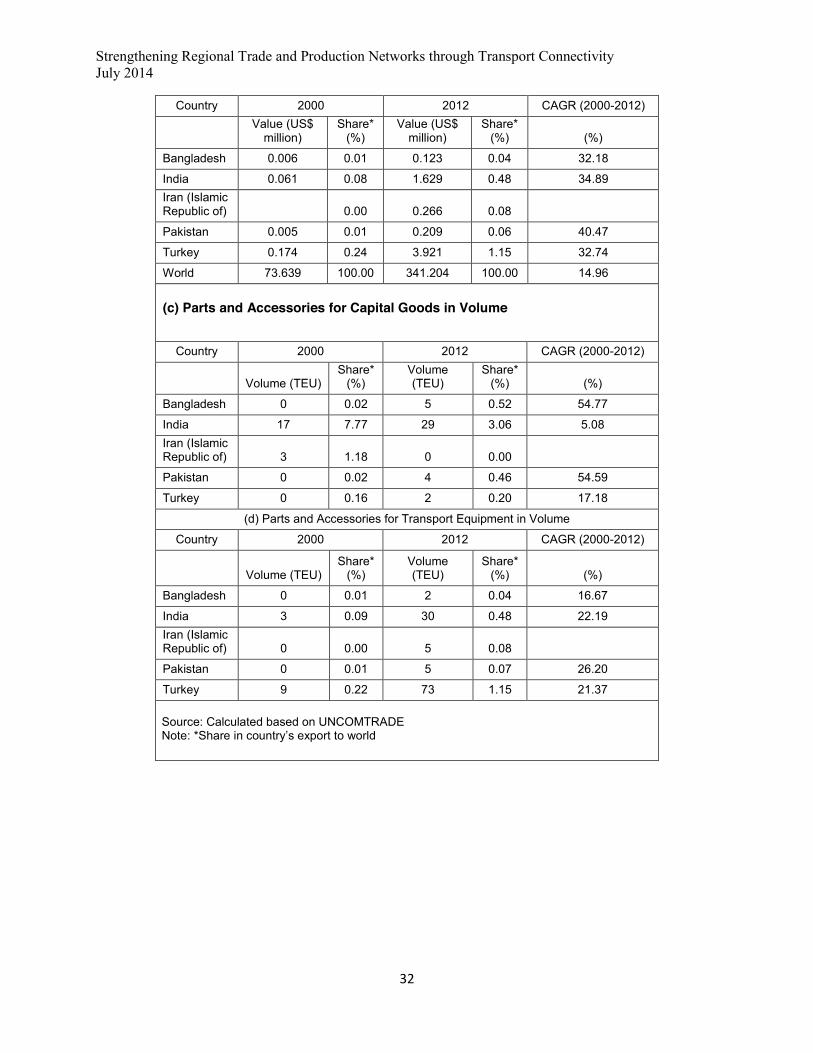
Table 4. Sri Lanka’s Export of Parts and Components to SSWA Countries
(a) Parts and Accessories for Capital Goods in Value
Country 2000 2012 CAGR (2000-2012)
Value (US$
million) Share*
(%) Value (US$
million) Share*
(%) (%)
Bangladesh 0.03 0.02 0.58 0.37 32.94
India 0.16 0.10 12.74 8.10 48.75 Iran (Islamic Republic of) 0.21 0.13 0.00
Pakistan 0.00 0.00 0.50 0.32 52.86
Turkey 0.21 0.13 0.10 0.07 -6.19
(b) Parts and Accessories for Transport Equipment in Value
Strengthening Regional Trade and Production Networks through Transport Connectivity July 2014
32
Country 2000 2012 CAGR (2000-2012)
Value (US$
million) Share*
(%) Value (US$
million) Share*
(%) (%)
Bangladesh 0.006 0.01 0.123 0.04 32.18
India 0.061 0.08 1.629 0.48 34.89 Iran (Islamic Republic of) 0.00 0.266 0.08
Pakistan 0.005 0.01 0.209 0.06 40.47
Turkey 0.174 0.24 3.921 1.15 32.74
World 73.639 100.00 341.204 100.00 14.96
(c) Parts and Accessories for Capital Goods in Volume
Country 2000 2012 CAGR (2000-2012)
Volume (TEU) Share*
(%) Volume (TEU)
Share* (%) (%)
Bangladesh 0 0.02 5 0.52 54.77
India 17 7.77 29 3.06 5.08 Iran (Islamic Republic of) 3 1.18 0 0.00
Pakistan 0 0.02 4 0.46 54.59
Turkey 0 0.16 2 0.20 17.18
(d) Parts and Accessories for Transport Equipment in Volume
Country 2000 2012 CAGR (2000-2012)
Volume (TEU) Share*
(%) Volume (TEU)
Share* (%) (%)
Bangladesh 0 0.01 2 0.04 16.67
India 3 0.09 30 0.48 22.19 Iran (Islamic Republic of) 0 0.00 5 0.08
Pakistan 0 0.01 5 0.07 26.20
Turkey 9 0.22 73 1.15 21.37 Source: Calculated based on UNCOMTRADE Note: *Share in country’s export to world
South and South-West Asia Development Papers 1401 July 2014
33
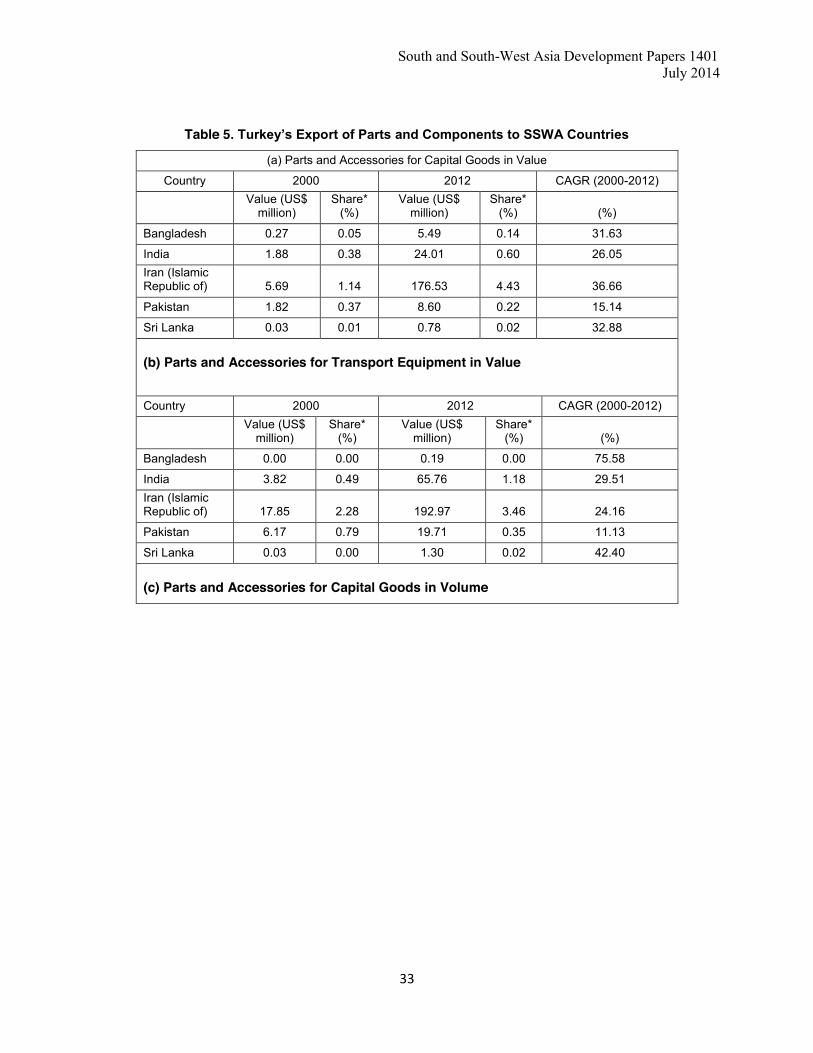
Table 5. Turkey’s Export of Parts and Components to SSWA Countries
(a) Parts and Accessories for Capital Goods in Value
Country 2000 2012 CAGR (2000-2012)
Value (US$
million) Share*
(%) Value (US$
million) Share*
(%) (%)
Bangladesh 0.27 0.05 5.49 0.14 31.63
India 1.88 0.38 24.01 0.60 26.05 Iran (Islamic Republic of) 5.69 1.14 176.53 4.43 36.66
Pakistan 1.82 0.37 8.60 0.22 15.14
Sri Lanka 0.03 0.01 0.78 0.02 32.88
(b) Parts and Accessories for Transport Equipment in Value
Country 2000 2012 CAGR (2000-2012)
Value (US$
million) Share*
(%) Value (US$
million) Share*
(%) (%)
Bangladesh 0.00 0.00 0.19 0.00 75.58
India 3.82 0.49 65.76 1.18 29.51 Iran (Islamic Republic of) 17.85 2.28 192.97 3.46 24.16
Pakistan 6.17 0.79 19.71 0.35 11.13
Sri Lanka 0.03 0.00 1.30 0.02 42.40
(c) Parts and Accessories for Capital Goods in Volume

Strengthening Regional Trade and Production Networks through Transport Connectivity July 2014
34
Country 2000 2012 CAGR (2000-2012)
Volume (TEU)
Share* (%)
Volume (TEU)
Share* (%) (%)
Bangladesh 5 0.05 36 0.09 19.99
India 10 0.10 254 0.63 34.42 Iran (Islamic Republic of) 78 0.80 1711 4.24 32.34
Pakistan 20 0.21 65 0.16 11.15
Sri Lanka 0 0.00 5 0.01 25.30
(d) Parts and Accessories for Transport Equipment in Volume
Country 2000 2012 CAGR (2000-2012)
Volume (TEU)
Share* (%)
Volume (TEU)
Share* (%) (%)
Bangladesh 0 0.00 2 0.00 101.68
India 58 0.41 602 1.03 23.75 Iran (Islamic Republic of) 282 1.98 1997 3.43 19.47
Pakistan 76 0.53 83 0.14 0.85
Sri Lanka 1 0.01 33 0.06 37.47 Source: Calculated based on UNCOMTRADE Note: *Share in country’s export to world
South and South-West Asia Development Papers 1401 July 2014
35
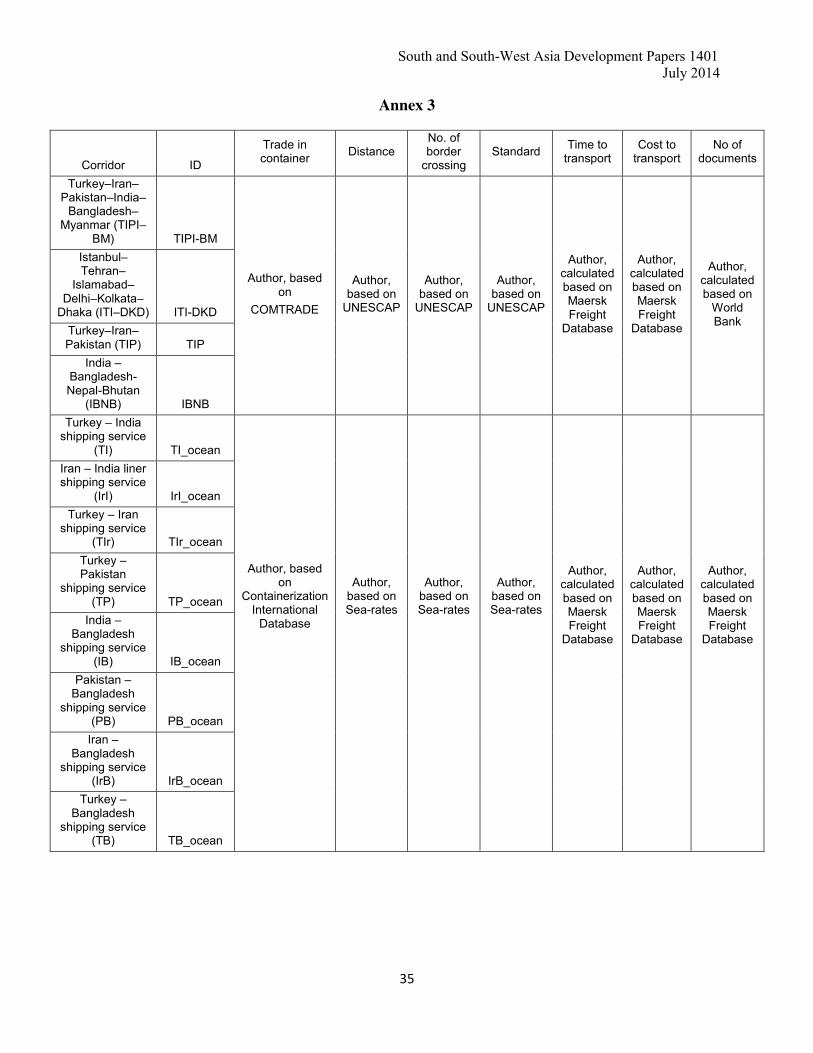
Annex 3
Corridor ID
Trade in container Distance
No. of border
crossing Standard Time to
transport Cost to
transport No of
documents
Turkey–Iran–Pakistan–India–
Bangladesh–Myanmar (TIPI–
BM) TIPI-BM
Author, based on
COMTRADE
Author, based on
UNESCAP
Author, based on
UNESCAP
Author, based on
UNESCAP
Author, calculated based on Maersk Freight
Database
Author, calculated based on Maersk Freight
Database
Author, calculated based on
World Bank
Istanbul–Tehran–
Islamabad–Delhi–Kolkata–
Dhaka (ITI–DKD) ITI-DKD Turkey–Iran–Pakistan (TIP) TIP
India – Bangladesh-Nepal-Bhutan
(IBNB) IBNB Turkey – India
shipping service (TI) TI_ocean
Author, based on
Containerization International
Database
Author, based on Sea-rates
Author, based on Sea-rates
Author, based on Sea-rates
Author, calculated based on Maersk Freight
Database
Author, calculated based on Maersk Freight
Database
Author, calculated based on Maersk Freight
Database
Iran – India liner shipping service
(IrI) IrI_ocean Turkey – Iran
shipping service (TIr) TIr_ocean
Turkey – Pakistan
shipping service (TP) TP_ocean
India – Bangladesh
shipping service (IB) IB_ocean
Pakistan – Bangladesh
shipping service (PB) PB_ocean
Iran – Bangladesh
shipping service (IrB) IrB_ocean
Turkey – Bangladesh
shipping service (TB) TB_ocean