Embed Size (px)
Citation preview

By
Dr. Talat Salama and Mr. Ahmed Abd-El-Meguid
Department of Civil, Construction, and Environmental Engineering The University of Alabama at Birmingham
Birmingham, AL
Prepared by
UUTTCCAA University Transportation Center for Alabama
The University of Alabama, The University of Alabama at Birmingham, and The University of Alabama in Huntsville
UTCA Report Number 06217
June 2010
Strengthening Steel Bridge Girders Using CFRP
UTCA Theme: Management and Safety of Transportation Systems

Strengthening Steel Bridge Girders Using CFRP
By
Dr. Talat Salama and Mr. Ahmed Abd-El-Meguid Department of Civil, Construction, and Environmental Engineering
The University of Alabama at Birmingham Birmingham, AL
Prepared by
UUTTCCAA University Transportation Center for Alabama
The University of Alabama, The University of Alabama at Birmingham, and The University of Alabama in Huntsville
UTCA Report Number 06217
June 2010

ii
Technical Report Documentation Page
Form DOT F 1700.7 (8-72)
1. Report No. (FHWA/CA/OR-)
2. Government Accession No.
3. Recipient's Catalog No.
4. Title and Subtitle
Strengthening Steel Bridge Girders Using CFRP
5. Report Date:
Submitted June 2009; Published June
2010.
6. Performing Organization Code
7. Author(s)
Dr. Talat Salama and Mr. Ahmed Abd-El-Meguid 8. Performing Organization Report No.
UTCA #06217
9. Performing Organization Name and Address
Dept. of Civil, Construction, and Environmental Engineering
The University of Alabama at Birmingham
Birmingham, AL
10. Work Unit No. (TRAIS)
11. Contract or Grant No.
12. Sponsoring Agency Name and Address
University Transportation Center for Alabama
The University of Alabama; P. O. Box 870205
Tuscaloosa, AL 35487-0205
13. Type of Report and Period Covered
Final Report of Research Conducted
June 1, 2006 – December 30, 2008.
14. Sponsoring Agency Code
15. Supplementary Notes
16. Abstract
While traditional retrofitting methods for steel bridge girders could be time consuming and uneconomical, an
alternative repair method is suggested using Carbon Fiber Reinforced Polymers (CFRP) laminate strips,
providing engineers with a competitive solution that will increase the life-cycle of repaired bridges. This
study investigated its feasibility as an option to strengthen and rehabilitate steel bridges. The main
advantages of using CFRP laminates are their light weight and durability, which results in ease of handling
and maintenance.
The research conducted experimental and analytical work to evaluate the effectiveness of strengthening steel
beams by the use of novel CFRP laminate strips configurations. The research involved the testing of five
experimental composite beams, in addition to the development of approximately 100 finite element models.
The results showed a significant gain in the beam’s elastic and ultimate capacities. The conclusion is that
there are specific sensitive parameters controlling the effectiveness of the CFRP laminate rehabilitation
technique. An adequate AASHTO design of the rehabilitation method, which takes into consideration the
effective parameters, would result in an effective bridge structure
17. Key Word(s)
CFRP, Steel Beams, Bridge Girders, Rehabilitation,
Strengthening, Finite Element Modeling, ABAQUS,
SAP 2000, Design Guidelines
18. Distribution Statement
19. Security Classif. (of this report)
20. Security Classif. (of this page)
21. No. of Pages
184
22. Price

iii
Contents
Contents ............................................................................................................................. iii
List of Tables ..................................................................................................................... vi List of Figures .................................................................................................................. viii Executive Summary ........................................................................................................... xi
1.0 Introduction ...............................................................................................................1
1.1 Background ...........................................................................................................1 1.2 Problem Statement ................................................................................................1
1.3 Research Objectives ..............................................................................................2 1.4 Methodology and Approach ..................................................................................2
1.5 Scope of Study ......................................................................................................3 1.6 Organization of the Report ....................................................................................3 1.7 Study Contribution and Innovation .......................................................................4
2.0 Literature Review......................................................................................................5 2.1 Introduction ...........................................................................................................5
2.2 Common Rehabilitation Field Applications ..........................................................5 2.3 Guidelines of Using FRP Reinforcement in the United States .............................6 2.4 Guidelines of Using FRP Reinforcement Worldwide ...........................................6
2.5 FRP Types and Applications .................................................................................7
2.5.1 AFRP..............................................................................................................9 2.5.2 GFRP..............................................................................................................9 2.5.3 CFRP ............................................................................................................10
2.6 CFRP Structural Characteristics..........................................................................11 2.7 CFRP in Steel Beam Applications ......................................................................11 2.8 CFRP Bond Behavior ..........................................................................................12
2.9 Fatigue Behavior of Steel Beams Reinforced with CFRP ..................................12 2.10 Summary ..........................................................................................................13
3.0 The Experimental Program .....................................................................................14 3.1 Specimen Details .................................................................................................14 3.2 Instrumentation....................................................................................................22
3.2.1 Strain Gages .................................................................................................22 3.2.2 Load Cell and LVDT Sensor .......................................................................23
3.2.3 Data Acquisition System..............................................................................23 3.3 Experimental Testing ..........................................................................................24 3.4 Results .................................................................................................................25 3.5 Material Properties of Steel and CFRP Plates .....................................................32

iv
3.5.1 Steel Tension Testing ...................................................................................33
3.5.2 CFRP Tension Testing .................................................................................35 3.6 Summary .............................................................................................................40
4.0 Verification of FE Model ........................................................................................42
4.1 Modeling Technique ...........................................................................................42 4.2 Model Details ......................................................................................................42 4.3 Element Interaction Simulation and Special FE Models ....................................47
4.3.1 Cohesive Elements and Adhesive Material Modeling .................................47 4.3.2 Mesh Tie Constraints ...................................................................................49
4.4 Compatibility of Steel Top Plate to Concrete Slab .............................................50 4.4.1 Concrete .......................................................................................................50 4.4.2 Compressive Behavior of the Concrete Model ............................................53
4.5 Failure Modes in FE Models ...............................................................................54 4.5.1 Steel Beam Failure .......................................................................................54 4.5.2 Concrete Failure ...........................................................................................56
4.5.3 CFRP Rupture ..............................................................................................59 4.5.4 CFRP Debonding – Epoxy Failure ..............................................................64
4.6 Results .................................................................................................................67 4.6.1 Concrete Slab versus Steel Top Plate ..........................................................67 4.6.2 Verification of FE Model by the Tested Beams ..........................................70
4.6.3 Strain-Depth Verification.............................................................................72 4.7 Summary .............................................................................................................75
5.0 Parametric Study .....................................................................................................76 5.1 Introduction .........................................................................................................76
5.2 Parametric Study Program ..................................................................................76 5.2.1 Flowchart Calculating Plastic Neutral Axis .................................................80
5.2.2 Flowchart Calculating Plastic Moment Capacity ........................................84 5.2.3 Effective Parameters ....................................................................................88 5.2.4 Beam Designation ........................................................................................88
5.3 Results .................................................................................................................91 5.3.1 CFRP Configuration ....................................................................................91
5.3.2 CFRP Thickness...........................................................................................96 5.3.3 CFRP Length ...............................................................................................97
5.3.4 CFRP Width .................................................................................................98 5.3.5 CFRP Manufacturer .....................................................................................99 5.3.6 CFRP Elastic Modulus ...............................................................................100 5.3.7 Results Summary .......................................................................................101
5.4 Conclusions .......................................................................................................101 5.5 Recommendations .............................................................................................106
6.0 Bridge Design Rehabilitation Guidelines .............................................................107
6.1 Background .......................................................................................................107 6.2 Scope .................................................................................................................107 6.3 Finite Element Bridge Modeling .......................................................................107
v
6.3.1 Bridge Description .....................................................................................107
6.3.2 Bridge Modeling ........................................................................................107 6.3.3 Bridge Loading ..........................................................................................110 6.3.4 Utilizing the FE Model to Evaluate Rehabilitation using CFRP ...............110
6.4 Steel Bridge Girder – Solved Example .............................................................121 6.4.1 Develop General Section ...........................................................................121 6.4.2 Develop Typical Section and Design Basis ...............................................122 6.4.3 Design Conventionally Reinforced Concrete Deck ...................................124 6.4.4 Select Resistance Factors ...........................................................................124
6.4.5 Select Load Modifiers ................................................................................125 6.4.6 Select Applicable Load Combinations.......................................................125 6.4.7 Calculate Live Load Force Effects [A3.6.1.1.1] ........................................125 6.4.8 Calculate Force Effects from Other Loads ................................................130
6.4.9 Design Required Sections ..........................................................................132 6.4.10 Dimension and Detail Requirements .........................................................143
6.5 Steel Bridge Girder Strengthened using CFRP – Solved Example ...................147 6.5.1 Design Required Sections ..........................................................................147
6.6 CFRP Contribution to Steel Bridge Girders ......................................................156 6.6.1 Section Inertia and Modulus ......................................................................157 6.6.2 Stresses .......................................................................................................158
6.6.3 Fatigue Stresses ..........................................................................................158 6.6.4 Deflections .................................................................................................159
6.7 Design Guidelines .............................................................................................159 6.8 Summary ...........................................................................................................160
7.0 Summary, Conclusions & Future Research ..........................................................161
7.1 Summary ...........................................................................................................161
7.2 Conclusion .........................................................................................................162 7.3 Future Research .................................................................................................163
8.0 References .............................................................................................................164
Appendix ..........................................................................................................................168
Appendix A: Plastic Neutral Axis Calculations ..........................................................169 Appendix B: Plastic Moment Capacity Calculations ..................................................171

vi
List of Tables Number Page
Table 3-1. Test Matrix for the Large-Scale Steel-CFRP Composite Beam Tests .................................. 14 Table 3-2. Experimental Beam Results .................................................................................................. 32 Table 3-3. Carbon Fiber Material Properties ......................................................................................... 35 Table 3-4. CFRP Tension Test Results .................................................................................................. 37 Table 3-5. Laminate Properties of CFRP From Several Manufacturers Comparison ........................... 40 Table 5-1. W200 x 19.3 – Input Data Sheet ........................................................................................... 78 Table 5-2. W200 x 19.3 – Output Data Sheet ........................................................................................ 79 Table 5-3. W200 x 19.3 Parametric Study Table – Four-Point Loading ............................................... 89 Table 5-4. W200 x 19.3 Parametric Study Table – Uniform Loading ................................................... 90 Table 5-5. W310 x 38.7 and W410 x 53 Parametric Study Table, Four-Point Loading ........................ 91 Table 5-6. W200 x 19.3 with CFRP 90% Length and 1.40 mm Thickness – Four-Point Loading ....... 92 Table 5-7. W200 x 19.3 with CFRP 60% Length and 2.00 mm Thickness – Four-Point Loading ....... 93 Table 5-8. W200 x 19.3 with CFRP 60% Length and 2.00 mm Thickness – Uniform Loading ........... 95 Table 5-9. W200 x 19.3 with CFRP 75% Length and 2.00 mm Thickness – Uniform Loading ........... 96 Table 5-10. W200 x 19.3 Results Table, Four-Point Loading – CFRP Length Variable ...................... 98 Table 5-11. W200 x 19.3 Results Table, Four-Point Loading – CFRP Width Variable ........................ 99 Table 5-12. W200 x 19.3 Beam Stiffness Comparison with CFRP from Different Manufacturers .... 100 Table 5-13. W200 x 19.3 Results Table, Four-Point Loading ............................................................. 104 Table 5-14. W200 x 19.3 Results Table, Uniform Loading ................................................................. 105 Table 5-15. W310 x 38.7 Results Table, Four-Point Loading ............................................................. 106 Table 5-16. W410 x 53 Results Table, Four-Point Loading ................................................................ 106 Table 6-1. Truck Loading Data ............................................................................................................ 110 Table 6-2. LRFD Load Modifiers ........................................................................................................ 125 Table 6-3. Multiple Presence Factors .................................................................................................. 125 Table 6-4. Dynamic Load Allowance Factors ..................................................................................... 126 Table 6-5. Interior Girder Un-factored Moments and Shears .............................................................. 131 Table 6-6. Exterior Girder Un-factored Moments and Shears ............................................................. 132 Table 6-7. Steel Section Properties ...................................................................................................... 134 Table 6-8. Short-Term Composite Section Properties, n=8, bi = 2380 mm ......................................... 137 Table 6-9. Long-Term Composite Section Properties, 3n=24 ............................................................. 138 Table 6-10. Maximum Flexural Stress in the Web for Positive Flexure (Interior Girder)................... 139 Table 6-11. Compressive Stresses in Top of Steel Beam Due to Factored Loading (Interior Girder) 139 Table 6-12. Tensile Stresses in Bottom of Steel Beam Due to Factored Loading ............................... 139 Table 6-13. Stresses in Top of Flange of Steel Beam Due to Service II Moments .............................. 146 Table 6-14. Stresses in Bottom Flange of Steel Beam Due to Service II Moments ............................ 146 Table 6-15. Exterior Beam Deflection Due to Dead Loads ................................................................. 146 Table 6-16. Interior Beam Deflection Due to Dead Loads .................................................................. 146 Table 6-17. Section Properties (Steel + CFRP) ................................................................................... 148 Table 6-18. Short-Term Composite Section Properties, n=8, bi = 2380 mm ....................................... 150 Table 6-19. Long-Term Composite Section Properties, 3n=24 ........................................................... 152 Table 6-20. Maximum Flexural Stress in the Web for Positive Flexure (Interior Girder)................... 152 Table 6-21. Compressive Stresses in Top of Steel Beam Due to Factored Loading (Interior Girder) 153

vii
Table 6-22. Tensile Stresses in Bottom of Steel Beam Due to Factored Loading ............................... 153 Table 6-23. Stresses in Top of Flange of Steel Beam Due to Service II Moments .............................. 155 Table 6-24. Stresses in Bottom Flange of Steel Beam Due to Service II Moments ............................ 155 Table 6-25. Exterior Beam Deflection Due to Dead Loads ................................................................. 155 Table 6-26. Interior Beam Deflection Due to Dead Loads .................................................................. 156

viii
List of Figures
Number Page
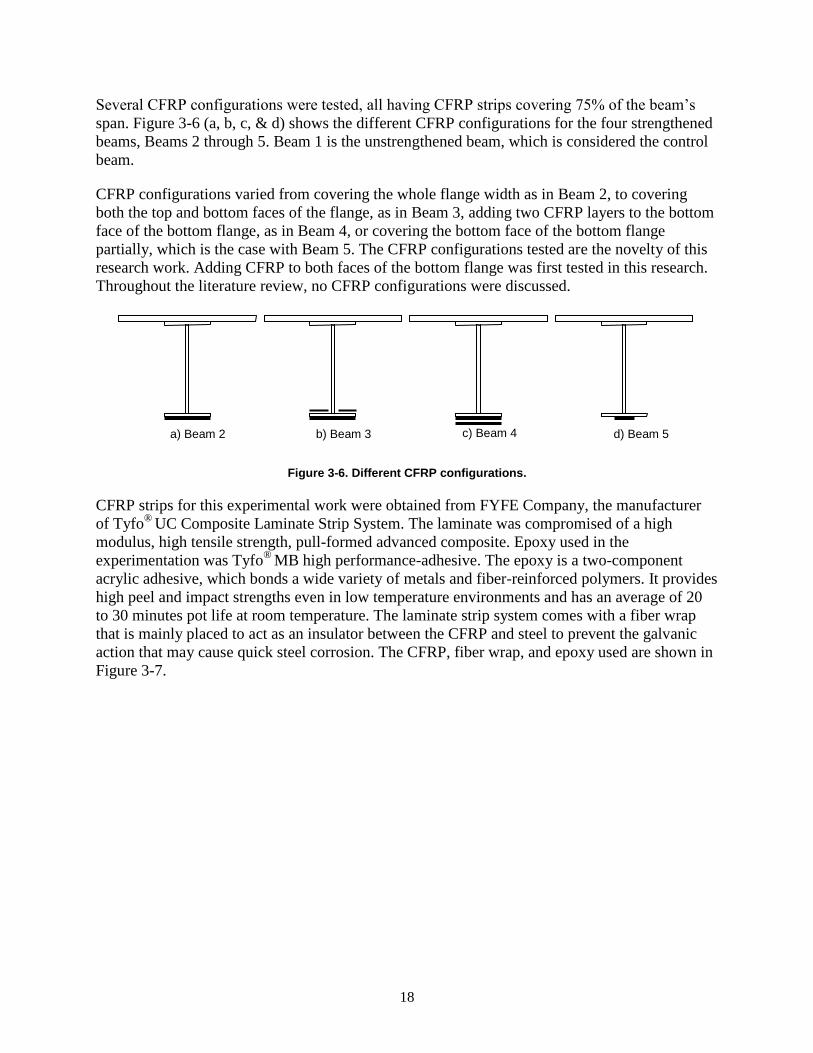
Figure 2-1. Comparison of stress-strain behavior of steel and FRPs (QuakeWrap, 2008) ...................... 7 Figure 3-1. Beam dimensions and strain gage locations ........................................................................ 15 Figure 3-2. Steel beam and steel plate centered before welding ............................................................ 16 Figure 3-3. Weld size and spacing dictated ........................................................................................... 16 Figure 3-4. Automatic welding machine used ....................................................................................... 17 Figure 3-5. Steel beam and steel plate during the welding process ....................................................... 17 Figure 3-6. Different CFRP configurations ........................................................................................... 18 Figure 3-7. (a) CFRP and fiber wraps, (b) Epoxy and gun applicator ................................................... 19 Figure 3-8. Roughening the surface of CFRP ........................................................................................ 20 Figure 3-9. Adding Epoxy and spreading it on the prepared aurface .................................................... 20 Figure 3-10. The strengthened beam after adding the CFRP layer ........................................................ 21 Figure 3-11. Applying pressure on the CFRP layer using clamps ......................................................... 21 Figure 3-12. Experimental setup of steel beam strengthened by CFRP................................................. 22 Figure 3-13. Installation of strain gages ................................................................................................. 23 Figure 3-14. Wiring strain gages to the data acquisition system ........................................................... 24 Figure 3-15. A view of Beam 4 showing the deflection at the end of the experiment ........................... 25 Figure 3-16. Load-strain curve for Beam 1 ............................................................................................ 26 Figure 3-17. Load-strain curve for Beam 2 ............................................................................................ 26 Figure 3-18. Load-strain curve for Beam 3 ............................................................................................ 27 Figure 3-19. Load-strain curve for Beam 4 ............................................................................................ 27 Figure 3-20. Load-strain curve for Beam 5 ............................................................................................ 28 Figure 3-21. Strain-depth curve for Beam 1 .......................................................................................... 29 Figure 3-22. Strain-depth curve for Beam 2 .......................................................................................... 29 Figure 3-23. Strain-depth curve for Beam 3 .......................................................................................... 30 Figure 3-24. Strain-depth curve for Beam 4 .......................................................................................... 30 Figure 3-25. Strain-depth curve for Beam 5 .......................................................................................... 31 Figure 3-26. Experimental load-deflection curves for the five beams ................................................... 32 Figure 3-27. Steel specimen mounted for a tension test – strain gage installed .................................... 33 Figure 3-28. Steel specimen after the tension test ................................................................................. 34 Figure 3-29. Stress-strain curve for steel from tension test results ........................................................ 34 Figure 3-30. Tension test setup: testing machine and data acquisition system ...................................... 36 Figure 3-31. First signs of CFRP rupture: outer fibers ruptured ............................................................ 37 Figure 3-32. Successive CFRP fiber rupture towards the specimen center ........................................... 38 Figure 3-33. Stress-strain curve for CFRP Tension Test 1 – 100 mm x 1.40 mm ................................. 38 Figure 3-34. Stress-strain curve for CFRP Tension Test 2 – 100 mm x 1.40 mm ................................. 39 Figure 3-35. Stress-strain curve for CFRP Tension Test 3 – 50 mm x 1.40 mm ................................... 39 Figure 3-36. Stress-strain curve for CFRP Tension Test 4 – 100 mm x 1.40 mm ................................. 40 Figure 4-1. An isotropic view of the three-dimensional FE model ........................................................ 44 Figure 4-2. Isometric view of the beam model – loads shown .............................................................. 45 Figure 4-3. Concentrated load definition ............................................................................................... 45 Figure 4-4. Boundary conditions – hinged support ................................................................................ 46 Figure 4-5. Boundary conditions – roller support .................................................................................. 46

ix
Figure 4-6. Debonding along a skin-stringer interface: typical situation for
traction-separation-based modeling (Abaqus Analysis User Manual, 2007) ....................... 48 Figure 4-7. Cohesive element definition form ....................................................................................... 49 Figure 4-8. Surface constraints definition .............................................................................................. 50 Figure 4-9. Tension stiffening model (Abaqus Analysis User Manual, 2007) ...................................... 52 Figure 4-10. Fracture energy cracking model (Abaqus Analysis User Manual, 2007) .......................... 53 Figure 4-11. Uniaxial behavior of plain concrete (Abaqus Analysis User Manual, 2007) .................... 54 Figure 4-12. Steel elastic material properties ......................................................................................... 55 Figure 4-13. Steel plastic material properties ........................................................................................ 56 Figure 4-14. Concrete elastic material properties .................................................................................. 57 Figure 4-15. Concrete smeared cracking material properties ................................................................ 58 Figure 4-16. Concrete tension stiffening ................................................................................................ 58 Figure 4-17. Concrete failure ratios ....................................................................................................... 59 Figure 4-18. CFRP damage strength ...................................................................................................... 61 Figure 4-19. CFRP damage evolution .................................................................................................... 61 Figure 4-20. CFRP damage stabilization ............................................................................................... 62 Figure 4-21. CFRP slastic material properties ....................................................................................... 63 Figure 4-22. CFRP section definition .................................................................................................... 64 Figure 4-23. Epoxy damage properties .................................................................................................. 65 Figure 4-24. Epoxy damage evolution ................................................................................................... 66 Figure 4-25. Epoxy elastic material properties ...................................................................................... 66 Figure 4-26. Load-deflection – steel plate vs. concrete slab – Beam 1.................................................. 67 Figure 4-27. Load-deflection – steel plate vs. concrete slab – Beam 2.................................................. 68 Figure 4-28. Load-deflection – steel plate vs. concrete slab – Beam 3.................................................. 68 Figure 4-29. Load-deflection – steel plate vs. concrete slab – Beam 4.................................................. 69 Figure 4-30. Load-deflection – steel plate vs. concrete slab – Beam 5.................................................. 69 Figure 4-31. Load-deflection curve for Beams 1 and 2 – experimental vs. Abaqus .............................. 70 Figure 4-32. Load-deflection curve for Beams 1 and 3 – experimental vs. Abaqus .............................. 71 Figure 4-33. Load-deflection curve for Beams 1 and 4 – experimental vs. Abaqus .............................. 71 Figure 4-34. Load-deflection curve for Beams 1 and 5 – experimental vs. Abaqus .............................. 72 Figure 4-35. Beam depth strain – experimental vs. Abaqus – Beam 1 .................................................. 73 Figure 4-36. Beam depth strain – experimental vs. Abaqus – Beam 2 .................................................. 74 Figure 4-37. Beam depth strain – experimental vs. Abaqus – Beam 3 .................................................. 74 Figure 5-1 Beam W200 x 19.3 with CFRP 90% length and 1.40 mm thickness. .................................. 92 Figure 5-2. Beam W200 x 19.3 with CFRP 60% length and 2.00 mm thickness. ................................. 93 Figure 5-3. Beam P60080B4T failure outside the CFRP reinforced zone. ............................................ 94 Figure 5-4. Beam W200 x 19.3 with CFRP 60% length and 2.00 mm thickness. ................................. 95 Figure 5-5. Beam W200 x 19.3 with CFRP 75% length and 2.00 mm thickness. ................................. 96 Figure 5-6. Beam W310 x 38.7 with CFRP 75% length and variable thickness. .................................. 97 Figure 5-7. Beam W200 x 19.3 with CFRP 2.00 mm thickness and variable length ............................ 98 Figure 5-8. Beam W200 x 19.3 with CFRP 75% length with variable CFRP laminate width .............. 99 Figure 5-9. Beam W200 x 19.3 with CFRP 75% length from different manufacturers ...................... 100 Figure 5-10. Beam W200 x 19.3 with different CFRP Young’s modulus ........................................... 101 Figure 6-1. Steel girder dimensions and area properties ...................................................................... 108 Figure 6-2. Bridge cross section and lane positions ............................................................................. 108 Figure 6-3. Composite section dimensions and area rroperties ........................................................... 109 Figure 6-4. Strain reduction after rehabilitation with CFRP – Truck 1 ............................................... 111 Figure 6-5. Strain reduction after rehabilitation with CFRP – Truck 2 ............................................... 111 Figure 6-6. Strain reduction after rehabilitation with CFRP – Truck 3 ............................................... 112

x
Figure 6-7. Strain reduction after rehabilitation with CFRP – Truck 4 ............................................... 112 Figure 6-8. Strain reduction after rehabilitation with CFRP – Truck 5 ............................................... 113 Figure 6-9. Strain reduction after rehabilitation with CFRP – Truck 6 ............................................... 113 Figure 6-10. Strain reduction after rehabilitation with CFRP – Truck 7 ............................................. 114 Figure 6-11. Strain reduction after rehabilitation with CFRP – Truck 8 ............................................. 114 Figure 6-12. Strain reduction after rehabilitation with CFRP – Truck 9 ............................................. 115 Figure 6-13. Strain reduction after rehabilitation with CFRP – Truck 10 ........................................... 115 Figure 6-14. Moment increase after rehabilitation with CFRP – Truck 1 ........................................... 116 Figure 6-15. Moment increase after rehabilitation with CFRP – Truck 2 ........................................... 117 Figure 6-16. Moment increase after rehabilitation with CFRP – Truck 3 ........................................... 117 Figure 6-17. Moment increase after rehabilitation with CFRP – Truck 4 ........................................... 118 Figure 6-18. Moment increase after rehabilitation with CFRP – Truck 5 ........................................... 118 Figure 6-19. Moment increase after rehabilitation with CFRP – Truck 6 ........................................... 119 Figure 6-20. Moment increase after rehabilitation with CFRP – Truck 7 ........................................... 119 Figure 6-21. Moment increase after rehabilitation with CFRP – Truck 8 ........................................... 120 Figure 6-22. Moment increase after rehabilitation with CFRP – Truck 9 ........................................... 120 Figure 6-23. Moment increase after rehabilitation with CFRP – Truck 10 ......................................... 121 Figure 6-24. Bridge example – bridge cross section ............................................................................ 122 Figure 6-25. Bridge example – (a) general elevation and (b) plan view .............................................. 123 Figure 6-26. Lever rule for determination of distribution factor for moment in
exterior beam, one lane loaded .......................................................................................... 127 Figure 6-27. Truck, tandem, and lane load placement for laximum loment at Location 105 .............. 128 Figure 6-28. Truck, tandem, and lane load placement for maximum shear at Location 100 ............... 130 Figure 6-29. Steel section at midspan .................................................................................................. 135 Figure 6-30. Composite section at midspan ......................................................................................... 136 Figure 6-31. Fatigue truck placement for maximum moment ............................................................. 138 Figure 6-32. Truck placement for maximum deflection ...................................................................... 143 Figure 6-33. General placement of point load P .................................................................................. 144 Figure 6-34. Point load P at center of span .......................................................................................... 144 Figure 6-35. Steel section with CFRP at midspan ............................................................................... 149 Figure 6-36. Composite steel section with CFRP at midspan .............................................................. 151

xi
Executive Summary
While traditional retrofitting methods for steel bridge girders could be time consuming and
uneconomical, an alternative repair method is suggested using Carbon Fiber Reinforced
Polymers (CFRP) laminate strips, providing engineers with a competitive solution that will
increase the life-cycle of repaired bridges. This study investigated its feasibility as an option to
strengthen and rehabilitate steel bridges. The main advantages of using CFRP laminates are their
light weight and durability, which results in ease of handling and maintenance.
The research conducted experimental and analytical work to evaluate the effectiveness of
strengthening steel beams by the use of novel CFRP laminate strips configurations. The research
involved the testing of five experimental composite beams, in addition to the development of
approximately 100 finite element models. The results showed a significant gain in the beam’s
elastic and ultimate capacities. The conclusion is that there are specific sensitive parameters
controlling the effectiveness of the CFRP laminate rehabilitation technique. An adequate
AASHTO design of the rehabilitation method, which takes into consideration the effective
parameters, would result in an effective bridge structure.
1
Section 1
1.0 Introduction
1.1 Background
Throughout the U.S., there are thousands of steel bridges that are at various levels of advanced
deterioration due to many years of service and exposure to the environment (Liu, Silva, & Nanni,
2001). Rehabilitation can involve various strategies and application methods. These strategies
include adding steel plates to the girders in order to increase the girder capacity, adding new
girders between the old ones (McRae & Ramey, 2003), or replacing the whole bridge
superstructure. Moreover, load ratings decrease as bridges deteriorate, which affects truck
routing and loading limits and in turn affects freight costs dramatically. CFRP materials have
been predominantly used by the aerospace industry, where cost is generally a secondary
consideration to weight (Jones R. , 1998). Carbon fibers were first used in civil applications at
Swiss Federal Testing Laboratories (Burgoyne, 1999).
The bridge collapse in Minnesota in 2007 was a wakeup call for bridge engineers and
departments of transportation. Current bridge inspection is mainly visual and lacks in-depth
inspection, such as strain and stress evaluation of different structural elements.
Besides the rehabilitation method using carbon fiber reinforced polymers (CFRP) laminates
discussed in the report, modeling techniques using FE to verify the usefulness of the method are
also presented.
1.2 Problem Statement
Corroded steel bridge girders cause the severe reduction of cross section, hence the inertia of the
cross section needed to sustain truck loads. Moreover, the increased demand on goods and gas
prices lead some truck companies to drastically increase truck loads beyond the legal weight
limits designated for bridges. This causes a significant increase in both live load stresses in the
short term and the fatigue stress range over the long term. Drops in section inertia also cause
increases in live load deflections. According to the American Association of State Highway and
Transportation Officials (AASHTO), limits are set for live load stresses, fatigue stresses, and
deflections. Exceeding these limits leads to the non-adequacy of bridges in the short or long
term. Traditional repair solutions include adding steel plates or adding external prestressed
tendons at the steel girders.
The proposed rehabilitation and strengthening methodology for steel girder bridges is to install
CFRP plates to the bottom flange of the girders.

2
The hypothesis of this research is that CFRP laminates are significantly effective strengthening
and rehabilitating technique for steel girder bridges. CFRP laminates added to the tension flange
of steel girders will enhance their flexural capacity.
1.3 Research Objectives
The objective of this research is to quantify the load improvement using novel CFRP
configurations and develop design guidelines for using CFRP laminates to strengthen steel
bridge girders.
1.4 Methodology and Approach
In order to achieve the outlined objectives, a detailed plan was developed. Five steel beam
specimens having CFRP laminate configuration variations were tested. Bending testing was
conducted on the simply supported beams via four-point loading. Nonlinear finite element
analysis software, ABAQUS (Abaqus Analysis User Manual, 2007), was used to verify the
experimental results. The report describes the tasks performed and the design process of steel
beam strengthened using CFRP. Discussion of the FE models built to simulate the experimental
beams is also presented. Evaluation of the rehabilitation technique is performed utilizing FE
models.
The list of tasks accomplished is as follows:
Experimental plan for the steel beams: this task was mainly focused on the
preliminary design of steel beams to choose a suitable beam for laboratory
experimentation given certain restrictions of the laboratory testing frame and
equipment, such as length, depth, weight, and load capacity.
Excel design spreadsheet utilizing Visual Basic programming: an Excel
spreadsheet that incorporated Visual Basic programming was developed to predict
the failure load of various experimental beams. The experimental beam was
chosen using this spreadsheet.
Steel beam purchase / fabrication: steel beams were fabricated and purchased
from Garrison Steel Company. The bottom flange of the steel beams was sand
blasted for proper attachment of the CFRP plate. Steel specimens for the tension
tests were also provided.
Experimental setup and testing: tension testing was performed on steel and CFRP
specimens. Test setup for the beams involved the attachment of the CFRP
laminates to the steel flange. The beam was equipped with strain gages at various
locations, and a load cell and LVDT were placed at the midspan of the beam. All
instruments were then connected to the data acquisition system, and testing
followed. Analysis of experimental results: this task included graphing load
deflection, load strain, and strain variation along the depth of the beam for all
tested beams. Comparison of the results was performed.

3
Parametric study using finite element (FE) analysis: a parametric study was
conducted to test several parameters, such as CFRP laminate length, thickness,
configuration, and material properties, and the steel beam section. ABAQUS was
the software package used for the FE modeling, which involved special bonding
elements, contact surfaces, constraints, and material properties.
Analysis of parametric study results: load-deflection graphs were plotted to
compare the effect of various parameters. A tabular form was then utilized to
calculate elastic and plastic percentage gains.
Performing structural evaluation of bridges strengthened using CFRP: FE models
were developed using SAP2000 software.
Developing design guidelines for rehabilitating bridges using CFRP laminates.
1.5 Scope of Study
The scope of this research is limited to the strengthening of steel beams in flexure only. No shear
strengthening is included. Steel beams for the experimental work were chosen to have enough
shear-carrying capacity throughout the loading process. The main focus was to increase the load
carrying capacity of the beams using CFRP plates’ configurations. Only laboratory strengthening
was performed.
1.6 Organization of the Report
This report consists of seven chapters. Chapter 1, Introduction, discusses the research problem
background. It also presents the objective of the research work performed and the methodology
utilized to approach the objectives. Chapter 1 concludes with the report organization, a brief
summary of the rest of the chapters.
Chapter 2, Literature Review, reviews the previous research conducted on rehabilitating bridges.
A historical background is presented on the evolution of rehabilitation methods and when FRP,
specifically CFRP, came into use in bridge rehabilitations.
Chapter 3, The Experimental Program; is concerned with the experimental work performed
during the course of this study, starting with the tension tests performed on steel and CFRP
specimens to obtain stiffness and strength properties. The bulk of the experimental work was
performed on five steel W200 x 19.3 (W8 x 13) beams topped by a steel plate that replaced the
reinforced concrete deck. The chapter describes the steps executed in order to perform the tests.
A summary of the results concludes this chapter.
Chapter 4, Verification of FE Model, mainly describes the FE model built to simulate the steel
beams tested experimentally in Chapter 3. Results from the verification models and the
experimental results are compared in this chapter.
Chapter 5, Parametric Study, utilizes the FE model built in Chapter 4 to perform an extensive
parametric study to evaluate the sensitivity of each parameter of the CFRP rehabilitation process.

4
Around a hundred models have been developed and executed using the ABAQUS FE program.
Parameters investigated were CFRP laminate length, thickness, and configuration, and loading,
and the steel beam section. Results are presented in the form of load deflection graphs and tables
showing the strength gain in both the elastic and plastic load range. An Excel spreadsheet
utilizing Visual Basic programming was developed for the design of steel beams strengthened
with CFRP laminates. The Visual Basic modules were embedded in the spreadsheet and used as
built-in functions to calculate the elastic and plastic neutral axis location, the plastic moment
capacity, and the beam’s deflection.
In chapter 6, Bridge Design: Rehabilitation Guidelines, two main topics are discussed: first,
simulation work of a typical composite steel concrete bridge; second to evaluate the
strengthening of steel girder bridges using CFRP plates through solved AASHTO bridge
examples. This includes the gain in strength, section modulus, and stiffness of the bridge girders.
The reduction of the deflections and the fatigue stress ranges are also discussed. Design
guidelines for rehabilitating steel bridges using CFRP are introduced at the end of the chapter.
Chapter 7, Conclusions, presents conclusions regarding the effectiveness of CFRP laminates in
the rehabilitation of steel bridge girders. Recommendations for future work are also presented.
1.7 Study Contribution and Innovation
This research conducts both experimental and analytical testing on various novel CFRP laminate
configurations used in the rehabilitation and strengthening of steel bridge girders. The tested
CFRP configurations presented here were not presented previously in any of the research.
5
Section 2
2.0 Literature Review
2.1 Introduction
Many state and local agencies are faced with deteriorating bridge infrastructure composed of
relatively short to medium-span bridges. In many cases, these older structures are hot-rolled or
welded longitudinal steel stringers acting compositely with a reinforced concrete deck (Wipf T.
J., Phares, Klaiber, & Lee, 2003). Bridge deterioration rates, durability and longevity
performance have been discussed thoroughly during the last few decades. A factor that receives
too little consideration in bridge work is durability (Ramey & Wright, 1997). This leads to the
huge number of structurally deficient and functionally obsolete bridges all over the United
States.
2.2 Common Rehabilitation Field Applications
Conventional rehabilitation, such as welding steel plates to structural members has been the
traditional method for a long time but induces high thermal stresses in the steel members. The
induced stress reduces the member fatigue resistance. A rehabilitation design using conventional
methods is discussed by Farhey (Farhey, et al., 2000), as applied to an existing historic bridge
crossing Sandusky River in Fremont, Ohio. Although the conventional restoration methods are
still applicable and preferred in some structural elements, such as the gusset plates, the CFRP
method is on the rise as a rehabilitation technique to be used with bridge elements, such as main
girders.
When total replacement is not an option and traditional retrofit methods are uneconomical and
time consuming, an alternative retrofit method using CFRP composite material provide engineers
with an effective solution that can increase the life cycle of these bridges. Research recently
conducted on the use of CFRP for strengthening and repair of steel beams has been investigated
(Mertz & Gillespie, 1996), (Tavakkolizadeh & Saadatmanesh, 2003) and (Al-Saidy, Klaiber, &
Wipf, 2004). A number of different approaches have been studied to assess the effectiveness of
various CFRP materials for the strengthening and repair of steel bridges, including the repair of
overloaded girders (Sen, Libby, & Mullins, 2001).
A proposed solution to strengthen the damaged reinforced concrete headstock of the Tenthill
Creeks Bridge, Queensland, Australia, using FRP composites was presented by Nezamian
(Nezamian & Setunge, 2007). A decision was made to consider strengthening the headstock
using bonded carbon FRP laminates to increase the load-carrying capacity of the headstock in
shear and bending.

6
A reliability analysis of reinforced concrete bridge girders strengthened by CFRP laminates was
developed by Okeil (Okeil, El-Tawil, & Shahawy, 2002). A resistance model is used to calculate
the probability of failure and the reliability index of CFRP-strengthened cross sections. The
reliability method is employed to calibrate the flexural resistance factor for a broad range of
design variables. The study shows that the addition of CFRP improves reliability somewhat
because the strength of CFRP laminates has a lower coefficient of variation than steel or
concrete.
The rehabilitation of an existing concrete bridge in Alabama through external bonding of FRP
plates to the bridge girders was performed by Stallings (Stallings, Tedesco, El-Mihilmy, &
McCauley, 2000). Field load tests were conducted before and after application of the FRP plates
to evaluate the advance in structural response.
2.3 Guidelines of Using FRP Reinforcement in the United States
Design guidelines and testing protocols for FRP reinforcement are nationally defined for
concrete structures. The American Concrete Institute (ACI) presents a number of technical
reports for the design, construction, and repair of concrete structures using FRP reinforcement.
Recommendations for the design and construction of FRP reinforcement based knowledge
gained from worldwide research can be found in ACI 440.1R-03 (ACI Committee, 2003).
Flexure and shear design procedures, and FRP reinforcement detailing are presented in this
report. The report also includes material characteristics of commercially available FRP.
Although FRP design, construction, and rehabilitation guidelines are available for concrete
structures, similar guidelines are not available for steel structures.
2.4 Guidelines of Using FRP Reinforcement Worldwide
Limited literature was found for design guidelines of FRP worldwide. Deeks and Hao, (2004)
mention some design guidelines and safety factors. Based on BS 8110 (1997), the guidelines
identify critical areas to be assessed along the length of the beam. These are the areas of
maximum moment and the ends of the FRP. It is recommended that internal steel reinforcement
yield before failure from either concrete crushing or FRP rupture. BS 8110 (1997) also
recommends that the characteristic material properties be divided by appropriate partial safety
factors. The partial safety factors for concrete in flexure, γc, and steel reinforcement, γs, are 1.50
and 1.15, respectively. The partial safety factor for strength of FRP is equal to the type of fiber,
γmf, multiplied by the stage in the manufacturing route in which the FRP samples were taken for
testing, γmm, (e.g. in-situ or factory). CFRP, GFRP, and AFRP (C: carbon, G: glass, and A:
aramid) have γmf values of 1.40, 3.50, and 1.50, respectively, while γmm varies from 1.10 to 2.0.
The recommended partial safety factors for modulus of elasticity, γmE, are 1.10, 1.80, and 1.80,
for CFRP, GFRP, and AFRP, respectively. To avoid any possibility of brittle failure, the ultimate
moment capacity may be increased by 1.15.

7
2.5 FRP Types and Applications
Fiber reinforced plastic (FRP), also known as fiber reinforced polymer, is a composite material
consisting of a polymer matrix reinforced with fibers. Fibers are usually aramid, fiberglass, or
carbon, while the polymer is usually a vinylester, polyester thermosetting plastic, or epoxy.
Figure 2-1 shows a stress-strain comparison between steel and various FRPs. It shows that CFRP
have similar stiffness to steel, while AFRP and GFRP have lower stiffness compared to steel.
Both CFRP and AFRP have high strength compared to GFRP. Comparing the FRP modes of
failure against steel, it is clear that all FRP have a brittle failure mode, while steel has its well-
known ductile behavior.
Figure 2-1. Comparison of stress-strain behavior of steel and FRPs (QuakeWrap, 2008).
FRP composites have a history of extensive successful use in the aerospace, defense, marine, and
automotive sectors, particularly in corrosion resistant equipment. However, until recently they
were largely considered to be of limited value in civil infrastructure beyond use in facades,
aesthetic additions, and for architectural purposes. Nonetheless, over the past two decades these
materials have made a rapid transition from being subjects of academic research to being
increasingly considered for use in the renewal of civil infrastructure (Karbhari, 2005). FRP used
as jackets for bridge piers in seismic zones showed great impact for rehabilitation and
construction. FRP with reinforcement primarily in the hoop direction not only provides an
efficient means of confinement but also enables rapid fabrication of cost-effective and durable
jackets with little or no traffic disruption (Karbhari, 2005) and (Atadero, Lee, & Karbhari, 2005).
0
400
800
1200
0 0.005 0.01 0.015 0.02 0.025 0.03
Str
ess
(MP
a)
Strain (mm/mm)
Steel
CFRP
GFRP
AFRP
Steel
CFRP AFRP
GFRP

8
A new spun concrete pole reinforced with CFRP bars has proven to be of great importance,
where poles usually serve in severe salt water, resulting in the deterioration of conventional
concrete poles due to steel corrosion (Shalaby, 2007). Beyond their use in seismic retrofit, FRP
composites have found great applicability in the rehabilitation of bridge girders and decks
through their use as externally bonded reinforcements (Karbhari, 2005) and (Atadero, Lee, &
Karbhari, 2005).
The use of FRP as reinforcement for concrete bridge decks was extensively studied and proved
to be an effective, corrosion-resistant, flexible, and electromagnetic resistant (Boyd, 1997).
Furthermore, anchorage of concrete parapets on GFRP bridge decks was investigated
experimentally to develop an effective means of connecting glass fiber-reinforced polymer
bridge decks to conventional reinforced concrete parapets (Naito, 2005).
Application of GFRP to enhance the flexural capacity of composite steel girders using heavy-
duty adhesive systems is subject to ongoing research (El Damatty, Abushagur, & Youssef,
2005). The excellent performance of a W-shaped steel beam strengthened using GFRP sheets has
encouraged the research at hand to assess the applicability of this technique to composite steel
bridges.
A seismic retrofit design that was developed using CFRP composites was implemented in the
summers of 2000 and 2001 to improve the displacement ductility of the U.S. Interstate 80 Bridge
over State Street in Salt Lake City which is very close to the Wasatch fault. The seismic retrofit
included column jacketing, as well as wrapping of the bent cap and bent cap-column joints for
confinement, flexural, and shear strength increase (Pantelides, Cercone, & Policelli, 2004).
The study of composite (steel-CFRP) members were tested both experimentally and analytically
(Al-Emrani & Kliger, 2006) to find different types of fracture modes that could be examined by
testing composite elements with different combinations of CFRP-laminates and adhesives. The
tested composite elements displayed different behavior, and a large difference in strength and
ductility could be observed (Al-Emrani & Kliger, 2006).
Composite materials find extensive use in modern engineering applications due to their high
strength-to-weight ratio coupled with favorable mechanical and thermal properties
(Swaminathan, Pagano, & Ghosh, 2006). The main advantages of CFRP laminates are their light
weight and durability, which results in ease of handling and maintenance (Nozaka, Sheild, &
Hajjar, 2005). Moreover, FRP products are non-corrosive and light weight compared to
traditional steel members (Stoll, Saliba, & Laura, 2000). However, the ultimate strength gain and
elastic response depend heavily on the configuration of the CFRP laminates and the application
technique to the steel beam, which in turn depends on the epoxy used. The global mechanical
properties of the material are affected by local failures that include particle or fiber splitting,
interfacial debonding and matrix cracking. The occurrence of a failure mechanism depends on
such factors like matrix, particle and interface strength, and loading mode, as well as such
morphological parameters as fiber volume fraction, reinforcement size and shape, orientation,
and the spatial dispersion of the fibers in the matrix (Swaminathan, Pagano, & Ghosh, 2006).

9
2.5.1 AFRP
Aramid fiber reinforced plastic (AFRP) is a composite material made of plastic reinforced with
fine aramid fibers. Like any reinforced plastic, the composite material is commonly referred to
by its reinforcing fibers, aramid in this case. AFRP filaments are produced by extrusion of the
precursor through a spinnert. Extrusion imparts anisotropy (increased strength in the lengthwise
direction) to the filaments. The most popular matrix materials for manufacturing AFRP are
thermosets (polymers which do not melt when heated) such as epoxies, vinylester, and phenolics.
Aramid may protect carbon fibers and improve their properties. Hybrid fabric (Aramid + carbon
fibers) combines very high tensile strength with high impact and abrasion resistance.
Aramid fibers were originally developed as a replacement for steel in automotive tires. The
distinctive features of Aramid are high impact resistance and low density. The disadvantages of
Aramid are ability to absorb moisture, difficulties in cutting, and low compressive strength.
Aramid fibers possess the following properties:
High tensile strength (five times stronger per weight unite than steel);
High modulus of elasticity;
Very low elongation up to breaking point;
Low weight;
High chemical inertness;
Very low coefficient of thermal expansion;
High fracture toughness (impact resistance);
High cut resistance;
Textile processibility;
Flame resistance.
2.5.2 GFRP
Glass fiber reinforced plastic (GFRP) is a composite material made of plastic reinforced with
fine glass fibers. Like graphite-reinforced plastic, the composite material is commonly referred to
by the name of its reinforcing fibers (fiberglass). The plastic is thermosetting (polymer materials
that irreversibly cure form), most often polyester or vinylester, but other plastics, such as epoxy
are also used. The glass is mostly in the form of chopped strand mat (CSM), but woven fabrics
are also used. CSM is a form of reinforcement used in glass-reinforced plastics. It consists of
glass-fibers laid randomly across each other and held together by a binder.
An individual structural glass fiber is both stiff and strong in tension and compression, along its
longitudinal axis. Although one might intuitively imagine the fiber to be weak in compression, it
is actually only the long aspect ratio of the fiber which makes it seem so; i.e., because a typical
fiber is long and narrow, it buckles easily. On the other hand, the glass fiber is relatively unstiff
and weak in shear. In other words, the fiber is stiff and strong in the preferred direction, namely,
along its length. Therefore if a collection of fibers can be arranged permanently in the preferred
direction within a material, and if the fibers can be prevented from buckling in compression, then
the material will become preferentially strong in that direction. Furthermore, by laying multiple
10
layers of fiber on top of one another, with each layer oriented in various preferred directions, the
stiffness and strength properties of the overall material can be controlled in an efficient manner.
In the case of glass-reinforced plastic, it is the plastic matrix that permanently constrains the
structural glass fibers to directions chosen by the designer. With chopped strand mat, this
directionality is essentially an entire two-dimensional plane; with woven fabrics or unidirectional
layers, directionality of stiffness and strength can be more precisely controlled within the plane.
A glass-reinforced plastic component is typically of a thin "shell" construction, sometimes filled
on the inside with structural foam, as in the case of surfboards. The component may be of nearly
arbitrary shape, limited only by the complexity and tolerances of the mold used for
manufacturing the shell.
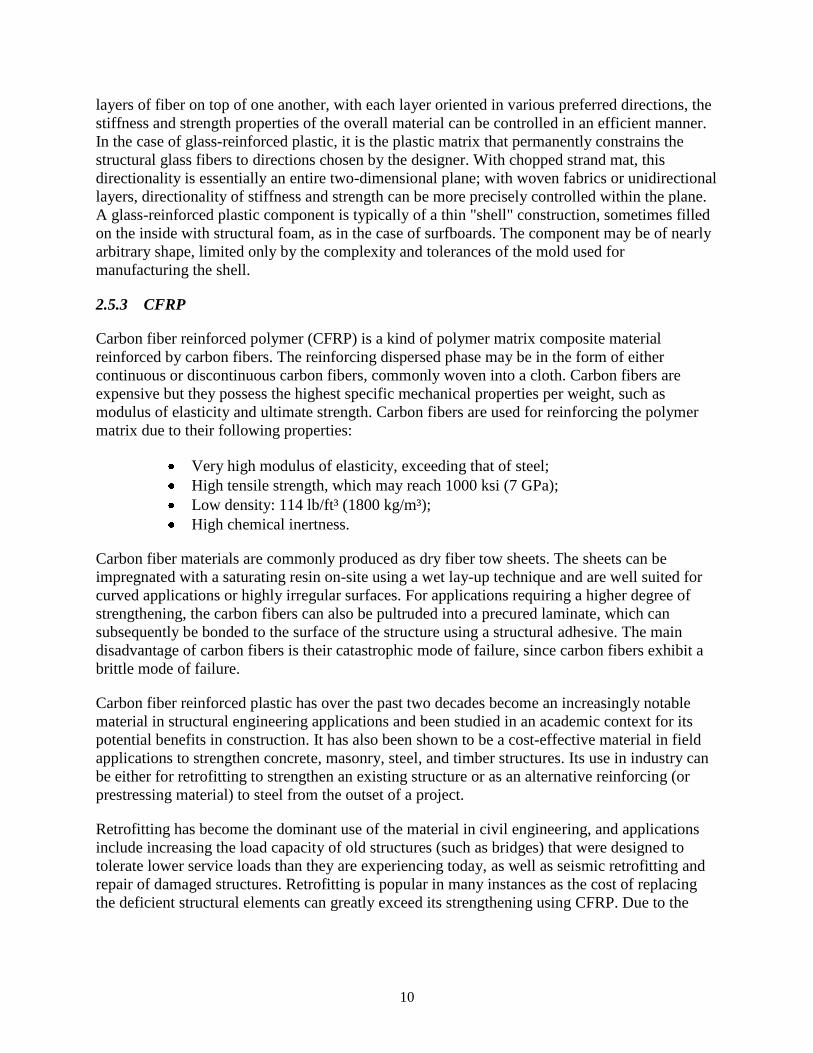
2.5.3 CFRP
Carbon fiber reinforced polymer (CFRP) is a kind of polymer matrix composite material
reinforced by carbon fibers. The reinforcing dispersed phase may be in the form of either
continuous or discontinuous carbon fibers, commonly woven into a cloth. Carbon fibers are
expensive but they possess the highest specific mechanical properties per weight, such as
modulus of elasticity and ultimate strength. Carbon fibers are used for reinforcing the polymer
matrix due to their following properties:
Very high modulus of elasticity, exceeding that of steel;
High tensile strength, which may reach 1000 ksi (7 GPa);
Low density: 114 lb/ft³ (1800 kg/m³);
High chemical inertness.
Carbon fiber materials are commonly produced as dry fiber tow sheets. The sheets can be
impregnated with a saturating resin on-site using a wet lay-up technique and are well suited for
curved applications or highly irregular surfaces. For applications requiring a higher degree of
strengthening, the carbon fibers can also be pultruded into a precured laminate, which can
subsequently be bonded to the surface of the structure using a structural adhesive. The main
disadvantage of carbon fibers is their catastrophic mode of failure, since carbon fibers exhibit a
brittle mode of failure.
Carbon fiber reinforced plastic has over the past two decades become an increasingly notable
material in structural engineering applications and been studied in an academic context for its
potential benefits in construction. It has also been shown to be a cost-effective material in field
applications to strengthen concrete, masonry, steel, and timber structures. Its use in industry can
be either for retrofitting to strengthen an existing structure or as an alternative reinforcing (or
prestressing material) to steel from the outset of a project.
Retrofitting has become the dominant use of the material in civil engineering, and applications
include increasing the load capacity of old structures (such as bridges) that were designed to
tolerate lower service loads than they are experiencing today, as well as seismic retrofitting and
repair of damaged structures. Retrofitting is popular in many instances as the cost of replacing
the deficient structural elements can greatly exceed its strengthening using CFRP. Due to the
11
high stiffness of CFRP, it can be used underneath bridge spans to help prevent excessive
deflections or wrapped around beams to limit shear stresses.
When used as a replacement for reinforcing steel, CFRP bars are also used to reinforce concrete
structures. More commonly they are used as prestressing tendons due to their high stiffness and
strength. The advantages of CFRP over steel as a prestressing material are its light weight and
corrosion resistance, enabling the material to be used in highly corrosive environments, such as
offshore structures.
CFRP is a more costly material than its counterparts GFRP and AFRP, though CFRP is generally
regarded as having superior properties. Much research continues to be done on using CFRP both
for retrofitting and as an alternative to steel as a reinforcing or prestressing material. Cost
remains an issue and long-term durability questions remain. Though design codes have been
drawn up by institutions such as the American Concrete Institute, there remains some hesitation
among the engineering community in regards to implementing these alternative materials. In part
this is due to a lack of standardization and the proprietary nature of the fiber and resin
combinations on the market, though this in itself is advantageous in that the material properties
can be tailored to the desired application requirements.
2.6 CFRP Structural Characteristics
The material properties of the CFRP laminates have been greatly improved over the last few
years, with a wide variety of dimensions and strengths required to achieve significant stiffness
increases. More recently, CFRP materials with a modulus of elasticity approximately twice that
of structural steel have become available. Several researchers have indicated that these materials
can be used to increase the strength and stiffness of steel-concrete composite beams.
Consideration of the CFRP plate end debonding as critical failure mode should be avoided to
prevent an undesirable failure of the system. Debonding strength of steel beams strengthened
with CFRP plates were discussed by Lenwari (Lenwari, Thepchatri, & Albrecht, 2006) and
Nozaka (Nozaka, Sheild, & Hajjar, 2005). Spliced connections were further discussed by other
researchers (Schnerch D. , 2005) and (Dawood, 2005).
2.7 CFRP in Steel Beam Applications
Several researches were performed on strengthening steel beams and steel girders using CFRP.
Due to the great development in CFRP material properties, and due to the development of
epoxies used, the gain in stiffness and strength in steel structures is still in the research phase.
Two main CFRP products are used by structural engineer researchers in strengthening steel
structures. These are CFRP laminates (plates) and CFRP tendons. CFRP laminates are available
in a wide variety of thicknesses, widths, and lengths. The coming sections will focus on both
CFRP products and review some of the research performed using these products.
Recent work was performed on the use of CFRP plates on steel girders (Phares, Wipf, Klaiber,
Abu-Hawash, & Lee, 2003). The bridge was 45.72 m x 9.14 m three-span continuous I-beam

12
girders. Furthermore, research by Al-Saidy (2001) showed the effectiveness of CFRP plates for
improving the strength of steel composite beams. Research that involved laboratory and field
study, in which CFRP plates were used to strengthen composite steel stringers, was performed
(Wipf T. , Phares, Klaiber, Al-Saidy, & Lee, 2005). The study showed a potential enhancement
in the bridge live load capacity through the addition of CFRP plates to the bottom flange.
Conclusions as to the performance and behavior of the strengthened bridge will be made as a
follow-up tests takes place.
2.8 CFRP Bond Behavior
Similar to the way stresses develop in reinforcement bars or plates, high concentrated stresses
develop at the reinforcement ends. Several details were investigated by Schnerch (2007) to help
reduce the bond stress concentration near the ends of the splice plate, including increasing the
length of the splice cover plate, implementing a reverse taper near the plate ends, and applying a
transverse CFRP wrap around the splice plate. It was found that increasing the length of the
splice plate beyond the maximum moment region did not significantly increase the total capacity
of the CFRP system but may be necessary to avoid sequential failure in unreinforced regions.
Similarly, the presence of the transverse CFRP wrap did not increase the ultimate capacity of the
spliced connection.
The debonding strength of partial-length adhesively bonded CFRP plates that are used to
strengthen steel beams was studied by Lenwari, Thepchatri, & Albrecht (2006). CFRP plates
only covered a partial length of the steel beams. Bonded CFRP plates tend to debond under static
and fatigue loadings because of the very high stress field at the plate ends. CFRP plate length
was also studied, and research concluded that the hybrid beams had two failure modes: plate
debonding in beams with short plates, and plate rupture at midspan in beams with long plates
(Lenwari, Thepchatri, & Albrecht, 2005).
2.9 Fatigue Behavior of Steel Beams Reinforced with CFRP
Repairing fatigue cracks in older structures especially, with bridges designed prior to the
AASHTO fatigue detailing provisions, is an ongoing problem. The use of CFRP has shown
significant promise in bridge rehabilitation and strengthening. In addition to all of the previously
mentioned advantages, CFRP has a very good resistance to fatigue in fiber-dominated materials
(Jones & Civjan, 2003). Researchers proved that composite laminates can extend the fatigue life
of aluminum specimens (Baker, 1997). An investigation of the use of prestressed CFRP to repair
fatigue cracks and prevent future cracks from propagating showed a good impact on structures
(Basseti, 2000). An experimental and analytical study was conducted to investigate the
effectiveness of applying CFRP overlays to steel fatigue tension coupons to prolong fatigue life
(Jones & Civjan, 2003). Specimens were either notched or center hole specimens and tested in
uniaxial tension. Variables studied were CFRP system, bond length, bond area, one and two
sided applications, and applications prior or subsequent to crack propagation. Two-sided
applications were very effective, prolonging fatigue life by as much as 115%. The method

13
therefore showed promise as both a preventive technique and repair method (Jones & Civjan,
2003).
2.10 Summary
Based on the literature review, concrete and steel structures reinforced with CFRP have proven
to have a satisfactory behavioral improvement, including enhancements in strength and ductility.
The literature review also pointed out the great significance of CFRP bonding. Even though there
are limited uses of CFRP plates to strengthen and rehabilitate structures, further research is
needed to provide confidence in the usefulness of the materials, as illustrated by this research.

14
Section 3
3.0 The Experimental Program
This chapter describes the various tests conducted in the laboratory to evaluate the CFRP
laminate strengthening system performance. Tension tests were performed to evaluate the tensile
strength properties of the steel and CFRP used. Scaled four-point loading tests were performed
on five steel beams to evaluate the flexural enhancement gained by strengthening the beams with
CFRP laminates.
3.1 Specimen Details
Five scaled steel beams were tested in the lab to investigate the effectiveness of using different
configurations of CFRP laminates to increase the strength and stiffness of steel highway bridge
girders. The details of the testing program are presented in Table 3-1. All of the beams had a
length of 4.3 m and were loaded monotonically to failure using a four-point bending
configuration separated equally. A schematic diagram of the cross-section of a typical test beam
and the corresponding strain gages location is shown in Figure 3-1.
Table 3-1. Test Matrix for the Large-Scale Steel-CFRP Composite Beam Tests
Beam Designation
CFRP Configuration CFRP Strip Length (mm)
CFRP Strip Width (mm)
Beam 1 (control beam)
None --- ---
Beam 2 One strip on lower face of bottom flange 3200 100
Beam 3 One bottom face of lower flange + one strip on upper face of bottom flange
3200 100 & 50
Beam 4 Two strips on lower face of bottom flange 3200 100 & 100
Beam 5 One strip on lower face of bottom flange 3200 50

15
Figure 3-1. Beam dimensions and strain gage locations.
The beam’s cross-section was chosen based on several factors and limitations. The first factor
was that the span-to-depth ratio had to be representative of a typical bridge girder. Due to
laboratory restrictions, the beam’s length was limited to a maximum of 4.5 m, which affected the
design of the beam’s depth. The CFRP laminate was designed accordingly. Furthermore, the
weight of the beam was restricted to the lightest possible section for ease of handling in the lab
using the mechanical crane. Through the development of an Excel spreadsheet, various W-
shaped steel beams were evaluated. The W200 x 19.3 (W8 x 13) steel beam proved to be the
most appropriate, based on the limitations and design criteria. Bridge decks are commonly
composed of steel girders attached by shear connectors to an overlaying concrete slab. In this
experimental setup, the concrete deck was replaced by a steel plate to avoid the results from
being influenced by varying concrete strength produced by different batches for each beam. This
would insure a controlled experiment with the CFRP laminates being the only variable. The steel
plate was designed to have the neutral axis at the top flange of the steel beam, therefore causing
the beam to be mainly in tension and the plate in compression. The steel plate’s width provided
the beam with sufficient lateral support to avoid any lateral torsional buckling. A top plate with
cross-sectional dimensions of 305 mm by 13 mm was welded to the I-beam (Figure 3-1). The
arc-weld strength used was 483 MPa, with a size of 9.5 mm (3/8 in) and length 76 mm (3.0 in) at
152 mm separation center-to-center (6.0 in). Steel beams were purchased from Garrison Steel, a
steel manufacturing company in Pell City, Alabama. Figure 3-2 shows the steel beam and steel
plate before welding in the manufacturing yard of Garrison steel. Figure 3-3 shows the spot
welding size being requested from the technician and measurement mark-ups on the beam. The
automatic arc-welding machine used to weld the steel beam to the plate is shown in Figure 3-4,
and the welding process is shown in Figure 3-5. Beams were then transported to the UAB
structural laboratory.
216mm
100 mm
PL 305 mm x 13 mm
W200 x 19.3
Strain Gage Locations

16
Figure 3-2. Steel beam and steel plate centered before welding.
Figure 3-3. Weld size and spacing dictated.

17
Figure 3-4. Automatic welding machine used.
Figure 3-5. Steel beam and steel plate during the welding process.
18
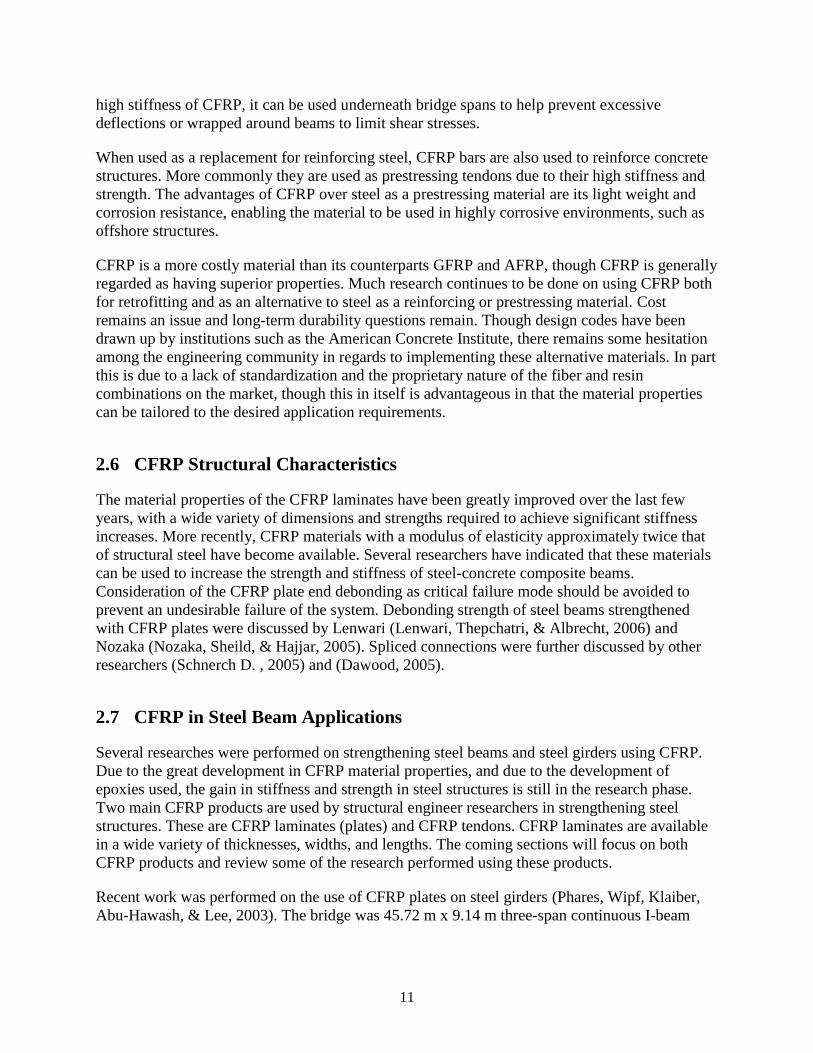
Several CFRP configurations were tested, all having CFRP strips covering 75% of the beam’s
span. Figure 3-6 (a, b, c, & d) shows the different CFRP configurations for the four strengthened
beams, Beams 2 through 5. Beam 1 is the unstrengthened beam, which is considered the control
beam.
CFRP configurations varied from covering the whole flange width as in Beam 2, to covering
both the top and bottom faces of the flange, as in Beam 3, adding two CFRP layers to the bottom
face of the bottom flange, as in Beam 4, or covering the bottom face of the bottom flange
partially, which is the case with Beam 5. The CFRP configurations tested are the novelty of this
research work. Adding CFRP to both faces of the bottom flange was first tested in this research.
Throughout the literature review, no CFRP configurations were discussed.
Figure 3-6. Different CFRP configurations.
CFRP strips for this experimental work were obtained from FYFE Company, the manufacturer
of Tyfo®
UC Composite Laminate Strip System. The laminate was compromised of a high
modulus, high tensile strength, pull-formed advanced composite. Epoxy used in the
experimentation was Tyfo®
MB high performance-adhesive. The epoxy is a two-component
acrylic adhesive, which bonds a wide variety of metals and fiber-reinforced polymers. It provides
high peel and impact strengths even in low temperature environments and has an average of 20
to 30 minutes pot life at room temperature. The laminate strip system comes with a fiber wrap
that is mainly placed to act as an insulator between the CFRP and steel to prevent the galvanic
action that may cause quick steel corrosion. The CFRP, fiber wrap, and epoxy used are shown in
Figure 3-7.
d) Beam 5 c) Beam 4 b) Beam 3 a) Beam 2

19
Figure 3-7. (a) CFRP & fiber wraps, (b) Epoxy and gun applicator.
The beam preparation process included surface preparation, installing CFRP laminates and strain
gages, positioning the beam on the testing frame, and placing the LVDT (Linear Variable
Differential Transformer) at the midpoint. All of the measurement devices were then connected
to the data acquisition system. To install the CFRP strips, the bottom flange’s surface had to be
prepared by abrasive methods, typically light sandblasting and grinding (Figure 3-8). Fine
abrasion of the surface was performed using sandpaper grades ranging from 100 to 400. The
CFRP laminates and the fiber wraps were then cut to the required lengths. Figure 3-7 (a) shows
the CFRP and fiber wraps cut down to the required lengths. The epoxy was spread on the surface
using the gun applicator shown in Figure 3-7 (b). The installation sequence was started by
turning over the steel beam, spreading the epoxy on the steel beam’s flange (Figure 3-9), placing
the fiber wrap onto the epoxy, and finally installing the CFRP plate (Figure 3-10). To ensure
proper bonding between the laminate and the steel beam, a uniform pressure was applied by steel
clamps through 25 mm x 100 mm pieces of wood (Figure 3-11). A minimum of eight pressure
points was used over the length of the CFRP to ensure equal distribution of pressure. Complete
curing was achieved within one week. Figure 3-12 shows a typical beam ready for testing.
Fiber Wrap
(b)
(a)
CFRP Strip

20
Figure 3-8. Roughening the surface of CFRP.
Figure 3-9. Adding Epoxy and spreading it on the prepared surface.
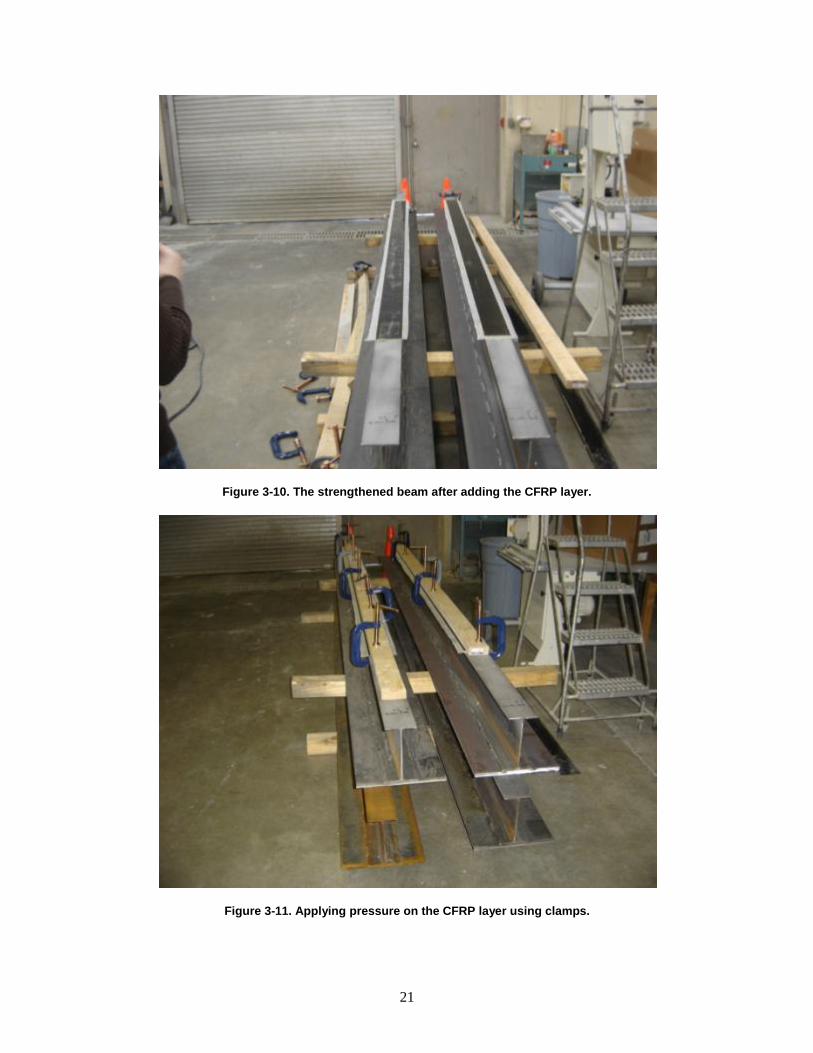
21
Figure 3-10. The strengthened beam after adding the CFRP layer.
Figure 3-11. Applying pressure on the CFRP layer using clamps.

22
Figure 3-12. Experimental setup of steel beam strengthened by CFRP.
3.2 Instrumentation
Several outputs were required for the experiment. First, load readings were required; a load cell
was installed to read them. Second, strain values were required at various points, and strain gages
were used. Third, displacement at various points was required. Instrumentation for this consisted
of two LVDTs.
3.2.1 Strain Gages
Strain gages used in the project were purchased from Vishay®
Micro-Measurements. Strain
gages had a resistance of 350.0 ± 0.3% ohms, which are adequate for measuring strain for steel
and CFRP. The high-resistance gage is preferable in that it reduces the heat generation rate by a
factor of three for the same applied voltage across the gage.
Because the strain gage is an extremely sensitive device capable of registering the smallest
effects of an imperfect bond, considerable attention to detail must be taken to assure stable,
creep-free installations. Strain gages were installed using M-Bond 200 adhesive. Strain gage
application consists of several steps: surface preparation, strain gage bonding, and attaching the
gages to the data acquisition system (Figure 3-13).
LVDT at midspan
CFRP Strip
Hinged Support
Strain Gages
Load Cell
Roller Support

23
Figure 3-13. Installation of strain gages.
3.2.2 Load Cell and LVDT Sensor
A load cell is an electronic device used to measure forces. It converts the applied forces to an
electrical signal that is captured by the data acquisition system. The load cell in this experimental
setup was used to measure the applied load on the beam.
The LVDT, a transformer used to measure linear displacements, was used in this experimental
program. Two LVDTs were used to measure vertical displacement at the midspan and the third
point. Data recorded by the load cell and the LVDT at the midspan was used to develop the load
deflection diagrams for the beams.
3.2.3 Data Acquisition System
The data acquisition system used was a VISHAY model 5100B. The most important
specification for this model is that it scans and digitizes 20 channels of input within 1 ms. This
data acquisition model also provided stable, high-accuracy data for fast static performance. The
maximum number of channels needed in any of the performed experiments was 19 channels (16
strain gages, 2 LVDTs, and a load cell). Wiring strain gages to the data acquisition system is
shown in Figure 3-14.
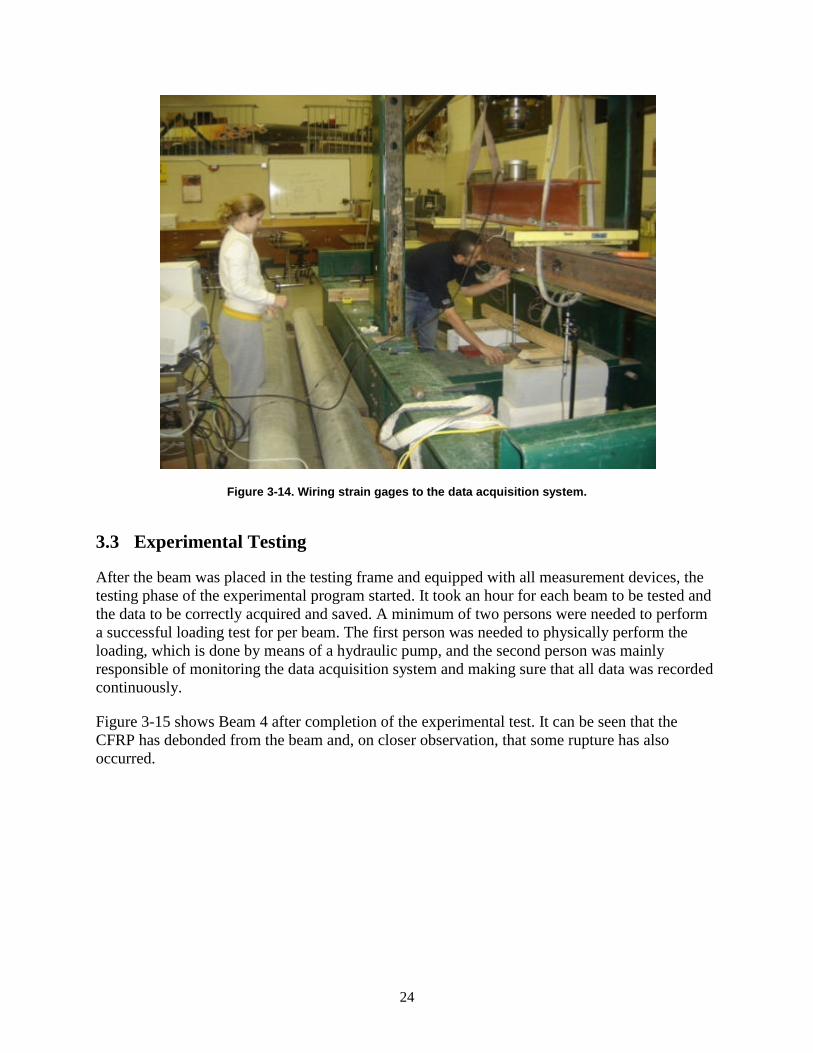
24
Figure 3-14. Wiring strain gages to the data acquisition system.
3.3 Experimental Testing
After the beam was placed in the testing frame and equipped with all measurement devices, the
testing phase of the experimental program started. It took an hour for each beam to be tested and
the data to be correctly acquired and saved. A minimum of two persons were needed to perform
a successful loading test for per beam. The first person was needed to physically perform the
loading, which is done by means of a hydraulic pump, and the second person was mainly
responsible of monitoring the data acquisition system and making sure that all data was recorded
continuously.
Figure 3-15 shows Beam 4 after completion of the experimental test. It can be seen that the
CFRP has debonded from the beam and, on closer observation, that some rupture has also
occurred.

25
Figure 3-15. A view of Beam 4 showing the deflection at the end of the experiment.
3.4 Results
Data collected from the experimental phase is displayed and summarized in this section of the
chapter. Data acquired were mainly strain readings at different locations on the beam,
displacement readings at the midspan and the third point, and load readings from the load cell.
Charts were constructed for the load–strain diagrams for each of the tested beams. Figure 3-16
shows the load strain curves for five strain gages attached at the midspan of Beam 1. Positive
strain represents tension, as opposed to negative strain representing compression. Strain gages
located at the extreme bottom fibers read the most tension strain, while the strain gages located at
the extreme top fibers read the maximum compression.
Figure 3-17 shows the load strain curves for five strain gages attached at the midspan of Beam 2.
The strain variation was similar to that of Beam 1, except for the debonding behavior, which is
observed at the two strain readings in the extreme tension zone, where a drop of strain readings
indicated the CFRP debonding point. Figure 3-18 shows the load strain curves for five strain
gages attached at the midspan of Beam 3. The strain variation is similar to that of Beam 2. Figure
3-19 and Figure 3-20 shows the load strain curves for five strain gages attached at the midspans
of Beam 4 and Beam 5, respectively. The strain variations are similar to those of Beam 2.
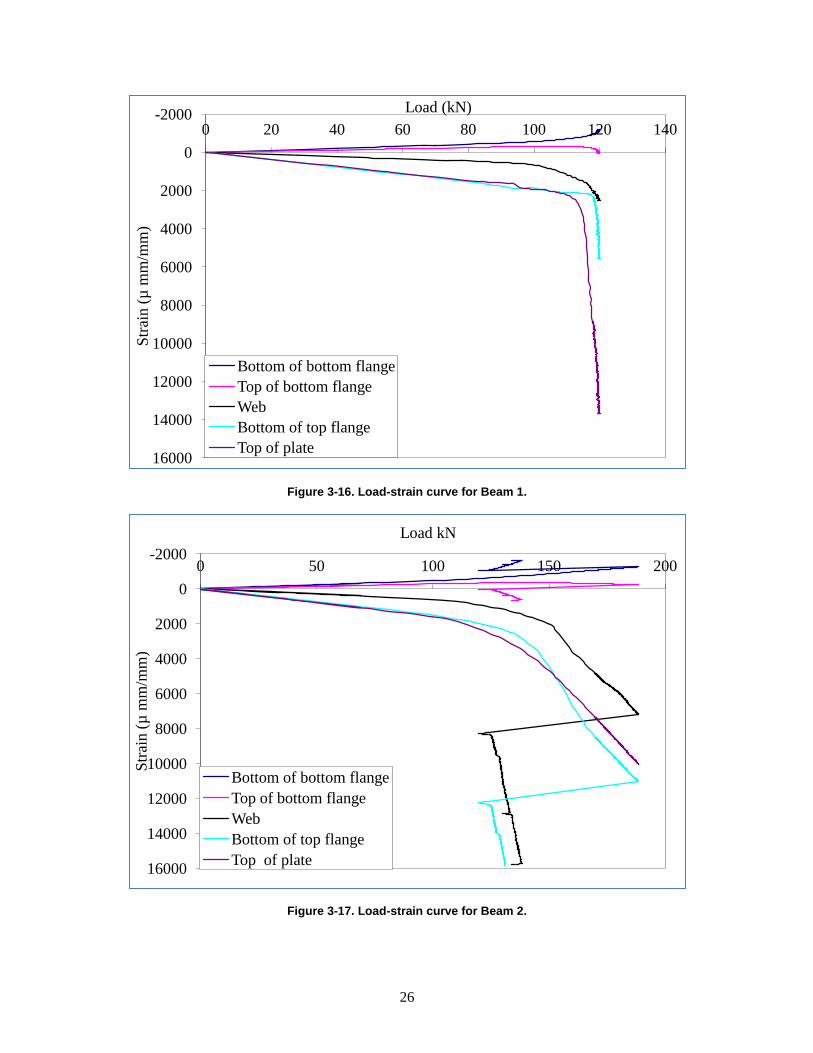
26
Figure 3-16. Load-strain curve for Beam 1.
Figure 3-17. Load-strain curve for Beam 2.
-2000
0
2000
4000
6000
8000
10000
12000
14000
16000
0 20 40 60 80 100 120 140S
trai
n (
µ m
m/m
m)
Load (kN)
Bottom of bottom flange
Top of bottom flange
Web
Bottom of top flange
Top of plate
-2000
0
2000
4000
6000
8000
10000
12000
14000
16000
0 50 100 150 200
Str
ain (
µ m
m/m
m)
Load kN
Bottom of bottom flange
Top of bottom flange
Web
Bottom of top flange
Top of plate

27
Figure 3-18. Load-strain curve for Beam 3.
Figure 3-19. Load-strain curve for Beam 4.
-2000
0
2000
4000
6000
8000
10000
12000
14000
16000
0 40 80 120 160 200S
trai
n (
µ m
m/m
m)
Load kN
Bottom of bottom flange
Top of Bottom Flange
Web
Bottom of top flange
Top of Plate
-2000
0
2000
4000
6000
8000
10000
12000
14000
16000
0 20 40 60 80 100 120 140 160 180
Str
ain (
µ m
m/m
m)
Load kN
Bottom of bottom flange
Top of bottom flange
Web
Bottom of top flange
Top of plate
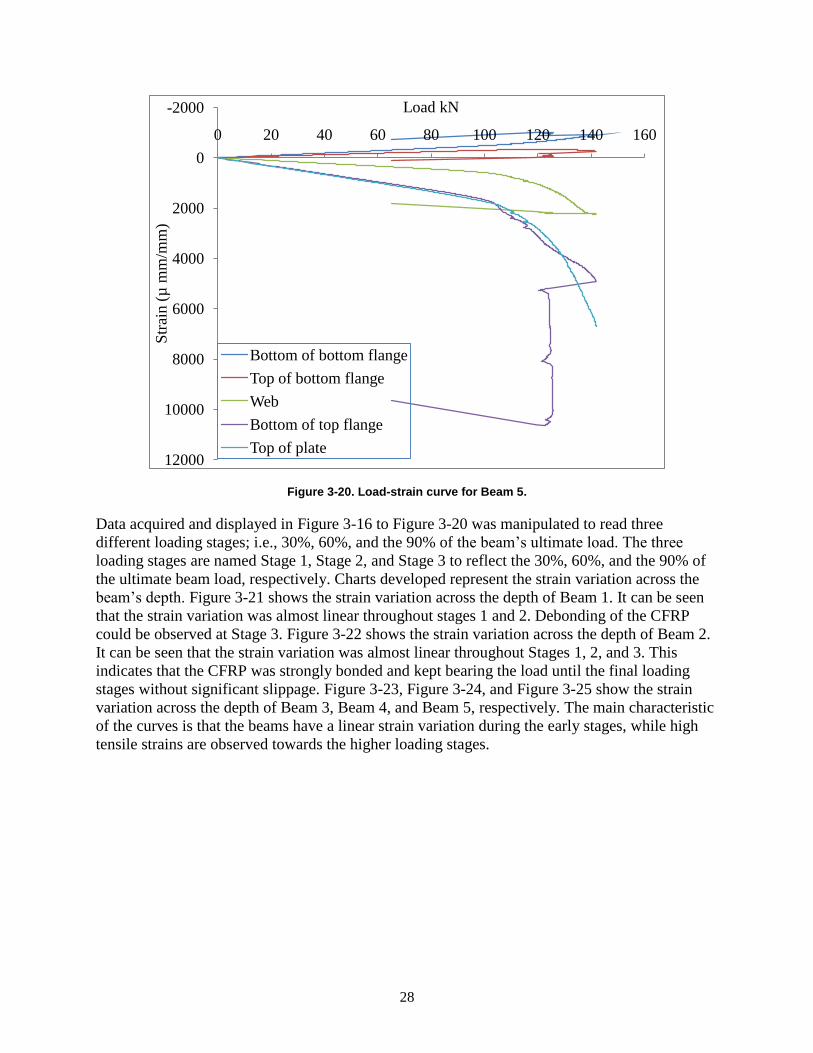
28
Figure 3-20. Load-strain curve for Beam 5.
Data acquired and displayed in Figure 3-16 to Figure 3-20 was manipulated to read three
different loading stages; i.e., 30%, 60%, and the 90% of the beam’s ultimate load. The three
loading stages are named Stage 1, Stage 2, and Stage 3 to reflect the 30%, 60%, and the 90% of
the ultimate beam load, respectively. Charts developed represent the strain variation across the
beam’s depth. Figure 3-21 shows the strain variation across the depth of Beam 1. It can be seen
that the strain variation was almost linear throughout stages 1 and 2. Debonding of the CFRP
could be observed at Stage 3. Figure 3-22 shows the strain variation across the depth of Beam 2.
It can be seen that the strain variation was almost linear throughout Stages 1, 2, and 3. This
indicates that the CFRP was strongly bonded and kept bearing the load until the final loading
stages without significant slippage. Figure 3-23, Figure 3-24, and Figure 3-25 show the strain
variation across the depth of Beam 3, Beam 4, and Beam 5, respectively. The main characteristic
of the curves is that the beams have a linear strain variation during the early stages, while high
tensile strains are observed towards the higher loading stages.
-2000
0
2000
4000
6000
8000
10000
12000
0 20 40 60 80 100 120 140 160
Str
ain (
µ m
m/m
m)
Load kN
Bottom of bottom flange
Top of bottom flange
Web
Bottom of top flange
Top of plate

29
Figure 3-21. Strain-depth curve for Beam 1.
Figure 3-22. Strain-depth curve for Beam 2.
0
50
100
150
200
-1000 -500 0 500 1000 1500 2000 2500 3000
Dep
th (
mm
)
Strain (µmm/mm)
Variation of Strain Distribution at Midspan Section
Stage 1
Stage 2
Stage 3
Bottom of
Bottom flange
Top of Plate
Web
0
50
100
150
200
-2000 0 2000 4000 6000 8000 10000 12000
Dep
th (
mm
)
Strain (µmm/mm)
Variation of Strain Distribution at Midspan Section
Stage 1
Stage 2
Stage 3
Bottom of
Bottom flange
Top of
Plate
Web

30
Figure 3-23. Strain-depth curve for Beam 3.
Figure 3-24. Strain-depth curve for Beam 4.
0
50
100
150
200
-2000 -1000 0 1000 2000 3000 4000 5000
Dep
th (
mm
)
Strain (µmm/mm)
Variation of Strain Distribution at Midspan Section
Stage 1
Stage 2
Stage 3
Bottom of
Bottom flange
Top of
Plate
Web
0
50
100
150
200
-2000 -1000 0 1000 2000 3000 4000 5000
Dep
th (
mm
)
Strain (µmm/mm)
Variation of Strain Distribution at Midspan Section
Stage 1
Stage 2
Stage 3
Bottom of
Bottom flange
Top of Plate
Web
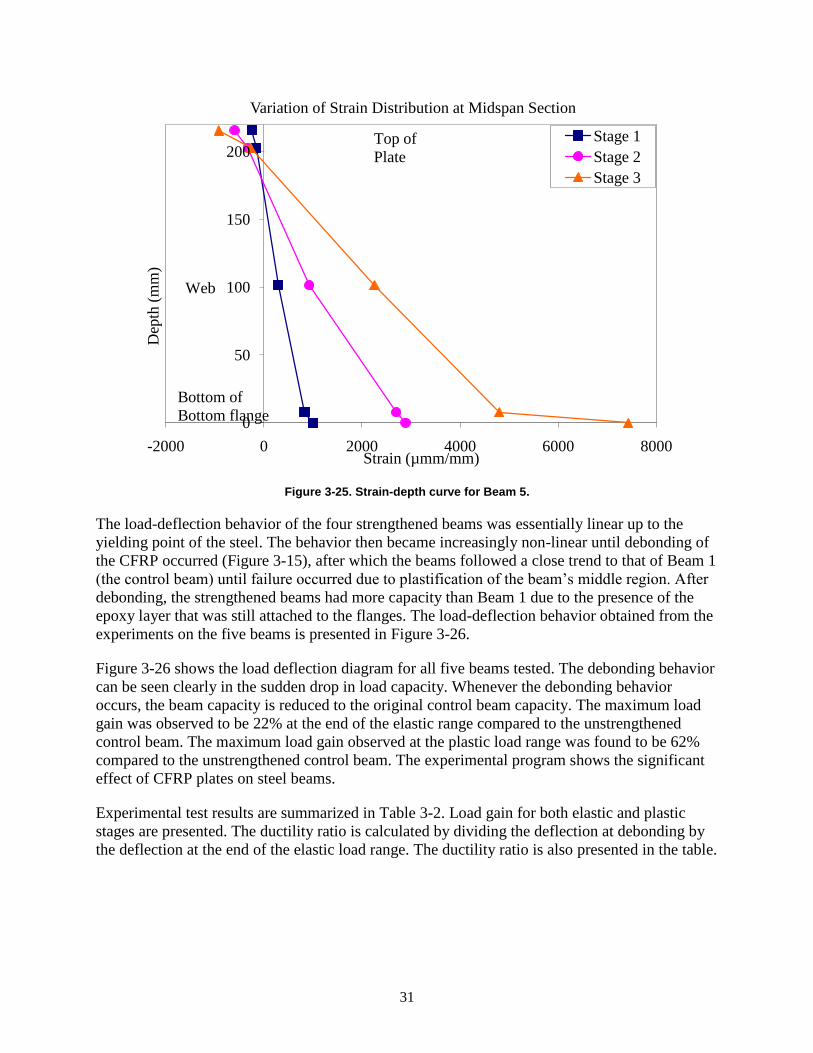
31
Figure 3-25. Strain-depth curve for Beam 5.
The load-deflection behavior of the four strengthened beams was essentially linear up to the
yielding point of the steel. The behavior then became increasingly non-linear until debonding of
the CFRP occurred (Figure 3-15), after which the beams followed a close trend to that of Beam 1
(the control beam) until failure occurred due to plastification of the beam’s middle region. After
debonding, the strengthened beams had more capacity than Beam 1 due to the presence of the
epoxy layer that was still attached to the flanges. The load-deflection behavior obtained from the
experiments on the five beams is presented in Figure 3-26.
Figure 3-26 shows the load deflection diagram for all five beams tested. The debonding behavior
can be seen clearly in the sudden drop in load capacity. Whenever the debonding behavior
occurs, the beam capacity is reduced to the original control beam capacity. The maximum load
gain was observed to be 22% at the end of the elastic range compared to the unstrengthened
control beam. The maximum load gain observed at the plastic load range was found to be 62%
compared to the unstrengthened control beam. The experimental program shows the significant
effect of CFRP plates on steel beams.
Experimental test results are summarized in Table 3-2. Load gain for both elastic and plastic
stages are presented. The ductility ratio is calculated by dividing the deflection at debonding by
the deflection at the end of the elastic load range. The ductility ratio is also presented in the table.
0
50
100
150
200
-2000 0 2000 4000 6000 8000
Dep
th (
mm
)
Strain (µmm/mm)
Variation of Strain Distribution at Midspan Section
Stage 1
Stage 2
Stage 3
Bottom of
Bottom flange
Top of
Plate
Web

32
Table 3-2. Experimental Beam Results
Beam # Ductility ratio
Deflection Load Deflection Load Elastic Plastic
(mm) (kN) (mm) (kN)
Beam 1 27 103 0 119 0.0
Beam 2 27 116 97 193 3.6 13% 62%
Beam 3 27 124 60 187 2.2 20% 57%
Beam 4 27 126 54 177 2.0 22% 48%
Beam 5 27 109 62 145 2.3 6% 22%
P60055B4T 27 116 97 189 3.6 13% 58%
P60055TBT 27 124 51 168 1.9 20% 41%
P60055BBT 27 124 54 177 2.0 20% 48%
P60055B2T 27 109 62 145 2.3 6% 22%
P90055B4T 27 116 97 189 3.6 13% 58%
P90055TBT 27 124 60 187 2.2 20% 57%
P90055BBT 27 124 53 177 2.0 20% 48%
P90055B2T 27 109 62 145 2.3 6% 22%
P75080B4T 27 120 104 219 3.9 17% 84%
P75080TBT 27 128 55 181 2.0 24% 52%
P75080BBT 27 128 60 204 2.2 24% 71%
P75080B2T 27 110 62 154 2.3 7% 29%
P60080B4T 27 120 117 217 4.3 17% 82%
P60080TBT 27 128 59 180 2.2 24% 51%
P60080BBT 27 128 64 203 2.4 24% 71%
P60080B2T 27 110 66 157 2.4 7% 32%
P90080B4T 27 120 104 219 3.8 17% 84%
P90080TBT 27 128 59 203 2.2 24% 70%
P90080BBT 27 128 59 203 2.2 24% 70%
P90080B2T 27 110 64 155 2.4 7% 30%
P75105B4T 27 125 111 249 4.1 21% 109%
P75105TBT 27 136 44 177 1.6 32% 49%
P75105BBT 27 136 53 187 2.0 32% 57%
P75105B2T 27 117 68 169 2.5 14% 41%
P60105B4T 27 125 109 217 4.0 21% 82%
P60105TBT 27 136 54 182 2.0 32% 52%
P60105BBT 27 136 43 179 1.6 32% 50%
P60105B2T 27 117 69 168 2.5 14% 41%
P90105B4T 27 125 111 249 4.1 21% 109%
P90105TBT 27 136 56 210 2.1 32% 76%
P90105BBT 27 136 64 230 2.4 32% 93%
P90105B2T 27 117 68 169 2.5 14% 41%
P0000000U 27 30.70 0.00 37.10 0.00
Ultimate Load GainElastic
Figure 3-26. Experimental load-deflection curves for the five Beams.
Comparing the five experimental beams, the only variable was the CFRP configuration. Beam 3
and Beam 4 showed the highest stiffness among the beams tested. Beam 2 and Beam 3 showed
the highest beam strength. Beam 2 was the only beam showing significant deflection before
debonding. This configuration (CFRP on bottom face only) proved to be the best CFRP
configuration among all tested beams. This configuration is used throughout the design chapters
later in the report.
3.5 Material Properties of Steel and CFRP Plates
Tension tests were performed experimentally to obtain accurate material properties of the beams
used. Steel tension testing as well as CFRP tension testing was performed. Stress-strain curves
were used later as modeling input parameters.
0
20
40
60
80
100
120
140
160
180
200
0 40 80 120 160
Lo
ad (
KN
)
Deflection (mm)
Experimental - Beam 1
Experimental - Beam 2
Experimental - Beam 3
Experimental - Beam 4
Experimental - Beam 5
Debonding/Rupture
of CFRP
62%
22%

33
3.5.1 Steel Tension Testing
Several tension tests were performed on steel plate specimens to test for the stiffness and
strength of the steel used in the experimentation program. Steel specimen dimensions were 50
mm x 6.47 mm (2.0 in x 0.255 in) obtained from the same steel plates as the tested I-beams.
Similar steel specimens were obtained from the top plates having the dimensions of 50 mm x
12.7 mm (2.0 in x 0.50 in).
The steel plate specimens were mounted in the Tinius Olsen Universal Testing machine and
equipped with a strain gage in order to plot the stress-strain relationship (Figure 3-27). The
machine has a capacity of 272 kN (600 kips) and was connected to a data acquisition system,
where loads applied, crosshead movement, and loading rate are displayed and stored. Figure 3-28
shows the steel plate after testing where it is observed that the plate rupturing near the midpoint.
Figure 3-29 shows the steel stress-strain graph obtained from the tension tests. It is observed that
steel specimens tested from the steel beam had higher strength than that of the steel plate used on
top of the beam. These results were verified by more tension tests, where all specimens gave the
same values for both kinds of steel. Results obtained from this test were very useful in the
accurate development of the FE model developed and used later and discussed.
Figure 3-27. Steel specimen mounted for a tension test – strain gage installed.
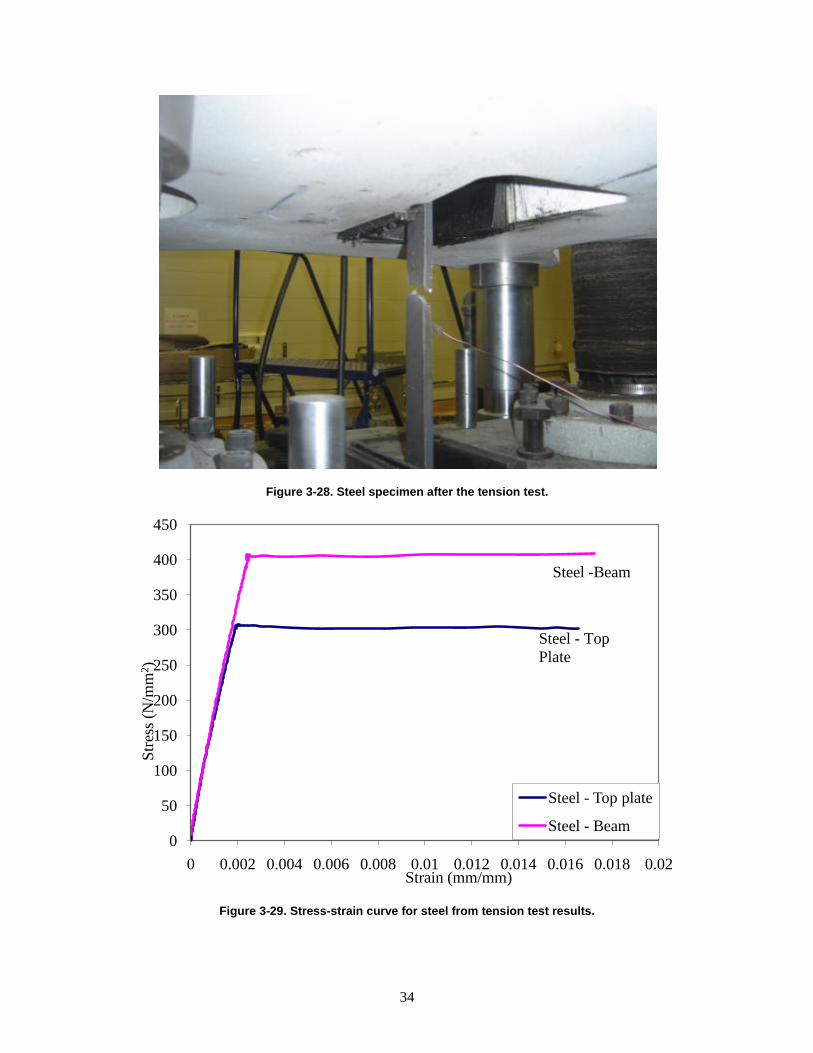
34
Figure 3-28. Steel specimen after the tension test.
Figure 3-29. Stress-strain curve for steel from tension test results.
0
50
100
150
200
250
300
350
400
450
0 0.002 0.004 0.006 0.008 0.01 0.012 0.014 0.016 0.018 0.02
Str
ess
(N/m
m2)
Strain (mm/mm)
Steel - Top plate
Steel - Beam
Steel -Beam
Steel - Top
Plate
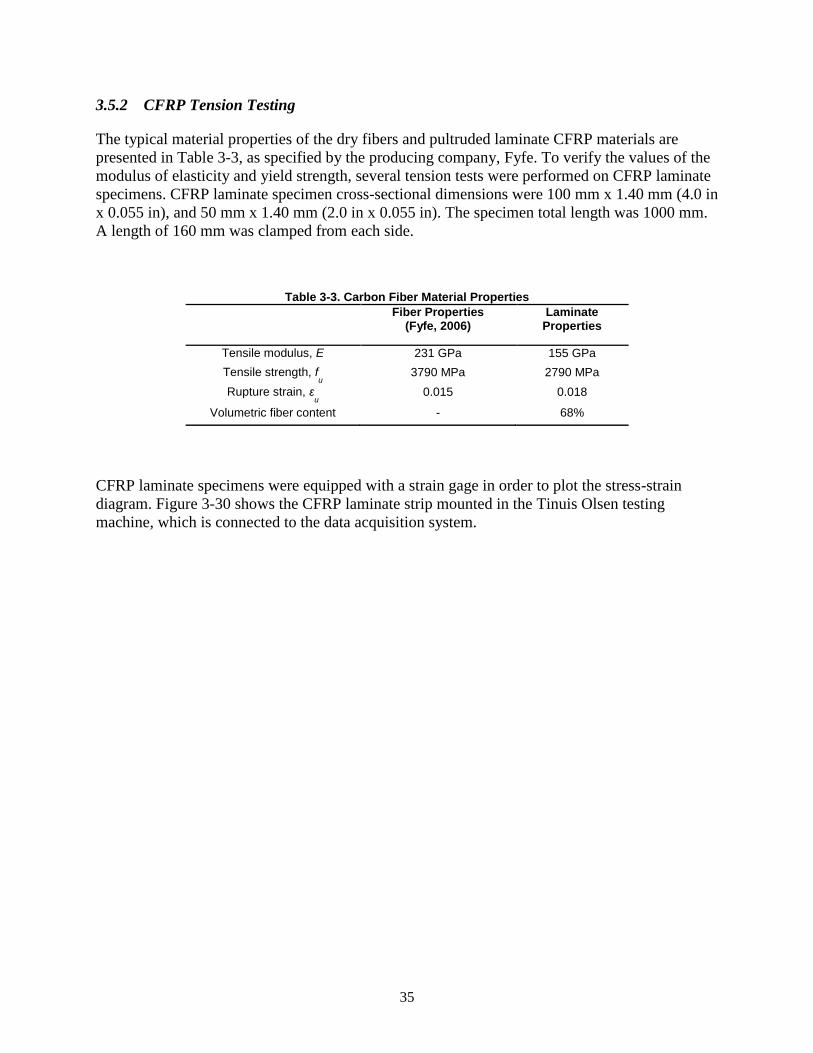
35
3.5.2 CFRP Tension Testing
The typical material properties of the dry fibers and pultruded laminate CFRP materials are
presented in Table 3-3, as specified by the producing company, Fyfe. To verify the values of the
modulus of elasticity and yield strength, several tension tests were performed on CFRP laminate
specimens. CFRP laminate specimen cross-sectional dimensions were 100 mm x 1.40 mm (4.0 in
x 0.055 in), and 50 mm x 1.40 mm (2.0 in x 0.055 in). The specimen total length was 1000 mm.
A length of 160 mm was clamped from each side.
Table 3-3. Carbon Fiber Material Properties
Fiber Properties (Fyfe, 2006)
Laminate Properties
Tensile modulus, E 231 GPa 155 GPa
Tensile strength, fu 3790 MPa 2790 MPa
Rupture strain, εu 0.015 0.018
Volumetric fiber content - 68%
CFRP laminate specimens were equipped with a strain gage in order to plot the stress-strain
diagram. Figure 3-30 shows the CFRP laminate strip mounted in the Tinuis Olsen testing
machine, which is connected to the data acquisition system.

36
Figure 3-30. Tension test setup: testing machine and data acquisition system.
CFRP has a brittle rupture failure mode. This was clear from the literature and the tension tests
performed. Figure 3-31 shows the first signs of rupture of the outer fibers of the CFRP laminate
specimen. As loading increased, more rupture occurred in the outer fibers (Figure 3-32), and
successive popping sounds were heard.
A minor problem with the experimental setup was that the testing machine grips had some effect
on the CFRP laminate specimen. The handles induced high stresses at the points of contact,
causing an early rupture of the CFRP plates at the grips rather than the middle of the specimen. It
was therefore concluded that the values obtained from the test results were to be used as a guide
only, and that one should use the manufacturer’s specifications for the analytical work. This
assumption proved to be accurate, as would be shown in FE modeling presented in the following
chapter. The stress strain curves of the CFRP laminates tested are shown in Figure 3-33, Figure
3-34, Figure 3-35, and Figure 3-36, where the average modulus of elasticity experimentally
obtained is 145 GPa, which is comparable to the specifications value of 155 GPa; however, the
ultimate stress observed was much less than the specifications due to the testing limitations
faced. CFRP tension test results are summarized in Table 3-4.
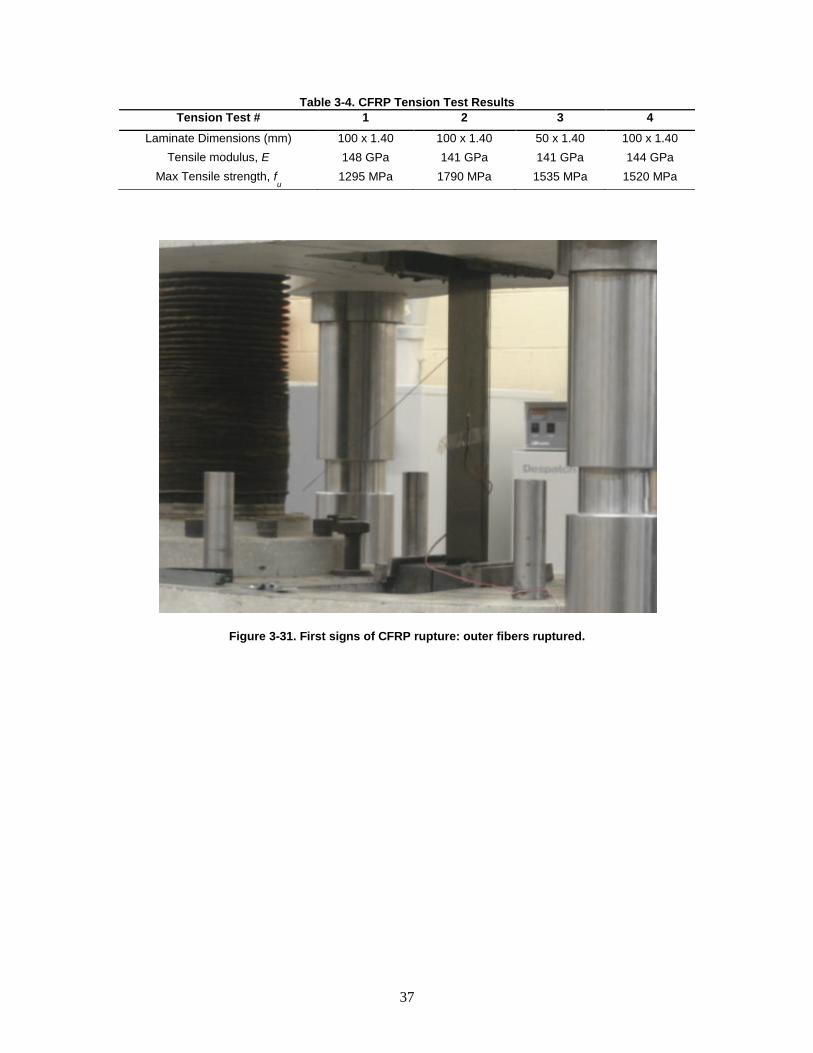
37
Table 3-4. CFRP Tension Test Results
Tension Test # 1 2 3 4
Laminate Dimensions (mm) 100 x 1.40 100 x 1.40 50 x 1.40 100 x 1.40
Tensile modulus, E 148 GPa 141 GPa 141 GPa 144 GPa
Max Tensile strength, fu 1295 MPa 1790 MPa 1535 MPa 1520 MPa
Figure 3-31. First signs of CFRP rupture: outer fibers ruptured.

38
Figure 3-32. Successive CFRP fiber rupture towards the specimen center.
Figure 3-33. Stress-strain curve for CFRP Tension Test 1 – 100 mm x 1.40 mm.
0
200
400
600
800
1000
1200
1400
0 0.002 0.004 0.006 0.008 0.01 0.012 0.014 0.016
Str
ess
(N/m
m2)
Strain (mm/mm)
CFRP

39
Figure 3-34. Stress-strain curve for CFRP Tension Test 2 – 100 mm x 1.40 mm.
Figure 3-35. Stress-strain curve for CFRP Tension Test 3 – 50 mm x 1.40 mm.
0
200
400
600
800
1000
1200
1400
1600
1800
2000
0 0.002 0.004 0.006 0.008 0.01 0.012 0.014 0.016
Str
ess
(N/m
m2)
Strain (mm/mm)
CFRP
0
200
400
600
800
1000
1200
1400
1600
0 0.002 0.004 0.006 0.008 0.01 0.012 0.014
Str
ess
(N/m
m2)
Strain (mm/mm)
CFRP

40
Figure 3-36. Stress-strain curve for CFRP Tension Test 4 – 100 mm x 1.40 mm.
The CFRP used in this study was not a high modulus CFRP but it was characterized by a
relatively high strength compared that from other CFRP manufacturers. Table 3-5 compares the
laminate properties of CFRP of similar thicknesses obtained from several manufacturers
including Fyfe, Mitsubishi, and Epsilon. It is observed that even though CFRP from Fyfe has
lower elasticity modulus as compared to Mitsubishi, the tensile strength of the Fyfe product is
significantly higher than its counterparts.
Table 3-5. Laminate Properties of CFRP from Several Manufacturers Comparison
(Fyfe, 2006) Mitsubishi Epsilon
Tensile modulus, E 155 GPa 229 GPa 460 GPa
Tensile strength, fu 2790 MPa 1220 MPa 1530 MPa
Volumetric fiber content 68% 55% 70%
Laminate thickness (mm) 1.40-2.00 3.20 2.90-4.00
3.6 Summary
The chapter presents the experiments performed during the course of this research, starting with
the tension tests performed on steel and CFRP specimens to obtain stiffness and strength
0
200
400
600
800
1000
1200
1400
1600
0 0.002 0.004 0.006 0.008 0.01 0.012 0.014
Str
ess
(N/m
m2)
Strain (mm/mm)
CFRP

41
properties. The bulk of the experimental work was performed on five steel W200 x 19.3 (W8 x
13) beams topped by a steel plate that replaced the reinforced concrete deck. The chapter
describes the steps executed in order to perform the tests. A summary of the results concludes
this chapter.
At all times, the engineer / designer must understand the importance of achieving a good bond
between the CFRP laminate and steel. To ensure a good bond, general CFRP installation steps
can be summarized as follows:
Prepare the steel surface using proper sand blasting techniques to obtain a white
clean steel surface;
Cut the CFRP and fiber fabric to the required lengths;
Prepare wooden pieces to be used in the clamping process;
Prepare enough C-clamps to use in the curing process;
Clean the steel surface with rubbing alcohol and leave the surface to dry
completely before proceeding to further steps;
Apply the epoxy using the gun applicator;
Distribute the epoxy using a trowel;
Apply the fiber fabric layer to the steel surface;
Add more epoxy as required;
Install the CFRP laminate;
Uniformly press on the CFRP laminate to ensure that the epoxy fills all of the
voids under the laminate. The use of a clean, smooth cloth is recommended;
Place the prepared wooden piece over the CFRP layer and use the clamps to apply
uniform pressure along the CFRP length;
Leave the CFRP to cure for at least 24 hours or as recommended by the epoxy
manufacturer.

42
Section 4
4.0 Verification of FE Model
The chapter mainly describes the FE model built to simulate the steel beams tested
experimentally in Chapter 3. Results from the verification models and the experimental results
are compared in this chapter. The FE models are then used to perform the parametric study in
Chapter 5.
4.1 Modeling Technique
A FE model was developed using the software package ABAQUS that was verified by the
experimental program. ABAQUS and ANSYS were both considered during the research study
by comparing both FE packages from the technical and GUI (graphical user interface) stand
points. The technical comparison turned out that ABAQUS is much more capable of modeling
fracture mechanics and contact problems through its enhanced solvers. The capabilities of
ANSYS in fracture mechanics and contact options were satisfactory. From the GUI stand point,
ABAQUS has a simple to use yet enhanced GUI, making it much more user friendly than the
user menus in ANSYS. The basic program structure of ABAQUS is much more logical than the
menu structure of ANSYS. The only advantage of ANSYS over ABAQUS is the number of
users, due to its lower pricing.
Debonding and rupture of the CFRP plates is a geometrically nonlinear static problem that
involves buckling or collapse behavior, where the load-displacement response represents a
negative stiffness and the structure must release strain energy to remain in equilibrium. Several
approaches are possible for modeling such behavior. One is to treat the buckling response
dynamically, thus actually modeling the response with inertia effects imposed as the structure
fails. Second, in some simple cases, a displacement control approach can provide a solution,
even when the conjugate load (the reaction force) decreases as the displacement increases. A
third approach would be to use dashpots to stabilize the structure during a static analysis. The
fourth approach is the implementation of the modified Riks method, which provides static
equilibrium during the unstable debonding phase of the response. This method is used for cases
where the loading is proportional; that is, where the load magnitudes are governed by a single
scalar parameter. The final fourth approach was the method used in this study.
4.2 Model Details
One begins modeling the experimental beams by defining the geometry. The beam together with
the top plate and the CFRP layers were defined as parts. Furthermore, an adhesive layer between
the CFRP plate and the lower surface of the steel beams’ bottom flange had to be defined. Each
part is first defined as a volume, which is then meshed into elements. The meshing size of each

43
part greatly depended in its relative size and the anticipated mode of failure. Element types and
material properties were then specified and assigned to each corresponding part. Special element
assignments were used for the CFRP laminate and adhesive layers, as will be demonstrated.
The meshing size for the steel parts was coarse due to the isotropic and ductile behavior of steel.
The coarse mesh of the steel parts helped reduce the computing time. The CFRP plate and the
adhesive layer had to be fine meshed to the anisotropic and brittle nature of the material, where a
fine mesh would accurately predict the failure criteria defined by the material behavior, namely
debonding and rupture. A coarse mesh for either the CFRP plate or the adhesive layer would
have resulted in an unstable model with a non-converging solution. Since parts were meshed
separately, no nodes were shared between adjacent parts. Therefore, contact surfaces had to be
defined to create the bonding effect between parts. Surface constraints were used to tie the steel
parts together (plate, top flange, web, and bottom flange) without any failure criteria defined,
since full composite action controlled the actual behavior of the steel parts. These surface
constraints made the meshing process simpler as opposed to attempting to fine mesh the parts to
share common nodes at the interface. Further discussion on surface constraints is presented in the
following section.
The loads were applied as unit loads at the third-point lengths of the beam, and a load
proportionately factor (LPF) was calculated during the analysis of the model until failure criteria
were reached. The nonlinear behavior of the steel and CFRP materials were defined in the model
by the complete stress strain curves. Figure 4-1 shows an isometric view of the three-
dimensional FE model developed, where each part was meshed separately. Surface constraints
were defined to connect these parts together, without having connecting nodes between the parts,
as previously discussed.
Figure 4-2 shows a full isometric view of the beam model. The applied loads can be seen at the
third-point beam length on top of two transverse rigid parts. The rigid parts would ensure a
uniform distribution of the concentrated line loads acting on the top plate, therefore avoiding
local stress concentrations due to a point load acting at one particular node. Furthermore, the
rigid part simulated the actual experimental setup discussed in Chapter 3.

44
Figure 4-1. An isotropic view of the three-dimensional FE model.
Defining the concentrated load applied over time using the Riks method is presented in Figure
4-3. The magnitude and direction of the force on each of the two rigid parts was 500 N vertically
downwards, which did add up to 1 kN, the unity loading for proper use of the Riks technique.
The output of the Riks loading was a loading proportionality factor (LPF) and was read later in
the output in kN. Figure 4-4 and Figure 4-5 present the boundary constraints defined for the
hinged and roller supports, respectively.

45
Figure 4-2. Isometric iiew of the beam model – loads shown.
Figure 4-3. Concentrated load definition.

46
Figure 4-4. Boundary conditions – Hinged support.
Figure 4-5. Boundary conditions – roller support.

47
4.3 Element Interaction Simulation and Special FE Models
Special FE models are discussed in this section to illustrate the steps taken to simulate correctly
the interaction behavior between the various components of the composite beams.
4.3.1 Cohesive Elements and Adhesive Material Modeling
ABAQUS offers a damage model enabling the prediction of the onset of rupture and the
modeling of damage evolution for elastic-brittle materials with anisotropic behavior, such as the
CFRP laminates. The model is primarily intended to be used with fiber-reinforced materials
since they typically exhibit such behavior. The damage model requires specification of the
following: the undamaged response of the material that must be linearly elastic, a damage
initiation criterion, and a damage evolution response where elements can be removed. Damage is
characterized by the degradation of material stiffness. It plays an important role in the analysis of
fiber-reinforced composite materials. Many such materials exhibit elastic-brittle behavior where
damage is initiated without significant plastic deformation. Consequently, plasticity can be
neglected when modeling the behavior of such materials. Four different modes of failure are
considered: (1) fiber rupture in tension, (2) fiber buckling and kinking in compression, (3) matrix
cracking under transverse tension and shearing, and (4) matrix crushing under transverse
compression and shearing. In ABAQUS the onset of damage is determined by the initiation
criteria proposed by Hashin (Hashin & Rotem, 1973); and (Hashin, 1980).
ABAQUS offers a library of cohesive elements to model the behavior of adhesive joints,
interfaces in composites, and other situations where the integrity and strength of interfaces may
be of interest. The cohesive element COH3D8 represented the epoxy used to bond the CFRP
laminate to the steel beam. Modeling of cohesive elements consisted of choosing the appropriate
element type, defining the initial geometry of the cohesive elements, and defining the mechanical
constitutive behavior of the cohesive elements. The constitutive response of these elements
depends on the specific application, namely continuum, gasket, and traction-separation. It is
based on certain assumptions that the deformation and stress states are appropriate for each
application area. For this model, traction-separation response was used to model the bond
interface between the CFRP laminate and the steel beam. The modeling of bonded interfaces in
composite materials often involves situations where the intermediate glue material is very thin
and, for all practical purposes, may be considered to be of zero thickness. In three-dimensional
problems the traction-separation-based model assumes three components of separation, one
normal to the interface and two parallel to it, and the corresponding stress components are
assumed to be active at a material point. Using the cohesive elements and adhesive material
models, together with introducing the strain at which debonding was expected helped model the
debonding behavior of the CFRP plate attached to the steel beam.
Modeling with cohesive elements consists of several steps. The first step is choosing the
appropriate cohesive element type, including the cohesive elements in a finite element model,
connecting them to other components, and understanding typical modeling issues that arise
during modeling using cohesive elements. The second step is defining the initial geometry of the
cohesive elements. Third, the mechanical constitutive behavior of the cohesive elements can be
defined by (1) a continuum-based constitutive model; (2) a uniaxial stress-based constitutive

48
model, which is useful in modeling gaskets and/or single adhesive patches; or (3) a constitutive
model specified directly in terms of traction versus separation. This study used the third behavior
for cohesive elements, a three-dimensional traction separation model.
The cohesive elements could be used in areas of the model where it is expected that cracking
would develop. It is not required that the model have initial cracking modeled. In fact, the
precise locations where cracks initiate, as well as the evolution characteristics of such cracks, are
determined as part of the solution. The cracks are restricted to propagate along the layer of
cohesive elements and will not deflect into the surrounding material. Figure 4-6 shows a typical
use of cohesive elements traction separation-based modeling, the debonding along a skin-stringer
interface.
Figure 4-6. Debonding along a skin-stringer interface: typical situation for traction-separation-based modeling (Abaqus Analysis User Manual, 2007).
Figure 4-7 shows the form used in defining the cohesive elements in the model developed in this
study. In essence, cohesive elements are used to model adhesives between two components, each
of which may be deformable or rigid. They are used to model interfacial debonding using a
cohesive zone framework.

49
Figure 4-7. Cohesive element definition form.
4.3.2 Mesh Tie Constraints
A surface-based tie constraint fully bonds two surfaces together for the duration of a simulation.
It can be used only with surface-based constraint definitions. It can also be used to create a
constraint on a surface so that it follows the motion of a three-dimensional beam. Surface-based
constraints are useful for mesh refinement purposes, especially for three-dimensional problems,
as they allow for rapid transitions in mesh density within the model. The idea behind surface
constraints is to constrain each of the nodes on the slave surface to have the same motion as the
point on the master surface to which it is closest. In addition, they eliminate the degrees of
freedom of the slave surface nodes that are constrained, where possible.
Figure 4-8 shows the surface constraints definition form. The two surfaces to be constrained
were predefined, then one surface was selected as a master surface, while the other was selected
as a slave surface which would follow all of the translations and rotations of the master surface.

50
Figure 4-8. Surface constraints definition.
4.4 Compatibility of Steel Top Plate to Concrete Slab
The experimental program in Chapter 3 was performed using a steel top plate instead of a
concrete slab. FE analysis was used to verify that the replacement was acceptable and
compatible. A model with a concrete slab was built and compared to the models with a steel top
plate.
4.4.1 Concrete
The smeared crack concrete model in ABAQUS was used to verify the compatibility of using a
steel top plate to the typical concrete slab. The FE software provides a general capability for
modeling reinforced concrete in all types of structures, including beams, trusses, shells, and
solids The smeared crack concrete model is designed for applications in which the concrete is
subjected to essentially monotonic straining at low confining pressures, which was the case with
the four-point bending tests conducted. It consists of an isotropically hardening yield surface that
is active when the stress is dominantly compressive and has an independent “crack detection
surface” that determines if a point fails by cracking.

51
The smeared crack model uses oriented damaged elasticity concepts (smeared cracking) to
describe the reversible part of the material's response after cracking failure. Reinforcement in
concrete structures is typically provided by means of rebars, which are one-dimensional strain
theory elements (rods) that can be defined singly or embedded in oriented surfaces. Rebars are
typically used with metal plasticity models to describe the behavior of the rebar material and are
superimposed on a mesh of standard element types used to model the concrete.
With this modeling approach, the concrete behavior was considered independently of the rebar.
Effects associated with the rebar/concrete interface, such as bond slip and dowel action, are
modeled approximately by introducing some “tension stiffening” into the concrete modeling to
simulate load transfer across cracks through the rebar. Details regarding tension stiffening are
provided in the following sections.
Defining the rebar can be tedious in complex problems, but it is important that this be done
accurately since it may cause an analysis to fail due to a lack of reinforcement in key regions of a
model. The composite section model built had the concrete section mainly in compression, but
rebar was necessary to stabilize the solution and prevent early crack detection in the concrete
section that would lead to inaccurate failure modes. This would be needed especially when the
concrete was under tension stresses due to the upward shifting of the neutral axis from the steel-
concrete interface to within the concrete slab as the loading increased. In this case, rebar would
play an important role in carrying the tension forces, allowing the model to continue solving for
the overall failure behavior.
The postfailure behavior for direct straining across cracks is modeled with tension stiffening,
which allows one to define the strain-softening behavior for cracked concrete. This behavior also
allows for the effects of the reinforcement interaction with concrete to be simulated in a simple
manner. Tension stiffening is required in the concrete smeared cracking model. You can specify
tension stiffening by means of a postfailure stress-strain relation or by applying a fracture energy
cracking criterion.
4.4.1.1 Crack Detection
Cracking is assumed to occur when the stress reaches a failure surface that is called the “crack
detection surface.” This failure surface is a linear relationship between the equivalent pressure
stress, p, and the Mises equivalent deviatoric stress, q, and is illustrated in Figure 4-9. When a
crack has been detected, its orientation is stored for subsequent calculations. Subsequent
cracking at the same point is restricted to being orthogonal to this direction, since stress
components associated with an open crack are not included in the definition of the failure surface
used for detecting the additional cracks.
Cracks are irrecoverable; they remain for the rest of the calculation (but may open and close). No
more than three cracks can occur at any point (two in a plane stress case, one in a uniaxial stress
case). Following crack detection, the crack affects the calculations because a damaged elasticity
model is used. Oriented damaged elasticity is discussed in more detail in “An inelastic

52
constitutive model for concrete”, Section 4.5.1 of the Abaqus Theory Manual (Abaqus Analysis
User Manual, 2007).
Figure 4-9. Tension stiffening model (Abaqus Analysis User Manual, 2007).
4.4.1.2 Fracture Energy Cracking Criterion
As discussed earlier, when there is no reinforcement in significant regions of a concrete model,
the strain softening approach for defining tension stiffening may introduce unreasonable mesh
sensitivity into the results. Crisfield (1986) discusses this issue and concludes that Hillerborg
(1976) proposal is adequate to allay the concern for many practical purposes. Hillerborg defines
the energy required to open a unit area of crack as a material parameter, using brittle fracture
concepts. With this approach the concrete's brittle behavior is characterized by a stress-
displacement response rather than a stress-strain response. Under tension a concrete specimen
will crack across some section. After it has been pulled apart sufficiently for most of the stress to
be removed (so that the elastic strain is small), its length will be determined primarily by the
opening at the crack. The opening does not depend on the specimen's length (Figure 4-10).

53
Figure 4-10. Fracture energy cracking model (Abaqus Analysis User Manual, 2007).
4.4.2 Compressive Behavior of the Concrete Model
The cracking and compressive responses of concrete that are incorporated in the concrete model
are illustrated by the uniaxial response of a specimen shown in Figure 4-11. When concrete is
loaded in compression, it initially exhibits elastic response. As the stress is increased, some non-
recoverable (inelastic) straining occurs and the response of the material softens. An ultimate
stress is reached, after which the material loses strength until it can no longer carry any stress. If
the load is removed at some point after inelastic straining has occurred, the unloading response is
softer than the initial elastic response: the elasticity has been damaged. This effect is ignored in
the model, since we assume that the applications involve primarily monotonic straining, with
only occasional, minor un-loadings. When a uniaxial concrete specimen is loaded in tension, it
responds elastically until, at a stress that is typically 7%–10% of the ultimate compressive stress,
cracks form so quickly that, even in the stiffest testing machines, it is very difficult to observe
the actual behavior. The model assumes that cracking causes damage, in the sense that open
cracks can be represented by a loss of elastic stiffness. It is also assumed that there is no
permanent strain associated with cracking. This will allow cracks to close completely if the stress
across them becomes compressive.

54
Figure 4-11. Uniaxial behavior of plain concrete (Abaqus Analysis User Manual, 2007).
4.5 Failure Modes in FE Models
Several modes of failure were programmed and defined in the ABAQUS FE models built to
correctly develop a model that simulates the actual beams. In addition to modes of failure, the
failure limits and material strength were also of great concern. In this section, the modes of
failure anticipated, together with the material limits are discussed. The modes of failure taken
into consideration were for (1) the steel beam, (2) the concrete slab, (3) the CFRP rupture, and
(4) the CFRP debonding (epoxy failure).
4.5.1 Steel Beam Failure
Steel material was defined using its classical elastic and plastic properties. Elastic properties
(Figure 4-12) were the Young’s modulus, E = 185000 N/mm2, and Poisson’s ratio, ν = 0.3. The
plastic material properties were specified as seen in Figure 4-13, where the data inputted starting
from the yield point.

55
Figure 4-12. Steel elastic material properties.

56
Figure 4-13. Steel plastic material properties.
4.5.2 Concrete Failure
Concrete material was defined using its classical elastic and plastic properties. Elastic properties
(Figure 4-14) were the Young’s modulus, E = 18000 N/mm2, and poisson’s ratio, ν = 0.15.

57
Figure 4-14. Concrete elastic material properties.
The concrete smeared cracking properties were specified as seen in Figure 4-15, where the data
were inputted starting from the plastic point. The figure shows the values that were obtained
from solved examples in the Abaqus reference manual (Abaqus Analysis User Manual, 2007).
Concrete tension stiffening properties are shown in Figure 4-16.

58
Figure 4-15. Concrete smeared cracking material properties.
Figure 4-16. Concrete tension stiffening.

59
You can specify failure ratios to define the shape of the failure surface. Figure 4-17 shows the
values that were obtained from solved examples in the Abaqus reference manual (Abaqus
Analysis User Manual, 2007). Four failure ratios can be specified:
The ratio of the ultimate biaxial compressive stress to the ultimate uniaxial
compressive stress.
The absolute value of the ratio of the uniaxial tensile stress at failure to the
ultimate uniaxial compressive stress.
The ratio of the magnitude of a principal component of plastic strain at ultimate
stress in biaxial compression to the plastic strain at ultimate stress in uniaxial
compression.
The ratio of the tensile principal stress at cracking, in plane stress, when the other
principal stress is at the ultimate compressive value, to the tensile cracking stress
under uniaxial tension.
Figure 4-17. Concrete failure ratios.
4.5.3 CFRP Rupture
CFRP modeling in ABAQUS was done using Hashin models, as previously mentioned. The
model has two main steps:
Hashin Damage;
Elastic material properties.
Figure 4-18 shows the window used for defining Hashin damage values that were obtained from
the manufacturer, as well as tension test results and solved examples in the Abaqus reference
manual (Abaqus Analysis User Manual, 2007). The values used were as follows:

60
Longitudinal tensile strength = 3790 N/mm2
Longitudinal compressive strength = 2000 N/mm2
Transverse tensile strength = 1800 N/mm2
Transverse compressive strength = 1000 N/mm2
Longitudinal shear strength = 500 N/mm2
Transverse shear strength = 500 N/mm2
Figure 4-19 shows the form used for defining damage evolution values. Values were obtained
from solved examples in the Abaqus reference manual (Abaqus Analysis User Manual, 2007).
The values used were as follows:
Longitudinal tensile fracture energy = 50 kg.mm2 / s
2 (µJ)
Longitudinal compressive fracture energy = 50 kg.mm2 / s
2 (µJ)
Transverse tensile fracture energy = 10 kg.mm2 / s
2 (µJ)
Transverse compressive fracture energy = 10 kg.mm2 / s
2 (µJ)
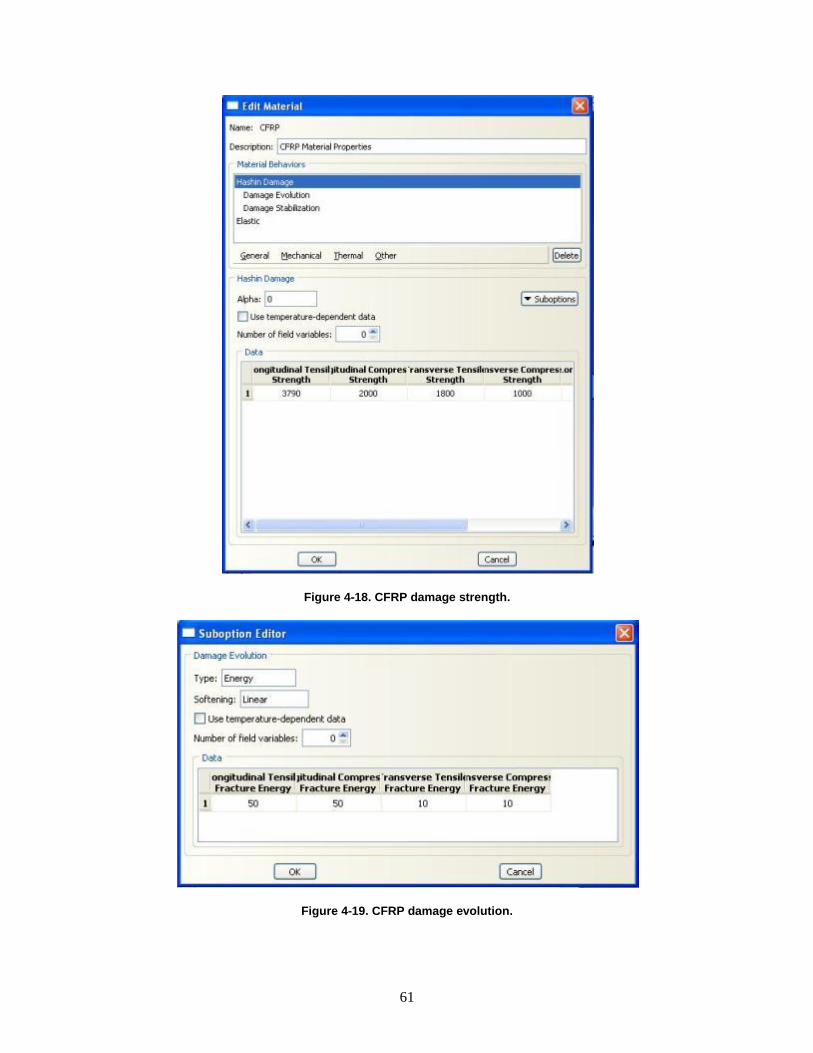
61
Figure 4-18. CFRP damage strength.
Figure 4-19. CFRP damage evolution.
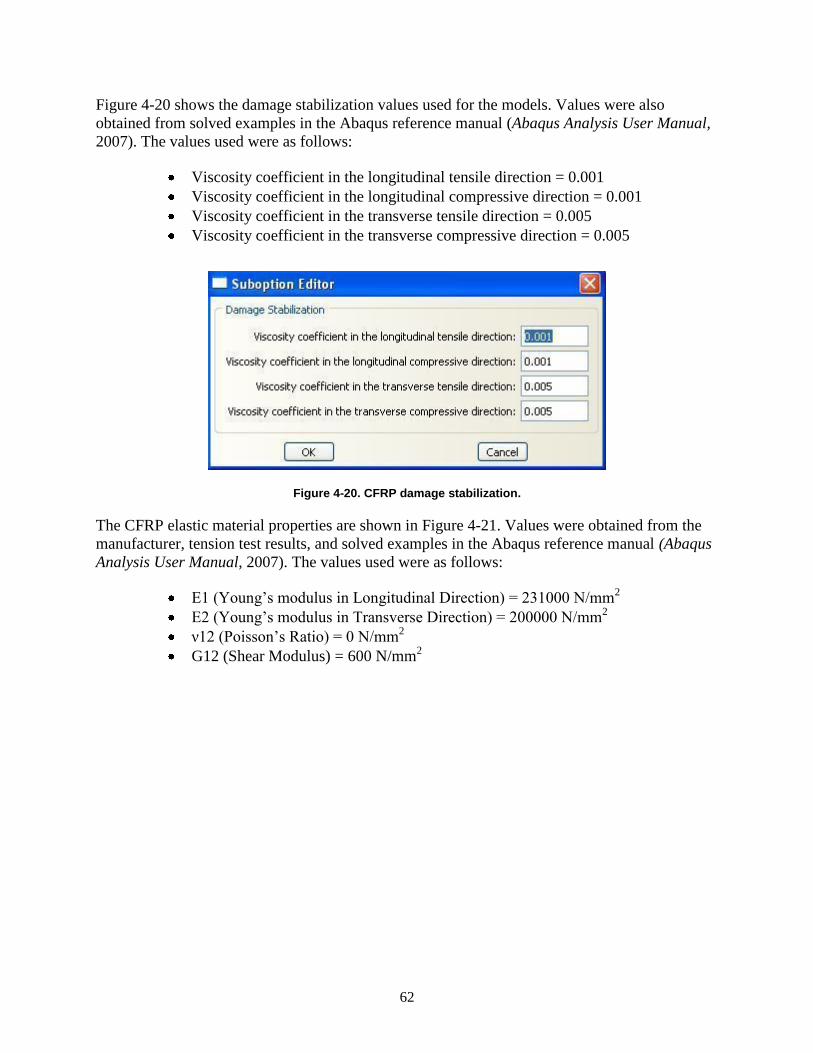
62
Figure 4-20 shows the damage stabilization values used for the models. Values were also
obtained from solved examples in the Abaqus reference manual (Abaqus Analysis User Manual,
2007). The values used were as follows:
Viscosity coefficient in the longitudinal tensile direction = 0.001
Viscosity coefficient in the longitudinal compressive direction = 0.001
Viscosity coefficient in the transverse tensile direction = 0.005
Viscosity coefficient in the transverse compressive direction = 0.005
Figure 4-20. CFRP damage stabilization.
The CFRP elastic material properties are shown in Figure 4-21. Values were obtained from the
manufacturer, tension test results, and solved examples in the Abaqus reference manual (Abaqus
Analysis User Manual, 2007). The values used were as follows:
E1 (Young’s modulus in Longitudinal Direction) = 231000 N/mm2
E2 (Young’s modulus in Transverse Direction) = 200000 N/mm2
ν12 (Poisson’s Ratio) = 0 N/mm2
G12 (Shear Modulus) = 600 N/mm2

63
Figure 4-21. CFRP elastic material properties.
Figure 4-22 shows the definition of the CFRP section. The section was defined as a continuum
homogeneous shell with CFRP material properties defined in Figure 4-18 to Figure 4-21. The
only variable introduced in this form was the CFRP laminate thickness, which was shown to be
1.40 mm in this window. Different values were used for different models.

64
Figure 4-22. CFRP section definition.
4.5.4 CFRP Debonding – Epoxy Failure
Adhesive material (epoxy) was defined in the model to connect the CFRP laminate to the bottom
flange of the steel beam. Adhesive definition is divided into two parts, the Quade damage and the
elastic material properties. Values were obtained from the literature and solved examples in the
Abaqus reference manual (Abaqus Analysis User Manual, 2007). Figure 4-23 shows the Quade
damage definition of the adhesive elements. Data inputted in this form were the nominal strain
values at which the epoxy layer looses its stiffness and starts failing:
Nominal strain – Normal-only mode = 2.5e-5
Nominal strain – Shear-only mode first direction = 6.65e-5
Nominal strain – Shear-only mode second direction = 6.65e-5
A sub-option that was defined with the damage definition was the damage evolution option
shown in Figure 4-24, which was the default value recommended by Abaqus (Abaqus Analysis
User Manual, 2007). The adhesive elastic material properties are shown in Figure 4-25. Values
were obtained from solved examples in the Abaqus reference manual (Abaqus Analysis User
Manual, 2007). The values used were as follows:
E (Young’s modulus in Longitudinal Direction) = 200000 N/mm2
G1 (Shear Modulus in direction 1) = 75188 N/mm2

65
G2 (Shear Modulus in direction 2) = 75188 N/mm2
Figure 4-23. Epoxy damage properties.

66
Figure 4-24. Epoxy damage evolution.
Figure 4-25. Epoxy elastic material properties.

67
4.6 Results
The verification of FE models built versus experimental work is presented in the following
sections. Models with concrete deck versus models with the steel top plate are also compared to
validate the assumption regarding replacement of the concrete deck with a steel plate.
4.6.1 Concrete Slab versus Steel Top Plate
The findings of the comparisons of the concrete slab and the steel top plate demonstrate that an
excellent correlation exists between them. For all the different configurations of the CFRP strips
tested, the models accurately predicted the debonding points, the ultimate load capacity, and
deflections. Figure 4-26 through Figure 4-30 present the load-deflection curves obtained from
the concrete-slab model and steel-plate model for Beams 1 through Beam 5. The curves show
very good correlation between the two models, which indicates that replacing the concrete slab
with a steel plate was successful. The concrete model was a little more stiff in the plastic zone at
very high deflections.
Figure 4-26. Load-deflection – steel plate vs. concrete slab – Beam 1.
0
20
40
60
80
100
120
140
0 20 40 60 80 100 120 140
Load
(kN
)
Deflection (mm)
B1-Steel Plate Model
B1-Concrete Slab Model

68
Figure 4-27. Load-deflection – steel plate vs. concrete slab – Beam 2.
Figure 4-28. Load-deflection – steel plate vs. concrete slab – Beam 3.
0
20
40
60
80
100
120
140
160
180
200
0 20 40 60 80 100 120
Load
(kN
)
Deflection (mm)
B2 Steel Plate Model
B2 - Concrete Slab Model
0
20
40
60
80
100
120
140
160
180
200
0 20 40 60 80
Load
(kN
)
Deflection (mm)
B3 Steel Plate Model
B3-Concrete Slab Model
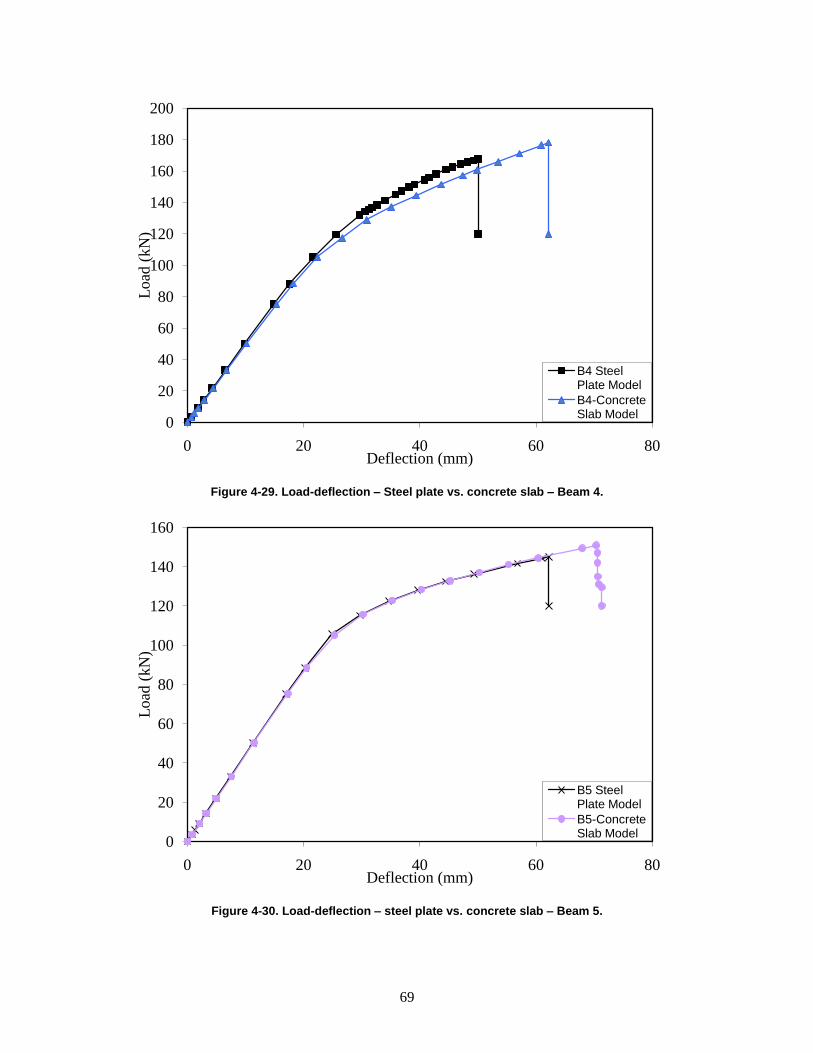
69
Figure 4-29. Load-deflection – Steel plate vs. concrete slab – Beam 4.
Figure 4-30. Load-deflection – steel plate vs. concrete slab – Beam 5.
0
20
40
60
80
100
120
140
160
180
200
0 20 40 60 80
Load
(kN
)
Deflection (mm)
B4 Steel Plate Model
B4-Concrete Slab Model
0
20
40
60
80
100
120
140
160
0 20 40 60 80
Load
(kN
)
Deflection (mm)
B5 Steel Plate Model
B5-Concrete Slab Model

70
4.6.2 Verification of FE Model by the Tested Beams
The verification of the FE models to the experimental tests is presented in this section. It was
found that an excellent correlation exists between the experimentally tested steel beams and the
FE models built. For all of the different configurations of the CFRP strips, the models accurately
predicted the debonding points, the ultimate load capacity, and deflections. Strain comparison
was also performed and showed a good correlation. This is observed in Figure 4-31 through
Figure 4-34.
Figure 4-31. Load-deflection curve for Beams 1 and 2 – experimental vs. Abaqus.
0
20
40
60
80
100
120
140
160
180
200
0 20 40 60 80 100 120 140 160 180
Load
(K
N)
Deflection (mm)
Experimental - Beam 1
Experimental - Beam 2
ABAQUS - Beam 1
ABAQUS - Beam 2
Debonding /
Rupture of CFRP
62%
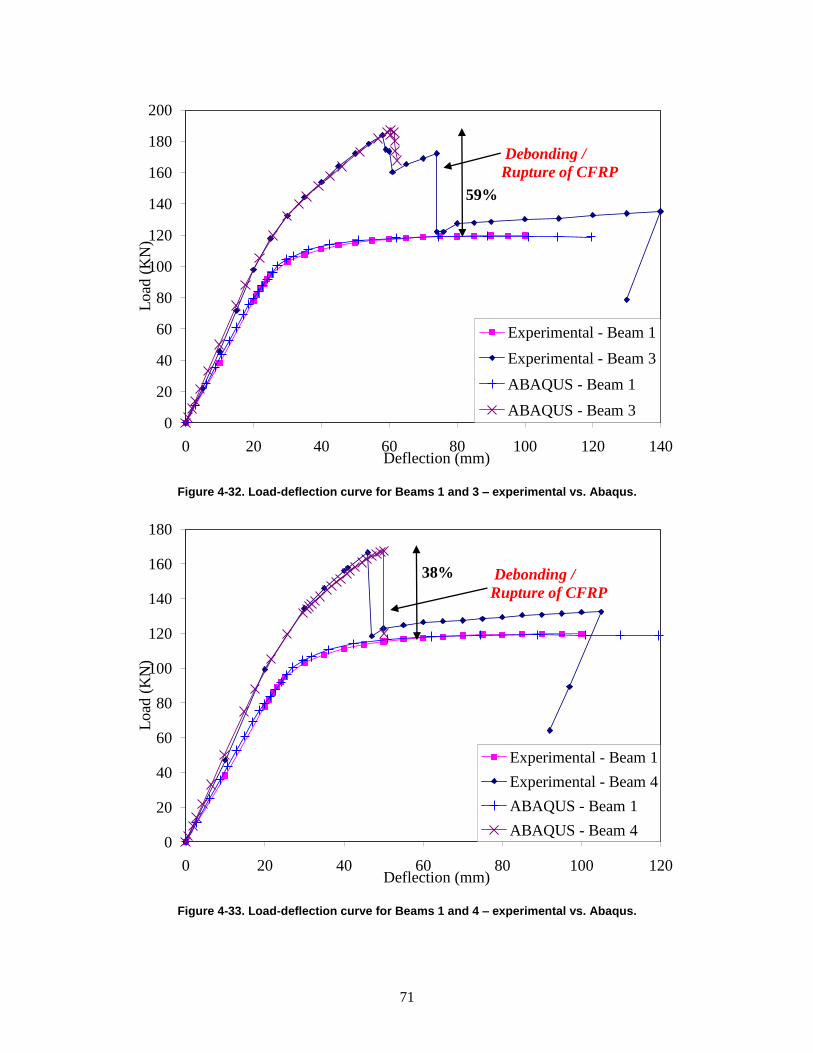
71
Figure 4-32. Load-deflection curve for Beams 1 and 3 – experimental vs. Abaqus.
Figure 4-33. Load-deflection curve for Beams 1 and 4 – experimental vs. Abaqus.
0
20
40
60
80
100
120
140
160
180
200
0 20 40 60 80 100 120 140
Lo
ad (
KN
)
Deflection (mm)
Experimental - Beam 1
Experimental - Beam 3
ABAQUS - Beam 1
ABAQUS - Beam 3
Debonding /
Rupture of CFRP
59%
0
20
40
60
80
100
120
140
160
180
0 20 40 60 80 100 120
Load
(K
N)
Deflection (mm)
Experimental - Beam 1
Experimental - Beam 4
ABAQUS - Beam 1
ABAQUS - Beam 4
Debonding /
Rupture of CFRP
38%

72
Figure 4-34. Load deflection curve for Beams 1 and 5 – experimental vs. Abaqus.
Based on all of these correlated models, a parametric study was performed, as shown in the
following chapter, to test the sensitive parameters of steel beams strengthened using CFRP
laminates.
4.6.3 Strain-Depth Verification
Strain-depth comparisons between the verification FE models and the experimental tests showed
excellent correlation at the early loading stages, while strain readings started to deviate at the
later stages. The strain-depth comparisons will be demonstrated in this section through a group
of graphs (Figure 4-35, Figure 4-36, and Figure 4-37). Each graph shows three load levels at
which the comparison occurs. Load steps are implied by ABAQUS load steps. That is why they
do not exactly match the previous discussed load levels of 30%, 60%, and 90%.
Figure 4-35 shows the strain-depth variations of Beam 1. Three load stages were investigated:
33.11 kN, 75.40 kN, and 102.92 kN. Experimental results versus FE results show excellent
correlation at all stages.
Figure 4-36 shows the strain-depth variations of Beam 2. Three load stages were investigated;
50.14 kN, 114.41 kN, and 159.89 kN. The comparison of experimental results versus FE results
shows excellent correlation at early loading stages. Experimental strain readings exceed the FE
strain reading at the 159.89 kN load level.
0
20
40
60
80
100
120
140
160
0 20 40 60 80 100 120
Lo
ad (
KN
)
Deflection (mm)
Experimental - Beam 1
Experimental - Beam 5
ABAQUS - Beam 1
ABAQUS - Beam 5
Debonding /
Rupture of CFRP20%

73
Figure 4-37 shows the strain-depth variations of Beam 3. Three load stages were investigated:
50.17 kN, 108.30 kN, and 160.06 kN. The comparison of experimental results versus FE results
shows excellent correlation at the early loading stages. Experimental strain readings exceed the
FE strain reading at the 160.06 kN load level.
Figure 4-35. Beam depth-strain – experimental vs. Abaqus – Beam 1.
0
20
40
60
80
100
120
140
160
180
200
220
-800 -600 -400 -200 0 200 400 600 800 1000 1200 1400 1600 1800 2000 2200 2400
Dep
th (
mm
)
Strain (µ mm/mm)
Abaqus @33.11kNAbaqus @75.40kNAbaqus @102.92kNExp @33.11kNExp @75.40kNExp @102.92kN
Top of plate
Soffit of beam top
flange
Top of beam bottom flange

74
Figure 4-36. Beam depth-strain – experimental vs. Abaqus – Beam 2.
Figure 4-37. Beam depth-strain – experimental vs. Abaqus – Beam 3.
0
20
40
60
80
100
120
140
160
180
200
220
-1500 -900 -300 300 900 1500 2100 2700 3300 3900 4500 5100 5700 6300 6900
Dep
th (
mm
)
Strain (µ mm/mm)
Abaqus @50.14kNAbaqus @114.41kNAbaqus @159.89kNExp @50.14kNExp @114.41kNExp @159.89kN
Top of plate
Soffit of beam top
flange
Top of beam
bottom flange
0
20
40
60
80
100
120
140
160
180
200
220
-800 -400 0 400 800 1200 1600 2000 2400 2800
Dep
th (
mm
)
Strain (µ mm/mm)
Abaqus @50.17kNAbaqus @108.30kNAbaqus @160.06kNExp @50.17kNExp @108.30kNExp @160.06kN
Top of plate
Soffit of beam
top flange
Top of beam bottom flange

75
4.7 Summary
Verification of the FE model built to simulate the steel beams tested experimentally in Chapter 3
showed excellent correlation. Load-deflection curves were compared from both the verification
models and the experimental results. Strain-depth curves were also compared. Results from the
verification models and the experimental results were compared. The FE models were ready to
perform the parametric study.

76
Section 5
5.0 Parametric Study
5.1 Introduction
While traditional retrofitting methods could be time consuming and uneconomical, an alternative
repair method is suggested using CFRP laminate strips, providing engineers with a competitive
solution that will increase the life-cycle of bridges repaired. The experimental work conducted
showed that the method is effective and provided a reliable option to strengthen and rehabilitate
steel girder bridges. Work in this chapter investigates the various parameters effecting its
utilization. The study summarizes the extensive parametric FE analysis work conducted to
strengthen steel beams using the novel CFRP laminate strips configurations.
The results of the parametric study demonstrated a significant gain in the beam’s elastic and
ultimate capacities. The ultimate gain of the beam greatly depends on the configuration of the
CFRP laminates and the laminate’s dimensions. The conclusion is that there are specific
sensitive parameters controlling the effectiveness of the CFRP laminate rehabilitation technique.
An adequate design of the rehabilitation method, which takes into consideration the effective
parameters, would result in an effective design.
An extensive parametric study was conducted using the FE model developed in the previous
chapter to investigate the sensitive parameters affecting the behavior of composite beams
strengthened by CFRP plates. The parametric study involved the development of approximately
100 models, and through a process of elimination, the most effective parameters were
established. Therefore, once a parameter is proved to be ineffective, it is eliminated from
continued testing.
This chapter starts by introducing the parametric study table implemented, and results for each
beam case were then discussed and analyzed. Finally, the results are presented with design
recommendations for the structural engineer for an optimum design.
5.2 Parametric Study Program
The parametric study program was based on experimental and FE analysis work previously
conducted (Salama & Abd-El-Meguid, 2007). Three small-scale steel beam models were
developed to investigate the effectiveness of using different configurations of CFRP laminates to
increase the strength and stiffness of steel highway bridge girders. Each beam had the same
length and was loaded monotonically to failure using a four-point bending configuration
separated equally. Uniform loading was investigated as an additional parameter. A schematic
diagram of the cross-section of a typical modeled beam and the strain gages location is shown in

77
Figure 3-1. Figure 3-6 (a, b, c, & d) show the different CFRP configurations used for
strengthening beams throughout the parametric study.
The W200 x 19.3 (W8 x 13), W310 x 38.7 (W12 x 26), and W410 x 53 (W16 x 36) steel beam
sections proved to be the most appropriate based on the preliminary design criteria. Deeper beam
sections were chosen in order to show that the CFRP rehabilitation is effective on any steel
section when appropriately designed.
The factor that affected the beam selection was the span-to-depth ratio used for bridge design.
Furthermore, steel bridges are composed of steel girders attached by shear connectors to the
overlaying concrete slab. In the models developed, the concrete deck was replaced by a steel
plate to control the experimental variation in concrete strength produced by different concrete
batches. The steel plate was designed to have the neutral axis at the top flange of the steel beam,
causing the beam to be mainly in tension and the plate in compression. The steel plate’s width
provided the beam with sufficient lateral support to avoid any lateral torsional buckling.
Preliminary design was done using an Excel spreadsheet with Visual Basic programming. The
Visual Basic modules programmed are found in Appendix A and B. The sheet was divided into
input (Table 5-1) and output phases (Table 5-2). The input sheet starts with the choice of the
steel section where steel section properties are automatically extracted from stored section
databases. Dimensions and material properties of the CFRP laminates and the steel top plate
were the second input phase in the sheet. Loading was the final input phase in the sheet.
Calculations are always automatically updated once an input changes. The output sheet (Table
5-2) starts by displaying the local stability and compactness of the chosen section. After all
checks were performed, a message saying that the “section is compact” and “no instability” can
be read. In the next output phase, the plastic neutral axis and the section plastic capacity were
calculated for each step of the strengthening of the steel beam. The calculation of the plastic
neutral axis included an iteration method, which is where the Visual Basic programming code
was introduced. Plastic moment capacity was calculated using a Visual Basic module. Shear
factor of safety was then calculated to ensure that the beam was only flexure governed, with no
probability of failing in shear. Stresses and deflections were then displayed at the end of the
spreadsheet.

78
Table 5-1. W200 x 19.3 – Input Data Sheet SECTION DESIGN FOR EXPERIMENTAL TESTING
input numbers in bold b lue only
Beam Dimensions
Span= 14.00 ft 4.27 m NO INSTABILITY
Beam Length= 15.00 ft 4.57 m 1.58
Lb= 0.00 ft 0.00 m Flexure governed
Section= 263 W8X13 W200x19.3
Beam Weight = 195 lb 89 kg
Span/Depth Ratio= 21.03
STEEL Section Properties
A 3.84 in2 24.77 cm2
d 7.99 in 20.29 cm
tw 0.23 in 0.58 cm
tf 0.255 in 0.65 cm
bf 4 in 10.16 cm
Ix-x 39.6 in4 1648 cm4
Iy-y 2.73 in4 114 cm4
J 0.0871 in4 4 cm4
Sx-x 9.91 in3 162 cm3
Zx-x 11.4 in3 187 cm3
ry 0.843 in 2.14 cm
section weight 13.00 lb/ft 19.36 kg/m
Elastic modulus (E) 2.90E+07 psi 2.04E+06 kg/cm2
Shear Modulus (G) 1.12E+07 psi 7.88E+05 kg/cm2
Yield stress 50.0 ksi 3.52 t/cm2
Residual stress 10.0 ksi 0.70 t/cm2
CFRP properties (added on the bottom face of the bottom flange)
Width 3.94 in 10.00 cm O.K, Max is 10.16
Thickness 0.06 in 0.14 cm
Area 0.22 in2 1.40 cm2
Equivalent area 0.15 in2 0.96 cm2
Added inertia 6.20 in4 257.89 cm4
Elastic modulus 2.00E+07 psi 1.41E+06 kg/cm2
Yield stress 293.0 ksi 20.62 t/cm2
CFRP properties (added on the top face of the bottom flange)
Width 3.00 in 7.62 cm O.K, Max is 9.5758
Thickness 0.06 in 0.14 cm
Area 0.17 in2 1.06 cm2
Equivalent area 0.11 in2 0.73 cm2
Added inertia 4.72 in4 196.51 cm4
Elastic modulus 2.00E+07 psi 1.41E+06 kg/cm2
Yield stress 293.0 ksi 20.62 t/cm2
Top plate properties (substituting the concrete slab)
Width 12.00 in 30.49 cm
Thickness 0.50 in 1.27 cm
Area 6.00 in2 38.72 cm2
Equivalent area 6.00 in2 38.72 cm2
Added inertia 20.05 in4 834.68 cm4
Elastic modulus 2.90E+07 psi 2.04E+06 kg/cm2
Yield stress 50.0 ksi 3.52 t/cm2
Point Loading
Dist between loads = 4.666666667 ft 1.42 m
Total Point Load = 38300 lb 17388.2 kg
Straining Actions
Total SERVICE Straining Actions
Moment = 90183 lb.ft 12.479 m.t
Shear = 19383.2 lb 8.800 t
section properties are
extractied from the
tables based on the
selection done above.

79
Table 5-2. W200 x 19.3 – Output Data Sheet
Output & Checks
Width thickness ratio l l p l r
Flange 7.84 9.15 22.35 Compact
Web 29.9 90.55 137.27 Compact
X1= 2336 ksi Section is Compact
X2= 0.00617 ksi-2
Lr= 8.51 ft
Lp= 2.98 ft NO INSTABILITY
Applied Moment= 1082.2 kip.in 1247.9 t.cm
Section Plastic NA (in) Mn (kip.in) F.O.S Step Gain %
Steel Section only 3.97 555.3 0.51 0.00%
Steel Section + Plate 0.41 820.9 0.76 47.82%
Section + Plate+B_CFRP 0.46 1333.8 1.23 62.48%
Section + Plate+2 CFRP 0.50 1707.5 1.58 28.01%
Vn= 51.61 kips 23.43 ton
Vu= 19.38 kips 8.80 ton
Shear F.O.S= 2.66
Stresses in steel plate
ftop -24177.71 psi -1.70 t/cm2SAFE
Stresses in steel section
ftop -18359.80 psi -1.29 t/cm2SAFE
fbottom 74610.39 psi 5.25 t/cm2UNSAFE
q 10547.55 psi 0.742 t/cm2 SAFE
Stresses in CFRP
fbottom_Top 49433.85 psi 3.48 t/cm2SAFE
fbottom_bottom 51922.75 psi 3.65 t/cm2SAFE
P-Delta chart
Load step Load (kips) Delta (Excel)
0 0 0
1 3830 0.1195
2 7660 0.2390
3 11490 0.3585
4 15320 0.4780
5 19150 0.5975
6 22980 0.7170
7 26810 0.8365
8 30640 0.9559
9 34470 1.0754
10 38300 1.1949

80
5.2.1 Flowchart Calculating Plastic Neutral Axis
START
READ INPUT DATA -Section Dimensions (D, B_F, T_W, T_F)
-Plate Dimensions (Top_Plate_T, Top_Plate_W) -Top CFRP Dimensions (T_CFRP_T, T_CFRP_W)
-Bottom CFRP Dimensions (B_CFRP_T, B_CFRP_W) -Steel Material Properties (FY)
-CFRP Material Properties (CFRP_Y)
Plastic_NA = 0.0
Plastic_NA = Plastic_NA + 0.00001 x D
DEFINE AND ZERO ALL FORCES -Top plate force 1 (F_Top_Plate_1) -Top plate force 2 (F_Top_Plate_2)
-Top flange force 1 (F_Top_Flange_1) -Top flange force 2 (F_Top_Flange_2)
-Web force 1 (F_Web_1) -Web force 2 (F_Web_2)
-Top CFRP force (F_CFRP_TOP) -Bottom flange force (F_Bottom_Flange) -Bottom CFRP force (F_CFRP_Bottom)
5
1

81
Plastic_NA < Top_Plate_T
1
TRUE
F_Top_Plate_1 = -Top_Plate_W * Plastic_NA * F_Y F_Top_Plate_2 = Top_Plate_W * (Top_Plate_T - Plastic_NA) *
F_Y F_Top_Flange_1 = B_F * T_F * F_Y
F_Top_Flange_2 = 0 F_Web_1 = (D - 2 * T_F) * T_W * F_Y
F_Web_2 = 0 F_CFRP_TOP = T_CFRP_W * T_CFRP_T * CFRP_Y
F_Bottom_Flange = B_F * T_F * F_Y F_CFRP_Bottom = B_CFRP_W * B_CFRP_T * CFRP_Y
FALSE
Plastic_NA < Top_Plate_T + T_F
TRUE
2
3
FALSE

82
2
F_Top_Plate_1 = -Top_Plate_W * Top_Plate_T * F_Y F_Top_Plate_2 = 0
F_Top_Flange_1 = -B_F * (Plastic_NA - Top_Plate_T) * F_Y F_Top_Flange_2 = B_F * (Top_Plate_T + T_F - Plastic_NA) * F_Y
F_Web_1 = (D - 2 * T_F) * T_W * F_Y F_Web_2 = 0
F_CFRP_TOP = T_CFRP_W * T_CFRP_T * CFRP_Y F_Bottom_Flange = B_F * T_F * F_Y
F_CFRP_Bottom = B_CFRP_W * B_CFRP_T * CFRP_Y
3
F_Top_Plate_1 = -Top_Plate_W * Top_Plate_T * F_Y F_Top_Plate_2 = 0
F_Top_Flange_1 = -B_F * T_F * F_Y F_Top_Flange_2 = 0
F_Web_1 = -T_W * (Plastic_NA - Top_Plate_T - T_F) * F_Y F_Web_2 = T_W * (D - 2 * T_F - Plastic_NA + Top_Plate_T + T_F) * F_Y
F_CFRP_TOP = T_CFRP_W * T_CFRP_T * CFRP_Y F_Bottom_Flange = B_F * T_F * F_Y
F_CFRP_Bottom = B_CFRP_W * B_CFRP_T * CFRP_Y
4
4

83
4
Sigma_Force = F_Top_Plate_1 + F_Top_Plate_2 + F_Top_Flange_1 + F_Top_Flange_2 + F_Web_1 + F_Web_2 + F_CFRP_TOP + F_Bottom_Flange + F_CFRP_Bottom
Abs (Sigma_Force) > 0.50
TRUE
5
FALSE
PRINT Plastic_NA
END

84
5.2.2 Flowchart Calculating Plastic Moment Capacity
START
READ INPUT DATA -Section Dimensions (D, B_F, T_W, T_F)
-Plate Dimensions (Top_Plate_T, Top_Plate_W) -Top CFRP Dimensions (T_CFRP_T, T_CFRP_W)
-Bottom CFRP Dimensions (B_CFRP_T, B_CFRP_W) -Steel Material Properties (FY)
-CFRP Material Properties (CFRP_Y) -Plastic Neutral Axis (NA)
DEFINE AND ZERO ALL MOMENTS -Total plastic moment (M_Plastic)
-Top plate moment 1 (M_Top_Plate_1) -Top plate moment 2 (M_Top_Plate_2)
-Top flange moment 1 (M_Top_Flange_1) -Top flange moment 2 (M_Top_Flange_2)
-Web moment 1 (M_Web_1) -Web moment 2 (M_Web_2)
-Top CFRP moment (M_CFRP_TOP) -Bottom flange moment (M_Bottom_Flange) -Bottom CFRP moment (M_CFRP_Bottom)
1

85
NA < Top_Plate_T
1
TRUE
M_Top_Plate_1 = Top_Plate_W * NA * F_Y * 0.5 * NA M_Top_Plate_2 = Top_Plate_W * (Top_Plate_T - NA) * F_Y *
0.5 * (Top_Plate_T - NA) M_Top_Flange_1 = B_F * T_F * F_Y * (Top_Plate_T - NA + 0.5
* T_F) M_Top_Flange_2 = 0
M_Web_1 = (D - 2 * T_F) * T_W * F_Y * (Top_Plate_T - NA + T_F + 0.5 * (D - 2 * T_F))
M_Web_2 = 0 M_CFRP_TOP = T_CFRP_W * T_CFRP_T * CFRP_Y *
(Top_Plate_T - NA + D - T_F - 0.5 * T_CFRP_T) M_Bottom_Flange = B_F * T_F * F_Y * (Top_Plate_T - NA + D -
0.5 * T_F) M_CFRP_Bottom = B_CFRP_W * B_CFRP_T * CFRP_Y *
(Top_Plate_T - NA + D + 0.5 * B_CFRP_T)
FALSE
NA < Top_Plate_T + T_F
TRUE
2
3
FALSE
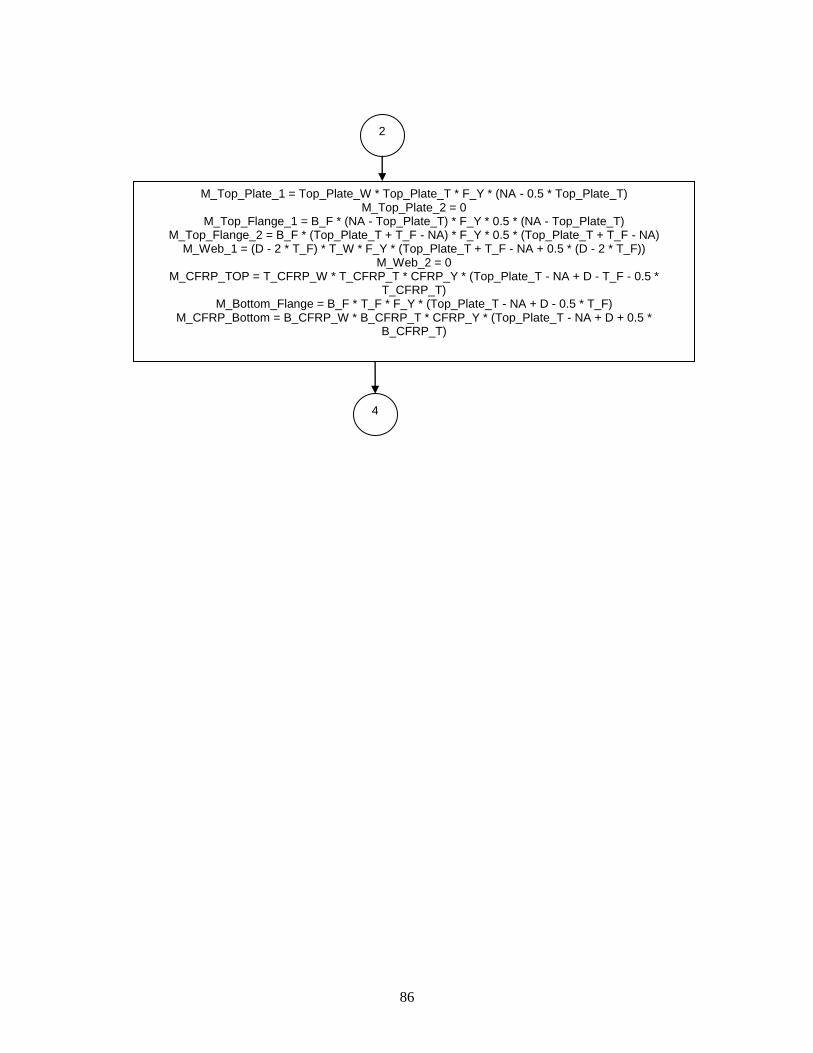
86
2
M_Top_Plate_1 = Top_Plate_W * Top_Plate_T * F_Y * (NA - 0.5 * Top_Plate_T) M_Top_Plate_2 = 0
M_Top_Flange_1 = B_F * (NA - Top_Plate_T) * F_Y * 0.5 * (NA - Top_Plate_T) M_Top_Flange_2 = B_F * (Top_Plate_T + T_F - NA) * F_Y * 0.5 * (Top_Plate_T + T_F - NA)
M_Web_1 = (D - 2 * T_F) * T_W * F_Y * (Top_Plate_T + T_F - NA + 0.5 * (D - 2 * T_F)) M_Web_2 = 0
M_CFRP_TOP = T_CFRP_W * T_CFRP_T * CFRP_Y * (Top_Plate_T - NA + D - T_F - 0.5 * T_CFRP_T)
M_Bottom_Flange = B_F * T_F * F_Y * (Top_Plate_T - NA + D - 0.5 * T_F) M_CFRP_Bottom = B_CFRP_W * B_CFRP_T * CFRP_Y * (Top_Plate_T - NA + D + 0.5 *
B_CFRP_T)
4

87
3
M_Top_Plate_1 = Top_Plate_W * Top_Plate_T * F_Y * (NA - 0.5 * Top_Plate_T) M_Top_Plate_2 = 0
M_Top_Flange_1 = B_F * T_F * F_Y * (NA - Top_Plate_T - 0.5 * T_F) M_Top_Flange_2 = 0
M_Web_1 = T_W * (NA - Top_Plate_T - T_F) * F_Y * 0.5 * (NA - Top_Plate_T - T_F) M_Web_2 = T_W * (D - T_F - NA + Top_Plate_T) * F_Y * 0.5 * (D - T_F - NA + Top_Plate_T) M_CFRP_TOP = T_CFRP_W * T_CFRP_T * CFRP_Y * (D - T_F - NA + Top_Plate_T - 0.5 *
T_CFRP_T) M_Bottom_Flange = B_F * T_F * F_Y * (D - 0.5 * T_F - NA + Top_Plate_T)
M_CFRP_Bottom = B_CFRP_W * B_CFRP_T * CFRP_Y * (D - NA + Top_Plate_T + 0.5 * B_CFRP_T)
M_Plastic = M_Top_Plate_1 + M_Top_Plate_2 + M_Top_Flange_1 + M_Top_Flange_2 + M_Web_1 + M_Web_2 + M_CFRP_TOP + M_Bottom_Flange + M_CFRP_Bottom
PRINT M_Plastic
END
4

88
5.2.3 Effective Parameters
Parameters taken into consideration for the parametric study were CFRP laminate length,
thickness, and configuration, and the beam cross section. The three different CFRP laminate
lengths studied were defined relative to the length of the I-beam as a percentage value. The
CFRP lengths tested were 60%, 75%, and 90% of the beam’s total length. Three CFRP laminate
thicknesses were tested: 1.40 mm (0.055 in), 2.00 mm (0.080 in), and 2.60 mm (0.105 in).
Manufacturing companies of CFRP strips have standard widths and lengths of theses laminates,
but they would typically be able to provide variations to those standards based on the consumer’s
request.
CFRP material properties for the parametric study were obtained from FYFE Company, the
manufacturer of Tyfo®
UC Composite Laminate Strip System. Values were also verified using
experimental results shown in Chapter 3. The typical material properties of the laminate CFRP
materials are; tensile modulus (E) of 155GPa, tensile Strength (Fu) of 2790MPa, rupture strain
(εu) of 0.018, and volumetric fiber content of 68%.
5.2.4 Beam Designation
Beams developed for the study are shown in Table 5-3, Table 5-4, and Table 5-5. To help in the
discussion of the beams, a unique designation system is provided for each beam with the
following criteria:
The letter “V” stands for beams verified with experimental results, and “P” stands
for a model developed for the parametric study program.
The first two digits after the letter designation represent the CFRP laminate length
percentage compared to the total length of the beam; namely 60%, 75% and 90%.
The following three digits represent the laminate thickness, for instance 055
would stand for 0.055 inches laminate thickness.
The next two letters determine the CFRP configuration on each beam as shown in
Figure 3-6 Such that “B4” represents 100 mm (4 in) wide laminate placed at the
bottom face of the lower flange, “B2” represents a 50 mm (2 in) laminate width at
the same location, “TB” represents two 100 mm (4 in) laminates placed at the top
and bottom faces of the lower flange, and “BB” represents a two 100 mm (4 in)
laminates placed at the bottom face of the lower flange.
The last letter determines the load configuration, such that “T” stands for loading
at third points of beam length, and “U” stands for uniform loading over the length
of the beam.
As an example of beam designation, P75080B4T is a parametric study beam with a laminate
length covering 75% of the length of the steel beam, having a thickness of 2.00 mm (0.080 in),
placed at the bottom face of the lower flange and a width of 100 mm (4 in), and being loaded at
third-points of the beam length. The control beam without laminates and loaded at third-points,
would have a beam designation of P0000000T. This designation simplifies the comparison effort
for 94 beams with varying parameters studied for each.

89
Table 5-3 shows the parametric study for beam section W200 x 19.3 loaded with a four-point
loading configuration. The column titled “CFRP Config” indicates the configuration of eh
laminates at the lower flange of the steel beam; “B” at bottom face, “B+T” at bottom and top
faces, and “BB” double strips at bottom face. Table 5-4 shows the parametric study for beam
section W200 x 19.3 loaded with a uniform loading configuration. Table 5-5 shows the
parametric study for beam section W310 x 38.7 (Test # 75 – 84) and W410 x 53 (Test # 85 – 94)
loaded with a four-point loading configuration. Number of tests was greatly reduced for these
beams due to the elimination of parameters proven ineffective by previous tests.
Table 5-3. W200 x 19.3 Parametric Study Table – Four-Point Loading
Parameter CFRP Length CFRP Thickness CFRP Width CFRP Config Model Name
Test # (in) (in)
1 0% 0 0 0 V00000000T
2 75% 0.055 4 B V75055B4T
3 75% 0.055 4+2+2 B+T V75055TBT
4 75% 0.055 4+4 BB V75055BBT
5 75% 0.055 2 B V75055B2T
6 60% 0.055 4 B P60055B4T
7 60% 0.055 4+2+2 B+T P60055TBT
8 60% 0.055 4+4 BB P60055BBT
9 60% 0.055 2 B P60055B2T
10 90% 0.055 4 B P90055B4T
11 90% 0.055 4+2+2 B+T P90055TBT
12 90% 0.055 4+4 BB P90055BBT
13 90% 0.055 2 B P90055B2T
14 75% 0.08 4 B P75080B4T
15 75% 0.08 4+2+2 B+T P75080TBT
16 75% 0.08 4+4 BB P75080BBT
17 75% 0.08 2 B P75080B2T
18 60% 0.08 4 B P60080B4T
19 60% 0.08 4+2+2 B+T P60080TBT
20 60% 0.08 4+4 BB P60080BBT
21 60% 0.08 2 B P60080B2T
22 90% 0.08 4 B P90080B4T
23 90% 0.08 4+2+2 B+T P90080TBT
24 90% 0.08 4+4 BB P90080BBT
25 90% 0.08 2 B P90080B2T
26 75% 0.105 4 B P75105B4T
27 75% 0.105 4+2+2 B+T P75105TBT
28 75% 0.105 4+4 BB P75105BBT
29 75% 0.105 2 B P75105B2T
30 60% 0.105 4 B P60105B4T
31 60% 0.105 4+2+2 B+T P60105TBT
32 60% 0.105 4+4 BB P60105BBT
33 60% 0.105 2 B P60105B2T
34 90% 0.105 4 B P90105B4T
35 90% 0.105 4+2+2 B+T P90105TBT
36 90% 0.105 4+4 BB P90105BBT
37 90% 0.105 2 B P90105B2T

90
Table 5-4. W200 x 19.3 Parametric Study Table – Uniform Loading
Parameter CFRP Length CFRP Thickness CFRP Width CFRP Config Model Name
Test #
38 0% 0 0 0 P0000000U
39 75% 0.055 4 B P60055B4U
40 75% 0.055 4+2+2 B+T P60055TBU
41 75% 0.055 4+4 BB P60055BBU
42 75% 0.055 2 B P60055B2U
43 60% 0.055 4 B P60055B4U
44 60% 0.055 4+2+2 B+T P60055TBU
45 60% 0.055 4+4 BB P60055BBU
46 60% 0.055 2 B P60055B2U
47 90% 0.055 4 B P90055B4U
48 90% 0.055 4+2+2 B+T P90055TBU
49 90% 0.055 4+4 BB P90055BBU
50 90% 0.055 2 B P90055B2U
51 75% 0.08 4 B P75080B4U
52 75% 0.08 4+2+2 B+T P75080TBU
53 75% 0.08 4+4 BB P75080BBU
54 75% 0.08 2 B P75080B2U
55 60% 0.08 4 B P60080B4U
56 60% 0.08 4+2+2 B+T P60080TBU
57 60% 0.08 4+4 BB P60080BBU
58 60% 0.08 2 B P60080B2U
59 90% 0.08 4 B P90080B4U
60 90% 0.08 4+2+2 B+T P90080TBU
61 90% 0.08 4+4 BB P90080BBU
62 90% 0.08 2 B P90080B2U
63 75% 0.105 4 B P75105B4U
64 75% 0.105 4+2+2 B+T P75105TBU
65 75% 0.105 4+4 BB P75105BBU
66 75% 0.105 2 B P75105B2U
67 60% 0.105 4 B P60105B4U
68 60% 0.105 4+2+2 B+T P60105TBU
69 60% 0.105 4+4 BB P60105BBU
70 60% 0.105 2 B P60105B2U
71 90% 0.105 4 B P90105B4U
72 90% 0.105 4+2+2 B+T P90105TBU
73 90% 0.105 4+4 BB P90105BBU
74 90% 0.105 2 B P90105B2U

91
Table 5-5. W310 x 38.7 and W410 x 53 Parametric Study Table, Four-Point Loading
Parameter Beam Section CFRP L CFRP T Model Name
Test #
75 W310x38.7 0% 0 P00000000T
76 W310x38.7 60% 0.055 P60055B4T
77 W310x38.7 60% 0.08 P60080B4T
78 W310x38.7 60% 0.105 P60105B4T
79 W310x38.7 75% 0.055 P75055B4T
80 W310x38.7 75% 0.08 P75080B4T
81 W310x38.7 75% 0.105 P75105B4T
82 W310x38.7 90% 0.055 P90055B4T
83 W310x38.7 90% 0.08 P90080B4T
84 W310x38.7 90% 0.105 P90105B4T
85 W410x53 0% 0 P00000000T
86 W410x53 60% 0.055 P60055B4T
87 W410x53 60% 0.08 P60080B4T
88 W410x53 60% 0.105 P60105B4T
89 W410x53 75% 0.055 P75055B4T
90 W410x53 75% 0.08 P75080B4T
91 W410x53 75% 0.105 P75105B4T
92 W410x53 90% 0.055 P90055B4T
93 W410x53 90% 0.08 P90080B4T
94 W410x53 90% 0.105 P90105B4T
5.3 Results
Comparison of the FE models was achieved through the load-deflection curves. Deflection was
found at the midspan of the beam unless specified otherwise. Graphs are plotted for the main
parameters found. The control beam curves (beams without CFRP laminates) are plotted in each
graph to demonstrate the effectiveness of each parameter studied. Strength gain in both the
elastic and plastic phases is summarized by tables after each figure and later in the chapter. The
behavior of the beams was generally linear up to yielding point, becoming increasingly plastic
until the debonding limit of the CFRP laminate.
5.3.1 CFRP Configuration
Figure 5-1 compares five plots for W200 x 19.3 beams acted upon by four-point loading with
CFRP laminates covering 90% of the beams’ length with thicknesses of 1.40 mm (0.055 in). The
variable parameter was the laminate configurations. The control beam has the designation
V0000000T, indicating that the beam was tested experimentally in the structural lab. Beam
P90055B4T shows a significant increase in strength and displacement, hence is ductile in the
plastic phase. Beam P90055TBT shows similar strength, but less displacement, hence less
ductility. Beam P90055BBT shows less strength and ductility than the previous two beams.
Beam P90055B2T shows the least strength gain, but similar displacement / ductility to beam
P90055TBT. The laminate configuration is therefore a sensitive parameter, where the best
configuration is that presented in Figure 3-1.

92
Table 5-6 show the increase in the load capacity and deflection limits of the strengthened beams
at the elastic and ultimate loading points for W200 x 19.3 with CFRP 90% length and 1.40 mm
thickness. The tables also provide the ductility ratio for each beam. The last two columns
calculate the load gain at the elastic and ultimate loading points by comparing the strengthened
beam to the non-strengthened control beam.
Table 5-6. W200 x 19.3 with CFRP 90% Length and 1.40 mm Thickness – Four-Point Loading
Model Name Ductility ratio
Deflection Load Deflection Load Elastic Plastic
(mm) (kN) (mm) (kN)
V00000000T 27 103 0 119 0.0
P90055B4T 27 116 97 193 3.6 13% 62%
P90055TBT 27 124 60 187 2.2 20% 57%
P90055BBT 27 126 53 177 2.0 22% 48%
P90055B2T 27 109 62 145 2.3 6% 22%
Ultimate Load GainElastic
Figure 5-1 Beam W200 x 19.3 with CFRP 90% length and 1.40 mm thickness.
Figure 5-2 compares four plots of W200 x 19.3 beams acted upon by four-point loading with
CFRP laminates covering 60% of the beam length with laminate thicknesses of 2.00 mm, each
having a different CFRP laminate configuration. Beam P60080B4T shows an increase in
strength and displacement; hence it is ductile in the plastic phase. However, note that CFRP
0
20
40
60
80
100
120
140
160
180
200
0 20 40 60 80 100 120
Load
(kN
)
Midspan Deflection (mm)
V00000000T
P90055B4T
P90055TBT
P90055BBT
P90055B2T

93
debonding or rupture did not occur, which otherwise would result in a sudden drop in the load
deflection curve (as observed in other beams), indicating a typical plastic failure.
Table 5-7 shows the increase in the load capacity and deflection limits of the strengthened beams
at the elastic and ultimate loading points for W200 x 19.3 with CFRP 60% length and 2.00 mm
thickness. The tables also provide the ductility ratio for each beam. The last two columns
calculate the load gain at the elastic and ultimate loading points by comparing the strengthened
beam to the control non-strengthened beam.
Table 5-7. W200 x 19.3 with CFRP 60% Length and 2.00 mm Thickness – Four-Point Loading
Model Name Ductility ratio
Deflection Load Deflection Load Elastic Plastic
(mm) (kN) (mm) (kN)
P60080B4T 27 120 117 217 4.3 17% 82%
P60080TBT 27 128 59 180 2.2 24% 51%
P60080BBT 27 128 64 203 2.4 24% 71%
P60080B2T 27 110 66 157 2.4 7% 32%
Ultimate Load GainElastic
Figure 5-2. Beam W200 x 19.3 with CFRP 60% length and 2.00 mm thickness.
Figure 5-3 presents a finite element contour plot indicating a local failure of the beam just
outside of the laminate zone, concluding that the development length of the laminate did not
fully materialize. Beam P60080BBT shows less strength than beam P60080B4T, and less
0
20
40
60
80
100
120
140
160
180
200
220
240
0 20 40 60 80 100 120 140
Load
(kN
)
Midspan Deflection (mm)
P60080B4T
P60080B2T
P60080TBT
P60080BBT

94
displacement, hence less ductility. Beam P60080TBT has even less ductility, and Beam
P60080B2T even less. It is therefore concluded that laminate configuration is a sensitive
parameter even with different laminate dimensions.
Figure 5-3. Beam P60080B4T failure outside the CFRP reinforced zone.
Figure 5-4 compares four W200 x 19.3 beams with CFRP laminates covering 60% of the beam
length with a laminate thickness of 2.00 mm for different CFRP laminate configurations subject
to uniform-loading. Beam P60080B4U shows an increase in strength and displacement, hence is
ductile in the plastic phase, which is similar to P60080B4T (Figure 5-3). The load type did not
change the ductility of the failure behavior of the beam.
Table 5-8 shows the increase in the load capacity and deflection limits of the strengthened beams
at the elastic and ultimate loading points for W200 x 19.3 with CFRP 60% length and 2.00 mm
thickness. The tables also provide the ductility ratio for each beam. The last two columns
calculate the load gain at the elastic and ultimate loading points by comparing the strengthened
beam to the control non-strengthened beam.

95
Table 5-8. W200 x 19.3 with CFRP 60% Length and 2.00 mm Thickness – Uniform Loading
Model Name Ductility ratio
Deflection Load Deflection Load Elastic Plastic
(mm) (kN) (mm) (kN)
P60080B4U 27 33 112 64 4.1 8% 72%
P60080TBU 27 35 69 49 2.5 14% 32%
P60080BBU 27 35 80 63 3.0 14% 71%
P60080B2U 27 33 68 49 2.5 6% 31%
Ultimate Load GainElastic
Figure 5-4. Beam W200 x 19.3 with CFRP 60% length and 2.00 mm thickness.
Figure 5-5 compares four W200 x 19.3 beams with CFRP laminates covering 75% of the beam
length with a laminate thickness of 2.00 mm for different CFRP laminate configurations subject
to uniform-loading. The behavior of the beams is similar to behavior presented in the previous
graphs.
Table 5-9 shows the increase in the load capacity and deflection limits of the strengthened beams
at the elastic and ultimate loading points for W200 x 19.3 with CFRP 75% length and 2.00 mm
thickness. The tables also provide the ductility ratio for each beam. The last two columns
calculate the load gain at the elastic and ultimate loading points by comparing the strengthened
beam to the control non-strengthened beam.
0
5
10
15
20
25
30
35
40
45
50
55
60
65
70
0 20 40 60 80 100 120 140
Load
(kN
/m)
Midspan Deflection (mm)
P60080B4U
P60080B2U
P60080TBU
P60080BBU

96
Table 5-9. W200 x 19.3 with CFRP 75% Length and 2.00 mm Thickness – Uniform Loading
Model Name Ductility ratio
Deflection Load Deflection Load Elastic Plastic
(mm) (kN) (mm) (kN)
P75080B4U 27 33 109 68 4.0 8% 84%
P75080TBU 27 35 74 67 2.7 14% 81%
P75080BBU 27 35 67 63 2.5 14% 71%
P75080B2U 27 33 68 49 2.5 6% 31%
Ultimate Load GainElastic
Figure 5-5. Beam W200 x 19.3 with CFRP 75% length and 2.00 mm thickness.
5.3.2 CFRP Thickness
Figure 5-6 compares four plots of W310 x 38.7 beams subjected to four-point loading having
CFRP laminates covering 75% of the beam’s length. The varying parameter was the laminate
thickness, either 1.4 mm, 2.0 mm or 2.6 mm. The laminate configuration chosen for these beams
is “B4”, which denotes the presence of one laminate layer at the bottom face of the lower flange
having a width of 100 mm (4 in). Beam P0000000T represents the control beam with no CFRP
laminates reinforcing. Beam P75105B4T shows a significant increase in strength and
displacement, hence is ductile in the plastic phase. Beam P75080B4T show less strength, and
less displacement, and hence is less ductile. Beam P75055B4T has the least strength and
displacement, and so less ductility than the beams P75105B4T and P75080B4T. The conclusion
is that the laminate thickness is a sensitive parameter, where beam ductility increases as the
laminate thickness increases. Refer to Table 5-15 for tabular results.
0
5
10
15
20
25
30
35
40
45
50
55
60
65
70
0 20 40 60 80 100 120 140
Load
(kN
/m)
Midspan Deflection (mm)
P75080B4U
P75080B2U
P75080TBU
P75080BBU

97
Figure 5-6. Beam W310 x 38.7 with CFRP 75% length and variable thickness.
5.3.3 CFRP Length
Figure 5-7 compares four plots of W200 x 19.3 beams subjected to four-point loading having
CFRP laminates of 2.0 mm in thickness. The varying parameter was the laminate length, either
60%, 75% and 90%. The laminate configuration chosen for these beams is “B4”, which denotes
the presence of one laminate layer at the bottom face of the lower flange having a width of 100
mm (4 in). Beam V0000000T represents the control beam with no CFRP laminates reinforcing.
Beams P75080B4T and P90080B4T show a significant increase in strength and displacement,
and hence are ductile in the plastic phase. Beam P60080B4T show the same strength, but higher
displacement with a different mode of failure. The beam with 60% CFRP laminate length failed
outside the reinforced zone. The conclusion is that the laminate length is a sensitive parameter,
where the maximum moment zone of the beam needs to be covered. Other than covering the
maximum moment zone and adding sufficient debonding length, the CFRP laminate length
parameter was not effective, as can be seen by comparing the behavior of beams P75080B4T and
P90080B4T. Refer to Table 5-10 for tabular results.
0
40
80
120
160
200
240
280
320
360
400
440
480
0 40 80 120 160
Load
(kN
)
Midspan Deflection (mm)
P0000000T
P75055B4T
P75080B4T
P75105B4T
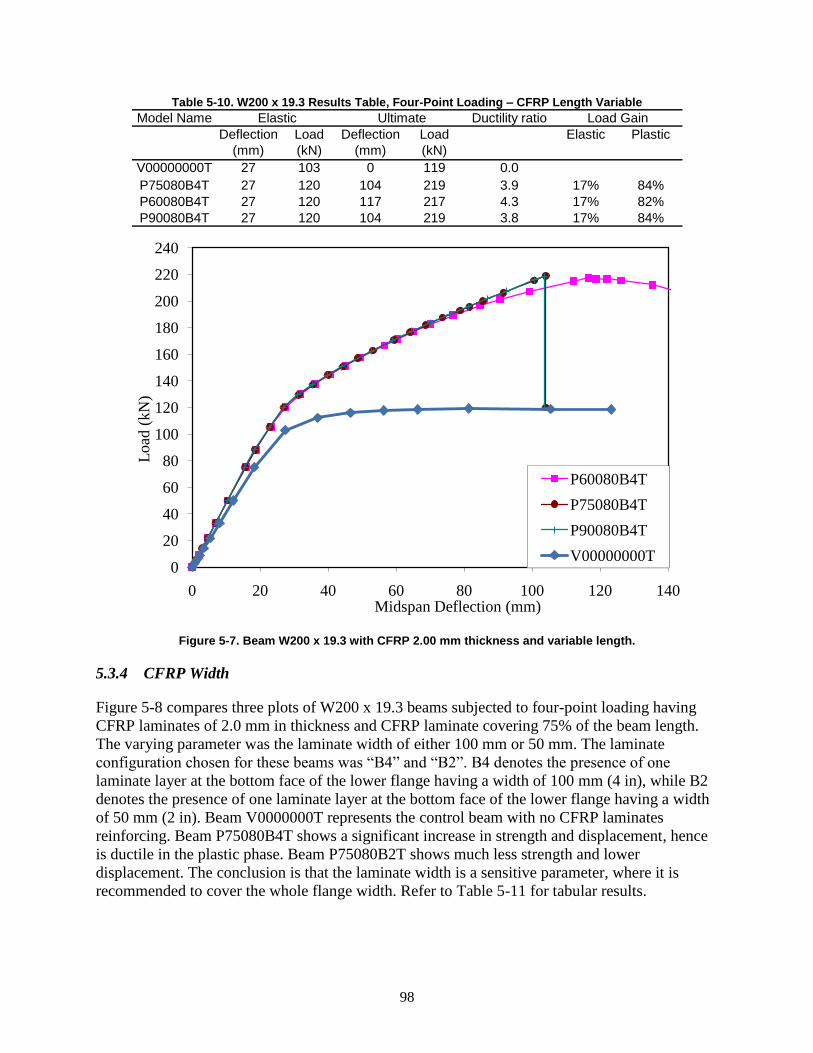
98
Table 5-10. W200 x 19.3 Results Table, Four-Point Loading – CFRP Length Variable
Model Name Ductility ratio
Deflection Load Deflection Load Elastic Plastic
(mm) (kN) (mm) (kN)
V00000000T 27 103 0 119 0.0
P75080B4T 27 120 104 219 3.9 17% 84%
P60080B4T 27 120 117 217 4.3 17% 82%
P90080B4T 27 120 104 219 3.8 17% 84%
Ultimate Load GainElastic
Figure 5-7. Beam W200 x 19.3 with CFRP 2.00 mm thickness and variable length.
5.3.4 CFRP Width
Figure 5-8 compares three plots of W200 x 19.3 beams subjected to four-point loading having
CFRP laminates of 2.0 mm in thickness and CFRP laminate covering 75% of the beam length.
The varying parameter was the laminate width of either 100 mm or 50 mm. The laminate
configuration chosen for these beams was “B4” and “B2”. B4 denotes the presence of one
laminate layer at the bottom face of the lower flange having a width of 100 mm (4 in), while B2
denotes the presence of one laminate layer at the bottom face of the lower flange having a width
of 50 mm (2 in). Beam V0000000T represents the control beam with no CFRP laminates
reinforcing. Beam P75080B4T shows a significant increase in strength and displacement, hence
is ductile in the plastic phase. Beam P75080B2T shows much less strength and lower
displacement. The conclusion is that the laminate width is a sensitive parameter, where it is
recommended to cover the whole flange width. Refer to Table 5-11 for tabular results.
0
20
40
60
80
100
120
140
160
180
200
220
240
0 20 40 60 80 100 120 140
Load
(kN
)
Midspan Deflection (mm)
P60080B4T
P75080B4T
P90080B4T
V00000000T

99
Table 5-11. W200 x 19.3 Results Table, Four-Point Loading – CFRP Width Variable
Model Name Ductility ratio
Deflection Load Deflection Load Elastic Plastic
(mm) (kN) (mm) (kN)
V00000000T 27 103 0 119 0.0
P75080B4T 27 120 104 219 3.9 17% 84%
P75080B2T 27 110 62 154 2.3 7% 29%
Ultimate Load GainElastic
Figure 5-8. Beam W200 x 19.3 with CFRP 75% Length with variable CFRP laminate width.
5.3.5 CFRP Manufacturer
Figure 5-9 compares four plots of W200 x 19.3 beams subjected to four-point loading with
CFRP laminates covering 75% of the beam’s length. The varying parameter was the CFRP
laminate manufacturer, either Fyfe, Epsilon, or Mitsubishi. The laminate configuration chosen
for these beams is “B4”, which denotes the presence of one laminate layer at the bottom face of
the lower flange having a width of 100 mm (4 in). Beam W200 x 19.3 reinforced with Fyfe
CFRP shows a significant increase in strength and displacement, hence is ductile in the plastic
phase. Beam W200 x 19.3 reinforced with Mitsubishi CFRP shows less strength but similar
stiffness and less displacement, hence is less ductile. Beam W200 x 19.3 reinforced with Epsilon
CFRP has the least strength and displacement / ductility than the other two beams. The
conclusion is that the laminate material properties are sensitive parameters, where beam ductility
increases as the ultimate laminate strength increases, and laminate stiffness decreases. Table 5-12
0
20
40
60
80
100
120
140
160
180
200
220
240
0 20 40 60 80 100 120 140
Load
(kN
)
Midspan Deflection (mm)
P75080B4T
P75080B2T
V00000000T

100
shows the change in stiffness in beam W200 x 19.3 stiffness rehabilitated by CFRP from
different manufacturers. Increasing the elastic modulus from 200 GPa to 460 GPa, a 130%
increase only increases the beam stiffness from 5.02 kN/mm to 5.48 kN/mm, a 9.2% increase.
This proves that the CFRP elastic modulus is a non-effective parameter within the elastic
modulus range of (155 GPa – 230 GPa). A slight increase in the overall beam stiffness was
noticed (9.2 %) when the elastic modulus was increased to more than double the original value.
Table 5-12. W200 x 19.3 Beam Stiffness Comparison with CFRP from Different Manufacturers
(Fyfe, 2006) Mitsubishi Epsilon
Tensile modulus, E 155 GPa 229 GPa 460 GPa
Tensile strength, fu 2790 MPa 1220 MPa 1530 MPa
Beam Stiffness, kN/mm 5.02 5.02 5.48
Laminate thickness (mm) 1.40-2.00 3.20 2.90-4.00
Figure 5-9. Beam W200 x 19.3 with CFRP 75% length from different manufacturers.
5.3.6 CFRP Elastic Modulus
Three models were executed to test the effectiveness of the CFRP elastic modulus on the
behavior of the modeled beam. Figure 5-10 shows the load deflection curves of the modeled
0
20
40
60
80
100
120
140
160
180
200
220
240
260
0 20 40 60 80 100 120
Load
(kN
)
Midspan Deflection (mm)
W200x19.3 FYFE
W200x19.3 MITSUBISHI
W200x19.3 EPSILON
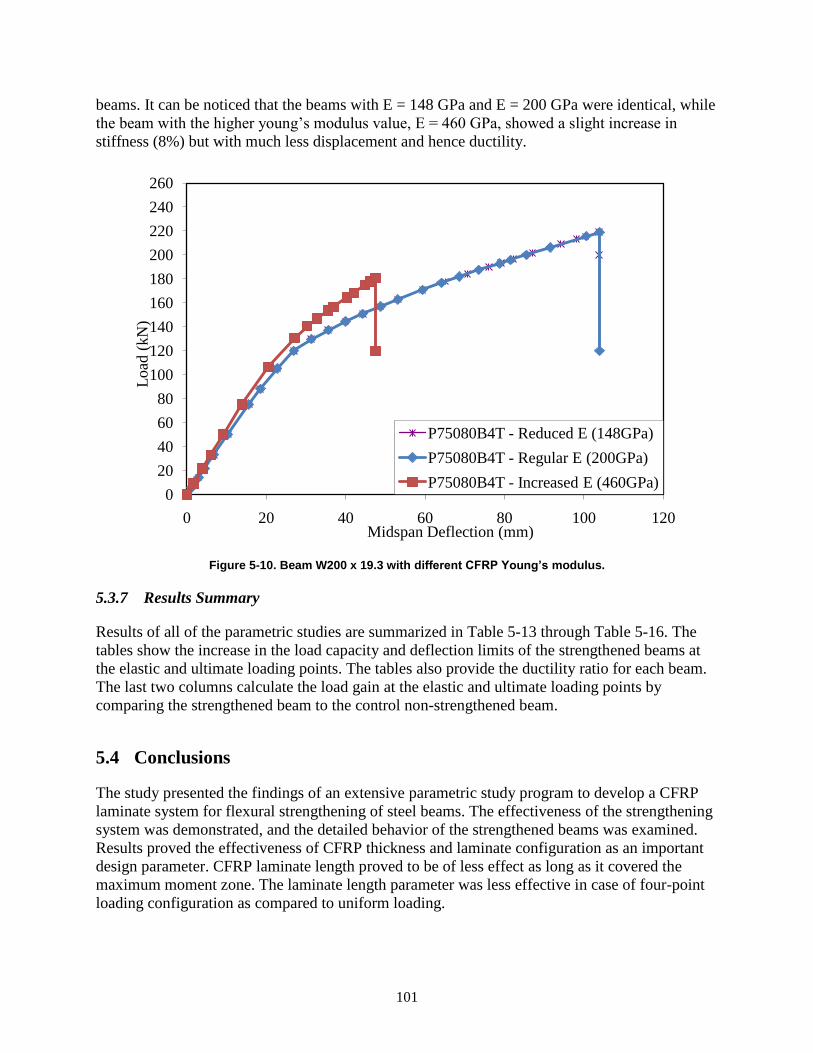
101
beams. It can be noticed that the beams with E = 148 GPa and E = 200 GPa were identical, while
the beam with the higher young’s modulus value, E = 460 GPa, showed a slight increase in
stiffness (8%) but with much less displacement and hence ductility.
Figure 5-10. Beam W200 x 19.3 with different CFRP Young’s modulus.
5.3.7 Results Summary
Results of all of the parametric studies are summarized in Table 5-13 through Table 5-16. The
tables show the increase in the load capacity and deflection limits of the strengthened beams at
the elastic and ultimate loading points. The tables also provide the ductility ratio for each beam.
The last two columns calculate the load gain at the elastic and ultimate loading points by
comparing the strengthened beam to the control non-strengthened beam.
5.4 Conclusions
The study presented the findings of an extensive parametric study program to develop a CFRP
laminate system for flexural strengthening of steel beams. The effectiveness of the strengthening
system was demonstrated, and the detailed behavior of the strengthened beams was examined.
Results proved the effectiveness of CFRP thickness and laminate configuration as an important
design parameter. CFRP laminate length proved to be of less effect as long as it covered the
maximum moment zone. The laminate length parameter was less effective in case of four-point
loading configuration as compared to uniform loading.
0
20
40
60
80
100
120
140
160
180
200
220
240
260
0 20 40 60 80 100 120
Load
(kN
)
Midspan Deflection (mm)
P75080B4T - Reduced E (148GPa)
P75080B4T - Regular E (200GPa)
P75080B4T - Increased E (460GPa)
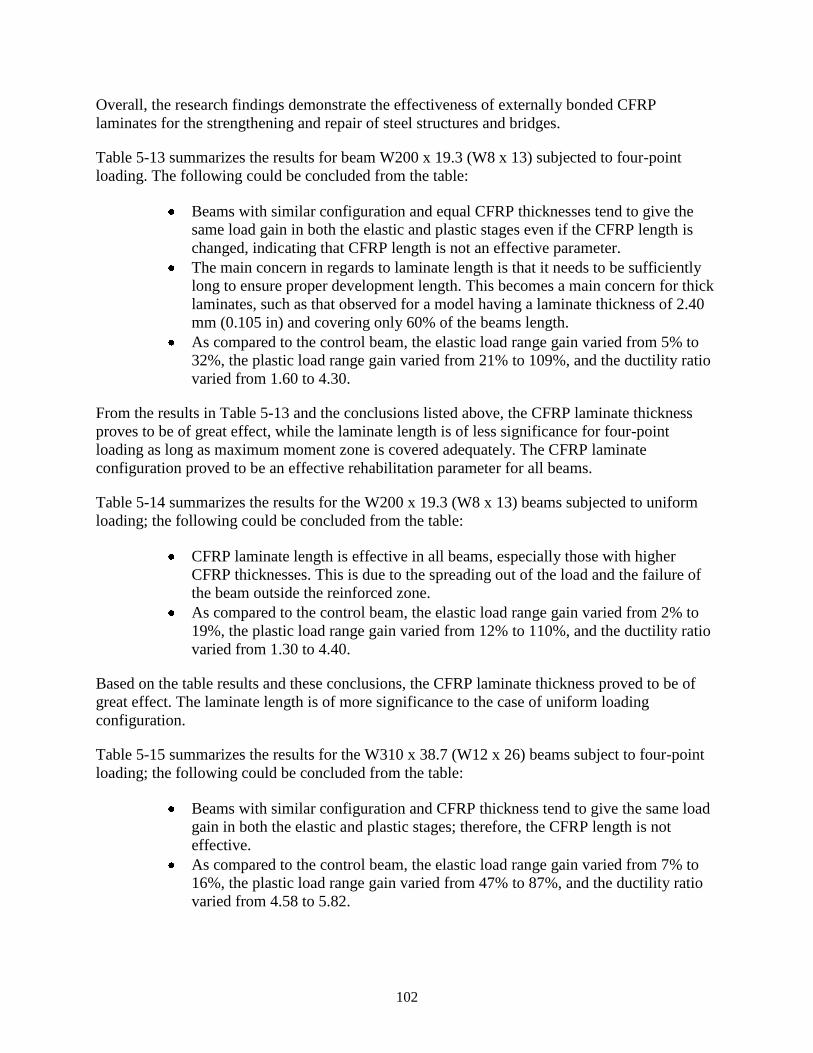
102
Overall, the research findings demonstrate the effectiveness of externally bonded CFRP
laminates for the strengthening and repair of steel structures and bridges.
Table 5-13 summarizes the results for beam W200 x 19.3 (W8 x 13) subjected to four-point
loading. The following could be concluded from the table:
Beams with similar configuration and equal CFRP thicknesses tend to give the
same load gain in both the elastic and plastic stages even if the CFRP length is
changed, indicating that CFRP length is not an effective parameter.
The main concern in regards to laminate length is that it needs to be sufficiently
long to ensure proper development length. This becomes a main concern for thick
laminates, such as that observed for a model having a laminate thickness of 2.40
mm (0.105 in) and covering only 60% of the beams length.
As compared to the control beam, the elastic load range gain varied from 5% to
32%, the plastic load range gain varied from 21% to 109%, and the ductility ratio
varied from 1.60 to 4.30.
From the results in Table 5-13 and the conclusions listed above, the CFRP laminate thickness
proves to be of great effect, while the laminate length is of less significance for four-point
loading as long as maximum moment zone is covered adequately. The CFRP laminate
configuration proved to be an effective rehabilitation parameter for all beams.
Table 5-14 summarizes the results for the W200 x 19.3 (W8 x 13) beams subjected to uniform
loading; the following could be concluded from the table:
CFRP laminate length is effective in all beams, especially those with higher
CFRP thicknesses. This is due to the spreading out of the load and the failure of
the beam outside the reinforced zone.
As compared to the control beam, the elastic load range gain varied from 2% to
19%, the plastic load range gain varied from 12% to 110%, and the ductility ratio
varied from 1.30 to 4.40.
Based on the table results and these conclusions, the CFRP laminate thickness proved to be of
great effect. The laminate length is of more significance to the case of uniform loading
configuration.
Table 5-15 summarizes the results for the W310 x 38.7 (W12 x 26) beams subject to four-point
loading; the following could be concluded from the table:
Beams with similar configuration and CFRP thickness tend to give the same load
gain in both the elastic and plastic stages; therefore, the CFRP length is not
effective.
As compared to the control beam, the elastic load range gain varied from 7% to
16%, the plastic load range gain varied from 47% to 87%, and the ductility ratio
varied from 4.58 to 5.82.

103
From the table results and these conclusions, the CFRP laminate thickness proves to be of great
effect, while the laminate length is of less significance in the case of four-point loading.
Table 5-16 summarizes the results for the W410 x 53 (W16 x 36) beams subject to four-point
loading. The following could be concluded from the table:
Beams with similar configuration and CFRP thickness tend to give the same load
gain in both the elastic and plastic stages; therefore, the CFRP length is not
effective.
As compared to the control beam, the elastic load range gain varied from 3.5% to
10.5%, the plastic load range gain varied from 37% to 70%, and the ductility ratio
varied from 3.55 to 4.11.
From the results in Table 5-15 and Table 5-16 and from these conclusions, the CFRP laminate
thickness proves to be of great effect, while the laminate length is of less significance to the case
of four-point loading configuration. Results prove that the rehabilitation technique is effective
for deeper beams.

104
Table 5-13. W200 x 19.3 Results Table, Four-Point Loading
Model Name Ductility ratio
Deflection Load Deflection Load Elastic Plastic
(mm) (kN) (mm) (kN)
V00000000T 27 103 0 119 0.0
V75055B4T 27 116 97 193 3.6 13% 62%
V75055TBT 27 124 60 187 2.2 20% 57%
V75055BBT 27 126 54 177 2.0 22% 48%
V75055B2T 27 109 62 145 2.3 6% 22%
P60055B4T 27 116 97 189 3.6 13% 58%
P60055TBT 27 124 51 168 1.9 20% 41%
P60055BBT 27 124 54 177 2.0 20% 48%
P60055B2T 27 109 62 145 2.3 6% 22%
P90055B4T 27 116 97 189 3.6 13% 58%
P90055TBT 27 124 60 187 2.2 20% 57%
P90055BBT 27 124 53 177 2.0 20% 48%
P90055B2T 27 109 62 145 2.3 6% 22%
P75080B4T 27 120 104 219 3.9 17% 84%
P75080TBT 27 128 55 181 2.0 24% 52%
P75080BBT 27 128 60 204 2.2 24% 71%
P75080B2T 27 110 62 154 2.3 7% 29%
P60080B4T 27 120 117 217 4.3 17% 82%
P60080TBT 27 128 59 180 2.2 24% 51%
P60080BBT 27 128 64 203 2.4 24% 71%
P60080B2T 27 110 66 157 2.4 7% 32%
P90080B4T 27 120 104 219 3.8 17% 84%
P90080TBT 27 128 59 203 2.2 24% 70%
P90080BBT 27 128 59 203 2.2 24% 70%
P90080B2T 27 110 64 155 2.4 7% 30%
P75105B4T 27 125 111 249 4.1 21% 109%
P75105TBT 27 136 44 177 1.6 32% 49%
P75105BBT 27 136 53 187 2.0 32% 57%
P75105B2T 27 117 68 169 2.5 14% 41%
P60105B4T 27 125 109 217 4.0 21% 82%
P60105TBT 27 136 54 182 2.0 32% 52%
P60105BBT 27 136 43 179 1.6 32% 50%
P60105B2T 27 117 69 168 2.5 14% 41%
P90105B4T 27 125 111 249 4.1 21% 109%
P90105TBT 27 136 56 210 2.1 32% 76%
P90105BBT 27 136 64 230 2.4 32% 93%
P90105B2T 27 117 68 169 2.5 14% 41%
Ultimate Load GainElastic

105
Table 5-14. W200 x 19.3 Results Table, Uniform Loading
Model Name Ductility ratio
Deflection Load Deflection Load Elastic Plastic
(mm) (kN) (mm) (kN)
P0000000U 27 31 0 37 0.0
P75055B4U 27 33 99 59 3.7 6% 59%
P75055TBU 27 34 66 58 2.5 9% 57%
P75055BBU 27 34 60 55 2.2 9% 48%
P75055B2U 27 31 63 45 2.3 2% 21%
P60055B4U 27 33 102 59 3.8 6% 59%
P60055TBU 27 34 70 58 2.6 9% 56%
P60055BBU 27 34 61 55 2.3 9% 48%
P60055B2U 27 31 62 45 2.3 2% 20%
P90055B4U 27 33 99 59 3.7 6% 59%
P90055TBU 27 34 47 48 1.7 9% 30%
P90055BBU 27 34 36 42 1.3 9% 12%
P90055B2U 27 31 63 45 2.3 2% 21%
P75080B4U 27 33 109 68 4.0 8% 84%
P75080TBU 27 35 74 67 2.7 14% 81%
P75080BBU 27 35 67 63 2.5 14% 71%
P75080B2U 27 33 68 49 2.5 6% 31%
P60080B4U 27 33 112 64 4.1 8% 72%
P60080TBU 27 35 69 49 2.5 14% 32%
P60080BBU 27 35 80 63 3.0 14% 71%
P60080B2U 27 33 68 49 2.5 6% 31%
P90080B4U 27 33 109 69 4.0 8% 85%
P90080TBU 27 35 74 67 2.7 14% 81%
P90080BBU 27 35 66 63 2.5 14% 70%
P90080B2U 27 33 67 49 2.5 6% 31%
P75105B4U 27 34 118 78 4.4 11% 110%
P75105TBU 27 37 81 76 3.0 19% 105%
P75105BBU 27 37 74 72 2.7 19% 94%
P75105B2U 27 32 72 52 2.7 4% 41%
P60105B4U 27 34 102 64 3.8 11% 72%
P60105TBU 27 37 80 64 3.0 19% 74%
P60105BBU 27 37 80 64 3.0 19% 74%
P60105B2U 27 32 73 52 2.7 4% 41%
P90105B4U 27 34 95 69 3.5 11% 85%
P90105TBU 27 37 80 76 3.0 19% 105%
P90105BBU 27 37 73 72 2.7 19% 94%
P90105B2U 27 32 71 52 2.6 4% 41%
Ultimate Load GainElastic

106
Table 5-15. W310 x 38.7 Results Table, Four-Point Loading
Model Name Ductility ratio
Deflection Load Deflection Load Elastic Plastic
(mm) (kN) (mm) (kN)
P00000000T 32 167 0 242 0.0
P60055B4T 32 180 145 356 4.6 8% 47%
P60080B4T 32 185 158 405 5.0 10% 67%
P60105B4T 32 190 185 446 5.8 13% 84%
P75055B4T 32 184 145 357 4.6 10% 47%
P75080B4T 32 189 155 405 4.9 13% 67%
P75105B4T 32 194 164 452 5.2 16% 87%
P90055B4T 32 187 144 356 4.6 12% 47%
P90080B4T 32 191 154 404 4.8 14% 67%
P90105B4T 32 194 164 453 5.2 16% 87%
Elastic Ultimate Load Gain
Table 5-16. W410 x 53 Results Table, Four-Point Loading
Model Name Ductility ratio
Deflection Load Deflection Load Elastic Plastic
(mm) (kN) (mm) (kN)
P00000000T 50 270 0 324 0.0
P60055B4T 50 282 181 447 3.6 5% 38%
P60080B4T 50 287 193 499 3.8 6% 54%
P60105B4T 50 290 208 551 4.1 8% 70%
P75055B4T 50 280 180 447 3.6 4% 38%
P75080B4T 50 290 191 499 3.8 8% 54%
P75105B4T 50 298 202 551 4.0 11% 70%
P90055B4T 50 280 179 447 3.6 4% 38%
P90080B4T 50 290 191 499 3.8 8% 54%
P90105B4T 50 298 202 551 4.0 11% 70%
Elastic Ultimate Load Gain
5.5 Recommendations
Based on the parametric study, the following recommendation should be considered while
strengthening steel beams using CFRP laminates:
The CFRP laminate length should cover at least 75% of the beam length.
Other modes of failure should always be checked.
The best CFRP configuration is the configuration covering the bottom face of the
bottom flange.
CFRP thickness is an effective parameter, and shall be chosen according to the
designers’ required strength.
CFRP Young’s modulus is not a very effective parameter.
CFRP ultimate strength is much more effective.

107
Section 6
6.0 Bridge Design Rehabilitation Guidelines
6.1 Background
The wide range of uses of CFRP in infrastructures such as bridges was discussed in the previous
chapters, as well as the experimental testing and FE analysis. This chapter presents the utilization
of CFRP plates to strengthen steel girders for bridges through an analytical approach. It should
be noted that CFRP laminates was not installed onto bridges.
6.2 Scope
FE models were developed for a typical steel bridge. The FE model would then include the
CFRP laminates to predict the behavior of the bridge after strengthening. The bridge was a steel
girder bridge topped by a reinforced concrete deck slab.
6.3 Finite Element Bridge Modeling
A steel girder bridge model was built using the SAP 2000 FE package. The model’s details, in
terms of structural properties, material properties, and loading data, will be introduced in the
following sections.
6.3.1 Bridge Description
The bridge is a steel girder bridge topped by a reinforced concrete deck slab. The bridge has four
lanes with a total ADT of 31,980 and a truck percentage of 17%. The bridge has three simply
supported spans with a total bridge length of 52.6 m. The bridge has no skew angle with the
abutments or piers.
6.3.2 Bridge Modeling
A FE model was built to simulate the behavior of the bridge. Grillage analysis was the basis of
the FE model; frame elements were used to model both the girders and the slab. The deck was
virtually modeled as a grid of longitudinal and transverse beams. The grillage simulates the
bridge closely by having the frame members coincide with the center lines of the girders.
Diaphragms are represented by transverse elements that coincide with the midspan of the slab;
otherwise, transverse elements are equally spaced throughout the bridge length with spacing of
one-quarter to one-eighths of the effective span length. These specifications for grillage analysis
and behavior follow the guidelines set by Hambly in his book “Bridge Deck Behavior” (Hambly,
1976).
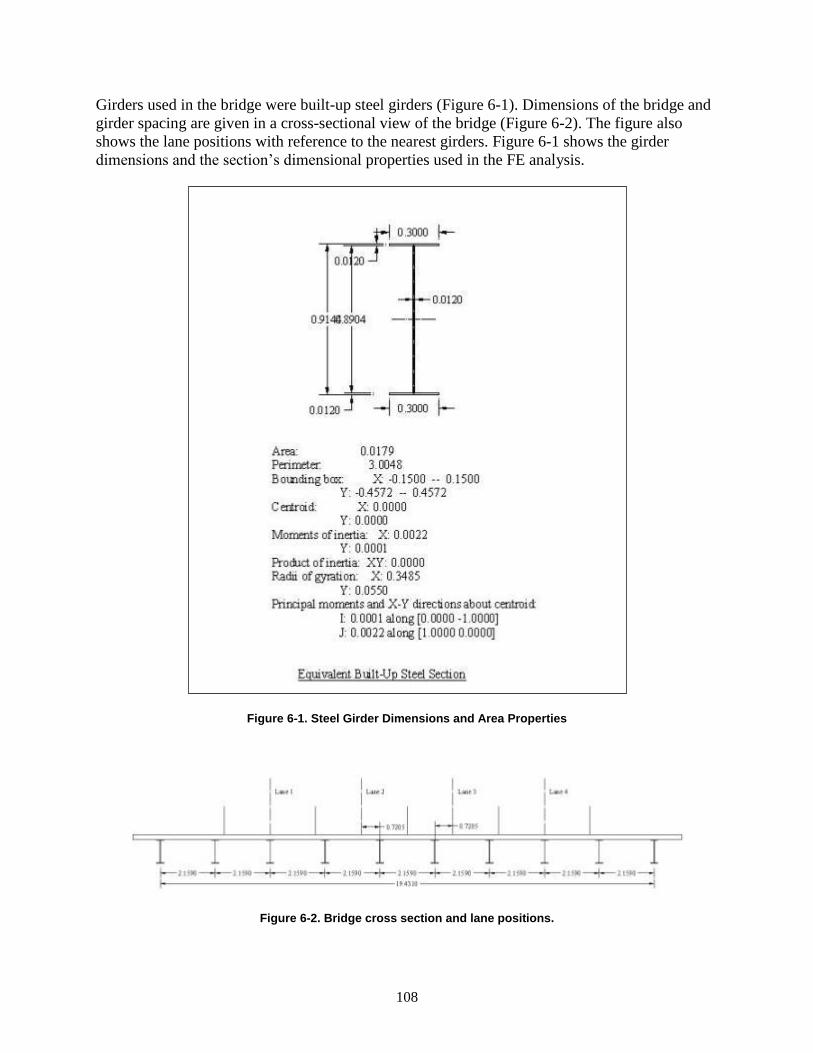
108
Girders used in the bridge were built-up steel girders (Figure 6-1). Dimensions of the bridge and
girder spacing are given in a cross-sectional view of the bridge (Figure 6-2). The figure also
shows the lane positions with reference to the nearest girders. Figure 6-1 shows the girder
dimensions and the section’s dimensional properties used in the FE analysis.
Figure 6-1. Steel Girder Dimensions and Area Properties
Figure 6-2. Bridge cross section and lane positions.

109
Figure 6-3 displays the gross composite section properties of the girder with the overlaying slab.
The slab width used in the analysis was obtained according to the AASHTO code criteria (1998).
The flexural moment of inertia of each grillage member is calculated about the centroid of the
section it represents. The section properties of transverse grillage members represents only the
slab, except for the mid-transverse grillage members, which represent the diaphragm in addition
to the slab.
Figure 6-3. Composite section dimensions and area properties.
FE using SAP2000 analysis (SAP 2000, 2008) directly provides moment values as part of the
results output. The moment readings will be the comparison basis for the bridge before and after
strengthening with CFRP. Another strain comparison was also provided. The moment to strain
conversion was used to convert the SAP 2000 moment readings to strain. The moment to strain
equation used was

110
6.3.3 Bridge Loading
Ten auxiliary trucks were used for loading the bridge model. Table 6-1 shows the data for the 10
trucks analyzed, including the number of axles and the static weight for each truck.
Table 6-1. Truck Loading Data
Truck Number of Axles Lane Gross weight (kN)
1 5 2 335.1
2 5 3 359.6
3 5 3 351.4
4 5 2 356.1
5 5 3 336.0
6 6 1 321.2
7 5 3 334.7
8 5 3 341.8
9 5 2 344.5
10 5 1 299.3
6.3.4 Utilizing the FE Model to Evaluate Rehabilitation using CFRP
The FE model is then used to apply CFRP laminates on the bridge girders. Strain values were
expected to drop, as seen in Figure 6-4 to Figure 6-13 showing the strain reduction obtained from
the FE analysis due to applying CFRP to the bridge girders. The FE model can be applied on
steel bridge girders or prestressed concrete girders.

111
Figure 6-4. Strain reduction after rehabilitation with CFRP – Truck 1.
Figure 6-5. Strain reduction after rehabilitation with CFRP – Truck 2.
0.00000
0.00002
0.00004
0.00006
0.00008
0.00010
0.00012
1 2 3 4 5 6 7 8 9 10
Str
ain (
m/m
)
Girder Number
With CFRP Truck1
NO CFRP Truck1
0.00000
0.00002
0.00004
0.00006
0.00008
0.00010
0.00012
1 2 3 4 5 6 7 8 9 10
Str
ain (
m/m
)
Girder Number
With CFRP Truck 2
NO CFRP Truck 2

112
Figure 6-6. Strain reduction after rehabilitation with CFRP – Truck 3.
Figure 6-7. Strain reduction after rehabilitation with CFRP – Truck 4.
0.00000
0.00002
0.00004
0.00006
0.00008
0.00010
0.00012
1 2 3 4 5 6 7 8 9 10
Str
ain (
m/m
)
Girder Number
With CFRP Truck 3
NO CFRP Truck 3
0.00000
0.00002
0.00004
0.00006
0.00008
0.00010
0.00012
1 2 3 4 5 6 7 8 9 10
Str
ain (
m/m
)
Girder Number
With CFRP Truck 4
NO CFRP Truck 4

113
Figure 6-8. Strain reduction after rehabilitation with CFRP – Truck 5.
Figure 6-9. Strain reduction after rehabilitation with CFRP – Truck 6.
0.00000
0.00002
0.00004
0.00006
0.00008
0.00010
0.00012
1 2 3 4 5 6 7 8 9 10
Str
ain (
m/m
)
Girder Number
With CFRP Truck 5
NO CFRP Truck 5
0.00000
0.00002
0.00004
0.00006
0.00008
0.00010
0.00012
1 2 3 4 5 6 7 8 9 10
Str
ain (
m/m
)
Girder Number
With CFRP Truck 6
NO CFRP Truck 6
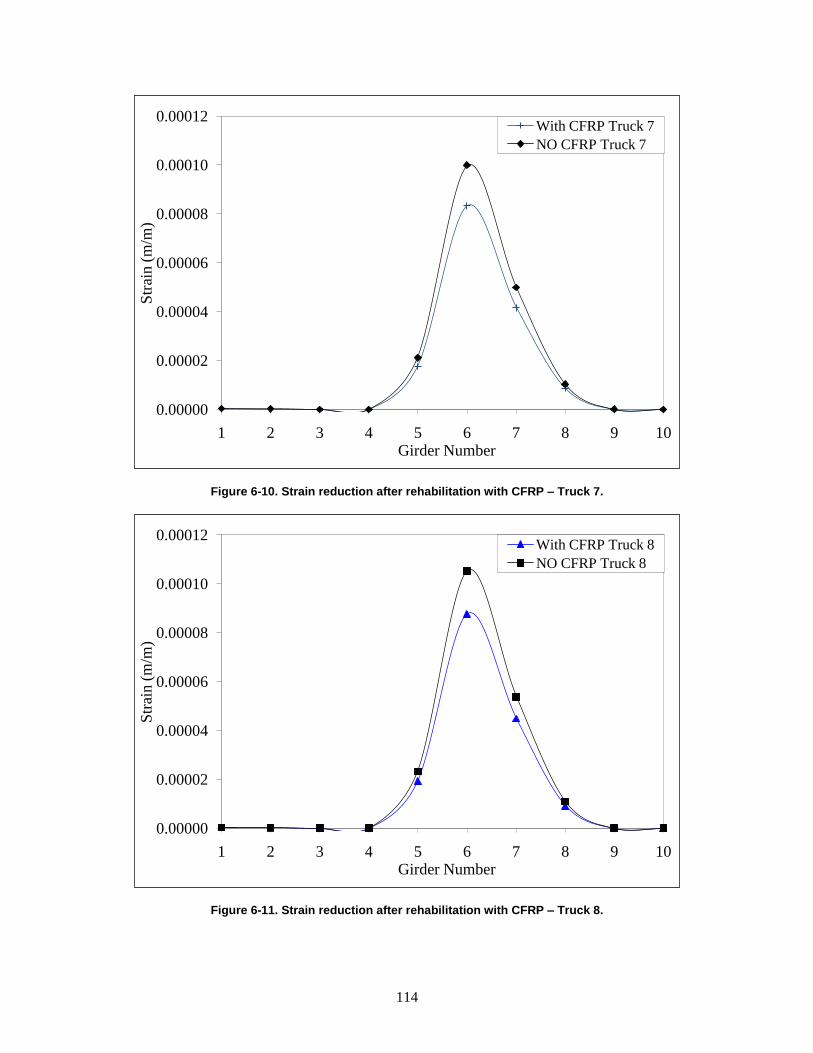
114
Figure 6-10. Strain reduction after rehabilitation with CFRP – Truck 7.
Figure 6-11. Strain reduction after rehabilitation with CFRP – Truck 8.
0.00000
0.00002
0.00004
0.00006
0.00008
0.00010
0.00012
1 2 3 4 5 6 7 8 9 10
Str
ain (
m/m
)
Girder Number
With CFRP Truck 7
NO CFRP Truck 7
0.00000
0.00002
0.00004
0.00006
0.00008
0.00010
0.00012
1 2 3 4 5 6 7 8 9 10
Str
ain (
m/m
)
Girder Number
With CFRP Truck 8
NO CFRP Truck 8
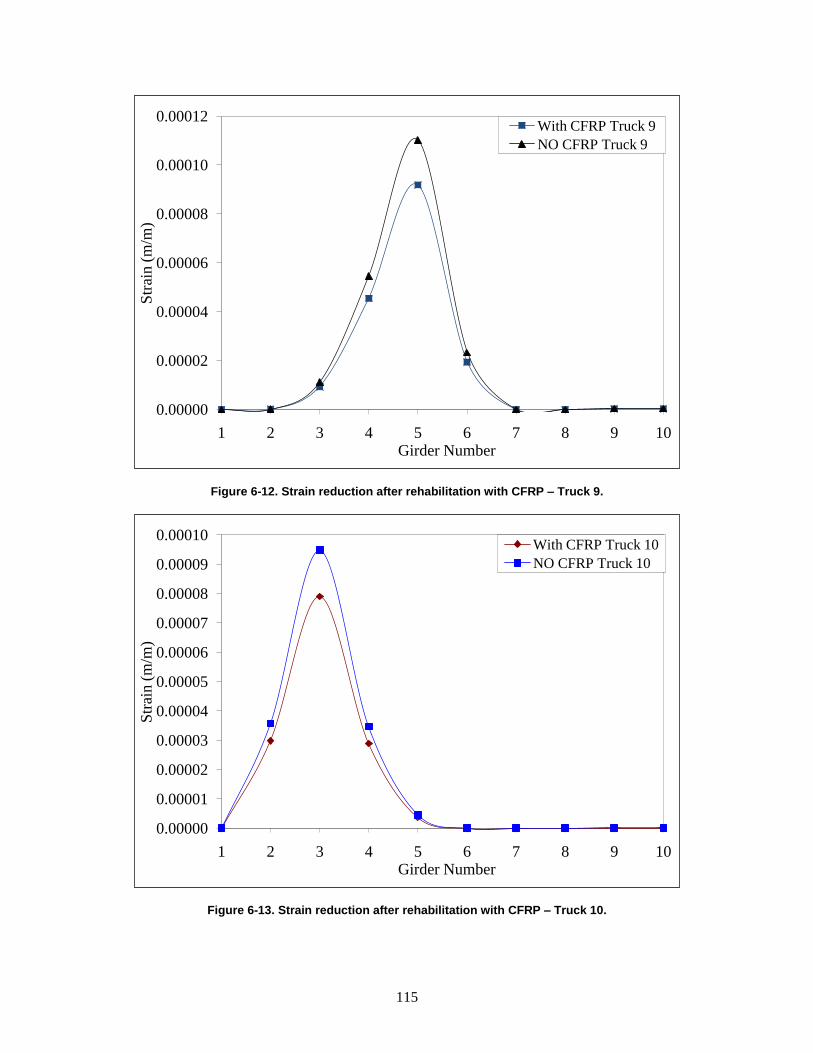
115
Figure 6-12. Strain reduction after rehabilitation with CFRP – Truck 9.
Figure 6-13. Strain reduction after rehabilitation with CFRP – Truck 10.
0.00000
0.00002
0.00004
0.00006
0.00008
0.00010
0.00012
1 2 3 4 5 6 7 8 9 10
Str
ain (
m/m
)
Girder Number
With CFRP Truck 9
NO CFRP Truck 9
0.00000
0.00001
0.00002
0.00003
0.00004
0.00005
0.00006
0.00007
0.00008
0.00009
0.00010
1 2 3 4 5 6 7 8 9 10
Str
ain (
m/m
)
Girder Number
With CFRP Truck 10
NO CFRP Truck 10

116
Using the same FE model, truck loading was then increased with the aim of reaching the same
stress level in steel before rehabilitation. Models were executed once again, and moment values
were extracted for all girders and displayed in Figure 6-14 to Figure 6-23. Moments from the
original truck loading are also shown in the figures for comparison. The moment increase was
found to average 20%, which in turn increased the posting load limit by 20%.
Figure 6-14. Moment increase after rehabilitation with CFRP – Truck 1.
0
40
80
120
160
200
240
280
320
1 2 3 4 5 6 7 8 9 10
Mom
ent
(kN
.m)
Girder Number
CFRP Truck 1No CFRP Truck 1

117
Figure 6-15. Moment increase after rehabilitation with CFRP – Truck 2.
Figure 6-16. Moment increase after rehabilitation with CFRP – Truck 3.
0
40
80
120
160
200
240
280
320
1 2 3 4 5 6 7 8 9 10
Mom
ent
(kN
.m)
Girder Number
CFRP Truck 2No CFRP Truck 2
0
40
80
120
160
200
240
280
320
1 2 3 4 5 6 7 8 9 10
Mom
ent
(kN
.m)
Girder Number
CFRP Truck 3No CFRP Truck 3

118
Figure 6-17. Moment increase after rehabilitation with CFRP – Truck 4.
Figure 6-18. Moment increase after rehabilitation with CFRP – Truck 5.
0
40
80
120
160
200
240
280
320
1 2 3 4 5 6 7 8 9 10
Mo
men
t (k
N.m
)
Girder Number
CFRP Truck 4No CFRP Truck 4
0
40
80
120
160
200
240
280
320
1 2 3 4 5 6 7 8 9 10
Mom
ent
(kN
.m)
Girder Number
CFRP Truck 5No CFRP Truck 5

119
Figure 6-19. Moment increase after rehabilitation with CFRP – Truck 6.
Figure 6-20. Moment increase after rehabilitation with CFRP – Truck 7.
0
40
80
120
160
200
240
280
320
1 2 3 4 5 6 7 8 9 10
Mom
ent
(kN
.m)
Girder Number
CFRP Truck 6No CFRP Truck 6
0
40
80
120
160
200
240
280
320
1 2 3 4 5 6 7 8 9 10
Mom
ent
(kN
.m)
Girder Number
CFRP Truck 7No CFRP Truck 7

120
Figure 6-21. Moment increase after rehabilitation with CFRP – Truck 8.
Figure 6-22. Moment increase after rehabilitation with CFRP – Truck 9.
0
40
80
120
160
200
240
280
320
1 2 3 4 5 6 7 8 9 10
Mom
ent
(kN
.m)
Girder Number
CFRP Truck 8No CFRP Truck 8
0
40
80
120
160
200
240
280
320
1 2 3 4 5 6 7 8 9 10
Mom
ent
(kN
.m)
Girder Number
CFRP Truck 9No CFRP Truck 9

121
Figure 6-23. Moment increase after rehabilitation with CFRP – Truck 10.
6.4 Steel Bridge Girder – Solved Example
This section presents a design example of a steel girder bridge strengthened using CFRP
laminates. Recommendations for the bridge design engineer will then be summarized. All the
calculations are based on AASHTO LRFD bridge design specifications (1998). Equations and
design limits used in this section are those implemented in the design Excel spreadsheet
presented previously in Chapter 5.
First, a steel bridge will be designed without CFRP laminates. The same bridge would then be
analyzed after being strengthened using CFRP. This example would show the significant
increase to the load-carrying capacity of the bridge due to this technique. A complete design
check was performed to ensure the bridge enhanced safety after rehabilitation.
The bridge designed is a simple-span composite rolled-steel-beam bridge shown in Figure 6-24
and Figure 6-25 with 10.5 m span. The design live load applied was HL-93. Roadway width is
13,420 mm from curb to curb, and the future top wearing surface is 75 mm thick bituminous
overlay. The concrete strength, fc’, is 30 MPa, the steel reinforcement is M270 of grade Gr250.
6.4.1 Develop General Section
The bridge is to carry interstate traffic over a normally small stream that is subject to high water
flows during the rainy season.
0
40
80
120
160
200
240
280
320
1 2 3 4 5 6 7 8 9 10
Mom
ent
(kN
.m)
Girder Number
CFRP Truck 10No CFRP Truck 10

122
6.4.2 Develop Typical Section and Design Basis
6.4.2.1 I-Girder [A6.10.1]
Design flexural members for:
Strength limit state;
Service limit state;
Fatigue and fracture limit state for details;
Fatigue requirements for web;
Constructability;
Member proportions of flexural components:
Figure 6-24. Bridge example – bridge cross section.
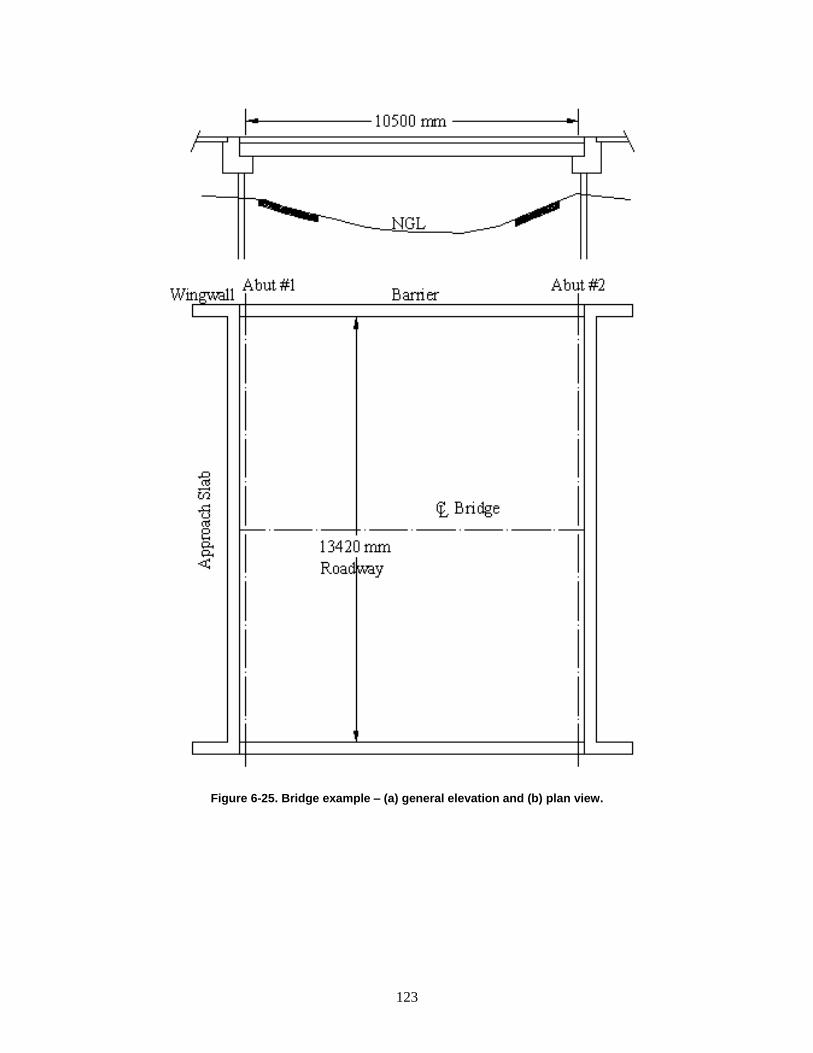
123
Figure 6-25. Bridge example – (a) general elevation and (b) plan view.

124
6.4.2.2 Elastic Analysis or Inelastic Analysis [A6.10.2.2]
Elastic analysis will be performed. The span is simply supported, thus moment redistribution is
not used.
6.4.2.3 Homogeneous or Hybrid [A6.10.5.4]
Rolled beams are homogeneous (the flanges and web are the same material and strength). For
homogeneous sections, the hybrid factor, Rh, shall be taken as 1.0. For compression flanges, if
either a longitudinal stiffener is provided or the following equation is satisfied, then the load
shedding factor Rb shall be taken as 1.0.
Otherwise,
For which
For tension flanges, Rb shall be taken as 1.0.
6.4.3 Design Conventionally Reinforced Concrete Deck
The deck design will not be included in this design as it has no influence on the rehabilitation of
steel girders using CFRP.
6.4.4 Select Resistance Factors
Strength Limit state Φ [A6.5.4.2]
Flexure 1.00
Shear 1.00

125
Non-strength limit states 1.00 [A1.3.2.1]
6.4.5 Select Load Modifiers
Load modifiers are summarized in Table 6-2 with references to AASHTO.
Table 6-2. LRFD Load Modifiers
Strength Service Fatigue
Ductility, ηD [A1.3.3] 0.95 1.0 1.0 Redundancy, ηR [A1.3.4] 0.95 1.0 1.0 Importance, ηI [A1.3.5] 1.05 N/A N/A
η= ηD ηR ηI [A1.3.2.1] 0.95 1.0 1.0
6.4.6 Select Applicable Load Combinations
Strength I Limit State
Service I Limit State
Fatigue and Fracture Limit State
6.4.7 Calculate Live Load Force Effects [A3.6.1.1.1]
Select number of lanes: [A3.6.1.1.1]
Multiple presence factor: (Table 4.6) [A3.6.1.1.2]. Refer to Table 6-3.
Table 6-3. Multiple Presence Factors
No. of loaded lanes m
1 1.20 2 1.00 3 0.85

126
Dynamic load allowance: (Table 4.7) [A3.6.2.1]. Refer to Table 6-4.
Table 6-4. Dynamic Load Allowance Factors
Component IM (%)
Deck joints 75 Fatigue 15 All other 33
Distribution factors for moment: [A4.6.2.2.2] Cross-section type (a) (Table 2.2), S = 2440 mm, L
= 10500 mm. assume for preliminary design,
Interior beams (Table 6.5) [Table A4.6.2.2.2b-1]. One design lane loaded:
Two design lanes loaded:
The two design lanes loaded governs.
Exterior beams (Table 6.5) [Table A4.6.2.2.2d-1]. One design lane loaded – lever rule. Refer to
Figure 6-26.
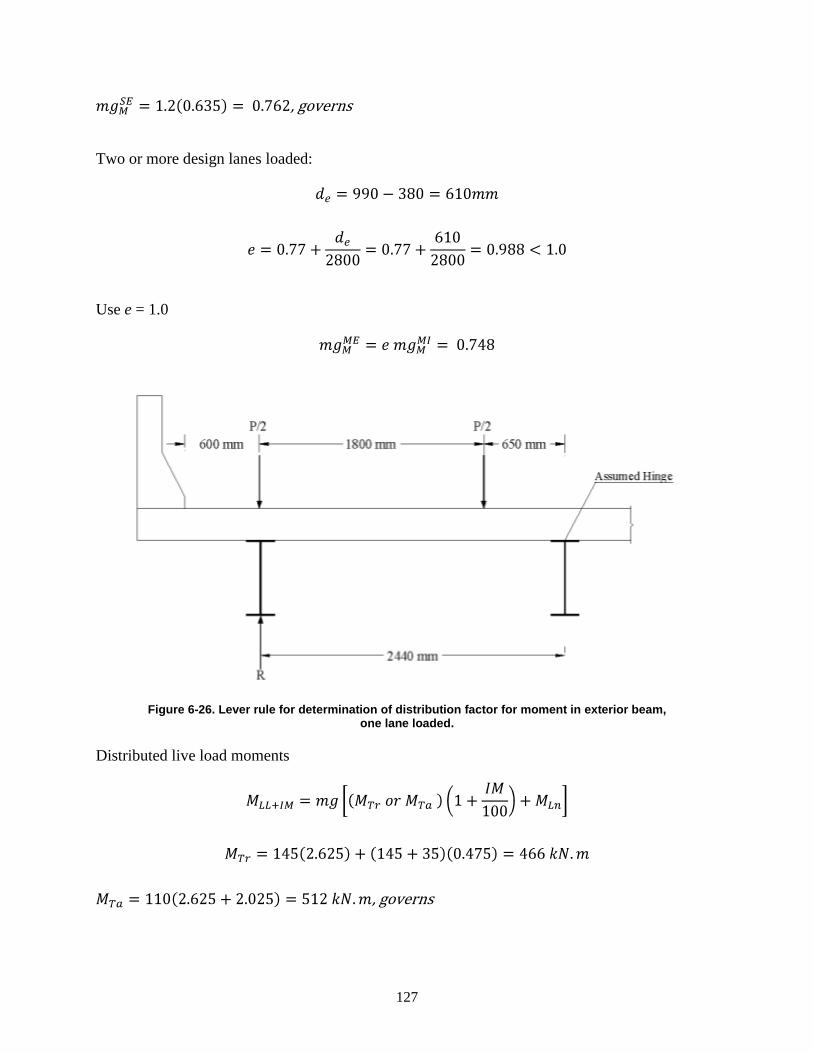
127
, governs
Two or more design lanes loaded:
Use e = 1.0
Figure 6-26. Lever rule for determination of distribution factor for moment in exterior beam, one lane loaded.
Distributed live load moments
, governs

128
The absolute moment due to the tandem actually occurs under the wheel closest to the resultant
when the cg of the wheels on the span and the critical wheel are equidistant from the centerline
of the span. For this span, the absolute maximum moment is 513 kN.m. However, the value of
512 kN.m is used because moments due to other loads are maximum at the centerline and thus
can be added to the tandem load moment. Refer to Figure 6-27 for the truck, tandem, and lane
load locations for maximum moment at 105 (midspan)
Interior Beams
Exterior Beams
Figure 6-27. Truck, tandem, and lane load placement for maximum moment at Location 105.

129
Distribution factors for shear [A4.6.2.2.3] Cross-section type (a) (Table 2.2)
Interior beams (Table 6.5) [Table A4.6.2.2.3a-1], one design lane loaded
Two design lanes loaded
The two design lanes loaded factor governs.
Exterior beams (Table 6.5) [Table A4.6.2.2.3b-1] One design lane loaded
, governs
Two or more design lanes loaded
Distributed live load for shears. Figure 6-28 shows the truck, tandem, and lane load positions for
maximum shear at span end (location 100).
, governs
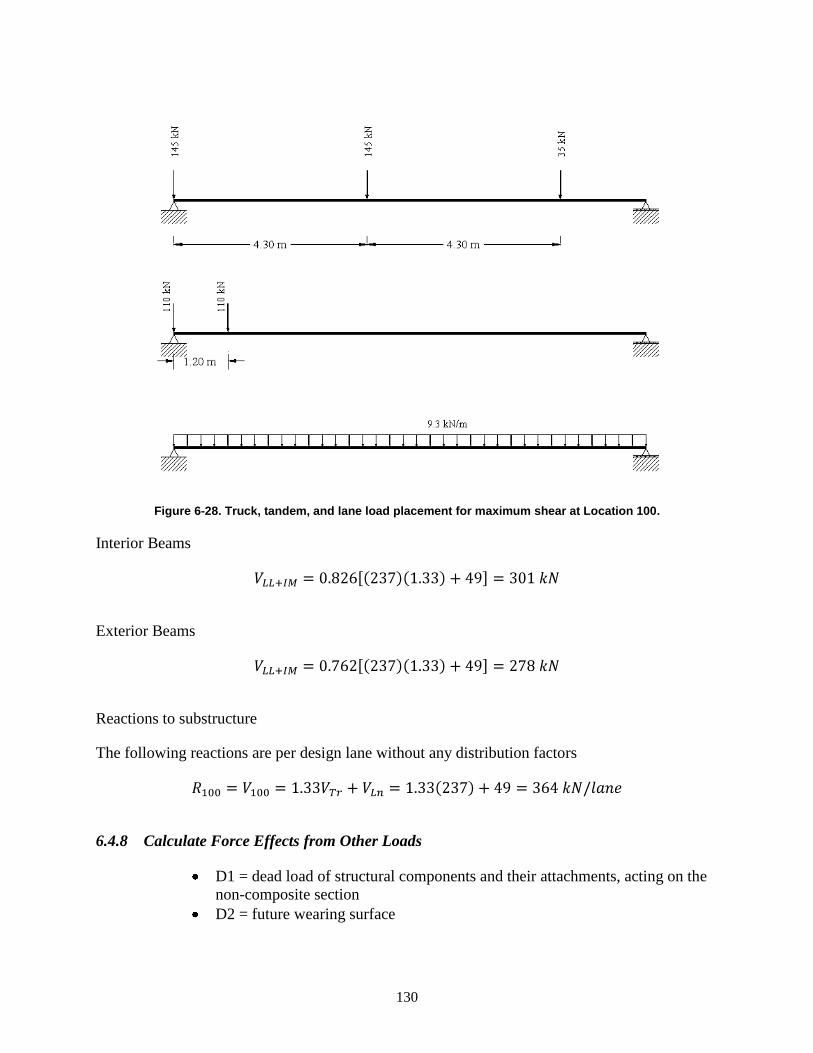
130
Figure 6-28. Truck, tandem, and lane load placement for maximum shear at Location 100.
Interior Beams
Exterior Beams
Reactions to substructure
The following reactions are per design lane without any distribution factors
6.4.8 Calculate Force Effects from Other Loads
D1 = dead load of structural components and their attachments, acting on the
non-composite section
D2 = future wearing surface

131
D3 = barriers that have a cross-sectional area of 197 312 mm2
A 50 mm x 300 mm average concrete haunch at each girder is used to account for camber and
unshored construction.
Assume a beam weight of 1.5 kN/m.
For a uniformly distributed load, w,
Interior girders
D1 Deck Slab
Girder =
Haunch
D2 75 mm bituminous paving
D3 Barriers, one-sixth share
Table 6-5 summarizes the un-factored moments and shear at critical section for interior girders.
Table 6-5. Interior Girder Un-factored Moments and Shears
Load Type W (kN/m) Moment (kN.m) M105 Shear (kN) V100
D1 13.63 188 72 D2 4.04 56 21 D3 1.55 21 8
LL + IM N/A 605 301

132
Exterior girders
D1 Deck Slab
Girder =
Haunch
D2 75 mm bituminous paving
D3 Barriers, one-sixth share
Table 6-6 summarizes the un-factored moments and shear at critical section for exterior girders.
Table 6-6. Exterior Girder Un-factored Moments and Shears
Load Type W (kN/m) Moment (kN.m) M105 Shear (kN) V100
D1 13.10 181 69 D2 3.03 42 16 D3 1.55 21 8
LL + IM N/A 616 278
6.4.9 Design Required Sections
6.4.9.1 Strength Limit State
Interior beam – factored shear and moment

133
Exterior beam – factored shear and moment
6.4.9.2 Loading and Concrete Placement Sequence [ A6.10.5.1.1a]
Case 1 Weight of girder and slab (D1). Supported by steel girder alone.
Case 2 Superimposed dead load (FWS, curbs, and railings) (D2 and D3). Supported by long-
term composite section.
Case 3 live load plus impact (LL+IM). Supported by short-term composite section.
6.4.9.3 Determine Effective Flange Width [A4.6.2.6]
For interior girders. The effective flange width is the least of:
One-quarter of the average span length
Twelve times the average thickness of the slab, plus the greater of the web
thickness or one-half the width of the top flange of the girder
Average spacing of adjacent girders
Assume the girder top flange is 200 mm wide
Therefore, bi = 2380 mm
For exterior girders the effective flange width is one-half the effective flange width of the
adjacent interior girder, plus the least of:
One-eighth of the average span length
Six times the average thickness of the slab, plus the greater of the web
thickness or one-half the width of the top flange of the girder
The width of the overhang

134
Therefore,
6.4.9.4 Modular Ratio
For [A6.10.5.1.1b]
6.4.9.5 Cover Plates
For economy, the lightest and shallowest beam with the largest cover plate possible gives the
best design. The length of the cover plate, Lcp , must satisfy [A6.10.9]
Where ds = depth of the steel section (mm)
6.4.9.6 Trial Section Properties
6.4.9.6.1 Steel Section at Midspan.
Try W610x101 with 10 mm x 200 mm cover plate. Properties of W610x101 are taken from
AISC. The calculations for the steel section properties are summarized in Table 6-7 and shown in
Figure 6-29.
Table 6-7. Steel Section Properties
Component A y Ay I0
Beam 12900
3.899x10⁶ -41.4 21.8x10
6 764x10
6
Cover Plate 2000 603+5=608 1.216x10⁶ 265.4 140.9x10
6 17x10
3
14900 5.105x10⁶ 162.7x10
6 764x10
6

135
Figure 6-29. Steel section at midspan.
(Note: positive y is downward from centroid of section)

136
6.4.9.6.2 Composite Section, n = 8, at Midspan.
Figure 6-30 shows the composite section with a haunch of 25 mm, a net slab thickness (without
15 mm sacrificial wearing surface) of 190 mm, and an effective width of 2380 mm The
composite section properties calculations are summarized in Table 6-8.
Figure 6-30. Composite section at midspan.

137
6.4.9.6.3 Composite Section, 3n = 24, at Midspan.
The composite section properties calculations, reduced for the effect of creep in the concrete
slab, are summarized in Table 6-9.
Table 6-8. Short-Term Composite Section Properties, n=8, bi = 2380 mm
Component A y Ay I0
Concrete (bi x ts/n)
a
56525
-6.783x10⁶ -96.5 526x10
6 170x10
6
Steel 14900 342.6 5.105x10⁶ 366.1 1997x10
6 927x10
6
71425 -1.678x10⁶ 2523x10
6 1097x10
6
a The parameter bi is used because interior girders control the moment design
6.4.9.7 Member Proportions [A6.10.1.1]

138
Fatigue Induced by Web Flexure [A6.10.4.3]
Therefore, fcf must be less than RhFyc, where
fcf = maximum compressive elastic flexural stress in the compression flange due to the un-
factored permanent load and twice the fatigue loading [ A6.10.4.2].
The un-factored moment at location 105 due to the fatigue loading was calculated and found to
be 397 kN.m. The value given in Table 6-10 for MLL+IM is twice the positive moment value with
load factor and without multiple presence.
Figure 6-31. Fatigue truck placement for maximum moment.
Table 6-9. Long-Term Composite Section Properties, 3n=24
Component A y Ay I0
Concrete (bi x ts/3n)
a
18842 -2.261x10⁶ -204.3 786x10
6 56.7x10
6
Steel 14900 342.6 5.105x10⁶ 258.3 994x10
6 926.7x10
6
33742 2.844x10⁶ 1780x10
6 983.4x10
6
a The parameter bi is used because interior girders control the moment design

139
Table 6-10. Maximum Flexural Stress in the Web for Positive Flexure (Interior Girder)
Load MD1 MD2 MD3 MLL+IM St Steel St Composite Stress (MPa)
D1 188 -2.705x10⁶ -69.5
D2 56 -32.78 x10⁶ -1.7
D3 21 -32.78 x10⁶ -0.6
LL+IM 427 154.0x10⁶ 2.8
Total -69.0
6.4.9.8 Stresses
Stresses in top and bottom of girder for strength limit state are given in Table 6-11 and Table
6-12. Yielding has occurred in the bottom flange.
Table 6-11. Compressive Stresses in Top of Steel Beam Due to Factored Loading (Interior Girder)
Load MD1 MD2 MD3 MLL+IM St Steel St Composite Stress (MPa)
D1 235 -2.705x10⁶ -86.9
D2 84 -32.78 x10⁶ -2.6
D3 26 -32.78 x10⁶ -0.8
LL+IM 1059 154.0x10⁶ 6.9
Total -83.4 η=0.95 -79.2
Table 6-12. Tensile Stresses in Bottom of Steel Beam Due to Factored Loading
Load MD1 MD2 MD3 MLL+IM Sb Steel Sb Composite Stress (MPa)
D1 235 3.427x10⁶ 68.6
D2 84 5.277 x 10⁶ 16.1
D3 26 5.277 x 10⁶ 5.0
LL+IM 1059 5.69 x 10⁶ 186.1
Total 275.8 η=0.95 262.0
6.4.9.9 Determine if Section is Compact
Web Slenderness (Table 8.16) [A6.10.5.2.2c]

140
Number of bars in top of slab in effective width =
Number of bars in bottom slab =
Plastic Forces Assume PNA is in slab above bottom bars (c<156 mm)
Top Reinforcement,
Concrete Slab,
Bottom Reinforcement,
Beam,
Cover Plate,
Plastic Neutral Axis PNA
Because the PNA is not in the web, Dcp shall be taken equal to 0, the web slenderness
requirement is satisfied [A6.10.5.1.4b], the section is classified as compact, and Mn = Mp.
Calculate Plastic Moment Mp by summing moments about PNA:
Top Reinforcement:
Slab:
141
Bottom reinforcement:
Beam:
Cover Plate:
6.4.9.9.1 Compression Flange Slenderness [A6.10.5.2.2c].
No requirement at strength limit state for compact composite I-sections in positive flexure (Table
8.16) [Table A6.10.5.2.1-1]
6.4.9.9.2 Compression Flange Bracing.
No requirement at strength limit state for compact composite I-sections in positive flexure (Table
8.16) [Table A6.10.5.2.1-1]
6.4.9.9.3 Calculate Flexural Resistance [A6.10.5.2.2a].
For simple spans, the nominal flexural resistance is taken as
6.4.9.9.4 Check Positive Flexure Ductility [A6.10.5.2.2b].
As calculated in Table 6-11 and Table 6-12, the moment due to the factored loads results in
stresses of 79.2 and 262.0 MPa in the top and bottom flanges, respectively. Because the bottom
flange elastic stress exceeds the yield strength of the flange (250 MPa), the section must satisfy
Where
Dp = distance from the top of the slab to the neutral axis at the plastic moment = 80.1 mm
d = depth of the steel section = 603 mm

142
ts = thickness of the concrete slab = 205 mm
th = thickness of the concrete haunch = 25 mm
Therefore, all requirements for flexure have been satisfied.
6.4.9.10 Shear Design
For beams with un-stiffened web (Table 8.19) [A6.10.7.2]
Therefore,
(factored shear in interior beam), OK
Bearing Stiffener design [A6.10.8.2]
The bearing stiffeners are not required.

143
6.4.10 Dimension and Detail Requirements
6.4.10.1 Material Thickness [A6.7.3].
Bracing and cross frames shall not be less than 8 mm in thickness. Web thickness of rolled
beams shall not be less than 7 mm.
6.4.10.2 Optional Deflection Control [A2.5.2.6.2].
Allowable service load deflection
From [A3.6.1.3.2], deflection is taken as the larger of:
That resulting from the design truck alone.
That resulting from 25% of the design truck taken together with the design
lane load.
The distribution factor for deflection may be taken as the number of lanes divided by the number
of beams, because all design lanes should be loaded, and all supporting components should be
assumed to deflect equally.
Deflection resulting from design truck alone, Figure 6-32.
Figure 6-32. Truck placement for maximum deflection.

144
The deflection at any point, Δx, due to a point load P can be found from AISC manual, refer
to Figure 6-33, for
Figure 6-33. General placement of point load P.
The maximum deflection (located at center) of a simply supported span, due to a concentrated
load at the center of the span, can be found from the AISC. Refer to Figure 6-34:
Figure 6-34. Point load P at center of span.

145
Deflection resulting from 25% design truck together with the design lane load
The deflection due to lane load can be found from the AISC:
6.4.10.3 Service Limit State Control of Permanent Deflections [A6.10.3]
For both flanges of composite sections
Where
ff = elastic flange stress caused by the factored loading
The maximum Service II moment, which occurs at Location 105 in the interior beam, is due to
un-factored dead loads D1, D2, and D3, and the factored live load, 1.3(LL+IM), taken from
Table 6-5. The stresses calculated from these moments are given in Table 6-13 and Table 6-14.

146
Table 6-13. Stresses in Top of Flange of Steel Beam Due to Service II Moments
Load MD1 MD2 MD3 MLL+IM Sb Steel Sb Composite Stress (MPa)
D1 188 -2.705x10⁶ -69.5
D2 56 -32.78 x 10⁶ -1.7
D3 21 -32.78 x 10⁶ -0.6
LL+IM 787 154.0 x 10⁶ 5.1
Total -66.7
Table 6-14. Stresses in Bottom Flange of Steel Beam Due to Service II Moments
Load MD1 MD2 MD3 MLL+IM Sb Steel Sb Composite Stress (MPa)
D1 188 3.427x10⁶ 54.9
D2 56 5.277 x 10⁶ 10.7
D3 21 5.277 x 10⁶ 4.0
LL+IM 787 5.69 x 10⁶ 138.3
Total 207.9
6.4.10.4 Check Construction Requirements, (Dead Load Camber)
The centerline deflection due to a uniform load on a simply support span is:
By substituting the dead loads from Table 6-5 and Table 6-6, the centerline deflections are
calculated in Table 6-15 and Table 6-16. Use a 12 mm camber on all beams.
Table 6-15. Exterior Beam Deflection Due to Dead Loads
Load Type Load, w (N/mm) I (mm4) ΔCL (mm)
D1 13.10 926.7 x 10⁶ 11
D2 3.03 2763.4 x 106 0.9
D3 1.55 2763.4 x 106 0.5
Total 12.4
Table 6-16. Interior Beam Deflection Due to Dead Loads
Load Type Load, w (N/mm) I (mm4) ΔCL (mm)
D1 13.63 926.7 x 10⁶ 12
D2 4.04 2763.4 x 106 1.2
D3 1.55 2763.4 x 106 0.5
Total 13.7

147
6.4.10.5 Check Fatigue [A6.5.3]
The maximum stress range is assumed to be twice the live load stress range due to the passage of
the fatigue load. However, the stress range need not be multiplied by two because the fatigue
resistance is divided by two.
where Sb is the section modulus for the short-term composite section, calculated before.
6.4.10.6 Shear Connectors [A6.10.7.4]
Shear connectors must be provided throughout the length of the span for simple span composite
bridges. Use 19 mm diameter studs, 100 mm high. The ratio of height to diameter is:
6.5 Steel Bridge Girder Strengthened using CFRP – Solved Example
The steel bridge girder example from the previous section will be used as the basis of this
example. Sections affected by the addition of the CFRP laminate will only be included below.
CFRP properties are taken to be the same as mentioned in Chapter 3. Tensile modulus = 155
GPa, and the tensile strength = 2790MPa.
6.5.1 Design Required Sections
The same design procedure followed in the previous example still apply to this section.

148
6.5.1.1 Section Properties
6.5.1.1.1 Steel Section at Midspan.
Using the W610x101 with the 10 mm x 200 mm cover plate with an additional 10 mm x 200 mm
CFRP laminate.
First, a Young’s modulus ratio nCFRP will be calculated:
Properties of W610x101 are taken from AISC. The calculations for the steel and CFRP section
properties are summarized in Table 6-17 and shown in Figure 6-35. The CFRP area will be
reduced by multiplying the actual physical area by nCFRP.
Table 6-17. Section Properties (Steel + CFRP)
Component A y Ay I0
Beam 12900
3.899x10⁶ -67.0 58.0x10
6 764x10
6
Cover Plate 2000 603+5=608 1.216x10⁶ 239.4 114.6x10
6 17x10
3
CFRP 1550 613+5=618 0.95 x10⁶ 249.4 96.4x10
6 1615
16450 6.063x10⁶ 269.11x10
6 764x10
6

149
Figure 6-35. Steel section with CFRP at midspan.

150
Note that the inertia, Ix increased by only 11%, while the increase in the bottom section modulus,
Sb, was 28.6%. This is due to the fact that the neutral axis was shifted downwards, which greatly
affects the Sb, which leads to the increase of section capacity. The top section modulus, Sb,
remained almost the same, which means no extra stresses will be seen at the compression zone
(concrete deck or top flange). This is also one of the benefits of the CFRP rehabilitation system.
(Note: positive y is downward from centroid of section)
6.5.1.1.2 Composite Section.
The composite section shown in Figure 6-36 shows the composite section with a haunch of 25
mm, a net slab thickness (without 15 mm sacrificial wearing surface) of 190 mm, and an
effective width of 2380 mm, in addition to the 10 mm CFRP laminate. The composite section
properties calculations are summarized in Table 6-18 and Table 6-19.
Table 6-18. Short-Term Composite Section Properties, n=8, bi = 2380 mm
Component A y Ay I0
Concrete (bi x ts/n)
a
56525
-6.783x10⁶ -110.1 685x10
6 170x10
6
Steel 16450 368.6 6.063x10⁶ 378.46 2356x10
6 1030x10
6
72975 -0.719x10⁶ 3041x10
6 1200x10
6
a The parameter bi is used because interior girders control the moment design

151
Figure 6-36. Composite steel section with CFRP at midspan.

152
Reconsidering the long-term composite action, the increase in inertia and section modulus is
recalculated:
Table 6-19. Long-Term Composite Section Properties, 3n=24
Component A y Ay I0
Concrete (bi x ts/3n)
a
18842
-2.26x10⁶ -227.7 977.26x10
6 170x10
6
Steel+CFRP 16450 368.6 6.064x10⁶ 260.86 1119.4x10
6 1030x10
6
35292 3.802x10⁶ 2096.6x10
6 1200x10
6
a The parameter bi is used because interior girders control the moment design
Table 6-20. Maximum Flexural Stress in the Web for Positive Flexure (Interior Girder)
Load MD1 MD2 MD3 MLL+IM St Steel St Composite Stress (MPa)
D1 188 -2.802x10⁶ -67.09
D2 56 -30.6 x10⁶ -1.83
D3 21 -30.6 x10⁶ -0.69
LL+IM 427 430.2x10⁶ 0.99
Total -68.62
6.5.1.2 Stresses
Stresses in top and bottom of girder for strength limit state are given in Table 6-21 and Table
6-22. Yielding has occurred in the bottom flange.

153
Table 6-21. Compressive Stresses in Top of Steel Beam Due to Factored Loading (Interior Girder)
Load MD1 MD2 MD3 MLL+IM St Steel St Composite Stress (MPa)
D1 235 -2.802x10⁶ -83.87
D2 84 -30.6 x10⁶ -2.75
D3 26 -30.6 x10⁶ -0.85
LL+IM 1059 430.2x10⁶ 2.46
Total -85.0 η=0.95 -80.75
Table 6-22. Tensile Stresses in Bottom of Steel Beam Due to Factored Loading
Load MD1 MD2 MD3 MLL+IM Sb Steel Sb Composite
Stress (MPa)
D1 235 4.407x10⁶ 53.32
D2 84 6.52 x 10⁶ 12.88
D3 26 6.52 x 10⁶ 4.0
LL+IM 1059 6.81 x 10⁶ 155.51
Total 225.7 η=0.95 214.41
Deflection resulting from design truck alone, Figure 6-32.
The deflection at any point, Δx, due to a point load P can be found from AISC manual, refer
to Figure 6-33, for
The maximum deflection (located at center) of a simply supported span, due to a concentrated
load at the center of the span, can be found from the AISC. Refer to Figure 6-34:

154
Deflection resulting from 25% design truck together with the design lane load
The deflection due to lane load can be found from the AISC:
Service Limit State Control of Permanent Deflections [A6.10.3]. For both flanges of composite
sections
Where
ff = elastic flange stress caused by the factored loading

155
The maximum Service II moment, which occurs at Location 105 in the interior beam, is due to
un-factored dead loads D1, D2, and D3, and the factored live load, 1.3(LL+IM), taken from
Table 6-5. The stresses calculated from these moments are given in Table 6-23 and Table 6-24.
Table 6-23. Stresses in Top of Flange of Steel Beam Due to Service II Moments
Load MD1 MD2 MD3 MLL+IM Sb Steel Sb Composite Stress (MPa)
D1 188 -2.705x10⁶ -67.1
D2 56 -30.6 x 10⁶ -1.8
D3 21 -30.6 x 10⁶ -0.7
LL+IM 787 430.2 x 10⁶ 1.8
Total -67.8
Table 6-24. Stresses in Bottom Flange of Steel Beam Due to Service II Moments
Load MD1 MD2 MD3 MLL+IM Sb Steel Sb Composite Stress (MPa)
D1 188 3.427x10⁶ 42.7
D2 56 6.52 x 10⁶ 8.6
D3 21 6.52 x 10⁶ 3.2
LL+IM 787 6.81 x 10⁶ 115.6
Total 170
6.5.1.3 Check Construction Requirements, (Dead Load Camber)
The centerline deflection due to a uniform load on a simply support span is:
By substituting the dead loads from Table 6-5 and Table 6-6, the centerline deflections are
calculated in Table 6-25 and Table 6-26. Use a 12 mm camber on all beams.
Table 6-25. Exterior Beam Deflection Due to Dead Loads
Load Type Load, w (N/mm) I (mm4) ΔCL (mm)
D1 13.10 1030 x 106 9.9
D2 3.03 3296.6 x 106 0.8
D3 1.55 3296.6 x 106 0.4
Total 11.1

156
Table 6-26. Interior Beam Deflection Due to Dead Loads
Load Type Load, w (N/mm) I (mm4) ΔCL (mm)
D1 13.63 1030 x 106 10.8
D2 4.04 3296.6 x 106 1.0
D3 1.55 3296.6 x 106 0.4
Total 12.2
6.5.1.4 Check Fatigue [A6.5.3]
The maximum stress range is assumed to be twice the live load stress range due to the passage of
the fatigue load. However, the stress range need not be multiplied by two because the fatigue
resistance is divided by two.
where Sb is the section modulus calculated before for the short-term composite section.
6.6 CFRP Contribution to Steel Bridge Girders
In this section, a comparison between both solved examples in sections 6.5 and 6.6 will be
provided. The contribution of the CFRP laminate added to the steel girder will be discussed.
Change in the section inertia and section modulus will be discussed thoroughly. The effect of the
CFRP laminate on stresses as well as fatigue stresses will be pointed out, and finally, the effect
on the girder deflections.

157
6.6.1 Section Inertia and Modulus
6.6.1.1 Steel Section Properties
The increase in section properties due to adding the CFRP laminate was significant. Comparing
the steel girder without the concrete slab, before and after adding the CFRP laminate, the
comparison is as follows:
Section inertia without CFRP laminate;
Section inertia with CFRP laminate;
The increase in section inertia due to CFRP laminate
The increase in section modulus (bottom fibers) due to adding the CFRP laminate was more
significant due to the shifting of the neutral axis downwards when adding a CFRP laminate.
Comparing the steel girder without the concrete slab, before and after adding the CFRP laminate,
the comparison is as follows:
Section modulus without CFRP laminate;
Section modulus with CFRP laminate;
The increase in section modulus due to CFRP laminate
The increase in section modulus (top fibers) due to adding the CFRP laminate was not significant
due to the shifting of the neutral axis downwards when adding a CFRP laminate. The top section
modulus is not of great importance in the rehabilitation process due its generally low stress
levels. Comparing the steel girder without the concrete slab, before and after adding the CFRP
laminate, the comparison is as follows:
Section modulus without CFRP laminate;
Section modulus with CFRP laminate;
The increase in section modulus due to CFRP laminate
6.6.1.2 Composite Section Properties
The increase in section properties due to adding the CFRP laminate was also significant.
Comparing the composite steel girder, before and after adding the CFRP laminate, the
comparison is as follows:
Section inertia without CFRP laminate;
Section inertia with CFRP laminate;
The increase in section inertia due to CFRP laminate
The increase in section modulus (bottom fibers) due to adding the CFRP laminate was more
significant due to the shifting of the neutral axis downwards when adding a CFRP laminate.

158
Comparing the composite steel girder, before and after adding the CFRP laminate, the
comparison is as follows:
Section modulus without CFRP laminate;
Section modulus with CFRP laminate;
The increase in section modulus due to CFRP laminate
A decrease in section modulus (top fibers) due to adding the CFRP laminate was noticed and was
not significant due to the shifting of the neutral axis downwards when adding a CFRP laminate.
The top section modulus is not of great importance in the rehabilitation process due its generally
low stress levels. Comparing the composite steel girder, before and after adding the CFRP
laminate, the comparison is as follows:
Section modulus without CFRP laminate;
Section modulus with CFRP laminate;
The increase in section modulus due to CFRP laminate
6.6.2 Stresses
The decrease in bottom tensile stresses due to factored loading after adding the CFRP laminate
was significant. Comparing the composite steel girder, before and after adding the CFRP
laminate, the comparison is as follows:
Tensile stresses without CFRP laminate;
Tensile stresses with CFRP laminate;
The decrease in tensile stresses due to CFRP laminate
The decrease in bottom tensile stresses due to Service II loading after adding the CFRP laminate
was also significant. Comparing the composite steel girder, before and after adding the CFRP
laminate, the comparison is as follows:
Tensile stresses without CFRP laminate;
Tensile stresses with CFRP laminate;
The decrease in tensile stresses due to CFRP laminate
6.6.3 Fatigue Stresses
The decrease in fatigue stress range after adding the CFRP laminate was significant. Comparing
the composite steel girder, before and after adding the CFRP laminate, the comparison is as
follows:
Fatigue stress range without CFRP laminate;
Fatigue stress range with CFRP laminate;
The decrease in fatigue stress range due to CFRP laminate

159
6.6.4 Deflections
The decrease in deflections due to factored loading after adding the CFRP laminate was
significant. Comparing the interior composite steel girder, before and after adding the CFRP
laminate, the comparison is as follows:
Deflections without CFRP laminate;
Deflections with CFRP laminate;
The decrease in deflections due to CFRP laminate
Comparing the exterior composite steel girder, before and after adding the CFRP laminate, the
comparison is as follows:
Deflections without CFRP laminate;
Deflections with CFRP laminate;
The decrease in deflections due to CFRP laminate
6.7 Design Guidelines
Steel girders strengthened by CFRP laminates have several potential modes of failure, such as
rupture of CFRP laminates, debonding of CFRP laminates, crushing of the concrete, or web
failure due to shear. The design guidelines proposed here are mainly concerned by the first two
modes of failure, as the latest two can be check using AASHTO equations.
Installation of CFRP laminates can increase the elastic stiffness of a steel girder leading to the
reduction in the elastic strain in the tension flange of the girder as compared to an unstrengthened
girder at the same load level. Due to these two effects, the live load capacity of a steel girder can
be increased using externally bonded CFRP laminates. The following section presents a
proposed design philosophy and procedure that can be used to design the CFRP strengthening for
steel–concrete composite flexural girders to achieve a desired increase of the live load level of
the girder.
Develop general bridge section;
Develop typical section and design basis;
Design conventionally reinforced concrete deck;
Select appropriate resistance factors [A6.5.4.2];
Select load modifiers [A1.3.3], [A1.3.4], [A1.3.5];
Select applicable load combinations;
Calculate live load force effects [A3.6.1.1.1];
Calculate force effects from other loads;
Choose CFRP thickness, width, and length;
Choose a CFRP configuration (B4 recommended). It is also recommended to
cover the whole flange width;

160
CFRP length should cover the maximum moment zone in addition to the
development lengths;
CFRP length should cover at least 75% of the girder length;
Calculate section properties for steel girders with CFRP laminates;
Design required sections;
Check flexural stresses for interior and exterior girders;
Check for deflections;
Check for fatigue stresses.
6.8 Summary
This chapter discussed two topics: first, simulation work of a typical composite steel concrete
bridge using FE models. The models were then used in the evaluation process of the proposed
rehabilitation technique using CFRP laminates.
The second part of the chapter was to evaluate the strengthening of steel girder bridges using
CFRP plates through solved AASHTO bridge examples. This includes the gain in strength,
section modulus, and stiffness of the bridge girders. The reduction of the deflections and the
fatigue stress ranges are also discussed. Design guidelines for rehabilitating steel bridges using
CFRP were also introduced at the end of the chapter.

161
Section 7
7.0 Summary, Conclusions, and Future Research
7.1 Summary
This research presented the findings of an experimental testing program and finite element
parametric study to develop a CFRP laminate system for flexural strengthening of steel beams
and steel bridge girders. Based on the experimental findings, a detailed and accurate finite
element model was developed to facilitate proper simulation and analysis of the composite steel
beams strengthened by CFRP laminates. Several CFRP configurations were presented, and a
comparison between all configurations showed the advantages and disadvantages of each
configuration. The effectiveness of the strengthening system was demonstrated and the detailed
behavior of the strengthened beams was examined.
Consequently, a bridge FE model was developed using SAP 2000. The model was strengthened
by CFRP, which enhanced its behavior significantly (20% increase in flexural capacity). The
research findings demonstrated the effectiveness of externally bonded CFRP laminates for
strengthening and repair of steel structures and bridges.
Throughout the literature review, several rehabilitation techniques were discussed. A historical
background was presented on the evolution of the rehabilitation methods, which lead to the use
of FRP. Very few studies investigated the rehabilitation using CFRP on steel bridge girders in
the USA. All of these studies were either theoretical, or still in the experimentation phase. The
current use of CFRP in concrete structural applications was presented. It showed a significant
impact on flexural behavior, fatigue, deflection, and column confinement.
The research work in this study presented an experimental program that involved four-point
loading tests conducted on five composite beams strengthened by CFRP laminates. An Excel
spreadsheet with embedded Visual Basic programming was developed to design steel beams
strengthened with CFRP laminates. The Visual Basic modules were developed to calculate the
plastic neutral axis location, the plastic moment capacity, and the beam deflections.
Tension testing of steel and CFRP specimens was also conducted to obtain their accurate
material properties that were then used for the FE model. The study described the steps executed
on order to perform the experimental tests successfully.
The process of developing the FE model conducted using the FE software package ABAQUS.
The model had to account for the anisotropic behavior of the CFRP and the adhesive properties
of the epoxy that attached the CFRP to the steel beam. Verification of the FE model developed
was achieved by comparing the analytical results to the experimental data. A very good
correlation was found; therefore, the model was used to develop a parametric study.

162
An extensive parametric study using the FE model was performed to determine the sensitive
parameters affecting the CFRP rehabilitation process. A hundred models were built and executed
using the FE program. Parameters investigated were CFRP laminate length, thickness, and
configuration. Beam loading, and the steel beam cross-section size were also variable. Results
were presented in the form of load deflection charts and in the form of summarized tables
showing the strength gain in both the elastic and plastic load range.
In chapter 6, “Bridge Design: Rehabilitation Guidelines”, two main topics were discussed. First,
the simulation work of a typical composite steel concrete bridge is discussed. The model also
showed a significant improvement to the bridges behavior when using CFRP. Second, an
example of a bridge designed using the AASHTO code strengthened using CFRP laminates is
presented. The chapter concludes by comparing the behavior of the bridge designed with and
without CFRP plates. The comparison showed significant improvements in strength, section
modulus (increase of 28.6%), stiffness (increase of 11.2%), as well as fatigue (decrease of
15.2%) and deflection responses (decrease of 10.5%). Finally, design guidelines are provided at
the end of the chapter.
7.2 Conclusion
Conclusions drawn from this research study can be summarized as follows:
Steel beams reinforced with CFRP laminates showed a significant increase in
flexural capacity reaching 62%, and the beams exhibited satisfactory ductile
behavior before laminate debonding.
Debonding occurred after yielding of the steel beam signifying that bonding was
effective during the elastic stage (in the design range of beams and girders).
At debonding (in the plastic region) it was observed that the beam did not develop
a plastic hinge at the point of maximum moment, rather it behaved like the control
beam (unreinforced by CFRP) with similar strength and ductility.
Proper CFRP laminate configuration is essential for maximum gain in enhancing
the beams, behavior. Increasing the CFRP laminates does not necessarily enhance
the steel beam behavior.
Substituting the concrete slab with a steel plate is a valid assumption for the
experimental work and was verified by FE models.
FE models using ABAQUS were accurate in predicting the load deflection curve
and debonding load.
The FE models were able to predict the strain versus depth curves for all tested
beams.
The parametric study using the FE model developed showed that the sensitive
parameters affecting steel beams reinforced by CFRP laminates are CFRP
laminate thickness, CFRP Young’s modulus, and CFRP ultimate laminate
strength.
The CFRP laminate length is not an effective parameter as long as the maximum
moment zone is covered and appropriate development length is satisfied. Based
163
on the analytical work, it is recommended that the CFRP laminate length be not
less than 75% of the girder length.
It is recommended that the CFRP laminate width should cover the whole beam
soffit.
The SAP2000 model would be a useful tool for structural engineers to strengthen
and/or rehabilitate bridges using CFRP plates.
7.3 Future Research
This research work studied the flexural enhancement of steel beams reinforced with CFRP
laminates. The experimental application of the CFRP plates was conducted in the laboratory
only. Future research would implement this rehabilitation method on a real bridge, and field
testing should be done to evaluate the actual effect on a full-scale bridge structure.
Furthermore, the main mode of failure of steel beams reinforced with CFRP laminates was
debonding. Further investigation and experimentation could be performed using different types
of adhesives, which may significantly reduce or eliminate the debonding mode of failure.

164
Section 8
8.0 References
AASHTO. (1998). AASHTO LRFD Bridge Design Specifications. Washington, D.C.: American
Association of State Highway and Transportation Officials.
Abaqus Analysis User Manual. (2007).
ACI Committee, 4. (2003). ACI 440.1R-03, Guide for the Design and Construction of Concrete
Reinforced with FRP Bars.
Al-Emrani, M., & Kliger, R. (2006). Experimental and Numerical Investigation of the Behaviour
and Strength of Composite Steel-CFRP Members. Advances in Structural Engineering , 9 (6),
819-831.
Al-Saidy, A. H. (2001). Structural Behaviour of Composite Beams Strengthened/Reparies with
Carbon Fiber Reinforced Polymer Plates. Ames, Iowa: Iowa State University.
Al-Saidy, A. H., Klaiber, F. W., & Wipf, T. J. (2004). Repair of steel composite beams with
carbon fiber-reinforced plates. Journal of Composites for Construction, ASCE , 8 (2), 163-172.
Atadero, Lee, L., & Karbhari, V. (2005). Consideration of material variability in reliability
analysis of FRP strengthened bridge decks. Journal of Composite Structures , 70, 430-443.
Baker, A. (1997). Growth characterization of fatigue cracks repaired with adhesively bonded
boron/epoxy composite. (pp. 117-128). Sydney, Australia: Advances in Fracture Research:
Proc., 9th Int. Conf. on Fracture.
Basseti, A. N. (2000). Fatigue life extension of riveted bridge members using prestressed carbon
fiber composites. Steel Structures of 2000’s, ECCS , 11-13.
Boyd, C. B. (1997). A Load-Deflection Study of Fiber Reinforced Plastics as Reinforcement in
Concrete Bridge Decks. Thesis, Virginia Polytechnic Institute and State University, Civil
Engineering, Blacksburg, Virginia.
Burgoyne, J. (1999). Advanced Composites in Civil Engineering in Europe. University of
Cambridge.
Crisfield, M. (1986). Snap-through and snap-back response in concrete structures and the
dangers of under-integration. International Journal for Numerical Methods in Engineering ,
22, 751-767.
Dawood, M. (2005). Fundamental Behaviour of Steel-Concrete Composite beams Strengthened
with High Modulus Carbon Reinforced Polymer Materials. Master’s Thesis, North Carolina
State University, Raleigh, North Carolina.
165
Deeks, A. J., & Hao, H. (2004). Development of Mechanics of Structures and Materials. Perth,
Australia: CRC Press.
El Damatty, A. A., Abushagur, M., & Youssef, M. A. (2005). Rehabilitation of Composite Steel
Bridges Using GFRP Plates. Applied Composite Materials, Springer 2005 , 12, 309-325.
Farhey, D. N., Naghavi, R., Levi, A., Thakur, A. M., Pickett, M. A., Nims, D. K., et al. (2000).
Deterioration Assessment And Rehabilitation Design of Existing Steel Bridge. Journal of
Bridge Engineering , 5 (1), 39-48.
Hambly, E. C. (1976). Bridge Deck Behaviour. Edinburgh: Chapman and Hall, Ltd.
Hashin, Z. (1980). Failure Criteria for Unidirectional Fiber Composites. Journal of Applied
Mechanics , 47, 329-334.
Hashin, Z., & Rotem, A. (1973). A Fatigue Criterion for Fiber-Reinforced Materials. Journal of
Composite Materials , 7, 448-464.
Hillerborg, A. M. (1976). Analysis of crack formation and crack growth in concrete by means of
fracture mechanics and finite elements. Cement Concrete Research , 6, 773-782.
Jones, R. (1998). Guide to Short Fiber Reinforced Plastics. Chernow Editorial Services .
Jones, S. C., & Civjan, S. A. (2003). Application of Fiber Reinforced Polymer Overlays to
Extend Steel Fatigue Life. Journal of Composites for Construction, ASCE , 7, 331-338.
Karbhari, V. (2005). Building materials for the renewal of civil infrastructure. Journal of
Reinforced Plastics , 49, 14-25.
Lenwari, A., Thepchatri, T., & Albrecht, P. (2006). Debonding strength of steel beams
strengthened with CFRP plates. Journal of Composites for Construction, ASCE , 10, 69-78.
Lenwari, A., Thepchatri, T., & Albrecht, P. (2005). Flexural Response of Steel Beams
Strengthened with Partial-Length CFRP Plates. Journal of Composites for Construction, ASCE
, 9, 296-303.
Liu, X., Silva, P., & Nanni, A. (2001). Rehabilitation of Steel Bridge Members with FRP
Composite Materials. Composites in Construction , 613-617.
McRae, S., & Ramey, G. E. (2003). Rehabilitation of Bridge Superstructures via the addition of
Girder Lines I: Theoretical Considerations. Practice Periodical on Structural Design and
Construction , 8 (3), 164-171.
Mertz, D. R., & Gillespie, J. W. (1996). Rehabilitation of steel girders through the application of
advance composite materials. Washington D.C: Transportation Research Board.
Naito, C. (2005, May/June). Anchorage of Reinforced Concrete Parapets on Glass Fiber
Reinforced Polymer Bridge Decks. Journal of Composites for Construction, ASCE , 247-254.
Nezamian, A., & Setunge, S. (2007, September/October). Case Study of Application of FRP
Composites in Strengthening the Reinforced Concrete Headstock of a Bridge Structure.
Journal of Composites for Construction, ASCE , 531-544.

166
Nozaka, K., Sheild, C., & Hajjar, J. (2005). Design of a test specimen to assess the effective
bond length of carbon fiber reinforced polymer strips bonded to fatigued steel bridge girders.
Journal of Composites for Construction, ASCE , 9, 304-312.
Nozaka, K., Sheild, C., & Hajjar, J. (2005). Effective Bond Length of Carbon-Fiber-Reinforced
Polymer Strips Bonded to Fatigued Steel Bridge I-Girders. Journal of Bridge Engineering,
ASCE , 10 (2), 195-205.
Okeil, A. M., El-Tawil, S., & Shahawy, M. (2002, September/October). Flexural Reliability of
Reinforced Concrete Bridge Girders Strengthened with Carbon Fiber-Reinforced Polymer
Laminates. Journal of Bridge Engineering, ASCE , 290-299.
Pantelides, C. P., Cercone, L., & Policelli, F. (2004, January/February). Development of a
Specification for Bridge Seismic Retrofit with Carbon Fiber Reinforced Polymer Composites.
Journal of Composites for Construction, ASCE , 88-96.
Phares, B. M., Wipf, T. J., Klaiber, F. W., Abu-Hawash, A., & Lee, Y.-S. (2003). Strengthening
of Steel Girder Bridges Using FRP. Ames, Iowa: Proceedings of the 2003 Mid-Continent
Transportation Research Symposium.
QuakeWrap. (2008). Retrieved October 23, 2008, from QuakeWrap: www.quakewrap.com
Ramey, G. E., & Wright, R. L. (1997, August). Bridge Deterioration rates and durability-
longetivity performance. Practice Periodical on Structural Design and Construction , 2 (3),
pp. 98-104.
Salama, T., & Abd-El-Meguid, A. S. (2007). Experimentation and Finite Element Analysis of
Steel Beams Strengthened by CFRP Laminates. Proceedings of the 87th Annual Meetings of
Transportation Research Board. Washington D.C.: Transportation Research Board.
SAP 2000. (2008).
Schnerch, D. M. (2007). Proposed design guidelines for strengthening of steel bridges with FRP
materials. Construction and Building Materials , 21 (5), 1001-1010.
Schnerch, D. (2005). Strengthening of steel structures with high modulus carbon fiber reinforced
polymer (CFRP) materials. PhD dissertation, North Carolina State University, Raleigh, North
Carolina.
Sen, R., Libby, L., & Mullins, G. (2001). Strengthening steel bridge sections using CFRP
laminates. Composites Part B: Engineering , 39, 309-322.
Shalaby, A. M. (2007). Development of a New Spun Concrete Pole Reinforced with Carbon
Fiber Reinforced Polymer Bars. Dissertation, University of Alabama at Birmingham, Civil,
Construction and Environmental Engineering Department.
Stallings, J. M., Tedesco, J. W., El-Mihilmy, M., & McCauley, M. (2000, May). Field
Performance of FRP Bridge Repairs. Journal of Bridge Engineering , 107-113.
Stoll, F., Saliba, J. E., & Laura, E. C. (2000). Experimental study of CFRP- prestressed high
strength concrete bridge beams. Journal of Composite Structures , 49, 191-200.

167
Swaminathan, S., Pagano, N. J., & Ghosh, S. (2006). Analysis of Interfacial Debonding in Three-
Dimensional Composite Microstructures. Journal of Engineering Materials and Technology ,
128, 96-106.
Tavakkolizadeh, M., & Saadatmanesh, H. (2003). Strengthening of steel-concrete composite
girders using carbon fiber reinforced polymer sheets. Journal of Structural Engineering, ASCE,
129 (1), 30-40.
Wipf, T. J., Phares, B. M., Klaiber, F. W., & Lee, Y. S. (2003). Evaluation of Post-tension
Strengthened Steel Girder Bridge Using FRP Bars. Iowa: Center for Transportation Research
and Education, Bridge Engineering Center, Iowa State University.
Wipf, T., Phares, B., Klaiber, F., Al-Saidy, A., & Lee, Y. (2005, July). Strengthening Steel
Girder Bridges with Carbon Fiber-Reinforced Polymer Plates. Journal of the Transportation
Research Board , 435-447.

168
Appendices

169
Appendix A: Plastic Neutral Axis Calculations
Function Plastic_NA(Top_Plate_W, Top_Plate_T, D, B_F, T_F, T_W, T_CFRP_W, T_CFRP_T,
B_CFRP_W, B_CFRP_T, F_Y, CFRP_Y) As Double
Sigma_Force = 0
Plastic_NA = 0
F_Top_Plate_1 = 0
F_Top_Plate_2 = 0
F_Top_Flange_1 = 0
F_Top_Flange_2 = 0
F_Web_1 = 0
F_Web_2 = 0
F_CFRP_TOP = 0
F_Bottom_Flange = 0
F_CFRP_Bottom = 0
10 Plastic_NA = Plastic_NA + 0.00001 * D
If Plastic_NA < Top_Plate_T Then ' plastic NA in top plate
F_Top_Plate_1 = -Top_Plate_W * Plastic_NA * F_Y
F_Top_Plate_2 = Top_Plate_W * (Top_Plate_T - Plastic_NA) * F_Y
F_Top_Flange_1 = B_F * T_F * F_Y
F_Top_Flange_2 = 0
F_Web_1 = (D - 2 * T_F) * T_W * F_Y
F_Web_2 = 0
F_CFRP_TOP = T_CFRP_W * T_CFRP_T * CFRP_Y
F_Bottom_Flange = B_F * T_F * F_Y
F_CFRP_Bottom = B_CFRP_W * B_CFRP_T * CFRP_Y
Else
If Plastic_NA > Top_Plate_T And Plastic_NA < (Top_Plate_T + T_F) Then ' plastic NA
in top flange
F_Top_Plate_1 = -Top_Plate_W * Top_Plate_T * F_Y
F_Top_Plate_2 = 0
F_Top_Flange_1 = -B_F * (Plastic_NA - Top_Plate_T) * F_Y
F_Top_Flange_2 = B_F * (Top_Plate_T + T_F - Plastic_NA) * F_Y
F_Web_1 = (D - 2 * T_F) * T_W * F_Y
F_Web_2 = 0
F_CFRP_TOP = T_CFRP_W * T_CFRP_T * CFRP_Y
F_Bottom_Flange = B_F * T_F * F_Y
F_CFRP_Bottom = B_CFRP_W * B_CFRP_T * CFRP_Y
Else ' plastic NA in Web
F_Top_Plate_1 = -Top_Plate_W * Top_Plate_T * F_Y
F_Top_Plate_2 = 0
F_Top_Flange_1 = -B_F * T_F * F_Y
F_Top_Flange_2 = 0

170
F_Web_1 = -T_W * (Plastic_NA - Top_Plate_T - T_F) * F_Y
F_Web_2 = T_W * (D - 2 * T_F - Plastic_NA + Top_Plate_T + T_F) * F_Y
F_CFRP_TOP = T_CFRP_W * T_CFRP_T * CFRP_Y
F_Bottom_Flange = B_F * T_F * F_Y
F_CFRP_Bottom = B_CFRP_W * B_CFRP_T * CFRP_Y
End If
End If
Sigma_Force = F_Top_Plate_1 + F_Top_Plate_2 + F_Top_Flange_1 + F_Top_Flange_2 +
F_Web_1 + F_Web_2 + F_CFRP_TOP + F_Bottom_Flange + F_CFRP_Bottom
If Abs(Sigma_Force) > 0.5 Then GoTo 10
End Function

171
Appendix B: Plastic Moment Capacity Calculations
Function M_Plastic(Top_Plate_W, Top_Plate_T, D, B_F, T_F, T_W, T_CFRP_W, T_CFRP_T,
B_CFRP_W, B_CFRP_T, F_Y, CFRP_Y, NA) As Single
M_Plastic = 0
M_Top_Plate_1 = 0
M_Top_Plate_2 = 0
M_Top_Flange_1 = 0
M_Top_Flange_2 = 0
M_Web_1 = 0
M_Web_2 = 0
M_CFRP_TOP = 0
M_Bottom_Flange = 0
M_CFRP_Bottom = 0
If NA < Top_Plate_T Then ' plastic NA in top plate
M_Top_Plate_1 = Top_Plate_W * NA * F_Y * 0.5 * NA
M_Top_Plate_2 = Top_Plate_W * (Top_Plate_T - NA) * F_Y * 0.5 * (Top_Plate_T -
NA)
M_Top_Flange_1 = B_F * T_F * F_Y * (Top_Plate_T - NA + 0.5 * T_F)
M_Top_Flange_2 = 0
M_Web_1 = (D - 2 * T_F) * T_W * F_Y * (Top_Plate_T - NA + T_F + 0.5 * (D - 2 *
T_F))
M_Web_2 = 0
M_CFRP_TOP = T_CFRP_W * T_CFRP_T * CFRP_Y * (Top_Plate_T - NA + D - T_F - 0.5
* T_CFRP_T)
M_Bottom_Flange = B_F * T_F * F_Y * (Top_Plate_T - NA + D - 0.5 * T_F)
M_CFRP_Bottom = B_CFRP_W * B_CFRP_T * CFRP_Y * (Top_Plate_T - NA + D + 0.5
* B_CFRP_T)
Else
If NA > Top_Plate_T And NA < (Top_Plate_T + T_F) Then ' plastic NA in top flange
M_Top_Plate_1 = Top_Plate_W * Top_Plate_T * F_Y * (NA - 0.5 * Top_Plate_T)
M_Top_Plate_2 = 0
M_Top_Flange_1 = B_F * (NA - Top_Plate_T) * F_Y * 0.5 * (NA - Top_Plate_T)
M_Top_Flange_2 = B_F * (Top_Plate_T + T_F - NA) * F_Y * 0.5 * (Top_Plate_T +
T_F - NA)
M_Web_1 = (D - 2 * T_F) * T_W * F_Y * (Top_Plate_T + T_F - NA + 0.5 * (D - 2 *
T_F))
M_Web_2 = 0
M_CFRP_TOP = T_CFRP_W * T_CFRP_T * CFRP_Y * (Top_Plate_T - NA + D - T_F -
0.5 * T_CFRP_T)
M_Bottom_Flange = B_F * T_F * F_Y * (Top_Plate_T - NA + D - 0.5 * T_F)
M_CFRP_Bottom = B_CFRP_W * B_CFRP_T * CFRP_Y * (Top_Plate_T - NA + D +
0.5 * B_CFRP_T)
Else ' plastic NA in Web

172
M_Top_Plate_1 = Top_Plate_W * Top_Plate_T * F_Y * (NA - 0.5 * Top_Plate_T)
M_Top_Plate_2 = 0
M_Top_Flange_1 = B_F * T_F * F_Y * (NA - Top_Plate_T - 0.5 * T_F)
M_Top_Flange_2 = 0
M_Web_1 = T_W * (NA - Top_Plate_T - T_F) * F_Y * 0.5 * (NA - Top_Plate_T -
T_F)
M_Web_2 = T_W * (D - T_F - NA + Top_Plate_T) * F_Y * 0.5 * (D - T_F - NA +
Top_Plate_T)
M_CFRP_TOP = T_CFRP_W * T_CFRP_T * CFRP_Y * (D - T_F - NA + Top_Plate_T -
0.5 * T_CFRP_T)
M_Bottom_Flange = B_F * T_F * F_Y * (D - 0.5 * T_F - NA + Top_Plate_T)
M_CFRP_Bottom = B_CFRP_W * B_CFRP_T * CFRP_Y * (D - NA + Top_Plate_T +
0.5 * B_CFRP_T)
End If
End If
M_Plastic = M_Top_Plate_1 + M_Top_Plate_2 + M_Top_Flange_1 + M_Top_Flange_2 +
M_Web_1 + M_Web_2 + M_CFRP_TOP + M_Bottom_Flange + M_CFRP_Bottom
End Function