Embed Size (px)
Citation preview
Strengthening the Regional Innovation ProfileSTRINNOP –
the Experiences with Regional Innovation Indicators
Metropolis II MeetingHelsinki, Finland
24th April 2003
Hans-Christian Jäger
2
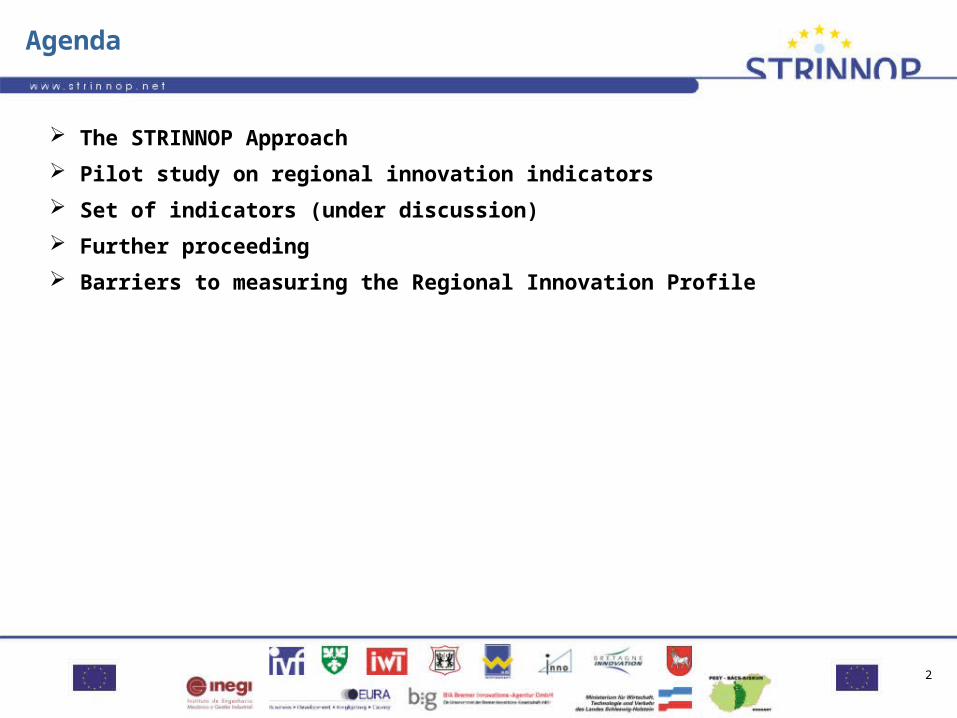
Agenda
The STRINNOP Approach
Pilot study on regional innovation indicators
Set of indicators (under discussion)
Further proceeding
Barriers to measuring the Regional Innovation Profile
3
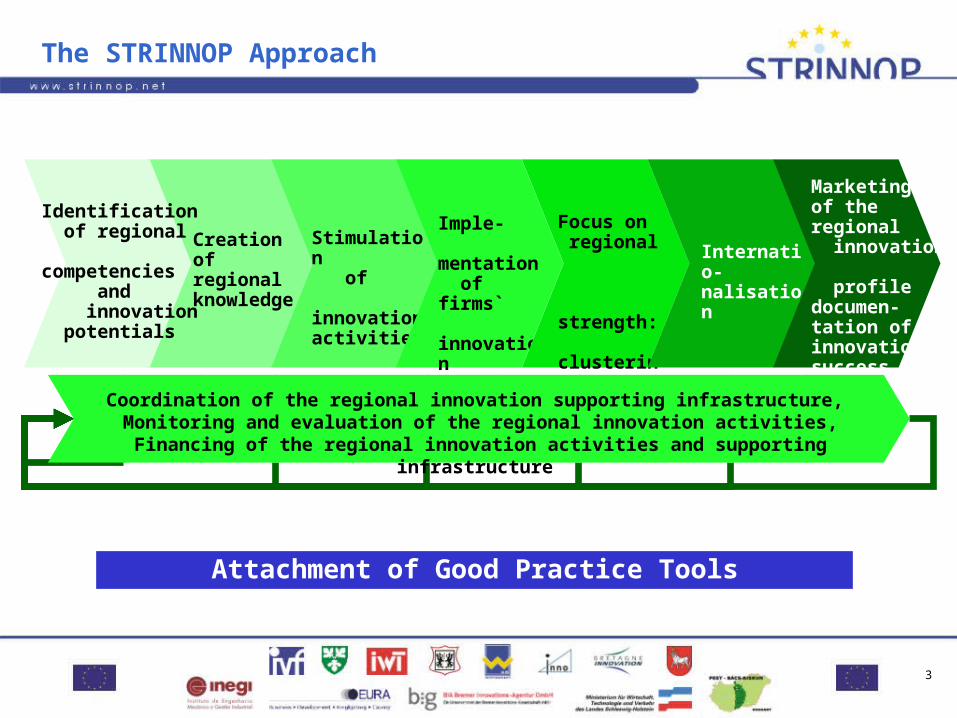
The STRINNOP Approach
Creationof regionalknowledge
Stimulation of innovation activities
Imple- mentation of firms` innovationactivities
Focus on regional strength: clustering andnetworking
Internatio-nalisation
Marketingof the regional innovation profiledocumen-tation of innovation success
Identification of regional competencies and innovation potentials
Coordination of the regional innovation supporting infrastructure, Monitoring and evaluation of the regional innovation activities,
Financing of the regional innovation activities and supporting infrastructure
Attachment of Good Practice Tools
4
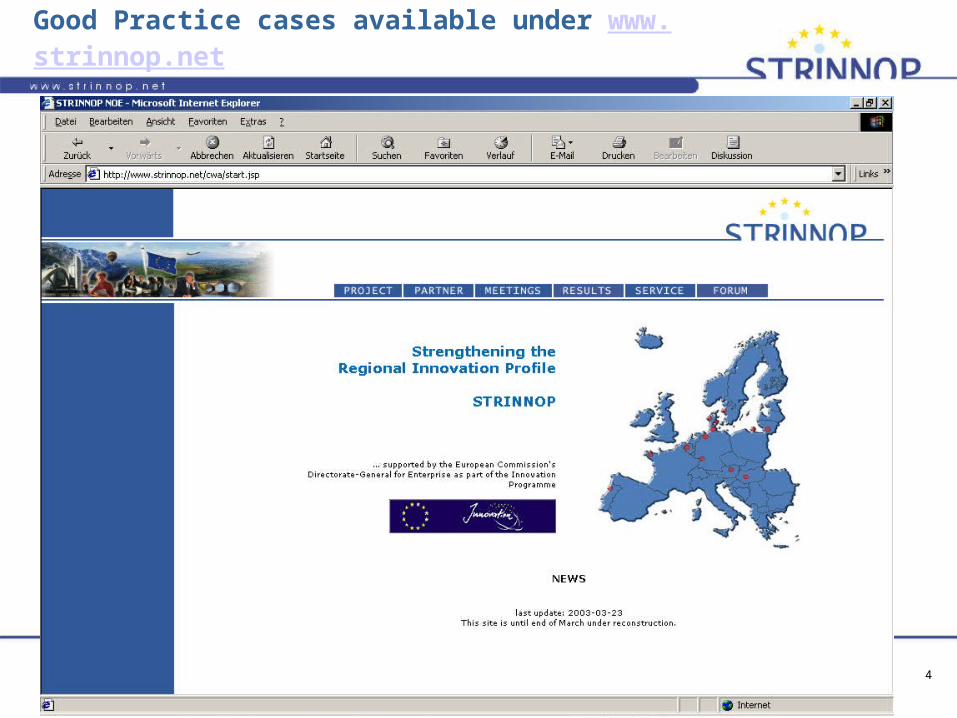
Good Practice cases available under www.strinnop.net
5
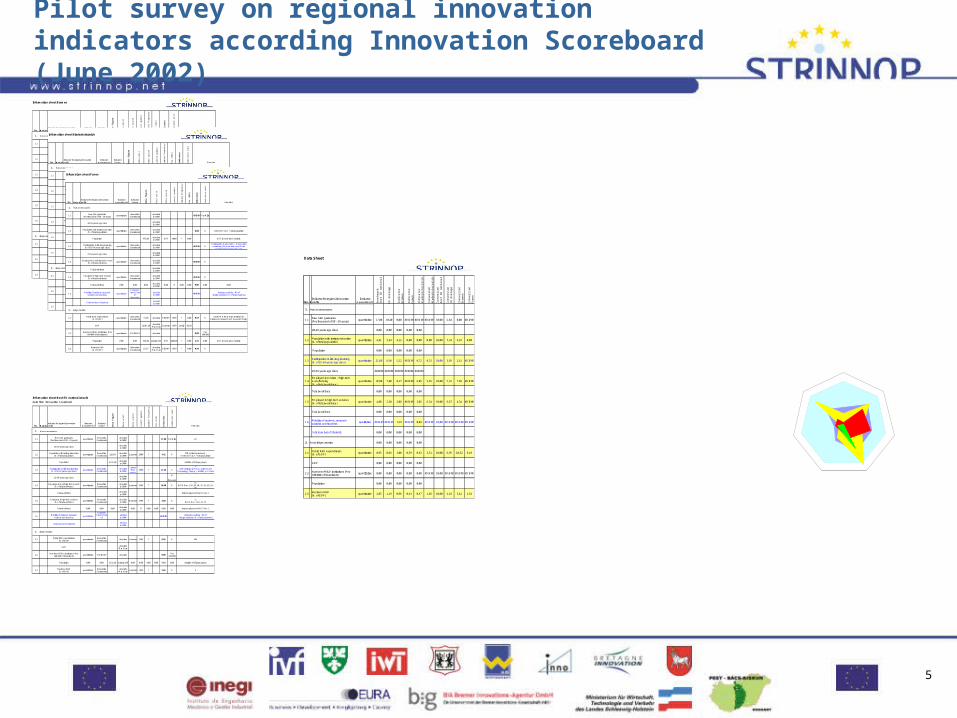
Pilot survey on regional innovation indicators according Innovation Scoreboard (June 2002)
Information sheet Bremen
No. Main indicatorsIndicator for regional innovation profile
Indicator measurement
Indicator Source D
ata
fig
ure
Dat
a un
iit
Dat
a so
urce
Late
st u
pdat
e
Upd
ate
Fre
quen
cy
Fee
(E
UR
)
Ind
icat
or
Indi
cato
r un
it
Remarks
1. Human ressources
1.1New S&E graduates
(Per thousand of 20 - 29 years)quantitative
Innovation Scoreboard
absolutein 1000
Eurostat 1997 yearly 83,85 0,00 Pro Mille
20-29 years age class 81,20absolutein 1000
Eurostat 2000 yearly 83,85
1.2Population with tertiary education
(% of total population)quantitative
Innovation Scoreboard
27,30absolutein 1000
Eurydice 1997 yearly 0,00 4,12 % Tot ISCED 5,6,7 / Total population
(not only 25-64 years)
Population 663,10absolutein 1000
Eurostat 2000 yearly 83,85 addition of all age groups
1.3Participation in life-long learning
(% of 25-64 years age class)quantitative
Innovation Scoreboard
19,91absolutein 1000
Eurostat 1997 yearly 83,85 5,22 % Participation to education = In education
or training (25 years and over) /Total number 25-64 years class age
25-64 years age class 381,30absolutein 1000
Eurostat 2000 yearly 83,85In
thousand
1.4Employed in med/high-tech manuf.
(% of total workforce)quantitative
Innovation Scoreboard
22,65absolutein 1000
Eurostat 1999 yearly 83,85 8,27 % NACE Rev. 1 24, 29, 30, 31, 32, 33, 34, 35
Total workforce 274,00absolutein 1000
Eurostat 1999 yearly 83,85 total employment NACE Rev. 1
1.5Employed in high-tech services
(% of total workforce)quantitative
Innovation Scoreboard
5,71absolutein 1000
Eurostat 1999 yearly 83,85 2,08 %NACE Rev. 1 64, 72, 73
Substraction HT tot -HT manuf
Total workforce 0,00 0,00 274,00absolutein 1000
Eurostat 1999 yearly 83,85 0,00 0,00 total employment NACE Rev. 1
1.6Mobility of students, research
workers and teachersquantitative
European Trend Chart
of Innovation
2,20absolutin 1000
Eurostat 1997 yearly 83,85 1,59 Indicator could be : Nb of
foreign students ( % of total students)
Total number of students and pupils 138,50absolutin 1000
Eurostat 1997 yearly 83,85
2.Knowledge creation
2.1Public R&D expenditures
(% of GDP)quantitative
Innovation Scoreboard
213,96absoluteMio. Euro
Eurostat 1997 1,00 % Expenditures from governmental and higher education institutions
GDP 21413,60absoluteMio. Euro
Eurostat 1999 yearly 83,85
2.2Number of R&D institutions (Per
100.000 of inhabitants)quantitative STRINNOP absolute 0,00
Per100.000
Population 0,00 0,00 663,10absolutein 1000Eurostat ###### yearly 83,85 0,00 0,00 addition of all age groups
2.3Business R&D
(% of GDP)quantitative
Innovation Scoreboard
208,87absoluteMio. Euro
Eurostat 1997 0,98 %
Information sheet Best EU national result
data from Innovation Scorebord
No. Main indicatorsIndicator for regional innovation profile
Indicator measurement
Indicator Source D
ata
fig
ure
Dat
a un
iit
Dat
a so
urce
Late
st u
pdat
e
Upd
ate
Fre
quen
cy
Fee
(E
UR
)
Ind
icat
or
Indi
cato
r un
it
Remarks
1. Human ressources
1.1New S&E graduates
(Per thousand of 20 - 29 years)quantitative
Innovation Scoreboard
absolutein 1000
17,80 Pro Mille UK
20-29 years age classabsolutein 1000
1.2Population with tertiary education
(% of total population)quantitative
Innovation Scoreboard
226,50absolutein 1000
Eurostat 2000 ? 4,41 %FIN (selbst berechnet) ;
Tot ISCED 5,6,7 / Total population
Population 5132,30absolutein 1000
addition of all age groups
1.3Participation in life-long learning
(% of 25-64 years age class)quantitative
Innovation Scoreboard
absolutein 1000
Labourforce
survey2000 ? 21,60 %
S;See Statistics in Focus, Science and
Technology, Theme ) - 6/2001, p. 5. Data available for only 5 EU countries, average
25-64 years age classabsolutein 1000
In
thousand
1.4Employed in med/high-tech manuf.
(% of total workforce)quantitative
Innovation Scoreboard
absolutein 1000
Eurostat 1999 ? 10,90 %D;
NACE Rev. 1 24, 29, 30, 31, 32, 33, 34, 35
Total workforceabsolutein 1000
total employment NACE Rev. 1
1.5Employed in high-tech services
(% of total workforce)quantitative
Innovation Scoreboard
absolutein 1000
Eurostat 1999 ? 4,80 %S;
NACE Rev. 1 64, 72, 73
Total workforce 0,00 0,00 0,00absolutein 1000
0,00 0 0,00 0,00 0,00 0,00 total employment NACE Rev. 1
1.6Mobility of students, research
workers and teachersquantitative
European Trend Chart
of Innovation
absolutin 1000
#DIV/0! Indicator could be : Nb of
foreign students ( % of total students)
Total number of studentsabsolutin 1000
2.Knowledge creation
2.1Public R&D expenditures
(% of GDP)quantitative
Innovation Scoreboard
absolute Eurostat 1999 ? 0,95 % FIN
GDPabsoluteMio. Euro
2.2Number of R&D institutions (Per
100.000 of inhabitants)quantitative STRINNOP absolute 0,00
Per100.000
Population 0,00 0,00 5132,30absolutein 1000 0,00 0,00 0,00 0,00 0,00 0,00 addition of all age groups
2.3Business R&D
(% of GDP)quantitative
Innovation Scoreboard
absoluteMio. Euro
Eurostat 1999 ? 2,85 % S
Information sheet Niederösterreich
No. Main indicatorsIndicator for regional innovation profile
Indicator measurement
Indicator Source D
ata
fig
ure
Dat
a un
iit
Dat
a so
urce
Late
st u
pdat
e
Upd
ate
Fre
quen
cy
Fee
(E
UR
)
Ind
icat
or
Indi
cato
r un
it
Remarks
1. Human ressources
1.1New S&E graduates
(Per thousand of 20 - 29 years)quantitative
Innovation Scoreboard
absolutein 1000
#DIV/0! Pro Mille
20-29 years age classabsolutein 1000
Eurostat 2000 yearly 83,85
1.2Population with tertiary education
(% of total population)quantitative
Innovation Scoreboard
absolutein 1000
0,00 % Tot ISCED 5,6,7 / Total population
Population 1540,50absolutein 1000
Eurostat 2000 yearly 83,85 addition of all age groups
1.3Participation in life-long learning
(% of 25-64 years age class)quantitative
Innovation Scoreboard
6,10absolutein 1000
Eurostat 1996 yearly 83,85 0,72 % Participation to education = In education
or training (25 years and over) /Total number 25-64 years class age
25-64 years age class 848,30absolutein 1000
Eurostat 2000 yearly 83,85In
thousand
1.4Employed in med/high-tech manuf.
(% of total workforce)quantitative
Innovation Scoreboard
42,01absolutein 1000
Eurostat 1999 yearly 83,85 6,05 % NACE Rev. 1 24, 29, 30, 31, 32, 33, 34, 35
Total workforce 693,82absolutein 1000
Eurostat 1999 yearly 83,85 total employment NACE Rev. 1
1.5Employed in high-tech services
(% of total workforce)quantitative
Innovation Scoreboard
21,13absolutein 1000
Eurostat 1999 yearly 83,85 3,05 % NACE Rev. 1 64, 72, 73
Total workforce 0,00 0,00 693,82absolutein 1000
Eurostat 1999 yearly 83,85 0,00 0,00 total employment NACE Rev. 1
1.6Mobility of students, research
workers and teachersquantitative
European Trend Chart
of Innovation
0,10absolutin 1000
Eurostat 1997 yearly 83,85 0,04 Indicator could be : Nb of
foreign students ( % of total students)
Total number of students 265,30absolutin 1000
Eurostat 1996 yearly 83,85
2.Knowledge creation
2.1Public R&D expenditures
(% of GDP)quantitative
Innovation Scoreboard
104,82 absolute ÖSTAT 1993 0,33 % "Bruttoinlandsaufwendungen für F+E"
GDP 31458,40absoluteMio. Euro
Eurostat 1999 yearly 83,85
2.2Number of R&D institutions (Per
100.000 of inhabitants)quantitative STRINNOP absolute 0,00
Per100.000
Population 0,00 0,00 1540,50absolutein 1000Eurostat ###### yearly 83,85 0,00 0,00 addition of all age groups
2.3Business R&D
(% of GDP)quantitative
Innovation Scoreboard
148,51absoluteMio. Euro
ÖSTAT 1993 0,47 % from JTK, Inno AT
Information sheet Funen
No. Main indicatorsIndicator for regional innovation profile
Indicator measurement
Indicator Source D
ata
fig
ure
Dat
a un
iit
Dat
a so
urce
Late
st u
pdat
e
Upd
ate
Fre
quen
cy
Fee
(E
UR
)
Ind
icat
or
Indi
cato
r un
it
Remarks
1. Human ressources
1.1New S&E graduates
(Per thousand of 20 - 29 years)quantitative
Innovation Scoreboard
absolutein 1000
#DIV/0! Pro Mille
20-29 years age classabsolutein 1000
1.2Population with tertiary education
(% of total population)quantitative
Innovation Scoreboard
absolutein 1000
0,00 % Tot ISCED 5,6,7 / Total population
Population 472,06absolutein 1000
DST 2000 ? 0,00 DST is Danmarks Statistik
1.3Participation in life-long learning
(% of 25-64 years age class)quantitative
Innovation Scoreboard
absolutein 1000
#DIV/0! % Participation to education = In education
or training (25 years and over) /Total number 25-64 years class age
25-64 years age classabsolutein 1000
1.4Employed in med/high-tech manuf.
(% of total workforce)quantitative
Innovation Scoreboard
absolutein 1000
#DIV/0! %
Total workforceabsolutein 1000
1.5Employed in high-tech services
(% of total workforce)quantitative
Innovation Scoreboard
absolutein 1000
#DIV/0! %
Total workforce 0,00 0,00 0,00absolutein 1000
0,00 0 0,00 0,00 0,00 0,00 0,00
1.6Mobility of students, research
workers and teachersquantitative
European Trend Chart
of Innovation
absolutin 1000
#DIV/0! Indicator could be : Nb of
foreign students ( % of total students)
Total number of studentsabsolutin 1000
2.Knowledge creation
2.1Public R&D expenditures
(% of GDP)quantitative
Innovation Scoreboard
71,65 absolute DISRRP 1999 ? 0,00 0,59 %DISRRP is the Danish Institute for
Studies in Research and Research Policy
GDP 12181,30absoluteMio. Euro
Eurostat 1999 yearly 83,85
2.2Number of R&D institutions (Per
100.000 of inhabitants)quantitative STRINNOP absolute 0,00
Per100.000
Population 0,00 0,00 472,06absolutein 1000 DST ###### ? 0,00 0,00 0,00 DST is Danmarks Statistik
2.3Business R&D
(% of GDP)quantitative
Innovation Scoreboard
53,37absoluteMio. Euro
DISRRP 1999 ? 0,00 0,44 %
Data Sheet
No. Main indicatorsIndicator for regional innovation profile
Indicator measurement B
en
chm
ark
Be
st E
U n
atio
na
l re
sult
EU
Ave
rag
e
Ind
ica
tor
Bre
me
n
Ind
ica
tor
Fu
ne
n
Ind
ica
tor
Nie
de
röst
err
eic
h
Co
nve
rsio
nN
ied
erö
ste
rre
ich
Co
nve
rsio
nB
est
EU
na
tion
al r
esu
lt
Co
nve
rsio
nE
U A
vera
ge
Co
nve
rsio
nB
rem
en
Co
nve
rsio
nF
un
en
1. Human ressources
1.1New S&E graduates(Per thousand of 20 - 29 years)
quantitative 17,80 10,40 0,00 #DIV/0! #DIV/0! #DIV/0! 10,00 5,84 0,00 #DIV/0!
20-29 years age class 0,00 0,00 0,00 0,00 0,00
1.2Population with tertiary education(% of total population)
quantitative 4,41 3,24 4,12 0,00 0,00 0,00 10,00 7,34 9,33 0,00
Population 0,00 0,00 0,00 0,00 0,00
1.3Participation in life-long learning(% of 25-64 years age class)
quantitative 21,60 8,40 5,22 #DIV/0! 0,72 0,33 10,00 3,89 2,42 #DIV/0!
25-64 years age class ###### ###### ###### ###### ######
1.4Employed in medium / high-tech manufactuing(% of total workforce)
quantitative 10,90 7,80 8,27 #DIV/0! 6,05 5,55 10,00 7,16 7,58 #DIV/0!
Total workforce 0,00 0,00 0,00 0,00 0,00
1.5Employed in high-tech services(% of total workforce)
quantitative 4,80 3,20 2,08 #DIV/0! 3,05 6,34 10,00 6,67 4,34 #DIV/0!
Total workforce 0,00 0,00 0,00 0,00 0,00
1.6Mobility of students, research workers and teachers
qualitative #DIV/0! #DIV/0! 1,59 #DIV/0! 0,04 #DIV/0! 10,00 #DIV/0! #DIV/0! #DIV/0!
Total number of students 0,00 0,00 0,00 0,00 0,00
2. Knowledge creation 0,00 0,00 0,00 0,00 0,00
2.1Public R&D expenditures (% of GDP)
quantitative 0,95 0,66 1,00 0,59 0,33 3,51 10,00 6,95 10,52 6,19
GDP 0,00 0,00 0,00 0,00 0,00
2.2Number of R&D institutions (Per 100.000 of inhabitants)
quantitative 0,00 0,00 0,00 0,00 0,00 #DIV/0! 10,00 #DIV/0! #DIV/0! #DIV/0!
Population 0,00 0,00 0,00 0,00 0,00
2.3Business R&D(% of GDP)
quantitative 2,85 1,19 0,98 0,44 0,47 1,66 10,00 4,18 3,42 1,54
Benchmarking HB-FU-NÖfor 7 innovation criteria
1.3 Participation in life-long learning(% of 25-64 years age class)
1.4 Employed in medium / high-tech manufactuing(% of total workforce)
1.5 Employed in high-tech services(% of total workforce)
2.1 Public R&D expenditures (% of GDP)
2.3 Business R&D(% of GDP)
2.6 High-tech EPO patents(Per million of population)
2.5 R&D Personnel(% of total workforce)
Best EU country
EU average
Bremen
Niederösterreich
Funen
Benchmarking Bremen / EUfor 7 innovation criteria
1.3 Participation in life-long learning(% of 25-64 years age class)
1.4 Employed in medium / high-tech manufactuing(% of total workforce)
1.5 Employed in high-tech services(% of total workforce)
2.1 Public R&D expenditures (% of GDP)
2.3 Business R&D(% of GDP)
2.6 High-tech EPO patents(Per million of population)
2.5 R&D Personnel(% of total workforce)
Best EU country
EU average
Bremen
Benchmarking Funen / EUfor 7 innovation criteria
1.3 Participation in life-long learning(% of 25-64 years age class)
1.4 Employed in medium / high-tech manufactuing(% of total workforce)
1.5 Employed in high-tech services(% of total workforce)
2.1 Public R&D expenditures (% of GDP)
2.3 Business R&D(% of GDP)
2.6 High-tech EPO patents(Per million of population)
2.5 R&D Personnel(% of total workforce)
Best EU country
EU average
Funen
Benchmarking Niederösterreich / EUfor 7 innovation criteria
1.3 Participation in life-long learning(% of 25-64 years age class)
1.4 Employed in medium / high-tech manufactuing(% of total workforce)
1.5 Employed in high-tech services(% of total workforce)
2.1 Public R&D expenditures (% of GDP)
2.3 Business R&D(% of GDP)
2.6 High-tech EPO patents(Per million of population)
2.5 R&D Personnel(% of total workforce)
Best EU country
EU average
Niederösterreich
Regional information sheets
Information sheet EU average
data from Innovation Scorebord
No. Main indicatorsIndicator for regional innovation profile
Indicator measurement
Indicator Source D
ata
fig
ure
Dat
a un
iit
Dat
a so
urce
Late
st u
pdat
e
Upd
ate
Fre
quen
cy
Fee
(E
UR
)
Ind
icat
or
Indi
cato
r un
it
Remarks
1. Human ressources
1.1New S&E graduates
(Per thousand of 20 - 29 years)quantitative
Innovation Scoreboard
absolutein 1000
Eurostat 1999 yearly 10,40 Pro Mille
20-29 years age classabsolutein 1000
Found in www.scb.se
1.2Population with tertiary education
(% of total population)quantitative
Innovation Scoreboard
12148,10absolutein 1000
Eurydice 1997 yearly 0,00 3,24 % Tot ISCED 5,6,7 / Total population
Population 374845,70absolutein 1000
addition of all age groups
1.3Participation in life-long learning
(% of 25-64 years age class)quantitative
Innovation Scoreboard
absolutein 1000
Labour forcesurvey
2000 ? 0,00 8,40 %Participation to education = In education
or training (25 years and over) /Total number 25-64 years class age
25-64 years age classabsolutein 1000
In
thousand
1.4Employed in med/high-tech manuf.
(% of total workforce)quantitative
Innovation Scoreboard
absolutein 1000
Eurostat 1999 ? 7,80 % NACE Rev. 1 24, 29, 30, 31, 32, 33, 34, 35
Total workforceabsolutein 1000
total employment NACE Rev. 1
1.5Employed in high-tech services
(% of total workforce)quantitative
Innovation Scoreboard
absolutein 1000
Eurostat 1999 ? 3,20 % NACE Rev. 1 64, 72, 73
Total workforce 0,00 0,00 0,00absolutein 1000
0,00 0 0,00 0,00 0,00 0,00 total employment NACE Rev. 1
1.6Mobility of students, research
workers and teachersquantitative
European Trend Chart
of Innovation
absolutin 1000
#DIV/0! Indicator could be : Nb of
foreign students ( % of total students)
Total number of studentsabsolutin 1000
2.Knowledge creation
2.1Public R&D expenditures
(% of GDP)quantitative
Innovation Scoreboard
absolute Eurostat 1996 ? 0,66 %
GDPabsoluteMio. Euro
2.2Number of R&D institutions (Per
100.000 of inhabitants)quantitative STRINNOP absolute 0,00
Per100.000
Population 0,00 0,00 374845,70absolutein 1000 0,00 0,00 0,00 0,00 0,00 0,00 addition of all age groups
2.3Business R&D
(% of GDP)quantitative
Innovation Scoreboard
absoluteMio. Euro
1,19 % BERD/GDPSheets on best EU national resultsand EU average
For a particular region: regional comparison to EU best national result and EU average
0,95
0,66
1,00
0,59
0,33
0,00
0,20
0,40
0,60
0,80
1,00
1,20
1,40
1,60
1,80
2,00
2.1 Public R&D expenditures (% of GDP)
Best EU country
EU Average
Bremen
Funen
Niederösterreich Comparison ofregional data
for particular criterions
Data sheetwith all regions
„overview web“
6
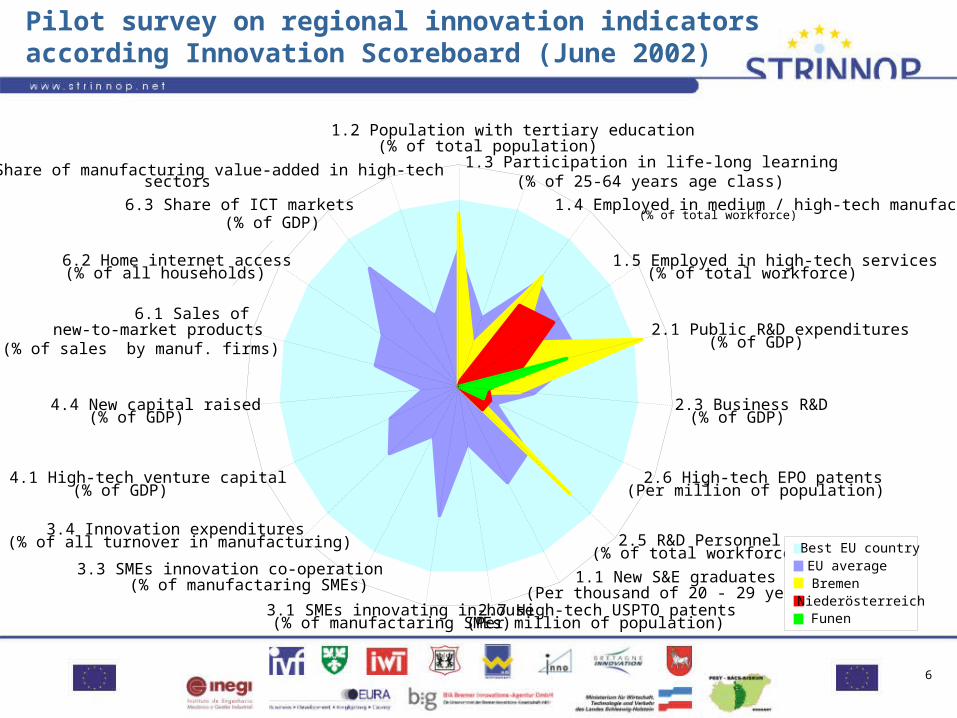
Pilot survey on regional innovation indicators according Innovation Scoreboard (June 2002)
1.2 Population with tertiary education(% of total population)
1.3 Participation in life-long learning(% of 25-64 years age class)
1.4 Employed in medium / high-tech manufactuing(% of total workforce)
1.5 Employed in high-tech services(% of total workforce)
2.1 Public R&D expenditures (% of GDP)
2.3 Business R&D(% of GDP)
2.6 High-tech EPO patents(Per million of population)
2.5 R&D Personnel(% of total workforce)
1.1 New S&E graduates(Per thousand of 20 - 29 years)
2.7 High-tech USPTO patents(Per million of population)
3.1 SMEs innovating in-house(% of manufactaring SMEs)
3.3 SMEs innovation co-operation(% of manufactaring SMEs)
3.4 Innovation expenditures(% of all turnover in manufacturing)
4.1 High-tech venture capital(% of GDP)
4.4 New capital raised(% of GDP)
6.1 Sales of new-to-market products
(% of sales by manuf. firms)
6.2 Home internet access(% of all households)
6.3 Share of ICT markets(% of GDP)
6.4 Share of manufacturing value-added in high-techsectors
Best EU countryEU averageBremenNiederösterreichFunen
7
Consequence of these findings
Development of a set of indicators
Assigned to single STRINNOP steps
Including quantitative indicators of European Innovation Scoreboard, which are already available on regional level (or can be made available within a manageable effort)
Including quantitative and qualitative indicators,eg. from the analyses of RITTS/RIS-projects, further surveys,expert enquiries
under its way …
8
Set of indicators according (under discussion)STRINNOP Approach – step 1
Identification of regional competencies and innovation potentials
1.1 Transparency of regional know-how and competencies
1.2 Transparency of firms’ needs in innovation support
1.3 RNSII (Regional National Summary Innovation Index)
1.4 RRSII (Revealed Regional Summary Innovation Index)
Identification of regional competencies and innovation potentials
9
Creationof regionalknowledge
Set of indicators according (under discussion) STRINNOP Approach – step 2
Creation of regional knowledge 2.1 Population with a tertiary education
(% of 25-64 years age classes) 2.2 Participation in life-long learning
(% of 25-64 years olds) 2.3 Public R&D Expenditure (GERD – BERD)
(% GDP) 2.4 Business Expenditure on R&D (BERD)
(% GDP 2.5 High-tech EPO patent applications
(per million population) 2.6 Adequate interfaces at technology providers 2.7 Education and training with respect to
future entrepreneurs 2.8 % national technology leadership
(of total sample of firms) 2.9 International technology leadership
10
Stimulation of innovation activities
Set of indicators according (under discussion) STRINNOP Approach – step 3
Stimulation of innovation activities
3.1 Existence of "regional innovation culture" and "entrepreneurship culture”
3.2 Existence of proactive approach to contact firms'
3.3 Communication platform to facilitate firms' access to technology and service providers
3.4 Range of stimulation activities and quality
3.5 Existence of (pre-)seed activities
11
Imple- mentation of firms` innovationactivities
Set of indicators according (under discussion) STRINNOP Approach – step 4
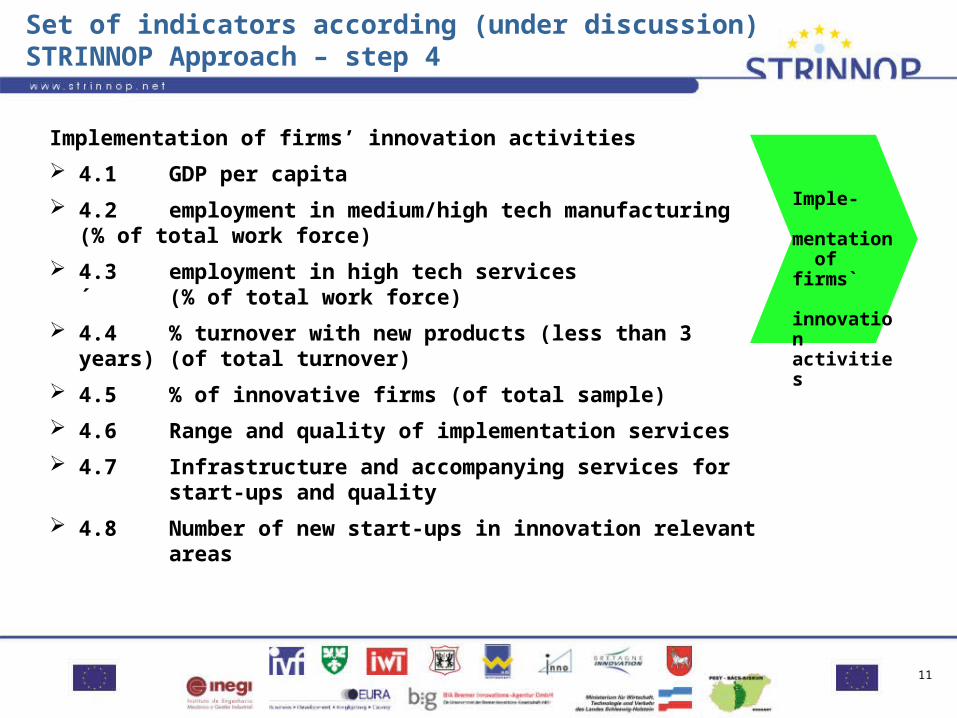
Implementation of firms’ innovation activities
4.1 GDP per capita
4.2 employment in medium/high tech manufacturing (% of total work force)
4.3 employment in high tech services ´ (% of total work force)
4.4 % turnover with new products (less than 3 years) (of total turnover)
4.5 % of innovative firms (of total sample)
4.6 Range and quality of implementation services
4.7 Infrastructure and accompanying services for start-ups and quality
4.8 Number of new start-ups in innovation relevant areas
12
Focus on regional strength: clustering andnetworking
Set of indicators according (under discussion) STRINNOP Approach – step 5
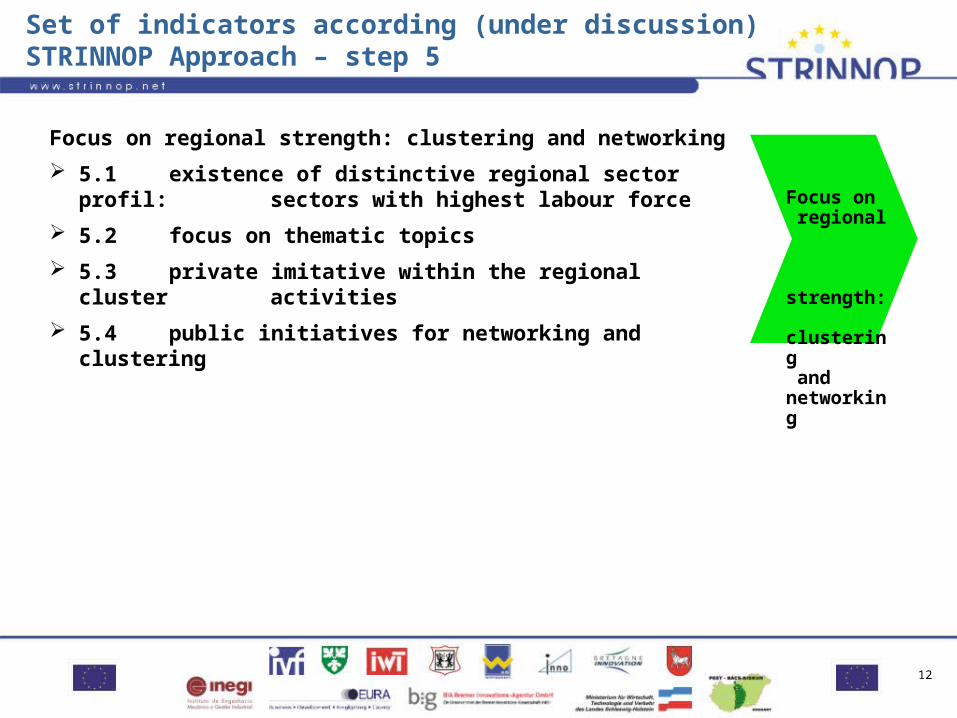
Focus on regional strength: clustering and networking
5.1 existence of distinctive regional sector profil: sectors with highest labour force
5.2 focus on thematic topics
5.3 private imitative within the regional cluster activities
5.4 public initiatives for networking and clustering

13
Internatio-nalisation
Set of indicators according (under discussion) STRINNOP Approach – step 6
Internationalisation
6.1 % of export / total turnover
6.2 Existence of international networks
6.3 Range and quality of services to foster firms’ internationalisation activities
14
Marketingof the regional innovation profiledocumen-tation of innovation success
Set of indicators according (under discussion) STRINNOP Approach – step 7
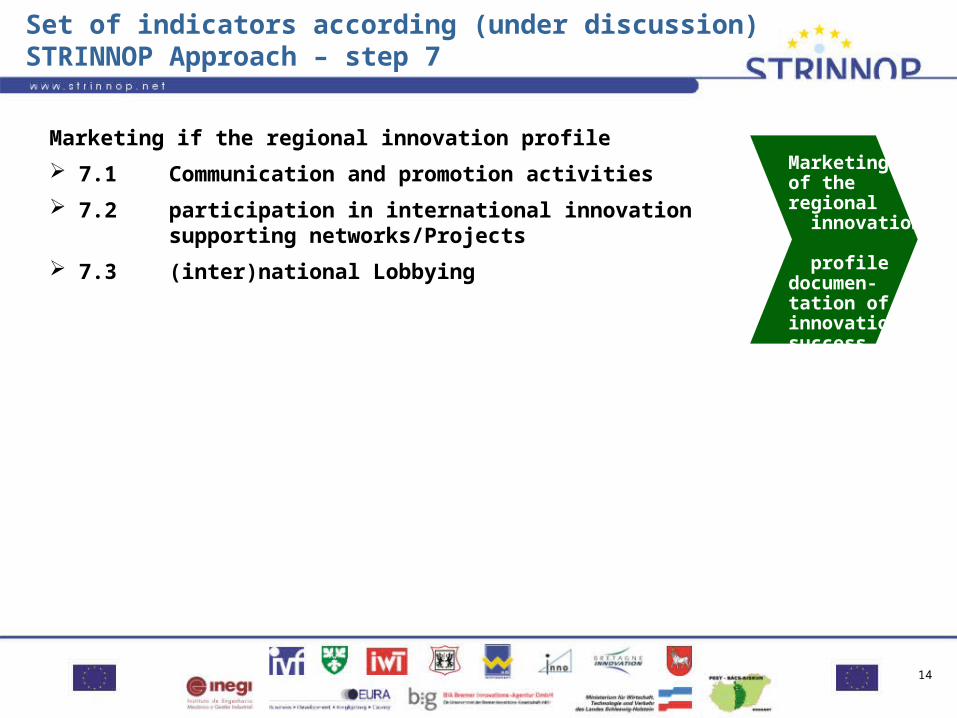
Marketing if the regional innovation profile
7.1 Communication and promotion activities
7.2 participation in international innovation supporting networks/Projects
7.3 (inter)national Lobbying
15
Set of indicators according (under discussion) STRINNOP Approach – step 8
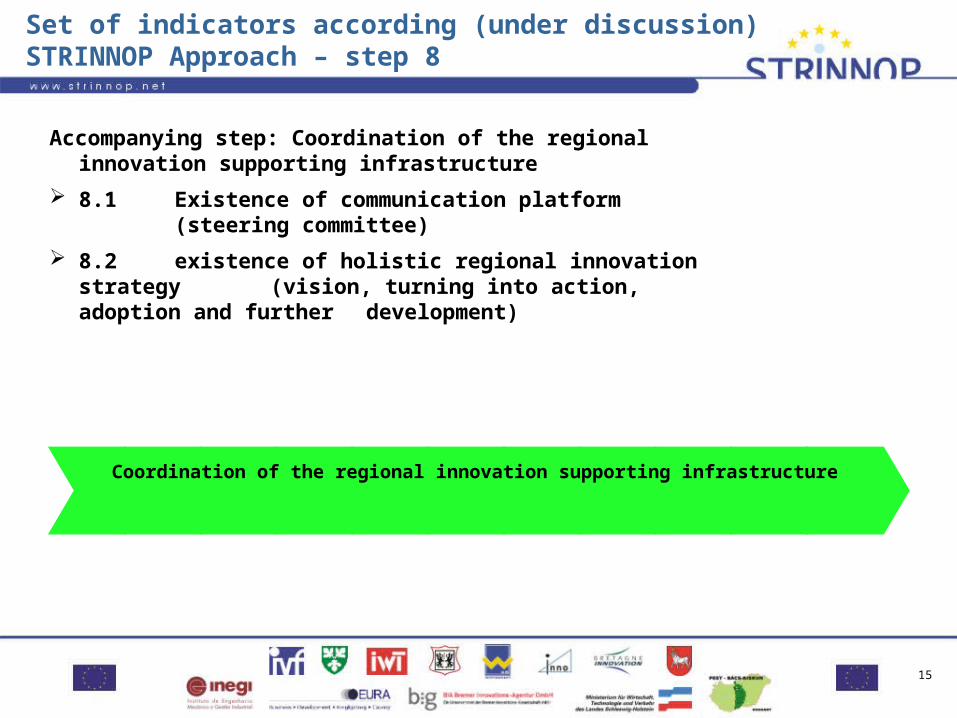
Accompanying step: Coordination of the regional innovation supporting infrastructure
8.1 Existence of communication platform (steering committee)
8.2 existence of holistic regional innovation strategy (vision, turning into action, adoption and further development)
Coordination of the regional innovation supporting infrastructure
16
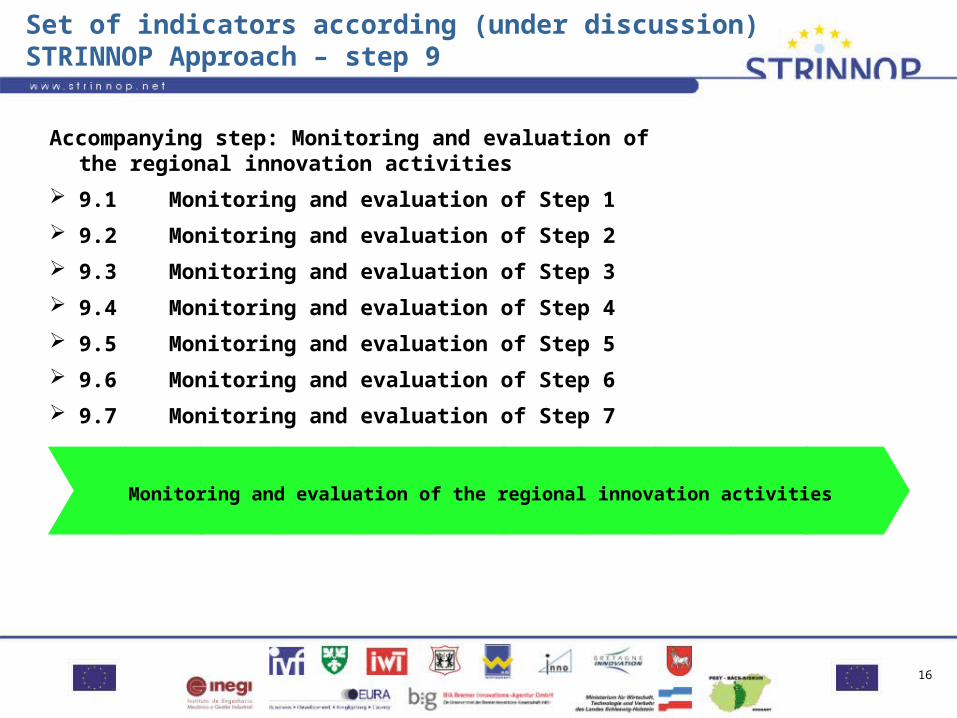
Set of indicators according (under discussion) STRINNOP Approach – step 9
Accompanying step: Monitoring and evaluation of the regional innovation activities
9.1 Monitoring and evaluation of Step 1
9.2 Monitoring and evaluation of Step 2
9.3 Monitoring and evaluation of Step 3
9.4 Monitoring and evaluation of Step 4
9.5 Monitoring and evaluation of Step 5
9.6 Monitoring and evaluation of Step 6
9.7 Monitoring and evaluation of Step 7
Monitoring and evaluation of the regional innovation activities
17
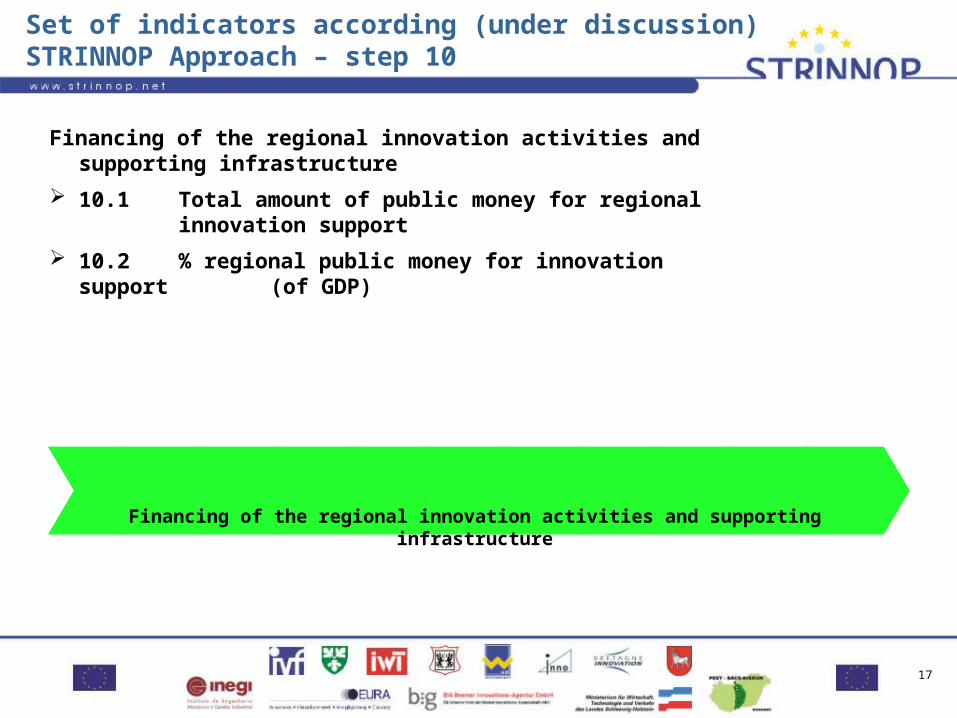
Set of indicators according (under discussion) STRINNOP Approach – step 10
Financing of the regional innovation activities and supporting infrastructure
10.1 Total amount of public money for regional innovation support
10.2 % regional public money for innovation support (of GDP)
Financing of the regional innovation activities and supporting infrastructure
18
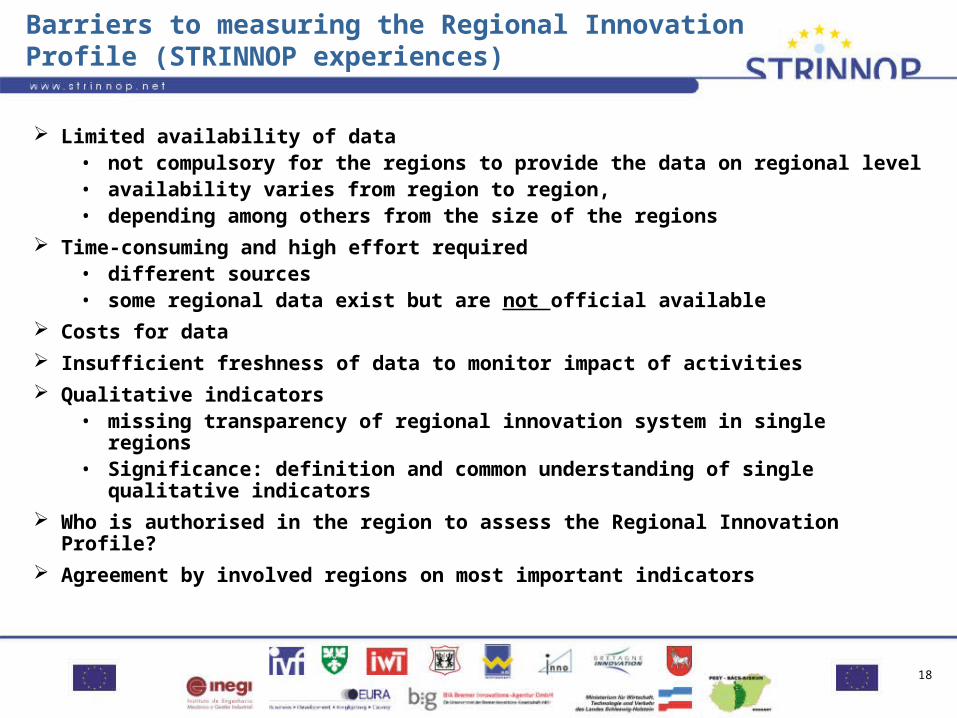
Barriers to measuring the Regional Innovation Profile (STRINNOP experiences)
Limited availability of data• not compulsory for the regions to provide the data on regional level• availability varies from region to region,• depending among others from the size of the regions
Time-consuming and high effort required• different sources• some regional data exist but are not official available
Costs for data Insufficient freshness of data to monitor impact of activities Qualitative indicators
• missing transparency of regional innovation system in single regions
• Significance: definition and common understanding of single qualitative indicators
Who is authorised in the region to assess the Regional Innovation Profile?
Agreement by involved regions on most important indicators
19
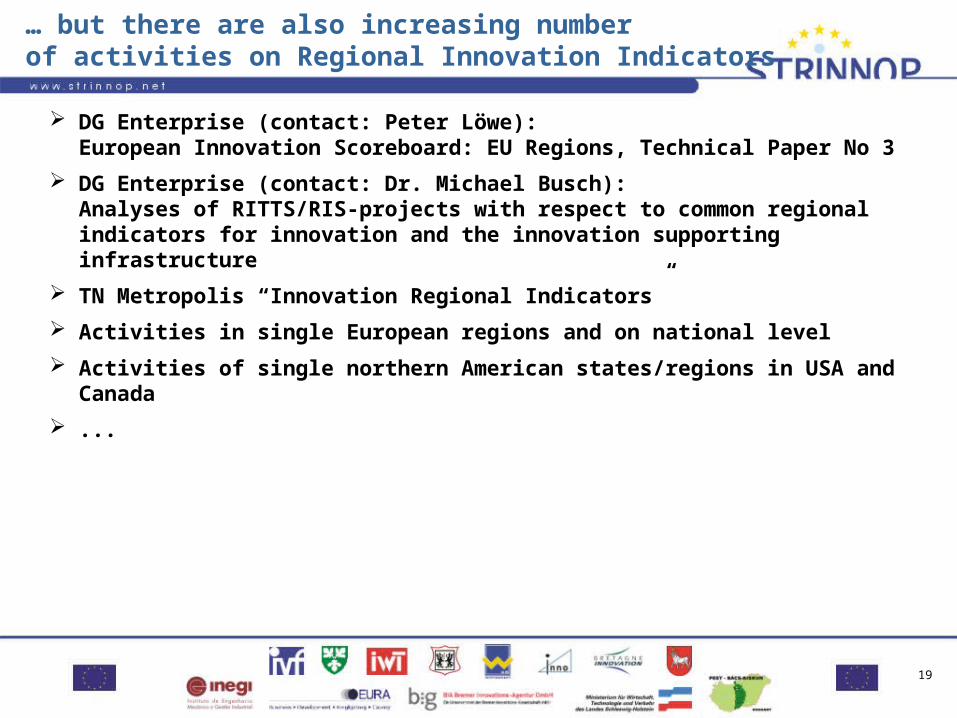
… but there are also increasing number of activities on Regional Innovation Indicators
DG Enterprise (contact: Peter Löwe):European Innovation Scoreboard: EU Regions, Technical Paper No 3
DG Enterprise (contact: Dr. Michael Busch):Analyses of RITTS/RIS-projects with respect to common regional indicators for innovation and the innovation supporting infrastructure
TN Metropolis “Innovation Regional Indicators”
Activities in single European regions and on national level
Activities of single northern American states/regions in USA and Canada
...

20
Further proceeding of STRINNOP
Feedback of regions on suggested indicators
First drawing of Regional Innovation Profile by each STRINNOP member
(STRINNOP internal) Benchmark of Regional Innovation Profiles
Open STRINNOP Conference in Bremenon 16th & 17th October 2003
Thank you for your attention!