Embed Size (px)
Citation preview
STRESS FREE TEMPERATURE TESTING AND CALCULATIONS ON OUT-OF-AUTOCLAVE COMPOSITES
Sarah B. Cox,2 LaNetra C. Tate, 1 Susan E. Danley,2 Jeffrey W. Sampson, 1 Brian J. Taylor, 1
James K. Sutter3, Sandi G. Miller3
1Kennedy Space Center, Materials Engineering Branch, Materials Science Division 2Kennedy Space Center, Flight Structures & Thermal Protection Systems Branch, Mechanical Division 3Glenn Research Center, Polymers Branch, Structures and Materials Division
ABSTRACT
Future launch vehicles will require the incorporation of large composite parts that will make up primary and secondary components of the vehicle. NASA has explored the feasibility of manufacturing these large components using Out-of-Autoclave impregnated carbon fiber composite systems through many composites development projects. Most recently, the Composites for Exploration Project has been looking at the development of a 10 meter diameter fairing structure, similar in size to what will be required for a heavy launch vehicle. The development of new material systems requires the investigation of the material properties and the stress in the parts. Residual stress is an important factor to incorporate when modeling the stresses that a part is undergoing. Testing was performed to verify the stress free temperature with two-ply asymmetric panels. A comparison was done between three newly developed out of autoclave IM7/Bismaleimide (BMI) systems. This paper presents the testing results and the analysis performed to determine the stress free temperature of the materials.
1. INTRODUCTION
The Composites for Exploration project was started in order to advance the development of composite systems for large primary structure applications, such as a payload fairing similar in size to what is needed for a heavy lift vehicle like the Space Launch System. The goal was to demonstrate mass savings and cost savings over metal structures, while reducing the risk for use of composite structures on future NASA vehicles. A graphite/bismaleimide (BMI) system was chosen because of its high operating temperature, which reduces the amount of thermal protection needed, further decreasing the weight. Due to the size of the payload fairing, and in order to minimize the number of joints, the composite must be cured out of the autoclave. This led NASA to request an Out-of-Autoclave (OOA) composite system be developed that could be cured at 177°C. Three manufacturers provided materials, which are undergoing testing by NASA. Kennedy Space Center has been performing stress free temperature testing, which will be used for residual stress calculations, in support of this effort.
1.1 Residual Stress
Carbon fiber reinforced composites have residual stresses due to the coefficient of thermal expansion (CTE) mismatch between the carbon fiber and the resin matrix. Several studies have investigated the residual stress and stress free temperature of polymer matrix composites [1-5] .
https://ntrs.nasa.gov/search.jsp?R=20130011525 2018-08-16T19:36:03+00:00Z
As the material is cured, it develops an equilibrium state at the elevated temperature. As the material cools, stresses develop within the pmi. In order to better understand the mechanical behavior of this material, especially for use as a primary structure, it is important to understand how much stress is in the material under no external loading. McGinnis, et al, [6] give a residual stress equation for a two layer system (layers A and B):
(1)
Where
d = layer thickness
a = Coefficient of then11al expansion
~T = TsF- T
T sF= Stress Free Temperature
T =Current Temperature
v =Poisson's ratio
E =Young's Modulus
This equation shows a direct proportional relationship between the residual stress and ~ T. Therefore, the higher the stress free temperature, the higher the residual stress. If the highest loading environment of the composite pmi occurs at an elevated temperature, ~ T is reduced and thus, the residual stress in the part will be reduced.
Although the stress free temperature should theoretically be the cure temperature, it is still important to verify this value. There are two ways to detennine the stress free temperature. A study performed by Sandhu, et al, fabricated two ply asymmetric panels with the configuration [0/90] and then used Timoshenko's analysis ofbimetal thennostats, which uses the following equation [7]:
~T = (~) (~) (2)
Where
H= thickness of the specimen
R = radius of curvature at the reference temperature
A= 24.0(ao- a9o)
E~ E~ B = 14.0 +-t +-t
Ez El
a 0 = Coefficient of Thermal Expansion in the fiber direction
a9o = Coefficient of Thermal Expansion in the transverse to the fiber direction
E~ = tensile Young's modulus in fiber direction
E~ =tensile Young's modulus in transverse to fiber direction
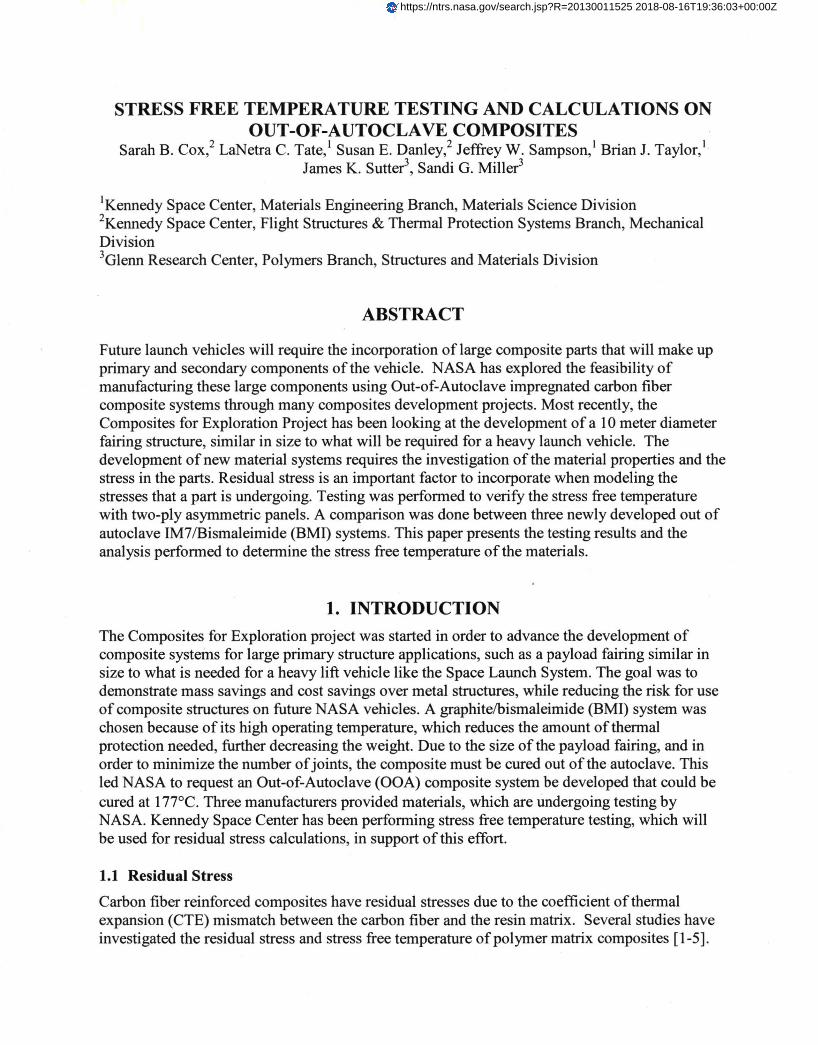
By having this unbalanced configuration, the panels are curved at room temperature, giving a visual indication of the stress within the panel (see Figure 1). The radius of the curved panel, along with Young's Modulus and the CTE, are used to find the stress free temperature. Sandhu, et al, explain that this method of obtaining the stress free temperature assumes small displacements and temperature independent elastic properties. [7]
The second way of determining the stress free temperature is to heat the 2 ply asymmetric panel until it is flat. Heating the panel releases these internal stresses and causes the panel to flatten out. When the panel is completely flat, it has reached its stress free temperature. This experimental data can then be compared to the results of Equation 2 above.
Figure 1. Example of a 2-ply Asymmetric Panel
2. EXPERIMENTATION
2.1 Test Panel Fabrication
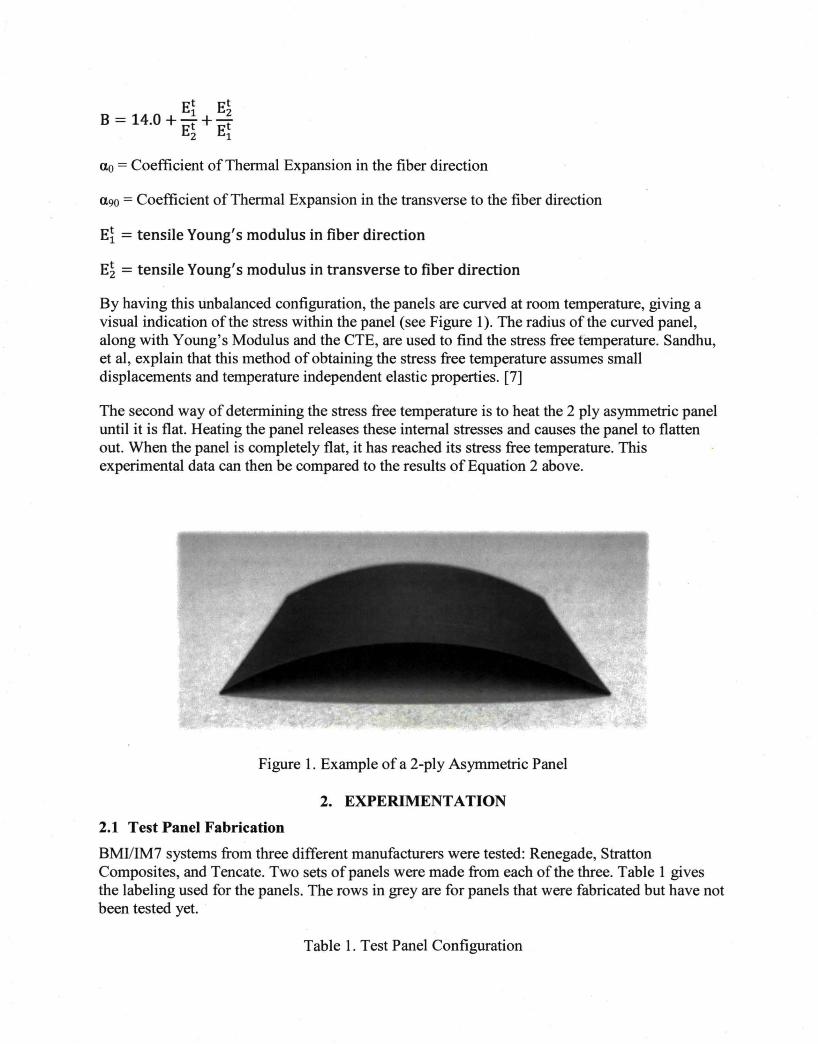
BMIIIM7 systems from three different manufacturers were tested: Renegade, Stratton Composites, and Tencate. Two sets of panels were made from each of the three. Table 1 gives the labeling used for the panels. The rows in grey are for panels that were fabricated but have not been tested yet.
Table 1. Test Panel Configuration
MANUFACTURE HEATED DEBULK
PANEL R PLIES SIZE OF PANEL (em) LAYUP TEMP (DEG C) SET CONDITION
615-R1 Renegade 2 15.2 X 15.2 [0/90] 40 1 1
615-R2 Renegade 2 15.2 X 15.2 [0/90] 40 1 2
615-S1 Stratton 2 15.2 X 15.2 [0/90] 40 1 1
615-S2 Stratton 2 15.2 X 15.2 [0/90] 40 1 2
615-T1 Tencate 2 15.2 X 15.2 [0/90] 30 1 1
615-T2 Tencate 2 15.2 X 15.2 [0/90] 30 1 2
630-R1 Renegade 2 15.2 X 15.2 [0/90] 60 2 1
630-R2 Renegade 2 15.2 X 15.2 [0/90] 60 2 2
630-S1 Stratton 2 15.2 X 15.2 [0/90] 60 2 1
630-S2 Stratton 2 15.2 X 15.2 [0/90] 60 2 2
630-T1 Tencate 2 15.2 X 15.2 [0/90] 60 2 1
630-T2 Tencate 2 15.2 X 15.2 [0/90] 60 2 2
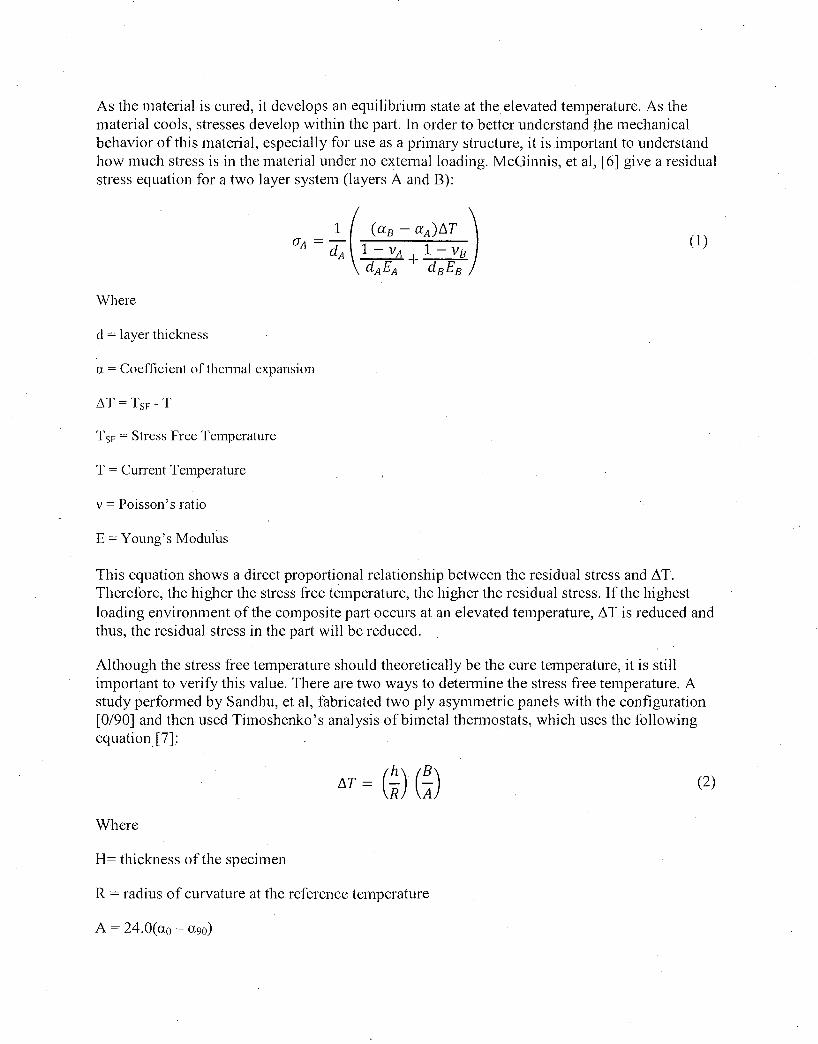
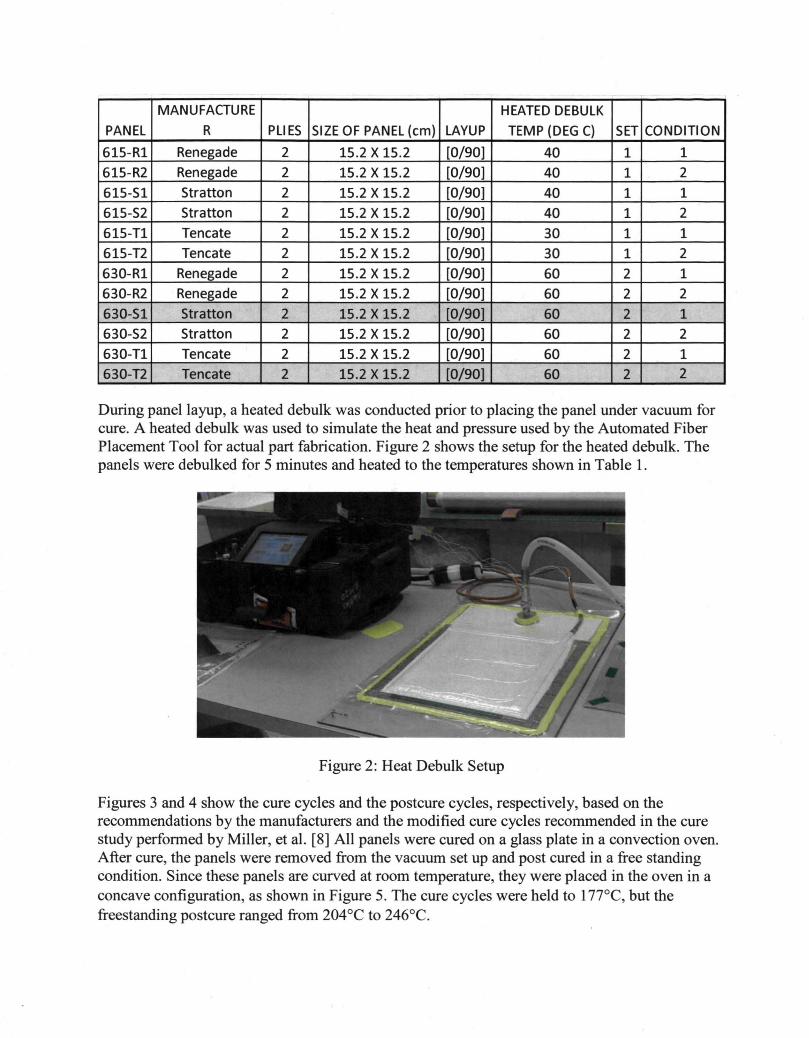
During panel layup, a heated debulk was conducted prior to placing the panel under vacuum for cure. A heated debulk was used to simulate the heat and pressure used by the Automated Fiber Placement Tool for actual part fabrication. Figure 2 shows the setup for the heated debulk. The panels were debulked for 5 minutes and heated to the temperatures shown in Table 1.
Figure 2: Heat Debulk Setup
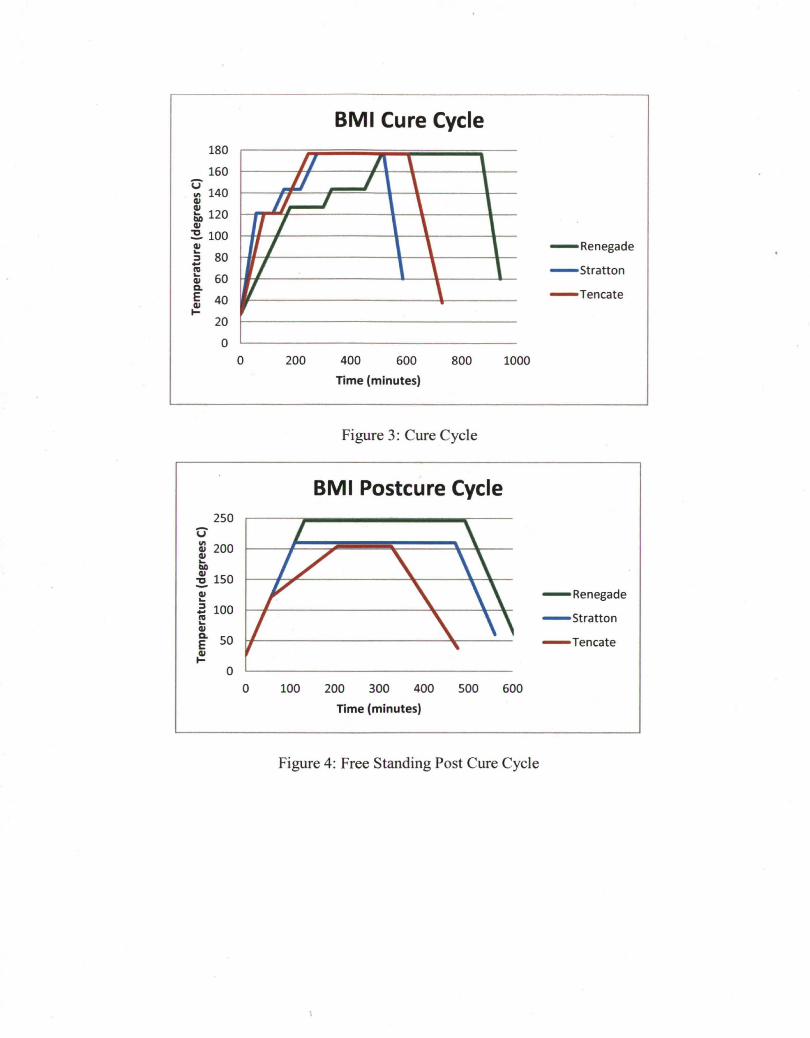
Figures 3 and 4 show the cure cycles and the postcure cycles, respectively, based on the recommendations by the manufacturers and the modified cure cycles recommended in the cure study performed by Miller, et al. [8] All panels were cured on a glass plate in a convection oven. After cure, the panels were removed from the vacuum set up and post cured in a free standing condition. Since these panels are curved at room temperature, they were placed in the oven in a concave configuration, as shown in Figure 5. The cure cycles were held to 177°C, but the freestanding postcure ranged from 204 °C to 246°C.
180
160
~ 140 Ill
~ 120 110 Ill ~ 100 Ill :; 80 ... ~ Ill 60 Q.
E 40 Ill 1-
v
20
0
250
:3 200 Ill ... 110
! 150 Ill
E 1oo "' ... Ill Q. so E ~
0
BMI Cure Cycle
- Renegade
- stratton
- Tencate
0 200 400 600 800 1000
Time (minutes)
Figure 3: Cure Cycle
BMI Postcure Cycle
- Renegade
- stratton
- Tencate
0 100 200 300 400 500 600
Time (minutes)
Figure 4: Free Standing Post Cure Cycle
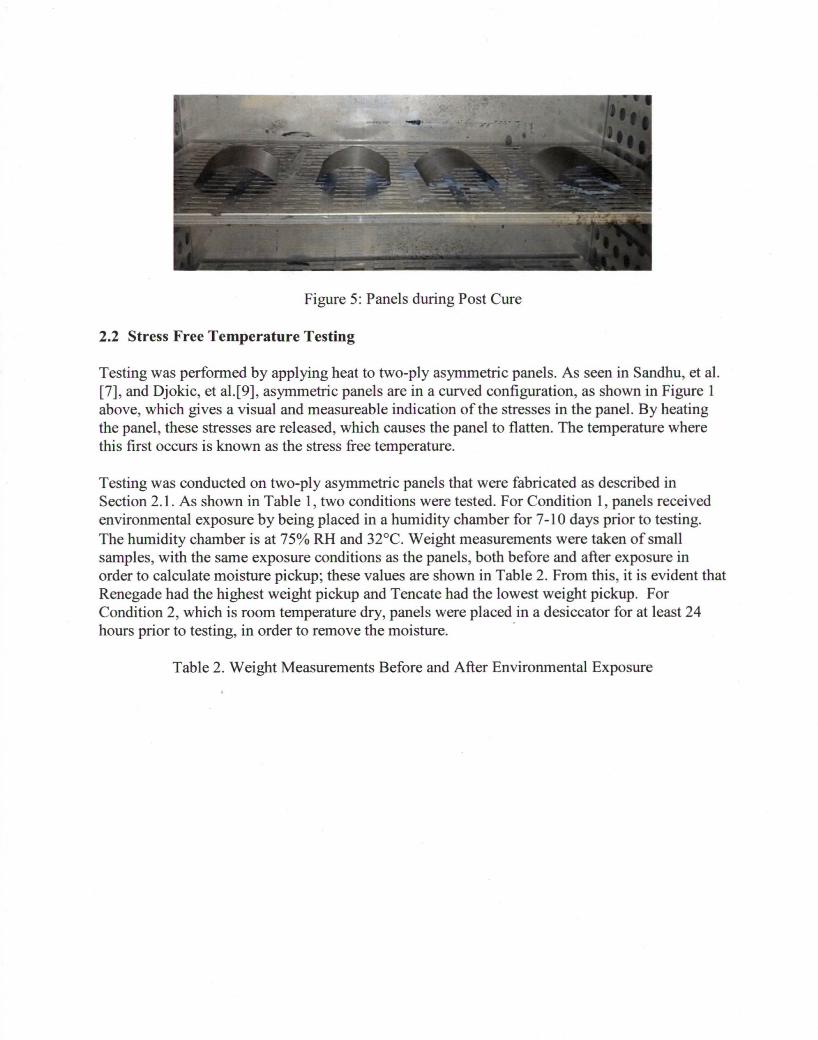
Figure 5: Panels during Post Cure
2.2 Stress Free Temperature Testing
Testing was performed by applying heat to two-ply asymmetric panels. As seen in Sandhu, et al. [7] , and Djokic, et al.[9], asymmetric panels are in a curved configuration, as shown in Figure 1 above, which gives a visual and measureable indication of the stresses in the panel. By heating the panel, these stresses are released, which causes the panel to flatten. The temperature where this first occurs is known as the stress free temperature.
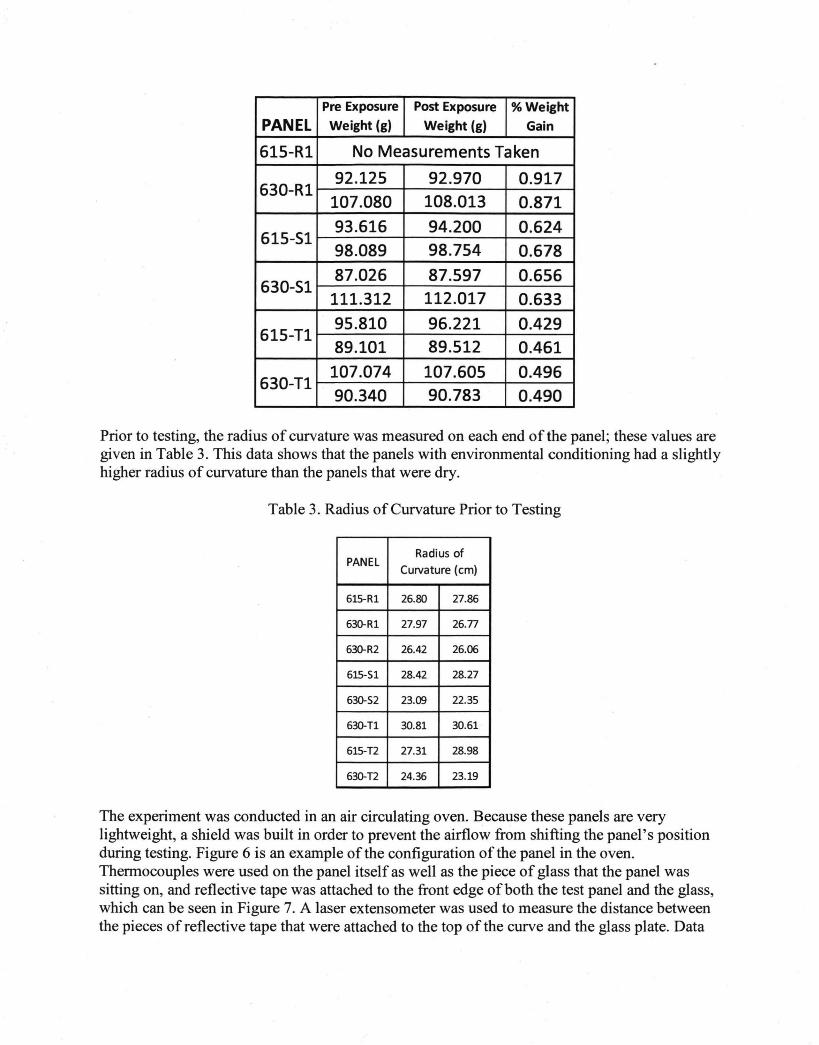
Testing was conducted on two-ply asymmetric panels that were fabricated as described in Section 2.1. As shown in Table 1, two conditions were tested. For Condition 1, panels received environmental exposure by being placed in a humidity chamber for 7-1 0 days prior to testing. The humidity chamber is at 75% RH and 32°C. Weight measurements were taken of small samples, with the same exposure conditions as the panels, both before and after exposure in order to calculate moisture pickup; these values are shown in Table 2. From this, it is evident that Renegade had the highest weight pickup and Tencate had the lowest weight pickup. For Condition 2, which is room temperature dry, panels were placed in a desiccator for at least 24 hours prior to testing, in order to remove the moisture. ·
Table 2. Weight Measurements Before and After Environmental Exposure
Pre Exposure Post Exposure %Weight
PANEL Weight (g) Weight (g) Gain
615-R1 No Measurements Taken
630-R1 92.125 92.970 0.917
107.080 108.013 0.871
615-51 93.616 94.200 0.624 98.089 98.754 0.678
630-51 87.026 87.597 0.656
111.312 112.017 0.633
615-T1 95.810 96.221 0.429 89.101 89.512 0.461
630-T1 107.074 107.605 0.496 90.340 90.783 0.490
Prior to testing, the radius of curvature was measured on each end of the panel; these values are given in Table 3. This data shows that the panels with environmental conditioning had a slightly higher radius of curvature than the panels that were dry.
Table 3. Radius of Curvature Prior to Testing
PANEL Radius of
Curvature (em)
615-R1 26.80 27.86
630-R1 27.97 26.77
630-R2 26.42 26.06
615-51 28.42 28.27
630-52 23.09 22.35
630-Tl 30.81 30.61
615-T2 27.31 28.98
630-T2 24.36 23.19
The experiment was conducted in an air circulating oven. Because these panels are very lightweight, a shield was built in order to prevent the airflow from shifting the panel's position during testing. Figure 6 is an example of the configuration of the panel in the oven. Thermocouples were used on the panel itself as well as the piece of glass that the panel was sitting on, and reflective tape was attached to the front edge ofboth the test panel and the glass, which can be seen in Figure 7. A laser extensometer was used to measure the distance between the pieces of reflective tape that were attached to the top of the curve and the glass plate. Data
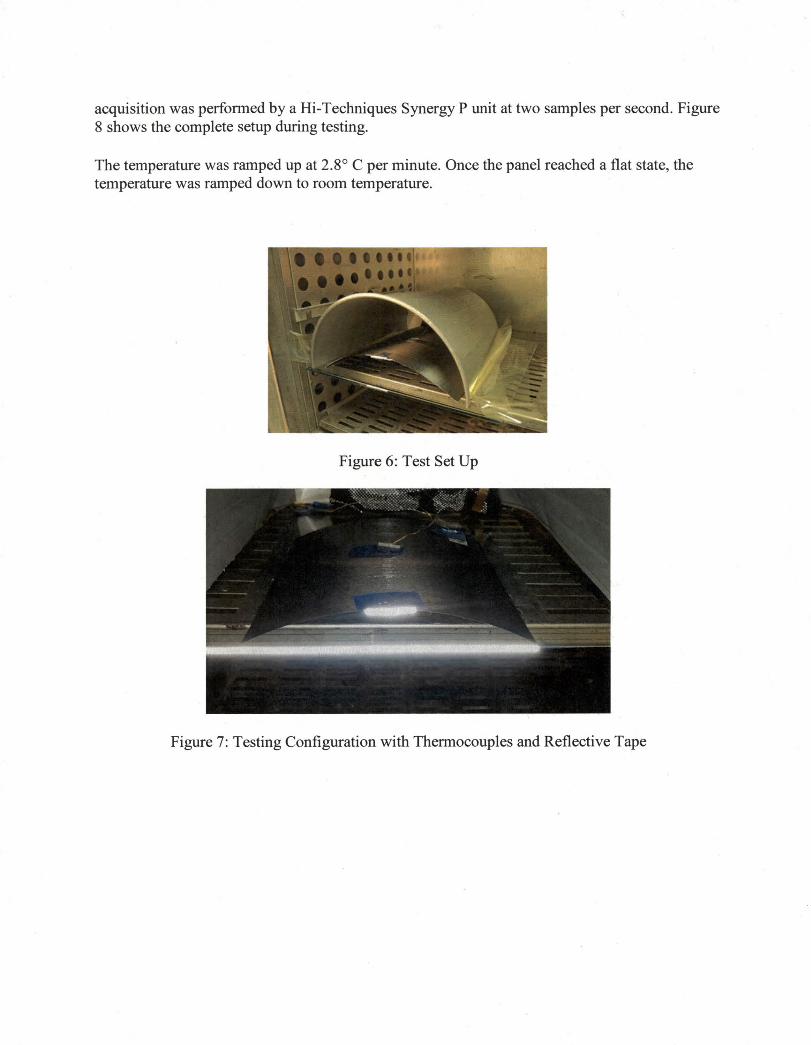
acquisition was performed by a Hi-Techniques Synergy P unit at two samples per second. Figure 8 shows the complete setup during testing.
The temperature was ramped up at 2.8° C per minute. Once the panel reached a flat state, the temperature was ramped down to room temperature.
Figure 6: Test Set Up
Figure 7: Testing Configuration with Thermocouples and Reflective Tape
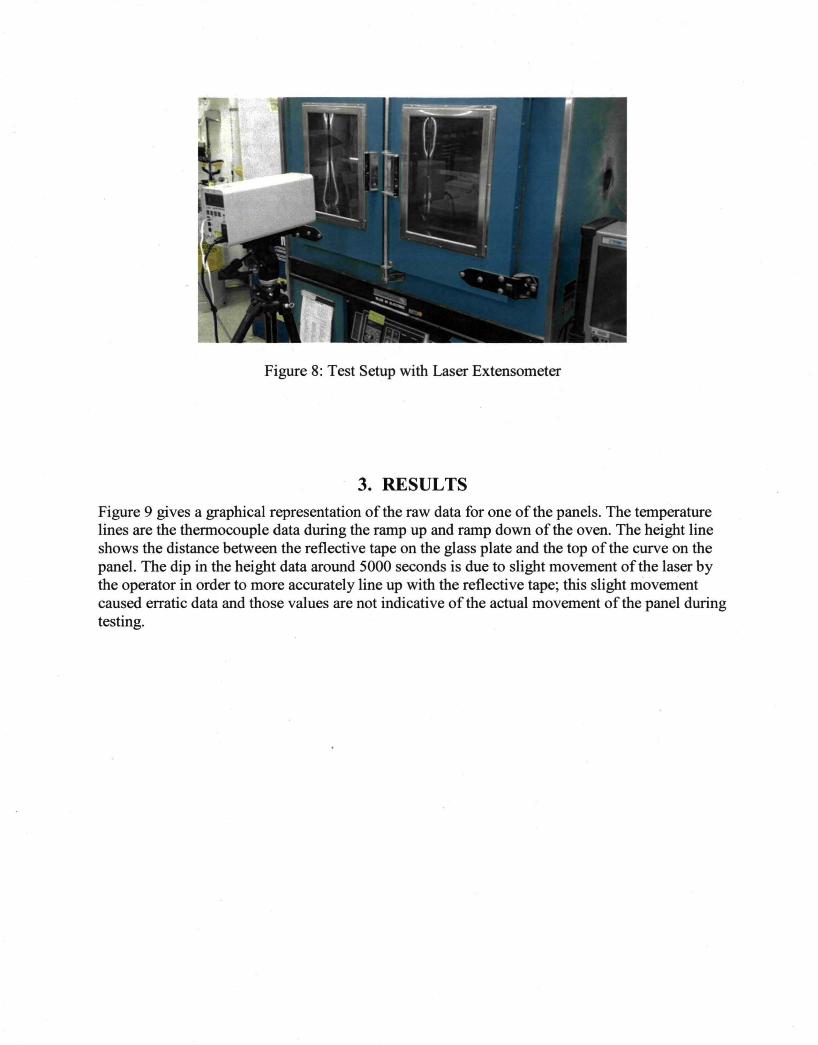
Figure 8: Test Setup with Laser Extensometer
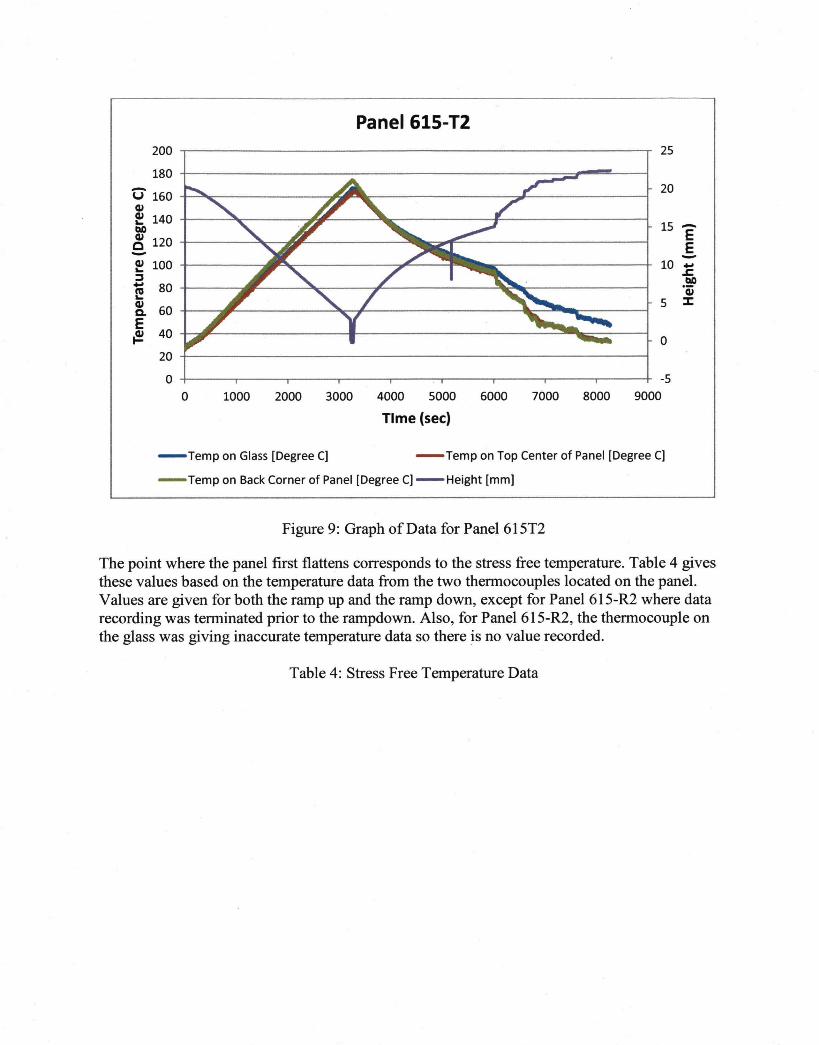
3. RESULTS Figure 9 gives a graphical representation of the raw data for one of the panels. The temperature lines are the thermocouple data during the ramp up and ramp down of the oven. The height line shows the distance between the reflective tape on the glass plate and the top of the curve on the panel. The dip in the height data around 5000 seconds is due to slight movement of the laser by the operator in order to more accurately line up with the reflective tape; this slight movement caused erratic data and those values are not indicative of the actual movement of the panel during testing.
Panel 615-T2 200 25
180 - 20 u 160 cu ~ 140 15-QO
~ 120 E E - -cu 100 10 ... ...
::l .s:. ... 80 QO
ru "(jj ... cu 5 :I: Q. 60 E {E 40 0
20
0 -5 0 1000 2000 3000 4000 5000 6000 7000 8000 9000
Time (sec)
- Temp on Glass [Degree C) - Temp on Top Center of Panel [Degree C)
- Temp on Back Corner of Panel [Degree C] - Height [mm]
Figure 9: Graph ofData for Panel615T2
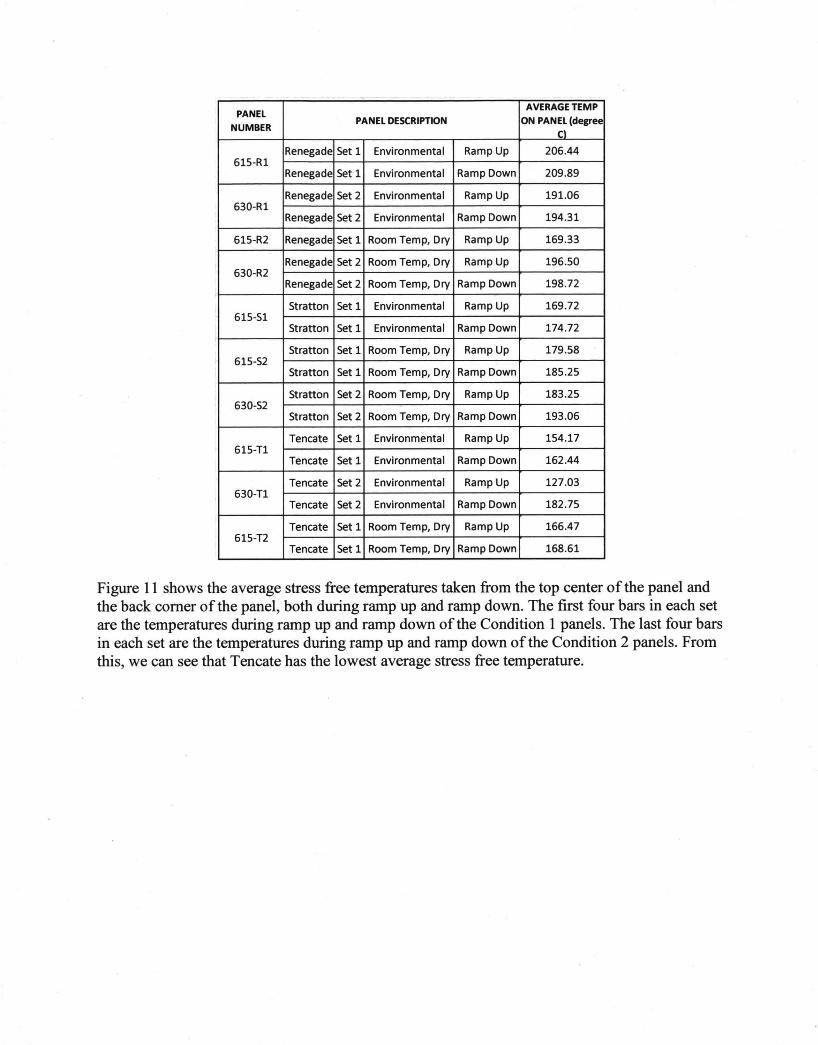
The point where the panel first flattens corresponds to the stress free temperature. Table 4 gives these values based on the temperature data from the two thermocouples located on the panel. Values are given for both the ramp up and the ramp down, except for Panel 615-R2 where data recording was terminated prior to the rampdown. Also, for Panel 615-R2, the thermocouple on the glass was giving inaccurate temperature data so there is no value recorded.
Table 4: Stress Free Temperature Data
PANEL AVERAGE TEMP
NUMBER PANEL DESCRIPTION ON PANEL (degree
Cl
Renegade Set 1 Environmental Ramp Up 206.44 615-R1
Renegade Set 1 Environmental Ramp Down 209.89
Renegade Set2 Environmental Ramp Up 191.06 630-R1
Renegade Set 2 Environmental Ramp Down 194.31
615-R2 Renegade Set 1 Room Temp, Dry Ramp Up 169.33
Renegade Set2 Room Temp, Dry Ramp Up 196.50 630-R2
Renegade Set 2 Room Temp, Dry Ramp Down 198.72
Stratton Set 1 Environmental Ramp Up 169.72 615-S1
Stratton Set 1 Environmental Ramp Down 174.72
Stratton Set 1 Room Temp, Dry Ramp Up 179.58 615-S2
Stratton Set 1 Room Temp, Dry Ramp Down 185.25
Stratton Set 2 Room Temp, Dry Ramp Up 183.25 630-S2
Stratton Set 2 Room Temp, Dry Ramp Down 193.06
Tencate Set 1 Environmental Ramp Up 154.17 615-Tl
Tencate Set 1 Environmental Ramp Down 162.44
Tencate Set 2 Environmental Ramp Up 127.03 630-Tl
Tencate Set 2 Environmental Ramp Down 182.75
Tencate Set 1 Room Temp, Dry Ramp Up 166.47 615-T2
Tencate Set 1 Room Temp, Dry Ramp Down 168.61
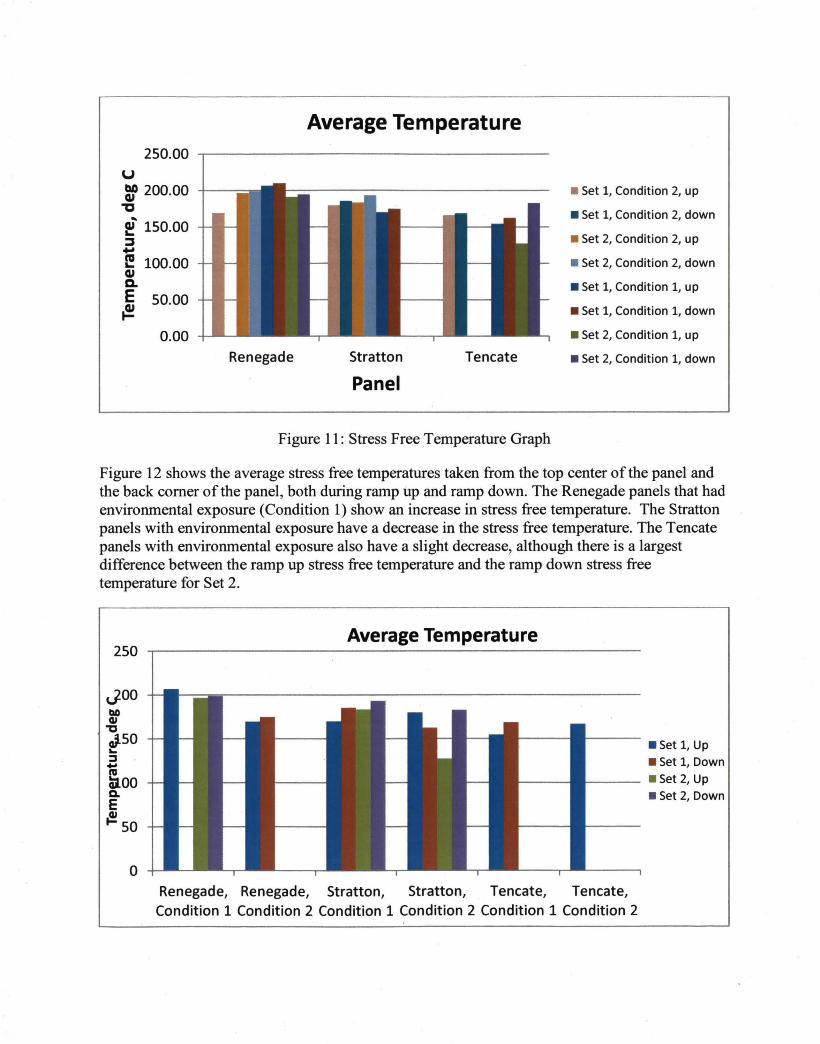
Figure 11 shows the average stress free temperatures taken from the top center of the panel and the back corner of the panel, both during ramp up and ramp down. The first four bars in each set are the temperatures during ramp up and ramp down of the Condition 1 panels. The last four bars in each set are the temperatures during ramp up and ramp down of the Condition 2 panels. From this, we can see that Tencate has the lowest average stress free temperature.
250.00 u g,o 200.00
"'C
~ 150.00 ::J .... I! 100.00 cu a. E so.oo ~
0.00
Average Temperature
• Set 1, Condition 2, up
• Set 1, Condition 2, down
• Set 2, Condition 2, up
• Set 2, Condition 2, down
• Set 1, Condition 1, up
• Set 1, Condition 1, down
• Set 2, Condition 1, up
Renegade Stratton Tencate • Set 2, Condition 1, down
Panel
Figure 11 : Stress Free Temperature Graph
Figure 12 shows the average stress free temperatures taken from the top center of the panel and the back corner of the panel, both during ramp up and ramp down. The Renegade panels that had environmental exposure (Condition 1) show an increase in stress free temperature. The Stratton panels with environmental exposure have a decrease in the stress free temperature. The Tencate panels with environmental exposure also have a slight decrease, although there is a largest difference between the ramp up stress free temperature and the ramp down stress free temperature for Set 2.
250
JOO
f "C J.SO ... :I ... ftl ;aoo Q.
E Ql F- so
0
Average Temperature
• Set 1, Up • set 1, Down
--- • Set 2, Up • set 2, Down
Renegade, Renegade, Stratton, Stratton, Tencate, Tencate, Condition 1 Condition 2 Condition 1 Condition 2 Condition 1 Condition 2
Figure 12: Graph of Stress Free Temperatures
The stress free temperature for the Tencate is just below the cure temperature of 177°F, while the stress free temperatures for the Renegade and Stratton are above the cure temperature. The cure study by Miller, et al. , on these three BMI systems concluded that the Tencate has a higher degree of cure than the Renegade or the Stratton. A correlation of the degree of cure to the stress free temperature shows that the stress free temperature is closely related to the cure temperature. A higher cure temperature, which would increase the degree of cure for the Stratton and Renegade, would more closely match the stress free temperatures from this test data.
4. CONCLUSIONS Stress free temperatures were determined through testing of asymmetric panels by heating the panels until they flatten, indicating a stress free configuration. Although there is a limited amount oftest data so far, Tencate has a consistently lower stress free temperature than Renegade and Stratton. In addition to completing the testing on the panels that have been fabricated, more testing should be done at these conditions in order to increase the sample size. Other variables in addition to environmental exposure may also be considered, such as the effect of the adhesive cured to the composite facesheet of a sandwich panel.
By determining the tensile modulus and the coefficient of thermal expansion, Equation 2 can be used to compare the calculated value to the stress free testing values. The residual stress for each of these systems can then be calculated based on the stress free temperature of the material.
5. ACKNOWLEDGEMENTS The authors would like to thank the Composites for Exploration Project and Dr. Mark Shuart.
6. REFERENCES 1. Palmese, G.R, and McCullough, R.L., "Relationship Between Interphase Composition,
Material Properties, and Residual Thermal Stresses in Composite Materials," J. Adhesion, 1995. Vol. 52, pp. 101-113.
2. Wang, Hong-Bing; Yang, Yu-Geng; Yu, Hui-Hong; Sun, Wei-Ming; Zhang, Ying-Hua; and Zhou, Hong-Wei, " Assessment of Residual Stresses During Cure and Cooling of Epoxy Resins," Polymer Engineering and Science, Mid-December, 1995. Vol. 35, No. 23, pp. 1895-1898.
3. Wang, Xiaojun, and Chung, D.D.L, "Residual stress in carbon fiber embedded in epoxy, studied by simultaneous measurement of applied stress and electrical resistance," Composite Interfaces, 1998. Vol. 5, No. 3, pp. 277-281.
4. Hodges, J. ; Yates, B.; Darby, M.l. ; Wostenholm, G.H. ; Clemmet, J.F. ; and Keates, T.F., "Residual stresses and the optimum cure cycle for an epoxy resin," Journal of Materials Science, 1989. Vol. 24, pp. 1984-1990. ..,. :-
5. Bogetti, Travis A., and Gillespie, Jr, John W., "Process-Induced Stress and Deformation in Thick-Section Thermoset Composite Laminates," Journal of Composite Materials, 1992. Vol. 26, No.5, pp. 626-660.
6. McGinnis, Arthur J. ; Watkins Thomas R.; and Jagannadham K. , "Residual Stresses in a Multilayer System of Coatings," JCPDS-Intemational Centre for Diffraction Data, 1999. pp 443-454.
7. Sandhu, R.S. ; Sendeckyj G.P.; Schoeppner G.A. ; and Pappas J.E. , "Initiation and Prevention of Edge Delamination With and Without Residual Stresses," Advisory Group for Aerospace Research and Development Conference Proceedings 530, 1992. pp. 3-1 - 3-20.
8. Miller, SG; Williams, TS; Wingard, CD; Hou, T-H; Sutter, JK; Pelham, LI; Hastings, C; and Tate, LC, "Cure Studies Based on Out of Autoclave Processable Bismaleimides", SAMPE Tech 2012, Charleston SC., Oct 22 - 25, 2012.
9. Djokic, D.; Johnston A.; Rogers A.; Lee-Sullivan P.; and Mrad N., "Residual Stress Development during the Composite Patch Bonding Process: Measurement and Modeling," Composites: Part A 2002; 33: 277-288.