Embed Size (px)
DESCRIPTION
Stress Testing Kuwait Banks
Citation preview

Kuwait Financial Centre S.A.K “Markaz” R E S E A R C H
Stress Testing Kuwait Banks Assessing recapitalization needs
“Stress Test has become increasingly widespread, and has been taken up by various governmental bodies as a regulatory requirement on certain financial institutions to ensure adequate capital allocation levels to cover potential losses incurred during extreme, but plausible, events. This emphasis on adequate, risk adjusted determination of capital has been further enhanced by modifications to banking regulations such as Basel II. Stress testing models typically allow not only the testing of individual stressors, but also combinations of different events. Stress testing reveals how well a portfolio is positioned in the event forecasts prove true. Stress testing also lends insight into a portfolio's vulnerabilities. Though extreme events are never certain, studying their performance implications strengthens understanding” -Wikipedia
Kuwait banks endured stress since the unfolding of the financial crisis in late 2008. They had to grapple with significant exposure to real
estate and investment companies, two sectors that contributed to bank‟s vulnerabilities. After growing at an annual clip of 30% during
the hey days (2004-2007), the sector witnessed a 70% plunge in
bottom line thanks to high levels of provisioning primiarly due to real estate declines and financial service distress. NPL‟s skyrocketed to
10.8% of loans in 2009 from 2.7% in 2007. Loan growth was nearly 0% in 2010 from 45% in 2007 in line with muted deposit growth and
increased risk aversion. All this resulted in significant capital raising to
strengthen the balance sheet and resurrect Capital Adequacy Ratio (CAR).
The question is how are they doing now after nearly 3 years of crisis and provisioning? We attempted to examine this issue by stress
testing Kuwait banks primarily for two risks i.e, real estate and
financial services sector exposure. We looked at declines in the sector‟s in isolation as well as in combinations (Table-1). The worst
case scenario anticipates a 30% decline in both sectors. The sector is more vulnerable to Real Estate declines with recap needs ranging
between KD 200 mn and over KD 1.5bn under different value declines.
However, two caveats would be proper upfront. Firstly, there are
several assumptions that we need to make to get here and hence this study is as good as the assumptions on which it is sitting. Secondly,
stress testing views the risk only from one angle i.e, impact on CAR. But by no means CAR is an all encompassing yardstick (see inside for
a critique on CAR).
Table 1: Recapitalization Needs for Banking Sector – Stress Test
Real Estate
KD mn
0% -10% -20% -30%
Fin
an
cia
l
Se
rvic
es 0% - 3 256 692
-10% - 194 612 1,111
-20% 131 547 1,050 1,554
-30% 360 990 1,554 2,185
Source: Markaz Research, Annual Reports
May 2011
Research Highlights: Stress Testing the Kuwait banking sector against Real
Estate and Financial sector
exposure in addition to performance review and loan
quality analysis
M.R. Raghu CFA, FRM Head of Research +965 2224 8280
Layla Al-Ammar Assistant Manager [email protected]
+965 2224 8000 Ext: 1205
Kuwait Financial Centre “Markaz”
P.O. Box 23444, Safat 13095, Kuwait
Tel: +965 2224 8000 Fax: +965 2242 5828
www.markaz.com
R E S E A R C H
May 2011
Kuwait Financial Centre S.A.K. “Markaz” 2
Section A: Stress Testing the Sector
A common plus which is mentioned when discussing capitalization of the region‟s banking sectors is how high the Kuwait banks‟ Capital Adequacy
Ratios (CAR) are compared with Central Bank required minimum of 12% (based on Basel Accords). The sector‟s Tier I CAR stood at 17% at the end
of 2010 (Tier II at 18%), higher than the 16% registered in 2009 as several bank‟s increased capital during the year.
As things stand, Kuwait banks seem adequately capitalized against possible
losses/asset devaluation. Using a July 2010 IMF paper as a model, we conducted a stress test on the sector to gauge the effect of different levels
of asset decline.
Our stress test is conducted on the nine local listed banks using reported 2010 Risk weighted assets and Capital as a starting base and makes the
following assumptions:
- We approximated Banks & Other Financial Institution and Real Estate
exposure by looking at each bank‟s gross credit exposure to assets in
these sectors.
- The change in Capital is a function of declining asset values and
“normal” earnings which, in this case, we have taken as each bank‟s average RoE over the last three years.
- The test is conducted on both Tier I and Tier II Capital Adequacy Ratios
- Our test takes into account three scenarios for the Real Estate and
Financial Sectors: Scenario 1 assumes a 10% fall in asset values in
the two sector‟s; Scenario 2 calls for a 20% decline while Scenario 3 assumes a 30% drop in asset values.
The picture is rosier,
predictably, for the Tier II ratios given the allowance for
other forms of capital
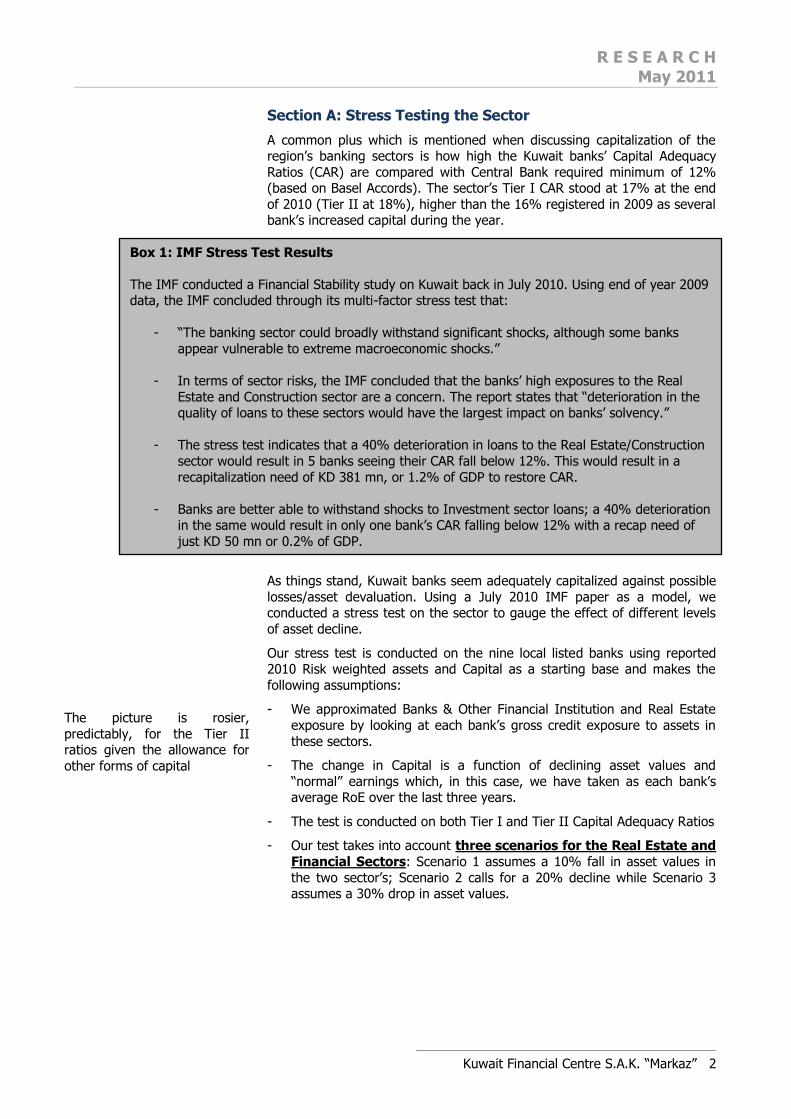
Box 1: IMF Stress Test Results
The IMF conducted a Financial Stability study on Kuwait back in July 2010. Using end of year 2009 data, the IMF concluded through its multi-factor stress test that:
- “The banking sector could broadly withstand significant shocks, although some banks
appear vulnerable to extreme macroeconomic shocks.”
- In terms of sector risks, the IMF concluded that the banks‟ high exposures to the Real
Estate and Construction sector are a concern. The report states that “deterioration in the quality of loans to these sectors would have the largest impact on banks‟ solvency.”
- The stress test indicates that a 40% deterioration in loans to the Real Estate/Construction
sector would result in 5 banks seeing their CAR fall below 12%. This would result in a
recapitalization need of KD 381 mn, or 1.2% of GDP to restore CAR.
- Banks are better able to withstand shocks to Investment sector loans; a 40% deterioration in the same would result in only one bank‟s CAR falling below 12% with a recap need of
just KD 50 mn or 0.2% of GDP.

R E S E A R C H
May 2011
Kuwait Financial Centre S.A.K. “Markaz” 3
The results
Tier I is the more stringent definition of capital, comprised mainly of
Common Stock and Retained Earnings, whereas Tier II capital can include
Undisclosed Reserves, Revaluated Reserves, Provisions, Hybrid Instruments and Subordinated Debt. Consequently, Tier II capital can give a misleading
view of the level of support a bank may have depending on how reserves and other instruments have been valued.
The stress test showcases that while the current Capital Adequacy Ratios
(CARs) are safely above the limit, the sector is still vulnerable to declines in asset values in two of the country‟s most important sectors, Real Estate and
Financials, more so in the former rather than the latter. This would seem to align with IMF stress test results (see Box 1), which arrived at the same
conclusion.
Table 2: Stress Test - Number of banks falling below CAR minimum (12%)
Real Estate
0% -10% -20% -30%
Fin
an
cia
l
Se
rvic
es 0% 0 1 2 5
-10% 0 2 5 6
-20% 2 6 6 6
-30% 5 6 7 8
Source: Markaz Research, Annual Reports
As per the stress test, over half of the country‟s banks fall below the 12%
CAR minimum should Real Estate and Financial Services assets decline by
20% or more (Table 2). Under the worst case scenario (seeing a fall of 30% in both Real Estate and Financial Services), all but one of Kuwait‟s banks
would fall below the CAR minimum.
Real Estate Assets
Tier I Capital Adequacy Ratios
Looking at Tier I capital, the sector is able to absorb a 10% decline in Real
Estate asset values without a need for recapitalization; however, having
said that, 1 bank would see its CAR fall to the 8%-12% range, indicating a need for recapitalization (KD 3mn) to bring CAR back to a minimum of 12%.
Under Scenario II (marking a 20% decline in values), the sector‟s Tier I CAR would be at 14%, well above the limit. However, under this scenario, 2
banks would see their Tier I CAR drop to the 8%-12% range while 7 would
remain over the 12% minimum. The total recapitalization needed to bring these banks to the regulatory minimum would be KD 256 mn, or 0.53% of
GDP.
In Scenario III (assuming a 30% decline in asset values), the sector CAR
would dip just below 12%, with 3 banks seeing their CARs fall below 8% while 4 bank would remain over the limit. The sector would need KD 692
mn in capital (or 1.4% of GDP) to restore it to a 12% CAR.
Tier II Capital Adequacy Ratios
The picture is rosier, predictably, for the Tier II ratios given the allowance
for other forms of capital. Under Scenario I, all banks would remain capitalized. For Scenario II, 1 bank falls under the 12% limit with a
recapitalization need of KD 182 mn, or 0.37% of GDP, to restore its CAR.
Scenario III sees 4 banks falling below the limit, 1 of which would see CAR below 8%, while 5 banks would be well-capitalized. The banks whose CARs
fell below 12% would need a combined capital influx of KD 492 mn, or 1% of GDP, to bring the ratio back up to Central Bank regulations.
Banks‟ remain vulnerable to deterioration in Real Estate
loans
The picture is rosier, predictably, for the Tier II
ratios given the allowance for
other forms of capital

R E S E A R C H
May 2011
Kuwait Financial Centre S.A.K. “Markaz” 4
Table 3: Kuwait Banking Sector Stress Test – Real Estate Assets
CAR (Number of Banks)
Total Sector CAR
Change Recapitalization
needs
<8% 8%-12% >12%
KD mn
% of GDP
Base line (2010) Tier I - - 9 17%
Tier II - - 9 18%
Main Assumption: Decline in Value of Loans to Real Estate Sector
Scenario I: 10% Decline
Tier I - 1 8 16.2% (0.35) 3 0.01%
Tier II - - 9 17.7% (0.22) 0 0.00%
Scenario II: 20% Decline
Tier I - 2 7 14.0% (2.55) 256 0.53%
Tier II - 1 8 15.5% (2.38) 182 0.37%
Scenario III: 30% Decline
Tier I 3 2 4 11.7% (4.87) 692 1.42%
Tier II 1 3 5 13.3% (4.66) 492 1.01%
Nominal GDP (2011f) -IMF
48,611
Source: Annual Reports, Markaz Research, IMF World Economic Outlook April 2011
In our view, a 30% drop in Real Estate values is rather unlikely owing to
the fact that the Real Estate market in Kuwait is split roughly 35/65 between Commercial real estate versus Investment Real Estate. The former
is the more troubled segment in the country as Commercial RE is expected
to have declined by about 50% in value (Office down by about 40%) whereas the Investment segment has held up thus far which would lend
some stability to the overall exposure.
Financial Sector
Tier I Capital Adequacy Ratios
According to the stress test, Kuwait banks are relatively better able to withstand hits to their financial sector assets versus those from Real Estate.
In the case of these assets, the banks would be able to handle both a 10% decline in value and remain well-capitalized (all bank CARs above 12%).
In Scenario II, 2 banks would fall below the CAR minimum, requiring KD 131 mn in recapitalization (or 0.27% of GDP) to restore the ratio. In
Scenario III where Tier I CAR would dip below 12%, with 5 banks seeing
their CAR in the 8%-12%, calling for a recapitalization of KD 492 mn, or 1% of GDP.
Tier II Capital Adequacy Ratios
If Tier I did not respond to the declines set out in Scenario I and II, then
Tier II capital will not respond either. Consequently, the sector‟s banks
remain well-capitalized under Tier II ratios as well in Scenario I. Scenario II would see 1 bank fall below the limit with KD 107 mn needed to restore it.
Under Scenario III, 2 banks would see CAR in the 8%-12% while the remaining 7 would be above the minimum requirement. Those under the
12% bar would need KD 360 mn in capital, or 0.74% of GDP, to restore
them.
According to the stress test, Kuwait banks are better able to
withstand hits to their financial sector assets versus those
from Real Estate

R E S E A R C H
May 2011
Kuwait Financial Centre S.A.K. “Markaz” 5
Table 4: Kuwait Banking Sector Stress Test – Financial Sector Assets
CAR (Number of Banks)
Total Sector CAR
Change Recapitalization
needs
<8% 8%-12% >12%
KD mn
% of GDP
Base line (2010) Tier I - - 9 17%
Tier II - - 9 18%
Main Assumption: Decline in Value of Loans to Banks & Other Financial Institutions
Scenario I: 10% Decline
Tier I - - 9 16.2% (0.38) - -
Tier II - - 9 17.7% (0.24) - -
Scenario II: 20% Decline
Tier I - 2 7 14.0% (2.60) 131 0.27%
Tier II - 1 8 15.5% (2.43) 107 0.22%
Scenario III: 30% Decline
Tier I - 5 4 11.6% (4.94) 492 1.01%
Tier II - 2 7 13.2% (4.73) 360 0.74%
Nominal GDP (2011f) -IMF
48,611
Source: Annual Reports, Markaz Research, IMF World Economic Outlook April 2011
Section B: Is CAR adequate?
Given that CAR is the go-to measure for bank health, the ratio itself, which
is internationally accepted, has not been seriously questioned until the
global credit crisis of late 2008. The criticism against CAR has basically centered on the issue of valuations, both on the capital and asset side.
The risk weighting buckets have been accused of being too rudimentary and not taking into account differences between classes of lenders and their
individual creditworthiness1. Moreover, the CAR does not discern between
different loans; in terms of maturity, sector, purpose etc, all of which can provide an incomplete picture of the bank‟s actual health.
Furthermore, the minimum itself has been deemed arbitrary and is standard among adopting countries without taking into consideration local economic
factors which may substantially impact required capital2.
In terms of valuations, the issue arises over Retained Earnings, which form a portion of Tier I Capital. This equity could contain inflated asset valuations
of financial instruments carried to the balance sheet rather than posted to the income statement. In times of market exuberance, this can give a
misleading view of actual capital that can be mobilized in the event of a shock.
Additionally, ratings by credit rating agencies are fundamental to the risk
weighting placed on the bank‟s assets. Consequently, a high degree of reliability in the credit rating, insofar that it reflects a realistic view of the
entity in question, is fundamental to ensuring a correct ratio. Critics have argued that assessing credit is the job of the bankers and that relying on
external rating agencies may give an inaccurate view of the debtor in
addition to possibly eroding the bank‟s internal credit assessment processes over the long term as they come to rely too heavily on external ratings3.
1 Center for Financial Studies, Kraussl, 2003 2 IMF Working Paper 00/93 3 Allocating Bank Regulatory Powers, Bank for International Settlements, 2001
The criticism against CAR has basically centered on the issue
of valuations, both on the
capital and asset side
R E S E A R C H
May 2011
Kuwait Financial Centre S.A.K. “Markaz” 6
Appendix 1: Kuwait Banking Sector Performance
After averaging about 30% annual growth during 2004-2007, Kuwait banks saw net profits plummet 70% in 2008 (mainly on account of Gulf Bank‟s KD 360 mn loss). The following year saw a 15% growth in earning,
but three banks registered losses while the rest all saw declines in their bottom lines. If we normalize Gulf
Bank‟s 2008 net profit to about KD 100 mn, the sector would have seen a 54% decline in its bottom line. The situation normalized somewhat in 2010; the sector reported a net profit of KD 574 mn, a 61% growth.
Only two banks saw net profit declines, Burgan Bank and Kuwait Finance House, by 25% and 11%, respectively.
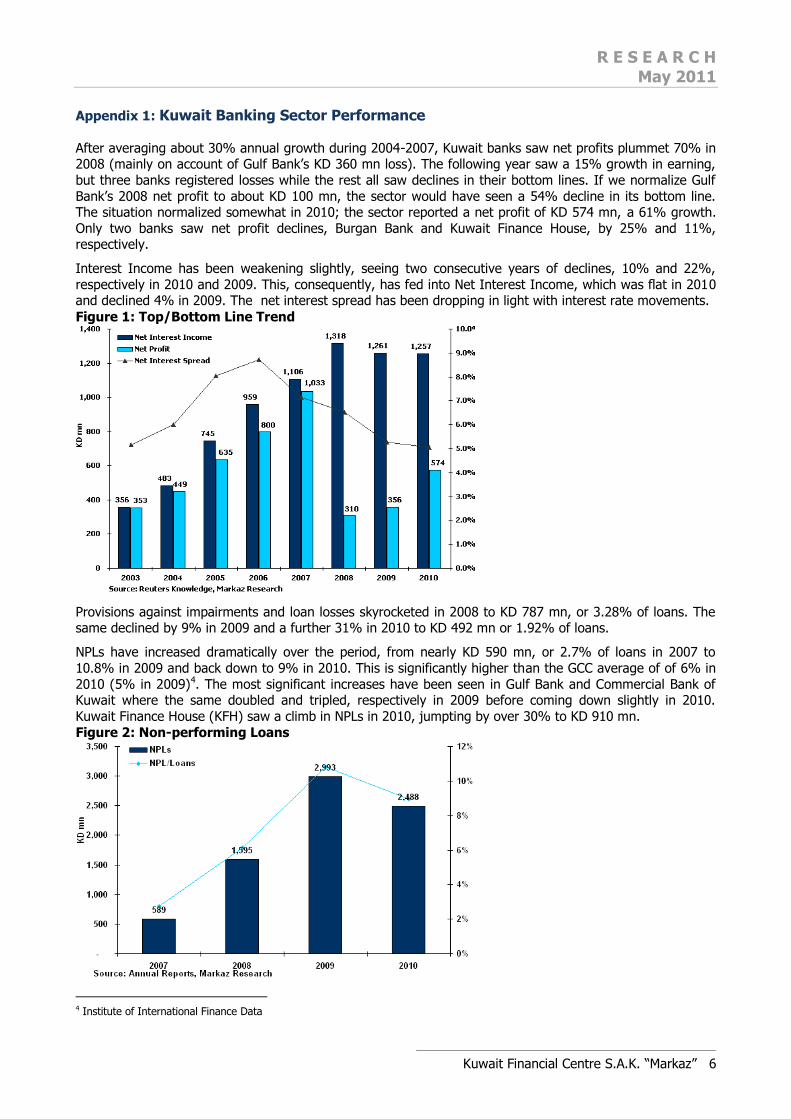
Interest Income has been weakening slightly, seeing two consecutive years of declines, 10% and 22%,
respectively in 2010 and 2009. This, consequently, has fed into Net Interest Income, which was flat in 2010 and declined 4% in 2009. The net interest spread has been dropping in light with interest rate movements.
Figure 1: Top/Bottom Line Trend
Provisions against impairments and loan losses skyrocketed in 2008 to KD 787 mn, or 3.28% of loans. The same declined by 9% in 2009 and a further 31% in 2010 to KD 492 mn or 1.92% of loans.
NPLs have increased dramatically over the period, from nearly KD 590 mn, or 2.7% of loans in 2007 to
10.8% in 2009 and back down to 9% in 2010. This is significantly higher than the GCC average of of 6% in
2010 (5% in 2009)4. The most significant increases have been seen in Gulf Bank and Commercial Bank of Kuwait where the same doubled and tripled, respectively in 2009 before coming down slightly in 2010.
Kuwait Finance House (KFH) saw a climb in NPLs in 2010, jumpting by over 30% to KD 910 mn.
Figure 2: Non-performing Loans
4 Institute of International Finance Data

R E S E A R C H
May 2011
Kuwait Financial Centre S.A.K. “Markaz” 7
Lending is the primary reason behind the slowdown; loans growth has stagnated over the last two years as banks have attempted to clean up their balance sheets and have been hesitant to lend due to strengthened
risk management and higher aversion. Gross Loans were flat in 2010 at KD 27.8 bn after decelerating to an
annual growth of 7% in 2009. Likewise, deposits have slowed considerably; registering just 1% growth in both 2009 and 2010 (averaging 21% between 2004-2008).
This has been a regional phenomenon and is not limited to Kuwait; there is a bit of a vicious cycle occurring
whereby the economic slowdown, brought on by a financial crisis, has led to decelerating deposits growth
(which itself limits lending ability) in addition to risk aversion among lenders and private investors, leading to lower credit demand. All of this, in turn, makes economic recovery shallow and sluggish. According to the
IMF, “significant recovery of credit may take three years or more following a financial crisis.5”
Loans/Deposits Lending and deposit growth have averaged 19% and 15.5%, respectively, between 2004-2010 as the region witnessed an investment and liquidity boom. Both lending and deposit growth fell dramatically in 2009,
coming in at 6.6% and 1.2% growth, respectively, as banks became hesitant to lend. The situation has worsened in 2010 with loans growth flat while Deposits were stagnant at a 1% growth.
Loans growth was buoyed in 2009 by a 13% growth in NBK‟s gross loans; NBK accounts for about 30% of
loans by listed local banks. This support was not present in 2010, as NBK gross loans were flat. Additionally,
over half of the banks (5 out of 9) saw loans contract in 2010 by 5% - 10% thereby mitigating overall growth for the sector. The loans to deposit ratio has averaged about 70% between 2005-2010.
Figure 3: Loans/Deposits Growth Trends
Asset Impairment The quality of the sector‟s loan book (excluding Boubyan Bank and Kuwait Finance House due to differing
reporting style) has fallen through the period between 2007-2010. The percentage of loans categorized as “High” quality was 60% in 2007, dropped to 50% in 2009 and is at 52% as of the end of 2010 (Figure 4)
5 WP /10/219, International Monetary Fund

R E S E A R C H
May 2011
Kuwait Financial Centre S.A.K. “Markaz” 8
Figure 4: Loan Quality
Note: Includes seven listed conventional banks. Boubyan Bank and Kuwait Finance House excluded from analysis due to different reporting.
Conversely, the percentage of Past Due and/or Impaired Loans increased from 10% in 2007 to nearly 20%
in 2009 before settling at 14% in 2010. Past Due and/or Impaired loans increased 76% in 2008 and a further 29% in 2009 before declining 27% in 2010 to just over KD 3 bn. The value of loans classified as
“High” has remained static through the period; “Standard” quality loans have declined 7% and 14%, respectively, in 2009 and 2010 while “Acceptable” loans increased 6% and 27%, respectively, in the same
periods. The percentage of “Acceptable” loans has increased from 13% in 2007 to 20% in 2010, clearly
indicating a worsening in loans quality over time.
Figure 5: Loans Trend
Note: Includes seven listed conventional banks. Boubyan Bank and Kuwait Finance House excluded from analysis due to different reporting.

R E S E A R C H
May 2011
Kuwait Financial Centre S.A.K. “Markaz” 9
Credit Exposure to Financial Assets
The sector composition of the banking sector‟s gross credit exposure to financial assets (majority on balance
sheet items) has been relatively stable through the years (Figure 6). Exposures to Real Estate and Banks &
other Financial Inst. are the highest, averaging 22% and 28%, respectively, through the period.
Figure 6: Gross Credit Exposure to Assets (by Sector)
Note: Data for 9 listed local banks
Capital Increases
In light of rising NPL‟s and depreciating asset values, Kuwait banks went through a round of capital increases in 2010. Eight out of nine banks raised capital by an average of 40% (100% in the highest case
and 7% in the lowest) in order to boost adequacy ratios and combat asset devaluation. The sector‟s aggregate capital was up 38%, or KD 531 mn, in 2010 (from 2008).
Table 5: Bank Capital
KD mn 2008 2009 2010
% Change from 2008-
2010
1 Al Ahli Bank of Kuwait 147 152 223 52%
2 Ahli United Bank 89 98 107 21%
3 Boubyan Bank 117 117 175 50%
4 Burgan Bank 159 169 270 69%
5 Commercial Bank of Kuwait 127 127 127 0%
6 Gulf Bank 125 251 251 100%
7 Kuwait Finance House 206 231 249 21%
8 Kuwait International Bank 144 153 153 7%
9 National Bank of Kuwait 270 297 360 33%
Total 1,384 1,594 1,915 38%
Note: Bank Capital refers to Share Capital + Premium Source: Company Financials, Markaz Research
R E S E A R C H
May 2011
Kuwait Financial Centre S.A.K. “Markaz” 10
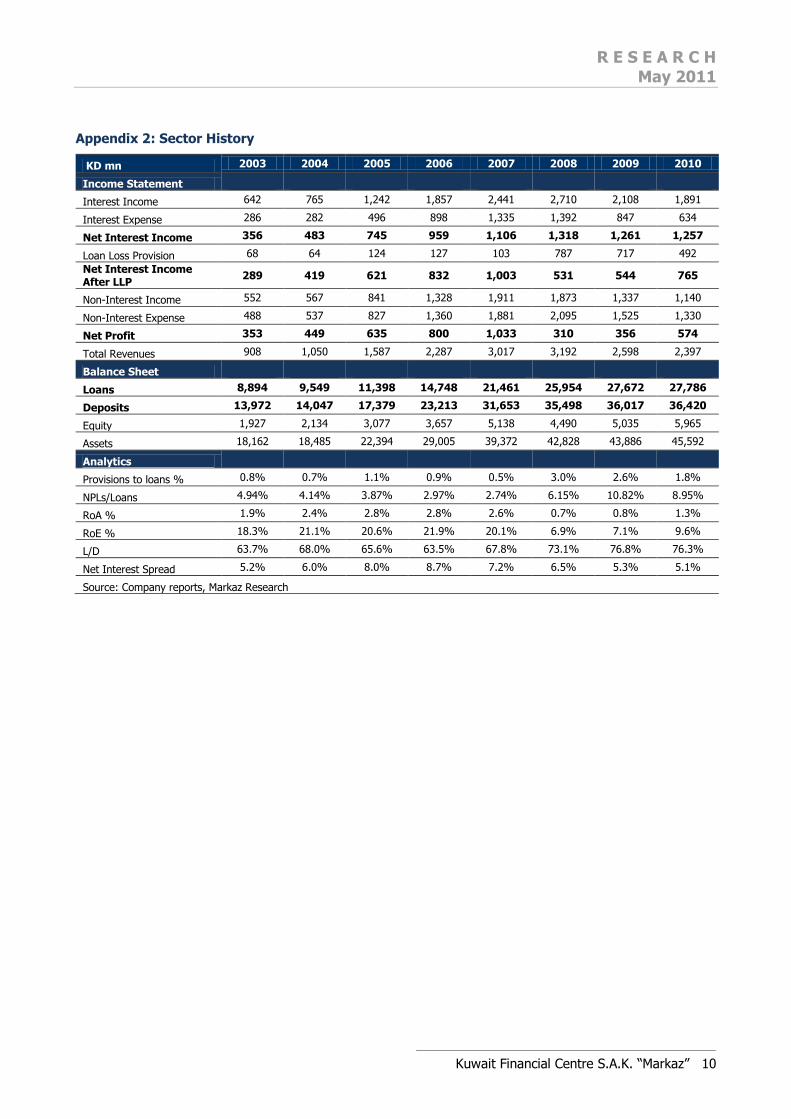
Appendix 2: Sector History
KD mn 2003 2004 2005 2006 2007 2008 2009 2010
Income Statement
Interest Income 642 765 1,242 1,857 2,441 2,710 2,108 1,891
Interest Expense 286 282 496 898 1,335 1,392 847 634
Net Interest Income 356 483 745 959 1,106 1,318 1,261 1,257
Loan Loss Provision 68 64 124 127 103 787 717 492
Net Interest Income After LLP
289 419 621 832 1,003 531 544 765
Non-Interest Income 552 567 841 1,328 1,911 1,873 1,337 1,140
Non-Interest Expense 488 537 827 1,360 1,881 2,095 1,525 1,330
Net Profit 353 449 635 800 1,033 310 356 574
Total Revenues 908 1,050 1,587 2,287 3,017 3,192 2,598 2,397
Balance Sheet
Loans 8,894 9,549 11,398 14,748 21,461 25,954 27,672 27,786
Deposits 13,972 14,047 17,379 23,213 31,653 35,498 36,017 36,420
Equity 1,927 2,134 3,077 3,657 5,138 4,490 5,035 5,965
Assets 18,162 18,485 22,394 29,005 39,372 42,828 43,886 45,592
Analytics
Provisions to loans % 0.8% 0.7% 1.1% 0.9% 0.5% 3.0% 2.6% 1.8%
NPLs/Loans 4.94% 4.14% 3.87% 2.97% 2.74% 6.15% 10.82% 8.95%
RoA % 1.9% 2.4% 2.8% 2.8% 2.6% 0.7% 0.8% 1.3%
RoE % 18.3% 21.1% 20.6% 21.9% 20.1% 6.9% 7.1% 9.6%
L/D 63.7% 68.0% 65.6% 63.5% 67.8% 73.1% 76.8% 76.3%
Net Interest Spread 5.2% 6.0% 8.0% 8.7% 7.2% 6.5% 5.3% 5.1%
Source: Company reports, Markaz Research

R E S E A R C H
May 2011
Kuwait Financial Centre S.A.K. “Markaz” 11
Appendix 3: Key Events
2010
February (13.5%)6
- Government passes Kuwait Development Plan (2010-2014) worth KD 35 bn, the first plan since
1986.
March (3.73%)
- Parliament passes Capital Market Authority law to regulate Stock Market activity.
June (-2.31%)
- Central Bank announces set of new regulations on the Kuwait Investment sector with a two year
deadline for compliance.
July (5.49)
- IMF report put the combined capital adequacy of the Kuwait banking sector at 18%, well above the
12% stipulated by the Central Bank.
August (3.96)
- Kuwait government gives green light to local banks to begin financing projects connected with the
State‟s development plan. Some banks expressed reservations about financing such long-term, high risk projects. Government agrees to provide 50% of financing.
2011
March (-3.25%)
- Kuwait Investment Authority announced a plan to inject over USD 3.5 bn into the local property market through a portfolio to be managed by Kuwait Finance House.
- Capital Market Authority regulations came into effect.
6 Represents Kuwait Weighted Index monthly returns

R E S E A R C H
May 2011
Kuwait Financial Centre S.A.K. “Markaz” 12
Appendix 4: Index Movers
NBK Code: NBK |Current Market Price: KWD1.180| Mcap: KD 4.77 Bn
National Bank of Kuwait (NBK), established in 1952, is the state‟s largest lender. The bank offers Retail and Corporate banking, wealth management, structured and trade Finance through 69 local and 17 international
branches.
Historical Financial highlights-
All Figures in KD Mn 2005 2006 2007 2008 2009 2010 2010
Income Statement
%
Interest income 330 477 607 683 546 481 -12%
Interest expense 111 216 324 317 170 123 -28%
Net Interest income 219 261 283 366 376 358 -5%
Provisions 23 30 23 78 46 12 -74%
Net profit 205 253 273 255 265 301 14%
Balance Sheet Total Assets 6,189 7,883 11,518 11,951 12,883 12,875 0%
Loans 3,471 4,438 6,120 7,212 8,113 8,133 0%
Deposits 5,278 6,668 9,601 10,148 10,849 10,439 -4%
Total Liabilities 5,421 6,826 9,835 10,396 11,061 10,661 -4%
Total Shareholder's Equity 768 1,058 1,683 1,555 1,822 2,213 18%
Source: Reuters Knowledge
NBK saw a net profit of KD 301 mn in 2010, a 14% annual growth, due to a 74% drop in provisions against credit impairments and losses. Provisions came in at just KD 12 mn or 0.15% of loans. Top line growth was
negative; Interest Income fell 12% while Interest Expense dropped almost 30%.
Lending was flat for the year with net loans coming in at KD 8 bn while Deposits fell 4% to KD 10.4 bn.
Looking forward
NBK stock has lost about 10% YTD versus a 5% loss on the index (weighted) after gaining 50% in 2010.
The stock is trading at a PE (TTM) of 15x versus 18x for the index. Value traded was down 35% in 2010 to KD 878 mn, bringing the turnover ratio to 17% versus 41% in 2009 (due to a nearly 60% jump in market
cap.)
NBK remains well capitalized against losses and shocks; with a CAR of 18%, it is one of the highest CARs in the sector. Although the bank has made a positive growth in its bottom line, weak top line growth remains
an issue, which is likely to continue unless lending picks up. Analysts are optimistic on NBK, forecasting net
profit growth between 3% - 12% for 2011 with Buy/Overweight calls for the stock.
Figure : Price and Turnover Trend Table: Consensus Estimate (2011f)
Annual (KD mn) EFG
Hermes TAIB
Apr-11 Apr-11
ROA: 2.35% 2.50%
ROE: 13.50% 14.60%
Revenue: 514 550
Net Profit 310 338
EPS(KWD) 0.08 0.09
Growth (EST) 3% 12%
Target price (KWD) 1.33 1.16
Recommendation BUY Outperform
Source: Reuters Knowledge

R E S E A R C H
May 2011
Kuwait Financial Centre S.A.K. “Markaz” 13
Kuwait Finance House Code: KFIN| Current Market Price: KD1.100 |Mcap: KD 3 Bn
Kuwait Finance House (KFH), established 1977, was the first Islamic bank in Kuwait; it provides products and services in the banking, real estate, trade finance and investment areas. The bank is Kuwait‟s second
largest lender and one of the largest firms in terms of market capitalization.
Historical Financial Highlights
All Figures in USD Mn 2005 2006 2007 2008 2009 2010 2010|9M
Income Statement
YoY
Net Financing income 208 302 425 473 393 402 2%
Provisions 36 26 37 204 197 199 1%
Total Operating profits 390 579 831 884 766 736 -4%
Net income 119 162 275 157 119 106 -11%
Balance Sheet
Financing (loans) 2,253 2,943 4,139 5,079 5,459 6,032 11%
Assets 4,678 6,310 8,792 10,537 11,284 12,541 11%
Deposits 3,469 4,807 6,543 8,202 8,717 9,854 13%
Shareholder‟s Equity 600 702 1,209 1,240 1,241 1,290 4%
Source: Reuters Knowledge
Net income for the bank fell by 11% in 2010 to KD 106 mn due to weak financing income growth and declining operating profits. Provisions have been flat at around KD 200 mn, or 3.3% of 2010 loans, since
2008. KFH managed to grow its financing activities (read: loans) by 11% in 2010 to KD 6 bn while Deposits were up 13% to KD 9.8 bn.
Looking forward
KFH has outperformed the index gaining about 3% YTD after gaining 14% in 2010. Value traded fell 55% in 2010 to just under KD 700 mn; consequently, the turnover ratio fell to 24.5% from 63% in 2009.
Despite a capital adequacy ratio of 14%, KFH has been grappling with rapidly rising Non-Performing Loans
(NPLs) which surged almost 6x in 2008, and grew a further 9% and 31% in 2009 and 2010, respectively.
NPLs/loans stand at 15% in 2010, up from 13% in 2009. Top line performance and balance sheet growth are positives for the bank, but the rise in impaired loans is a cause for concern.
Analysts are neutral on the bank, issuing Hold recommendations despite strong bottom line expected
growth.
Figure : Price and Turnover Trend

R E S E A R C H
May 2011
Kuwait Financial Centre S.A.K. “Markaz” 14
Gulf Bank Code: GBKK |Current market Price: KWD 0.530| Mcap: KD 1.35 Bn
Gulf Bank (GBK) is the third largest lender in the country with loans topping KD 3 bn. The bank, established
in 1960, provides Retail, Corporate, and Investment Banking services through 51 local branches. It is 16% owned by Kuwait Investment Authority and 14% held by Al Ghanim Industries.
Historical Financial highlights-
All Figures in KD Mn 2005 2006 2007 2008 2009 2010 2010
Income Statement
%
Interest income 136 235 314 331 208 180 -14%
Interest expense 55 127 208 214 119 77 -35%
Net Interest income 81 108 106 118 89 103 15%
Provisions 20 15 23 323 107 115 7%
Net profit 85 106 130 (358) (28) 19 NM
Balance Sheet Total Assets 2,599 4,046 5,065 4,930 4,727 4,584 -3%
Loans 1,640 2,611 3,356 3,807 3,787 3,413 -10%
Deposits 2,093 3,428 4,352 4,639 4,144 4,011 -3%
Total Liabilities 2,246 3,648 4,576 4,892 4,321 4,174 -3%
Total Shareholder's Equity 353 397 489 38 406 409 1%
Source: Reuters Knowledge
Gulf Bank saw a net profit of KD 19 mn in 2010 after seeing losses in 2008 and 2009. Net interest income
was up 15% for the year to KD 103 mn as Interest Expense fell 35% versus a 14% decline in interest income. Provisions were up 7% to KD 115 mn or 3.6% of loans. Gross Loans and deposits declined by 10%
and 3%, respectively, during the year as lending activity stagnated across the country.
Gulf Bank‟s NPLs remain exceedingly high, at 19% of loans while the CAR is at 14% (Tier I) and 17.5%
(Total).
Valuation Gulf Bank is down 5% YTD after gaining 90% in 2010. Value traded for the stock was up 34% to KD 373
mn; a larger gain in market cap caused the turnover ratio to decline from 38% in 2009 to 26% in 2010.
Figure : Price and Turnover Trend
Consensus Estimate Table (2011f)
Annual (KD mn)
EFG Hermes
TAIB Global
Investment House
Apr-11 Apr-11 Mar-11
ROA: 1.36% 0.90% 0.90%
ROE: 12.60% 9.20% 9.50%
Revenue: 657 567 613
Net Profit 173 121 112
EPS(KWD) 0.06 0.05 0.04
Growth (EST) 63% 14% 6%
Target price (KWD)
1.1 1.15 1.15
Recommendation
Hold Hold Hold
Source: Reuters Knowledge
R E S E A R C H
May 2011
Kuwait Financial Centre S.A.K. “Markaz” 15
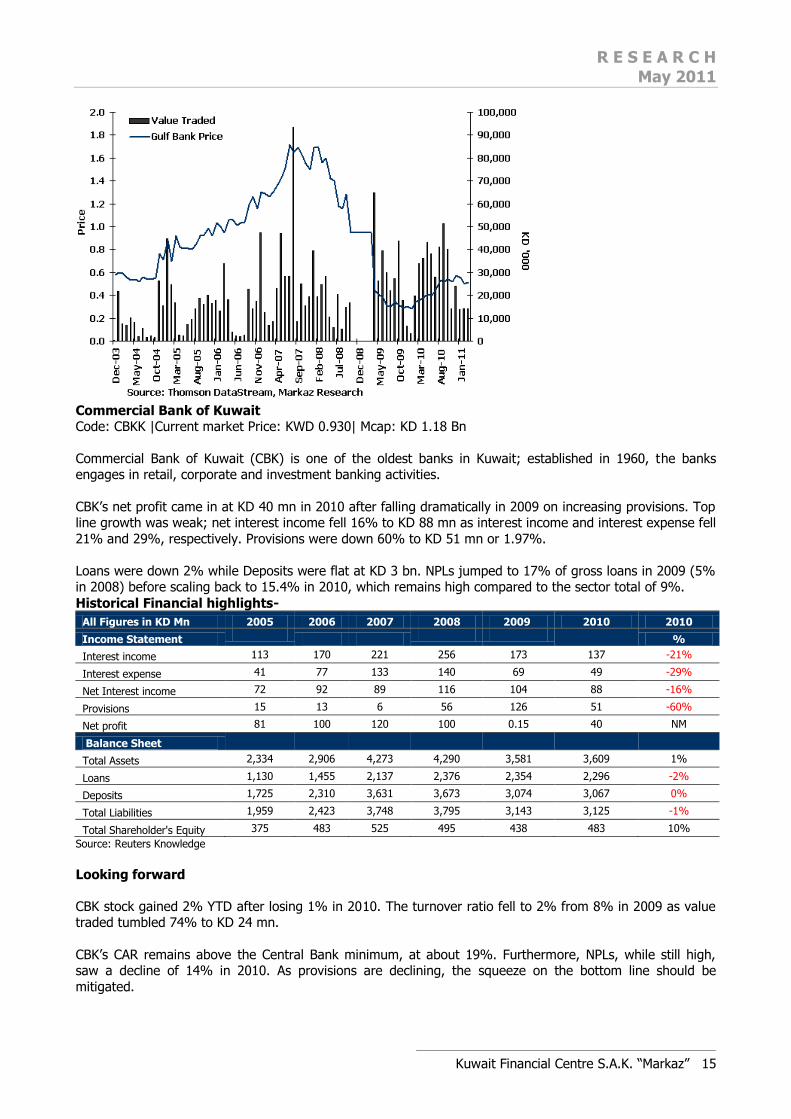
Commercial Bank of Kuwait Code: CBKK |Current market Price: KWD 0.930| Mcap: KD 1.18 Bn
Commercial Bank of Kuwait (CBK) is one of the oldest banks in Kuwait; established in 1960, the banks engages in retail, corporate and investment banking activities.
CBK‟s net profit came in at KD 40 mn in 2010 after falling dramatically in 2009 on increasing provisions. Top line growth was weak; net interest income fell 16% to KD 88 mn as interest income and interest expense fell
21% and 29%, respectively. Provisions were down 60% to KD 51 mn or 1.97%.
Loans were down 2% while Deposits were flat at KD 3 bn. NPLs jumped to 17% of gross loans in 2009 (5% in 2008) before scaling back to 15.4% in 2010, which remains high compared to the sector total of 9%.
Historical Financial highlights-
All Figures in KD Mn 2005 2006 2007 2008 2009 2010 2010
Income Statement
%
Interest income 113 170 221 256 173 137 -21%
Interest expense 41 77 133 140 69 49 -29%
Net Interest income 72 92 89 116 104 88 -16%
Provisions 15 13 6 56 126 51 -60%
Net profit 81 100 120 100 0.15 40 NM
Balance Sheet
Total Assets 2,334 2,906 4,273 4,290 3,581 3,609 1%
Loans 1,130 1,455 2,137 2,376 2,354 2,296 -2%
Deposits 1,725 2,310 3,631 3,673 3,074 3,067 0%
Total Liabilities 1,959 2,423 3,748 3,795 3,143 3,125 -1%
Total Shareholder's Equity 375 483 525 495 438 483 10%
Source: Reuters Knowledge
Looking forward
CBK stock gained 2% YTD after losing 1% in 2010. The turnover ratio fell to 2% from 8% in 2009 as value traded tumbled 74% to KD 24 mn.
CBK‟s CAR remains above the Central Bank minimum, at about 19%. Furthermore, NPLs, while still high, saw a decline of 14% in 2010. As provisions are declining, the squeeze on the bottom line should be
mitigated.
R E S E A R C H
May 2011
Kuwait Financial Centre S.A.K. “Markaz” 16
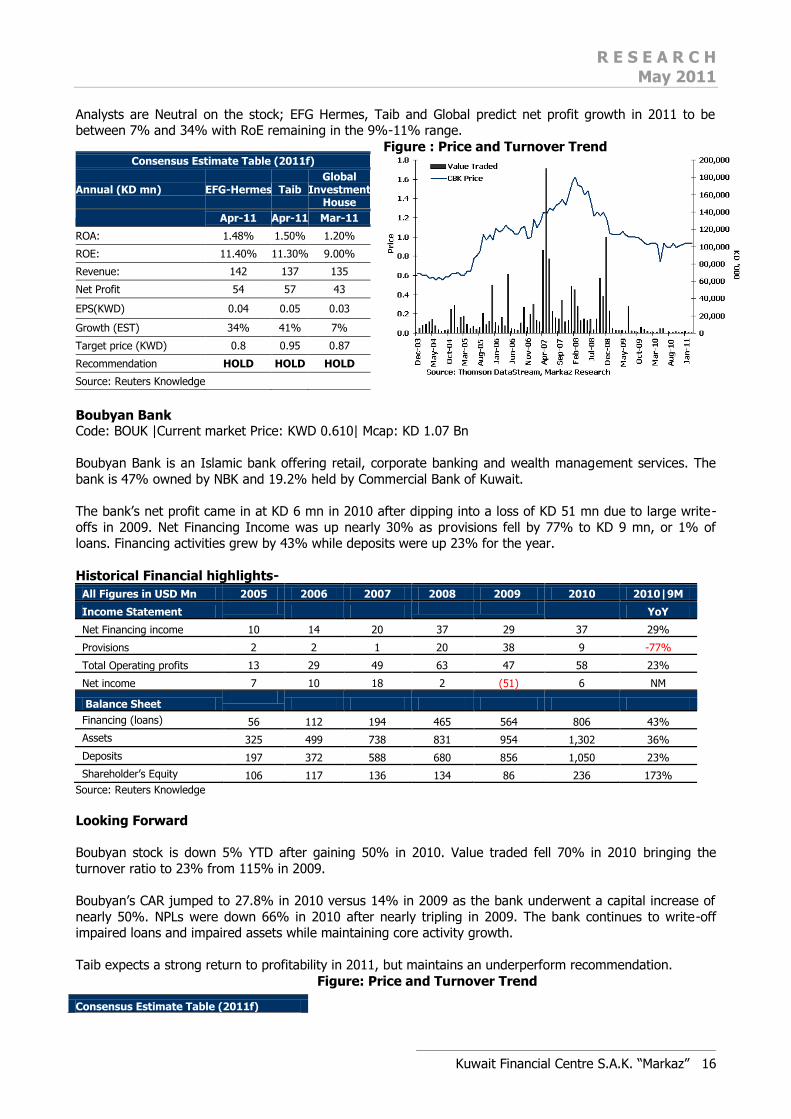
Analysts are Neutral on the stock; EFG Hermes, Taib and Global predict net profit growth in 2011 to be between 7% and 34% with RoE remaining in the 9%-11% range.
Figure : Price and Turnover Trend
Boubyan Bank Code: BOUK |Current market Price: KWD 0.610| Mcap: KD 1.07 Bn
Boubyan Bank is an Islamic bank offering retail, corporate banking and wealth management services. The
bank is 47% owned by NBK and 19.2% held by Commercial Bank of Kuwait.
The bank‟s net profit came in at KD 6 mn in 2010 after dipping into a loss of KD 51 mn due to large write-
offs in 2009. Net Financing Income was up nearly 30% as provisions fell by 77% to KD 9 mn, or 1% of loans. Financing activities grew by 43% while deposits were up 23% for the year.
Historical Financial highlights-
All Figures in USD Mn 2005 2006 2007 2008 2009 2010 2010|9M
Income Statement
YoY
Net Financing income 10 14 20 37 29 37 29%
Provisions 2 2 1 20 38 9 -77%
Total Operating profits 13 29 49 63 47 58 23%
Net income 7 10 18 2 (51) 6 NM
Balance Sheet
Financing (loans) 56 112 194 465 564 806 43%
Assets 325 499 738 831 954 1,302 36%
Deposits 197 372 588 680 856 1,050 23%
Shareholder‟s Equity 106 117 136 134 86 236 173%
Source: Reuters Knowledge
Looking Forward Boubyan stock is down 5% YTD after gaining 50% in 2010. Value traded fell 70% in 2010 bringing the
turnover ratio to 23% from 115% in 2009.
Boubyan‟s CAR jumped to 27.8% in 2010 versus 14% in 2009 as the bank underwent a capital increase of
nearly 50%. NPLs were down 66% in 2010 after nearly tripling in 2009. The bank continues to write-off impaired loans and impaired assets while maintaining core activity growth.
Taib expects a strong return to profitability in 2011, but maintains an underperform recommendation.
Figure: Price and Turnover Trend
Consensus Estimate Table (2011f)
Annual (KD mn) EFG-Hermes Taib Global
Investment House
Apr-11 Apr-11 Mar-11
ROA: 1.48% 1.50% 1.20%
ROE: 11.40% 11.30% 9.00%
Revenue: 142 137 135
Net Profit 54 57 43
EPS(KWD) 0.04 0.05 0.03
Growth (EST) 34% 41% 7%
Target price (KWD) 0.8 0.95 0.87
Recommendation HOLD HOLD HOLD
Source: Reuters Knowledge
Consensus Estimate Table (2011f)

R E S E A R C H
May 2011
Kuwait Financial Centre S.A.K. “Markaz” 17
Ahli United Bank Code: AUB |Current Market Price: KWD 0.750| Mcap: KD 1.02 Bn
Ahli United Bank (AUB), formerly known as The Bank of Kuwait and The Middle East (BKME), was established in 1971 and operates about 20 local branches. It is 67% owned by Al Ahli United Bank and 12%
Public Institute for Social Security (PiFSS). The bank is engaged in retail banking activities as well as wealth
management.
Historical Financial highlights-
All Figures in KD Mn 2005 2006 2007 2008 2009 2010 2010
Income Statement
%
Interest income 78 111 130 140 109 100 -8%
Interest expense 40 68 88 97 52 41 -21%
Net Interest income 38 42 42 42 57 60 4%
Provisions 6 1 5 18 45 24 -48%
Net profit 40 45 48 51 14 27 92%
Balance Sheet Total Assets 1,611 1,927 2,236 2,235 2,258 2,452 9%
Loans 796 961 1,295 1,532 1,648 1,665 1%
Deposits 938 1,171 1,277 1,431 1,459 1,286 -12%
Total Liabilities 1,406 1,693 1,967 1,992 2,045 2,206 8%
Total Shareholder's Equity 205 235 270 243 213 245 15%
Source: Reuters Knowledge
AUB‟s bottom line nearly doubled in 2010 to KD 27 mn as Net Interest Income grew 4% on account of a
21% drop in Interest Expense. Provisions were down by almost half to KD 24 mn, or 1.4% of loans. Loans increased 1% to KD 1.6 bn while deposits declined 12% to KD 1.3.
Valuation The stock is outperforming the index, up roughly 20% YTD versus a loss on the index. AUB gained 43% in 2009. The turnover ratio was stable at about 9% as value traded was up 33% in 2010 to KD 55 mn.
Figure: Price and Turnover Trend
Annual (KD mn) TAIB
Apr-11
ROA: 1.70%
ROE: 9.20%
Revenue: 58
Net Profit 23
EPS(KWD) 0.01
Growth (EST) 280%
Target price (KWD) Underperform
Recommendation 0.30
Source: Reuters Knowledge

R E S E A R C H
May 2011
Kuwait Financial Centre S.A.K. “Markaz” 18
Al Ahli Bank of Kuwait Code: ABKK |Current market Price: KWD 0.620| Mcap: KD 0.89 Bn
Al Ahli Bank of Kuwait (ABK) is the State‟s has a network of 25 branches across Kuwait, and two UAE branches. The bank is engaged in Retail Banking, Corporate Banking, wealth management & advisory and
Treasury. The bank is 11.5% owned by the Public Institution for Social Security (PiFSS).
Historical Financial highlights-
All Figures in KD Mn 2005 2006 2007 2008 2009 2010 2010
Income Statement
%
Interest income 98 144 175 186 138 119 -14%
Interest expense 48 84 109 117 57 44 -23%
Net Interest income 50 59 66 69 82 76 -7%
Provisions 11 19 10 34 48 16 -68%
Net profit 47 60 76 46 39 53 36%
Balance Sheet Total Assets 2,010 2,427 2,965 3,041 2,969 2,953 -1%
Loans 1,191 1,389 1,812 2,082 1,979 1,961 -1%
Deposits 1,588 2,036 2,569 2,643 2,581 2,422 -6%
Total Liabilities 1,746 2,164 2,645 2,728 2,639 2,483 -6%
Total Shareholder's Equity 264 263 319 313 331 469 42%
Source: Reuters Knowledge
ABK‟s net profit was up 36% for the year to KD 53 mn; Provisions were down 68% for the year to KD 16 mn, or 0.74% of loans. Top line growth was weak; net interest income was down 7% as interest income fell
14%.
Loans were down 1% while deposits contracted 6% to KD 2.4 bn.
Looking forward The stock is underperforming the index, losing 10% YTD versus a 5% on KSE Weighted. The stock gained
43% in 2010. Turnover velocity was down to 2.6% in 2010 as value traded was down 8% to KD 26 mn.

R E S E A R C H
May 2011
Kuwait Financial Centre S.A.K. “Markaz” 19
ABK‟s CAR jumped to 23.7% (Tier I) in 2010 from 15.6% in 2009 as the bank went through a capital increase, raising share capital by nearly 50%, thereby giving it an adequate buffer against shocks.
Taib expects a net profit growth of 14% in 2011 with a Hold recommendation.
Figure: Price and Turnover Trend
Burgan Bank Code: BURG |Current market Price: KWD 0.510| Mcap: KD 0.752 Bn
Burgan Bank, established in 1975, is one of the five largest lenders in Kuwait with loans of over KD 2 bn.
The bank engages in Retail, Corporate and Investment banking activities through 22 local branches. Burgan is majority owned (58%) by Kuwait Projects Holding (Kipco).
Historical Financial highlights-
All Figures in KD Mn 2005 2006 2007 2008 2009 2010 2010
Income Statement
%
Interest income 91 129 167 208 201 173 -14%
Interest expense 48 76 116 140 100 67 -33%
Net Interest income 43 53 51 68 102 107 5%
Provisions 4 6 0 45 77 72 -7%
Net profit 42 56 75 37 21 16 -25%
Balance Sheet Total Assets 1,884 2,203 2,839 3,931 4,089 4,137 1%
Loans 839 961 1,463 2,195 2,364 2,236 -5%
Deposits 1,523 1,821 2,373 3,201 3,392 3,366 -1%
Total Liabilities 1,637 1,944 2,489 3,621 3,764 3,714 -1%
Total Shareholder's Equity 247 259 350 309 324 423 30%
Source: Reuters Knowledge
Burgan Bank saw its net profits fall 25% in 2010 as top line weakness continues to weigh on banks. Interest
income was down 14% while Interest Expense fell 33%. Net interest income came in at KD 107 mn, a 5% increase.
Provisions were down 7% to KD 72 mn, or 3.2% of loans. Lending was down 5% to KD 2.2 bn while
Deposits were down 1%.
Looking forward Burgan is up 6% for the year after gaining 67% in 2010. Value traded was up 40% to KD 327 mn, bringing
turnover velocity to 61%.
Consensus Estimate Table (2011f)
Annual (KD mn) TAIB
Apr-11
ROA: 2.00%
ROE: 12.50%
Revenue: 111
Net Profit 60
EPS(KWD) 0.04
Growth (EST) 14%
Target price (KWD) 0.68
Recommendation HOLD
Source: Reuters Knowledge

R E S E A R C H
May 2011
Kuwait Financial Centre S.A.K. “Markaz” 20
Burgan‟s CAR (Tier I) was at 15.6% in 2010, up from 12% in 2009. A 16% increase in Tier II capital during
the year bumped total CAR to 21% in 2010 from just under 17% in 2009. Non-performing loans jumped in
2009 to 10% of gross loans before scaling back to 6% of loans in 2010.
Broker estimates on the bank are mixed; EFG Hermes has a “Buy” view while Taib recommends “Hold”.
Figure: Price and Turnover Trend
Kuwait International Bank Code: KIBK |Current market Price: KWD 0.320| Mcap: KD 0.332 Bn
Kuwait International Bank, established in 1973, is an Islamic bank operating in the retail, commercial
banking, international banking and property management space through 11 local branches. Major
shareholders include Al Hoda for Hotels (17.59%) and Al Baraka Kuwait Trading (5.33%).
The bank reported net earnings of KD 17 mn in 2010 after posting a loss of KD 8 mn in 2009. Net financing income was down 7% while Total Operating Profits shed 15% to KD 48 mn.
Loans were down 6% to KD 765 mn while deposits were down 2%.
Historical Financial highlights-
All Figures in USD Mn 2005 2006 2007 2008 2009 2010 2010|9M
Income Statement
YoY
Net Financing income 24 26 24 29 30 28 -7%
Provisions 9 14 (3) 9 32 (3) NM
Total Operating profits 57 69 65 92 57 48 -15%
Net income 10 9 18 20 (8) 17 NM
Balance Sheet
Financing (loans) 525 526 535 760 816 765 -6%
Assets 765 803 947 1,082 1,140 1,141 0%
Deposits 567 600 717 879 945 925 -2%
Shareholder‟s Equity 160 142 158 165 173 196 13%
Source: Reuters Knowledge
Looking Forward KIB stock has lost 4% YTD after surging nearly 90% in 2010. The stock is currently trading at 18x, i.e. on
par with the index. Value traded was up 16% in 2010 to KD 388 mn; turnover velocity is at 122%.
KIB‟s CAR is at around 20%, well above the Central Bank minimum of 12%. NPLs as a percentage of loans is
high at 16% in 2010 versus 9.5% in 2009 due to a decline in loans coupled with a 56% increase in NPLs.
Consensus Estimate Table (2011f)
Annual (KD mn) EFG-
Hermes Taib
Apr-11 Apr-11
ROA: 1.21% 0.40%
ROE: - 3.90%
Revenue: 168 170
Net Profit - -
EPS(KWD) -
Growth (EST) -
Target price (KWD) 0.6 0.5
Recommendation BUY HOLD
Source: Reuters Knowledge

R E S E A R C H
May 2011
Kuwait Financial Centre S.A.K. “Markaz” 21
Taib expects a 7% net profit growth in 2011 with a “Hold” call.
Figure: Price and Turnover Trend
Disclaimer
This report has been prepared and issued by Kuwait Financial Centre S.A.K (Markaz), which is regulated by the Central Bank of Kuwait. The report is owned by Markaz and is privileged and proprietary and is subject
to copyrights. Sale of any copies of this report is strictly prohibited. This report cannot be quoted without the prior written consent of Markaz. Any user after obtaining Markaz permission to use this report must clearly
mention the source as “Markaz “.This Report is intended to be circulated for general information only and
should not to be construed as an offer to buy or sell or a solicitation of an offer to buy or sell any financial instruments or to participate in any particular trading strategy in any jurisdiction. The information and
statistical data herein have been obtained from sources we believe to be reliable but in no way are warranted by us as to its accuracy or completeness. Markaz has no obligation to update, modify or amend
this report.
Consensus Estimate Table (2011f)
Annual (KD mn) TAIB
Apr-11
ROA: 1.50%
ROE: 8.70%
Revenue: 40
Net Profit 18
EPS(KWD) 0.02
Growth (EST) 7%
Target price (KWD) 0.34
Recommendation HOLD
Source: Reuters Knowledge

R E S E A R C H
May 2011
Kuwait Financial Centre S.A.K. “Markaz” 22
This report does not have regard to the specific investment objectives, financial situation and the particular needs of any specific person who may receive this report. Investors are urged to seek financial advice
regarding the appropriateness of investing in any securities or investment strategies discussed or
recommended in this report and to understand that statements regarding future prospects may not be realized. Investors should note that income from such securities, if any, may fluctuate and that each
security‟s price or value may rise or fall. Investors should be able and willing to accept a total or partial loss of their investment. Accordingly, investors may receive back less than originally invested. Past performance
is historical and is not necessarily indicative of future performance.
Kuwait Financial Centre S.A.K (Markaz) does and seeks to do business, including investment banking deals,
with companies covered in its research reports. As a result, investors should be aware that the firm may have a conflict of interest that could affect the objectivity of this report. For further information, please contact „Markaz‟ at P.O. Box 23444, Safat 13095, Kuwait. Tel: 00965 1804800 Fax: 00965 22450647. Email: [email protected]

Kuwait Financial Centre S.A.K “Markaz” R E S E A R C H
Economics
Kuwait Development Plan (Apr-11) MENA Unrest (Apr-11) Kuwait Investment Sector (Sept-10) The New Regulations on Kuwait Investment Sector (Jun-10) Kuwait Capital Market Law (Mar-10) The “Vicious Square” Monetary Policy options for Kuwait (Feb-08) A Gulf Emerging Portfolio: And Why Not? (Jun-07) To Leap or To Lag: Choices before GCC Regulators (Apr-07) GCC for Fundamentalists (Dec-06)
GCC Leverage Risk (Nov-06)
Sectors
Infrastructure GCC Power (Jul-09) GCC Ports (Aug-09) GCC Water (Nov-09) GCC Airports (Nov-09) GCC Roads & Railways (Dec-09) GCC ICT (Feb-10)
Real Estate Abu Dhabi Algeria Dubai Egypt Jordan KSA Kuwait Lebanon Qatar Syria U.S.A.
Banking
Stress Testing Kuwait‟s Banks (May-11) GCC Banks - Done with Provisions? (Jan-10) Shelter in a Storm (Mar-09) Banking Sweet spots (Apr-08)
Oil & Gas Diworsification: The GCC Oil Stranglehold (Jan-09)
Periodic Research Monthly Regional Petroleum Projects Commentary Weekly Real Estate Market Commentary Daily Oil & Gas Bulletin
Strategic Research What to expect in 2011 (Jan-11) The Golden Portfolio (Sept-10) Persistence in Performance (Jun-10) What to expect in 2010 (Jan-10) What is left for 2009? (Sept-09) Missing the Rally (Jun-09) This Too Shall Pass (Jan-09) Fishing in Troubled Waters (Dec-08) Down and Out: Saudi Stock Outlook (Oct-08) Mr. GCC Market-Manic Depressive (Sept-08) Global Investment Themes (June-08) To Yield or Not To Yield (May-08) China and India: Too Much Too Fast (Oct-07) A Potential USD 140b Industry: Review of Asset Management Industry in Kuwait (Sep-07) A Gulf Emerging Portfolio: And Why Not? (Jun-07) Derivatives Market in GCC (Mar-07) Managing GCC Volatility (Feb-07)
Periodic Research Annual GCC Market Outlook Quarterly GCC Equity Funds GCC Corporate Earnings GCC Equity Research Statistics Monthly Market Review Weekly MENA Market Intelligence KSE Market Review International Market Update Daily Markaz Daily Morning Brief Markaz Kuwait Watch Daily Fixed Income Update
Company Research
(See the list attached)
Capital Markets
Markaz Research Offerings

R E S E A R C H
May 2011
Kuwait Financial Centre S.A.K. “Markaz” 24