Embed Size (px)
Citation preview
Turk J Elec Eng & Comp Sci(2022) 30: 312 – 327© TÜBİTAKdoi:10.3906/elk-2102-138
Turkish Journal of Electrical Engineering & Computer Sciences
http :// journa l s . tub i tak .gov . t r/e lektr ik/
Research Article
Stressed or just running? Differentiation of mental stress and physical activityby using machine learning
Yekta Said CAN∗
History Department, College of Social Sciences and Humanities, Koç University, İstanbul, TURKEY
Received: 27.02.2021 • Accepted/Published Online: 09.11.2021 • Final Version: 19.01.2022
Abstract: Recently, modern people have excessive stress in their daily lives. With the advances in physiological sensorsand wearable technology, people’s physiological status can be tracked, and stress levels can be recognized for providingbeneficial services. Smartwatches and smartbands constitute the majority of wearable devices. Although they have anexcellent potential for physiological stress recognition, some crucial issues need to be addressed, such as the resemblanceof physiological reaction to stress and physical activity, artifacts caused by movements and low data quality. This paperfocused on examining and differentiating physiological responses to both stressors and physical activity. Physiologicaldata are collected in the laboratory environment, which contain relaxed, stressful and physically active states and theyare differentiated successfully by using machine learning.
Key words: Machine learning, stress detection, affective computing, smart band, PPG, physical activity detection
1. IntroductionStress is one of the significant issues in modern society. It is generally experienced when individuals fail torespond to mental, emotional, or physical demands competently [1]. Hence, the major causes of stress canbe listed as the exposure to the demands and pressures from physical or mental activities or self-imposedrequirements, obligations and self-criticism [2]. Severe illnesses can be caused by stress such as depression,cardiovascular diseases, infectious diseases, and cancer [3] and therefore, continuous measurement of stressin daily life gains importance. In behavioral science, researchers usually employ self-reports by periodicallycollecting instantaneous assessments of perceived stress. However, it is not possible to recognize stress levelswith this approach continuously because of its burden and obtrusiveness. Therefore, researchers investigateddifferent sensing techniques for recognizing stress levels automatically, such as facial expressions, physiologicalsignals, speech and gestures. Due to their noninvasiveness, privacy and ease of use in daily lives, detecting stressby using smartbands and smartwatches from physiological signals attracted more attention.
Notwithstanding the high potential of smartbands and smartwatches in stress detection, researchers needto deal with several issues in exploiting physiological reactions. The first one is the similar physiological reactionsto stressors and changes in physical or mental conditions. A physiological pattern might not necessarily indicatea stress level change [4, 5]. Similar physiological reactions can be seen under demanding physical activities,physical discomfort, noise, changes in posture, lighting conditions, demanding mental task and emotional stress[1]. The second issue is the limitations of these devices for detecting physiological signals. They are sensitive tonoise, might miss samples, and have problems with battery life. The third issue is the different types of stress∗Correspondence: [email protected]
This work is licensed under a Creative Commons Attribution 4.0 International License.312
CAN/Turk J Elec Eng & Comp Sci
can have varying physiological expressions. Under physical stress, the sympathetic nervous reaction is moredominant, but under cognitive stress, the adrenal reaction is more dominant. Finally, physiological reactions tostressors depend on individuals. Personalizing stress models might be necessary for accurate systems.
With the widespread usage of these wrist-worn wearables, health applications have been developed forimproving the life quality of users. However, these devices are not without challenges. Periodical stress detectionapps were developed by consumer smartwatch companies, but they require users to be still during these periodicmeasurements. The exact instruction is “during a stress test, wear your watch correctly and keep still”. Thismeans that these applications are not appropriate for recognizing the stress levels of individuals in their dailylives because the movements are unlimited. The reasons for this requirement could be artifacts caused bymovements or difficulty in differentiating physical activity and stress from physiological responses.
In this study, a stress and physical activity differentiation system is developed, which is implemented forunobtrusive smart wearable devices. To the best of our knowledge, this study is the first one to differentiatestress and physical activity system works with smart bands. The system is tested on 14 participants in thelaboratory environment. Heart rate variability (HRV) and electrodermal activity (EDA) signals obtained froman Empatica E4 smartband are used for this purpose. After cleaning the artifacts, most discriminative featureswere extracted. A variety of classifiers were tested for differentiating stressful, relaxed, physically active states.
The rest of the paper is organized as follows: In Section 2, the related work is provided for automaticstress and physical activity recognition systems that use smart bands or smartwatches. In Section 3, the datacollection procedure is explained. In Section 4, the proposed smart band-based stress and physical activitydifferentiation scheme is presented. In Section 5, the experimental results of the proposed system are discussed.In Section 6, the findings of the study are evaluated and future work of the current research is discussed.
2. Literature reviewAfter the emergence of smartbands and smartwatches, researchers used them to improve the quality of life. In theliterature, there are studies for recognizing physical activity and mental stress levels. Physical activity intensitylevel detection studies were accelerated with the emergence of smartphones. The motion sensors (accelerometerand gyroscope) were used for this purpose [6]. After smartphones, smartwatches and smartbands were alsoemployed for physical activity detection. Degroote et al. [7] used Polar M600, Huawei watch and Asus Zenwatchfor detecting physical activity levels. The accelerometer sensors were employed in these devices. In daily life,they achieved approximately 72.25% accuracy. Dobbins and Rawssizadeh [8] developed a physical activitylevel recognition system. They used an LG watch and Samsung Gear S watch and utilized the combination ofacceleration data of smartwatches and a smartphone for physical activity level detection. They achieved 78.61%accuracy. Davoudi et al. [9] conducted a validity study of Samsung Gear S devices for physical activity levelrecognition and showed that they have 87% accuracy.
Another widely conducted research field with smartwatches and smartbands is automatic stress recogni-tion. Stress has a physiological reaction and it can be measured from physiological signals such as electrodermalactivity (EDA), HRV, skin temperature (ST) and acceleration (ACC). Samsung Gear S, S2 and Microsoft Band2 are among the widely used commercial smartwatches and Empatica E4 is a commonly used research-orientedsmartband for stress level recognition. Hao et al. [10] used Empatica E4 PPG sensor for extracting HRVinformation and detected stress levels in real-life settings. De Arriba-Perez et al. [11] used Microsoft Band 2for detecting mental stress in laboratory settings and achieved 85% accuracy. Siirtola et al. [12] used a publicdataset WESAD and performed experiments. This dataset contains physiological data of participants in a
313
CAN/Turk J Elec Eng & Comp Sci
laboratory environment collected with Empatica E4. Can et al. [13] used a combination of smartwatches andsmartbands for collecting data in a real-life event. By using HRV and EDA, they achieved 90% accuracy fordetecting mental stress. They also analyzed the difference in physiological reactions between cognitive load andmental stress. As it can be seen from the literature, physical activity intensity and mental stress are studiedseparately in several studies. However, to the best of our knowledge, there is not any study that investigatesboth physical activity and mental stress and tries to differentiate them.
3. Laboratory data collection
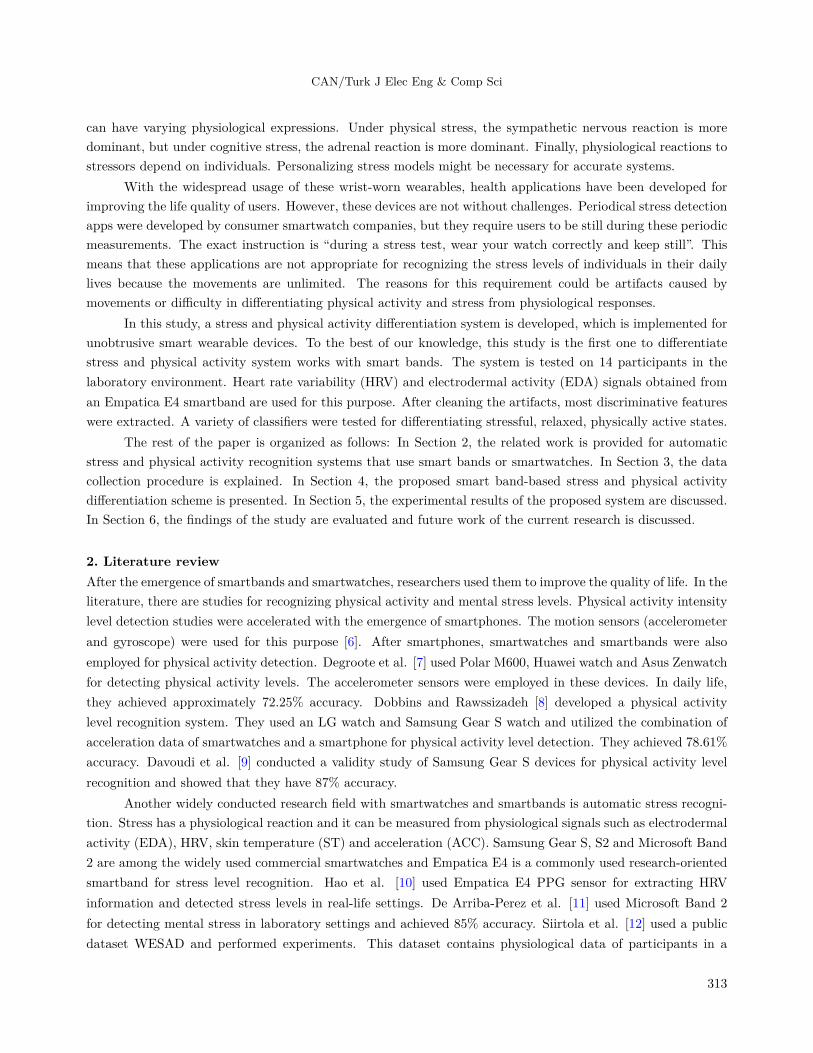
The laboratory data is collected through a psychological experiment by using an implementation of the TrierSocial Test (TSST) [14]. TSST is commonly used to induce stress in the literature. Controlled laboratory datawere obtained from the 14 subjects who participated in the experiment. All participants followed the sameprocess. They were college students whose ages are between 20 and 25. Nine of them were males and five ofthem were females. The experiment took approximately 1 h and it consists of baseline (prestress), mental stress,recovery and physical activity sessions (see Figure 1).
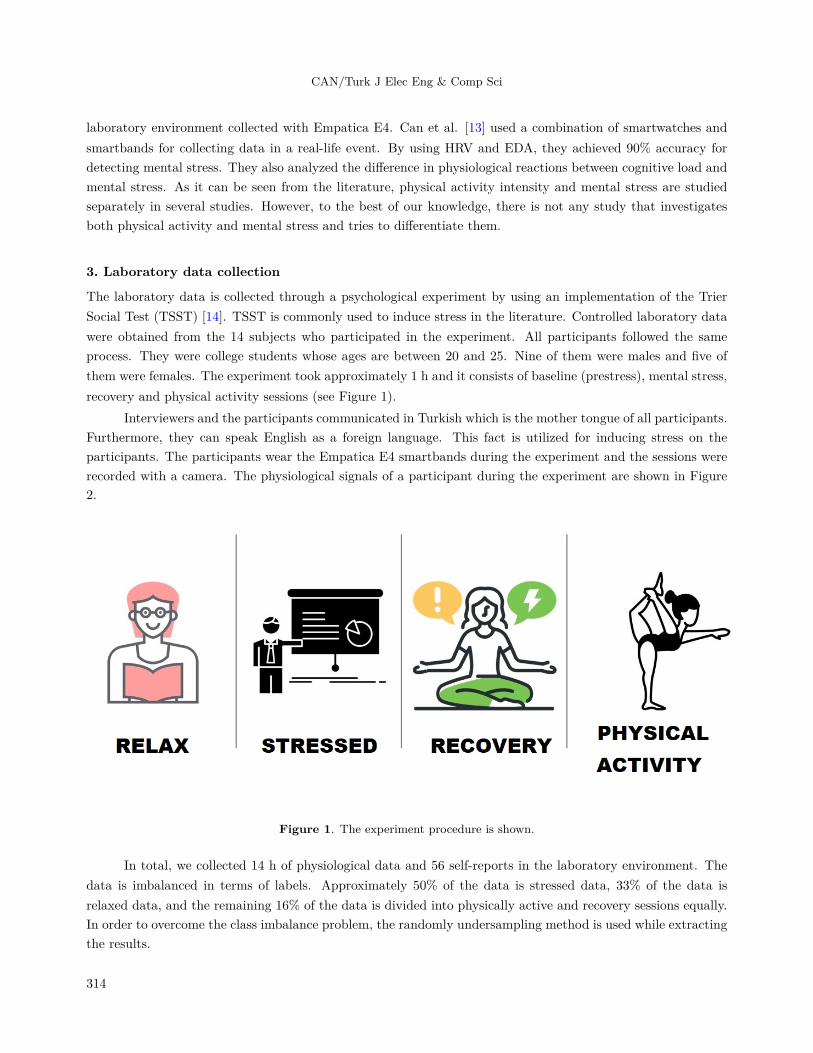
Interviewers and the participants communicated in Turkish which is the mother tongue of all participants.Furthermore, they can speak English as a foreign language. This fact is utilized for inducing stress on theparticipants. The participants wear the Empatica E4 smartbands during the experiment and the sessions wererecorded with a camera. The physiological signals of a participant during the experiment are shown in Figure2.
Figure 1. The experiment procedure is shown.
In total, we collected 14 h of physiological data and 56 self-reports in the laboratory environment. Thedata is imbalanced in terms of labels. Approximately 50% of the data is stressed data, 33% of the data isrelaxed data, and the remaining 16% of the data is divided into physically active and recovery sessions equally.In order to overcome the class imbalance problem, the randomly undersampling method is used while extractingthe results.
314
CAN/Turk J Elec Eng & Comp Sci
Figure 2. The changes in physiological signals of a participant during the experiment. The top signal is EDA, themiddle signal is acceleration and the bottom one is heart rate signal.
3.1. Set upIn the set-up phase;
1. Experiment areas are prepared, the camera is set and we check the Empatica E4 smartband battery andfunctionalities.
2. Interviewers are prepared. They keep eye contact with the participant during the experiment. Theirgestures and mimics should be neutral.
3. We informed the participants about the procedure and then they sign the consent forms.
4. The participant wears the smartband (Empatica E4).
5. The participants are asked to turn off their cellphones to refrain from distraction.
3.2. Prestress phaseIn the prestress phase;
1. Perceived Stress Scale (PSS-14) form is filled.
2. The participants stay in the waiting area and relax for 10 min. We put emotionally neutral magazinessuch as home, garden, car, furniture, fashion related ones for them to read.
3.3. The TSST phaseThe TSST is implemented as follows;
315

CAN/Turk J Elec Eng & Comp Sci
1. The participant enters the interview area.
2. For preparing the TSST speech, we read the following text to all the participants: “This is the speechpreparation portion of the task; you are expected to prepare a five-min speech describing why you study[name of the degree that the participant studies/studied] and why you would be a good candidate for yourideal job. Your speech will be videotaped and reviewed by the psychologists that we conduct the research.You have five min to prepare and your time begins now.”
3. After that, the participants prepare their speech. The digital timer is set to five min. Interviewers leavethe room during this phase.
4. At the end of the speech preparation phase we inform them by reading the following text: “This is thespeech portion of the task. You should speak for the entire five-min time period. Your time begins now”.Interviewers should start the recording of the camera.
5. TSST speech performance period: If the participant stops during this period, interviewers allow him/herto stay silent for around 20 s and then prompt: “You still have time remaining.”
6. After the first 2 min of the speech period, the participants are interrupted and asked to continue theirspeech in English by telling them: “Could you continue in English from now on, please ?”
7. At the end of 2.5 min, if the participant does not attempt to reply to both questions, interviewers promptthe participant to answer the other question.
8. At the end of the speech performance period, the communication between interviewers and the participantresumes in Turkish. Interviewers reset the timer to 5 min and read the following to the participant: “Duringthe final five-min math portion of this task, you will be asked to sequentially subtract 13 from 1022. Youwill verbally report your answers aloud and be asked to start over from 1022 if a mistake is made. Yourtime begins now.” If the participant makes any mistake, the interviewer says the following: ”That isincorrect, please start over from 1022.”
3.4. Poststress recovery phase
In order to decrease the stress levels of participants, we applied a biofeedback-based intervention techniquewhich is the built-in breathing application of Apple Watch. The technique is applied as follows;
1. Participants sit on the couch as a relaxing place.
2. Participants wear the Apple Watch provided to them and follow the breathing exercise built in the AppleWatch for a minute and then follow a mindfulness video, for the remaining four min, on a comfortablecouch, while sitting or lying as they prefer.
3. Interviewers leave the room after giving the Apple Watch to the participants.
4. At the end of the five-min-long recovery period, interviewers return to the room.
316

CAN/Turk J Elec Eng & Comp Sci
3.5. Physical activity phase1. Interviewers leave the room in order not to induce stress during the physical-activity period.
2. Participant follows a five-min-long exercise on Youtube. It is an intense cardio workout without using anyequipment. The link could be accessed at ”https://www.youtube.com/watch?v=Tz9d7By2ytQ”
3. Interviewers return to the room and return the pieces of equipment.
4. Mental stress and physical activity level detection methodAn unobtrusive stress and physical activity detection system which is suitable for daily life use is proposed(see Figure 3). Empatica E4 smart wristband is selected as the unobtrusive device. The battery life of thisdevice is around forty eight h and it has a 3D accelerometer sensor, a photoplethysmography (PPG) sensor, anskin temperature sensor and an EDA sensor. However, it has lower data quality than medical-grade devicesand it is more sensitive to unrestricted motions in daily life. Therefore, state-of-the-art preprocessing, featureextraction and machine learning algorithms are required for daily life stress and physical activity level detectionand differentiation system. Preprocessing and feature extraction modules were developed in our previous study[15].
Figure 3. The high-level block diagram of the proposed system is shown.
4.1. PreprocessingPhysiological time-series data obtained from various sensors of the smartband were divided into nonoverlappingwindows. The window sizes are determined as 120 s because stress stimulation and recovery processes lastedaround 3-4 min and selected window lengths can capture them 1.
4.1.1. HRV artifact detection and removal moduleAn artifact detection percentage threshold between each R to R interval and the local average was applied forthe heart rate signal. The threshold was selected as 20% because it is unlikely that RR intervals can deviatefrom the local mean with that amount [16]. The removed artifact data points were replaced with a cubic spline
1Harvard University (2021) Understanding the stress response [online]. https://www.health.harvard.edu/staying-healthy/understanding-the-stress-response [accessed 27 July 2021].
317
CAN/Turk J Elec Eng & Comp Sci
interpolation function, as implemented in Kubios [16]. The interpolation technique achieved better results, andtherefore it is preferred to the application of minimum consecutive time and sample constraints on the remainingdata [17]. The windows that contain more than 10% artifacts were discarded.
4.1.2. EDA artifact detection and removal moduleThe toolbox developed by Taylor et al. [18] was used to detect and remove the artifacts in the EDA signal.The EDAExplorer toolbox employs the SVM algorithm and determines artifact data points in the EDA signalwith less than 5% error by examining ST, ACC, and EDA signals. The artifacts were automatically removedafter being detected by this tool. The batch processing feature was further added. Then, the cleaned signal ispassed to the EDA feature extraction unit.
4.2. Feature extractionFor each modality, discriminative features are extracted. These state-of-the-art features were commonly used inthe literature [19–21]. The feature extraction methodologies for each of the physiological signals are describedin this section.
4.2.1. HRV feature extraction moduleThirteen HRV features were computed by analyzing the RR intervals. To extract frequency-domain features,two methods are applied. Firstly, RR intervals are resampled at 4 Hz [22] and Fast Fourier transform (FFT)is applied. In a second way, the Lomb-Scargle technique is applied, which is a special technique for convertingnonequidistant sampled signals to the frequency domain. The extracted heart rate variability features are listedas: 1. Mean value of the inter-beat (RR) intervals 2. Standard deviation of the inter-beat interval 3. Rootmean square of the successive difference of the RR intervals. 4. Percentage of the number of the successive RRintervals varying more than 50 ms from the previous interval 5. Total number of RR intervals divided by theheight of the histogram of all RR intervals measured on a scale with bins of 1/128 s 6. Triangular interpolationof RR interval histogram 7. Power in the low-frequency band (0.04–0.15 Hz) 8. Power in the high-frequencyband (0.15–0.4 Hz) 9. Ratio of LF to HF. 10. Prevalent low-frequency oscillation of the heart rate 11. Prevalenthigh-frequency oscillation of the heart rate 12. Power in the very low-frequency band (0.00–0.04 Hz) 13. Relatedstandard deviation of successive RR interval differences.
4.2.2. EDA feature extraction moduleEDA signal is decomposed into phasic and tonic components using the convex optimization-based EDAcvx tool[18]. EDAcvx also cleanses the Gaussian noise. Ten discriminative features from both the tonic and phasiccomponents of the EDA signal were extracted. Percentiles are very usable for examining the distribution ofnumber sets using various EDA graphs, and different percentiles were used. The following EDA features wereselected from the literature [19, 24]. 1. Mean value 2. Maximum value 3. Standard deviation 4. Minimum value5. Number of peaks 6. Derivative 7. Number of strong peaks 8. Twentieth percentile 9. Eightieth percentile10. Quartile deviation.
4.2.3. ACC feature extraction moduleThe sensor data of the accelerometer is employed for two different purposes. First, features are extractedfrom this sensor. This sensor was further used to clean the EDA signal in the EDAExplorer tool. Extracted
318
CAN/Turk J Elec Eng & Comp Sci
accelerometer features are Mean X (Mean acceleration over x-axis), Mean Y (Mean acceleration over y-axis),Mean Z (Mean acceleration over z-axis), Mean ACC MAG (Mean acceleration over acceleration magnitudeaxis).
4.3. Machine learning classification algorithmsTo detect stress and physical activity levels separately and differentiate them, the Python Keras and Scikitlibraries are employed. Several preprocessing tools were applied to the data before initiating the classificationprocess. When the number of instances in each class is concerned, our dataset is not balanced. Extra samples ofthe majority class were removed, and this issue was solved. Therefore, the biasing of the classifiers towards themajority classes was prevented. Five different machine learning classifiers were used. They are the most widelyapplied classifiers in the literature [19], [25], Logistic Regression (LR), kNN, multi-layer perceptron (MLP),support vector machine (SVM) and random forest (RF). Python scikit library was used for the implementationof these classifiers. The default parameters were used. In order to evaluate the performance of the classifiers,10-fold cross-validation was applied.
4.3.1. Support vector machines (SVM)
SVM creates decision planes that define decision boundaries. A decision plane can be defined as the planethat divides objects belonging to different classes. In some classification tasks, complex decision structures areneeded to separate these objects into their classes correctly. Support vector machines are designed to cope withthis kind of task. SVM rearranges objects using kernels which are a set of mathematical functions [26]. Theobjects are mapped or transformed so that they can be easily separated by less complex planes.
4.3.2. K nearest neighbors (kNN)
This method relies on memory for saving instances with known outputs. Labels of these instances are known.When a new test instance is to be decided, the output of the closest known objects is examined. The majorityof votes rule is applied. The output that has emerged on the majority among these neighbors is assigned to thetest instance. The distance formula (Euclidean, Mahalanobis, etc.) and the number of closest objects that arebeing evaluated (k number) are important parameters for the kNN algorithm.
4.3.3. Decision tree / random forest
Decision trees are ML tools that are used for regression or classification of both continuous and discrete variables[26]. The structure of this ML model inspired its name. The decision tree mechanism is as follows: For eachiteration, local regions are created recursively. It is a supervised, and hierarchical model [27]. The decision treecomprises of decision nodes and leaves. Each decision divides the data. Low entropy divisions are created inthis manner. Appropriate sized tree generation requires expert knowledge [26]. A random forest is a variationof a decision tree that uses multiple trees instead of a single one.
4.3.4. Logistic regression
Logistic regression (LR) is a method of representing the probability of a discrete outcome provided by an input[28]. The most widely used LR model is the model with a binary output, such as true/false, yes/no, and soon. Multinomial logistic regression can be employed if there are more than two possible discrete outputs. LR
319
CAN/Turk J Elec Eng & Comp Sci
is also a helpful analysis tool for classification problems where researchers try to decide whether a new samplefits best into a category.
4.3.5. Multilayer perceptron
The Multilayer perceptron (MLP) is a feedforward artificial neural network [29]. It has a minimum of threelayers which are the input layer, hidden layer(s) and the output layer. The hidden layer (s) uses the activationfunctions to capture nonlinear data relations. Therefore, MLPs can discriminate between classes that arenonlinearly separated. We selected them as representative of a shallow neural network to compare with thetraditional machine learning algorithms. Unipolar sigmoid function was used as an activation function in hiddenvolumes of MLP. We used a plain MLP with only one hidden layer.
5. Experimental results and discussionThree different states were differentiated which are physically active, stressed and relaxed states by usingmachine learning classifiers. The performance metrics were defined first the results which are obtained withdata coming from EDA, ACC, and PPG sensors were presented separately.
5.1. MetricsTo evaluate our system performance, we used four different metrics. These metrics are widely used in stressdetection studies.
5.1.1. Classification accuracyThe first metric is accuracy. It can be calculated by dividing the accurately classified windows by the numberof all windows of all participants (it is calculated for all tuples separately).
5.1.2. Precision, recall and f_MeasureWe also computed and presented the precision, recall and F_measure metrics. Recall and precision metrics areemployed to compute the F_measure. Their formulas are as follows:
Precision =TruePositive
TruePositive+ FalsePositive(1)
Recall =TruePositive
TruePositive+ FalseNegative(2)
Fmeasure =2× Precision×Recall
Precision+Recall(3)
5.2. Differentiation of physically active and relaxed statesFirst, physically active and relaxed states were differentiated. The classification accuracies are presented inTables 1, 2 and 3. Since the movements of participants are constrained in relaxed states, it is more convenientto use acceleration data to differentiate them from physically active states. Furthermore, the EDA signal isalso sensitive to movements and it is the most distinctive signal along with the acceleration signal. The heartactivity signal obtained from the PPG sensor achieves the lowest accuracy for distinguishing these two states.This could be explained by the contamination of this signal by the increased artifacts during physical activity.
320
CAN/Turk J Elec Eng & Comp Sci
Table 1. The differentiation results of physically active and relaxed sessions by using the accelerometer sensor.
Method Precision Recall F_measure Accuracy Area under ROCMLP 0.926 0.926 0.926 92.647 0.982RF 0.899 0.897 0.897 89.706 0.957kNN 0.905 0.904 0.904 90.124 0.911SVM 0.921 0.912 0.911 91.176 0.914LR 0.907 0.904 0.904 90.441 0.966
Table 2. The differentiation results of physically active and relaxed sessions by using the PPG sensor.
Method Precision Recall F_measure Accuracy Area under ROCMLP 0.863 0.826 0.822 82.638 0.833RF 0.851 0.833 0.831 83.333 0.912kNN 0.917 0.917 0.917 91.667 0.954SVM 0.894 0.889 0.889 88.889 0.848LR 0.808 0.806 0.805 80.556 0.865
Table 3. The differentiation results of physically active and relaxed sessions by using the EDA sensor.
Method Precision Recall F_measure Accuracy Area under ROCMLP 0.916 0.899 0.898 89.923 0.908RF 0.860 0.860 0.860 86.046 0.938kNN 0.869 0.868 0.868 86.821 0.864SVM 0.927 0.915 0.914 91.473 0.913LR 0.884 0.884 0.884 88.372 0.922
5.3. Differentiation of physically active and stressed statesPhysically active and stressed states were differentiated. This classification is the most challenging one sincethe physiological reactions to them are similar to each other. The classification accuracies are presented inTables 4, 5 and 6. The acceleration signal achieved the best performance while differentiating between thesetwo states, which is expected because the physical activity intensity level is different in these sessions. Around70% accuracies with heart activity signal were obtained and 60% accuracies with EDA signal were obtained.This proves the similarity of physiological reactions.
Table 4. The differentiation results of physically active and stressed sessions by using the accelerometer sensor.
Method Precision Recall F_measure Accuracy Area under ROCMLP 0.872 0.871 0.871 87.143 0.948RF 0.909 0.907 0.907 90.491 0.959kNN 0.818 0.814 0.814 81.428 0.897SVM 0.911 0.907 0.907 90.714 0.907LR 0.886 0.886 0.886 88.571 0.958
321
CAN/Turk J Elec Eng & Comp Sci
Table 5. The differentiation results of physically active and stressed sessions by using the PPG sensor.
Method Precision Recall F_measure Accuracy Area under ROCMLP 0.702 0.660 0.641 65.97 0.659RF 0.756 0.722 0.713 72.22 0.845kNN 0.748 0.740 0.739 74.028 0.792SVM 0.709 0.688 0.679 68.75 0.633LR 0.774 0.764 0.762 76.389 0.762
Table 6. The differentiation results of physically active and stressed sessions by using the EDA sensor.
Method Precision Recall F_measure Accuracy Area under ROCMLP 0.686 0.683 0.681 68.254 0.696RF 0.694 0.690 0.689 69.047 0.709kNN 0.688 0.659 0.645 65.873 0.696SVM 0.635 0.635 0.635 63.492 0.635LR 0.682 0.675 0.671 67.46 0.681
5.4. Differentiation of relaxed and stressed statesFinally relaxed and stressed states were differentiated. The classification accuracies are presented in Tables 7,8 and 9. The accuracies with all modalities are around 75% and 80%. The results could be higher but sinceparticipants’ perceived stress levels could be different than the expected stress level of the known context, thisdecreases the performance of our system. As an example, some participants might have lower stress levels inthe TSST session, which will cause a false ground truth and misleading training data segments.
Table 7. The differentiation results of relaxed and stressed sessions by using the accelerometer sensor.
Method Precision Recall F_measure Accuracy Area under ROCMLP 0.715 0.712 0.711 71.212 0.783RF 0.783 0.780 0.780 78.03 0.852kNN 0.770 0.765 0.764 76.5153 0.746SVM 0.690 0.689 0.689 68.939 0.689LR 0.680 0.681 0.682 68.261 0.690
Table 8. The differentiation results of relaxed and stressed sessions by using the PPG sensor.
Method Precision Recall F_measure Accuracy Area under ROCMLP 0.810 0.809 0.809 80.9497 0.845RF 0.824 0.819 0.818 81.918 0.886kNN 0.849 0.841 0.840 84.119 0.911SVM 0.825 0.822 0.821 82.232 0.822LR 0.791 0.791 0.791 79.088 0.884
322
CAN/Turk J Elec Eng & Comp Sci
Table 9. The differentiation results of relaxed and stressed sessions by using the EDA sensor.
Method Precision Recall F_measure Accuracy Area under ROCMLP 0.735 0.720 0.715 71.969 0.811RF 0.781 0.780 0.780 78.03 0.882kNN 0.854 0.833 0.831 83.333 0.895SVM 0.844 0.773 0.760 77.272 0.773LR 0.697 0.689 0.686 68.949 0.776
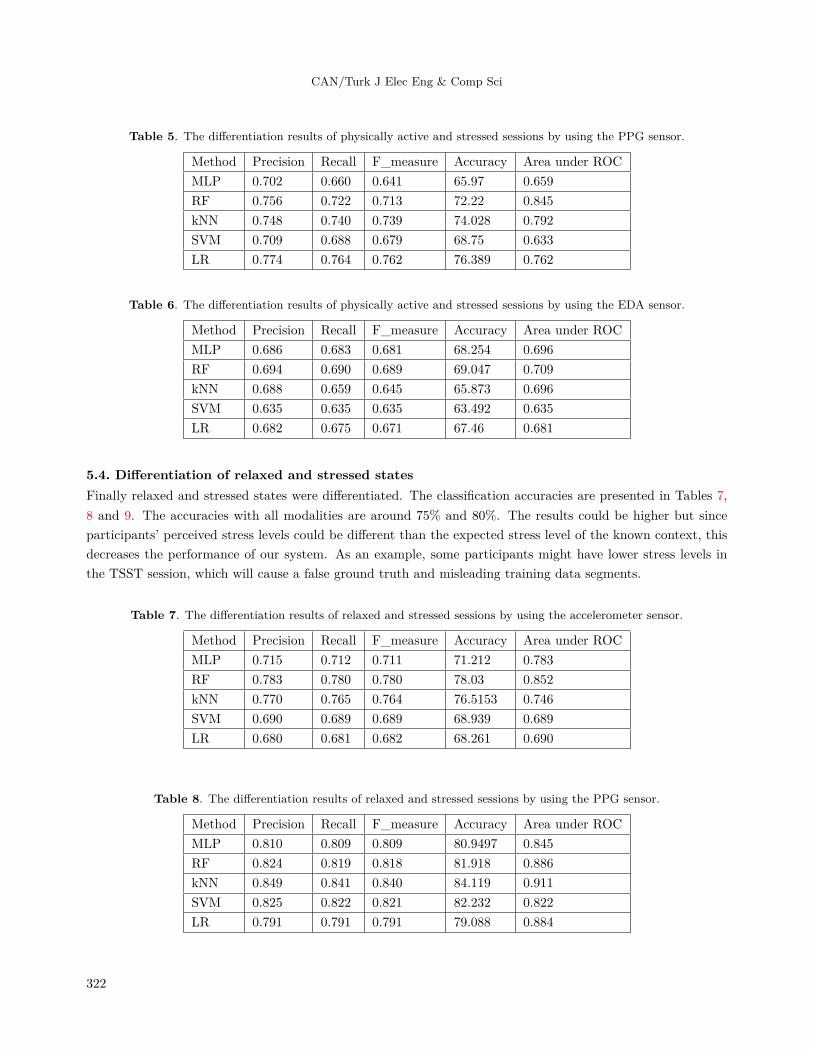
5.5. DiscussionThe main purpose of this study is to differentiate stress and physical activity. The most successful signal isthe acceleration for this purpose. Heart activity has also around 75% accuracy for differentiating these twosignals. Combining these two signals will achieve a more robust system for differentiating stress and physicalactivity. For detecting stress from relax sessions, heart activity achieves the best results. This proves that stressdetection systems must monitor heart activity. The acceleration signal is especially needed in the presence ofpotential physical activity. EDA signal is affected by environmental conditions such as temperature and physicalactivity, and it could be easily contaminated, and that is why it could not achieve higher results than the othersignals. The easiest task is to differentiate physical activity and relax states, and all signals can easily detectphysical activity with over 90% accuracy. SVM and random forest algorithms are the most successful classifiersin these tasks. Furthermore, I selected the best classifiers for differentiating each tuple (relax-stress, physicalactivity-stress and relax-physical activity) and draw the ROC curves (see Figures 4,5 and 6) to compare theresults visually.
Figure 4. The ROC curves of the best performing classifier (kNN) using heart activity signal for differentiating physicalactivity and relax states. The top ROC curve belongs to the relax label and the bottom ROC curve belongs to thephysical activity label.
323
CAN/Turk J Elec Eng & Comp Sci
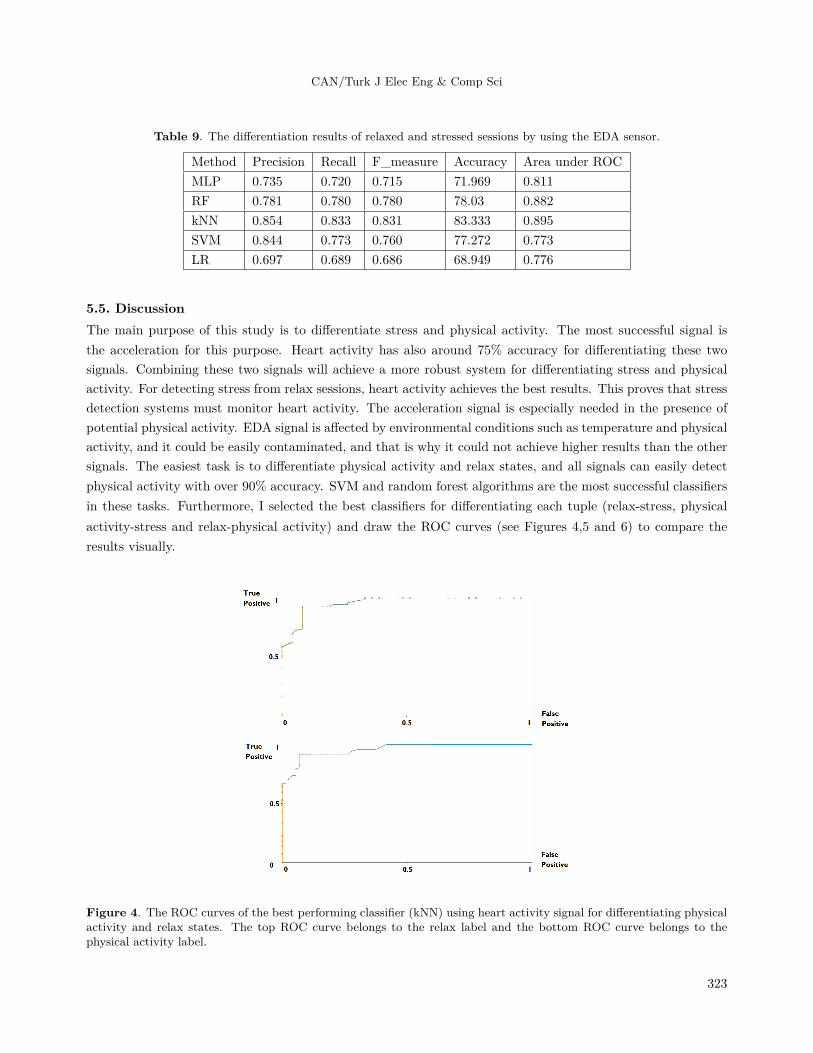
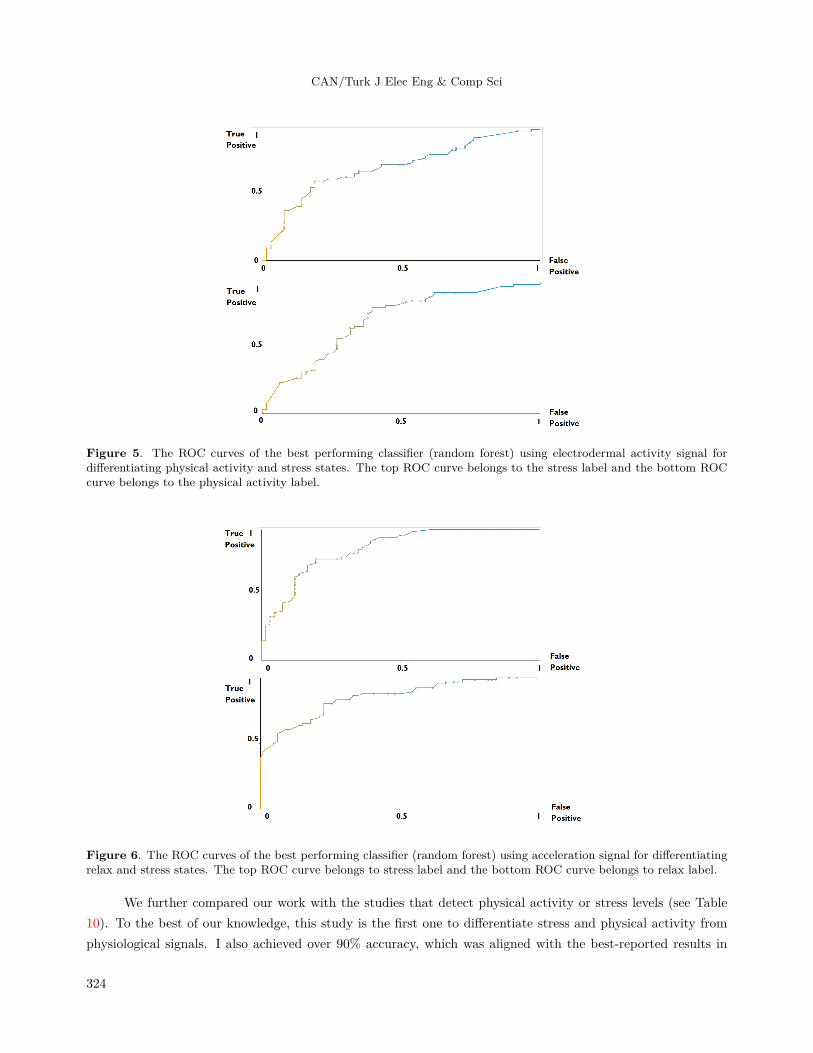
Figure 5. The ROC curves of the best performing classifier (random forest) using electrodermal activity signal fordifferentiating physical activity and stress states. The top ROC curve belongs to the stress label and the bottom ROCcurve belongs to the physical activity label.
Figure 6. The ROC curves of the best performing classifier (random forest) using acceleration signal for differentiatingrelax and stress states. The top ROC curve belongs to stress label and the bottom ROC curve belongs to relax label.
We further compared our work with the studies that detect physical activity or stress levels (see Table10). To the best of our knowledge, this study is the first one to differentiate stress and physical activity fromphysiological signals. I also achieved over 90% accuracy, which was aligned with the best-reported results in
324

CAN/Turk J Elec Eng & Comp Sci
the literature for recognizing mental stress levels or physical activity levels alone. This promising result showsthat the proposed system could be used to differentiate these two physiological responses with success.
Table 10. Comparison of studies that detect physical activity and mental stress levels.
Article Wearable devices Signals Mentalstress
Physicalactivity
Environment Accuracy
[8] LG watch and Samsung Gear S Accelerometer X 3 Laboratory %78.61[7] Polar M600, Huawei Watch, and Asus Zenwatch Accelerometer X 3 Daily Life %72.25[9] Samsung Gear S Accelerometer X 3 Laboratory %87[13] Empatica E4, Samsung Gear S, S2 HRV, EDA 3 X Real-Life
Event%90
[12] Empatica E4 BVP, ST, HR 3 X Laboratory %87.4[10] Empatica E4 BVP 3 X Real-Life
Event%81
[11] Microsoft Band 2 HR, ST, EDA 3 X Laboratory %85Our study Empatica E4 HRV, EDA,ST,ACC 3 3 Laboratory %90.71
6. ConclusionIn this study, a physiological signal-based system that can differentiate physically active, relaxed and stressedstates was developed. Artifact detection and removal, feature extraction and machine learning classificationmodules were implemented. The results for differentiating different tuples of these three states by usingacceleration, heart activity and electrodermal activity signals were presented. When the physically activesession is tried to be differentiated from the other two sessions, the accelerometer signal played an important role.Acceleration signal achieved around 90% accuracy for these classifications. Around 90% accuracies for classifyingphysically active and relaxed sessions with the EDA and 70% accuracy with the HRV signal were achieved.Stressed and relaxed sessions can be differentiated with approximately 80% accuracy with all modalities. Theaccuracies could be improved by analyzing the expected stress level of context and the actual perceived stresslevel of participants. The most challenging classification is between physically active and stressed states. Amaximum of 70% accuracy by using HRV signal was achieved which shows that the heart activity pattern ofphysical activity and stress has differences. Multilayer perceptron and random forest are generally the mostsuccessful classifiers. Furthermore, this study is not without limitations. In order to generalize the conclusions,more experiments based on larger sample groups should be conducted. Furthermore, stressed, physically activeand relaxed sessions were differentiated and the success of each modality is shown. However, the physiologicalsignals were not analyzed when mental stress occurs during physical activity. It is planned to conduct moreexperiments by including this state. It is believed that the contribution of this research will be beneficialto both academia and industry, and it could be used to improve the stress detection algorithms running oncommercial smartbands. This study could be used for a deeper understanding of physiological reactions ofstressed and physically active states and it will guide researchers in developing more robust continuous dailylife stress detection algorithms.
Acknowledgment
I would like to thank Professor Cem Ersoy for his contributions in this study and for managing the project.
325
CAN/Turk J Elec Eng & Comp Sci
References
[1] Hong JH, Ramos J, Dey A. Understanding physiological responses to stressors during physical activity. Proceedingsof the ACM conference on ubiquitous computing 2012; 270-279.
[2] Liao W, Zhang W, Zhu Z, Ji Q, Gray WD. Toward a decision-theoretic framework for affect recognitionand user assistance. Elsevier International Journal of Human-Computer Studies 2006; 64 (9): 847-873. doi:10.1016/j.ijhcs.2006.04.001
[3] Cohen S, Janicki-Deverts D, Miller GE. Psychological stress and disease. Journal of American Medical Association2007; 298 (14): 1685-1687. doi: 10.1001/jama.298.14.1685
[4] Plarre K, Raij A, Hossain S, Monowar A, Amin A et al. Continuous inference of psychological stress from sensorymeasurements collected in the natural environment. In Proceedings of the 10th ACM/IEEE international conferenceon information processing in sensor networks; Chicago, IL, USA; 2011. pp. 97-108.
[5] Li M. Multimodal physical activity recognition by fusing temporal and cepstral information. IEEE Transactions onNeural Systems and Rehabilitation Engineering 2010; 18 (4): 369-380. doi: 10.1109/TNSRE.2010.2053217
[6] Wu W, Dasgupta S,Ramirez EE, Peterson C, Norman GJ. Classification accuracies of physical activities usingsmartphone motion sensors. Journal of medical Internet research 2012; 14 (5): e130. doi: 10.2196/jmir.2208
[7] Degroote L, De Bourdeaudhuij I, Verloigne M, Poppe L, Crombez G. The accuracy of smart devices for measuringphysical activity in daily life: validation study. JMIR mHealth and uHealth 2018; 6 (12): e10972. doi: 10.2196/10972
[8] Dobbins C, Rawassizadeh R. Towards Clustering of Mobile and Smartwatch Accelerometer Data for PhysicalActivity Recognition. Informatics 2018; 5 (2). doi: 10.3390/informatics5020029
[9] Davoudi A. Accuracy of samsung gear s smartwatch for activity recognition: Validation study. JMIR mHealth anduHealth 2019; 7 (2): e11270. doi: 10.2196/11270
[10] Hao T, Walter KN, Ball MJ, Chang HY, Sun S et al. StressHacker: towards practical stress monitoring in the wildwith Smartwatches. In American Medical Informatics Association Annual Symposium Proceedings; WashingtonD.C., USA; 2017. pp. 830.
[11] de Arriba-Pérez F, Santos-Gago JM, Caeiro-Rodríguez M, Ramos-Merino M. Study of stress detection and pro-posal of stress-related features using commercial-off-the-shelf wrist wearables. Journal of Ambient Intelligence andHumanized Computing 2019; 10 (12): 4925-4945.
[12] Siirtola P. Continuous Stress Detection Using the Sensors of Commercial Smartwatch. In Adjunct Proceedings ofthe 2019 ACM International Joint Conference on Pervasive and Ubiquitous Computing and Proceedings of the 2019ACM International Symposium on Wearable Computers; London, UK; 2019. pp. 1198-1201.
[13] Can YS, Chalabianloo N, Ekiz D, Fernandez-Alvarez J, Riva G et al. Personal stress-level clustering and decision-level smoothing to enhance the performance of ambulatory stress detection with smartwatches. IEEE Access 2020;38146-38163. doi: 10.1109/ACCESS.2020.2975351
[14] Kirschbaum C, Pirke KM, Hellhammer D. The ‘trier social stress test’–a tool for investigating 20 psychobiologicalstress responses in a laboratory setting. Neuropsychobiology 1993; 28 (1-2):76–81. doi: 10.1159/000119004
[15] Can YS, Chalabianloo N, Ekiz D, Fernandez-Alvarez J, Repetto C et al. Real-life stress level monitoring us-ing smart bands in the light of contextual information. IEEE Sensors Journal 2020; 20 (15):8721-8730. doi:10.1109/JSEN.2020.2984644
[16] Tarvainen MP et al. Kubios HRV - A Software for Advanced Heart Rate Variability Analysis. In 4th EuropeanConference of the International Federation for Medical and Biological Engineering; Berlin, Germany; 2009. pp.1022-1025.
[17] Can YS, Gokay D, Kılıç DR, Ekiz D, Chalabianloo N et al. How Laboratory Experiments Can Be Exploited forMonitoring Stress in the Wild: A Bridge Between Laboratory and Daily Life. Sensors 2020; 20 (3).
326
CAN/Turk J Elec Eng & Comp Sci
[18] Taylor S, Jaques N, Chen W, Fedor S, Sano A et al. Automatic identification of artifacts in electrodermal activitydata. In 37th Annual International Conference of the IEEE Engineering in Medicine and Biology Society (EMBC);San Fransico, CA, USA; 2015. pp. 1934-1937.
[19] Gjoreski M, Luštrek M, Gams M, Gjoreski H. Monitoring stress with a wrist device using context. Journal ofBiomedical Informatics 2017; 73 (1): 159-170.
[20] Tarvainen MP, Niskanen J, Lipponen JA, Ranta-Aho PO, Karjalainen PA. Kubios HRV–heart rate variabilityanalysis software. Computer methods and programs in biomedicine 2014; 113 (1): 210-220.
[21] Alberdi A, Aztiria A, Basarab A. Towards an automatic early stress recognition system for office environmentsbased on multimodal measurements: A review. Journal of biomedical informatics 2016; 59 (1): 49-75.
[22] Singh D, Vinod K, Saxena SC. Sampling frequency of the RR interval time series for spectral analysis of heart ratevariability. Journal of Medical Engineering & Technology 2004; 28 (6): 263-272.
[23] Greco A, Marzi C, Lanata A, Scilingo EP, Vanello N. Combining Electrodermal Activity and Speech Analysis to-wards a more Accurate Emotion Recognition System. 41st Annual International Conference of the IEEE Engineeringin Medicine and Biology Society (EMBC) 2019; 229-232.
[24] Setz C, Arnrich B, Schumm J, La Marca R, Tröster G et al. Discriminating stress from cognitive load using awearable EDA device. IEEE Transactions on Information Technology in Biomedicine 2010; 14 (1): 410-417.
[25] Cinaz B, Arnrich B, Marca R, Tröster G. Monitoring of mental workload levels during an everyday life office-workscenario. Personal Ubiquitous Computing 2013; 17 (2): 229-239.
[26] Hill T, Lewicki P. Statistics: methods and applications: a comprehensive reference for science, industry, and datamining. Boston USA: Statsoft Incorporation, 2006.
[27] Alpaydın E. Introduction to machine learning. Cambridge, Massachusettes: The MIT Press, 2004.
[28] Edgar TW, Manz DO. Research methods for cyber security. Amsterdam, The Netherlands: Syngress, 2017.
[29] Can T. Gait Analysis and Fall Risk Assessment with Wearable Inertial Sensors. Ph.D., Bogazici University, Istanbul,TURKEY, 2019.
327