Embed Size (px)
Citation preview
Strip Adaptive Cluster Sampling with Application to Lemhi
Penstemon and Cave CricketsKurt Helf, CUPN Ecologist
Tom Rodhouse, UCBN Ecologist
National Park ServiceInventory and Monitoring Program
Cumberland Piedmont Network
National Park ServiceInventory and Monitoring Program
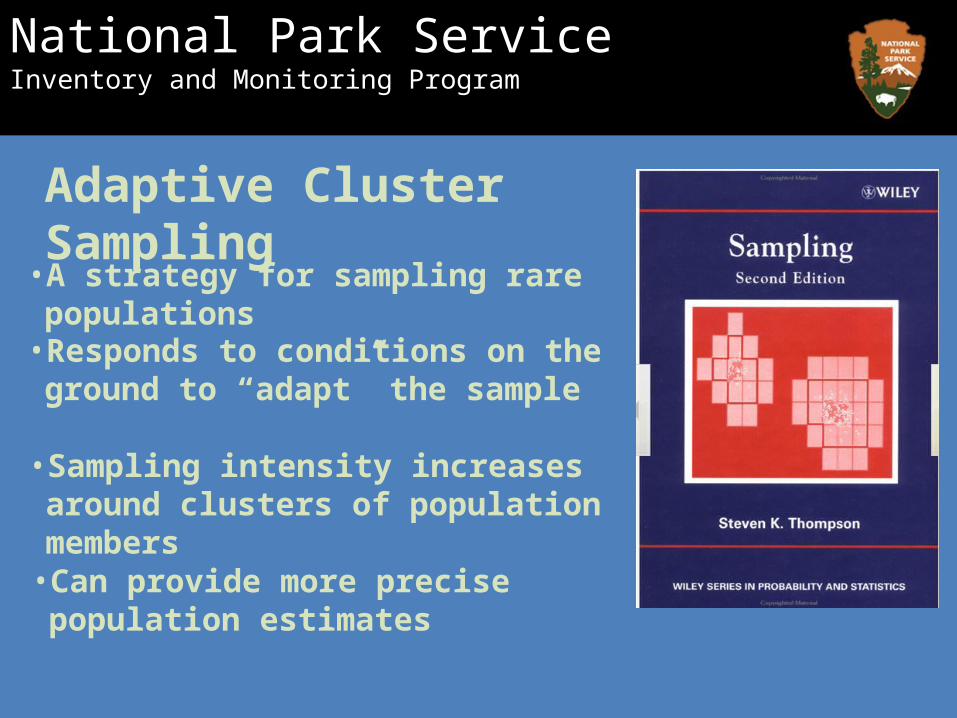
Adaptive Cluster Sampling
• A strategy for sampling rare populations
• Responds to conditions on the ground to “adapt” the sample
• Sampling intensity increases around clusters of population members
• Can provide more precise population estimates
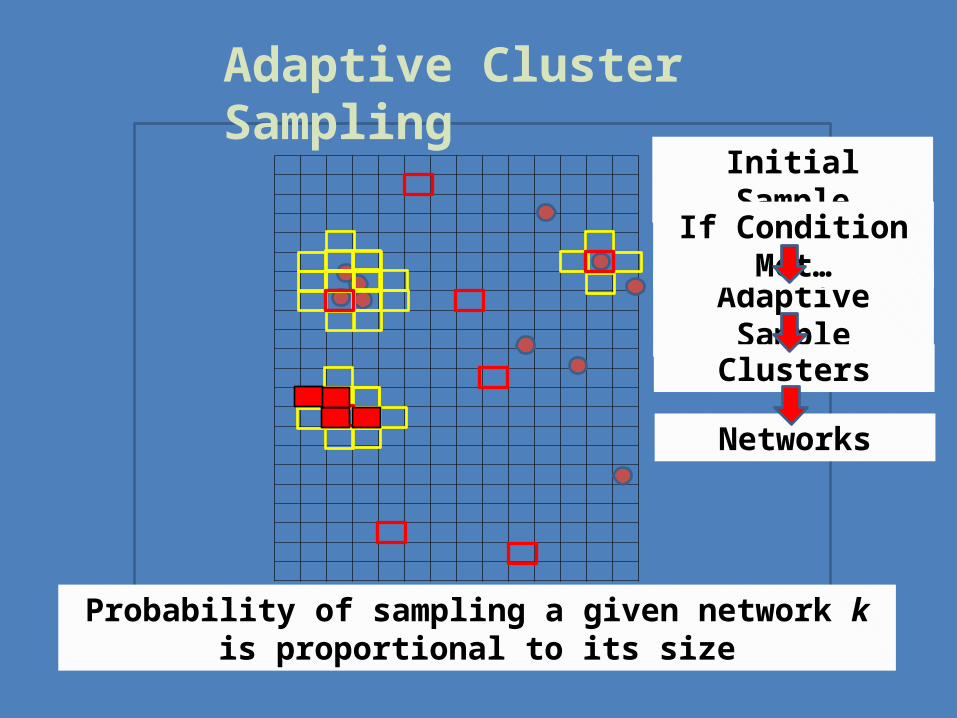
Adaptive Cluster Sampling
Initial Sample
Adaptive Sample
Clusters
Networks
If Condition Met…
Probability of sampling a given network k is proportional to its size

Strip Adaptive Cluster Sampling
Initial sample of primary units
“strips”
Adapt on secondary units
K Networks
Probability of sampling a given network k is proportional to its width

National Park ServiceInventory and Monitoring Program
K
k
ky
MN 1
1ˆ
MN
K
k jk
kjK
j kj
jk yy
NM 1 122
11
)ˆvar(
Modified Horvitz-Thompson Estimator
Total count per network
“Partial” inclusion
probability

National Park ServiceInventory and Monitoring Program
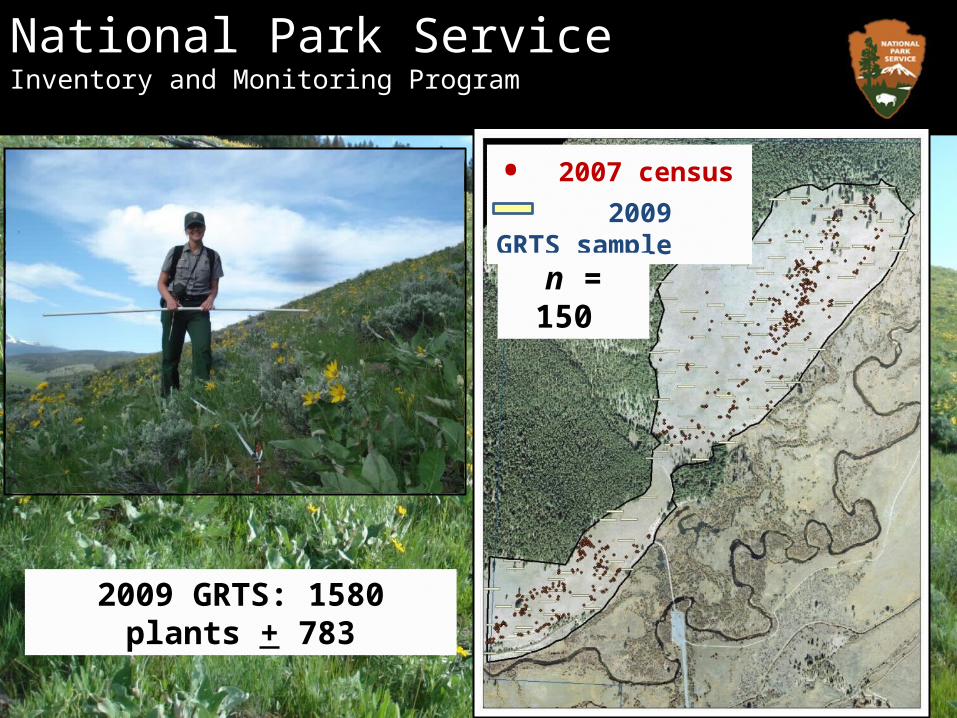
Case Study: Population Size of Lemhi Penstemon in Big Hole National Battlefield
National Park ServiceInventory and Monitoring Program
• 2007 census
2009 GRTS sample
2009 GRTS: 1580 plants + 783
n = 150
National Park ServiceInventory and Monitoring Program
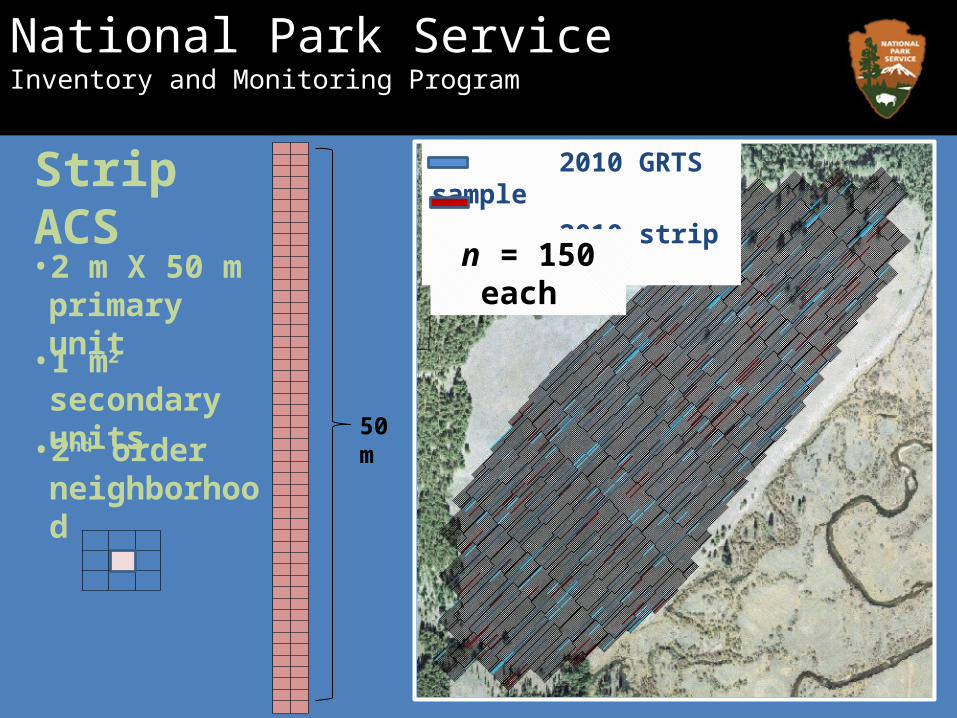
2010 GRTS sample 2010 strip ACS sample
• 2 m X 50 m primary unit
• 1 m2 secondary units
• 2nd order neighborhood
Strip ACS
50 m
n = 150 each

• Digital data entry via Pendragon on PDA
• Pin flags, reel tape, and 2m folding rulers
Field Methods
National Park ServiceInventory and Monitoring Program
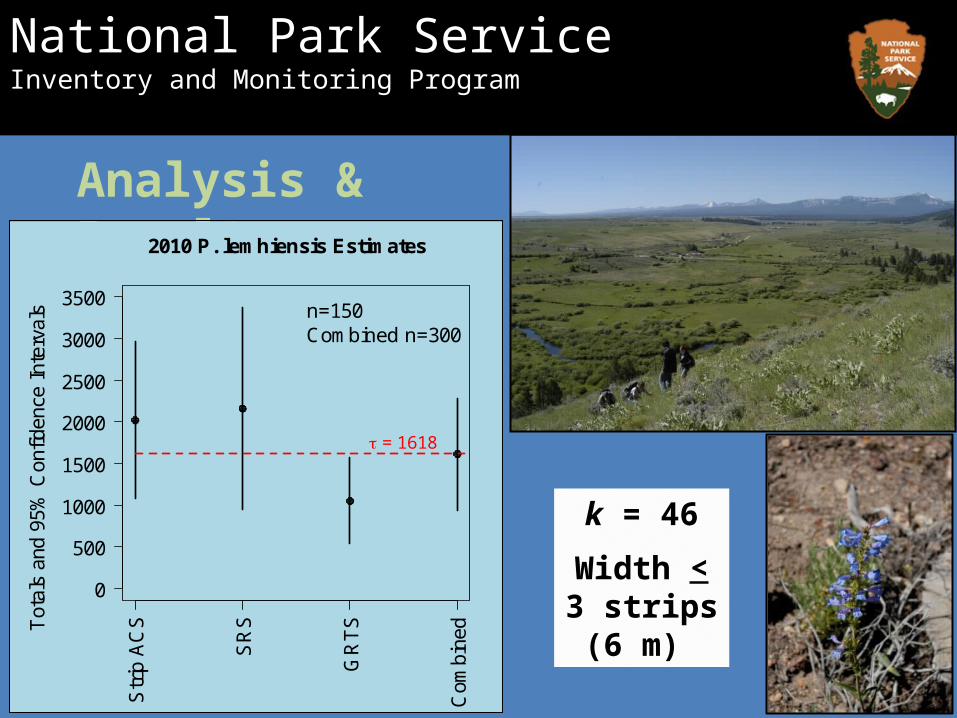
Analysis & Results
Coded by hand in R – but see Dryver’s package, Philippi’s script
0
500
1000
1500
2000
2500
3000
3500
Str
ip A
CS
SR
S
GR
TS
Com
bine
d
2010 P. lemhiensis Estimates
Tot
als
and
95%
Con
fiden
ce I
nter
vals
= 1618
n=150Combined n=300
k = 46
Width < 3 strips (6 m)

Case Study: Cave Cricket Monitoring in Mammoth Cave National Park
National Park ServiceInventory and Monitoring Program
National Park ServiceInventory and Monitoring Program
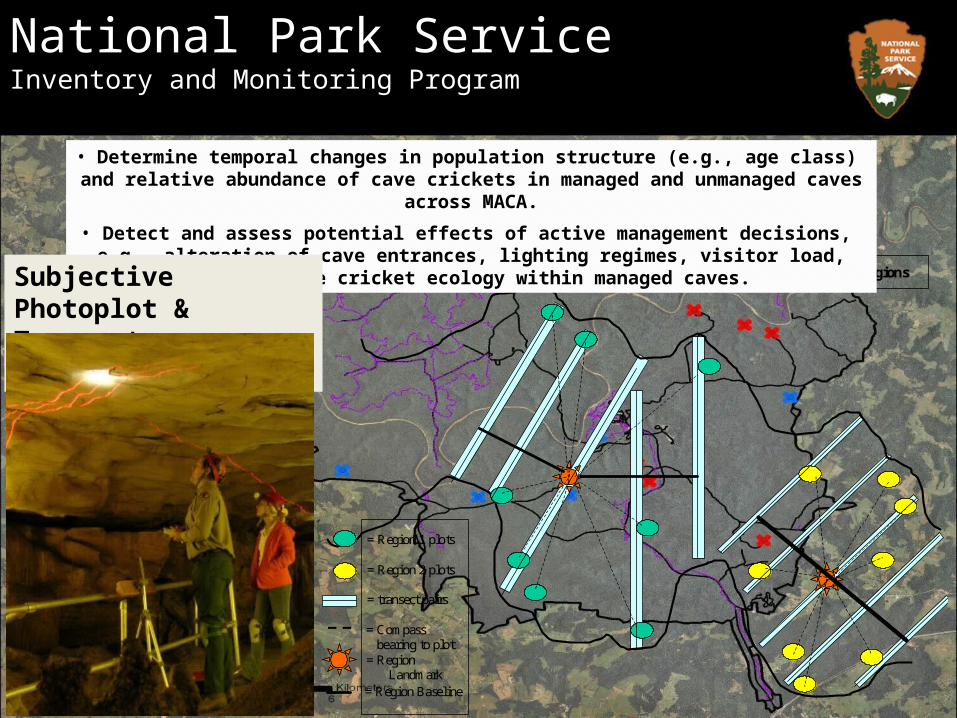
= Region 1 plots
= Region 2 plots
= transect pairs
= Compass bearing to plot
= Region Landmark
= Region Baseline
Plot & Transect Sampling in Cave Regions
• Determine temporal changes in population structure (e.g., age class) and relative abundance of cave crickets in managed and unmanaged caves across MACA.
• Detect and assess potential effects of active management decisions, e.g., alteration of cave entrances, lighting regimes, visitor load, etc., on cave cricket ecology within managed caves.
Subjective Photoplot & Transect Monitoring
National Park ServiceInventory and Monitoring Program
• Biased toward largest clusters of roosting cave crickets (though not
always).
• Biased low when clusters highly dispersed.
• Time & labor intensive field methods.
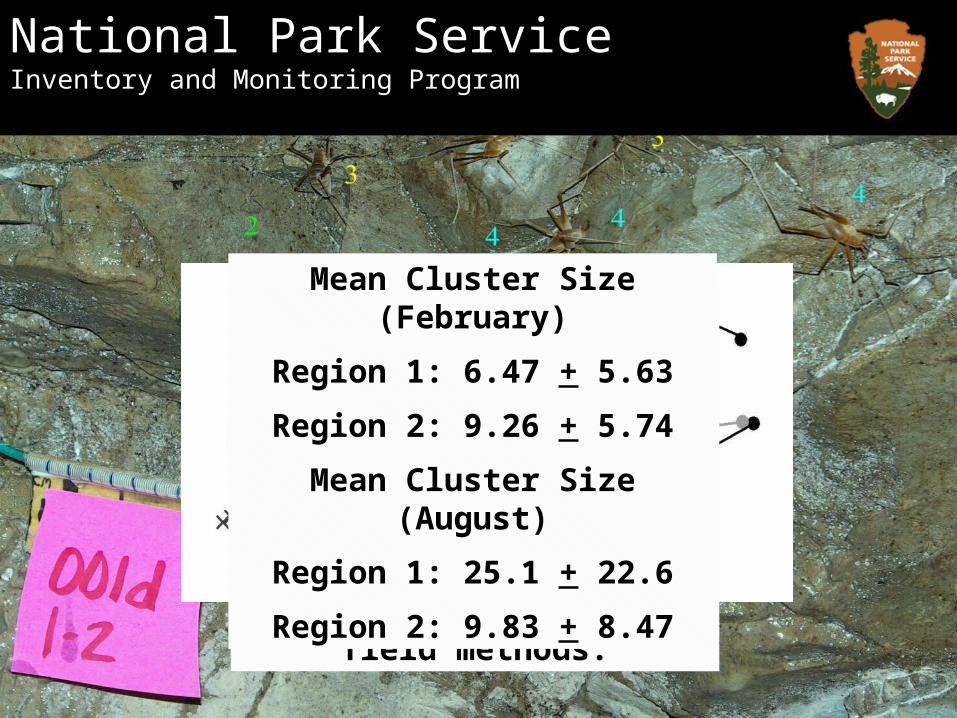
Mean Cluster Size (February)
Region 1: 6.47 + 5.63
Region 2: 9.26 + 5.74
Mean Cluster Size (August)
Region 1: 25.1 + 22.6
Region 2: 9.83 + 8.47

National Park ServiceInventory and Monitoring Program
•Laser transect projector platform & pistol•100m Keson tape to locate random transects•Electronic Distance Measuring Unit for mapping•Rite in the rain field data sheets; sticky notes•Jernigan
10 cm

National Park ServiceInventory and Monitoring Program
Analyzed in R using Philippi’s script
National Park ServiceInventory and Monitoring Program
• Combines best methods of previous protocol.
• Just as data rich.
• Unbiased estimators.
• Estimates of entrance populations!
• Time spent in field similar.
• Less expense since fewer personnel required.
Cave Entrance Obs. Count Est. Total Var Est. Total SD Est. Total Lower CI Upper CI
Carmichael 39 170.60 4531.12 67.31 59.87 281.33CrockPot 35 95.05 1040.68 32.26 41.99 148.12Frozen Niagara 24 115.06 3420.64 58.49 18.85 211.27Great Onyx 251 645.30 111559.29 334.00 95.86 1194.74Little Beauty 35 104.63 1727.12 41.56 36.27 172.99New Discovery 425 1641.55 295927.80 543.99 746.68 2536.42Salts 52 247.35 10611.74 103.01 77.89 416.80Silent Grove 83 259.59 5678.79 75.36 135.63 383.55Sloan's Crossing 51 161.02 5394.27 73.45 40.20 281.84Temple Hill 165 477.50 18131.05 134.65 256.00 699.00White 92 243.87 4186.48 64.70 137.43 350.31
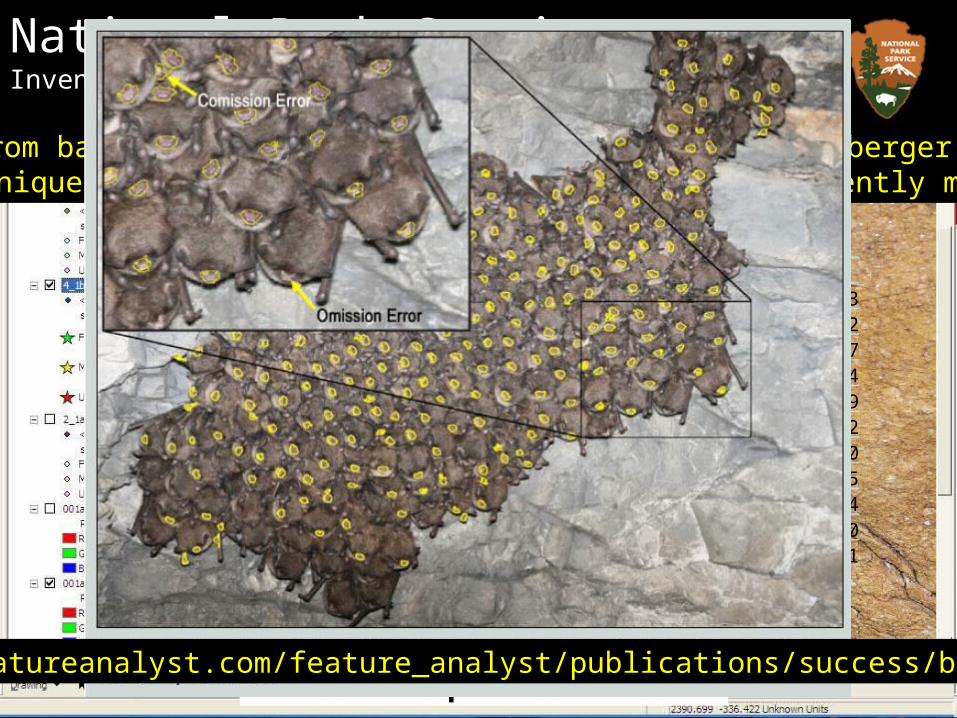
Adapted from bat counting protocol obtained from Traci Hemberger (KYDFW); origin of technique unknown but apparently discovered independently multiple times.
http://www.featureanalyst.com/feature_analyst/publications/success/bats_final.pdf
National Park ServiceInventory and Monitoring Program
Conclusions• It works!
But….• Efficiency is sensitive to the size and variability of networks• Penstemon – small networks, time not a big constraint, but
can cover more ground with a large GRTS sample of primary units.
• Other important information – patch size• Unfortunately, not clear how to analyze
trend, or to adapt GRTS initial sample• Hadenoecus– random v. fixed transects; park wide inference
poss. with present sample size & legacy sampling units?; pool of available sampling units constrained by methodology.

National Park ServiceInventory and Monitoring Program
ResourcesCome See Us at the Swap meet!
Check out Steven Thompson’s books
Paul Geissler’s sampling design course-presentations and bibliography from Dave Smith
Talk to HTLN about bladderpod experience
Talk to Tom Philippi!