Embed Size (px)
Citation preview

Atmos. Chem. Phys., 15, 1769–1781, 2015
www.atmos-chem-phys.net/15/1769/2015/
doi:10.5194/acp-15-1769-2015
© Author(s) 2015. CC Attribution 3.0 License.
Strong atmospheric new particle formation in winter in urban
Shanghai, China
S. Xiao1,2, M. Y. Wang1,2, L. Yao1,2, M. Kulmala3, B. Zhou1,2, X. Yang1,2, J. M. Chen1,2, D. F. Wang4, Q. Y. Fu4,
D. R. Worsnop5, and L. Wang1,2
1Shanghai Key Laboratory of Atmospheric Particle Pollution and Prevention (LAP3), Department of
Environmental Science and Engineering, Fudan University, Shanghai 200433, China2Fudan Tyndall Centre, Fudan University, Shanghai 200433, China3Department of Physics, University of Helsinki, 00014 Helsinki, Finland4Shanghai Environmental Monitoring Center, Shanghai 200030, China5Aerodyne Research, Billerica, MA 01821, USA
Correspondence to: L. Wang ([email protected])
Received: 6 September 2014 – Published in Atmos. Chem. Phys. Discuss.: 24 October 2014
Revised: 4 January 2015 – Accepted: 23 January 2015 – Published: 19 February 2015
Abstract. Particle size distributions in the range of 1.34–
615 nm were recorded from 25 November 2013 to 25
January 2014 in urban Shanghai, using a combination of
one nano condensation nucleus counter system, one nano
scanning mobility particle sizer (SMPS), and one long-
SMPS. Measurements of sulfur dioxide by an SO2 ana-
lyzer with pulsed UV fluorescence technique allowed cal-
culation of sulfuric acid proxy. In addition, concentrations
of ammonia were recorded with a differential optical ab-
sorption spectroscopy. During this 62-day campaign, 13
new particle formation (NPF) events were identified with
strong bursts of sub-3 nm particles and subsequent fast
growth of newly formed particles. The observed nucle-
ation rate (J1.34), formation rate of 3 nm particles (J3),
and condensation sink were 112.4–271.0 cm−3 s−1, 2.3–
19.2 cm−3 s−1, and 0.030–0.10 s−1, respectively. Subsequent
cluster/nanoparticle growth (GR) showed a clear size de-
pendence, with average values of GR1.35∼1.39, GR1.39∼1.46,
GR1.46∼1.70, GR1.70∼2.39, GR2.39∼7, and GR7∼20 being 1.6±
1.0, 1.4± 2.2, 7.2± 7.1, 9.0± 11.4, 10.9± 9.8, and 11.4±
9.7 nm h−1, respectively. Correlation between nucleation rate
(J1.34) and sulfuric acid proxy indicates that nucleation rate
J1.34 was proportional to a 0.65±0.28 power of sulfuric acid
proxy, indicating that the nucleation of particles can be ex-
plained by the activation theory. Correlation between nu-
cleation rate (J1.34) and gas-phase ammonia suggests that
ammonia was associated with NPF events. The calculated
sulfuric acid proxy was sufficient to explain the subsequent
growth of 1.34–3 nm particles, but its contribution became
smaller as the particle size grew. Qualitatively, NPF events
in urban Shanghai likely occur on days with low levels of
aerosol surface area, meaning the sulfuric acid proxy is only
a valid predictor when aerosol surface area is low.
1 Introduction
Aerosol particles can influence climate directly and indi-
rectly (Andreae and Crutzen, 1997; Haywood and Boucher,
2000; IPCC, 2013), and have adverse impact on human
health (Dockery et al., 1993; Laden et al., 2006; Pope and
Dockery, 2006). Atmospheric nucleation of gas-phase pre-
cursors to clusters and then further to nanoparticles is the
largest source of atmospheric aerosol particles (Kulmala et
al., 2004b; Zhang et al., 2012). This phenomenon has been
observed in numerous locations around the world, including
areas with a pristine atmosphere, e.g., coastal areas (O’Dowd
et al., 2002), Antarctic/Arctic (Park et al., 2004), remote
forest (Dal Maso et al., 2005), semi-rural locations with
very low pollution levels such as Kent, OH (Kanawade et
al., 2012), and heavily polluted cities, such as Mexico City
(Dunn et al., 2004).
The exact mechanism for atmospheric nucleation is still
under active investigation. Field measurements and labora-
Published by Copernicus Publications on behalf of the European Geosciences Union.

1770 S. Xiao et al.: Strong atmospheric new particle formation in winter
tory studies have shown that sulfuric acid is a key precur-
sor species for atmospheric nucleation (Weber et al., 1996;
Sipila et al., 2010) and that atmospheric nucleation rate can
be significantly promoted in the presence of other precursors
including ammonia (Ball et al., 1999; Benson et al., 2009),
amines (Berndt et al., 2010; Zhao et al., 2011), and organic
acids (Zhang et al., 2004, 2009). At certain locations, ion-
induced nucleation (Yu and Turco, 2001; Lee et al., 2003) or
iodine species (O’Dowd et al., 2002) may also help to explain
the observed new particle formation. Very recently, progress
has been made by the use of a particle size magnifier (PSM)
and chemical ionization atmospheric pressure interface time-
of-flight mass spectrometer by combining the Cosmics Leav-
ing OUtdoor Droplets (CLOUD) chamber experiments and
ambient observations including those in Hyytiälä, Finland,
showing that oxidation products of biogenic emissions, to-
gether with sulfuric acid, contribute to new particle formation
in the atmosphere (Schobesberger et al., 2013; Riccobono et
al., 2014).
China suffers severe air pollution, especially high atmo-
spheric particle loadings in recent years (Chan and Yao,
2008). Among many potential sources of atmospheric parti-
cles, atmospheric nucleation has been suggested to be a sig-
nificant source of particles (Matsui et al., 2011; Yue et al.,
2011). Correspondingly, a number of extensive campaigns or
long-term observational studies have been carried out in the
Beijing area (e.g., Wu et al., 2007; Yue et al., 2009; Zhang et
al., 2011; Gao et al., 2012) and Pearl River delta, including
Hong Kong (e.g., Guo et al., 2012; Yue et al., 2013). As one
of the most industrialized area of China, one of the most pop-
ulated region in the world, and one of the hotspots for particle
pollution, Yangtze River delta (YRD) has only seen a few re-
search activities on atmospheric nucleation (Du et al., 2012;
Herrmann et al., 2014). Among the few studies, measure-
ments at the station for Observing Regional Processes of the
Earth System, Nanjing University (SORPES-NJU), offered
a first insight for new particle formation in the western part
of YRD (Herrmann et al., 2014). On the other hand, atmo-
spheric nucleation research in China is still in its infant stage
and the latest experimental techniques are yet to be applied
in China. For example, data on freshly nucleated particles
are really sparse, except for those from an air ion spectrom-
eter employed at SORPES-NJU (Herrmann et al., 2014). To
the best of our knowledge, the use of a PSM, which is able
to study atmospheric nucleation at the size (mobility diam-
eter) down to 1.5± 0.4 nm (Kulmala et al., 2012), has not
been reported in a Chinese location in literature. The lack of
key information greatly hinders a better understanding of nu-
cleation mechanisms in China, where concentrations of sul-
furic acid and basic gases including ammonia and amines
are high (Zheng et al., 2011, 2015) but concentrations of ex-
tremely low-volatility organic compounds formed from bio-
genic emissions are yet to be determined.
Direct measurements of atmospheric nucleation rates
down to 1.5±0.4 nm provide a better and more accurate char-
acterization of atmospheric nucleation; the indirect calcula-
tion of atmospheric nucleation rates from the formation rates
of 3 nm particles leads to substantial uncertainty due to our
incomplete understanding of condensational growth and co-
agulation scavenging of particles in the 1.5 to 3 nm range
(Anttila et al., 2010; Korhonen et al., 2011). With the grow-
ing number of reports of real nucleation rates in clean atmo-
sphere (e.g., Kulmala et al., 2012; Yu et al., 2014), it is ideal
to measure nucleation rates in a polluted urban atmosphere to
find out how atmospheric nucleation rates vary under differ-
ent atmospheric conditions. In addition, the nucleation mech-
anism in a polluted urban atmosphere, which is vital to un-
derstanding atmospheric nucleation at a global scale and for
atmospheric model development, can be preliminarily inves-
tigated by examining the relationship between the measured
atmospheric nucleation rates and the well-accepted precursor
gases that exist in high concentrations.
In this study, we measured atmospheric nucleation from 25
November 2013 to 25 January 2014 in urban Shanghai with a
nano condensation nucleus counter system (nCNC) and two
sets of scanning mobility particle sizers (SMPS). Nucleation
frequency, nucleation rate (J1.34), condensation sink (CS),
and growth rates (GR) are reported and compared with pre-
vious studies with similar or dissimilar atmospheric environ-
ments. In addition, the potential nucleation mechanism was
explored by correlating sulfuric acid proxy calculated from
sulfur dioxide precursor and gas-phase ammonia to nucle-
ation rate J1.34.
2 Experimental
2.1 Nucleation measurements
Nucleation measurements were carried out on the rooftop of
a teaching building (31◦18′ N, 121◦30′ E) that is about 20 m
above ground on the campus of Fudan University between 25
November 2013 and 25 January 2014. This monitoring site is
mostly surrounded by commercial properties and residential
dwellings. The Middle Ring Road, one of the main overhead
highways in Shanghai, lies about 100 m to the south of the
site. Hence, the Fudan site can be treated as a representative
urban site influenced by a wide mixture of emission sources
(Wang L. et al., 2013; Ma et al., 2014).
Ambient particle size distributions in the range of 1.34–
615 nm were measured using a combination of one nano con-
densation nucleus counter system (model A11, Airmodus,
Finland), one nano-SMPS (consisting of one DMA3085 and
one CPC3776, TSI, USA), and one long-SMPS (consisting
of one DMA3081 and one CPC3775, TSI, USA). The in-
struments were continuously running except for maintenance
and minor instrument breakdown during the campaign.
Ambient air was drawn into a stainless-steel manifold of
5.0 m length and 4 inch inner diameter at a flow rate of
153 cubic feet per minute (CFM) using a blower (Model
Atmos. Chem. Phys., 15, 1769–1781, 2015 www.atmos-chem-phys.net/15/1769/2015/

S. Xiao et al.: Strong atmospheric new particle formation in winter 1771
DJT10U-25M, NUSSUN, China). From this main manifold,
1.75 L min−1 ambient air was drawn through a 1/4 in. in-
ner diameter stainless-steel tube of 18 cm length, and di-
luted with a zero air flow generated by a zero air genera-
tor (Model 111, Thermo, USA) at a ratio of 1 : 1 to reduce
the overall relative humidity (RH) and the number of parti-
cles entering PSM, since high RH and particle loading had
an impact on the saturation of diethylene glycol in PSM and
hence data quality. Subsequently, 2.5 L min−1 diluted air was
sampled into nCNC. In addition, 30 L min−1 split flow was
drawn from the main manifold through a 1/4 in. inner diam-
eter conductive silicon tubing of 50 cm length, and then 0.3
and 1.5 L min−1 ambient air from the split flow were drawn
into nano-SMPS and long-SMPS, respectively. The calcu-
lated diffusion loss is up to 29 % for 1.35 nm particles with
the above setup and has been taken into account in the entire
size range during data processing.
The nCNC system consists of one PSM (model A10,
Airmodus, Finland) and one butanol Condensation Particle
Counter (model A20, Airmodus, Finland), and was used to
measure size distributions of 1.34–3 nm clusters/particles.
Briefly, PSM activates the smallest particles using diethy-
lene glycol as a working fluid and condensationally grows
nanoparticles up to larger than 90 nm in mobility equiva-
lent diameter, after which an external condensation particle
counter is used to further grow the particles to optical sizes
and count the grown particles (Vanhanen et al., 2011). In this
study, PSM was used in the scanning mode in which the sat-
urator flow rate is changed continuously, giving an activation
spectrum of the measured particles to obtain size distribution
of sub-3 nm clusters/particles. A scanning cycle of 100 steps
between saturator flow rates 0.1 and 1 L min−1 and a time
resolution of 220 s were chosen. Sub-3 nm clusters/particles
were classified into 5 bins, i.e., 1.34–1.37, 1.37–1.41, 1.41–
1.52, 1.52–1.89, and 1.89–3.0 nm. Geometric mean values of
upper and lower limits of the five bins, i.e., 1.35, 1.39, 1.46,
1.70, and 2.39 nm, were used to refer to the five bins, respec-
tively, in the growth rate calculation.
The nano-SMPS measured particles in the size range of 3
to 64 nm and the long-SMPS recorded particles from 14 to
615 nm. For both SMPSs, 64 size bins and 5 min time res-
olution were chosen. The sample flow to sheath flow ratios
for both SMPSs were set at 1 : 10. A comparison analysis on
the total particle concentrations between 14 and 64 nm mea-
sured by both nano-SMPS and long-SMPS showed less than
10 % difference in the size range of 55–64 nm between two
SMPSs. Hence, number concentrations of particles in the size
range of 3–615 nm, N3∼615, were calculated from the sum
of N3∼55 obtained from nano-SMPS, N55∼64 from the arith-
metic average of nano-SPMS and long-SMPS, and N64∼615
from long-SMPS.
At the same site, sulfur dioxide (SO2) was measured by an
SO2 analyzer with pulsed UV fluorescence technique (Model
43i, Thermo, USA) and a time resolution of 5 min; calibra-
tion of this SO2 analyzer was performed every month. A dif-
ferential optical absorption spectroscopy system was used
to measure the integrated concentration of NH3 along the
optical path between a transmitter telescope using a 35W
Deuterium lamp as the light source and a receiver telescope
(53 m); then the system yielded the average concentration of
NH3 by dividing the integrated concentration by the absorp-
tion length (Platt and Stutz, 2008). In this study, the con-
centration of NH3 was determined by fitting the reference
spectra to the atmospheric spectra in a given window (205–
220 nm) using a nonlinear least-squares method similar to a
previous measurement of HONO and NO2 (Wang S. et al.,
2013). Detection limit of NH3 was about 1 ppb with a 3 min
integration time.
Solar radiation intensity measured by a pyranometer (Kipp
& Zonen CMP6, Netherlands) was obtained from the Shang-
hai Pudong Environmental Monitoring Centre (31◦14′ N,
121◦32′ E, about 8.78 km from the Fudan site).
2.2 Data processing
2.2.1 Nucleation rate, formation rate of 3 nm particles
(J3), growth rate, and condensation sink
In this study, PSM allowed measurements of clus-
ters/particles down to 1.34 nm. Hence, atmospheric nucle-
ation rate, J1.34, defined as the flux of particles growing over
1.34 nm, can be calculated by taking into account the coagu-
lation losses and condensational growth out of the considered
size range (Kulmala et al., 2012):
J1.34 =dN1.34∼3
dt+CoagSdp=2 nm ·N1.34∼3+
1
1.66nm(1)
GR1.34∼3 ·N1.34∼3,
where CoagSdp=2 nmrepresents coagulation sink of 2 nm par-
ticles, an approximation for that of the size interval 1.34–
3 nm, and GR1.34∼3 represents the apparent clusters/particle
growth rate between 1.34 and 3 nm.
Formation rate of 3 nm particles was calculated in a similar
way (Sihto et al., 2006; Kulmala et al., 2012), providing a
comparison with previous studies:
J3 =dN3∼6
dt+CoagSdp=4 nm·N3∼6+
1
3nmGR3∼6·N3∼6, (2)
where CoagSdp=4 nmrepresents coagulation sink of 4 nm par-
ticles, an approximation for that of the size interval 3–6 nm.
Growth rate is defined as the rate of change in the diam-
eter of a growing particle population, using the maximum-
concentration method (Kulmala et al., 2012):
GR=ddp
dt=1dp
1t=dp2− dp1
t2− t1, (3)
where dp1and dp2
are the representative particle diameters at
times t1 and t2, respectively.
www.atmos-chem-phys.net/15/1769/2015/ Atmos. Chem. Phys., 15, 1769–1781, 2015

1772 S. Xiao et al.: Strong atmospheric new particle formation in winter
Condensation sink describes the condensing vapor sink
caused by the particle population (Kulmala et al., 2012):
CS= 4πD
dpmax∫0
βm,dpdpNdpddp = 4πD∑dp
βm,dpdpNdp , (4)
where D is the diffusion coefficient of the condensing vapor,
usually assumed to be sulfuric acid (0.104 cm2 s−1 used in
this study), and βm,dp is the transitional regime correction
factor.
2.2.2 Sulfuric acid
Sulfuric acid has been accepted as a key gas-phase precursor
for atmospheric nucleation and contributes to the subsequent
growth of newly formed particles (Weber et al., 1996; Sipila
et al., 2010). The accurate measurement of gas-phase sul-
furic acid requires application of chemical ionization mass
spectrometry using nitrates as reagent ions (Eisele and Tan-
ner, 1993), which was not possessed by this research group
during this study. Instead, the sulfuric acid proxy [H2SO4]
was estimated based on local solar radiation n level radia-
tion, SO2 concentration [SO2], condensation sink, and rela-
tively humidity (Mikkonen et al., 2011):
[H2SO4] = 8.21× 10⁻³· k · radiation · [SO2]
0.62 (5)
· (CS ·RH)−0.13,
where k is the temperature-dependent reaction-rate constant.
The relative error between calculated sulfuric acid proxy and
measured sulfuric acid concentration is estimated to be 42 %
(Mikkonen et al., 2011). The time resolution of calculated
sulfuric acid proxy was 1 h since that of temperature and rel-
ative humidity was 1.
Condensation of sulfuric acid contributes to the growth of
newly formed particles. The growth of clusters/particles due
to condensation of sulfuric acid, GRH2SO4, can be estimated
by the following equations (Nieminen et al., 2010):
GRH2SO4=
γ
2ρv
(1+
dv
dp
)2(8kT
π
)1/2
(6)(1
mp
+1
mv
)1/2
mv[H2SO4]
and
γ =4
3·Kn ·βm,dp , (7)
where ρv and dv are the condensed phase density and
molecule diameter of H2SO4, respectively; mp and mv are
particle and H2SO4 vapor molecule masses, respectively; γ
is a correction factor; andKn is the Knudsen number (Lehti-
nen and Kulmala, 2003). For this calculation, particle density
ρp = 1.83 g cm−3 was used.
The particle growth due to the hydration of H2SO4 is
taken into account by assuming that sulfuric acid is instanta-
neously equilibrated with gas-phase water. During our cam-
paign, daily average RH varied between 28.7 and 60.0 %.
Hence, using the H2SO4-hydrate distribution data given by
Kurtén et al. (2007), the density and mass of the average hy-
drated H2SO4 molecule at 50 % relative humidity is calcu-
lated and further used in Eq. (6).
3 Results and discussion
3.1 Classification of new particle formation (NPF)
events
Figure 1 presents a contour plot for particle size distribu-
tions of 3–615 nm and a number concentration plot of sub-
3 nm clusters/particles, N1.34∼3, during 25 November 2013–
25 January 2014. Data were occasionally missing because
of maintenance and minor breakdown of instruments. From
the figure, frequent bursts of sub-3 nm particles were evident,
with concentrations up to 8.0× 104 cm−3 around noontime.
However, similar to previous studies (Kulmala et al., 2007,
2013; Yu et al., 2014), not all sub-3 nm particles eventually
underwent a continuous growth to larger sizes. In this study,
we define an observation day with appearances of sub-3 nm
clusters/particles over a time span of hours and subsequent
growth to larger sizes for a few hours as a NPF event day.
In this case, a NPF day will present a banana-shaped contour
plot of particle size distributions obtained from SMPS (Dal
Maso et al., 2005). We focus on characteristics and potential
mechanisms of these events.
According to the classification, there were 13 event days
during the 62-day campaign, as illustrated by the shadow in
Fig. 1. Although nCNC data were partially unavailable on 26
December 2013 and completely unavailable on 24 January
2014, these 2 days are still defined as NPF days since a dis-
tinctive banana-shaped contour plot for particle distributions
between 3 and 615 nm existed. 18 December 2013 was not
regarded as a NPF day since N1.34∼3 was not recorded and
the growth of 3–20 nm particles was relatively short-lived.
Among these NPF events, five NPF events occurred in
November, three in December, and five in January. The av-
eraged frequency for NPF events was 21.0 % during the 62-
day campaign. Our NPF frequency in Shanghai is larger than
the average value in winter 1996–2003 at SMEAR II station,
Hyytiälä, Finland (Dal Maso et al., 2005), likely because nu-
cleation events in Hyytiälä have recently been related to oxi-
dation products of biogenic emissions (Kulmala et al., 1998;
Schobesberger et al., 2013; Riccobono et al., 2014) and pho-
tochemistry of volatile organic compounds is less intensive
in winter months. This frequency is also higher than that in
winter in semi-rural Kent, OH, during which transport of sul-
fur dioxide from the east-southeast power plant to Kent is
not favored (Kanawade et al., 2012). NPF events occurred
Atmos. Chem. Phys., 15, 1769–1781, 2015 www.atmos-chem-phys.net/15/1769/2015/
S. Xiao et al.: Strong atmospheric new particle formation in winter 1773
Figure 1. Contour plot for particle size distributions of 3–615 nm and plot of number concentrations of sub-3 nm clusters/particles (N1.34∼3)
during 25 November 2013–25 January 2014. Data were occasionally missing because of the maintenance and minor breakdown of instru-
ments. NPF events are illustrated with shadows.
at a frequency of around 40 % during November–December
2004 in Beijing (Wu et al., 2007), much more often than in
Shanghai. On the other hand, NPF frequency in Shanghai is
remarkably close to that measured in winter 2012 in Nanjing,
which is also located in YRD (Herrmann et al., 2014).
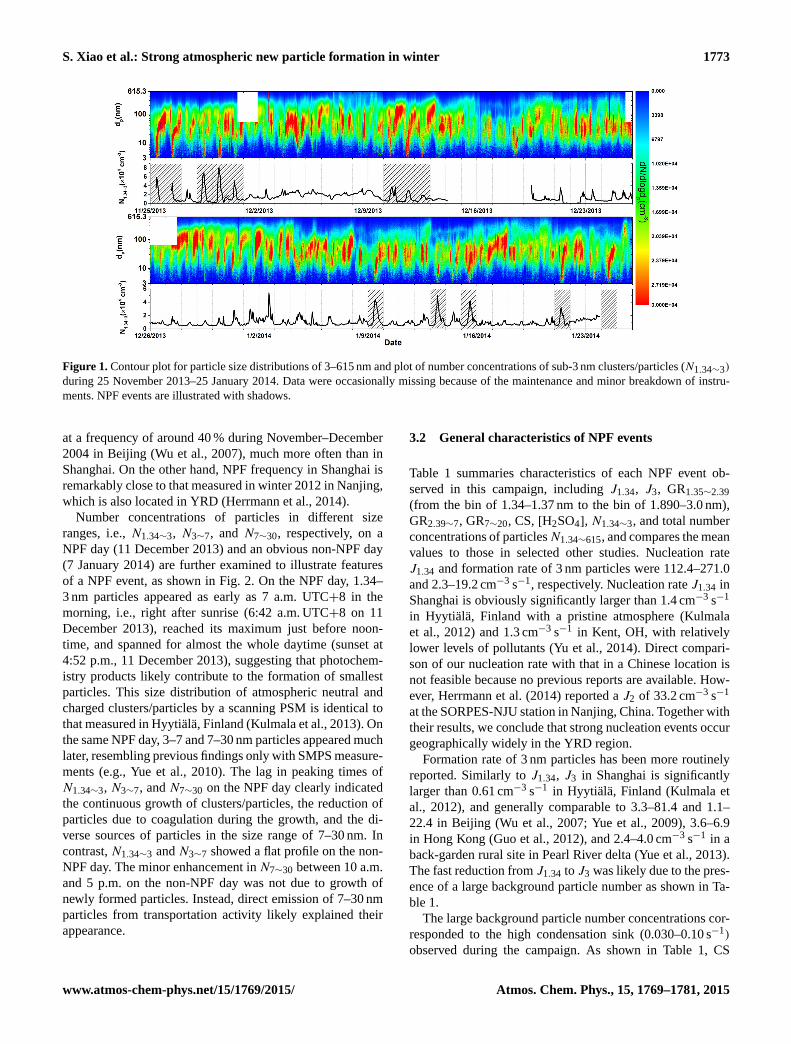
Number concentrations of particles in different size
ranges, i.e., N1.34∼3, N3∼7, and N7∼30, respectively, on a
NPF day (11 December 2013) and an obvious non-NPF day
(7 January 2014) are further examined to illustrate features
of a NPF event, as shown in Fig. 2. On the NPF day, 1.34–
3 nm particles appeared as early as 7 a.m. UTC+8 in the
morning, i.e., right after sunrise (6:42 a.m. UTC+8 on 11
December 2013), reached its maximum just before noon-
time, and spanned for almost the whole daytime (sunset at
4:52 p.m., 11 December 2013), suggesting that photochem-
istry products likely contribute to the formation of smallest
particles. This size distribution of atmospheric neutral and
charged clusters/particles by a scanning PSM is identical to
that measured in Hyytiälä, Finland (Kulmala et al., 2013). On
the same NPF day, 3–7 and 7–30 nm particles appeared much
later, resembling previous findings only with SMPS measure-
ments (e.g., Yue et al., 2010). The lag in peaking times of
N1.34∼3, N3∼7, and N7∼30 on the NPF day clearly indicated
the continuous growth of clusters/particles, the reduction of
particles due to coagulation during the growth, and the di-
verse sources of particles in the size range of 7–30 nm. In
contrast, N1.34∼3 and N3∼7 showed a flat profile on the non-
NPF day. The minor enhancement in N7∼30 between 10 a.m.
and 5 p.m. on the non-NPF day was not due to growth of
newly formed particles. Instead, direct emission of 7–30 nm
particles from transportation activity likely explained their
appearance.
3.2 General characteristics of NPF events
Table 1 summaries characteristics of each NPF event ob-
served in this campaign, including J1.34, J3, GR1.35∼2.39
(from the bin of 1.34–1.37 nm to the bin of 1.890–3.0 nm),
GR2.39∼7, GR7∼20, CS, [H2SO4], N1.34∼3, and total number
concentrations of particlesN1.34∼615, and compares the mean
values to those in selected other studies. Nucleation rate
J1.34 and formation rate of 3 nm particles were 112.4–271.0
and 2.3–19.2 cm−3 s−1, respectively. Nucleation rate J1.34 in
Shanghai is obviously significantly larger than 1.4 cm−3 s−1
in Hyytiälä, Finland with a pristine atmosphere (Kulmala
et al., 2012) and 1.3 cm−3 s−1 in Kent, OH, with relatively
lower levels of pollutants (Yu et al., 2014). Direct compari-
son of our nucleation rate with that in a Chinese location is
not feasible because no previous reports are available. How-
ever, Herrmann et al. (2014) reported a J2 of 33.2 cm−3 s−1
at the SORPES-NJU station in Nanjing, China. Together with
their results, we conclude that strong nucleation events occur
geographically widely in the YRD region.
Formation rate of 3 nm particles has been more routinely
reported. Similarly to J1.34, J3 in Shanghai is significantly
larger than 0.61 cm−3 s−1 in Hyytiälä, Finland (Kulmala et
al., 2012), and generally comparable to 3.3–81.4 and 1.1–
22.4 in Beijing (Wu et al., 2007; Yue et al., 2009), 3.6–6.9
in Hong Kong (Guo et al., 2012), and 2.4–4.0 cm−3 s−1 in a
back-garden rural site in Pearl River delta (Yue et al., 2013).
The fast reduction from J1.34 to J3 was likely due to the pres-
ence of a large background particle number as shown in Ta-
ble 1.
The large background particle number concentrations cor-
responded to the high condensation sink (0.030–0.10 s−1)
observed during the campaign. As shown in Table 1, CS
www.atmos-chem-phys.net/15/1769/2015/ Atmos. Chem. Phys., 15, 1769–1781, 2015
1774 S. Xiao et al.: Strong atmospheric new particle formation in winter
Figure 2. Profiles of N1.34∼3, N3∼7, and N7∼30 from 6 a.m. to 6 p.m. UTC +8 on a NPF day (11 December 2013) and a non-NPF day (7
January 2014).
in Shanghai is much larger than (0.05–0.35)× 10−2 s−1 in
Hyytiälä, Finland (Kulmala et al., 2012), and 0.8× 10⁻² s−1
in Kent, OH (Yu et al., 2014), but comparable to (0.58–
8.4)×10−2 s−1 in Beijing (Wu et al., 2007; Yue et al., 2009;
Zhang et al., 2011; Gao et al., 2012), (1.0–6.2)×10−2 s−1
in Hong Kong (Guo et al., 2012), 2.4× 10⁻² s−1 in Nanjing
(Herrmann et al., 2014), and (3.5–4.6)×10−2 s−1 in an urban
site in Pearl River delta (Yue et al., 2013). High sulfuric acid
proxy ([H2SO4] of (2.3–6.4)×107 molecules cm−3) existed
to promote the NPF events. Measurements of gas-phase sul-
furic acid by a chemical ionization mass spectrometer during
the CAREBeijing 2008 Campaign, a time period with strict
air-quality control regulations, reported peak concentrations
of sulfuric acid up to the order of 107 molecules cm−3 (Zheng
et al., 2011), smaller than our sulfuric acid proxy. Uncer-
tainty may well exist for our sulfuric acid proxy that was
calculated from the concentrations of sulfur dioxide and ra-
diation intensity. However, judging from CS and [H2SO4]
together, it is clear that the condensable vapor in Shanghai is
likely a main impetus for observed strong new particle for-
mation events.
GR1.35∼2.39, GR2.39∼7, and GR7∼20 were in the range
of 0.49–8.1, 3.1–35.7, and 4.5–38.3 nm h−1, respectively.
The arithmetic average values of GR1.35∼2.39, GR2.39∼7, and
GR7∼20 were 2.0±2.7 (1 standard deviation), 10.9±9.8, and
11.4± 9.7 nm h−1, respectively, which are comparable to 3–
20 nm h−1 for nucleation mode particles in another sulfur-
rich city, Atlanta, GA (Stolzenburg et al., 2005). In addi-
tion, GR1.35∼2.39 in Shanghai is smaller than the growth rates
(5.5–7.6 nm h−1) for particles in 1∼ 3 nm geometric diame-
ter range in Atlanta (Kuang et al., 2012). A closer examina-
tion of growth rates was performed by dividing GR1.35∼2.39
into growth of clusters/particles from one bin to another,
i.e., GR1.35∼1.39 (1.6± 1.0 nm h−1 from the bin of 1.34–
1.37 nm to the bin of 1.37–1.41 nm), GR1.39∼1.46 (1.4±
2.2 nm h−1 from 1.37–1.41 to 1.41–1.52 nm), GR1.46∼1.70
(7.2± 7.1 nm h−1 from 1.41–1.52 to 1.52–1.89 nm), and
GR1.70∼2.39(9.0± 11.4 nm h−1 from 1.52–1.89 to 1.89–
3.0 nm). These growth rates show a clear size-dependent par-
ticle growth (Fig. 3), owing to the nano-Köhler activation that
suggests a faster growth for activated nanoparticles due to a
decreasing Kelvin effect and, thus, an enhanced condensa-
tion flux (Kulmala et al., 2004b), Kelvin effect, and surface
or volume-controlled reaction corrected for the Kelvin effect
on surface or volume concentrations (Kuang et al., 2012).
Similar observations have been reported in previous studies
using nCNC (Kulmala et al., 2013) and diethylene glycol-
based ultrafine condensation particle counter (DEG UCPC)
(Kuang et al., 2012). Our GR2.39∼7 is larger than 6.3 nm h−1
in Nanjing (Herrmann et al., 2014), and our GR7∼20 is close
to the upper bound of those in urban Beijing (Wu et al., 2007;
Yue et al., 2009; Zhang et al., 2011; Gao et al., 2012) and
generally larger than 1.5–8.4 nm h−1 in Hong Kong (Guo et
al., 2012), indicating that high concentrations of condensable
vapors existed. In addition, our growth rates suggest that the
smallest clusters (the bin of 1.34–1.37 nm), if not scavenged
by larger particles, would grow to 3 nm within ∼ 12 min and
to 20 nm within ∼ 2 h.
Atmos. Chem. Phys., 15, 1769–1781, 2015 www.atmos-chem-phys.net/15/1769/2015/

S. Xiao et al.: Strong atmospheric new particle formation in winter 1775
Table 1. Nucleation rate (J1.34), formation rate of 3 nm particles (J3), particle growth rates (GR1.35∼2.39, GR2.39∼7, and GR7∼20), con-
densation sink (CS), sulfuric acid proxy ([H2SO4]), number concentrations of 1.34–3 nm clusters/particles (N1.34∼3), and total number
concentrations of particles (N1.34∼615), of each NPF event during this campaign.
Date J1.34 J3 GR1.35∼2.39 GR2.39∼7 GR7∼20 CSe [H2SO4]e N1.34∼3
f N1.34∼615f
(cm−3 s−1) (cm−3 s−1) (nm h−1) (nm h−1) (nm h−1) (10−2 s−1) (107 cm−3) (104 cm−3) (104 cm−3) Ref.
25 November 2013 NAa 10.6 NA 12.4b 38.3 4.7 2.7 3.3g 6.3 this study
26 November 2013 NA 2.3 NA 0.32b NA 5.9 2.6 NA NA this study
28 November 2013 185.1 13.4 0.94 35.7 4.6 5.7 3.6 1.6 4.2 this study
29 November 2013 271.0 3.9 1.7 10.6 4.5 6.3 4.3 2.1 4.5 this study
30 November 2013 NA NA 0.82 3.4 10.2 NA 3.1 1.5 NA this study
10 November 2013 268.4 10.0 0.49 18.6 21.0 9.9 5.5 1.4 4.6 this study
11 December 2013 219.0 19.2 NA 5.1 9.6 10.2 6.4 1.1 4.5 this study
12 December 2013 190.3 7.6 NA 3.1 12.3 8.8 4.5 1.1 4.1 this study
9 January 2014 136.2 NA 8.1 NA 9.5 3.7 2.3 1.6 3.8 this study
13 January 2014 NA 2.7 NA 6.3 1.9 3.0 2.3 1.5 3.4 this study
15 January 2014 121.9 NA 0.56 NA 9.7 4.2 4.1 1.5 4.3 this study
21 January 2014 112.4 9.2 1.5 11.9 7.5 4.9 3.7 1.1 3.9 this study
24 January 2014 NA 8.1 NA 12.2b 7.8 4.7 3.4 1.7 4.2 this study
Mean 188.0 8.7 2.0 10.9 11.4 6.0 3.7 1.5 4.4 this study
Hyytiälä 1.4 0.61 1.4 3.9 4.9 0.05–0.35 Kulmala et al. (2012)
Kent, OH 1.3 0.8 0.9 Yu et al. (2014)
Atlanta 3–20c Stolzenburg et al. (2005)
Atlanta 5.5–7.6 Kuang et al. (2012)
Beijing 1.2–8.0c 2.4–3.6 Gao et al. (2012)
Beijing 3.3–81.4 0.1–11.2c 0.58–4.3 Wu et al. (2007)
Beijing 2.7–13.9c 0.6–8.4 Zhang et al. (2011)
Beijing 1.1–22.4 1.2–5.6c 0.9–5.3 Yue et al. (2009)
Nanjing 33.2h 1.1i 6.3 8d 2.4 Herrmann et al. (2014)
Hong Kong 3.6–6.9 1.5–8.4c 1.0–6.2 Guo et al. (2012)
4.0–22.7 (rural) 2.3–3.3 (rural)
Pearl River delta 2.4–4.0 (rural) 10.1–18.9 (urban) 3.5–4.6 (urban) Yue et al. (2013)
a Data were not available or could not be accurately determined; b results were calculated from nano-SMPS data; c shown here is GR3∼30; d shown here is GR7∼30;e daytime average (from 6:00 a.m. to 6:00 p.m.); f 24 h average; g average values between 10 a.m. and 4 p.m.; h shown here is J2;i shown here is J6.
Figure 3. Averaged particle size evolution on NPF days. Arithmetic
mean of particle growth rates are given with 1 standard deviation.
3.3 Potential mechanisms for NPF events
As shown in Table 1, nucleation rate (J1.34) in this study
is typically larger than 100 cm−3 s−1, suggesting that the
ion-induced nucleation was not a main mechanism for ob-
served fast nucleation (Hirsikko et al., 2011; Riccobono et
al., 2014). The 2012 winter study at the SORPES-NJU sta-
tion that is also located at YRD shows that the ratio of J2
between ions and total particles (ions plus neutral particles)
was 0.002, also indicating the minor role of ion-induced nu-
cleation (Herrmann et al., 2014). Hence, it is likely that nu-
cleation of neutral precursor molecules actually largely de-
termined the observed NPF events.
Correlations between logJ1.34 and log[H2SO4] (Fig. 4)
and between logJ1.34 and log[NH3] (Fig. 5) were examined
to elucidate potential mechanisms for our NPF events. Since
J1.34 could not be accurately determined on some of the NPF
days, the number of data points in both figures was less than
the actual number of NPF events that have been observed.
Daily peak concentration of sulfuric acid proxy and daytime
(6 a.m.–6 p.m.) averages of ammonia were used as approxi-
mations for their effective concentrations on a NPF day since
there was no peak concentration for ammonia. The corre-
lation (R2= 0.62) between logJ1.34 and log[NH3] is better
than that (R2= 0.38) between logJ1.34 and log[H2SO4], and
slopes are 0.57± 0.17 and 0.65± 0.28, respectively.
Most ambient studies showed that nucleation rate J is pro-
portional to the first or second power of the concentration
of gas-phase sulfuric acid, i.e., J = A · [H2SO4]P where P
is equal to 1 or 2, conventionally interpreted as the num-
ber of sulfuric acid molecules in the critical nucleus, and
A is a pre-exponential factor (McMurry et al., 2005; Sihto
et al., 2006; Erupe et al., 2010). Our P of 0.65± 0.28 is of
a significant uncertainty, which could come from the uncer-
www.atmos-chem-phys.net/15/1769/2015/ Atmos. Chem. Phys., 15, 1769–1781, 2015

1776 S. Xiao et al.: Strong atmospheric new particle formation in winter
Figure 4. Correlation between logJ1.34 and log[H2SO4]. Daily
peak concentration of sulfuric acid proxy was used as an approx-
imation for its effective concentration on a NPF day. The error bar
corresponds to a 42 % uncertainty of sulfuric acid proxy according
to Mikkonen et al. (2011).
tainty during the calculation of sulfuric acid proxy [H2SO4]
and the scarcity of our data points. The upper limit of our
P indicates that nucleation occurs after activation of clus-
ters containing one molecule of sulfuric acid, with subse-
quent growth involving other species (Kulmala et al., 2006).
The lower limit, however, would imply a less important role
of sulfuric acid in the critical nucleus during our campaign,
which is unlikely to be true according to numerous previous
studies (Weber et al., 1996; Sipila et al., 2010; Yu and Hal-
lar, 2014). Kupiainen-Määttä et al. (2014) recently reported
that the number of molecules in a critical cluster cannot be
determined by a slope analysis in atmospherically relevant
applications, underscoring the need to further explore the ex-
act nucleation mechanism. Herrmann et al. (2014) also cal-
culated the sulfuric acid proxy, related it to observed nucle-
ation rates, and speculated that the sulfuric acid exponent
might be well over 2, which underscores the reliability of
calculation methods in a Chinese location. Hence, our pre-
liminary result should be further tested with actual measure-
ments of gas-phase sulfuric acid, although it does indicate
the key role of sulfuric acid in NPF events. On the one hand,
linear correlation between logJ and log[NH3] was observed
in a previous nucleation study in Atlanta, GA, with a slope of
1.17 (McMurry et al., 2005); on the other hand, a clear rela-
tionship was not perceived in Kent, OH (Erupe et al., 2010).
This discrepancy may come from the level of ammonia that
has been predicted to have a saturation threshold (Napari et
al., 2002) and/or the co-existing sulfuric acid concentration
(Benson et al., 2009). Nevertheless, our correlation between
logJ and log[NH3] suggests that ammonia also participated
in the nucleation. A recent chemical ionization mass spec-
trometer (CIMS) study (Zheng et al., 2015) observed good
Figure 5. Correlation between logJ1.34 and log[NH3]. Daytime av-
erage of ammonia was used as an approximation for its effective
concentration on a NPF day. The error bar represents the standard
deviation of the daytime average concentration of ammonia.
correlations between NH3 and amines at an urban site in
Nanjing, China. Hence, it is plausible that amines may con-
tribute to nucleation in our site in Shanghai, too.
The subsequent growth of newly formed particles can
be partially attributed to condensation of sulfuric acid.
The theoretical maximum growth rate of 1.34–3 nm clus-
ters/particles due to condensation of hydrated sulfuric acid
at 50 % RH (GRH2SO4(1.34∼3)), calculated according to Eqs.
(6) and (7), was 3.9± 1.3 nm h−1 on average. This rate is
larger than the observed growth rates of clusters/particles
from the bin of 1.34–1.37 nm to the bin of 1.89–3.0 nm
(GR1.35∼2.39), being 2.0± 2.7 nm h−1, indicating that sulfu-
ric acid proxy was enough to explain the observed growth
for particles under 3 nm. Similar calculation of GRH2SO4(3∼7)
and GRH2SO4(7∼20) yielded 2.8±0.94 and 2.2±0.74 nm h−1,
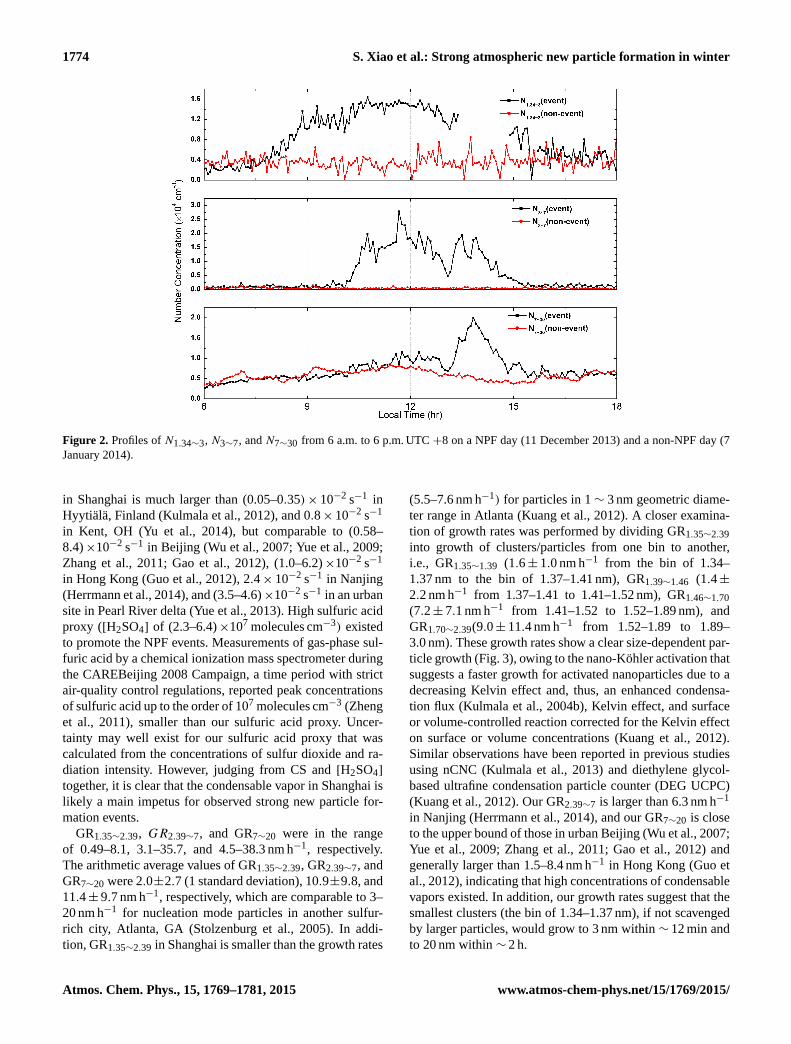
respectively. In Fig. 6, relative contributions of sulfuric acid
to growth of particles in the range of 3–7 and 7–20 nm on
each NPF day is presented. Since 7 nm particles reached their
maximum earlier than 3 nm particles on 9 and 15 January
2014, there was no calculated GR3∼7 and hence no ratios
available on these 2 days. In addition, condensation of hy-
drated sulfuric acid was more prominent for 3–7 nm par-
ticles on 6 NPF days (25, 26, and 30 November, and 10,
11, and 12 December 2013), whereas it was more signif-
icant for 7–20 nm particles on the other 5 NPF days (28,
29 November 2013, and 13, 21, and 24 January 2014). On
average, condensation of gas-phase hydrated sulfuric acid
explained 39.1 % of GR2.39∼7 and 29.0 % of GR7∼20. The
rest of growth might be largely attributed to condensation
of extremely low volatility organic compounds (Ehn et al.,
2014) and potentially heterogeneous reactions of organics on
nanoparticle surface (Wang et al., 2010, 2011).
Atmos. Chem. Phys., 15, 1769–1781, 2015 www.atmos-chem-phys.net/15/1769/2015/
S. Xiao et al.: Strong atmospheric new particle formation in winter 1777
Figure 6. Relative contribution of sulfuric acid to growth of par-
ticles in the range of 3–7 and 7–20 nm, respectively, on each NPF
day.
3.4 NPF and aerosol surface area
NPF events in urban environments are of special interest
since the pre-existing particle surface may significantly scav-
enge the newly formed particles and change the probability
of NPF. We plot number concentrations of 1.34–10 nm par-
ticles (N1.34∼10), sulfuric acid proxy ([H2SO4]), ammonia
([NH3]), and aerosol surface area with shadowed blocks rep-
resenting NPF events in Fig. 7. Note that N1.34∼10 was used
as an approximation for nucleation and subsequent growth
while excluding particles from direct emission. The average
daytime (6 a.m.–6 p.m.) N1.34∼10 on NPF days was (2.7±
2.1×104 cm−3, much larger than (1.5±1.0)×104 cm−3 on
the rest days of the campaign, indicating that a stronger input
of particles from nucleation processes on NPF days. How-
ever, daytime [H2SO4] did not show an apparent difference
between on NPF days ((3.7±1.2)×107 molecules cm−3) and
on the rest days ((3.9± 2.5)×107 molecules cm−3). For ex-
ample, an episode with high daily sulfuric acid proxy during
19 December 2013 and 16 January 2014 did not lead to any
NPF events. Instead, observed NPF events occurred on days
with low aerosol surface area levels and moderate [H2SO4].
During our campaign, NPF days were characterized with low
aerosol surface area ((7.8± 3.8)×108 nm2 cm−3), whereas
the average was (10.4±4.7)×108 nm2 cm−3 on the rest days
of the campaign. Ammonia varied dramatically, even within
a single day. NPF events occurred on days with around 10-
fold difference in ammonia concentrations. According to am-
monia’s profile and its positive correlation with J1.34, we
speculate that ammonia was involved in nucleation but was
not the driving force.
Examination of these parameters was performed from 12
to 14 January 2014 because the 3 days were characterized
with similar meteorological conditions. The average day-
time concentration of sulfuric acid proxy was 2.8, 2.3, and
1.0× 10⁷ molecules cm−3 on 12, 13, and 14 January 2014,
respectively. No NPF event was observed on 14 January at
least partially because of the low sulfuric acid proxy. Ap-
pearance of a NPF event on 13 January and non-appearance
on 12 January could be explained by the high aerosol surface
area on 12 January, with maximum aerosol surface area up
to 1.8×10⁹ nm2 cm−3, although similar sulfuric acid proxies
existed between the 2 days. Hence, we conclude that, quali-
tatively, NPF processes in urban Shanghai occurred with low
levels of aerosol surface and that high sulfuric acid favored
NPF events when aerosol surface area was low. This con-
clusion is identical to that drawn from a Mexico City study
where NPF events observed in the city correlated with el-
evated concentrations of sulfur dioxide and low particulate
matter mass concentrations in the afternoon hours (Dunn et
al., 2004).
4 Summary and conclusions
Atmospheric new particle formation is a significant source
of atmospheric aerosol particles. Understanding NPF under
the current levels of air pollution in China is of special sci-
entific interest because the exact nucleation mechanism un-
der urban environment remains elusive. From 25 November
2013 to 25 January 2014, a combination of one nCNC, one
nano-SPMS, and one long-SPMS has been utilized to inves-
tigate atmospheric nucleation by measuring particle size dis-
tributions in the range of 1.34–615 nm in urban Shanghai,
located in the east Yangtze River delta. During this 62-day
campaign, 13 NPF events were identified with strong burst
of sub-3 nm particles and subsequent fast growth of newly
formed particles. Together with nucleation frequency (21 %),
the obtained nucleation rate J1.34 (112.4–271.0 cm−3 s−1),
condensation sink (0.030–0.10 s−1), and aerosol surface area
((7.8±3.8)×108 nm2 cm−3) on NPF event days clearly indi-
cate that strong atmospheric new particle formation occurred
in winter in urban Shanghai, with competition between pro-
motion from condensable vapors and scavenging by preex-
isting particles. The absolute values of J1.34 and CS are 1
to 2 orders of magnitude larger than those at locations with
a pristine atmosphere (e.g., Kulmala et al., 2012) and semi-
rural locations with very low pollution levels such as Kent,
OH (Yu et al., 2014), as a reflection of the significantly al-
tered atmospheric background.
Our preliminary exploration of the nucleation mechanism
indicated that nucleation rate J1.34 was proportional to a
0.65± 0.28 power of sulfuric acid proxy. It is hence likely
that observed NPF events could be explained by the activa-
tion theory. As Herrmann et al. (2014) doubted reliability of
sulfuric acid proxy, accurate measurements of gas-phase sul-
furic acid instead of calculation of a proxy is necessary to
achieve an unambiguous conclusion. The positive correlation
between J1.34 and gas-phase ammonia hints at the involve-
www.atmos-chem-phys.net/15/1769/2015/ Atmos. Chem. Phys., 15, 1769–1781, 2015

1778 S. Xiao et al.: Strong atmospheric new particle formation in winter
Figure 7. Number concentrations of 1.34–10 nm particles (N1.34∼10), sulfuric acid proxy ([H2SO4]), concentrations of ammonia, and
aerosol surface area during the campaign. NPF events are illustrated with shadows.
ment of ammonia in new particle formation, but its exact role
cannot be determined without measurements of nucleating
clusters.
A size-dependent particle growth in the range of 1.34–
20 nm has been observed in this study, consistent with pre-
dictions from nano-Köhler theory (Kulmala et al., 2004a)
and Kelvin-limited diffusion, surface, and volume growth
laws (Kuang et al., 2012). Sulfuric acid proxy was enough
to explain the observed growth for particles under 3 nm and
contributed to 39.1 of GR2.39∼7 and 29.0 % of GR7∼20. The
rest of the growth could be largely attributed to condensation
of extremely low volatility organic compounds (Ehn et al.,
2014) and potentially heterogeneous reactions of organics on
nanoparticle surface (Wang et al., 2010, 2011).
Clearly, further long-term measurements with integrated
state-of-the-art measurement techniques are necessary to
draw a comprehensive picture of atmospheric nucleation
events in China. Currently, atmospheric sub-3 nm particle
measurements are still scarce in China, other than measure-
ments of gas-phase sulfuric acid, nucleating clusters, and
other potential precursors. Nevertheless, our study offers the
very first measurement of sub-3 nm particles in urban Shang-
hai and provides some of the preliminary mechanisms for
NPF events in China.
Acknowledgements. This study was financially supported by the
National Natural Science Foundation of China (no. 21107015,
21190053, 21277029, and 21222703), the Ministry of Science and
Technology of China (2012YQ220113-4), the Science and Tech-
nology Commission of Shanghai Municipality (12DJ1400100), and
the Cyrus Tang Foundation. LW thanks the Jiangsu Provincial 2011
Program (Collaborative Innovation Center of Climate Change).
Edited by: J. Allan
References
Andreae, M. O. and Crutzen, P. J.: Atmospheric aerosols: biogeo-
chemical sources and role in atmospheric chemistry, Science,
276, 1052–1058, 1997.
Anttila, T., Kerminen, V.-M., and Lehtinen, K. E. J.: Pa-
rameterizing the formation rate of new particles: the ef-
fect of nuclei self-coagulation, J. Aerosol Sci., 41, 621–636,
doi:10.1016/j.jaerosci.2010.04.008, 2010.
Ball, S., Hanson, D., Eisele, F., and McMurry, P.: Laboratory studies
of particle nucleation: Initial results for H2SO4, H2O, and NH3
vapors, J. Geophys. Res.-Atmos., 104, 23709–23718, 1999.
Benson, D. R., Erupe, M. E., and Lee, S. H.: Laboratory-
measured H2SO4-H2O-NH3 ternary homogeneous nucleation
rates: Initial observations, Geophys. Res. Lett., 36, L15818,
doi:10.1029/2009GL038728, 2009.
Berndt, T., Stratmann, F., Sipilä, M., Vanhanen, J., Petäjä, T.,
Mikkilä, J., Grüner, A., Spindler, G., Lee Mauldin III, R., Cur-
tius, J., Kulmala, M., and Heintzenberg, J.: Laboratory study on
new particle formation from the reaction OH + SO2: influence
of experimental conditions, H2O vapour, NH3 and the amine
tert-butylamine on the overall process, Atmos. Chem. Phys., 10,
7101–7116, doi:10.5194/acp-10-7101-2010, 2010.
Atmos. Chem. Phys., 15, 1769–1781, 2015 www.atmos-chem-phys.net/15/1769/2015/

S. Xiao et al.: Strong atmospheric new particle formation in winter 1779
Chan, C. K. and Yao, X.: Air pollution in mega cities in China,
Atmos. Environ., 42, 1–42, 2008.
Dal Maso, M. D., Kulmala, M., Riipinen, I., Wagner, R., Hussein,
T., Aalto, P. P., and Lehtinen, K. E.: Formation and growth of
fresh atmospheric aerosols: eight years of aerosol size distribu-
tion data from SMEAR II, Hyytiälä, Finland, Boreal Environ.
Res., 10, 323–336, 2005.
Dockery, D. W., Pope, C. A., Xu, X., Spengler, J. D., Ware, J. H.,
Fay, M. E., Ferris Jr, B. G., and Speizer, F. E.: An association
between air pollution and mortality in six US cities, New Engl.
J. Med., 329, 1753–1759, 1993.
Du, J., Cheng, T., Zhang, M., Chen, J., He, Q., Wang, X., Zhang, R.,
Tao, J., Huang, G., and Li, X.: Aerosol Size Spectra and Particle
Formation Events at Urban Shanghai in Eastern China, Aerosol
Air Qual. Res, 12, 1362–1372, 2012.
Dunn, M. J., Jiménez, J. L., Baumgardner, D., Castro, T., Mc-
Murry, P. H., and Smith, J. N.: Measurements of Mexico
City nanoparticle size distributions: Observations of new par-
ticle formation and growth, Geophys. Res. Lett., 31, L10102,
doi:10.1029/2004GL019483, 2004.
Ehn, M., Thornton, J. A., Kleist, E., Sipilä, M., Junninen, H., Pulli-
nen, I., Springer, M., Rubach, F., Tillmann, R., and Lee, B.: A
large source of low-volatility secondary organic aerosol, Nature,
506, 476–479, 2014.
Eisele, F. and Tanner, D.: Measurement of the gas phase concen-
tration of H2SO4 and methane sulfonic acid and estimates of
H2SO4 production and loss in the atmosphere, J. Geophys. Res.-
Atmos., 98, 9001–9010, 1993.
Erupe, M. E., Benson, D. R., Li, J., Young, L.-H., Verheggen,
B., Al-Refai, M., Tahboub, O., Cunningham, V., Frimpong, F.,
Viggiano, A. A., and Lee, S.-H.: Correlation of aerosol nu-
cleation rate with sulfuric acid and ammonia in Kent, Ohio:
An atmospheric observation, J. Geophys. Res., 115, D23216,
doi:10.1029/2010jd013942, 2010.
Gao, J., Chai, F., Wang, T., Wang, S., and Wang, W.: Particle num-
ber size distribution and new particle formation: New character-
istics during the special pollution control period in Beijing, J.
Environ. Sci., 24, 14–21, doi:10.1016/s1001-0742(11)60725-0,
2012.
Guo, H., Wang, D. W., Cheung, K., Ling, Z. H., Chan, C. K., and
Yao, X. H.: Observation of aerosol size distribution and new par-
ticle formation at a mountain site in subtropical Hong Kong,
Atmos. Chem. Phys., 12, 9923–9939, doi:10.5194/acp-12-9923-
2012, 2012.
Haywood, J. and Boucher, O.: Estimates of the direct and indi-
rect radiative forcing due to tropospheric aerosols: a review, Rev.
Geophys., 38, 513–543, doi:10.1029/1999rg000078, 2000.
Herrmann, E., Ding, A. J., Kerminen, V.-M., Petäjä, T., Yang, X.
Q., Sun, J. N., Qi, X. M., Manninen, H., Hakala, J., Nieminen,
T., Aalto, P. P., Kulmala, M., and Fu, C. B.: Aerosols and nucle-
ation in eastern China: first insights from the new SORPES-NJU
station, Atmos. Chem. Phys., 14, 2169–2183, doi:10.5194/acp-
14-2169-2014, 2014.
Hirsikko, A., Nieminen, T., Gagné, S., Lehtipalo, K., Manninen, H.
E., Ehn, M., Hõrrak, U., Kerminen, V.-M., Laakso, L., McMurry,
P. H., Mirme, A., Mirme, S., Petäjä, T., Tammet, H., Vakkari,
V., Vana, M., and Kulmala, M.: Atmospheric ions and nucle-
ation: a review of observations, Atmos. Chem. Phys., 11, 767–
798, doi:10.5194/acp-11-767-2011, 2011.
IPCC: IPCC, 2013: Climate change 2013: The physical science ba-
sis, Contribution of working group I to the fourth assessment
report of the intergovernmental panel on climate change, Cam-
bridge University Press, Cambridge, United Kingdom and New
York, NY, USA, 2013.
Kanawade, V. P., Benson, D. R., and Lee, S.-H.: Statistical
analysis of 4-year observations of aerosol sizes in a semi-
rural continental environment, Atmos. Environ., 59, 30–38,
doi:10.1016/j.atmosenv.2012.05.047, 2012.
Korhonen, H., Sihto, S.-L., Kerminen, V.-M., and Lehtinen, K. E.
J.: Evaluation of the accuracy of analysis tools for atmospheric
new particle formation, Atmos. Chem. Phys., 11, 3051–3066,
doi:10.5194/acp-11-3051-2011, 2011.
Kuang, C., Chen, M., Zhao, J., Smith, J., McMurry, P. H., and
Wang, J.: Size and time-resolved growth rate measurements of 1
to 5 nm freshly formed atmospheric nuclei, Atmos. Chem. Phys.,
12, 3573–3589, doi:10.5194/acp-12-3573-2012, 2012.
Kulmala, M., Toivonen, A., Mäkelä, J. M., and Laaksonen, A.:
Analysis of the growth of nucleation mode particles observed in
Boreal forest, Tellus B, 50, 449–462, 1998.
Kulmala, M., Kerminen, V. M., Anttila, T., Laaksonen, A.,
and O’Dowd, C. D.: Organic aerosol formation via sulphate
cluster activation, J. Geophys. Res.-Atmos., 109, D04205,
doi:10.1029/2003JD003961, 2004a.
Kulmala, M., Vehkamäki, H., Petäjä, T., Dal Maso, M., Lauri,
A., Kerminen, V. M., Birmili, W., and McMurry, P. H.:
Formation and growth rates of ultrafine atmospheric parti-
cles: a review of observations, J. Aerosol Sci., 35, 143–176,
doi:10.1016/j.jaerosci.2003.10.003, 2004b.
Kulmala, M., Lehtinen, K. E. J., and Laaksonen, A.: Cluster activa-
tion theory as an explanation of the linear dependence between
formation rate of 3 nm particles and sulphuric acid concentration,
Atmos. Chem. Phys., 6, 787–793, doi:10.5194/acp-6-787-2006,
2006.
Kulmala, M., Riipinen, I., Sipilä, M., Manninen, H. E., Petäjä, T.,
Junninen, H., Dal Maso, M., Mordas, G., Mirme, A., and Vana,
M.: Toward direct measurement of atmospheric nucleation, Sci-
ence, 318, 89–92, 2007.
Kulmala, M., Petäjä, T., Nieminen, T., Sipilä, M., Manninen,
H. E., Lehtipalo, K., Dal Maso, M., Aalto, P. P., Junninen,
H., Paasonen, P., Riipinen, I., Lehtinen, K. E. J., Laakso-
nen, A., and Kerminen, V.-M.: Measurement of the nucleation
of atmospheric aerosol particles, Nat. Protoc., 7, 1651–1667,
doi:10.1038/nprot.2012.091, 2012.
Kulmala, M., Kontkanen, J., Junninen, H., Lehtipalo, K., Manni-
nen, H. E., Nieminen, T., Petaja, T., Sipila, M., Schobesberger,
S., Rantala, P., Franchin, A., Jokinen, T., Jarvinen, E., Aijala, M.,
Kangasluoma, J., Hakala, J., Aalto, P. P., Paasonen, P., Mikkila,
J., Vanhanen, J., Aalto, J., Hakola, H., Makkonen, U., Ruuska-
nen, T., Mauldin, R. L., Duplissy, J., Vehkamaki, H., Back,
J., Kortelainen, A., Riipinen, I., Kurten, T., Johnston, M. V.,
Smith, J. N., Ehn, M., Mentel, T. F., Lehtinen, K. E. J., Laak-
sonen, A., Kerminen, V. M., and Worsnop, D. R.: Direct Obser-
vations of Atmospheric Aerosol Nucleation, Science, 339, 943–
946, doi:10.1126/science.1227385, 2013.
Kupiainen-Määttä, O., Olenius, T., Korhonen, H., Malila, J., Dal
Maso, M., Lehtinen, K., and Vehkamäki, H.: Critical cluster
size cannot in practice be determined by slope analysis in atmo-
www.atmos-chem-phys.net/15/1769/2015/ Atmos. Chem. Phys., 15, 1769–1781, 2015

1780 S. Xiao et al.: Strong atmospheric new particle formation in winter
spherically relevant applications, J. Aerosol Sci., 77, 127–144,
doi:10.1016/j.jaerosci.2014.07.005, 2014.
Kurtén, T., Noppel, M., Vehkamaeki, H., Salonen, M., and Kulmala,
M.: Quantum chemical studies of hydrate formation of H2SO4
and HSO−4
, Boreal Environ. Res., 12, 431–453, 2007.
Laden, F., Schwartz, J., Speizer, F. E., and Dockery, D. W.: Re-
duction in fine particulate air pollution and mortality: extended
follow-up of the Harvard Six Cities study, Am. J. Resp. Crit.Care,
173, 667–672, 2006.
Lee, S.-H., Reeves, J., Wilson, J., Hunton, D., Viggiano, A., Miller,
T., Ballenthin, J., and Lait, L.: Particle formation by ion nucle-
ation in the upper troposphere and lower stratosphere, Science,
301, 1886–1889, 2003.
Lehtinen, K. E. J. and Kulmala, M.: A model for particle formation
and growth in the atmosphere with molecular resolution in size,
Atmos. Chem. Phys., 3, 251–257, doi:10.5194/acp-3-251-2003,
2003.
Ma, Y., Xu, X., Song, W., Geng, F., and Wang, L.: Seasonal and di-
urnal variations of particulate organosulfates in urban Shanghai,
China, Atmos. Environ., 85, 152–160, 2014.
Matsui, H., Koike, M., Kondo, Y., Takegawa, N., Wiedensohler, A.,
Fast, J. D., and Zaveri, R. A.: Impact of new particle forma-
tion on the concentrations of aerosols and cloud condensation
nuclei around Beijing, J. Geophys. Res.-Atmos., 116, D19208,
doi:10.1029/2011JD016025, 2011.
McMurry, P. H., Fink, M., Sakurai, H., Stolzenburg, M., Mauldin,
R., Smith, J., Eisele, F., Moore, K., Sjostedt, S., and Tanner,
D.: A criterion for new particle formation in the sulfur-rich
Atlanta atmosphere, J. Geophys. Res.-Atmos., 110, D22S02,
doi:10.1029/2005JD005901, 2005.
Mikkonen, S., Romakkaniemi, S., Smith, J. N., Korhonen, H.,
Petäjä, T., Plass-Duelmer, C., Boy, M., McMurry, P. H., Lehtinen,
K. E. J., Joutsensaari, J., Hamed, A., Mauldin III, R. L., Birmili,
W., Spindler, G., Arnold, F., Kulmala, M., and Laaksonen, A.: A
statistical proxy for sulphuric acid concentration, Atmos. Chem.
Phys., 11, 11319–11334, doi:10.5194/acp-11-11319-2011, 2011.
Napari, I., Noppel, M., Vehkamäki, H., and Kulmala, M.:
Parametrization of ternary nucleation rates for H2SO4-NH3-
H2O vapors, J. Geophys. Res.-Atmos., 107, AAC 6-1–AAC 6-6,
2002.
Nieminen, T., Lehtinen, K. E. J., and Kulmala, M.: Sub-10 nm parti-
cle growth by vapor condensation –effects of vapor molecule size
and particle thermal speed, Atmos. Chem. Phys., 10, 9773–9779,
doi:10.5194/acp-10-9773-2010, 2010.
O’Dowd, C. D., Jimenez, J. L., Bahreini, R., Flagan, R. C., Seinfeld,
J. H., Hämeri, K., Pirjola, L., Kulmala, M., Jennings, S. G., and
Hoffmann, T.: Marine aerosol formation from biogenic iodine
emissions, Nature, 417, 632–636, 2002.
Park, J., Sakurai, H., Vollmers, K., and McMurry, P. H.: Aerosol size
distributions measured at the South Pole during ISCAT, Atmos.
Environ., 38, 5493–5500, 2004.
Platt, U. and Stutz, J.: Differential Optical Absorption
Spectroscopy-Principles and Applications, Springer Berlin
Heidelberg, 2008.
Pope, C. A. and Dockery, D. W.: Health effects of fine particulate air
pollution: lines that connect, Japca. J. Air Waste Ma., 56, 709–
742, 2006.
Riccobono, F., Schobesberger, S., Scott, C. E., Dommen, J., Or-
tega, I. K., Rondo, L., Almeida, J., Amorim, A., Bianchi, F., and
Breitenlechner, M.: Oxidation Products of Biogenic Emissions
Contribute to Nucleation of Atmospheric Particles, Science, 344,
717–721, 2014.
Schobesberger, S., Junninen, H., Bianchi, F., Lönn, G., Ehn, M.,
Lehtipalo, K., Dommen, J., Ehrhart, S., Ortega, I. K., and
Franchin, A.: Molecular understanding of atmospheric parti-
cle formation from sulfuric acid and large oxidized organic
molecules, P. Natl. Acad. Sci. USA, 110, 17223–17228, 2013.
Sihto, S.-L., Kulmala, M., Kerminen, V.-M., Dal Maso, M., Petäjä,
T., Riipinen, I., Korhonen, H., Arnold, F., Janson, R., Boy, M.,
Laaksonen, A., and Lehtinen, K. E. J.: Atmospheric sulphuric
acid and aerosol formation: implications from atmospheric mea-
surements for nucleation and early growth mechanisms, At-
mos. Chem. Phys., 6, 4079–4091, doi:10.5194/acp-6-4079-2006,
2006.
Sipila, M., Berndt, T., Petaja, T., Brus, D., Vanhanen, J., Strat-
mann, F., Patokoski, J., Mauldin, R. L., Hyvarinen, A. P.,
Lihavainen, H., and Kulmala, M.: The Role of Sulfuric
Acid in Atmospheric Nucleation, Science, 327, 1243–1246,
doi:10.1126/science.1180315, 2010.
Stolzenburg, M. R., McMurry, P. H., Sakurai, H., Smith, J. N.,
Mauldin, R. L., Eisele, F. L., and Clement, C. F.: Growth rates of
freshly nucleated atmospheric particles in Atlanta, J. Geophys.
Res., 110, D22S05, doi:10.1029/2005jd005935, 2005.
Vanhanen, J., Mikkilä, J., Lehtipalo, K., Sipilä, M., Manninen, H.,
Siivola, E., Petäjä, T., and Kulmala, M.: Particle size magnifier
for nano-CN detection, Aerosol Sci. Tech., 45, 533–542, 2011.
Wang, L., Khalizov, A. F., Zheng, J., Xu, W., Ma, Y., Lal, V., and
Zhang, R.: Atmospheric nanoparticles formed from heteroge-
neous reactions of organics, Nat. Geosci., 3, 238–242, 2010.
Wang, L., Xu, W., Khalizov, A. F., Zheng, J., Qiu, C., and Zhang, R.:
Laboratory investigation on the role of organics in atmospheric
nanoparticle growth,J. Phys. Chem. A, 115, 8940–8947, 2011.
Wang, L., Du, H., Chen, J., Zhang, M., Huang, X., Tan, H., Kong,
L., and Geng, F.: Consecutive transport of anthropogenic air
masses and dust storm plume: Two case events at Shanghai,
China, Atmos. Res., 127, 22–33, 2013.
Wang, S., Zhou, R., Zhao, H., Wang, Z., Chen, L., and Zhou, B.:
Long-term observation of atmospheric nitrous acid (HONO) and
its implication to local NO2 levels in Shanghai, China, Atmos.
Environ., 77, 718–724, doi:10.1016/j.atmosenv.2013.05.071,
2013.
Weber, R., Marti, J., McMurry, P., Eisele, F., Tanner, D., and Jef-
ferson, A.: Measured atmospheric new particle formation rates:
Implications for nucleation mechanisms, Chem. Eng. Commun.,
151, 53–64, 1996.
Wu, Z., Hu, M., Liu, S., Wehner, B., Bauer, S., Ma ßling, A.,
Wiedensohler, A., Petäjä, T., Dal Maso, M., and Kulmala, M.:
New particle formation in Beijing, China: Statistical analysis
of a 1-year data set, J. Geophys. Res.-Atmos., 112, D09209,
doi:10.1029/2006jd007406, 2007.
Yu, F. and Turco, R. P.: From molecular clusters to nanoparticles:
Role of ambient ionization in tropospheric aerosol formation, J.
Geophys. Res.-Atmos., 106, 4797–4814, 2001.
Yu, F. Q. and Hallar, A. G.: Difference in particle formation at a
mountaintop location during spring and summer: Implications
for the role of sulfuric acid and organics in nucleation, J. Geo-
phys. Res.-Atmos., 119, 12246–12255, 2014.
Atmos. Chem. Phys., 15, 1769–1781, 2015 www.atmos-chem-phys.net/15/1769/2015/
S. Xiao et al.: Strong atmospheric new particle formation in winter 1781
Yu, H., Gannet Hallar, A., You, Y., Sedlacek, A., Springston, S.,
Kanawade, V. P., Lee, Y. N., Wang, J., Kuang, C., and McGraw,
R. L.: Sub-3 nm particles observed at the coastal and continental
sites in the United States, J. Geophys. Res.-Atmos., 119, 860–
879, doi:10.1002/2013JD020841, 2014.
Yue, D., Hu, M., Wu, Z., Wang, Z., Guo, S., Wehner, B., Nowak, A.,
Achtert, P., Wiedensohler, A., Jung, J., Kim, Y. J., and Liu, S.:
Characteristics of aerosol size distributions and new particle for-
mation in the summer in Beijing, J. Geophys. Res., 114, D00G12,
doi:10.1029/2008jd010894, 2009.
Yue, D. L., Hu, M., Zhang, R. Y., Wang, Z. B., Zheng, J., Wu, Z.
J., Wiedensohler, A., He, L. Y., Huang, X. F., and Zhu, T.: The
roles of sulfuric acid in new particle formation and growth in
the mega-city of Beijing, Atmos. Chem. Phys., 10, 4953–4960,
doi:10.5194/acp-10-4953-2010, 2010.
Yue, D. L., Hu, M., Zhang, R. Y., Wu, Z. J., Su, H., Wang, Z.
B., Peng, J. F., He, L. Y., Huang, X. F., Gong, Y. G., and
Wiedensohler, A.: Potential contribution of new particle forma-
tion to cloud condensation nuclei in Beijing, Atmos. Environ.,
45, 6070–6077, doi:10.1016/j.atmosenv.2011.07.037, 2011.
Yue, D. L., Hu, M., Wang, Z. B., Wen, M. T., Guo, S., Zhong, L.
J., Wiedensohler, A., and Zhang, Y. H.: Comparison of particle
number size distributions and new particle formation between the
urban and rural sites in the PRD region, China, Atmos. Environ.,
76, 181–188, doi:10.1016/j.atmosenv.2012.11.018, 2013.
Zhang, R., Suh, I., Zhao, J., Zhang, D., Fortner, E. C., Tie, X.,
Molina, L. T., and Molina, M. J.: Atmospheric new particle for-
mation enhanced by organic acids, Science, 304, 1487–1490,
2004.
Zhang, R., Wang, L., Khalizov, A. F., Zhao, J., Zheng, J., McGraw,
R. L., and Molina, L. T.: Formation of nanoparticles of blue haze
enhanced by anthropogenic pollution, P. Natl. Acad. Sci. USA,
106, 17650–17654, 2009.
Zhang, R., Khalizov, A., Wang, L., Hu, M., and Xu, W.: Nucleation
and Growth of Nanoparticles in the Atmosphere, Chem. Rev.,
112, 1957–2011, doi:10.1021/cr2001756, 2012.
Zhang, Y., Zhang, X., Sun, J., Lin, W., Gong, S., Shen, X., and
Yang, S.: Characterization of new particle and secondary aerosol
formation during summertime in Beijing, China, Tellus B, 63,
382–394, 2011.
Zhao, J., Smith, J. N., Eisele, F. L., Chen, M., Kuang, C., and
McMurry, P. H.: Observation of neutral sulfuric acid-amine
containing clusters in laboratory and ambient measurements,
Atmos. Chem. Phys., 11, 10823–10836, doi:10.5194/acp-11-
10823-2011, 2011.
Zheng, J., Hu, M., Zhang, R., Yue, D., Wang, Z., Guo, S., Li,
X., Bohn, B., Shao, M., He, L., Huang, X., Wiedensohler, A.,
and Zhu, T.: Measurements of gaseous H2SO4 by AP-ID-CIMS
during CAREBeijing 2008 Campaign, Atmos. Chem. Phys., 11,
7755–7765, doi:10.5194/acp-11-7755-2011, 2011.
Zheng, J., Ma, Y., Chen, M., Zhang, Q., Wang, L., Khalizov, A. F.,
Yao, L., Wang, Z., Wang, X., and Chen, L.: Measurement of at-
mospheric amines and ammonia using the high resolution time-
of-flight chemical ionization mass spectrometry, Atmos. Envi-
ron., 102, 249–259, doi:10.1016/j.atmosenv.2014.12.002, 2015.
www.atmos-chem-phys.net/15/1769/2015/ Atmos. Chem. Phys., 15, 1769–1781, 2015