Embed Size (px)
Citation preview
October 22, 2021 Q3 2021 Activity A world leader in gases, technologies and services for Industry and HealthCryocapTM, Normandy, France
Q3 2021 Activity
Strong Sales Growth
Concrete Success in Project Development
Jérôme Pelletan, Group Chief Financial OfficerFrançois Jackow, Executive Vice PresidentMike Graff, Executive Vice President
Paris, October 22, 2021
October 22, 2021 Q3 2021 Activity A world leader in gases, technologies and services for Industry and Health
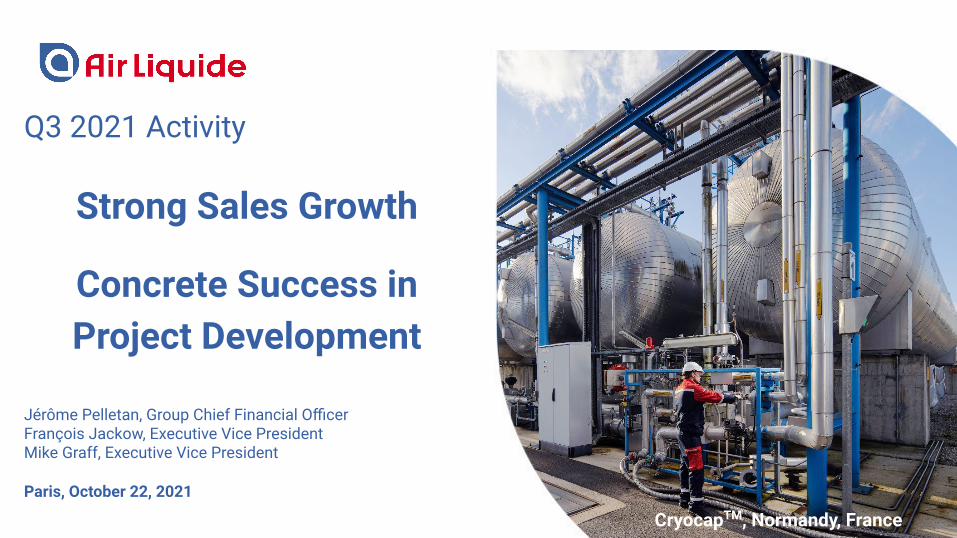
■ Strong comparable sales growth trend continuing in Q3
■ Continued focus on margin improvement and solid cash flow
Q3 2021 Key Highlights
2
■ Business Model designed to tackle energy price volatility
■ Confirmed 2021 guidance
■ Strong momentum in projects activity
■ Key positions taken in Q3 in the Energy Transition
Performance
Outlook
Market
October 22, 2021 Q3 2021 Activity A world leader in gases, technologies and services for Industry and Health
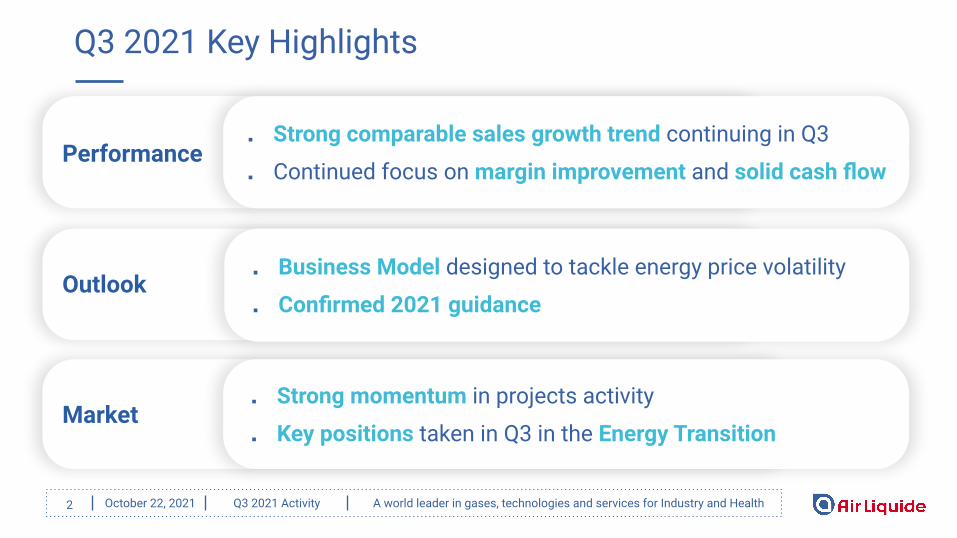
Impacts on Q3 Group Sales:
Record As Published Sales Growth
3
Sales in €m Q3 20 Q3 21 Q3 21/20As published
Q3 21/20Comparable
YTD 21/20Comparable
Gas & Services 4,777 5,585 +16.9% +6.5% +7.5%
Engineering & Construction 60 81 +36.9% +35.1% +54.7%
Global Markets & Technologies 143 168 +16.9% +15.9% +27.9%
Group Total 4,980 5,834 +17.2% +7.1% +8.5%
+0.5% FX
+5%
+8.9% Energy +0.7% Significant Scope(2)
vs. Q3 19(1)
+6%
(1) Vs. 2019: calculated as the sum of the comparable effects of 2020 and 2021 (2) Impact on sales of all acquisitions or disposals of a significant size for the Group
October 22, 2021 Q3 2021 Activity A world leader in gases, technologies and services for Industry and Health
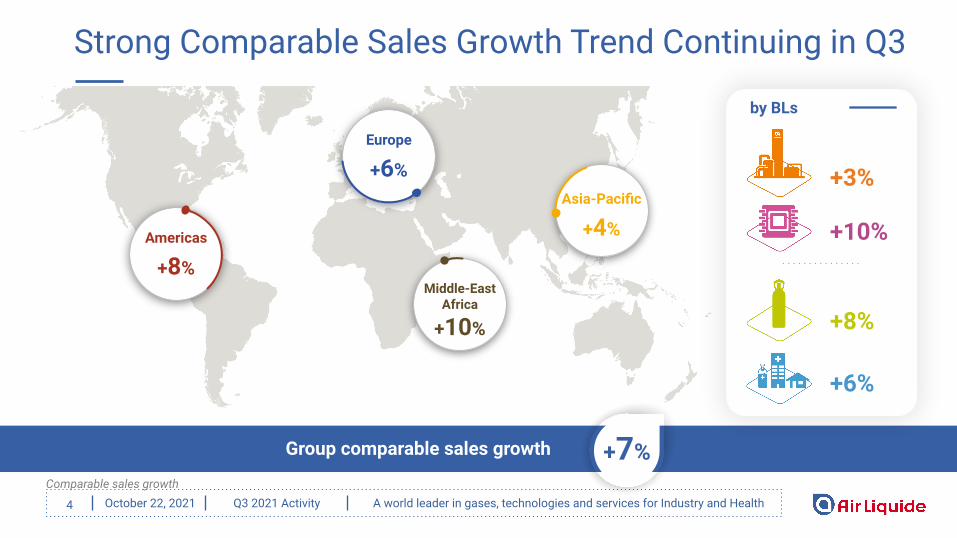
Strong Comparable Sales Growth Trend Continuing in Q3
4
+3%
+6%
+10%
by BLs
Europe
+6%
Americas
+8%Middle-East
Africa
+10%
Asia-Pacific
+4%
Comparable sales growth
Group comparable sales growth +7%
+8%

October 22, 2021 Q3 2021 Activity A world leader in gases, technologies and services for Industry and Health
Improving End-Markets Trends
5
▪ Strong Steel and Chemicals▪ Improving Refining
▪ Growth in all end-markets vs. 2020▪ Markets above 2019 level: Food & Pharma,
Technology & Research, Craftsmen
▪ Dynamic demand from end consumers
▪ High medical O2 for Covid-19, normalizing▪ Sustained growth
ChemicalsSteelRefining
Metal Fab.ConstructionAutomotiveEnergy Food & Pharma
Integrated Circuit
Medical gasesHome Healthcare
✓
✓
✓
✓
✓✓
✓
✓
✓
✓
✓

October 22, 2021 Q3 2021 Activity A world leader in gases, technologies and services for Industry and Health
Business Model Designed to Tackle Energy Price VolatilitySpike of Natural Gas prices
▪ The most energy intensive business line
▪ Energy costs 100% passed through to sales
▪ Indexation in major bulk contracts
▪ Pricing campaigns▪ Time-lag 1 to 6 months
Inflation firming-up
European Natural Gas price - NL-TTF (€/MWh)
6
LI
IM
Source Consensus Forecasts
October 22, 2021 Q3 2021 Activity A world leader in gases, technologies and services for Industry and Health
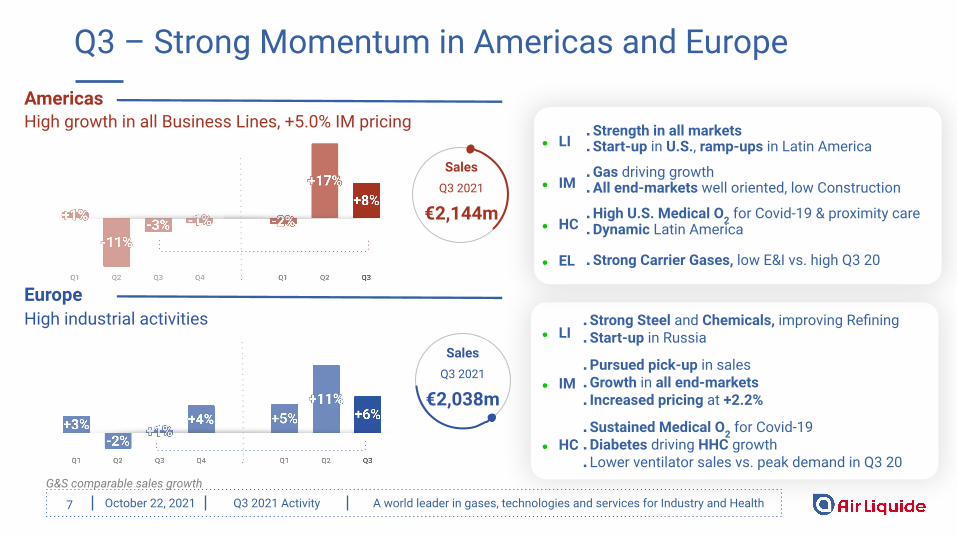
■ Strong Steel and Chemicals, improving Refining■ Start-up in Russia
■ Pursued pick-up in sales■ Growth in all end-markets■ Increased pricing at +2.2%
■ Sustained Medical O2 for Covid-19■ Diabetes driving HHC growth■ Lower ventilator sales vs. peak demand in Q3 20
SalesQ3 2021
€2,144m
■ Strength in all markets■ Start-up in U.S., ramp-ups in Latin America
■ Gas driving growth■ All end-markets well oriented, low Construction
■ High U.S. Medical O2 for Covid-19 & proximity care ■ Dynamic Latin America
■ Strong Carrier Gases, low E&I vs. high Q3 20
High growth in all Business Lines, +5.0% IM pricing
High industrial activities
FY 20: -3.7%
7
● LI
● EL
● IM
● HC
Q3 – Strong Momentum in Americas and Europe Americas
Europe
● LI
● IM
● HC
G&S comparable sales growth
SalesQ3 2021
€2,038m
October 22, 2021 Q3 2021 Activity A world leader in gases, technologies and services for Industry and Health
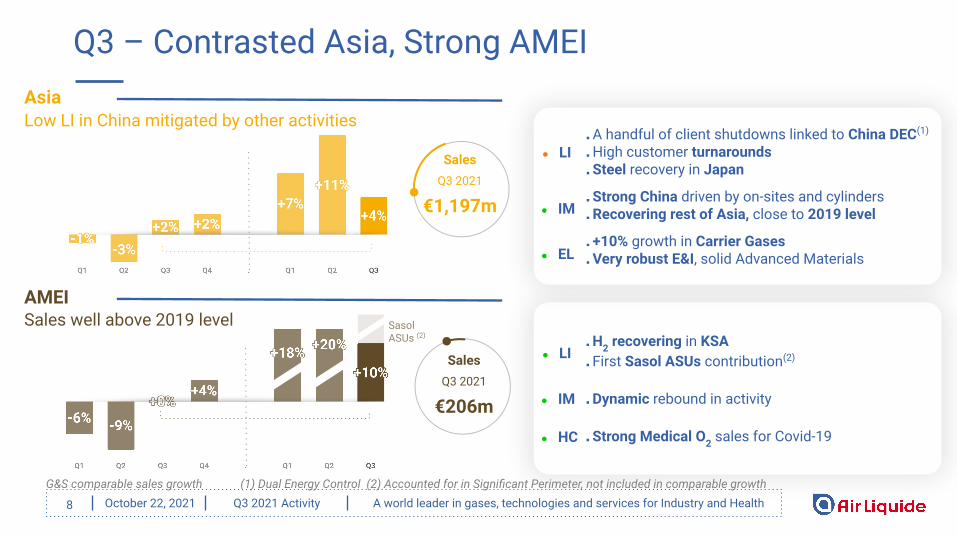
■ H2 recovering in KSA■ First Sasol ASUs contribution(2)
■ Dynamic rebound in activity
■ Strong Medical O2 sales for Covid-19
■ A handful of client shutdowns linked to China DEC(1)
■ High customer turnarounds ■ Steel recovery in Japan
■ Strong China driven by on-sites and cylinders■ Recovering rest of Asia, close to 2019 level
■ +10% growth in Carrier Gases ■ Very robust E&I, solid Advanced Materials
Low LI in China mitigated by other activities
Sales well above 2019 level
8
Q3 – Contrasted Asia, Strong AMEI Asia
AMEI
SalesQ3 2021
€1,197m
SalesQ3 2021
€206m
● LI
● IM
● EL
● LI
● IM
● HC
H1 21: +8.7%
G&S comparable sales growth (1) Dual Energy Control (2) Accounted for in Significant Perimeter, not included in comparable growth
Sasol ASUs (2)

October 22, 2021 Q3 2021 Activity A world leader in gases, technologies and services for Industry and Health
SalesQ3 2021
€1,743m
SalesQ3 2021
€537m
Q3 – Contrasted LI, Buoyant EL
High global activity, low China
9
● Strong Steel & Chemicals, improving Refining in Europe and U.S.
● High contribution from start-ups and ramp-ups
● A handful of client shutdowns linked to China DEC(1)
● Several customer turnarounds
Large Industries
H1 21: +7.3%
Start-ups in Carrier Gases and high E&I
● >+10% growth in Carrier Gases in all regions
● High E&I sales in Singapore and Taiwan
● Solid growth in Advanced and Specialty Materials
Electronics
H1 21: +4.7%
G&S comparable sales growth (1) Dual Energy Control
October 22, 2021 Q3 2021 Activity A world leader in gases, technologies and services for Industry and Health
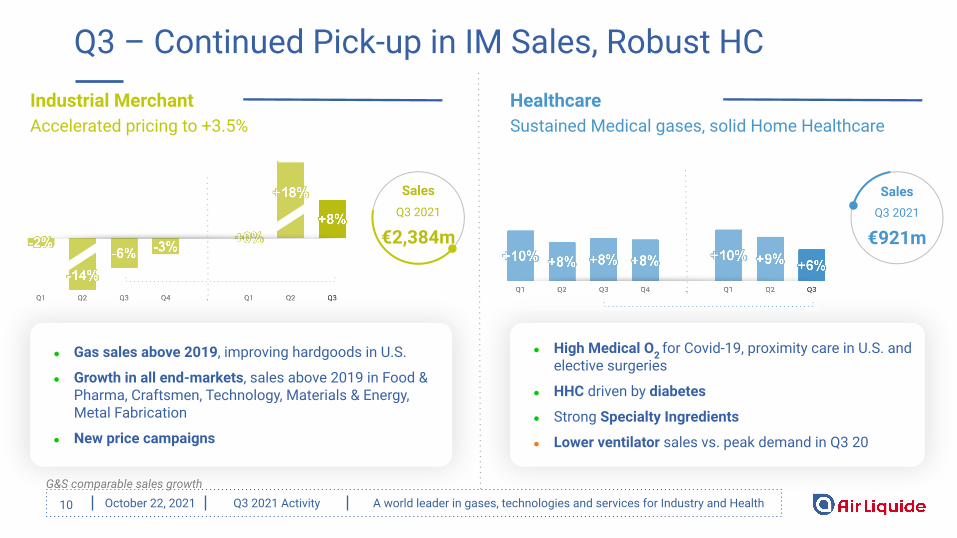
Q3 – Continued Pick-up in IM Sales, Robust HC
10
G&S comparable sales growth
SalesQ3 2021
€2,384m
H1 21: +8.5%
Accelerated pricing to +3.5%
● Gas sales above 2019, improving hardgoods in U.S.
● Growth in all end-markets, sales above 2019 in Food & Pharma, Craftsmen, Technology, Materials & Energy, Metal Fabrication
● New price campaigns
Industrial Merchant
SalesQ3 2021
€921m
● High Medical O2 for Covid-19, proximity care in U.S. and elective surgeries
● HHC driven by diabetes
● Strong Specialty Ingredients
● Lower ventilator sales vs. peak demand in Q3 20
Sustained Medical gases, solid Home Healthcare Healthcare
H1 21: +9.4%
October 22, 2021 Q3 2021 Activity A world leader in gases, technologies and services for Industry and Health
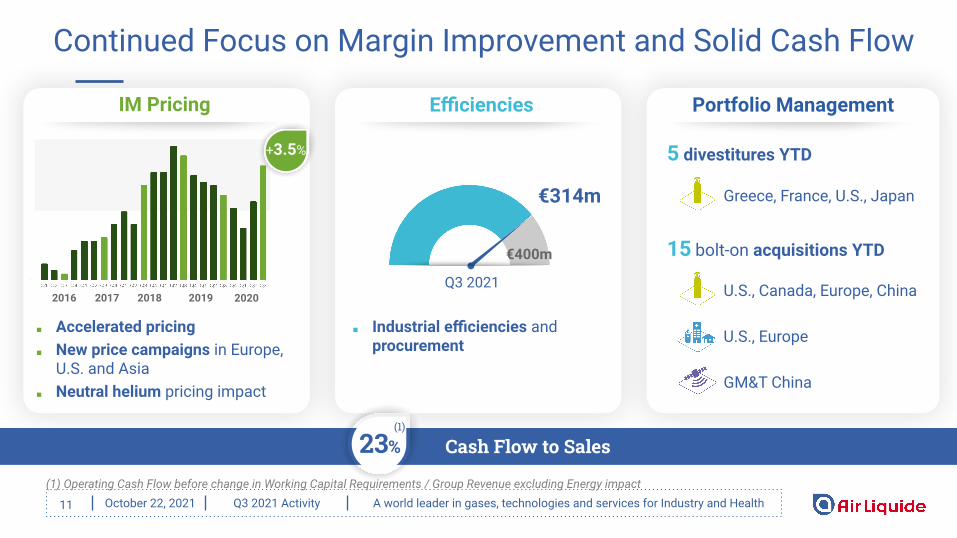
5 divestitures YTD
Greece, France, U.S., Japan
15 bolt-on acquisitions YTD
U.S., Canada, Europe, China
U.S., Europe
GM&T China
2016 2017 2018 2019 2020
■ Accelerated pricing■ New price campaigns in Europe,
U.S. and Asia■ Neutral helium pricing impact
■ Industrial efficiencies and procurement
IM Pricing Portfolio ManagementEfficiencies
11
Continued Focus on Margin Improvement and Solid Cash Flow
€314m
€400m
Q3 2021
+3.5%
Cash Flow to Sales 23%(1)
(1) Operating Cash Flow before change in Working Capital Requirements / Group Revenue excluding Energy impact
October 22, 2021 Q3 2021 Activity A world leader in gases, technologies and services for Industry and Health
Confirmed 2021 Guidance
12
Guidance
“Air Liquide is confident in its ability to further increase
its operating margin and to deliver recurring net profit(1)
growth, at constant exchange rates.”
(1) Excluding exceptional and significant items that have no impact on the operating income recurring. Excluding the impact of any US tax reform in 2021.

October 22, 2021 Q3 2021 Activity A world leader in gases, technologies and services for Industry and Health
Investment Opportunities(1) Investment Backlog(1) Investment Decisions(1)
13
(1) See definitions in appendix
Strong Momentum in Projects Activity, High Quality Backlog
Rising investment opportunities■ >40% in Energy Transition ■ High share of EL projects■ ~70% in Europe & Asia,
new opportunities in the U.S.
Several takeovers
High level of decisions
■ 1 major LI Energy Transition project ■ Several EL and Biogas projects
Strong Backlog■ Increasing share of projects linked
to Energy Transition
€1.1bn of yearly sales after full ramp-up
€1.3bn
FinancialIndustrialSasol ASUs Takeover
October 22, 2021 Q3 2021 Activity A world leader in gases, technologies and services for Industry and Health
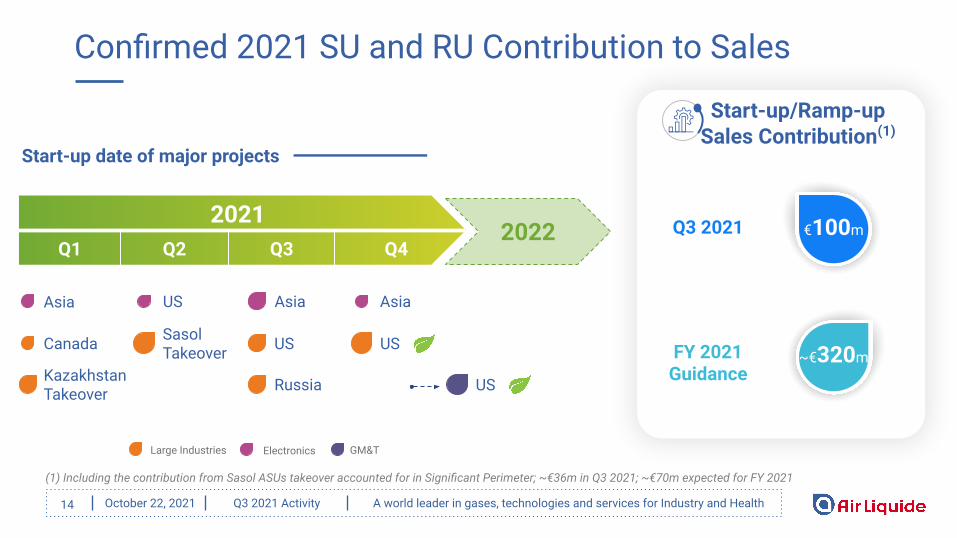
Confirmed 2021 SU and RU Contribution to Sales
14
Start-up/Ramp-upSales Contribution(1)
FY 2021 Guidance
Q3 2021
Asia
US
US
Asia
Kazakhstan Takeover
US
Asia
Canada
Russia
US
Start-up date of major projects
~€320m
€100m
(1) Including the contribution from Sasol ASUs takeover accounted for in Significant Perimeter; ~€36m in Q3 2021; ~€70m expected for FY 2021
SasolTakeover
Start-up date of major projects2021Q1 Q2 Q3 Q4
2022
Large Industries Electronics GM&T
October 22, 2021 Q3 2021 Activity A world leader in gases, technologies and services for Industry and Health
15
15
Concrete Success in Project Development
François JackowExecutive Vice President
October 22, 2021 Q3 2021 Activity A world leader in gases, technologies and services for Industry and Health
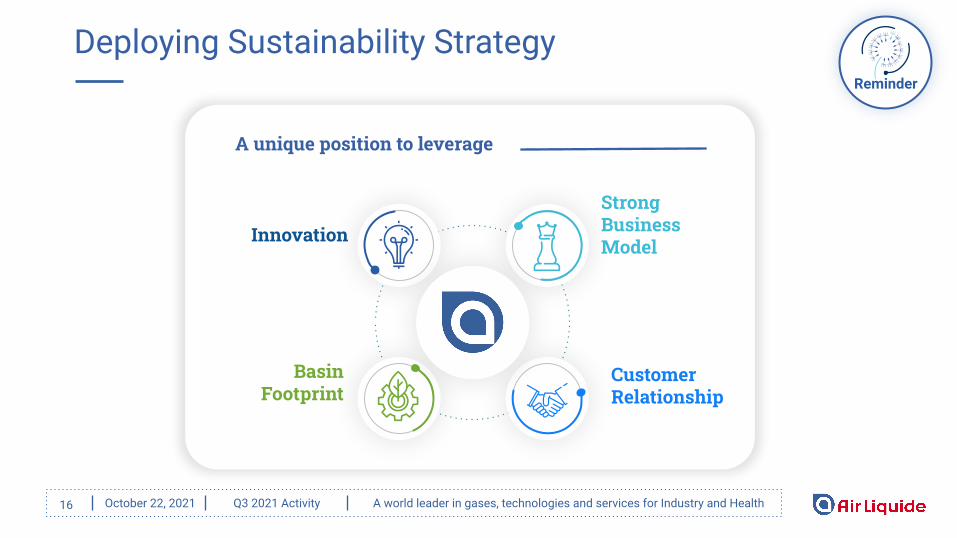
Deploying Sustainability Strategy
16
A unique position to leverage
Innovation
Strong Business Model
BasinFootprint
CustomerRelationship
Reminder

October 22, 2021 Q3 2021 Activity A world leader in gases, technologies and services for Industry and Health17
Normandy H2 Plant Takeover Project(1): a New Model...
Value for the customer▪ Over-The-Fence benefits▪ Reduction of Scope 1▪ Monetization of low-carbon products to end-customers
Value for Air Liquide▪ Extension of LI business Model▪ Reduction of Scope 1 when CO2 is captured▪ Leverage on existing assets
H2
SMR Takeover from
Existing SMR with CCUH2
Connection to the Pipeline
Adding the value of the Over-The-Fence supply... … to a joint commitment for CO2 reduction
▪ Carbon Capture investment by 2030
▪ Transportation and Storage chain
(1) Subject to social process completion CCU: Carbon Capture and Usage
Carbon capture
October 22, 2021 Q3 2021 Activity A world leader in gases, technologies and services for Industry and Health
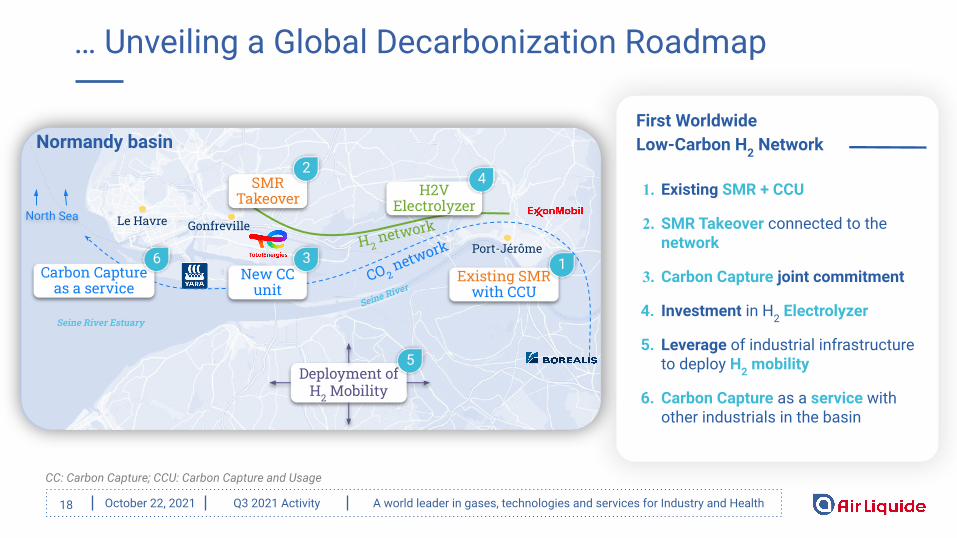
… Unveiling a Global Decarbonization Roadmap
18
Port-Jérôme
Le Havre
Seine River Estuary
Seine River
Gonfreville
1. Existing SMR + CCU
2. SMR Takeover connected to the network
3. Carbon Capture joint commitment
4. Investment in H2 Electrolyzer
5. Leverage of industrial infrastructure to deploy H2 mobility
6. Carbon Capture as a service with other industrials in the basin
First Worldwide Low-Carbon H2 Network Normandy basin
CO 2 network
Deployment of H2 Mobility
5
Existing SMR with CCU
1
North Sea
H2 network
H2V Electrolyzer
4
Carbon Capture as a service
6
SMR Takeover
2
New CC unit
3
CC: Carbon Capture; CCU: Carbon Capture and Usage
October 22, 2021 Q3 2021 Activity A world leader in gases, technologies and services for Industry and Health
2
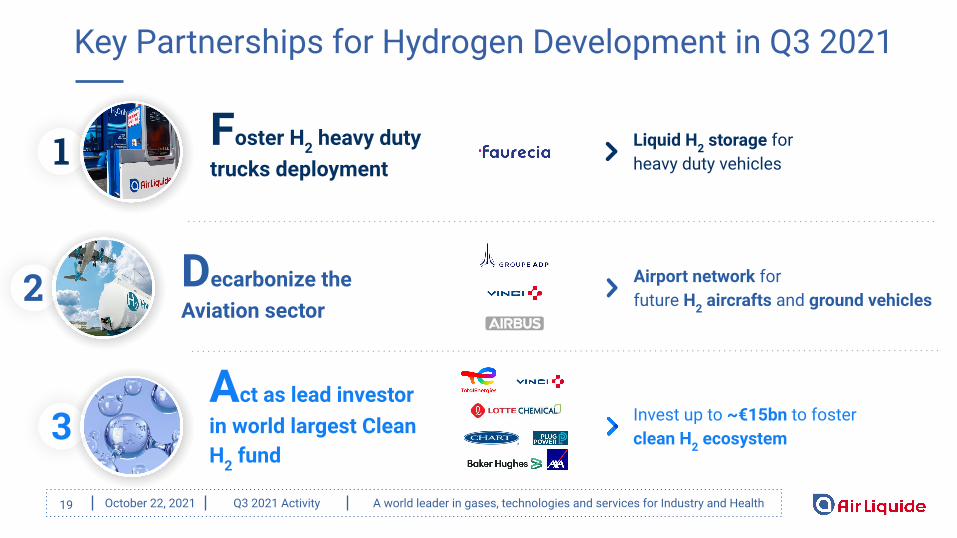
Key Partnerships for Hydrogen Development in Q3 2021
19
3
Decarbonize the Aviation sector
Airport network for future H2 aircrafts and ground vehicles
Liquid H2 storage for heavy duty vehicles
Invest up to ~€15bn to foster clean H2 ecosystem
H2 for ground vehicles and on board aircraft
1 Foster H2 heavy duty trucks deployment
Act as lead investorin world largest Clean H2 fund

October 22, 2021 Q3 2021 Activity A world leader in gases, technologies and services for Industry and Health
Delivering Short Term and Preparing the Future
20
■ Strong comparable sales growth trend continuing in Q3
■ Confirmed 2021 guidance
■ High momentum in projects activity and Energy Transition
October 22, 2021 Q3 2021 Activity A world leader in gases, technologies and services for Industry and Health
Appendix
21
October 22, 2021 Q3 2021 Activity A world leader in gases, technologies and services for Industry and Health
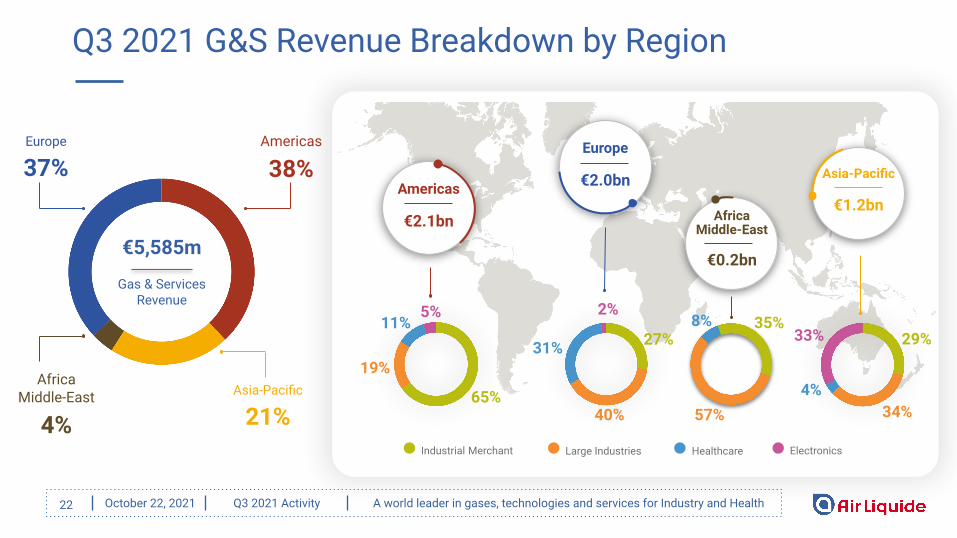
Large Industries Electronics HealthcareIndustrial Merchant
€5,585m
Gas & ServicesRevenue
Q3 2021 G&S Revenue Breakdown by Region
22
Americas
38%Europe
37%
Asia-Pacific
21%
Africa Middle-East
4%
5% 2%33%
65%
27% 29%
19%
40% 34%
11%31%
4%
Americas
€2.1bn
Europe
€2.0bn Asia-Pacific
€1.2bnAfrica
Middle-East
€0.2bn
35%
57%
8%
October 22, 2021 Q3 2021 Activity A world leader in gases, technologies and services for Industry and Health
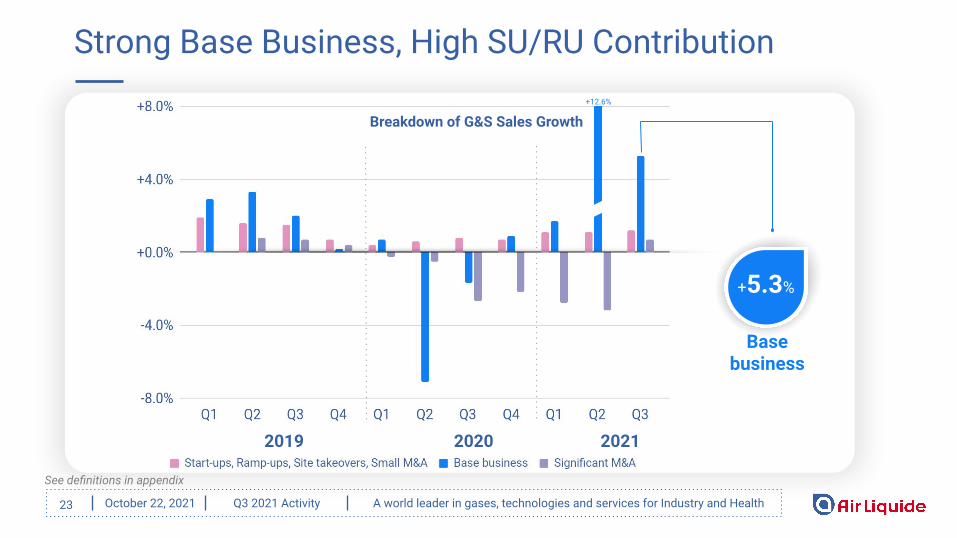
+5.3%
Base business
23
Strong Base Business, High SU/RU Contribution
2019 2020 2021
Breakdown of G&S Sales Growth
See definitions in appendix
+12.6%
October 22, 2021 Q3 2021 Activity A world leader in gases, technologies and services for Industry and Health
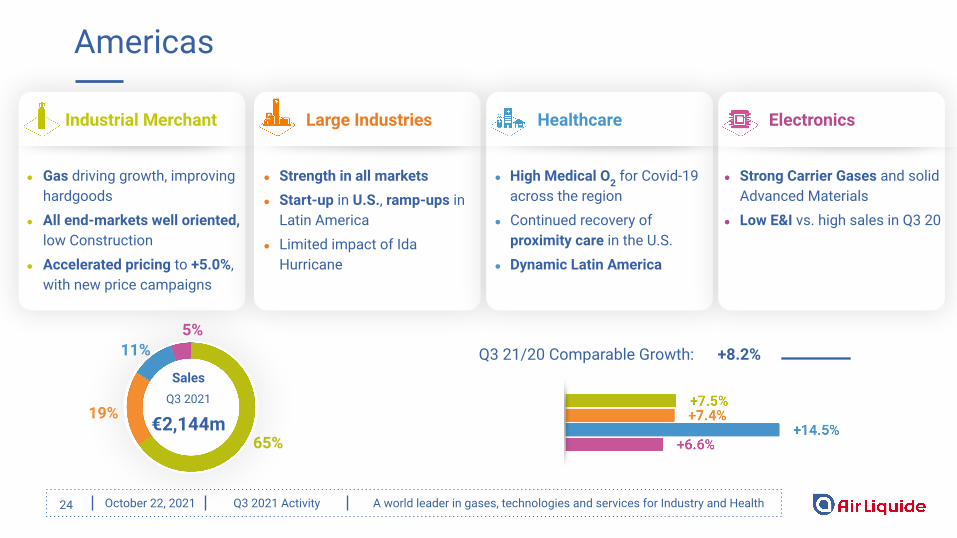
Americas
5%
24
Industrial Merchant
● Gas driving growth, improving hardgoods
● All end-markets well oriented, low Construction
● Accelerated pricing to +5.0%, with new price campaigns
Large Industries
● Strength in all markets● Start-up in U.S., ramp-ups in
Latin America● Limited impact of Ida
Hurricane
Healthcare
● High Medical O2 for Covid-19 across the region
● Continued recovery of proximity care in the U.S.
● Dynamic Latin America
Electronics
● Strong Carrier Gases and solid Advanced Materials
● Low E&I vs. high sales in Q3 20
SalesQ3 2021
€2,144m65%
19%
11% Q3 21/20 Comparable Growth: +8.2%

October 22, 2021 Q3 2021 Activity A world leader in gases, technologies and services for Industry and Health
● Pursued pick-up in sales, above 2019 level● Growth in all end-markets, driven by Metal
Fabrication and Materials & Energy ● Strong Eastern Europe● Increased pricing at +2.2%, launch of new
price campaigns
● Strong Steel and Chemicals ● Improving Refining driving higher H2
volumes● Start-up in Russia, ramp-up in
Kazakhstan
● Sustained Medical O2 for Covid-19 & elective surgeries
● Diabetes driving HHC growth● Strong Speciality Ingredients● Lower ventilator sales vs. peak demand
in Q3 20
Industrial Merchant Large Industries Healthcare
Q3 21/20 Comparable Growth: +5.8%
Europe
25
SalesQ3 2021
€2,038m
40%
2%
31%
27%
October 22, 2021 Q3 2021 Activity A world leader in gases, technologies and services for Industry and Health
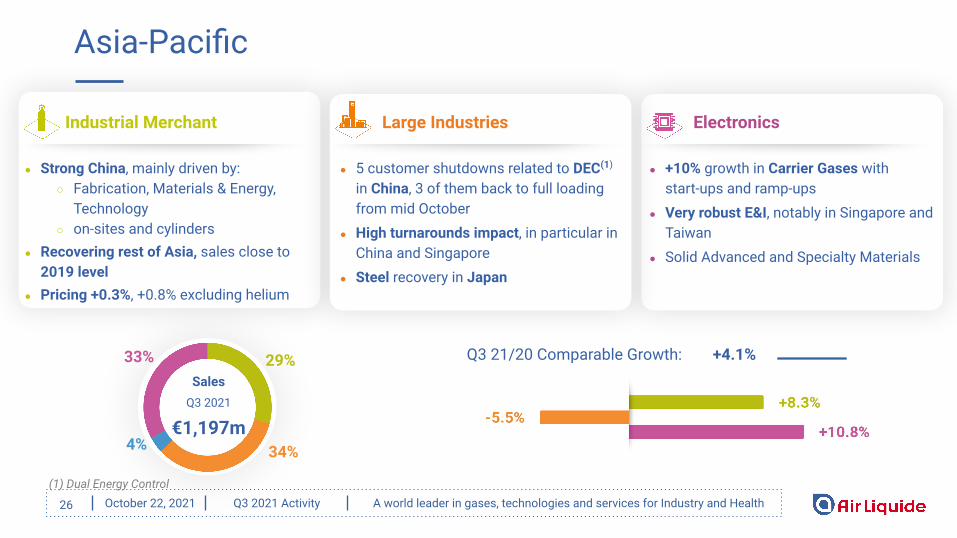
Q3 21/20 Comparable Growth: +4.1%
Electronics
● Strong China, mainly driven by:○ Fabrication, Materials & Energy,
Technology○ on-sites and cylinders
● Recovering rest of Asia, sales close to 2019 level
● Pricing +0.3%, +0.8% excluding helium
● 5 customer shutdowns related to DEC(1) in China, 3 of them back to full loading from mid October
● High turnarounds impact, in particular in China and Singapore
● Steel recovery in Japan
● +10% growth in Carrier Gases with start-ups and ramp-ups
● Very robust E&I, notably in Singapore and Taiwan
● Solid Advanced and Specialty Materials
Industrial Merchant Large Industries
Asia-Pacific
26
SalesQ3 2021
€1,197m
29%
34%
33%
4%
(1) Dual Energy Control
October 22, 2021 Q3 2021 Activity A world leader in gases, technologies and services for Industry and Health
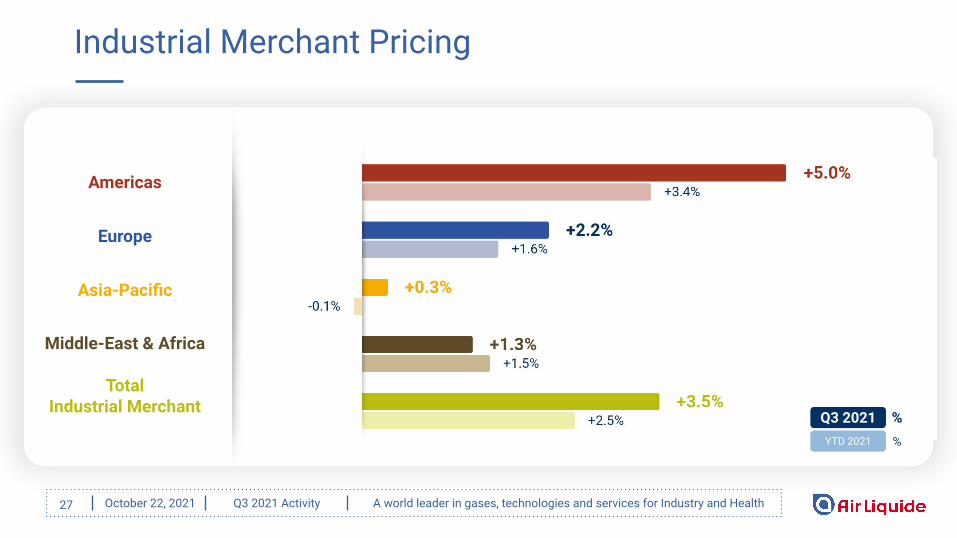
Industrial Merchant Pricing
Americas
Europe
Asia-Pacific
Middle-East & Africa
TotalIndustrial Merchant
27
%%
Q3 2021YTD 2021

October 22, 2021 Q3 2021 Activity A world leader in gases, technologies and services for Industry and Health
▪ Strong momentum of order intake
▪ Sustained level of sales vs. low Q3 20
Engineering & Construction
High Q3 2021 E&C and GM&T Activities
28
€300m
▪ Strong order intake vs. low Q3 20
▪ High sales growth, driven by biogas, high comparison basis in Q3 20
Global Markets & Technologies
€185m
Climate Objectives cascaded down in the field in addition to financial targets
+80%+159%
(1) Including internal sales
€81m €168m
Comparable sales growth Comparable sales growth
Total Sales(1) in Q3 21 +33%
October 22, 2021 Q3 2021 Activity A world leader in gases, technologies and services for Industry and Health
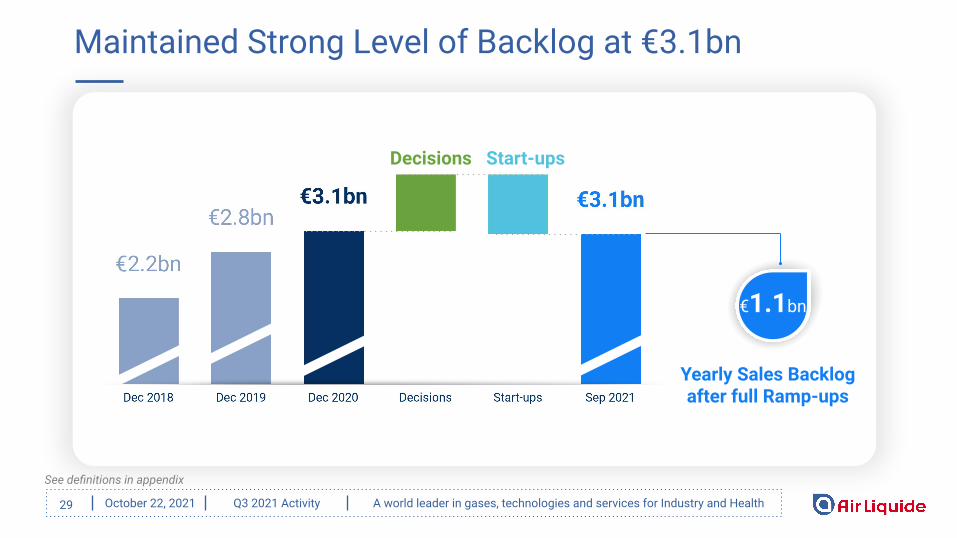
€1.1bn
29
Maintained Strong Level of Backlog at €3.1bn
See definitions in appendix
Start-upsDecisions
Yearly Sales Backlogafter full Ramp-ups

October 22, 2021 Q3 2021 Activity A world leader in gases, technologies and services for Industry and Health
Energy Price Increase, Passthrough Example
30
Sales
OIR
OIR / Sales
Costs
2020 base (€m)
20,485
3,790
18.5%
-16,695
Example with Energy price increase of €100m
+100
0
-10bps
-100
Modelling of 2020 base after Energy impact (€m)
20,585
3,790
18.4%
-16,795
Dilution of OIR / “as published” sales ratio
Operational performance : OIR / (As published Sales - Energy passthrough effect)
Inflated “as published” sales No Impact on OIR in value
As published simplified P&L
OIR: Operating Income Recurring
October 22, 2021 Q3 2021 Activity A world leader in gases, technologies and services for Industry and Health
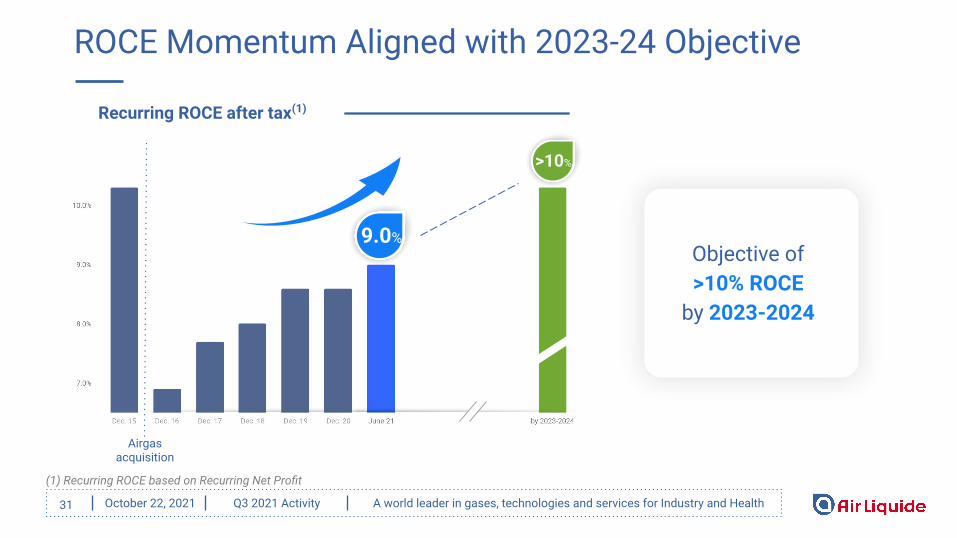
ROCE Momentum Aligned with 2023-24 Objective
31
(1) Recurring ROCE based on Recurring Net Profit
>10%
Objective of >10% ROCE
by 2023-2024
Recurring ROCE after tax(1)
9.0%
Airgas acquisition

October 22, 2021 Q3 2021 Activity A world leader in gases, technologies and services for Industry and Health
Impact of Currency and Energy on G&S Revenue
32
in €m Q1 20 Q2 20 Q3 20 Q4 20 Q1 21 Q2 21 Q3 21
€/USD +55 +30 (86) (126) (165) (169) (19)
€/JP¥ +11 +11 (11) (9) (14) (25) (10)
€/ARS (16) (23) (10) (26) (18) (14) (4)
€/BRL (11) (22) (25) (23) (23) (6) +1
Others +1 (26) (66) (62) (46) (6) +54
Currency Impact +40 (30) (198) (246) (266) (220) +22
in €m Q1 20 Q2 20 Q3 20 Q4 20 Q1 21 Q2 21 Q3 21
Natural Gas Impact (103) (135) (61) (18) +133 +171 +342
in €m Q1 20 Q2 20 Q3 20 Q4 20 Q1 21 Q2 21 Q3 21
Electricity Impact (31) (31) (19) (7) +46 +68 +99
October 22, 2021 Q3 2021 Activity A world leader in gases, technologies and services for Industry and Health
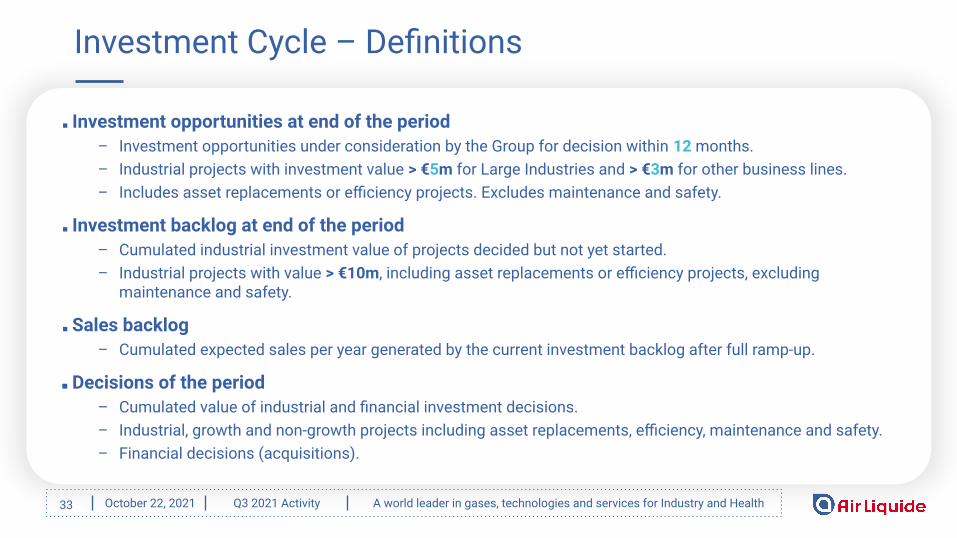
Investment Cycle – Definitions
33
■ Investment opportunities at end of the period– Investment opportunities under consideration by the Group for decision within 12 months.– Industrial projects with investment value > €5m for Large Industries and > €3m for other business lines.– Includes asset replacements or efficiency projects. Excludes maintenance and safety.
■ Investment backlog at end of the period– Cumulated industrial investment value of projects decided but not yet started.– Industrial projects with value > €10m, including asset replacements or efficiency projects, excluding
maintenance and safety.
■ Sales backlog– Cumulated expected sales per year generated by the current investment backlog after full ramp-up.
■ Decisions of the period– Cumulated value of industrial and financial investment decisions.– Industrial, growth and non-growth projects including asset replacements, efficiency, maintenance and safety.– Financial decisions (acquisitions).
October 22, 2021 Q3 2021 Activity A world leader in gases, technologies and services for Industry and Health
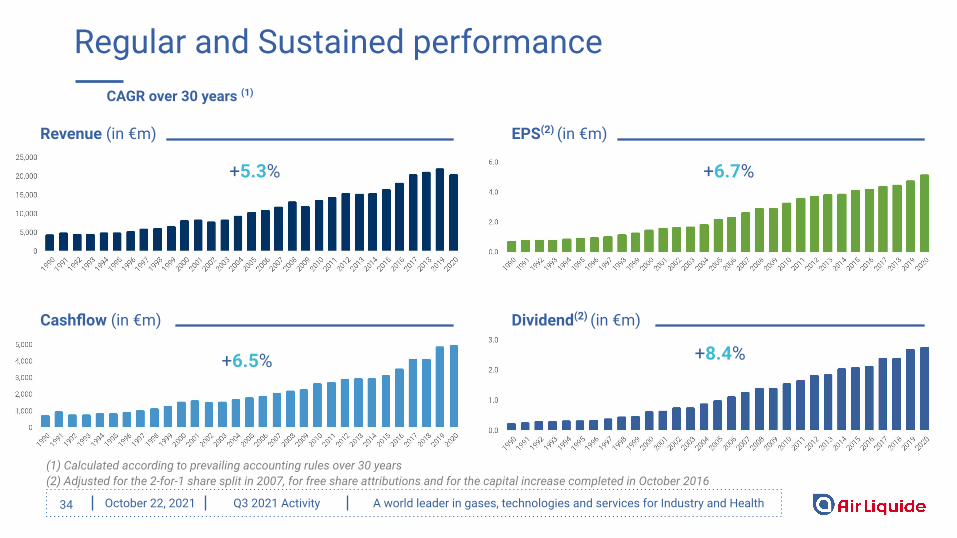
(1) Calculated according to prevailing accounting rules over 30 years (2) Adjusted for the 2-for-1 share split in 2007, for free share attributions and for the capital increase completed in October 2016
34
Regular and Sustained performance
Revenue (in €m)
+5.3%
Cashflow (in €m)
+6.5% +8.4%
+6.7%
EPS(2) (in €m)
Dividend(2) (in €m)
CAGR over 30 years (1)
October 22, 2021 Q3 2021 Activity A world leader in gases, technologies and services for Industry and Health
For further information, please contact:
35
Investor Relations
✆ +33 (0)1 40 62 51 50
Communication
✆ +33 (0)1 40 62 58 49
www.airliquide.com Follow us on Twitter @AirLiquideGroup
L’Air Liquide S.A.Corporation for the study and application of processes developed by Georges Claude with registered capital of 2,605,761,719.00 euros
Corporate Headquarters:75, Quai d’Orsay
75321 Paris Cedex 07+33 (0)1 40 62 55 55
RCS Paris 552 096 281
Upcoming events
2021 Full Year Results: February 16, 2022
Capital Markets Day: March 22, 2022
October 22, 2021 Q3 2021 Activity A world leader in gases, technologies and services for Industry and Health36
Disclaimer
This presentation may contain forward-looking statements (including objectives and trends) about Air Liquide’s financial situation, operating results, business activities and strategy.
Although Air Liquide believes that the expectation reflected in such forward-looking statements are reasonable, such statements are not guarantees of future performance. Actual results may differ materially from the forward-looking statements as a result of a number of risks and uncertainties, many of which are outside our control.
Please refer to the most recent Universal Registration Document filed by Air Liquide with the French Autorité des marchés financiers for additional information in relation to such risks and uncertainties.
The information is valid only at the time of writing and Air Liquide does not assume any obligation to update or revise the objectives on the basis of new information or future or other events, subject to applicable regulations.