Embed Size (px)
Citation preview

W. TheobaldUniversity of RochesterLaboratory for Laser Energetics
44th Annual Anomalous Absorption Conference
Estes Park, CO8–13 June 2014
Strong-Shock Generation and Laser–Plasma Interactions for Shock-Ignition Inertial Fusion
High-intensitybeams
Shockwave
Solidtarget 1.0
100
200
300
Absorbed intensity at nc (1015 W/cm2)
Pea
k ab
lati
on
pre
ssu
re (
Mb
ar)
1.5 2.0
1-ns squareShaped pulse (2 ns)Shaped pulse (1.4 ns)
FSC

FSC
High-intensity shock-ignition (SI) experiments on OMEGA provide valuable data on hot-electron production and shock ablation pressure
Summary
• Multiple overlapping high-intensity beams generate an energetic hot-electron distribution (<100 keV) with a conversion efficiency of up to ~10%
• Turning off smoothing by spectral dispersion (SSD) in overlapping high-intensity beam experiments increased the hot-electron fraction and shock strength
• Stimulated Raman scattering (SRS) increases significantly (~5×) when SSD is turned off, while two-plasmon–decay (TPD) is unaffected
• Moderate hot electrons may be beneficial to shock ignition by coupling energy to the outer layer of the imploding capsule
E23174
The inferred ablation pressures of 270 Mbar at ~3 × 10¹⁵ W/cm2 approaches the minimum SI requirement of 300 Mbar.

FSCCollaborators
R. Nora,* M. Lafon, K. S. Anderson, M. Hohenberger, F. J. Marshall, D. T. Michel, T. C. Sangster, W. Seka, A. A. Solodov, C. Stoeckl, B. Yaakobi, and R. Betti*
University of RochesterLaboratory for Laser Energetics
*also Departments of Mechanical Engineering and Physics
A. Casner and C. ReverdinCEA, DAM, DIFArpajon, France
X. Ribeyre and A. ValletCELIA
University of Bordeaux, France
J. PeeblesUniversity of California, San Diego
La Jolla, CA
M. S. WeiGeneral AtomicsSan Diego, CA

Sufficient ablation pressure and Thot < 150 keV must be demonstrated for shock ignition during the ignitor spike
TC8918d
FSC
*R. Betti et al., Phys. Rev. Lett. 98, 155001 (2007).
00
100
200
300
400
5 10Time (ns)
Po
wer
(T
W)
Ignitor spike~5 × 10¹⁵ W/cm2
Standardpulse
Assembly
Spikeshock wave
Returnshock
• Critical issues for shock ignition
– demonstrate ~300- to 400-Mbar spike-generated ablation pressure
– demonstrate hot-electron temperatures of ≤150 keV generated by spike

SI requires minimum ablation pressures of ~300 Mbar; up to ~600 Mbar is required for large ignition margins
E23176
Minimum ablation pressure for SI ~ 2× (PA main drive) ~300 Mbar.Ablation pressure for the National Ignition Facility (NIF) 700-kJ polar-drive (PD) SI design with an ignition threshold factor (ITF) = 4 ~ 600 Mbar.
0.00 0
20
40
60
80
100
120
140PA
1
2
Den
sity
(g
/cm
3 )
3
4
5
6
7
0.5Mass coordinate (mg)
0.00 0
200
400
600
800
PA
20
15
10
5
0.5Mass coordinate (mg)
Main drive beforepower spike
(NIF 700-kJ SI design)*During power spike
Iabs = 6.7 × 10¹⁵ W/cm2cr
Pre
ssu
re (
MB
ar)
PressureDensity
FSC
*K. S. Anderson et al., Phys. Plasmas 20, 056312 (2013).

Laser–plasma interaction during the spike pulse and hot-electron generation are important issues for shock ignition
TC7870i
If the tR is high enough when hot electrons are produced, they will be stopped in the outer regions of the shell.
10.00
2
3
1
4
5
0
40
60
20
80
100
10.5 11.0
Time (ns)
Inte
nsi
ty (
1015
W/c
m2 )
tR
(m
g/c
m2 )
10.20
10
40
30
20
50
60
10.4 10.6
Shock-launching time (ns)
Marginallyigniting
(no hot e–)
Gai
n
tR
tR range of 100-keV e–
IL
Shock-ignition targetwith 350-kJ total energy
Thot = 170 keVEhot/Espike = 0.17
Boostedmargin
(with hot e–)
R. Betti et al., J. Phys., Conf. Ser. 112, 022024 (2008);S. Gus’kov et al., Phys. Rev. Lett. 109, 255004 (2012).
FSC
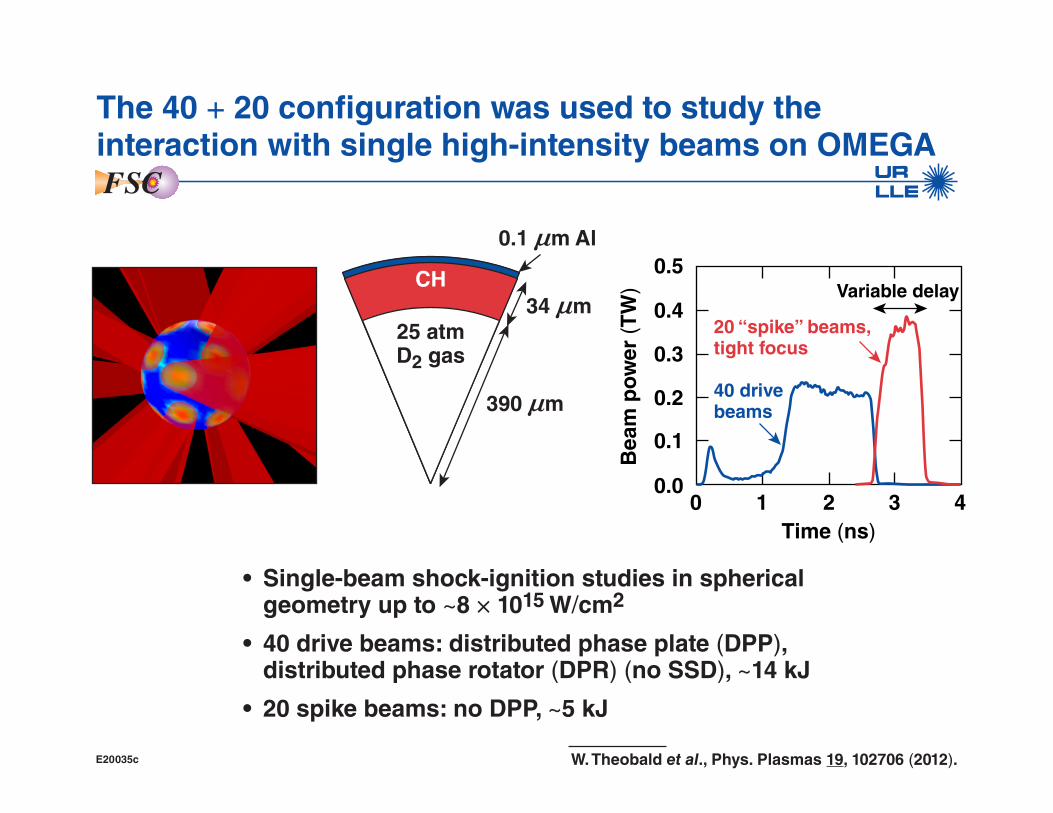
The 40 + 20 configuration was used to study the interaction with single high-intensity beams on OMEGA
E20035c
• Single-beam shock-ignition studies in spherical geometry up to ~8 × 10¹⁵ W/cm2
• 40 drive beams: distributed phase plate (DPP), distributed phase rotator (DPR) (no SSD), ~14 kJ
• 20 spike beams: no DPP, ~5 kJ
0.1
0.2
0.3
0.4
0.5
0.01 2 3 4
Variable delay
40 drivebeams
20 “spike” beams,tight focus
0
Bea
m p
ow
er (
TW
)
Time (ns)
CH
390 nm
34 nm
0.1 nm Al
25 atmD2 gas
FSC
W. Theobald et al., Phys. Plasmas 19, 102706 (2012).

Up to ~12% of the spike energy was converted into a moderate (~30-keV) hot-electron distribution
E23179
• Hot-electron generation in the 40 + 20 experiment is dominated by SRS
• The TPD instability is strongly suppressed
1
0
2
0.5
0.0
1.0 0.7
0.5
0.3
Focus ~140 nm Focus ~220 nm Focus ~580 nm
2.00
20
40
60
2.2Spike onset (ns)
T e (
keV
)
2.4 2.6 2.8 2.00
5
10
20
15
2.2Spike onset (ns)
Ho
t el
ectr
on
s (%
)
2.4 2.6 2.8
~0.9 × 10¹⁵ W/cm2
~1.5 × 10¹⁵ W/cm2
~1.5 × 10¹⁵ W/cm2 (DPP)~3.0 × 10¹⁵ W/cm2
Inte
nsi
ty o
n t
arg
et(×
1015
W/c
m2 )
Inte
nsi
ty o
n t
arg
et(×
1015
W/c
m2 )
Inte
nsi
ty o
n t
arg
et(×
1015
W/c
m2 )
FSC
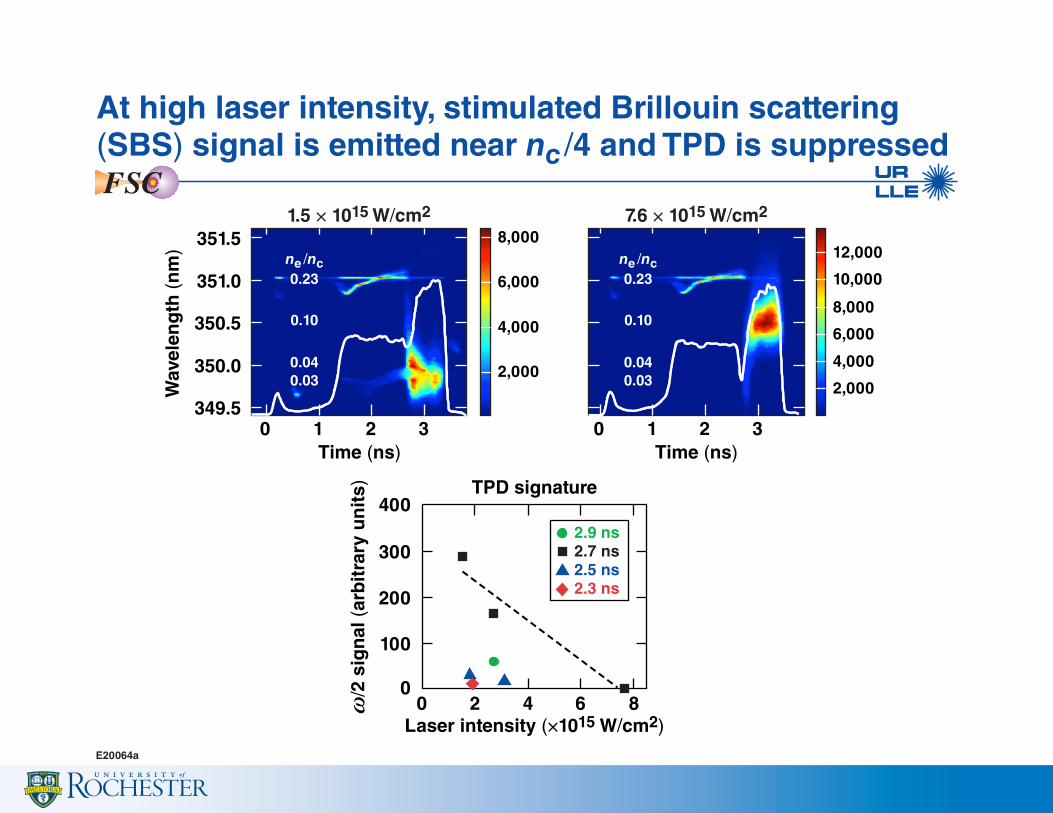
At high laser intensity, stimulated Brillouin scattering (SBS) signal is emitted near nc /4 and TPD is suppressedFSC
1.5 × 10¹⁵ W/cm2
ne /nc0.23
0.10
0.040.03
349.5
350.0
350.5
351.0
351.5 8,000
Wav
elen
gth
(n
m)
100
200
300
400
02 84 60~
/2 s
ign
al (
arb
itra
ry u
nit
s)
Laser intensity (×1015 W/cm2)
TPD signature
0 1 2 3Time (ns)
6,000
4,000
2,000
7.6 × 10¹⁵ W/cm2
ne /nc0.23
0.10
0.040.03
12,000
0 1 2 3Time (ns)
10,000
6,000
8,000
2,000
4,000
2.9 ns2.7 ns2.5 ns2.3 ns
E20064a
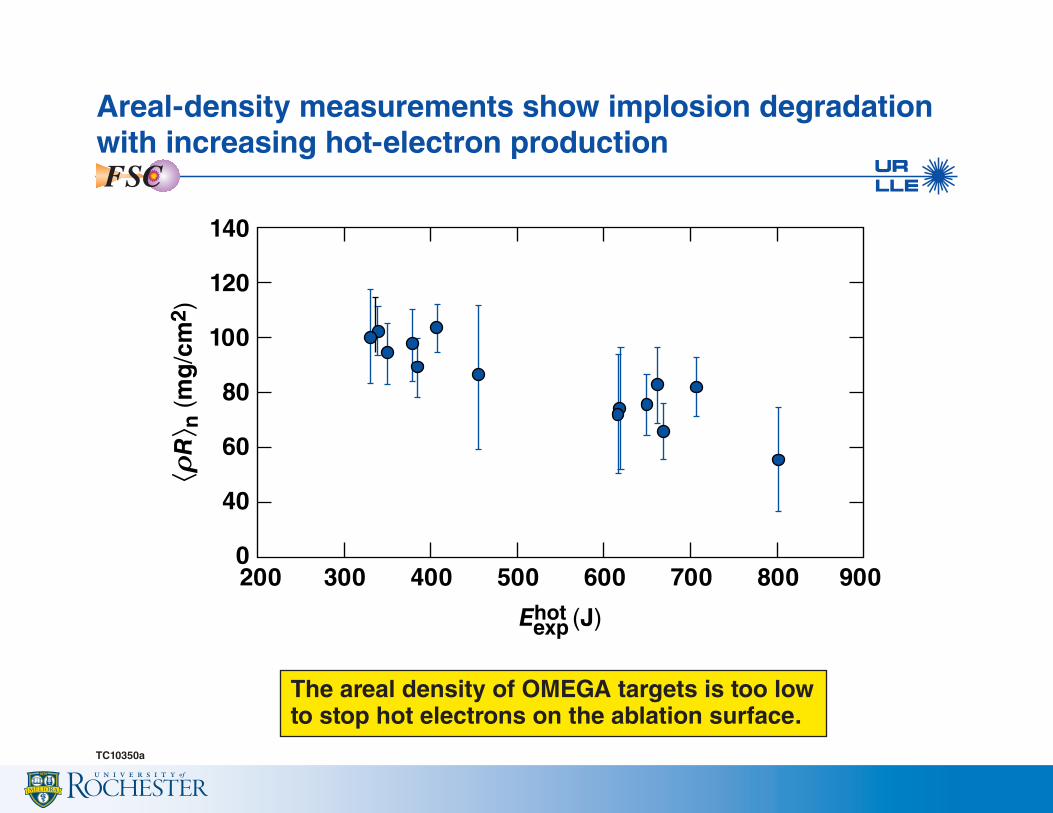
Areal-density measurements show implosion degradation with increasing hot-electron productionFSC
120
140
100
80
60
40
0400300200 500 600 700 800 900
GtRH n
(m
g/c
m2 )
Ehot (J)exp
The areal density of OMEGA targets is too lowto stop hot electrons on the ablation surface.
TC10350a

A laser–plasma interaction experiment was performed in planar geometry with overlapping beams to infer ablation pressure and to study hot-electron generationFSC
Time (ns)
OMEGA pulse shape15
10
5
00 1 2 3
Pea
k in
ten
sity
(×10
14)
W/c
m2
Cone 3
Cone 1Cone 2
40 nmCH 30 nm
Mo138 nmquartz
Hardx rays
VISAR*SOP**
17.5 keVMo Ka
Highintensity
Lowintensity
Laserbackscatter
• Phase plates and DPR’s with ~900-nm focal spots were used in plasma-generating beams (cone 2 and cone 3)
• Phase plates with an ~600-nm focal spot were used in six high-intensity beams (cone 1)
• Ln ~ 350 nm M. Hohenberger et al., Phys. Plasmas 21, 022702 (2014). * Velocity interferometer system for any reflector ** Streaked optical pyrometerE20455e

The hot-electron temperature and hot-electron fraction increase with spike laser intensity
E20783
Co
nver
sio
n e
ffici
ency
(%
)
Spike intensity (×1014 W/cm2)5
1
0
2
10 15
T ho
t (ke
V)
Spike intensity (×1014 W/cm2)5
20
40
80
60
10 15
Bac
ksca
tter
wit
hin
the
foca
l co
nes
(%
)
Spike intensity (×1014 W/cm2)5
0
2
3
1
4
10 15
FSC

FSC
The shock propagation in quartz was observed with SOP and VISAR*
40
30
202 6 84
Time (ns)
Time (ns)
2
6
4
2
04 6 8Te
mp
erat
ure
(eV
)
Sh
ock
vel
oci
ty(n
m/n
s)8
4
0
2000
–200
0 2 4 6 8
VISAR
Laser
2000
–200
Inte
nsi
ty(×
1014
W/c
m2 )
y (n
m)
y (n
m)
SOP
*J. E. Miller et al., Rev. Sci. Instrum. 78, 034903 (2007); P. M. Celliers et al., Rev. Sci. Instrum. 75, 4916 (2004); M. Hohenberger et al., Phys. Plasmas 21, 022702 (2014).E20451a

Two-dimensional DRACO simulations reproduce well the shock dynamics over a range of spike intensities
E20784
• The ablation pressure reaches ~75 Mbar at 1.2 × 10¹⁵ W/cm2
Sh
ock
rea
r b
reak
ou
t (n
s)
Spike intensity (×1014 W/cm2)
646
7
8
108
ExperimentSimulation
12 14 Pea
k ab
lati
on
pre
ssu
re (
Mb
ar)
Spike intensity (×1014 W/cm2)
64
40
20
60
80
108 12 14
Simulation
FSC

Ablation pressures in planar target experiments are limited by lateral heat losses
E23180
Higher ablation pressures can be achieved in spherical geometry.
Heat flux: Q = –lthdT
Target surface
Planar target
z (nm)
r (n
m)
00
200
400
600
800
1000
2000
1500
1000
500
3500
3000
2500
2000
1500
1000
500
y (n
m)
–1000
–500
0
500
1000
200 400 600 800 1000x (nm)
–1000 –500 0 500 1000
Temperature (eV) Temperature (eV)Spherical target
Laser beam
FSC

A new OMEGA platform has been developed to study the generation of strong shocks in spherical targets
E22457a
CH Ti (5%)
CH
OMEGA 60 Framing camera
Streaked x-rayspectrometer
Ti x ray
Ti x ray
430 nm
FSC

The small solid target was irradiated by 60 high-intensity beams equipped with small-spot phase plates
–400 –200
0.00.0
0.2
0.4
0.6
0.5
Time (ns)B
eam
po
wer
(T
W)
1.0 1.5
0
x (nm)
400200
Vertical
DataFit
–400 –200 0
x (nm)
y (n
m)
400
200
0
–200
–400
400200
ETP* with DPR and SSD
–4000.0
1.0
2.0
3.0
Sig
nal
(ar
bit
rary
un
its)
(×10
4 )
–200 0
x (nm)
400200
442 nm
Horizontal
492 nm
1-ns square pulseShaped pulse
E22458a
• Small-spot phase plates
• DPR’s
• SSD
• GIH ~ 3 × 10¹⁵ W/cm2
• Density scale length Ln 4c ~120 nm
*Equivalent target plane
FSC

One-dimensional LILAC simulations predict a strong spherical shock wave that converges in the center of the solid target
E22459a
00.1
1.0
10.0
100.0
100Radius (nm)
Mas
s d
ensi
ty (
g/c
m3 )
200
ns1.441.060.64
010
100
1000
100Radius (nm)
200
0100
1,000
10,000
100Radius (nm)
Sh
ock
pre
ssu
re(M
bar
)
Tem
per
atu
re (
eV)
200
FSC

An x-ray framing camera captured a short x-ray flash at the time when the shock converged in the center
E23233
0
0
200
Corona x-raysfrom laser
400
0
200
y (n
m)
x (nm)
400
0
200
400
1.13 ns1.13 ns 1.18 ns1.18 ns
x-ray flashfrom center of CH ball
1.28 ns
1.34 ns 1.39 ns 1.42 ns
1.44 ns 1.48 ns 1.54 ns
200 400 0 200 400 0 200 400
FSC

The x-ray flash was measured with a streaked x-ray spectrometer
E22461a
FiducialFiducial
1.2
3.4
3.0
2.6
2.2
1.6 2.0Time (ns)
Wav
elen
gth
(A
)
2.4 2.8 2.0 2.5 3.0 3.5
Shaped pulse
1.7
1.9
1.5
1.3
Intensity (1015 W/cm2)
X-r
ay fl
ash
(n
s)
X-ray flashX-ray flashStreak spectrometerFraming camera
FSC

Time (ns)
Ti Hea flash fromstreak camera
Framing-camera imagesfrom target center
Sig
nal
(ar
bit
rary
un
its)
1.3
0
100
200
1.4
53 ps
1.5 1.6 1.7
15 nm
HorizontalFitted curve
–20–40
–40
–20
0
0
x position (nm)
y p
osi
tio
n (n
m)
20
20
40 –400
1
2
Sig
nal
(×
104 )
(ar
bit
rary
un
its)
–20 0 20 4040
The x-ray flash was emitted from a small volume of ~103 nm3 in less than 50 ps
E22462a
FSC
–
–
m m m
ps ps
x 15 12 9
53 40
2 2
2 2
. .n n nD
pst 35. .D
^ ^^ ^
h hh h

Time integrated x-ray spectra reveal strong 1s–2p absorption features from Ti ions of various charge states
E23182
40
3
5
81s–2p absorptionfrom Be- to Ne-like Ti ions
Ti Hea Ti Lya
5Energy (keV)
Inte
nsi
ty (
×10
15 k
eV/k
eV)
6 7
Te ~ 10 to 100 eVSolid density Be- to Ne-like Ti ions
FSC

FSC
One-dimensional simulations reproduce the measured x-ray flash time when the flux limiter is adjusted to match the absorbed laser-power time history
E23184
0.00
5
10
15
20
25
30
0.2 0.4 0.6
Time (ns)
Incident
Measuredabsorbed
Simulated absorbedflux limiter = 0.068
Measured x-ray flash at 1.42 ns
Po
wer
(T
W)
0.8 1.0 1.2 1.4
Shot #69140

The last 400 ps of the laser pulse does not affect the x-ray flash time
E23187
Simulated P(t < t*) constrained by the measured laser absorption and x-ray flash.Simulated Pmax is constrained only by measured absorption.
0.00
50
100
150
200
250 Pmax
0.5
P
1.0
t*
Time (ns)
Ab
lati
on
pre
ssu
re (
Mb
ar)
Ab
lati
on
inte
nsi
ty (
×10
15 W
/cm
2 )
1.5
Shot 69140
2.00.0
0.5
1.0
1.5
2.0Determines x-ray flash
Absorbed laser intensity(absorbed power/critical surface)Simulated ablation pressure compatible with x-ray flash time
FSC

Peak ablation pressures of up to 270 Mbar were inferred from simulations constrained by the observables
E23188
FSC
1.0
100
200
300
Absorbed intensity at nc (1015 W/cm2)
Pea
k ab
lati
on
pre
ssu
re (
Mb
ar)
1.5 2.0
1-ns squareShaped pulse (2 ns)Shaped pulse (1.4 ns)

A plot of the ablation pressure versus the absorbed intensity shows the extrapolation required for theSI 700-kJ NIF point design
E22650a
The ablation pressure in the OMEGA experiments approaches the minimum requirements for SI of 300 Mbar. Demonstration of ~600 Mbar for the SI NIF design may require experiments on the NIF.
Pmin for SI
P ~ Iabs
P ~ Iabs2/3
0
200
400
600
800
1 2
Absorbed laser intensity (×1015 W/cm2)(absorbed power/critical surface area)
Ab
lati
on
pre
ssu
re (
Mb
ar)
3 4 5 6 7
*Spherical experiments PSpherical experiments Pmax
700-kJ NIFSI design
FSC
*K. S. Anderson et al., Phys. Plasmas 20, 056312 (2013).

The two-plasmon–decay (TPD) instability is important for the hot electron generation in the spherical strong-shock experiments
E23189
FSC
0.00.0
0.2
0.4
0.6
0.8
1.0
0.5Time (ns)
No
rmal
ized
val
ues
1.0 1.5
Laser powerHard x-ray signal3/2~ spectral power
~0, k0"
~e1, ke1" "
~e2, ke2
~e1 ~ ~e2 ~ ~0/2ne ~ nc /4
"
~0, k0"
3/2~0, k3/2
~e2, ke2"

Switching the SSD bandwidth off has a significant impact on the laser–plasma interaction
E23190
FSC
• Measured with nine channel imaging-plate diagnostic
• A hotter electron distribution and more hot electrons were produced when SSD was turned off
• Up to ~10% of the laser energy was converted into hot electrons
Off40
50
60
70
SSD
~3 × 10¹⁵ W/cm2
T ho
t (ke
V)
On Off40
500
1000
1500
2000
2500
SSDE
ho
t (J)
On

SRS increases significantly (~5× in FABS) when SSD is turned off*
E23226
700
Wav
elen
gth
(n
m)
650
600
5500 1
Time (ns)
E (arbitrary units) = 291 E (arbitrary units) = 1563
SSD
SRS
72676, FABS30
2
3
log10 (I)
2
1
3
log10 (I)
2
1
0 1Time (ns)
No SSD
72678, FABS30
2
0.210.21
0.170.17
0.130.13
ne /nc
0.210.21
0.170.17
0.130.13
ne /nc
*W. Seka et al., this conference

TPD is largely unaffected by SSD in contrast to backscattered SRS
E23227
720
700
680
238
Wav
elen
gth
(n
m)
Wav
elen
gth
(n
m)
236
234
232230
1.4 1.8 1.4Time (ns) Time (ns)
1.81.0
1.5
1
2
1
2
1.0 1.5
SSD No SSD
~/2 emission
3~/2 emission
1.0
1.0
FABS30 72676FABS30 72676 FABS30 72678FABS30 72678
7267672676 7267872678
1
2
3
1
2
3
E ~/2 (arbitrary units) = 483
ETPD (arbitrary units) = 420 ETPD (arbitrary units) = 328
E ~/2 (arbitrary units) = 445

The SBS backscatter signal is insensitive to SSD
E23228
Wav
elen
gth
(n
m)
351.4
351.0
350.6
0 1Time (ns)
SBBS = 10% (instant) SBBS = 12% (instant)
SSD
SBS
72676, SBS25
351 nm
I14 = 39
2
3
log10 (I)
2
1
3
log10 (I)
2
1
0 1Time (ns)
No SSD
72678, SBS25
2
I14 = 44

The increase in electron production correlates with an increase in the x-ray emission from the target center
E23191
FSC
*F. J. Marshall et al., Phys. Plasmas 5, 1118 (1998).
Time integrated x-ray microscope* data from the core center
Filter: 6.5 mils Be200 × 200-nm region Instrument spatial resolution ~7 nm
GMXI a image Median = 1Gamma = 2
7.5
6.0
4.5
3.0
1.5 0
0
2
–2
4
6
50 100
Ehot = 0.8 kJ
Ehot = 2.2 kJ
Position (nm)A
DU
/100
0150
ImageFit

The x-ray emission strongly increased when SSD was turned off
E23192
FSC
Off10
100
1000
10,000
25×
SSD
I ~ 3 × 10¹⁵ W/cm2
Noise floor
GM
XI s
ign
al (
arb
itra
ry u
nit
s)
On

An earlier flash time was measured when SSD was turned off
E23193
FSC
400 500
SSD off
(70±30) ps
SSD on
600
2.0
2.2
2.4
2.6
2.8
3.0
Diameter (nm)
X-r
ay fl
ash
(n
s)

E23174
Summary/Conclusions
FSC
High-intensity shock-ignition (SI) experiments on OMEGA provide valuable data on hot-electron production and shock ablation pressure
• Multiple overlapping high-intensity beams generate an energetic hot-electron distribution (<100 keV) with a conversion efficiency of up to ~10%
• Turning off smoothing by spectral dispersion (SSD) in overlapping high-intensity beam experiments increased the hot-electron fraction and shock strength
• Stimulated Raman scattering (SRS) increases significantly (~5×) when SSD is turned off, while two-plasmon–decay (TPD) is unaffected
• Moderate hot electrons may be beneficial to shock ignition by coupling energy to the outer layer of the imploding capsule
The inferred ablation pressures of 270 Mbar at ~3 × 10¹⁵ W/cm2 approaches the minimum SI requirement of 300 Mbar.

LILAC simulations indicate that hot electrons greatly enhance the shock pressure
E23271
Laser pulseAblation pressure without ThotAblation pressure with ThotShock pressure without ThotShock pressure with Thot
600
500
400
300
200
100
00.0 0.5 1.0
Time (ns)
Pre
ssu
re (
Mb
ar)
1.5 2.0

The simulated maximum ablation pressure with hot-electron deposition increases more than linear with the laser intensity
E23272
1100
200
300
400
500
2
Absorbed intensity at nc (×1015 W/cm2)
Max
PA
(M
bar
)
3 4
1.3~ Mbar IP 80maxA : abs^ h


![[XLS]minoritywelfare.bih.nic.inminoritywelfare.bih.nic.in/scholarships/PreMatric/Fresh... · Web view1 1000 0 0 1000 2 1000 0 0 1000 3 1000 0 0 1000 4 1000 0 0 1000 5 1000 0 0 1000](https://img.pdfslide.net/doc/110x75/5ab4f6537f8b9a7c5b8c491e/xls-view1-1000-0-0-1000-2-1000-0-0-1000-3-1000-0-0-1000-4-1000-0-0-1000-5-1000.jpg)