Embed Size (px)
Citation preview

Stronger growth, but risks loom large
Ángel Gurría OECD Secretary-General
Álvaro S. Pereira OECD Chief Economist ad interim
OECD ECONOMIC OUTLOOK
Paris, 30 May
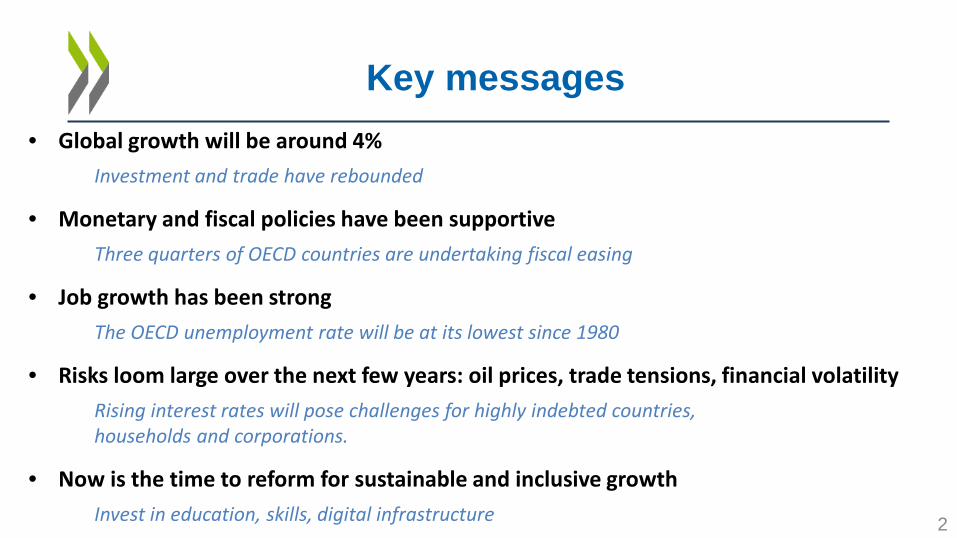
Key messages • Global growth will be around 4%
Investment and trade have rebounded
• Monetary and fiscal policies have been supportive Three quarters of OECD countries are undertaking fiscal easing
• Job growth has been strong The OECD unemployment rate will be at its lowest since 1980
• Risks loom large over the next few years: oil prices, trade tensions, financial volatility Rising interest rates will pose challenges for highly indebted countries, households and corporations.
• Now is the time to reform for sustainable and inclusive growth Invest in education, skills, digital infrastructure 2
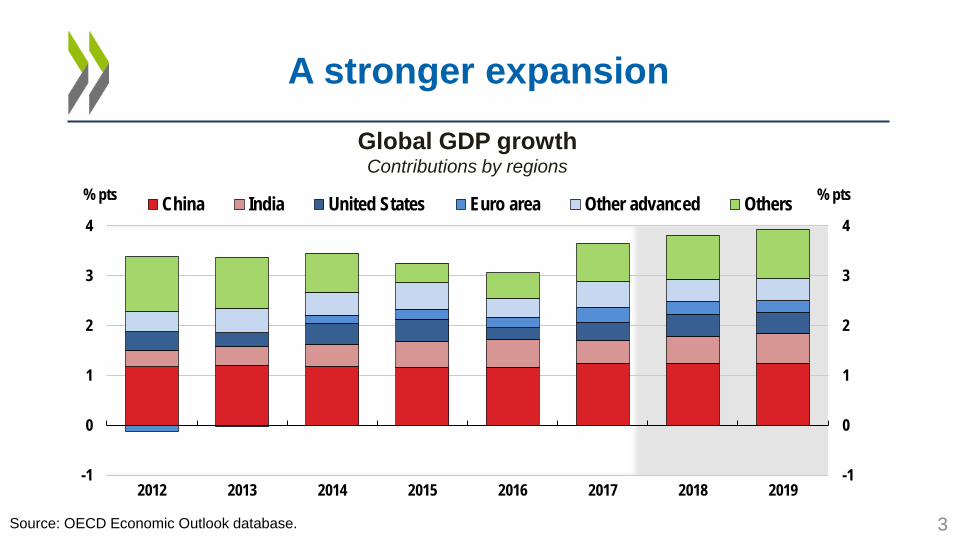
A stronger expansion
Global GDP growth Contributions by regions
Source: OECD Economic Outlook database.
-1
0
1
2
3
4
-1
0
1
2
3
4
2012 2013 2014 2015 2016 2017 2018 2019
% pts % pts China India United States Euro area Other advanced Others
3
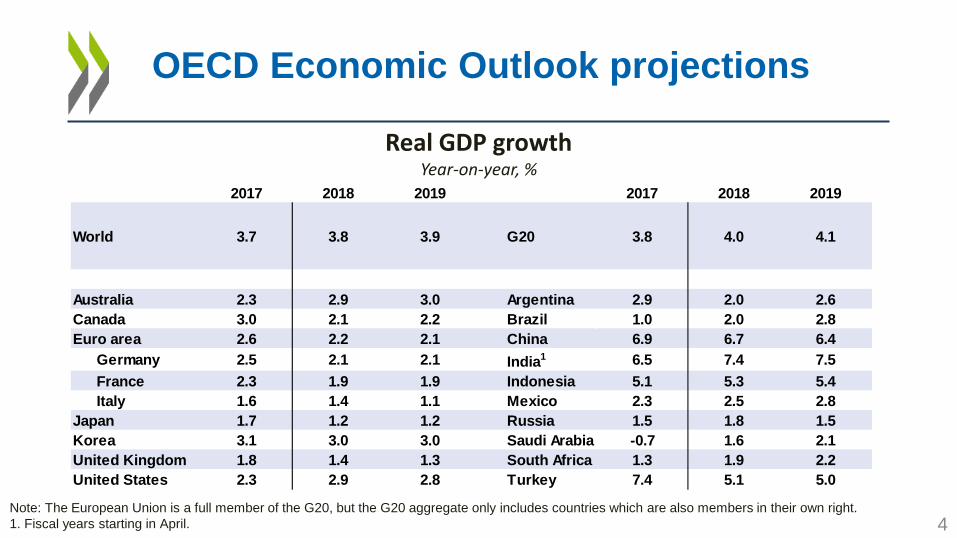
Real GDP growth Year-on-year, %
Note: The European Union is a full member of the G20, but the G20 aggregate only includes countries which are also members in their own right. 1. Fiscal years starting in April. 4
OECD Economic Outlook projections
2017 2018 2019 2017 2018 2019
World 3.7 3.8 3.9 G20 3.8 4.0 4.1
Australia 2.3 2.9 3.0 Argentina 2.9 2.0 2.6Canada 3.0 2.1 2.2 Brazil 1.0 2.0 2.8Euro area 2.6 2.2 2.1 China 6.9 6.7 6.4 Germany 2.5 2.1 2.1 India1 6.5 7.4 7.5 France 2.3 1.9 1.9 Indonesia 5.1 5.3 5.4 Italy 1.6 1.4 1.1 Mexico 2.3 2.5 2.8Japan 1.7 1.2 1.2 Russia 1.5 1.8 1.5Korea 3.1 3.0 3.0 Saudi Arabia -0.7 1.6 2.1United Kingdom 1.8 1.4 1.3 South Africa 1.3 1.9 2.2United States 2.3 2.9 2.8 Turkey 7.4 5.1 5.0
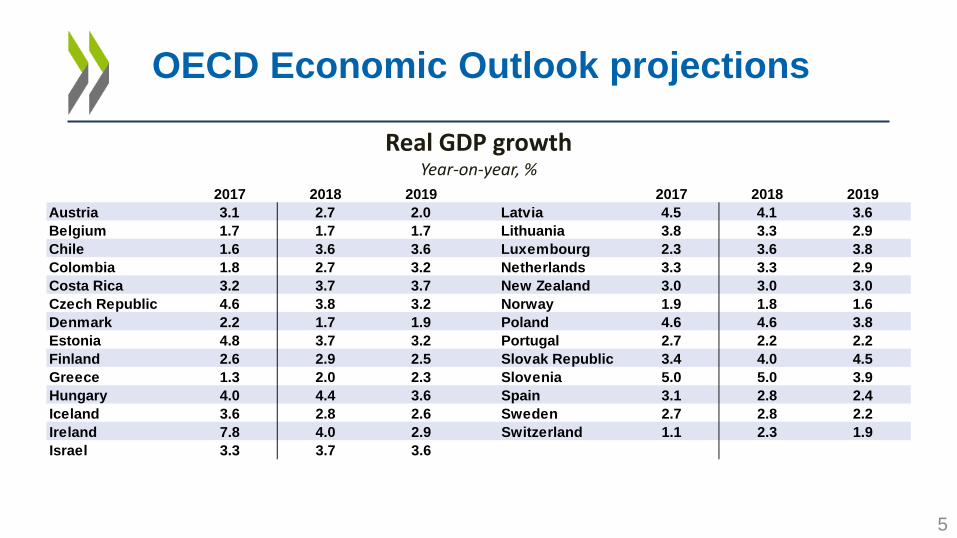
Real GDP growth Year-on-year, %
5
OECD Economic Outlook projections
2017 2018 2019 2017 2018 2019Austria 3.1 2.7 2.0 Latvia 4.5 4.1 3.6Belgium 1.7 1.7 1.7 Lithuania 3.8 3.3 2.9Chile 1.6 3.6 3.6 Luxembourg 2.3 3.6 3.8Colombia 1.8 2.7 3.2 Netherlands 3.3 3.3 2.9Costa Rica 3.2 3.7 3.7 New Zealand 3.0 3.0 3.0Czech Republic 4.6 3.8 3.2 Norway 1.9 1.8 1.6Denmark 2.2 1.7 1.9 Poland 4.6 4.6 3.8Estonia 4.8 3.7 3.2 Portugal 2.7 2.2 2.2Finland 2.6 2.9 2.5 Slovak Republic 3.4 4.0 4.5Greece 1.3 2.0 2.3 Slovenia 5.0 5.0 3.9Hungary 4.0 4.4 3.6 Spain 3.1 2.8 2.4Iceland 3.6 2.8 2.6 Sweden 2.7 2.8 2.2Ireland 7.8 4.0 2.9 Switzerland 1.1 2.3 1.9Israel 3.3 3.7 3.6
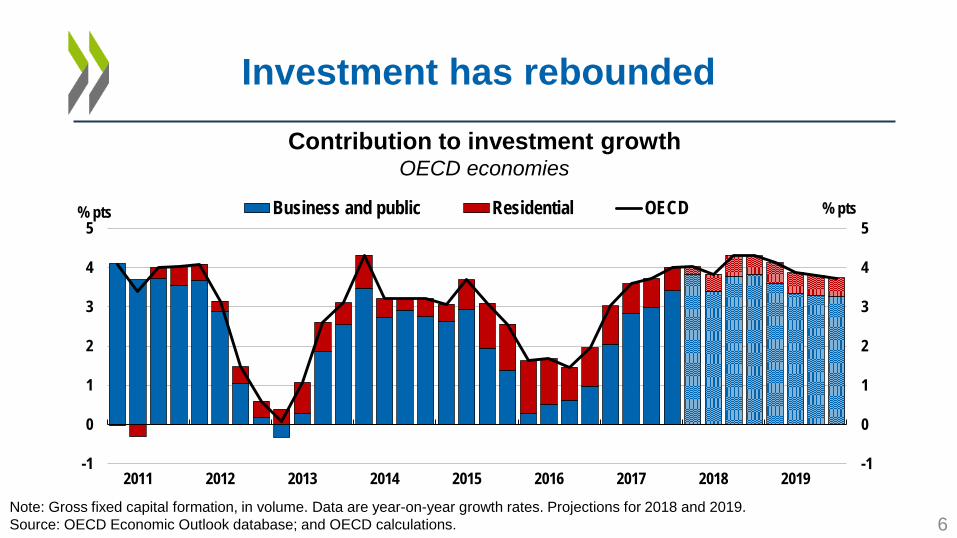
Investment has rebounded Contribution to investment growth
OECD economies
Note: Gross fixed capital formation, in volume. Data are year-on-year growth rates. Projections for 2018 and 2019. Source: OECD Economic Outlook database; and OECD calculations. 6
-1
0
1
2
3
4
5
-1
0
1
2
3
4
5
2011 2012 2013 2014 2015 2016 2017 2018 2019
Business and public Residential OECD% pts % pts
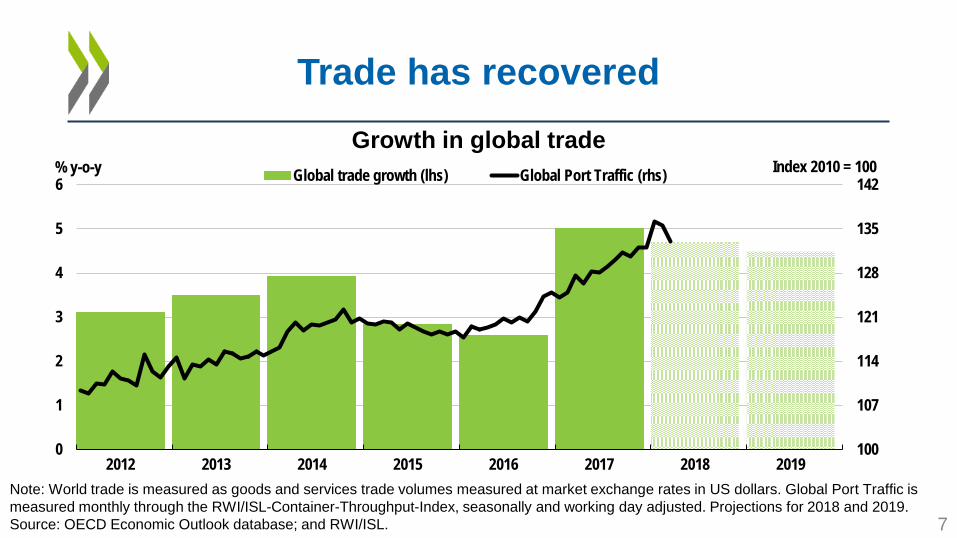
Trade has recovered Growth in global trade
Note: World trade is measured as goods and services trade volumes measured at market exchange rates in US dollars. Global Port Traffic is measured monthly through the RWI/ISL-Container-Throughput-Index, seasonally and working day adjusted. Projections for 2018 and 2019. Source: OECD Economic Outlook database; and RWI/ISL. 7
100
107
114
121
128
135
142
0
1
2
3
4
5
6
2012 2013 2014 2015 2016 2017 2018 2019
Index 2010 = 100 % y-o-y Global trade growth (lhs) Global Port Traffic (rhs)
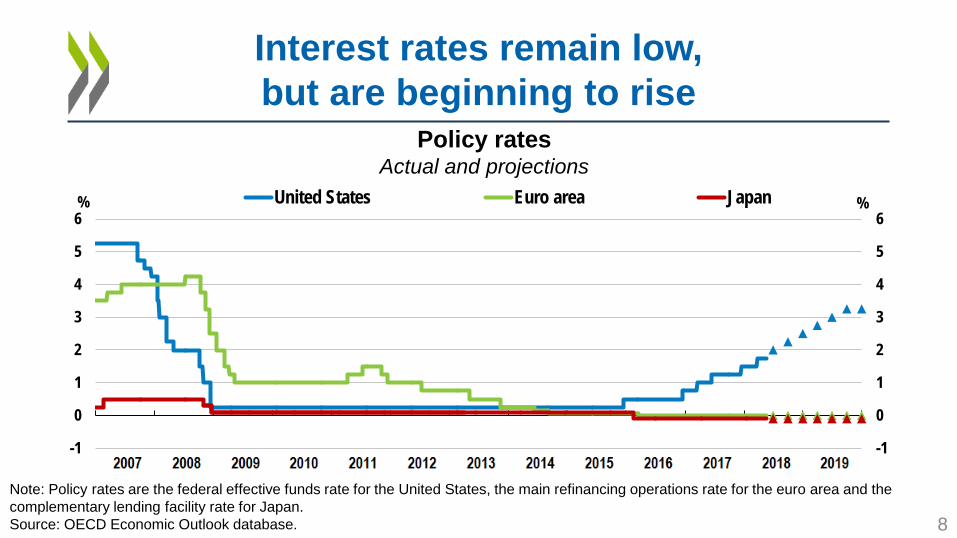
Interest rates remain low, but are beginning to rise
Policy rates Actual and projections
Note: Policy rates are the federal effective funds rate for the United States, the main refinancing operations rate for the euro area and the complementary lending facility rate for Japan. Source: OECD Economic Outlook database. 8
-1
0
1
2
3
4
5
6
-1
0
1
2
3
4
5
6United States Euro area Japan% %
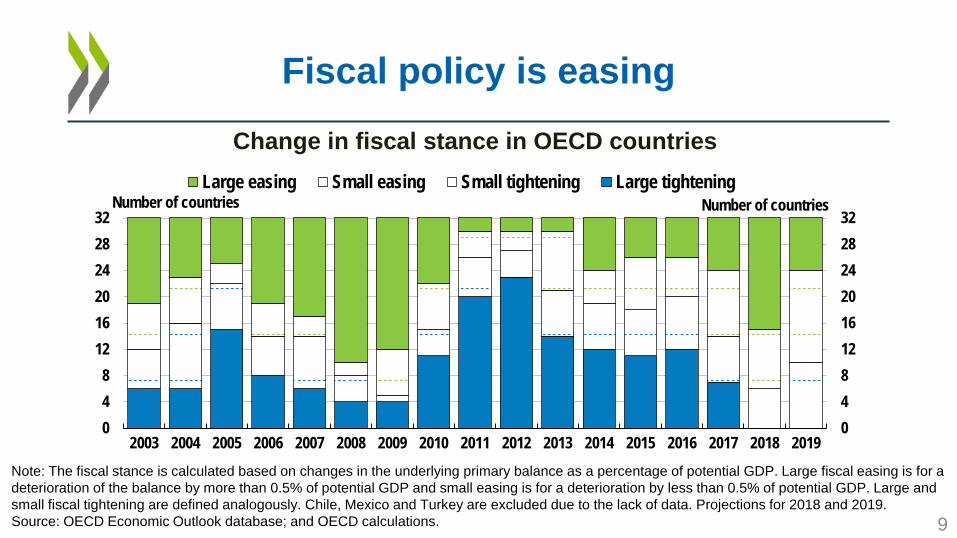
Note: The fiscal stance is calculated based on changes in the underlying primary balance as a percentage of potential GDP. Large fiscal easing is for a deterioration of the balance by more than 0.5% of potential GDP and small easing is for a deterioration by less than 0.5% of potential GDP. Large and small fiscal tightening are defined analogously. Chile, Mexico and Turkey are excluded due to the lack of data. Projections for 2018 and 2019. Source: OECD Economic Outlook database; and OECD calculations.
Change in fiscal stance in OECD countries
Fiscal policy is easing
048121620242832
048
121620242832
2003 2004 2005 2006 2007 2008 2009 2010 2011 2012 2013 2014 2015 2016 2017 2018 2019
Large easing Small easing Small tightening Large tighteningNumber of countries Number of countries
9
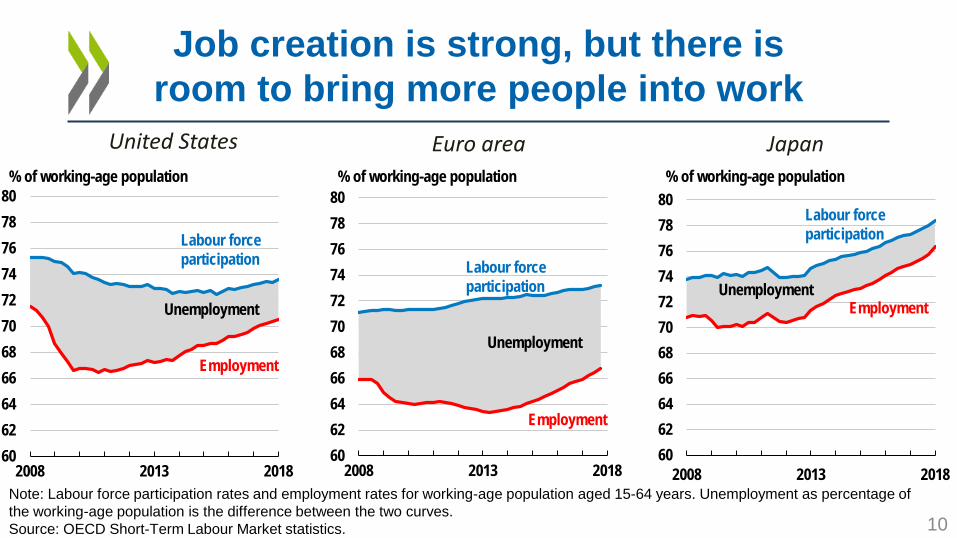
Note: Labour force participation rates and employment rates for working-age population aged 15-64 years. Unemployment as percentage of the working-age population is the difference between the two curves. Source: OECD Short-Term Labour Market statistics.
Job creation is strong, but there is room to bring more people into work
Euro area United States Japan
10
6062646668707274767880
2008 2013 2018
Unemployment
Employment
Labour force participation
% of working-age population
6062646668707274767880
2008 2013 2018
Unemployment Employment
Labour force participation
% of working-age population
6062646668707274767880
2008 2013 2018
Unemployment
Employment
Labour force participation
% of working-age population
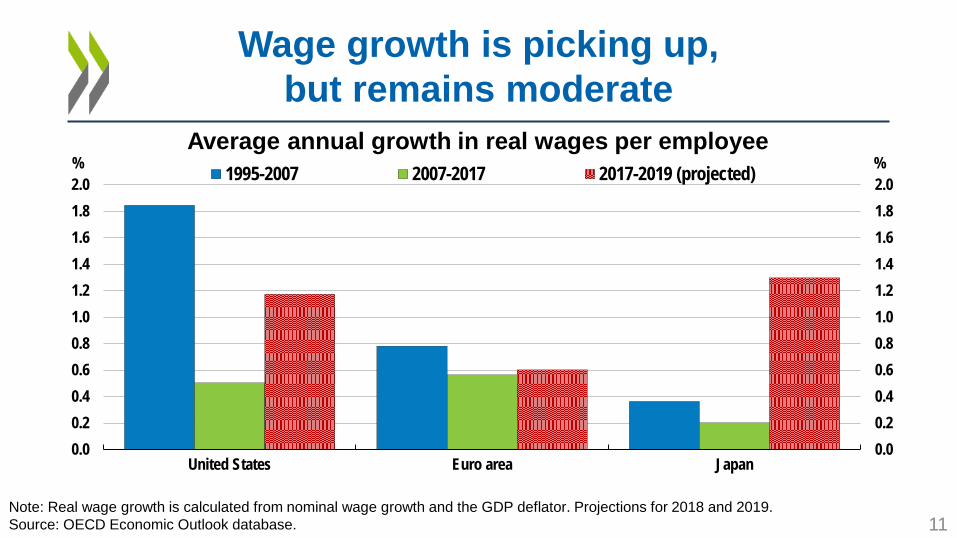
0.00.20.40.60.81.01.21.41.61.82.0
0.00.20.40.60.81.01.21.41.61.82.0
United States Euro area Japan
1995-2007 2007-2017 2017-2019 (projected) % %
Wage growth is picking up, but remains moderate
Note: Real wage growth is calculated from nominal wage growth and the GDP deflator. Projections for 2018 and 2019. Source: OECD Economic Outlook database. 11
Average annual growth in real wages per employee
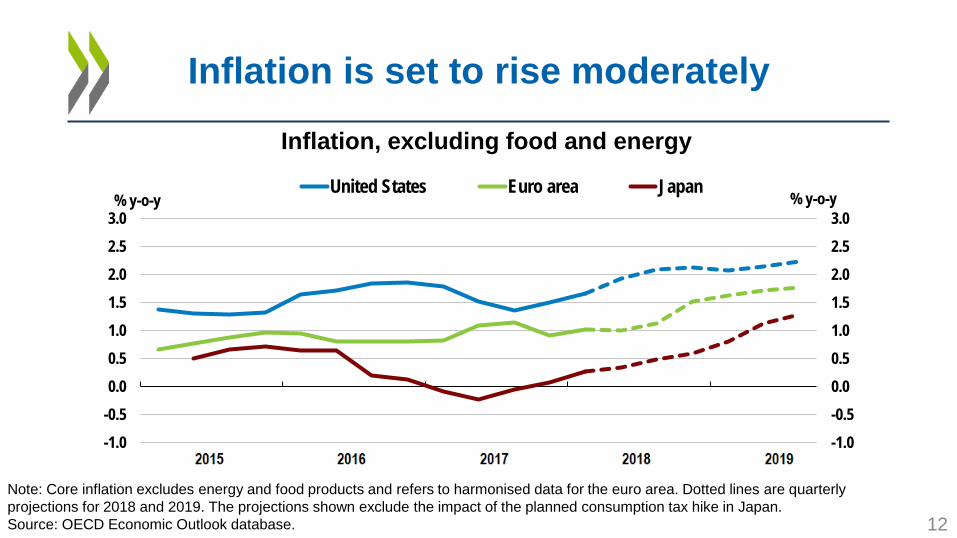
Inflation is set to rise moderately
Inflation, excluding food and energy
Note: Core inflation excludes energy and food products and refers to harmonised data for the euro area. Dotted lines are quarterly projections for 2018 and 2019. The projections shown exclude the impact of the planned consumption tax hike in Japan. Source: OECD Economic Outlook database. 12
-1.0-0.50.00.51.01.52.02.53.0
-1.0-0.50.00.51.01.52.02.53.0
United States Euro area Japan% y-o-y % y-o-y

RISKS LOOM LARGE
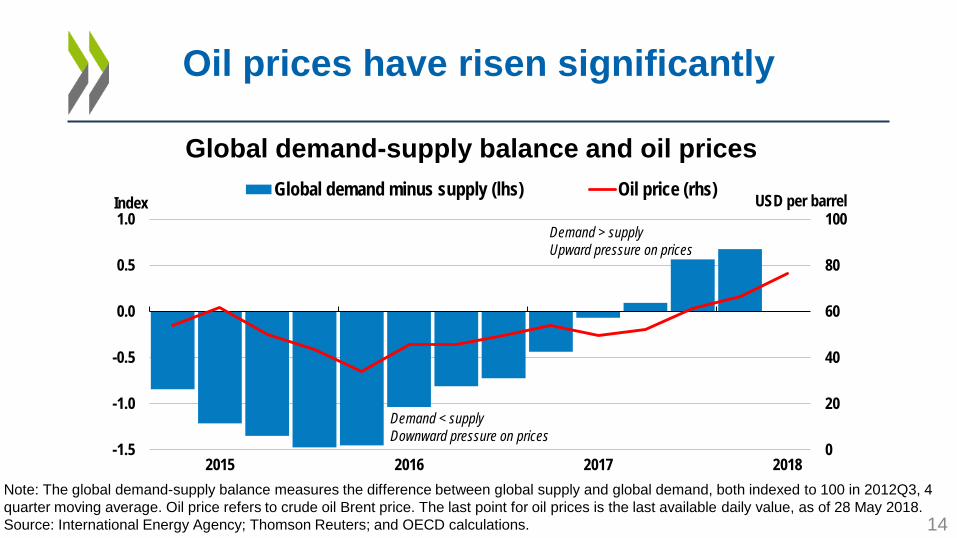
Global demand-supply balance and oil prices
Oil prices have risen significantly
Note: The global demand-supply balance measures the difference between global supply and global demand, both indexed to 100 in 2012Q3, 4 quarter moving average. Oil price refers to crude oil Brent price. The last point for oil prices is the last available daily value, as of 28 May 2018. Source: International Energy Agency; Thomson Reuters; and OECD calculations. 14
0
20
40
60
80
100
-1.5
-1.0
-0.5
0.0
0.5
1.0
2015 2016 2017 2018
Global demand minus supply (lhs) Oil price (rhs) USD per barrel Index
Demand < supply Downward pressure on prices
Demand > supply Upward pressure on prices
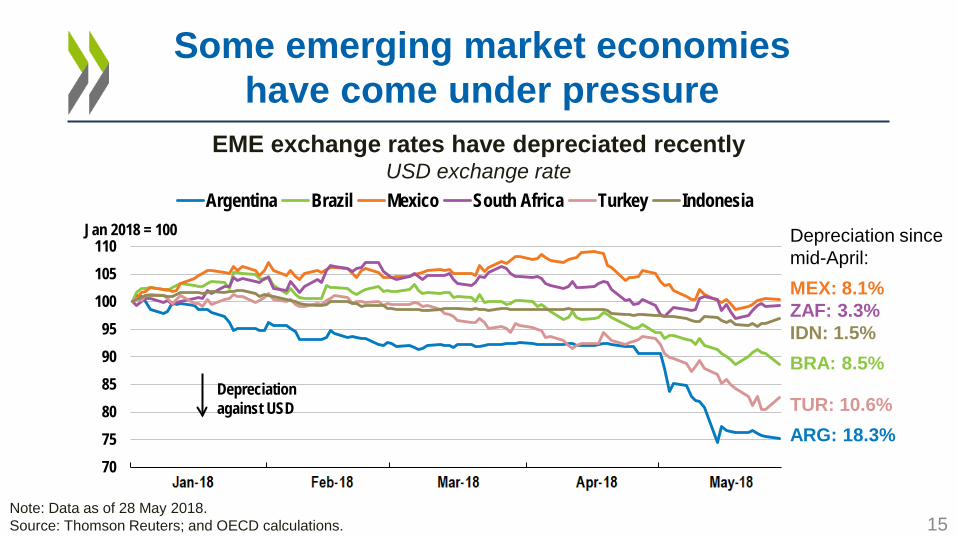
Some emerging market economies have come under pressure
EME exchange rates have depreciated recently USD exchange rate
Note: Data as of 28 May 2018. Source: Thomson Reuters; and OECD calculations.
Depreciation since mid-April: MEX: 8.1% ZAF: 3.3% IDN: 1.5% BRA: 8.5% TUR: 10.6% ARG: 18.3%
15
707580859095
100105110
Argentina Brazil Mexico South Africa Turkey IndonesiaJan 2018 = 100
Depreciation against USD
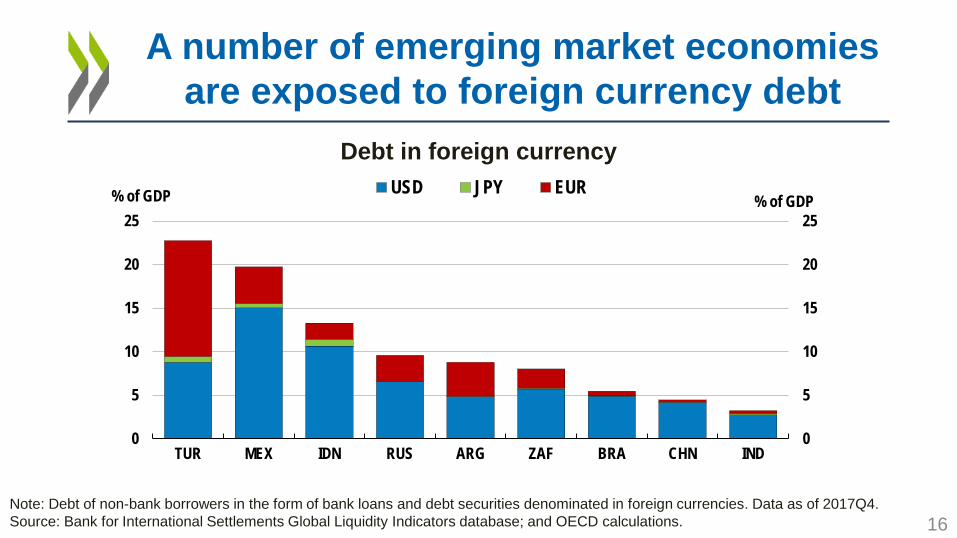
Debt in foreign currency
Note: Debt of non-bank borrowers in the form of bank loans and debt securities denominated in foreign currencies. Data as of 2017Q4. Source: Bank for International Settlements Global Liquidity Indicators database; and OECD calculations.
A number of emerging market economies are exposed to foreign currency debt
0
5
10
15
20
25
0
5
10
15
20
25
TUR MEX IDN RUS ARG ZAF BRA CHN IND
USD JPY EUR% of GDP % of GDP
16
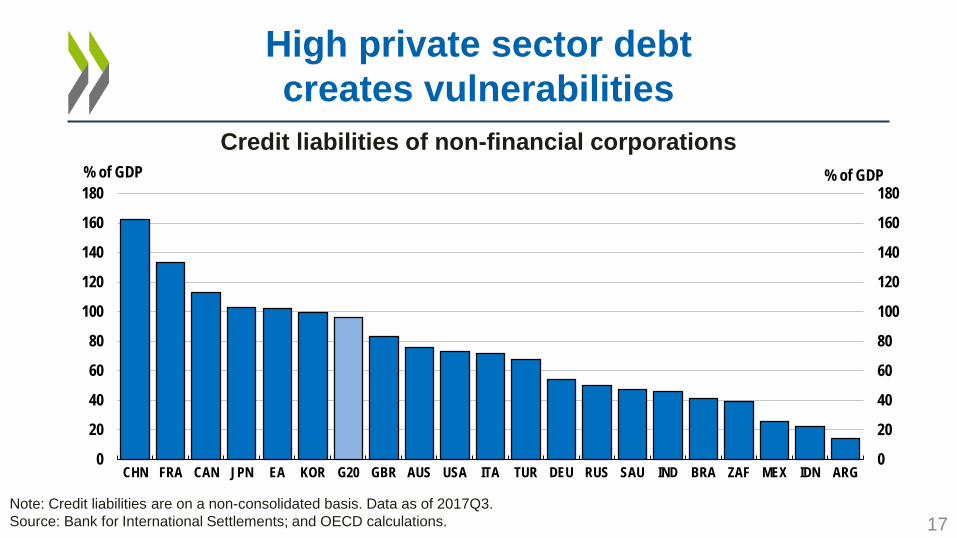
Note: Credit liabilities are on a non-consolidated basis. Data as of 2017Q3. Source: Bank for International Settlements; and OECD calculations.
High private sector debt creates vulnerabilities
Credit liabilities of non-financial corporations
17
0
20
40
60
80
100
120
140
160
180
0
20
40
60
80
100
120
140
160
180
CHN FRA CAN JPN EA KOR G20 GBR AUS USA ITA TUR DEU RUS SAU IND BRA ZAF MEX IDN ARG
% of GDP % of GDP
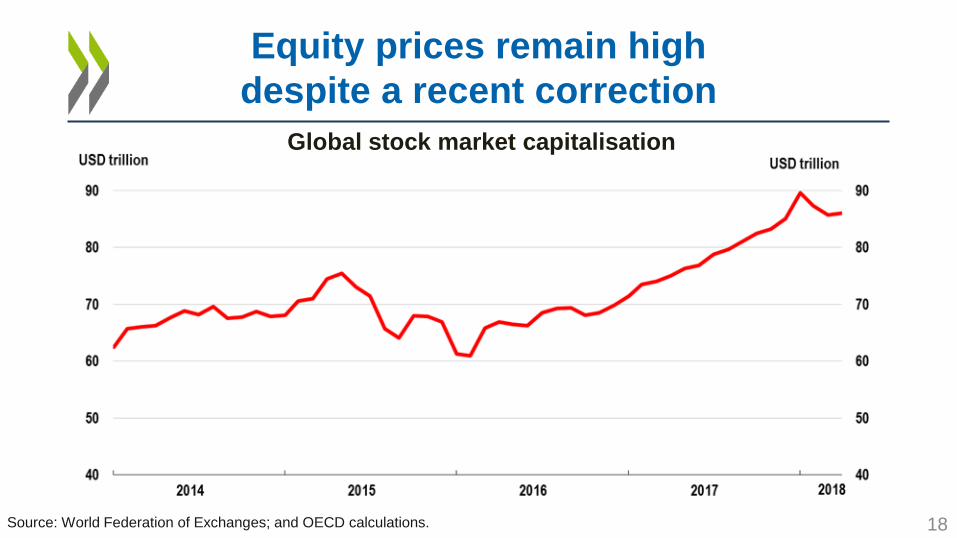
Global stock market capitalisation
Source: World Federation of Exchanges; and OECD calculations.
Equity prices remain high despite a recent correction
18
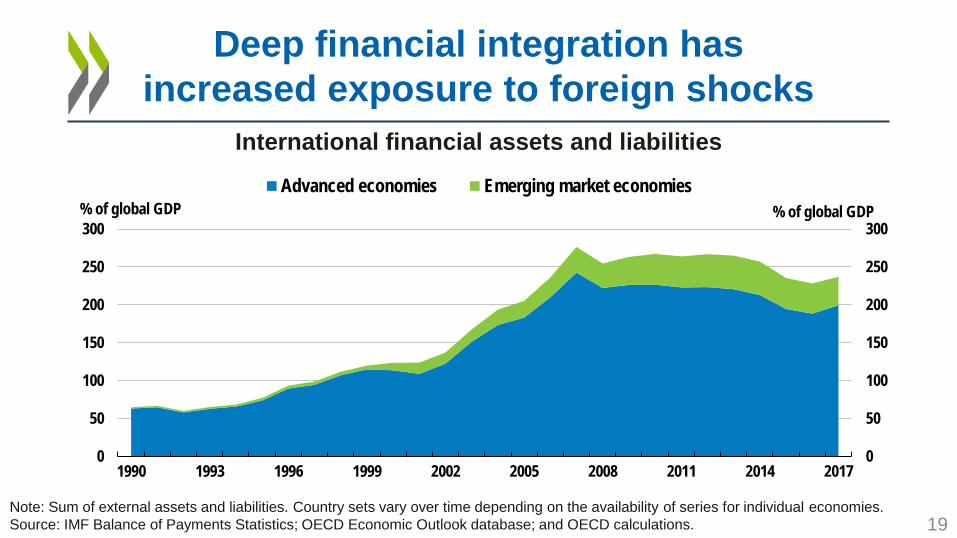
Deep financial integration has increased exposure to foreign shocks
International financial assets and liabilities
Note: Sum of external assets and liabilities. Country sets vary over time depending on the availability of series for individual economies. Source: IMF Balance of Payments Statistics; OECD Economic Outlook database; and OECD calculations. 19
0
50
100
150
200
250
300
0
50
100
150
200
250
300
1990 1993 1996 1999 2002 2005 2008 2011 2014 2017
Advanced economies Emerging market economies% of global GDP % of global GDP
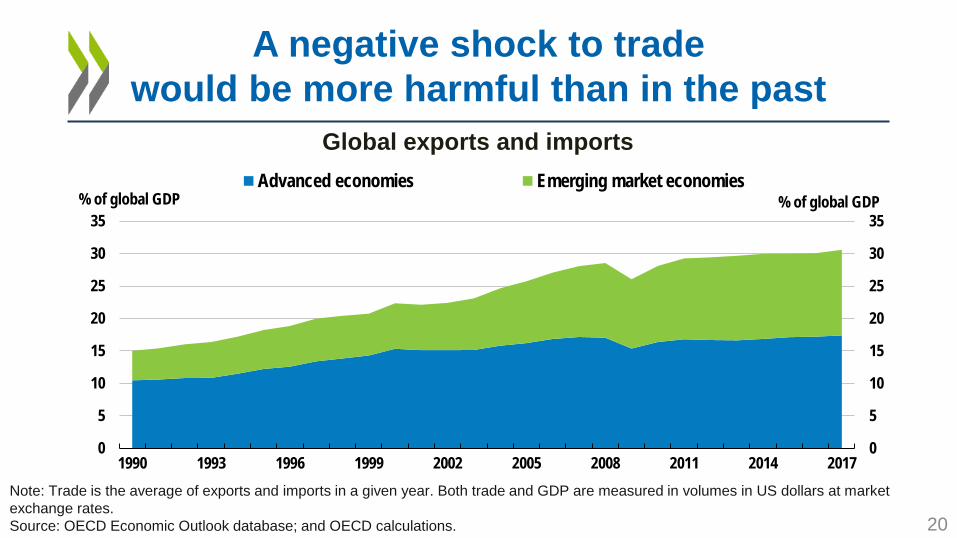
A negative shock to trade would be more harmful than in the past
Global exports and imports
Note: Trade is the average of exports and imports in a given year. Both trade and GDP are measured in volumes in US dollars at market exchange rates. Source: OECD Economic Outlook database; and OECD calculations. 20
0
5
10
15
20
25
30
35
0
5
10
15
20
25
30
35
1990 1993 1996 1999 2002 2005 2008 2011 2014 2017
Advanced economies Emerging market economies% of global GDP % of global GDP

POLICIES TO MAKE GROWTH MORE SUSTAINED
AND INCLUSIVE

051015202530354045
05
1015202530354045
2011-12 2013-14 2015-16 2017 2011-12 2013-14 2015-16 2017
% %
In process of implementation
In process of implementation
Emerging market economies Advanced economies
Note: The estimated take-up of reforms is captured by the Going for Growth indicator of reform responsiveness. Fully coloured bars refer to the share of fully implemented reforms. For 2017, reforms in process of implementation are shown to ensure comparability with previous 2-year periods. Emerging market economies include Argentina, Brazil, Chile, China, Colombia, Costa Rica, Indonesia, India, Mexico, Russia, Turkey and South Africa. Advanced economies include all non-emerging OECD member countries and Lithuania. Source: OECD Going for Growth.
Step up structural reform ambition
22
Implementation of Going for Growth recommendations
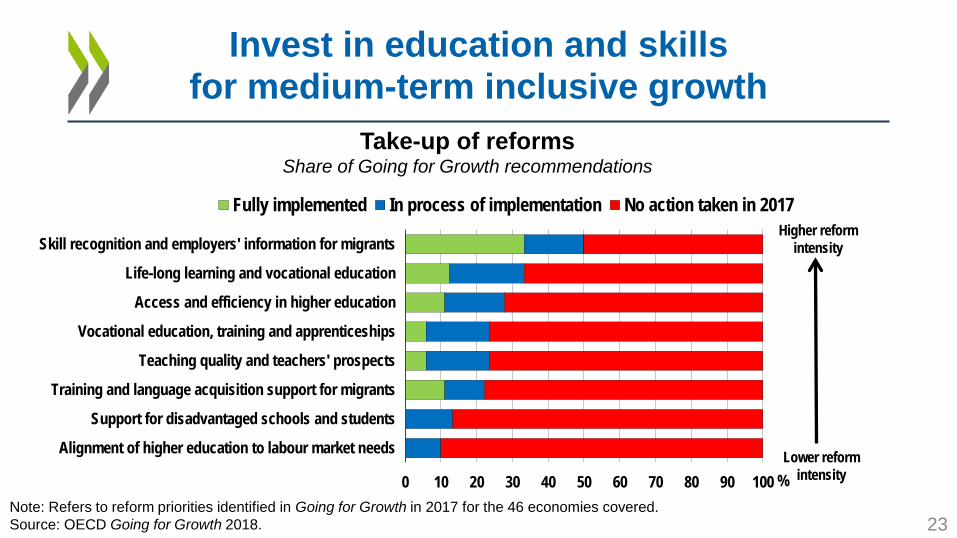
Invest in education and skills for medium-term inclusive growth
23 Note: Refers to reform priorities identified in Going for Growth in 2017 for the 46 economies covered. Source: OECD Going for Growth 2018.
Take-up of reforms Share of Going for Growth recommendations
0 10 20 30 40 50 60 70 80 90 100
Alignment of higher education to labour market needs
Support for disadvantaged schools and students
Training and language acquisition support for migrants
Teaching quality and teachers' prospects
Vocational education, training and apprenticeships
Access and efficiency in higher education
Life-long learning and vocational education
Skill recognition and employers' information for migrants
%
Fully implemented In process of implementation No action taken in 2017Higher reform
intensity
Lower reform intensity
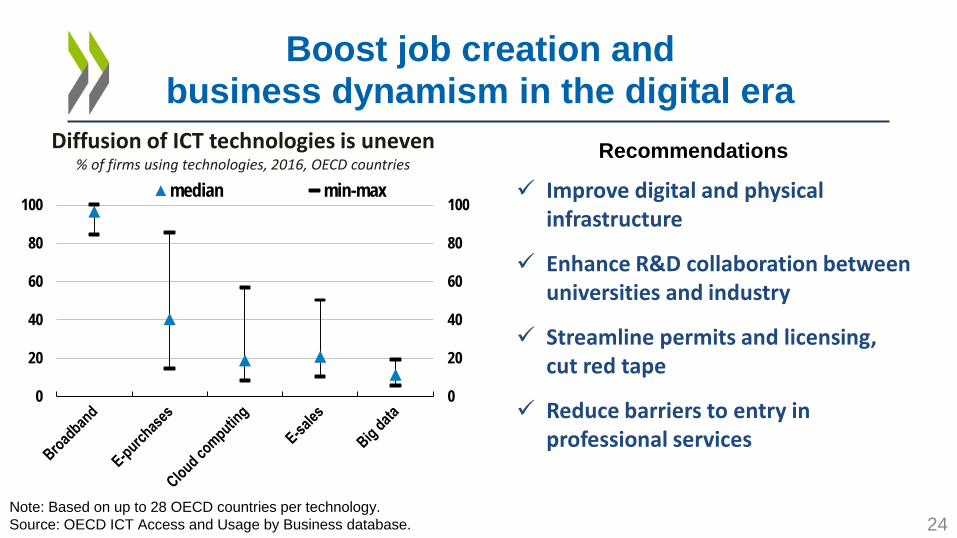
Boost job creation and business dynamism in the digital era
Note: Based on up to 28 OECD countries per technology. Source: OECD ICT Access and Usage by Business database.
Diffusion of ICT technologies is uneven % of firms using technologies, 2016, OECD countries
Improve digital and physical infrastructure
Enhance R&D collaboration between universities and industry
Streamline permits and licensing, cut red tape
Reduce barriers to entry in professional services
24
Recommendations
0
20
40
60
80
100
0
20
40
60
80
100median min-max
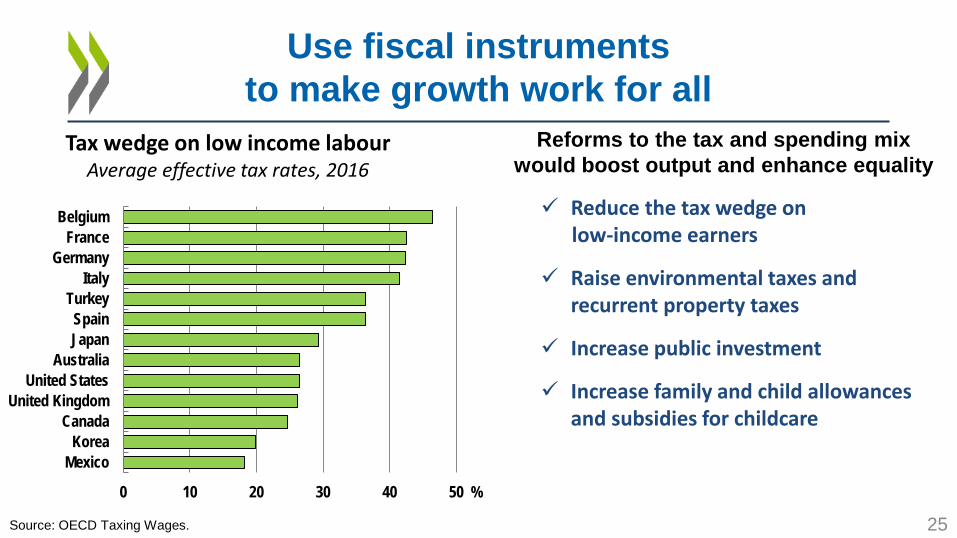
Source: OECD Taxing Wages.
Tax wedge on low income labour Average effective tax rates, 2016
Use fiscal instruments to make growth work for all
Reforms to the tax and spending mix would boost output and enhance equality
25
Reduce the tax wedge on low-income earners
Raise environmental taxes and recurrent property taxes
Increase public investment
Increase family and child allowances and subsidies for childcare
MexicoKorea
CanadaUnited Kingdom
United StatesAustralia
JapanSpain
TurkeyItaly
GermanyFrance
Belgium
0 10 20 30 40 50 %
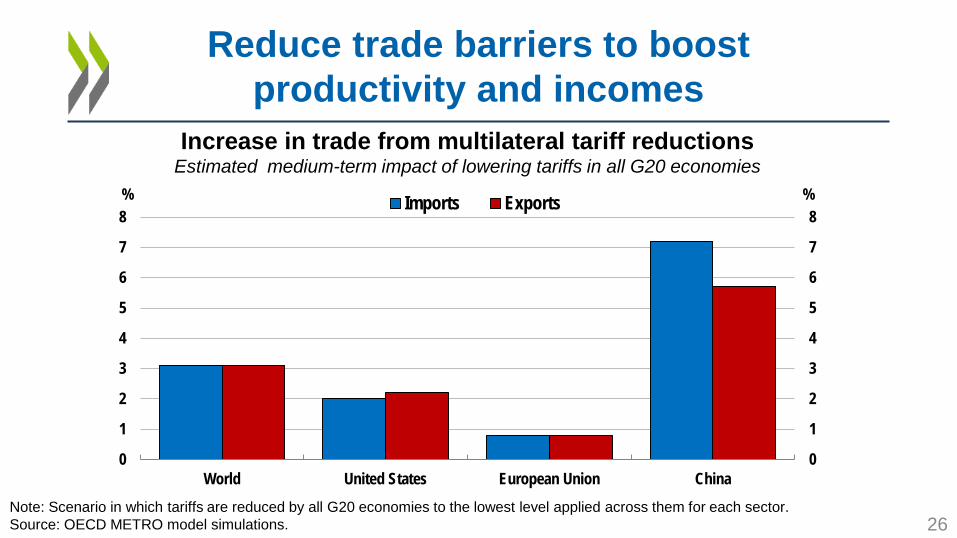
Reduce trade barriers to boost productivity and incomes
Note: Scenario in which tariffs are reduced by all G20 economies to the lowest level applied across them for each sector. Source: OECD METRO model simulations.
0
1
2
3
4
5
6
7
8
0
1
2
3
4
5
6
7
8
World United States European Union China
% % Imports Exports
Increase in trade from multilateral tariff reductions Estimated medium-term impact of lowering tariffs in all G20 economies
26
Key messages • Global growth will be around 4%
Investment and trade have rebounded
• Monetary and fiscal policies have been supportive Three quarters of OECD countries are undertaking fiscal easing
• Job growth has been strong The OECD unemployment rate will be at its lowest since 1980
• Risks loom large over the next few years: oil prices, trade tensions, financial volatility Rising interest rates will pose challenges for highly indebted countries, households and corporations.
• Now is the time to reform for sustainable and inclusive growth Invest in education, skills, digital infrastructure 27