Embed Size (px)
Citation preview

doi.org/10.26434/chemrxiv.9247709.v2
Strongly Bound Surface Water Affects the Shape Evolution of CeriumOxide NanoparticlesAdam Symington, Marco Molinari, Samuel Moxon, Joseph Flitcroft, Dean Sayle, Stephen Charles Parker
Submitted date: 06/08/2019 • Posted date: 06/08/2019Licence: CC BY-NC-ND 4.0Citation information: Symington, Adam; Molinari, Marco; Moxon, Samuel; Flitcroft, Joseph; Sayle, Dean;Parker, Stephen Charles (2019): Strongly Bound Surface Water Affects the Shape Evolution of Cerium OxideNanoparticles. ChemRxiv. Preprint.
The surface structure and composition of functional materials are well known to be critically important factorscontrolling the surface reactivity. However, when doped the surface composition will change and the challengeis to identify its impact on important surface processes and nanoparticle morphologies. We have begun toaddress this by using a combination of density functional theory and potential-based methods to investigatethe effect of surface dopants on water adsorption and morphology of the technologically important material,CeO2, which finds application as electrolyte in SOFCs, catalyst in soot combustion, and enzyme mimeticagent in biomedicine. We show that by mapping CeO2 surface phase diagrams we can predict nanoparticlemorphologies as a function of dopant, temperature and water partial pressure. Our results show that a lowtemperature, un-doped CeO2 nanocubes with active {100} surface sites are thermodynamically stable. But atthe typical high temperature operating conditions favors polyhedra where {100} surfaces are replaced by lessactive {111} surfaces by surface ion migration. However, on doping with trivalent cations, such as Gd3+, willincrease binding of water on the {100} surfaces and hence act to preserve the cuboidal architecture, bycapping the active surfaces. As surfaces tend to be decorated by impurities and dopants it is clear that theirrole should receive more attention and the approach we describe can be routinely applied to nanomaterials,morphologies and associated active/inactive surfaces.
File list (1)
download fileview on ChemRxivManuscript.pdf (3.40 MiB)

Strongly Bound Surface Water Affects the Shape
Evolution of Cerium Oxide Nanoparticles
Adam R. Symington,∗,† Marco Molinari,‡ Samuel Moxon,‡ Joseph M. Flitcroft,‡
Dean C. Sayle,¶ and Stephen C. Parker∗,†
†Department of Chemistry, University of Bath, Claverton Down, Bath BA2 7AY, UK
‡Department of Chemistry, University of Huddersfield, Queensgate, Huddersfield HD1
3DH, UK
¶School of Physical Science, University of Kent, Canterbury, Kent CT2 7NZ, U.K.
E-mail: [email protected]; [email protected]
Abstract
The surface structure and composition of functional materials are well known to
be critically important factors controlling the surface reactivity. However, when doped
the surface composition will change and the challenge is to identify its impact on im-
portant surface processes and nanoparticle morphologies. We have begun to address
this by using a combination of density functional theory and potential-based methods
to investigate the effect of surface dopants on water adsorption and morphology of
the technologically important material, CeO2, which finds application as electrolyte in
SOFCs, catalyst in soot combustion, and enzyme mimetic agent in biomedicine. We
show that by mapping CeO2 surface phase diagrams we can predict nanoparticle mor-
phologies as a function of dopant, temperature and water partial pressure. Our results
show that a low temperature, un-doped CeO2 nanocubes with active {100} surface
sites are thermodynamically stable. But at the typical high temperature operating
1

conditions favours polyhedra where {100} surfaces are replaced by less active {111}
surfaces by surface ion migration. However, on doping with trivalent cations, such as
Gd3+, will increase binding of water on the {100} surfaces and hence act to preserve
the cuboidal architecture, by capping the active surfaces. As surfaces tend to be deco-
rated by impurities and dopants it is clear that their role should receive more attention
and the approach we describe can be routinely applied to nanomaterials, morphologies
and associated active/inactive surfaces.
Introduction
The control of nanoparticle growth and evolution is an important topic that is tackled ex-
perimentally using SEM and TEM in the presence of biological macromolecules,1 organic
molecules,2 and polymers.3 This is not limited to presence of molecules in the surrounding
environment but also to nanoparticles response to external variables such as the high en-
ergy electron beam of a TEM.4 There has been recent work on defining rules to determine
the evolution of nanoparticle shape,5 however the challenge is also to correlate the shape of
nanoparticles to external variables such as pressure and temperature. We present a com-
prehensive way to predict nanoparticle shape as a function of water partial pressure and
temperature in both stoichiometric and doped nanoparticles. We demonstrate this method-
ology by applying it to CeO2 as it is an important catalyst, prevelant in a wide range of
processes and because the relationship between shape and the surrounding environment
remains largely unexplored.
Cerium oxide, CeO2 (Ceria), and doped derivatives, are important technological materials.
Thanks to the easily accessible redox conversion between Ce3+ and Ce4+ and the oxygen
vacancy tolerance of the fluorite structure, ceria enjoys a wide spectrum of applications like
electrochemical sensors,6,7 solid oxide fuel cells (SOFCs),8–11 catalytic exhaust treatment,12
hydrogen fuel generation13 and biomedicine.14,15 For each of its many applications, the redox
2

capability is essential to the performance of the materials. As the redox reactions take place
at the materials surfaces, the understanding of surface morphology and chemistry is key to
the design and engineering of ceria based materials.
Despite its presence in many chemical reactions as either a solvent, spectator or reagent,
water and its effect on the morphology of ceria nanoparticles is often overlooked. Most in-
vestigations focus on the oxygen reduction and incorporation at the electrolyte-cathode-gas
triple phase boundary in SOFCs and neglect the contribution from water vapor in the gaseous
atmosphere being fed at the cathode of the SOFC. Experiments have shown that water does
have a significant impact on the oxygen transport properties of both pure and doped ceria at
relevant operating temperatures.16,17 However, the details behind these changes are largely
unclear.18 Furthermore, dissociative water in the form of surface hydroxyl groups has been
linked to reduction of soot oxidation catalysts’ performance. While surface water is undesir-
able in soot oxidation and SOFCs, other catalytic processes depend on water dissociation at
the surface, e.g. the water gas shift reaction. It is also unclear how the morphology of the
material (generally in the form of nanoparticles) affects and is affected by the interaction
with water especially if the material is in use over a long period of time, i.e. over repeated
catalytic cycles.
Significant theoretical effort has been made to predict how water adsorbs at both stoichio-
metric and reduced ceria surfaces.19–22 However, in technological applications ceria is doped
and the interplay between water and doped ceria surfaces has not yet been fully explored.
Experimentally, ceria is often doped with aliovalent metals in the 3+ oxidation state, such as
Y3+, Sm3+ and Gd3+. These dopants promote the formation of oxygen vacancies, enhance
oxygen diffusion rate, increase materials stability under reducing conditions and improve cat-
alytic activity23 Compared to stoichiometric ceria, reduced or oxygen deficient ceria interacts
with humidity (water) differently19 Clearly, given the technological importance and the wide
range of uses of doped ceria, the effect of water adsorption warrants further study.
3

In this work, we describe our study of the interaction of water with the most important
low index surfaces of CeO2 ({111}, {110} and {100}) when doped with Y3+, Sm3+ and
Gd3+ cations. Thus, we aim to evaluate whether these trivalent cations strongly segregate
to these surfaces, and predict their effect on the equilibrium morphology and water adsorp-
tion. Thus demonstrate the extent to which morphology is linked to surface composition,
and hence comment on the relationship between catalytic activity and nanoparticle shape
evolution.
Methodology
Calculation Details
Density functional theory (DFT) calculations were performed using the Vienna Ab-initio
Simulation Package (VASP) code,24,25 within which projector augmented-wave pseudopo-
tentials and a plane wave cutoff of 500 eV were used. A Γ-centered K-point grid of 2x2x1
with the third vector perpendicular to the surface plane was used and was converged.
Calculations were carried out using the generalized gradient approximation (GGA) exchange-
correlation functional of Perdew (PBE), with the +U correction of Dudarev26 to account for
on-site Coulombic interactions. A U value of 5 eV is applied to Ce f states.14,19 The structures
were optimized until the residual forces on each atom were less than 10 meV A -1. All
calculations were spin polarized and an initial ferromagnetic ordering was used throughout,
which has been shown to produce no difference in the energetic of CeO2 systems.27,28
Isolated O2 and H2O molecules were simulated using a 10 A 3 cubic cell. The K point
density, and the same convergence criteria as the surface calculations was also used for these
molecules.
Surface Energies and Thermodynamic Framework
The physical quantity defining stable surface compositions is the surface energy γ (Jm−2).
4
Using the slab method, the surface energy of a stoichiometric slab (γStoich) can be calcu-
lated from the energy of the systems containing the slab (EStoich,Bare), the energy of ceria
stoichiometric bulk (EBulk,CeO2) and the surface area (S),
γStoich =EStoich,Bare − EBulk,CeO2
2S(1)
The surface energy of the doped surfaces (γDoped) was calculated according to
γDoped =ESlab,M2O3 − (EBulk,CeO2 + EBulk,M2O3)
2S(2)
where ESlab,M2O3 is the energy of the doped slab and EBulk,M2O3 is the energy of the bulk
dopant.
The heat of reduction was calculated for the three low index surfaces of ceria by creating
an oxygen vacancy through the removal of a surface oxygen atom. Two electrons are left
behind and localize on the cerium ions neighbouring the vacancy. The heat of reduction is
calculated according to
EReduction =(ESlab,Reduced + EO2)− EStoich,Bare
2(3)
EReduction is the reduction energy, ESlab,Reduced is the DFT energy of the surface containing
an oxygen vacancy and EO2 is the DFT energy of oxygen. Equations 1 and 2 provide surface
energies neglecting temperature and hence are not representative for the operating conditions
of various catalytic processes and the synthesis and sintering conditions. For the hydrated
surfaces, the effect of temperature is introduced as follows.19,29,30
γadsorbed,T,P = γBare + (C(Eads,T −RTln(pH2O
po))) (4)
5

where γBare is the surface energy of the base surface, and could be γStoich calculated according
to equation 1 for the stoichiometric surfaces or γDoped from equation 2 for the reduced and
doped surfaces, C is the coverage of water and
Eads,T = EHyd − (ESlab,Bare + nH2OEH2O,(T ))/nH2O (5)
where EHyd is the energy of the slab with the adsorbed species, EBare is the energy of the
bare surface, nH2O is the number of adsorbed H2O molecules, and
EH2O,(T ) = EH2O,(0K,g) − TS(T ) (6)
where S(T ) is the experimental entropy of gaseous water in the standard state.
Based upon the surface energies calculated according to equation 4, the surface area of each
surface was calculated using the Wulff construction.31–33 These areas were then combined to
give the ratio between each surface under varying pressure and temperature.
Surface Models
The structure of stoichiometric bulk CeO2 retains the fluorite crystal structure (space group
Fm-3 m) despite a small expansion of the unit cell. This is a well-documented effect for the
DFT methodology employed in this study.27 The simulated lattice parameter (a=0.545nm)
compares well with the experimental lattice parameter of (a=0.541nm). Model structures
were generated using the METADISE code.32 3D boundary conditions were used throughout,
and hence, the surfaces were modelled using the slab method34 in which a finite number of
crystal layers is used to generate two identical surfaces via the introduction of a vacuum gap
perpendicular to the surface. A vacuum gap of 15 A was used to minimize the interaction
between images.
The {100} and {110} slabs with a p(2 x 2) expansion of the surface unit cell included 13
6

and 7 atomic layers (24 and 28 CeO2 units, respectively), while the {111} slab with a p(2 x
3) expansion included 12 atomic layers (24 CeO2 units).
We have considered water adsorption on the stoichiometric surface of ceria, referred to as
Ce(IV) surfaces, reduced surfaces, referred to as Ce(III) and doped surfaces, referred to as
M3+, where M is Sm, Gd and Y.
As the number of configurations for adsorbed water on surfaces of ceria is extremely large, we
have limited the choice to structures that have previously been suggested and that maximize
the coordination between the adsorbate and the surface. Several configurations for the lowest
water coverage were then computed, but only the most stable one is reported. M3+ atoms
were distributed according to the defect ordering of the system.
Phase diagrams were generated and analysis was conducted using the surfinpy code.35
Wulff constructions were generated using pymatgen36 and all figures were drawn using
VESTA.37
Molecular Dynamics
To simulate the kinetics of the cube-to-polyhedron morphological change a model nanocube,
generated previously was used.38 The model comprises 6921 CeO2 repeat units and exposes
six {100} surfaces. Molecular Dynamics (MD) simulations, using the DLPOLY code,39 was
then performed at 5100K for 200 ns using an NVT ensemble. This enabled any energy
associated with, for example a cube-to-polyhedron shape change, to be extracted via a
thermostat. If it were not extracted, the heat energy would melt the nanoparticle. This
methodology has been used successfully in previous studies.40–44
The Born model of the ionic solid was used to represent the interactions between the Ce
and O ions comprising the nanoparticle using potential parameters derived by Minervini et
al,.45 A rigid ion model representation was used to reduce computational cost. Molecular
graphics, using the VMD code,46 was used extensively to track the change in morphology
7

with time and elucidate the atom transport mechanism.
Figure 1: Schematic representation of dissociative (A) and molecular (molecular) (B) ad-sorption of water on the {100} surface. Side view of the {111}(E), {110}(D), and {100}(F) surfaces. Cerium ions are shown in cream and surface oxygen ions in red.
Results
Surface Energy
The calculated surface energies obtained from equation 1 are 1.44, 1.06, 0.71 J/m2 for the
{100}, {110} and {111} surfaces, respectively which agrees with previously calculated sur-
face energies (1.4, 1.0 and 0.7 J/m2,,27 1.41, 1.04 and 0.69 J/m2,47). The heat of reduction
associated with the three surfaces, which corresponds to the ease to remove surface oxy-
gen ions, follows the order {111} > {100} > {110} with values of 1.96, 1.54, and 1.20 eV
respectively, which agree with those reported in the literature.48–50
We have calculated the surface energy of the M2O3 doped surfaces according to equation
8

2. The results in Figure 2 show that on reduction there is a decrease in surface energy
on reduction of the {110}/{100} surfaces and an increase on the {111}. All surfaces see an
increase in surface energy on addition of M2O3 (M = Gd, Sm and Y) dopants when compared
to the reduced system. While there is an order of stability that follows Ce(III) < Gd < Sm
< Y, there is only a difference of 0.02 J/m2 between the lowest (Gd) and highest (Y) on
each surface.
Figure 2: Surface energies for the Gd3+ doped, Sm3+ doped and Y3+ doped {111}, {110}and {100} surfaces (green, red and purple) in comparison to the stoichiometric (Ce(IV))andreduced (Ce(III)) surfaces (blue and orange).
Water Adsorption at the Lowest Coverage
The water adsorption energy is shown in Figure 3A. The adsorption energy at low water
coverage is found by evaluating the energy of an isolated single water molecule at the surfaces.
As expected, the water adsorption energies on stoichiometric surfaces follow the surface
energy, i.e. the least stable have a larger adsorption energy.
9

All M3+ doped and reduced (CeIII) surfaces have a stronger affinity for water than the cor-
responding stoichiometric surfaces.19 This is due to the presence of a vacancy, which binds
3+ cations at the surface, as shown in previous experimental and theoretical studies.51 Hy-
droxyl groups can fill the vacant oxygen lattice site and “heal” the surface enabling the
surface cations to recover coordination. Associatively adsorbed water cannot adequately en-
able this healing and thus surface oxygen vacancies promote dissociation of water molecules.
We find spontaneous dissociation of water molecules in the presence of surface oxygen va-
cancy, implying a barrier-less process.
Dissociative adsorption is favoured on the {111} surface, but water can still be adsorbed as a
molecular species, in line with previous experimental52 and computational19,22,53 literature.
Experimental observation of dissociation of water is also found for Gd3+ doped CeO2 surfaces
by Perez-Coll et al.,54 and Kossoy et al.55
Comparison between M3+ and Ce(III), shows that dopants decrease the affinity of the {111}
and {110} surfaces for water but enhance the affinity for water on the {100} surface(Figure
3A). On all surfaces there is a clear order of stability between the dopants and this follows
the order Sm3+ > Gd3+ > Y3+. The difference in adsorption energy is likely to arise from
surface strain due to the impurity. The order of ionic radii follows Ce(III) > Sm3+ > Gd3+
> Y3+ with Sm3+ being the closest in size to Ce3+. The average Sm3+ - O bond length (2.36
A ) is the longest and closest to the Ce – O bond distance (2.34 A ), whereas the average
Y3+ - O is slightly shorter (2.30 A ).
10
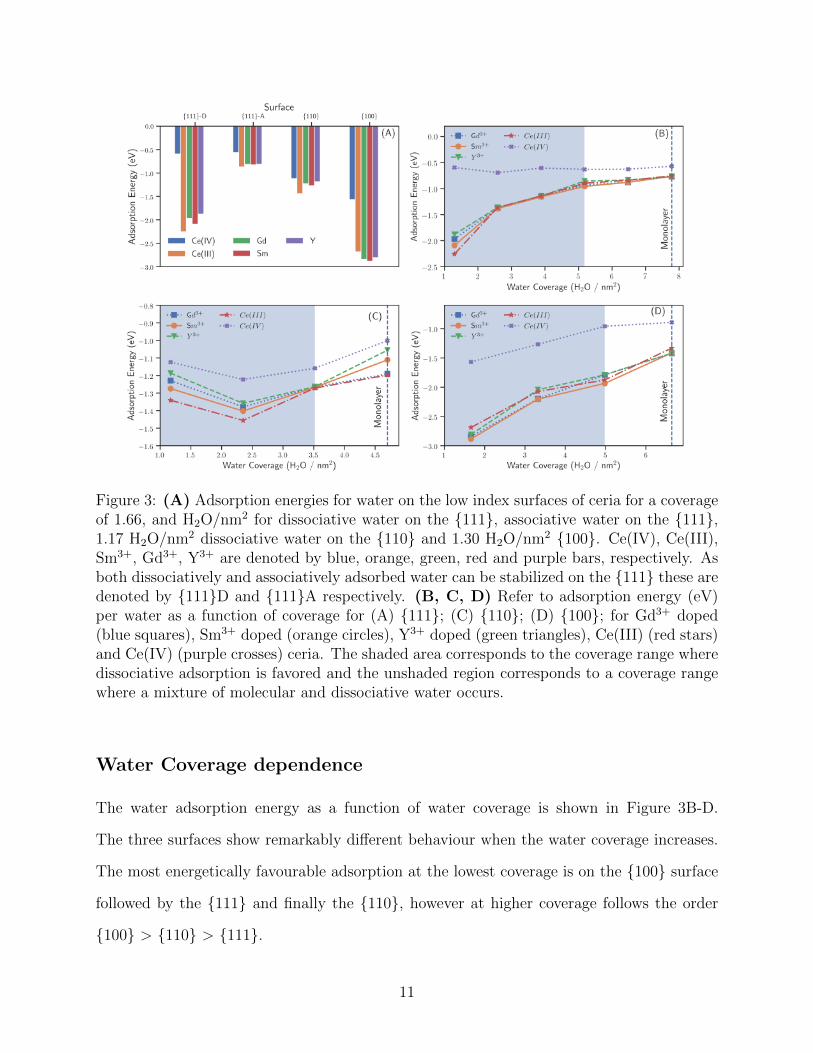
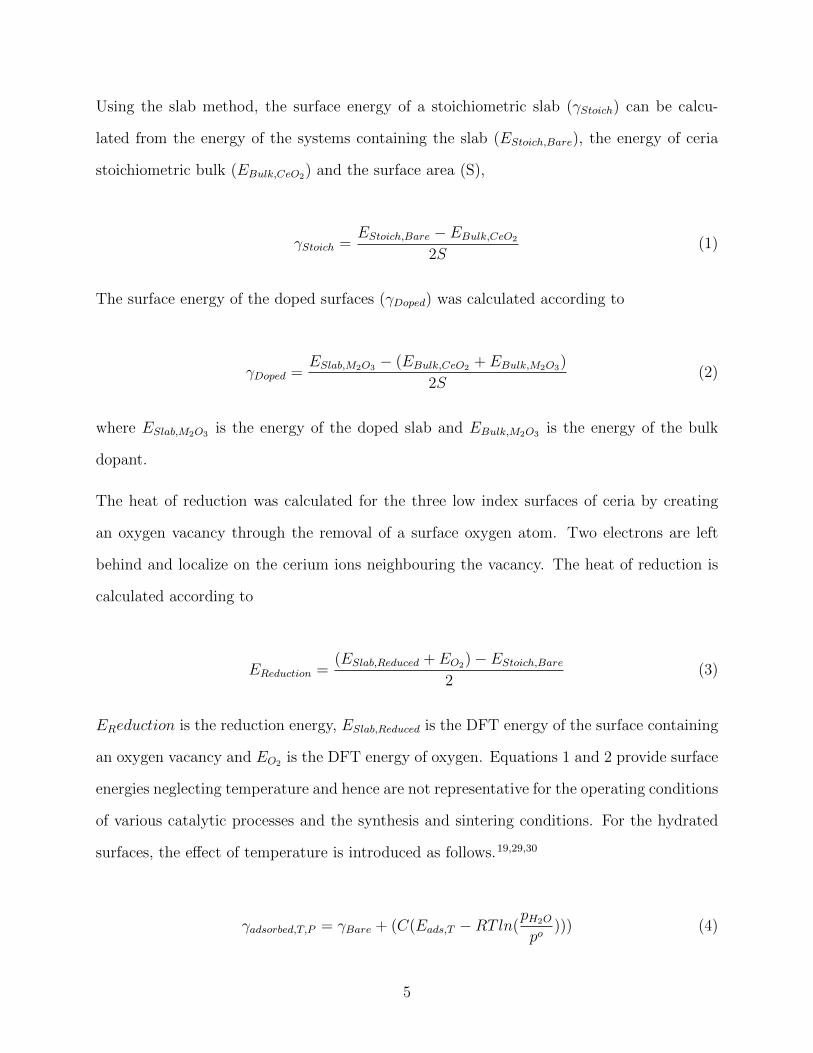
Figure 3: (A) Adsorption energies for water on the low index surfaces of ceria for a coverageof 1.66, and H2O/nm2 for dissociative water on the {111}, associative water on the {111},1.17 H2O/nm2 dissociative water on the {110} and 1.30 H2O/nm2 {100}. Ce(IV), Ce(III),Sm3+, Gd3+, Y3+ are denoted by blue, orange, green, red and purple bars, respectively. Asboth dissociatively and associatively adsorbed water can be stabilized on the {111} these aredenoted by {111}D and {111}A respectively. (B, C, D) Refer to adsorption energy (eV)per water as a function of coverage for (A) {111}; (C) {110}; (D) {100}; for Gd3+ doped(blue squares), Sm3+ doped (orange circles), Y3+ doped (green triangles), Ce(III) (red stars)and Ce(IV) (purple crosses) ceria. The shaded area corresponds to the coverage range wheredissociative adsorption is favored and the unshaded region corresponds to a coverage rangewhere a mixture of molecular and dissociative water occurs.
Water Coverage dependence
The water adsorption energy as a function of water coverage is shown in Figure 3B-D.
The three surfaces show remarkably different behaviour when the water coverage increases.
The most energetically favourable adsorption at the lowest coverage is on the {100} surface
followed by the {111} and finally the {110}, however at higher coverage follows the order
{100} > {110} > {111}.
11

Another difference between the surfaces is the change in in adsorption energy with coverage.
Adsorption on the {111} and {100} surfaces is less energetically favourable with increasing
water coverage up to the monolayer adsorption (i.e. a water molecule per surface Ce).
However, on the {110} surface there is an initial stabilization at 25% and 50% coverage
followed by a destabilization of the adsorption when monolayer coverage is reached. This is
likely due to the surface area available per surface Ce atom on the {110}, 0.21 nm2 against
the 0.19 and 0.15 nm2 on the {111} and {100}, which can accommodate a greater coverage of
water before steric effects start destabilizing further adsorption of water. It is clear that the
hydrogen bonding network on the {111} and {100} surfaces can easily form as the coverage
of water increases; this is not the case for the {110}, where the water molecules are adsorbed
and isolated by direct interaction with surface Ce.
All surfaces stabilize dissociative adsorption at low coverage but a mixture of associatively
and dissociatively adsorbed water adsorption occurs at the monolayer, again to maximize
hydrogen bonding at the surface. Sm3+ shows the greatest strength of adsorption compared
to Y3+ and Gd3+ at the lowest coverage (Figure 3), although at the monolayer coverage this
relationship is lost. This suggests that the M3+ - water interaction dominates, but at higher
water coverage this is lost as the hydrogen bonding network becomes the discriminating
factor defining surface stabilization.
Our data indicates that dopants have very little impact on the water adsorption on the {111}
surface at all coverages. The largest difference in water adsorption energies is at the lowest
coverage of 1.30 H2O/nm2 (0.4 eV); at higher coverages there is only a minimal difference
between the impurity covered and reduced surfaces. On the {100} surface, there is a modest
difference (up to 0.1 eV) in adsorption energy at all coverages. The greatest impact is found
for the {110} surface, with the exception of 3.5 H2O/nm2 which marks the change in water
behaviour (from dissociative to a mixture of dissociative/associative) where there is virtually
no difference between the strength of adsorption of water depending on the nature of the
12
dopant, all other coverage see a marked influence: Ce(III) is always the cation that stabilized
the adsorption the most and Y3+ the least.
Our data support the findings of Mullins et al. who performed XRD analysis on stoichio-
metric {111} and {100} surfaces and concluded that both associatively and dissociatively
adsorbed water is present at the surface.52 They also conclude that dissociatively adsorbed
water is considerably more stable on the {100} than the {111}. There are no data available
on the {110}, however our data suggest that this is also the case for the {110} (Figure
3D).
Phase Diagrams
Figure 4: The phase boundary between dry and wet surfaces as a function of water partialpressure and temperature. (A) Water desorption temperatures at different partial pressuresof water on stoichiometric {111} (Blue), {110} (Orange) and {100} (Green) surfaces (CeIV),(B) Desorption temperatures for water on the reduced (Ce(III)), Sm33+, Gd3+ and Y3+
surfaces (Blue, orange, green and red lines) surfaces. The desorption regions are labelled foreach surface. (C, D) Phase diagrams for water on the stoichiometric {100} surface and theSm3+ doped {100} surface have been shown to highlight the oxygen vacancy healing effect.
13

We evaluated the relative stability of the three low index surfaces as a function of tempera-
ture and partial pressure of water (equation 4). This has been successfully implemented in
other work29,30,56 as well as on CeO219 (later verified experimentally52) and more recently on
fluorite structured UO256 Figure 4A/B shows the pressures as a function of desorption tem-
peratures for the stoichiometric and reduced/doped surfaces calculated according to equation
4. Full temperature vs pressure surface phase diagrams for each dataset can be found in the
supporting information.
Generally the dopants moderate the interaction with water depending on the surface. In
the case of the {111} and {110} surfaces dopants reduce the surface stability of water at
the surface and thus the surface will lose water at lower temperatures. In contrast, on the
{100} surface, the dopants stabilize adsorbed water. The introduction of oxygen vacancies
(alongside the dopants Ce(III), Sm3+, Gd3+, Y3+) greatly increases the temperature range
that water is adsorbed on the surface. This is due to a ”healing” effect that occurs whereby
water, in the form of hydroxyl groups, persists at the surface, at the vacant oxygen sites.
This is illustrated in Figure 4C/D, where at low temperatures (blue region) the surfaces are
fully covered by a monolayer of water, whereas at higher temperatures (white region) the
bare stoichiometric surface is more stable. When M2O3 doping occurs, at intermediate tem-
peratures, the healed region (green) is the pressures and temperatures where the dissociative
water “heals” and stabilizes the surface. This observation is supported by Chen et al., who
proposed that the first layer of water on the {111} reduced surface adsorbs dissociatively
and fills the oxygen vacancies,57 and Kossoy who proposed that oxygen vacancy sites are the
first to be occupied on Gd doped ceria {111} surfaces.55
Desorption Temperature
The temperature of desorption can be evaluated from the Pressure-Temperature phase dia-
grams. Our calculated desorption temperatures are in good agreement with those calculated
by Molinari et al. for the stoichiometric surfaces and show reasonable agreement with the
14
reduced surfaces, although it should be noted that we examined a range of coverages whereas
only a single coverage was considered previously.19 Our work is also in agreement with other
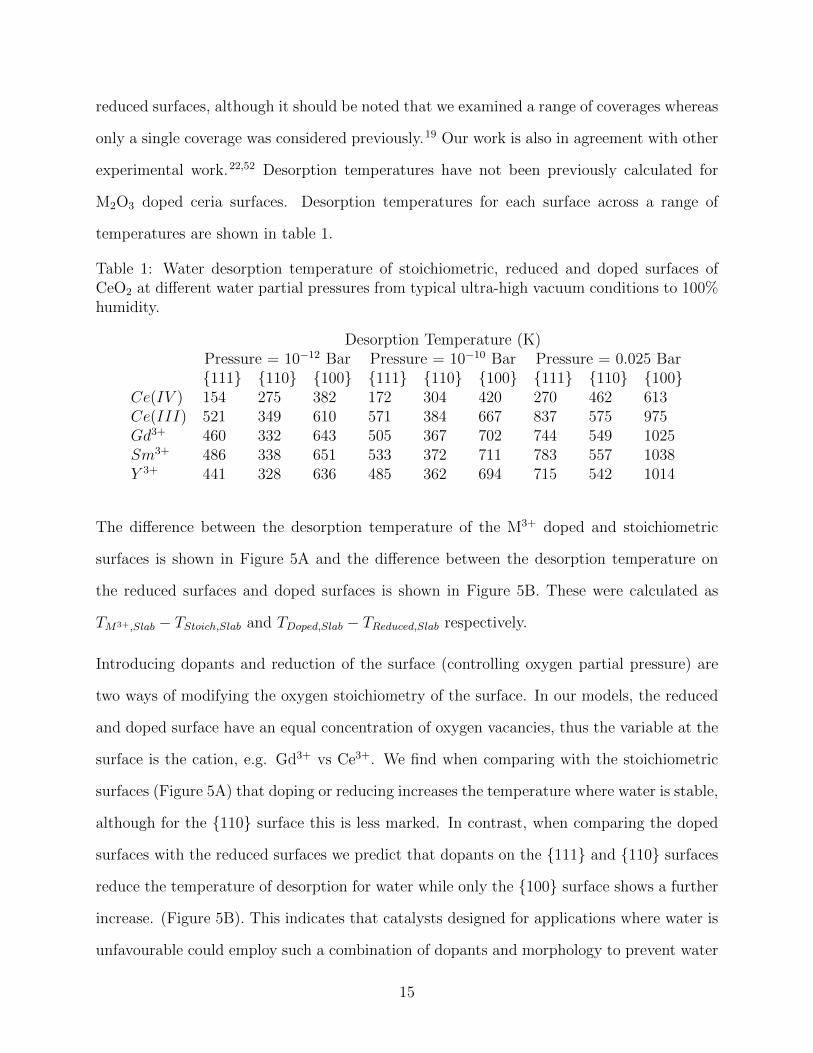
experimental work.22,52 Desorption temperatures have not been previously calculated for
M2O3 doped ceria surfaces. Desorption temperatures for each surface across a range of
temperatures are shown in table 1.
Table 1: Water desorption temperature of stoichiometric, reduced and doped surfaces ofCeO2 at different water partial pressures from typical ultra-high vacuum conditions to 100%humidity.
Desorption Temperature (K)Pressure = 10−12 Bar Pressure = 10−10 Bar Pressure = 0.025 Bar{111} {110} {100} {111} {110} {100} {111} {110} {100}
Ce(IV ) 154 275 382 172 304 420 270 462 613Ce(III) 521 349 610 571 384 667 837 575 975Gd3+ 460 332 643 505 367 702 744 549 1025Sm3+ 486 338 651 533 372 711 783 557 1038Y 3+ 441 328 636 485 362 694 715 542 1014
The difference between the desorption temperature of the M3+ doped and stoichiometric
surfaces is shown in Figure 5A and the difference between the desorption temperature on
the reduced surfaces and doped surfaces is shown in Figure 5B. These were calculated as
TM3+,Slab − TStoich,Slab and TDoped,Slab − TReduced,Slab respectively.
Introducing dopants and reduction of the surface (controlling oxygen partial pressure) are
two ways of modifying the oxygen stoichiometry of the surface. In our models, the reduced
and doped surface have an equal concentration of oxygen vacancies, thus the variable at the
surface is the cation, e.g. Gd3+ vs Ce3+. We find when comparing with the stoichiometric
surfaces (Figure 5A) that doping or reducing increases the temperature where water is stable,
although for the {110} surface this is less marked. In contrast, when comparing the doped
surfaces with the reduced surfaces we predict that dopants on the {111} and {110} surfaces
reduce the temperature of desorption for water while only the {100} surface shows a further
increase. (Figure 5B). This indicates that catalysts designed for applications where water is
unfavourable could employ such a combination of dopants and morphology to prevent water
15

adsorption at the surface. For example at a pressure of 1 bar pH2O, Y3+ doping reduces the
desorption temperature of water by 134 K on the {111} and 35 K on the {110}. This effect
increases with increasing pressure for the {111} surface but remains relatively constant for
the {110} (Figure 5B). However, as dopants on the{100} surface increase the temperature of
desorption compared with reduced surface, catalysts designed for applications where water is
required could employ doped nanocube morphologies, i.e. those where the {100} dominates.
For example, at a pressure of 1 bar, Sm3+ dopants increase the desorption temperature by
72 K on the {100}. This effect increases with increasing pressure (Figure 5B).
16

Figure 5: (A) The difference in desorption temperatures for doped surfaces compared tostoichiometric surfaces, calculated as TM3+,Slab − TStoich,Slab. The reduced (Ce(III)), Gd3+
doped, Sm3+ doped and Y3+ doped surfaces are shown in blue, orange, green and red,respectively. (B) The difference in desorption temperature between doped surfaces andreduced surfaces, calculated as TDoped,Slab − TReduced,Slab. Gd3+, Sm3+ and Y3+ are denotedby the blue, orange and green lines. The blue, orange and green shaded areas correspond tothe {111}, {110} and {100} datasets.
17

Predicted Particle Morphology
The desorption temperature corresponds to the temperature at a given partial pressure when
the surface free energy of a dry surface is the same as the wet surface. We can also use these
surface free energies to predict an equilibrium morphology and hence, infer how temperature
and water partial pressure will provide a driving force for particle morphology. Using the
surface energies calculated from equation 4, we can predict the relative surface area of each
surface at equilibrium as a function of temperature and pressure via a Wulff construction.31
Thus the effect of water exposure on the particle morphology can be evaluated. There are
numerous ways to control the shape of CeO2 nanoparticles and a wide variety of shapes
are available, e.g. nanocubes (expressing the {100} surface), octahedral (expressing the
{111} surface and nanorods (expressing the {110} surface).58–66 Over time however, this
morphology may change, causing other surfaces to be expressed. As our results predict that
the equilibrium particle shape as a function of temperature and pressure, and hence suggest
that there could be a thermodynamic driving force for the reconstruction of nanoparticles
under conditions different from the synthesis conditions, such as those in a catalytic cycle.
Our methodology provides a straightforward approach to evaluate the thermodynamic shape
of nanoparticles under selected conditions and thus the final shape of the nanoparticles after
being through many catalytic cycles at those conditions.
Figure 6 shows the ratio between the {100} and {111} surface areas as a function of tem-
perature and pressure. It should be noted that on reduced and doped surfaces within this
temperature and pressure range, the {110} surface is not expressed. Data for the stoichio-
metric CeO2 can be found in the supporting information. There are two key features from
the results. First, due to the increased stability of water on the doped {100} surfaces, these
surfaces will begin to be expressed (Forming truncated octahedral) under more extreme con-
ditions than for undoped reduced surface containing Ce3+. For example, our results suggest
that doped octahedral nanoparticles, used at ultra-high vacuum (-10 log10P) at 200 K, will
18

truncate to express {100} surfaces, whereas undoped reduced (Ce3+ containing) surfaces
will not. Whereas in contrast, nanocubes used at high temperatures, will be driven towards
{111} bearing octahedral nanoparticles.
19

Figure 6: Ratio between the {100}, {110} and {111} surface areas as a function of tempera-ture and pressure for the stoichiometric system. For visual clarity, nanoparticles correspond-ing to these ratios are shown. The ratio between the {100} and {111} reduced, Gd3+, Sm3+
and Y3+ doped systems as a function of temperature and pressure are shown. It should benoted that the {110} surface does not appear under these conditions for the doped systemsand has thus not been included. Predicted particle morphologies across a range of surfacearea rations are shown for visualization of these ratios.
20

Nanoparticle Transformation
Thus far we have considered the thermodynamics of nanoceria: from a nanocube, exposing
catalytically active {100} surfaces, to a nanopolyhedron with reduced exposure of active
facets. However, catalysts are typically operated at high temperatures, where the less active
(polyhedral) morphology is thermodynamically more stable. It is therefore important to
begin to understand the mechanism associated with the cube-to-polyhedron transformation,
and whether the kinetics can be controlled to preserve the material in its most active but
metastable form.67,68
Figure 7: (A) Surface rendered model of pure (left) and Gd3+ doped (right) ceria nanocubesheated to 4600K. start (cuboidal morphology), after 1 ns and after 13 ns (polyhedral mor-phology). Gd3+ atoms are shown as blue rendering to reveal more clearly their distributionin the nanoparticle. (B) Atoms on a {111} surface of a ceria nanoparticle move to occupypositions on {100} or {110} surfaces. Water molecules block the {100} surfaces hinderingthe kinetic transformation from cube to polyhedron. The water molecules are shown asschematic. Cerium is coloured white and oxygen is red. (C) Temperature of desorptionof water plotted as a function of the partial pressure of water. Only the {111} and {100}surfaces of Ce3+ reduced and Gd3+ doped surfaces are presented. For example, at 1 bar, thetemperature required to desorb water from a Gd3+ doped {100} surface (1130 K) is over 300K higher than from a Gd3+ doped {111} surface (815 K).
21

Accordingly, we simulated the (kinetic) transformation by heating a model ceria nanocube,
comprising 6921 CeO2 repeat units and six {100} surfaces, using molecular dynamics. Snap-
shots of the structure of a stoichiometric and a Gd3+ doped nanocube are shown in Figure
7A and reveal that both nanocubes transform to a nanopolyheda.
Analysis of the nanoceria structure as it evolves over time (MD trajectories) reveals that
the cube-to-polyhedron transformation is driven by the mass transport of surface ions from
{111} surfaces to {100} surfaces, Figure 7B; the {111} surfaces grow at the expense of {100}
surfaces. Blocking this mass transport would enable the nanoceria to exist longer in its most
catalytically activate active (cuboidal) morphology.
Typically capping of ceria {100} surfaces, using for example oleic acid, can protect {100}
surfaces. Indeed, different capping agents can be used to selectively control the morphology
of nanoceria.69 Accordingly, we hypothesize that the presence of water, adsorbed on the
{100} surfaces, will play a similar role to capping agents in blocking mass transport to {100}
surfaces and preserving the (desirable) cuboidal morphology, Figure 7B.
Our DFT data shows that water is preferentially stabilized on the doped {100} surfaces
relative to {111} surfaces (Figure 5 and Figure 7C). Accordingly, we predict that doping
by Gd3+ can protect metastable (cuboidal) morphologies In addition, experimental control
over the water (partial) pressure can be used to increase the desorption energy of water on
{100} surfaces, Figure 4; the temperature required to desorb water from the {100} increases
from about 650K to 1025K if the partial pressure of water is increase from 10-5 to 0.025 bar,
Figure 4, i.e. going from vacuum to humid conditions. Accordingly, high partial pressures
enable the blocking of {100} surfaces by water at higher (operating) temperatures.
Figure 7C shows the desorption temperature for water on the {111} and {100} reduced
and Gd3+ doped surfaces. The shaded region shows the p, T conditions on the reduced
surfaces where the {100} surface (Orange line) is being stabilized by water while the {111}
(Blue line) is not stabilized. As dopants destabilize water on the {111} surface and stabilize
22

water on the {100} surface, dopants increase the size of this shaded region (Green line /
Red Line). Therefore when seeking to stabilize cuboidal shaped nanoparticles there is a
requirement to be aware of the relative thermodynamic stabilization of the {111} and {100}
surfaces. Doping is clearly a way of changing the relative hydrophilicity of surfaces (i.e. this
is seen as the red and green lines in Figure 7C are further apart for Gd3+ compared to the
reduced surfaces). Water (partial) pressure could be controlled by experiment to increase
water affinity for {100} and preserve activity by retaining the structure in the cube form,
i.e. mass transport would be interrupted by having water adsorbed to {100} surfaces.
Discussion
The performance of nanoceria catalysts in the form of nanoparticles is strongly affected by the
type and nature of exposed surfaces. Recent advances in the preparation of ceria nanoparti-
cles have enabled the study of the effect of different facets on different catalytic process.60–66
Here, we have shown that the particle morphology strongly affects the interaction with water
and can potentially in turn impact upon catalytic reactions.
Ceria is used in diesel engines for the oxidation of soot,70 which is a major air-pollutants. The
presence of water vapor within the exhaust mixture has been shown to negatively affect the
catalyst behaviour.71 Dissociatively adsorbed water at the surface interferes with the NO2
assisted soot combustion mechanism (which exploits the high temperature induced oxidation
of NO to NO2). Surface OH groups act as adsorption sites for NO and thus hinder the
catalytic oxidation of NO to NO2. Sm and Y doped ceria has been shown to have enhanced
activity than its undoped counterpart for soot oxidation.72 At the operating temperatures
(500 - 900 K70) there is likely a dominance of {111} surfaces and our results indicate that
the OH groups desorb at lower temperatures relative to their undoped counterparts. Sm
doping could provide and effective strategy to reduce the impact of moisture within the
exhaust.
23

We have shown that on reduced surfaces, water dissociates in order to recover surface cerium
coordination. This represents the healing process that the surface undergoes in order to
regain surface stability. The dissociation of water is also a crucial process in the water gas
shift reaction (WGSR), which is used for the oxidation of CO to CO2 and reduction of H2O
to H2.73,74 Ceria is used in conjunction with a supported metal, usually Au or Pt. Two
mechanisms have been proposed for CeO2 catalysts in the WGSR. The first is the formate
route, where water dissociates at the surface, yielding OH groups, which react with CO to
form formates. H2 and CO2 are then formed from the decomposition of the intermediate
species. In this first route, the role of the metal is to allow the adsorption of CO and to
promote the cleavage of the C-H bond.75,76 The second mechanism is a redox route, where
reactive oxygen are transferred to the metal particles, leading to oxygen vacancies on the
ceria surface. These oxygen species then react with CO producing CO2, while H2O adsorbs
at the ceria surface to heal the oxygen vacancy.77,78 Although there is a debate on the two
mechanism, it is clear that water adsorption is essential in both routes and that water must
dissociate in some way at the surface of ceria. Surface selectivity towards water dissociation
has also been investigated and nanocubes expressing the {100} surface have been found
to promote the process compared to octahedral nanoparticles expressing the {111} surface
and nanorods expressing the {110} surface.62,79 Our results show that on reduced surfaces,
the dissociation of water is energetically favourable and sometimes barrier-less, with this
being the most favourable on the {100}. This provides an explanation for nanocubes having
the highest activity for the WGSR, given that water dissociation is strongest on the {100}
surface. Furthermore, we predict that Sm doping would further improve the activity of
nanocubes for the WGSR for two reasons, firstly, the interaction between water and the Sm
doped {100} surfaces is stronger, and secondly, water is stable at the surface at much higher
temperatures. This is not limited to the WGSR however and any process that requires surface
water dissociation would benefit from these observations. For example, water dissociation is
a key step in water splitting catalysts and in steam reforming of hydrocarbons.
24

Conclusions
We have shown that we can apply DFT modelling to aid in the interpretation of a number
of experimental observables, via surface phase diagram evaluation, which in turn allows the
prediction of nanoparticle morphology and nanoparticle evolution.
We show that by calculating reliable adsorption energies for water on different surfaces of
stoichiometric and doped CeO2, we can help in the development of a thermodynamic strategy
to evaluate the nanoparticle morphology of the materials as a function of temperature and
water partial pressure, two observables that can be controlled experimentally. We found
that there is a driving force towards cuboidal and octahedral morphologies at low and high
temperatures respectively, due to dopants reducing the affinity of water on {111} and {110}
surfaces, while increasing it on {100} surfaces.
Coupled with mechanistic studies using potential based MD, we predict that G3+ doping and
increasing water partial pressures increase the longevity of ceria nanoparticles in their active,
but metastable cuboidal morphology. The atomic-scale insights presented here quantify
the interaction between the doped surfaces of CeO2 and water, and we can begin to infer
their influence on the catalytic activity. Enhancing our fundamental understanding of these
interactions, as well as our predictive power and analysis, as we present here, provides a
valuable framework for the future optimization of energy and catalysis applications and can
be generally applicable to a range of materials
Author Information
Corresponding Author
* Adam R. Symington – [email protected]
* Stephen C. Parker - [email protected]
* Marco Molinari – [email protected]
25

ORCID
Adam R. Symington: 0000-0001-6059-497X
Samuel Moxon: 0000-0002-2972-5975
Marco Molinari: 0000-0001-7144-6075
Joseph M. Flitcroft: 0000-0001-8373-0233
Dean C. Sayle: 0000-0001-7227-9010
Stephen C. Parker: 0000-0003-3804-0975
Author Contributions
ARS, MM, SM, JMF and DS performed the calculations, ARS analysed the DFT data and
developed the surfinpy code,35 DS analysed the MD data, SCP and MM designed the study
and ARS wrote the paper with contributions from all authors.
Acknowledgement
We would like acknowledge AWE and EPSRC (EP/P007821/1, EP/R010366/1, EP/R023603/1,
EP/R513234/1, EP/M022617/1, EP/R513234/1, EP/M022617/1) for funding. Computa-
tions were run on Balena HPC facility at the University of Bath, the Orion computing facility
at the University of Huddersfield and the ARCHER UK National Supercomputing Service
(http://www.archer.ac.uk) via our membership of the UK’s HEC Materials Chemistry Con-
sortium (HEC MCC) funded by EPSRC (EP/L000202, EP/R029431); UK Materials and
Molecular Modelling Hub EPSRC (EP/P020194/1).
26

References
(1) Wu, J.; Tan, L. H.; Hwang, K.; Xing, H.; Wu, P.; Li, W.; Lu, Y. DNA Sequence-
Dependent Morphological Evolution of Silver Nanoparticles and Their Optical and
Hybridization Properties. Journal of the American Chemical Society 2014, 136, 15195–
15202.
(2) Compton, O. C.; Osterloh, F. E. Evolution of Size and Shape in the Colloidal Crystal-
lization of Gold Nanoparticles. Journal of the American Chemical Society 2007, 129,
7793–7798.
(3) Chen, P.-C.; Du, J. S.; Meckes, B.; Huang, L.; Xie, Z.; Hedrick, J. L.; Dravid, V. P.;
Mirkin, C. A. Structural Evolution of Three-Component Nanoparticles in Polymer
Nanoreactors. Journal of the American Chemical Society 2017, 139, 9876–9884.
(4) Latham, A. H.; Wilson, M. J.; Schiffer, P.; Williams, M. E. TEM-Induced Structural
Evolution in Amorphous Fe Oxide Nanoparticles. Journal of the American Chemical
Society 2006, 128, 12632–12633.
(5) Langille, M. R.; Personick, M. L.; Zhang, J.; Mirkin, C. A. Defining Rules for the Shape
Evolution of Gold Nanoparticles. Journal of the American Chemical Society 2012, 134,
14542–14554.
(6) Jasinski, P.; Suzuki, T.; Anderson, H. U. Nanocrystalline undoped ceria oxygen sensor.
Sensors and Actuators B: Chemical 2003, 95, 73 – 77.
(7) Elyassi, B.; Rajabbeigi, N.; Khodadadi, A.; Mohajerzadeh, S.; Sahimi, M. An yttria-
doped ceria-based oxygen sensor with solid-state reference. Sensors and Actuators B:
Chemical 2004, 103, 178 – 183.
(8) Kharton, V. V.; Figueiredo, F. M.; Navarro, L.; Naumovich, E. N.; Kovalevsky, A. V.;
Yaremchenko, A. A.; Viskup, A. P.; Carneiro, A.; Marques, F. M. B.; Frade, J. R.
27

Ceria-based materials for solid oxide fuel cells. Journal of Materials Science 2001, 36,
1105–1117.
(9) Kilner, J. A.; Burriel, M. Materials for Intermediate-Temperature Solid-Oxide Fuel
Cells. Annual Review of Materials Research 2014, 44, 365–393.
(10) Allen, J. P.; Grea, W.; Molinari, M.; Arrouvel, C.; Maglia, F.; Parker, S. C. Atom-
istic modelling of adsorption and segregation at inorganic solid interfaces. Molecular
Simulation 2009, 35, 584–608.
(11) Symington, A.; Molinari, M.; Statham, J.; Wu, J.; Parker, S. C. The role of dopant
segregation on the oxygen vacancy distribution and oxygen diffusion in CeO2 grain
boundaries. Journal of Physics: Energy 2019,
(12) Yao, H.; Yao, Y. Ceria in automotive exhaust catalysts: I. Oxygen storage. Journal of
Catalysis 1984, 86, 254 – 265.
(13) Chueh, W. C.; Falter, C.; Abbott, M.; Scipio, D.; Furler, P.; Haile, S. M.; Steinfeld, A.
High-Flux Solar-Driven Thermochemical Dissociation of CO2 and H2O Using Nonsto-
ichiometric Ceria. Science 2010, 330, 1797–1801.
(14) Molinari, M.; Symington, A. R.; Sayle, D. C.; Sakthivel, T. S.; Seal, S.; Parker, S. C.
Computer-Aided Design of Nanoceria Structures as Enzyme Mimetic Agents: The Role
of Bodily Electrolytes on Maximizing Their Activity. ACS Applied Bio Materials 2019,
2, 1098–1106.
(15) Karakoti, A. S.; Monteiro-Riviere, N. A.; Aggarwal, R.; Davis, J. P.; Narayan, R. J.;
Self, W. T.; McGinnis, J.; Seal, S. Nanoceria as antioxidant: Synthesis and biomedical
applications. JOM 2008, 60, 33–37.
(16) Sakai, N.; Yamaji, K.; Horita, T.; Xiong, Y. P.; Kishimoto, H.; Yokokawa, H. Effect
of Water on Oxygen Transport Properties on Electrolyte Surface in SOFCs: I. Surface
28
Reaction Mechanism of Oxygen Isotope Exchange on Solid Oxide Electrolytes. Journal
of The Electrochemical Society 2003, 150, A689–A694.
(17) Sakai, N.; Yamaji, K.; Xiong, Y. P.; Kishimoto, H.; Horita, T.; Yokokawa, H. Interaction
between Water and Ceria-Zirconia-Yttria Solid Solutions. Journal of Electroceramics
2004, 13, 677–682.
(18) Mogensen, M.; Jensen, K. V.; rgensen, M. J. J.; ren Primdahl, S. Progress in under-
standing SOFC electrodes. Solid State Ionics 2002, 150, 123 – 129, Ringberg Workshop
2000 Special Issue.
(19) Molinari, M.; Parker, S. C.; Sayle, D. C.; Islam, M. S. Water Adsorption and Its
Effect on the Stability of Low Index Stoichiometric and Reduced Surfaces of Ceria. The
Journal of Physical Chemistry C 2012, 116, 7073–7082.
(20) Kumar, S.; Schelling, P. K. Density functional theory study of water adsorption at
reduced and stoichiometric ceria (111) surfaces. The Journal of Chemical Physics 2006,
125, 204704.
(21) Kumar, A.; Das, S.; Munusamy, P.; Self, W.; Baer, D. R.; Sayle, D. C.; Seal, S. Behavior
of nanoceria in biologically-relevant environments. Environ. Sci.: Nano 2014, 1, 516–
532.
(22) Fronzi, M.; Piccinin, S.; Delley, B.; Traversa, E.; Stampfl, C. Water adsorption on the
stoichiometric and reduced CeO2(111) surface: a first-principles investigation. Phys.
Chem. Chem. Phys. 2009, 11, 9188–9199.
(23) Montini, T.; Melchionna, M.; Monai, M.; Fornasiero, P. Fundamentals and Catalytic
Applications of CeO2-Based Materials. Chemical Reviews 2016, 116, 5987–6041.
(24) Kresse, G.; Hafner, J. Ab initio molecular-dynamics simulation of the liquid-metal–
29

amorphous-semiconductor transition in germanium. Phys. Rev. B 1994, 49, 14251–
14269.
(25) Kresse, G.; Furthmuller, J. Efficient iterative schemes for ab initio total-energy calcu-
lations using a plane-wave basis set. Phys. Rev. B 1996, 54, 11169–11186.
(26) Dudarev, S. L.; Botton, G. A.; Savrasov, S. Y.; Humphreys, C. J.; Sutton, A. P.
Electron-energy-loss spectra and the structural stability of nickel oxide: An LSDA+U
study. Phys. Rev. B 1998, 57, 1505–1509.
(27) Nolan, M.; Parker, S. C.; Watson, G. W. The electronic structure of oxygen vacancy
defects at the low index surfaces of ceria. Surface Science 2005, 595, 223 – 232.
(28) Nolan, M.; Parker, S. C.; Watson, G. W. The electronic structure of oxygen vacancy
defects at the low index surfaces of ceria. Surface Science 2005, 595, 223 – 232.
(29) Sun, Q.; Reuter, K.; Scheffler, M. Effect of a humid environment on the surface structure
of RuO2(110). Phys. Rev. B 2003, 67, 205424.
(30) Kerisit, S.; Marmier, A.; Parker, S. C. Ab Initio Surface Phase Diagram of the 1014
Calcite Surface. The Journal of Physical Chemistry B 2005, 109, 18211–18213.
(31) Wulff, G. Zur Frage der Geschwindigkeit des Wachsthums und der Auflosung der Krys-
tallflachen. Crystalline Materials 1901, 34, 449.
(32) Watson, G. W.; Kelsey, E. T.; de Leeuw, N. H.; Harris, D. J.; Parker, S. C. Atomistic
simulation of dislocations, surfaces and interfaces in MgO. J. Chem. Soc., Faraday
Trans. 1996, 92, 433–438.
(33) Oliver, P. M.; Parker, S. C.; Mackrodt, W. C. Computer simulation of the crystal
morphology of NiO. Modelling and Simulation in Materials Science and Engineering
1993, 1, 755–760.
30

(34) Oliver, P. M.; Parker, S. C.; Mackrodt, W. C. Computer simulation of the crystal
morphology of NiO. Modelling and Simulation in Materials Science and Engineering
1993, 1, 755.
(35) Symington, A.; Tse, J.; Molinari, M.; Marmier, A.; Parker, S. surfinpy: A Surface
Phase Diagram Generator. Journal of Open Source Software 2019, 4, 1210.
(36) Tran, R.; Xu, Z.; Radhakrishnan, B.; Winston, D.; Sun, W.; Persson, K. A.; Ong, S. P.
Surface energies of elemental crystals. Scientific Data 2016, 3, 160080.
(37) Momma, K.; Izumi, F. VESTA3 for three-dimensional visualization of crystal, volumet-
ric and morphology data. Journal of Applied Crystallography 2011, 44, 1272–1276.
(38) Caddeo, F.; Corrias, A.; Sayle, D. C. Tuning the Properties of Nanoceria by Applying
Force: Stress-Induced Ostwald Ripening. The Journal of Physical Chemistry C 2016,
120, 14337–14344.
(39) Smith, W.; Forester, T. DLPOLY2.0: A general-purpose parallel molecular dynamics
simulation package. Journal of Molecular Graphics 1996, 14, 136 – 141.
(40) Morgan, L. M.; Molinari, M.; Corrias, A.; Sayle, D. C. Protecting Ceria Nanocatalysts-
The Role of Sacrificial Barriers. ACS Applied Materials & Interfaces 2018, 10, 32510–
32515.
(41) Bhatta, U. M.; Reid, D.; Sakthivel, T.; Sayle, T. X. T.; Sayle, D.; Molinari, M.;
Parker, S. C.; Ross, I. M.; Seal, S.; Mobus, G. Morphology and Surface Analysis of
Pure and Doped Cuboidal Ceria Nanoparticles. The Journal of Physical Chemistry C
2013, 117, 24561–24569.
(42) Sayle, T. X. T.; Molinari, M.; Das, S.; Bhatta, U. M.; Mobus, G.; Parker, S. C.; Seal, S.;
Sayle, D. C. Environment-mediated structure, surface redox activity and reactivity of
ceria nanoparticles. Nanoscale 2013, 5, 6063–6073.
31

(43) Sayle, T. X. T.; Cantoni, M.; Bhatta, U. M.; Parker, S. C.; Hall, S. R.; Mobus, G.;
Molinari, M.; Reid, D.; Seal, S.; Sayle, D. C. Strain and Architecture-Tuned Reactivity
in Ceria Nanostructures; Enhanced Catalytic Oxidation of CO to CO2. Chemistry of
Materials 2012, 24, 1811–1821.
(44) Sayle, T. X. T.; Inkson, B. J.; Karakoti, A.; Kumar, A.; Molinari, M.; Mobus, G.;
Parker, S. C.; Seal, S.; Sayle, D. C. Mechanical properties of ceria nanorods and
nanochains; the effect of dislocations, grain-boundaries and oriented attachment.
Nanoscale 2011, 3, 1823–1837.
(45) Minervini, L.; Zacate, M. O.; Grimes, R. W. Defect cluster formation in M2O3-doped
CeO2. Solid State Ionics 1999, 116, 339 – 349.
(46) Humphrey, W.; Dalke, A.; Schulten, K. VMD: Visual molecular dynamics. Journal of
Molecular Graphics 1996, 14, 33 – 38.
(47) Skorodumova, N. V.; Baudin, M.; Hermansson, K. Surface properties of CeO2 from first
principles. Phys. Rev. B 2004, 69, 075401.
(48) Keating, P. R. L.; Scanlon, D. O.; Watson, G. W. Intrinsic ferromagnetism in CeO2:
dispelling the myth of vacancy site localization mediated superexchange. Journal of
Physics: Condensed Matter 2009, 21, 405502.
(49) Nolan, M.; Parker, S. C.; Watson, G. W. Reduction of NO2 on Ceria Surfaces. The
Journal of Physical Chemistry B 2006, 110, 2256–2262.
(50) Scanlon, D. O.; Morgan, B. J.; Watson, G. W. The origin of the enhanced oxygen
storage capacity of Ce1-x(Pd/Pt)xO2. Phys. Chem. Chem. Phys. 2011, 13, 4279–4284.
(51) Jeyaranjan, A.; Sakthivel, T. S.; Molinari, M.; Sayle, D. C.; Seal, S. Morphology and
Crystal Planes Effects on Supercapacitance of CeO2 Nanostructures: Electrochemical
32

and Molecular Dynamics Studies. Particle & Particle Systems Characterization 2018,
35, 1800176.
(52) Mullins, D. R.; Albrecht, P. M.; Chen, T.-L.; Calaza, F. C.; Biegalski, M. D.; Chris-
ten, H. M.; Overbury, S. H. Water Dissociation on CeO2(100) and CeO2(111) Thin
Films. The Journal of Physical Chemistry C 2012, 116, 19419–19428.
(53) Watkins, M. B.; Foster, A. S.; Shluger, A. L. Hydrogen Cycle on CeO2 (111) Surfaces:
A Density Functional Theory Calculations. The Journal of Physical Chemistry C 2007,
111, 15337–15341.
(54) Perez-Coll, D.; Mather, G. C. Electrical transport at low temperatures in dense
nanocrystalline Gd-doped ceria. Solid State Ionics 2010, 181, 20 – 26.
(55) Kossoy, A.; Cohen, H.; Bendikov, T.; Wachtel, E.; Lubomirsky, I. Water adsorption at
the surface of pure and Gd-doped ceria. Solid State Ionics 2011, 194, 1 – 4.
(56) Tegner, B. E.; Molinari, M.; Kerridge, A.; Parker, S. C.; Kaltsoyannis, N. Water Ad-
sorption on AnO2 111, 110, and 100 Surfaces (An = U and Pu): A Density Functional
Theory + U Study. The Journal of Physical Chemistry C 2017, 121, 1675–1682.
(57) Chen, B.; Ma, Y.; Ding, L.; Xu, L.; Wu, Z.; Yuan, Q.; Huang, W. Reactivity of
Hydroxyls and Water on a CeO2(111) Thin Film Surface: The Role of Oxygen Vacancy.
The Journal of Physical Chemistry C 2013, 117, 5800–5810.
(58) Trovarelli, A.; Llorca, J. Ceria Catalysts at Nanoscale: How Do Crystal Shapes Shape
Catalysis? ACS Catalysis 2017, 7, 4716–4735.
(59) McDowell, M. T.; Lichterman, M. F.; Carim, A. I.; Liu, R.; Hu, S.; Brunschwig, B. S.;
Lewis, N. S. The Influence of Structure and Processing on the Behavior of TiO2 Protec-
tive Layers for Stabilization of n-Si/TiO2/Ni Photoanodes for Water Oxidation. ACS
Applied Materials & Interfaces 2015, 7, 15189–15199.
33

(60) Florea, I.; Feral-Martin, C.; Majimel, J.; Ihiawakrim, D.; Hirlimann, C.; Ersen, O.
Three-Dimensional Tomographic Analyses of CeO2 Nanoparticles. Crystal Growth &
Design 2013, 13, 1110–1121.
(61) Si, R.; Flytzani-Stephanopoulos, M. Shape and Crystal-Plane Effects of Nanoscale Ceria
on the Activity of Au-CeO2 Catalysts for the Water Gas Shift Reaction. Angewandte
Chemie International Edition 2008, 47, 2884–2887.
(62) Mai, H.-X.; Sun, L.-D.; Zhang, Y.-W.; Si, R.; Feng, W.; Zhang, H.-P.; Liu, H.-C.;
Yan, C.-H. Shape-Selective Synthesis and Oxygen Storage Behavior of Ceria Nanopoly-
hedra, Nanorods, and Nanocubes. The Journal of Physical Chemistry B 2005, 109,
24380–24385.
(63) Asahina, S.; Takami, S.; Otsuka, T.; Adschiri, T.; Terasaki, O. Exploitation of Surface-
Sensitive Electrons in Scanning Electron Microscopy Reveals the Formation Mechanism
of New Cubic and Truncated Octahedral CeO2 Nanoparticles. ChemCatChem 2011,
3, 1038–1044.
(64) Yang, C.; Yu, X.; Heiayler, S.; Nefedov, A.; Colussi, S.; Llorca, J.; Trovarelli, A.;
Wang, Y.; Wall, C. Surface Faceting and Reconstruction of Ceria Nanoparticles. Ange-
wandte Chemie International Edition 2017, 56, 375–379.
(65) Crozier, P. A.; Wang, R.; Sharma, R. In situ environmental TEM studies of dynamic
changes in cerium-based oxides nanoparticles during redox processes. Ultramicroscopy
2008, 108, 1432 – 1440.
(66) Lin, Y.; Wu, Z.; Wen, J.; Poeppelmeier, K. R.; Marks, L. D. Imaging the Atomic
Surface Structures of CeO2 Nanoparticles. Nano Letters 2014, 14, 191–196.
(67) Castanet, U.; Feral-Martin, C.; Demourgues, A.; Neale, R. L.; Sayle, D. C.; Caddeo, F.;
Flitcroft, J. M.; Caygill, R.; Pointon, B. J.; Molinari, M.; Majimel, J. Controlling
34
the 111/110 Surface Ratio of Cuboidal Ceria Nanoparticles. ACS Applied Materials &
Interfaces 2019, 11, 11384–11390.
(68) Asghar, M. S. A.; Inkson, B.; Seal, S.; Molinari, M.; Sayle, D.; Mobus, G. In-situ
observation of radiation physics and chemistry of nanostructured cerium oxide in water.
Materials Research Express 2018, 6, 015032.
(69) Raza Naqvi, S. T.; Shirinfar, B.; Majeed, S.; Najam-ul Haq, M.; Hussain, D.; Iqbal, T.;
Ahmed, N. Synthesis, design and sensing applications of nanostructured ceria-based
materials. Analyst 2018, 143, 5610–5628.
(70) LIU, S.; WU, X.; WENG, D.; RAN, R. Ceria-based catalysts for soot oxidation: a
review. Journal of Rare Earths 2015, 33, 567 – 590.
(71) Hernandez-Gimenez, A. M.; Lozano-Castello, D.; Bueno-Lopez, A. Effect of CO2, H2O
and SO2 in the ceria-catalyzed combustion of soot under simulated diesel exhaust con-
ditions. Applied Catalysis B: Environmental 2014, 148-149, 406 – 414.
(72) Krishna, K.; Bueno-Lopez, A.; Makkee, M.; Moulijn, J. Potential rare earth modified
CeO2 catalysts for soot oxidation: I. Characterisation and catalytic activity with O2.
Applied Catalysis B: Environmental 2007, 75, 189 – 200.
(73) Pal, D.; Chand, R.; Upadhyay, S.; Mishra, P. Performance of water gas shift reaction
catalysts: A review. Renewable and Sustainable Energy Reviews 2018, 93, 549 – 565.
(74) Trimm, D. Minimisation of carbon monoxide in a hydrogen stream for fuel cell appli-
cation. Applied Catalysis A: General 2005, 296, 1 – 11.
(75) Shido, T.; Iwasawa, Y. Regulation of reaction intermediate by reactant in the water-
gas shift reaction on CeO2, in relation to reactant-promoted mechanism. Journal of
Catalysis 1992, 136, 493 – 503.
35

(76) Shido, T.; Iwasawa, Y. Reactant-Promoted Reaction Mechanism for Water-Gas Shift
Reaction on Rh-Doped CeO2. Journal of Catalysis 1993, 141, 71 – 81.
(77) Zafiris, G.; Gorte, R. Evidence for Low-Temperature Oxygen Migration from Ceria to
Rh. Journal of Catalysis 1993, 139, 561 – 567.
(78) Zafiris, G.; Gorte, R. Evidence for a Second CO Oxidation Mechanism on Rh/Ceria.
Journal of Catalysis 1993, 143, 86 – 91.
(79) Wu, Z.; Li, M.; Overbury, S. H. On the structure dependence of CO oxidation over
CeO2 nanocrystals with well-defined surface planes. Journal of Catalysis 2012, 285,
61 – 73.
36

download fileview on ChemRxivManuscript.pdf (3.40 MiB)


![The Effect of Temperature on Moisture Transport in Concrete · deterioration of concrete [1–3]. The moisture curing condition strongly affects the hydration degree and strength](https://img.pdfslide.net/doc/110x75/5fb79836fa684745da401635/the-effect-of-temperature-on-moisture-transport-in-concrete-deterioration-of-concrete.jpg)