Embed Size (px)
Citation preview
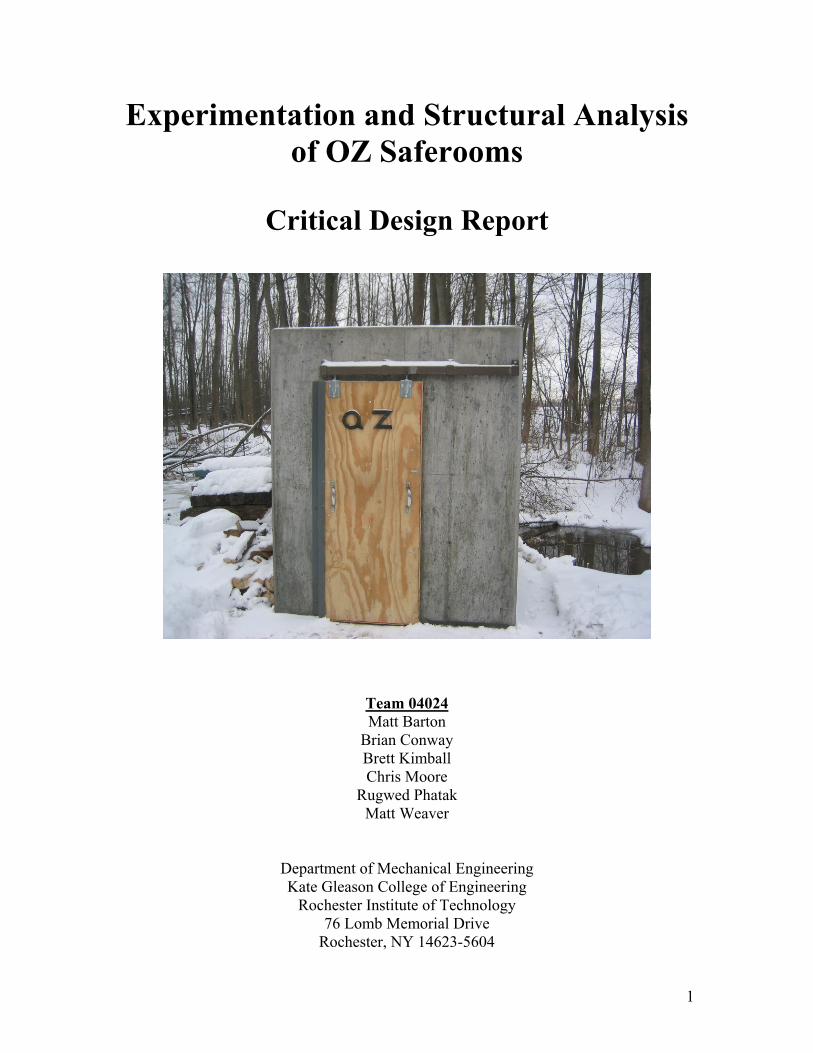
Experimentation and Structural Analysis of OZ Saferooms
Critical Design Report
Team 04024 Matt Barton
Brian Conway Brett Kimball Chris Moore
Rugwed Phatak Matt Weaver
Department of Mechanical Engineering Kate Gleason College of Engineering
Rochester Institute of Technology 76 Lomb Memorial Drive
Rochester, NY 14623-5604
1
Executive Summary
This report summarizes the progress made by the OZ Saferoom Senior Design Team. The goal of this project is to structurally analyze and determine the survivability of OZ Saferooms. This project will assist Zagorski Forms Specialists, Inc. by providing them with structural analysis and experimental data. Oz Saferooms are continuously poured, above ground, steel-reinforced concrete structures designed to withstand natural disasters. The existing OZ Saferooms have outside dimensions of 78 in. x 78 in. x 92 in., and are made of 5000 psi concrete. These structures are primarily built in tornado prone areas. The team used the Engineering Design Guide (EDGETM) methodology to structurally analyze and design experimentation for OZ Saferooms. All five facets of this process have been completed. The first facet or chapter of the report, recognize and quantify the need and statement of work, discuss the goals and motivation for the project. The second chapter presents an overview of the three deliverables and subsequent concepts the team has developed. The third chapter presents the feasibility assessment the team conducted on all deliverables and concepts. The fourth section presents a detailed description of the goals and specifications of the project. The fifth and sixth sections present the analysis and synthesis of each concept designs. The final chapter of the report provides suggestions and opportunities for further analysis of OZ Saferooms. Through this design process, many ideas evolved regarding different ways to analyze and sense damage to an OZ Saferoom structure. Three ideas include ASTM standard mechanical properties testing of concrete samples, finite element analysis, and experimental impact testing of an existing OZ Saferoom structure. Testing was conducted on concrete samples provided by the project sponsor, as well as experimental impact testing of an existing structure located in Macedon, NY. This was done to determine the mechanical properties of concrete and the dynamic response of the OZ Saferoom structure subjected to an impact test.
2
Table of Contents Executive Summary ............................................................................................................ 2 List of Illustrations.............................................................................................................. 6 1 Assessment.................................................................................................................. 7
1.1 Scope Limitations ............................................................................................... 9 1.2 Stakeholders........................................................................................................ 9 1.3 Key Business Goals of Zagorski Forms Specialists, Inc. ................................... 9 1.4 Financial Analysis............................................................................................. 10 1.5 Statement of Work ............................................................................................ 10
2 Concept Development............................................................................................... 11 2.1 Concrete Sample Testing Concept.................................................................... 12 2.2 Finite Element Analysis Concept...................................................................... 14 2.3 Experimental Impact Testing Concept.............................................................. 15
2.3.1 Laser Pointer Concept............................................................................... 15 2.3.2 Strain Gauge Concept ............................................................................... 16 2.3.3 Accelerometer Concept............................................................................. 16
3 Feasibility Assessment.............................................................................................. 17 3.1 Concrete Sample Testing Feasibility ................................................................ 18 3.2 FEA Feasibility ................................................................................................. 19 3.3 Experimental Impact Testing Feasibility .......................................................... 20
3.3.1 Laser Pointer Feasibility ........................................................................... 22 3.3.2 Strain Gauge Feasibility............................................................................ 23 3.3.3 Accelerometer Feasibility ......................................................................... 24
3.4 Feasibility Conclusion ...................................................................................... 26 4 Performance Objectives and Specifications.............................................................. 26
4.1 Design Objectives ............................................................................................. 27 4.2 Performance Specifications .............................................................................. 28
5 Analysis of Problem and Synthesis of Design.......................................................... 28 5.1 Concrete Sample Testing .................................................................................. 29
5.1.1 Three-Point Bending................................................................................. 29 5.1.2 Compression Testing ................................................................................ 30 5.1.3 Data Analysis ............................................................................................ 31
5.2 Preliminary Finite Element Analysis ................................................................ 32 5.2.1 Analysis of Reinforced Concrete Slab...................................................... 35 5.2.2 Structural Integrity of OZ Saferooms ....................................................... 36 5.2.3 Wind Load Analysis ................................................................................. 39
5.3 Experimental Impact Testing............................................................................ 43 5.3.1 Determination of Load.............................................................................. 43 5.3.2 Data Acquisition ....................................................................................... 44 5.3.3 Impact Testing Analysis ........................................................................... 45
5.3.3.1 Frequency Analysis........................................................................ 48 6 Sensor Package Design ............................................................................................. 50
6.1 Accelerometer Mounting .................................................................................. 50 6.2 Data Acquisition Equipment............................................................................. 52
7 Future Suggestions and Opportunities ...................................................................... 52
3
7.1 Finite Element Analysis.................................................................................... 52 7.2 Impact Testing .................................................................................................. 53
8 Project Schedule........................................................................................................ 54 9 Budget ....................................................................................................................... 55 10 References............................................................................................................. 56 11 Appendix A........................................................................................................... 57
11.1 Feasibility Assessment...................................................................................... 57 11.1.1 Weighted Method...................................................................................... 57 11.1.2 Radar Chart ............................................................................................... 58
12 Appendix B ........................................................................................................... 59 12.1 78 in. x 78 in. x 92 in. Structure Finite Element Model ................................... 59
12.1.1 Mesh.......................................................................................................... 59 12.1.2 Preliminary Deflection Results ................................................................. 61 12.1.3 Preliminary Stress Results ........................................................................ 62 12.1.4 Failure Analysis – Roof ............................................................................ 63 12.1.5 Failure Analysis – Wall ............................................................................ 64
12.2 102 in. x 102 in. x 92 in. Structure Finite Element Model ............................... 65 12.2.1 Mesh.......................................................................................................... 65 12.2.2 Preliminary Deflection Results ................................................................. 67 12.2.3 Preliminary Stress Results ........................................................................ 68 12.2.4 Failure Analysis – Roof ............................................................................ 69 12.2.5 Failure Analysis - Wall ............................................................................. 70
12.3 126 in. x 126 in. x 92 in. Structure Finite Element Model ............................... 71 12.3.1 Mesh.......................................................................................................... 71 12.3.2 Preliminary Deflection Results ................................................................. 73 12.3.3 Preliminary Stress Results ........................................................................ 74 12.3.4 Failure Analysis – Roof ............................................................................ 75 12.3.5 Failure Analysis - Wall ............................................................................. 76
12.4 20 ft. x 30 ft. x 92 in. Structure Finite Element Model..................................... 77 12.4.1 Mesh.......................................................................................................... 77 12.4.2 Preliminary Deflection Results ................................................................. 79 12.4.3 Preliminary Stress Results ........................................................................ 80 12.4.4 Failure Analysis – Roof ............................................................................ 81 12.4.5 Failure Analysis - Wall ............................................................................. 82
13 Appendix C ........................................................................................................... 83 13.1 Finite Element Analysis – Roof Slab................................................................ 83
14 Appendix D........................................................................................................... 84 14.1 Modal Analysis of Roof using I-DEAS............................................................ 84
15 Appendix E ........................................................................................................... 86 15.1 MATLAB Code for Impact Testing Analysis .................................................. 86 15.2 Theoretical Hand Calculations.......................................................................... 87
16 Appendix F............................................................................................................ 88 16.1 Concrete Sample Testing Procedure................................................................. 88
17 Appendix G........................................................................................................... 91 17.1 Mechanical Drawings ....................................................................................... 91 17.2 Spec Sheets ....................................................................................................... 91
4

18 Appendix H........................................................................................................... 92 18.1 Bill of Materials ................................................................................................ 92
19 Appendix I ............................................................................................................ 93 19.1 Gant Chart......................................................................................................... 93 19.2 Work Breakdown Structure .............................................................................. 94 19.3 Design Structure Matrix.................................................................................... 95
5
List of Illustrations Figure 1: OZ Saferoom after Tornado Impact ................................................................... 7 Figure 2: Compression Test Concept............................................................................... 13 Figure 3: 3-Point Bending Setup...................................................................................... 14 Figure 4: Concrete Sample Testing BOM ....................................................................... 18 Figure 5: Estimation of Relative Importance of Attributes ............................................. 20 Figure 6: Impact Testing Concept Comparison ............................................................... 21 Figure 7: Impact Testing Radar Chart ............................................................................. 22 Figure 8: Strain Gauge and Data Acquisition System BOM ........................................... 24 Figure 9: Accelerometer and Data Acquisition System BOM......................................... 26 Figure 10: 3-point bending setup ..................................................................................... 29 Figure 11: 3-point bending results ................................................................................... 30 Figure 12: Compression testing results............................................................................ 31 Figure 13: 78 in. x 78 in. x 92 in. Structure Mesh Values ............................................... 34 Figure 14: 102 in. x 102 in. x 92 in. Structure Mesh Values ........................................... 34 Figure 15: 126 in. x 126 in. x 92 in. Structure Mesh Values .......................................... 34 Figure 16: 20 ft. x 30 ft. x 92 in. Structure Mesh Values ................................................ 34 Figure 17: Reinforced concrete roof ................................................................................ 36 Figure 18: 38 psi distributed pressure applied to the roof ............................................... 38 Figure 19: 5.5 psi distributed pressure applied to the wall .............................................. 38 Figure 20: FEA failure analysis ....................................................................................... 39 Figure 21: Internal Pressure Coefficients ........................................................................ 40 Figure 22: Wind Load Determination.............................................................................. 42 Figure 23: 250 mph wind pressure analysis..................................................................... 42 Figure 24: Mounted accelerometer .................................................................................. 45 Figure 25: Acceleration signal from impact test.............................................................. 47 Figure 26: Roof's deflection............................................................................................. 47 Figure 27: Frequency content of impact test.................................................................... 49 Figure 28: First mode frequency of 312 Hz..................................................................... 49 Figure 29: Cross-section of roof, rebar, and anchor bolt ................................................. 50 Figure 30: Accelerometer locations – roof ...................................................................... 51 Figure 31: Accelerometer locations – wall ...................................................................... 51 Figure 32: Sensor package items ..................................................................................... 52
6
1 Assessment
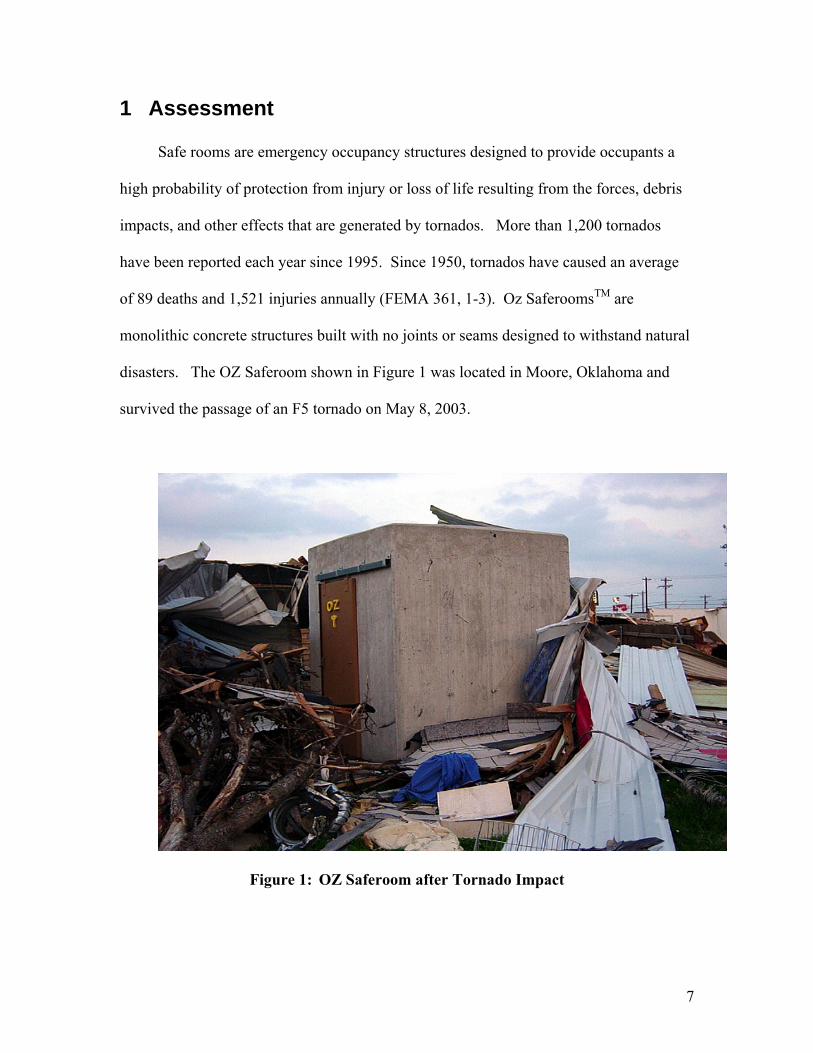
Safe rooms are emergency occupancy structures designed to provide occupants a
high probability of protection from injury or loss of life resulting from the forces, debris
impacts, and other effects that are generated by tornados. More than 1,200 tornados
have been reported each year since 1995. Since 1950, tornados have caused an average
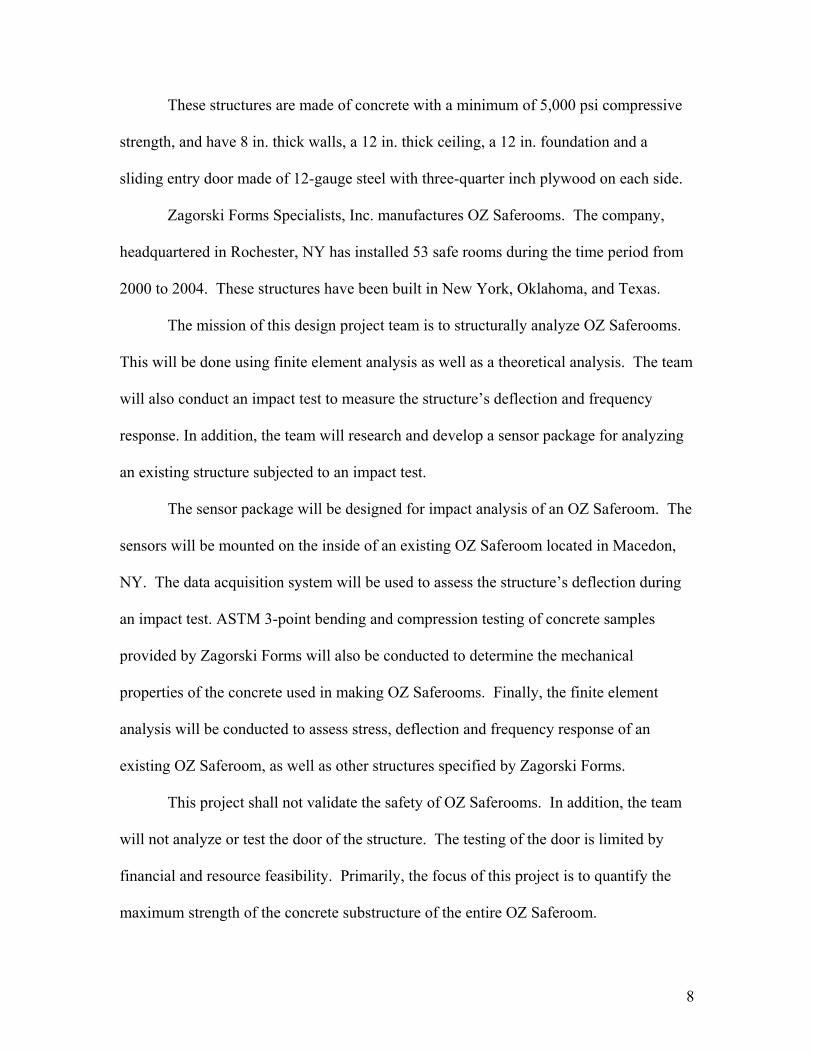
of 89 deaths and 1,521 injuries annually (FEMA 361, 1-3). Oz SaferoomsTM are
monolithic concrete structures built with no joints or seams designed to withstand natural
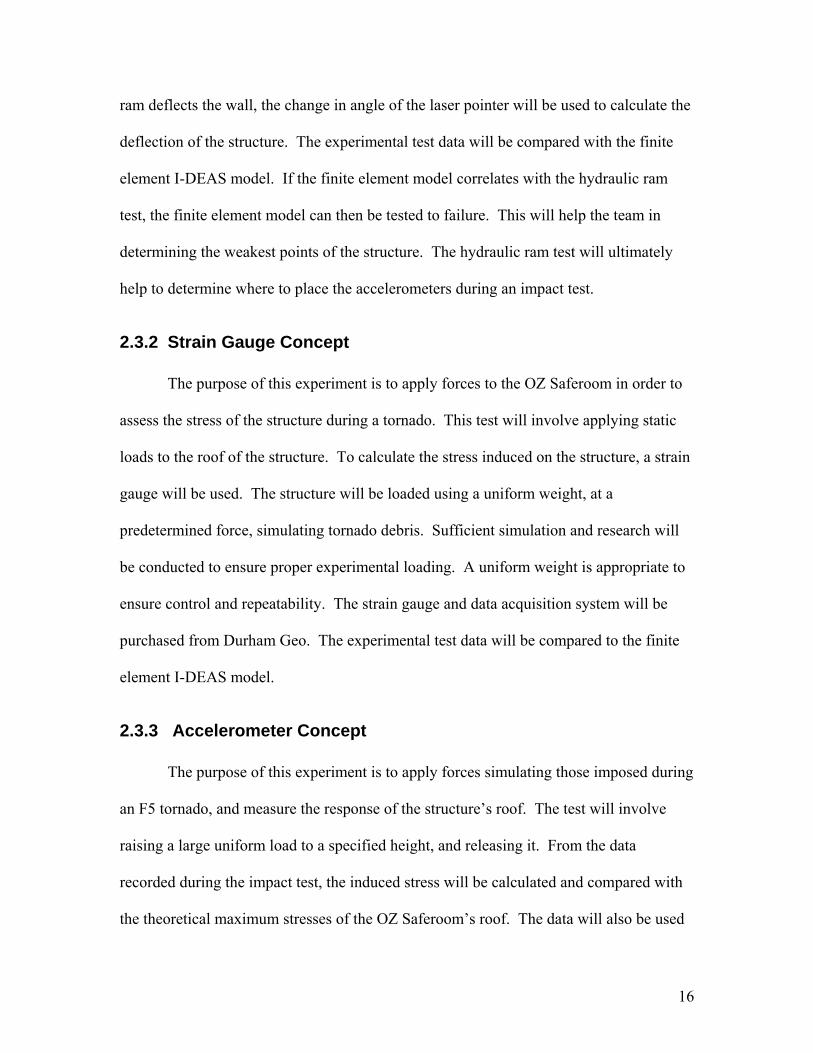
disasters. The OZ Saferoom shown in Figure 1 was located in Moore, Oklahoma and
survived the passage of an F5 tornado on May 8, 2003.
Figure 1: OZ Saferoom after Tornado Impact
7
These structures are made of concrete with a minimum of 5,000 psi compressive
strength, and have 8 in. thick walls, a 12 in. thick ceiling, a 12 in. foundation and a
sliding entry door made of 12-gauge steel with three-quarter inch plywood on each side.
Zagorski Forms Specialists, Inc. manufactures OZ Saferooms. The company,
headquartered in Rochester, NY has installed 53 safe rooms during the time period from
2000 to 2004. These structures have been built in New York, Oklahoma, and Texas.
The mission of this design project team is to structurally analyze OZ Saferooms.
This will be done using finite element analysis as well as a theoretical analysis. The team
will also conduct an impact test to measure the structure’s deflection and frequency
response. In addition, the team will research and develop a sensor package for analyzing
an existing structure subjected to an impact test.
The sensor package will be designed for impact analysis of an OZ Saferoom. The
sensors will be mounted on the inside of an existing OZ Saferoom located in Macedon,
NY. The data acquisition system will be used to assess the structure’s deflection during
an impact test. ASTM 3-point bending and compression testing of concrete samples
provided by Zagorski Forms will also be conducted to determine the mechanical
properties of the concrete used in making OZ Saferooms. Finally, the finite element
analysis will be conducted to assess stress, deflection and frequency response of an
existing OZ Saferoom, as well as other structures specified by Zagorski Forms.
This project shall not validate the safety of OZ Saferooms. In addition, the team
will not analyze or test the door of the structure. The testing of the door is limited by
financial and resource feasibility. Primarily, the focus of this project is to quantify the
maximum strength of the concrete substructure of the entire OZ Saferoom.
8
1.1 Scope Limitations
The project budget for this senior design project shall not exceed two thousand
dollars for all materials and testing. The sensor package and all accompanying work
shall be completed and deliverables submitted to the primary customer no later than May
21, 2004. These deliverables will include a sensor package which is capable of
measuring the deflections associated with an experimental test of an OZ Saferoom.
Furthermore, finite element analysis of multiple sized OZ Saferooms will be delivered to
analyze their stability after being subjected to tornado-like conditions.
The senior design team shall not validate the safety of OZ Saferooms. In
addition, the team will not analyze or test the door of the structure. The testing of the
door is limited by financial and resource feasibility. Primarily, the focus of this project is
to structurally analyze and determine the survivability of these structures.
1.2 Stakeholders
Stakeholders who have an interest in this senior design project include Zagorski
Forms Specialists, Inc., families and owners of safe rooms, the Federal Emergency
Management Agency (FEMA), Rochester Institute of Technology, local authorities, and
rescue workers.
1.3 Key Business Goals of Zagorski Forms Specialists, Inc. Through this project, Zagorksi Forms Specialists hope to obtain a quantification of the
strength and durability of their structure. This will aid them in becoming the premier
builder of tornado shelters for residential and municipal applications. It will also allow
9
funding from the Oklahoma State Government in order make OZ Saferooms more
affordable to everyone. These goals are further detailed below:
• Providing sensor, data acquisition, and instrumentation in support of refining OZ
Saferooms
• Impact test on the structure to quantify its survivability
• Analysis will encourage FEMA to primarily support Zagorski Forms Specialists,
Inc.
• Analysis will encourage consumers to buy product
• Revise FEMA guidelines to raise safe room standards
• Increase state funding for rebates upon purchase
1.4 Financial Analysis The following parameters describe the dominant issues relating to the sensor package.
• Cost of sensor package
• Experimental testing cost
• Number of sensors for experimental testing
• Data acquisition hardware and software
• Implementation costs
1.5 Statement of Work Senior Design team 04024 shall deliver the following by May 21, 2004:
• Structural analysis of steel-reinforced concrete structure
10
• Finite element analysis on existing 6’-6” x 6’-6” x 7’-8” structure, as well as 8’-6”
x 8’-6” x 7’-8” and 10’-6” x 10’-6” x 7’-8” structures (Note: All outside
dimensions)
• Finite element analysis on Zagorski Forms’ preliminary design of a 20’x30’
structure
• ASTM standards C 39 and C 78-02 for compression and three-point bending test
data to determine the mechanical properties of the concrete used in making OZ
Saferooms.
• Impact testing on an existing OZ Saferoom to provide data in determining the
deflections associated with various impact loads.
• Design of a sensor package for analyzing future OZ Saferoom structures
subjected to an impact test.
• Technical report documenting all structural analysis, test results, the
instrumentation package, and recommendations for future work.
2 Concept Development
The objective of this project is to develop methods to quantify survivability of the
OZ Saferoom structure, excluding the door. With this in mind, the first brainstorming
session began with a list of all possible ideas to achieve the tasks appointed by our
sponsor. All preliminary suggestions were accepted without discretion. The proposals
were then voted on by all team members, yielding the top three choices to be developed.
Each of the three concepts were then sketched on paper and expanded upon by every
member to develop the specific details. All team members were given two minutes to
input additional details. Sub-teams were then assigned the task of preparing assembly
11
sketches and reporting back to the group. The three sketches were revised and presented
into a more formal set of drawings. These ideas consisted of mechanical properties
testing of concrete, finite element analysis, and experimental impact testing of an OZ
Saferoom.
These concepts were further developed using the “Empathy Method”. In this
exercise, each member played the role of a component of the selected concept. By
running through the required steps and communicating with the other ‘components,’
many details were expanded further. This ensured that all aspects were inspected and
nothing was overlooked. The developed concepts are detailed in the following sections.
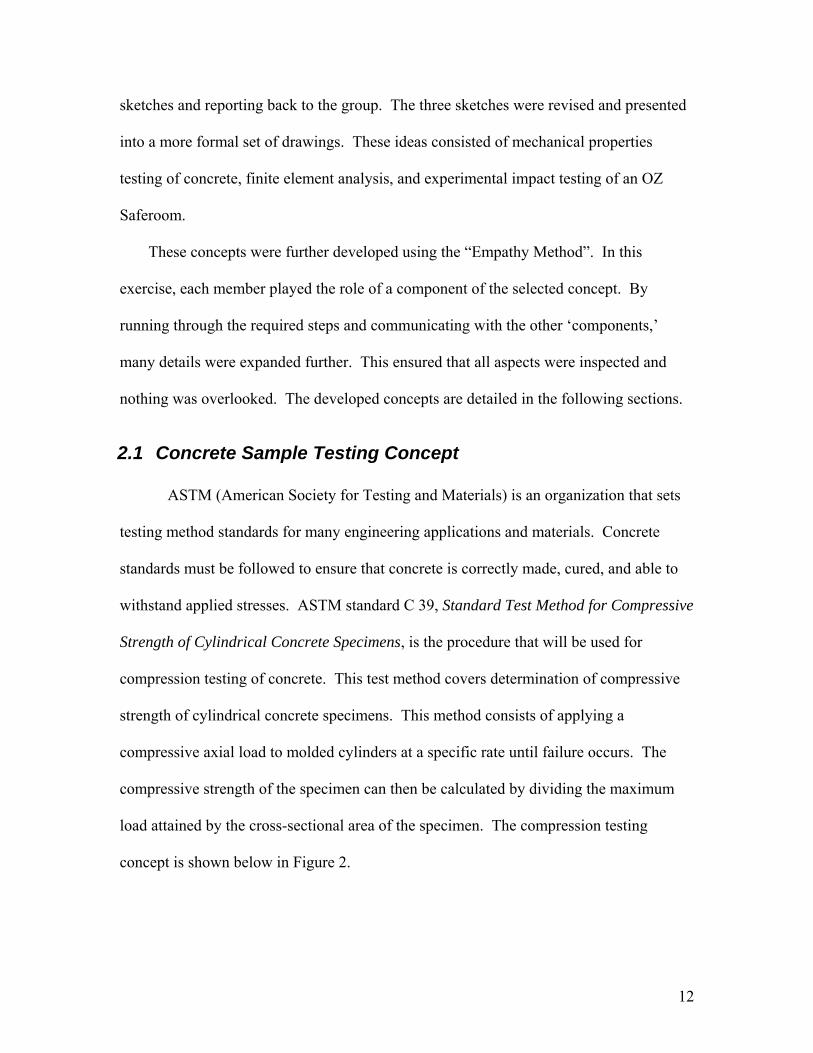
2.1 Concrete Sample Testing Concept
ASTM (American Society for Testing and Materials) is an organization that sets
testing method standards for many engineering applications and materials. Concrete
standards must be followed to ensure that concrete is correctly made, cured, and able to
withstand applied stresses. ASTM standard C 39, Standard Test Method for Compressive
Strength of Cylindrical Concrete Specimens, is the procedure that will be used for
compression testing of concrete. This test method covers determination of compressive
strength of cylindrical concrete specimens. This method consists of applying a
compressive axial load to molded cylinders at a specific rate until failure occurs. The
compressive strength of the specimen can then be calculated by dividing the maximum
load attained by the cross-sectional area of the specimen. The compression testing
concept is shown below in Figure 2.
12
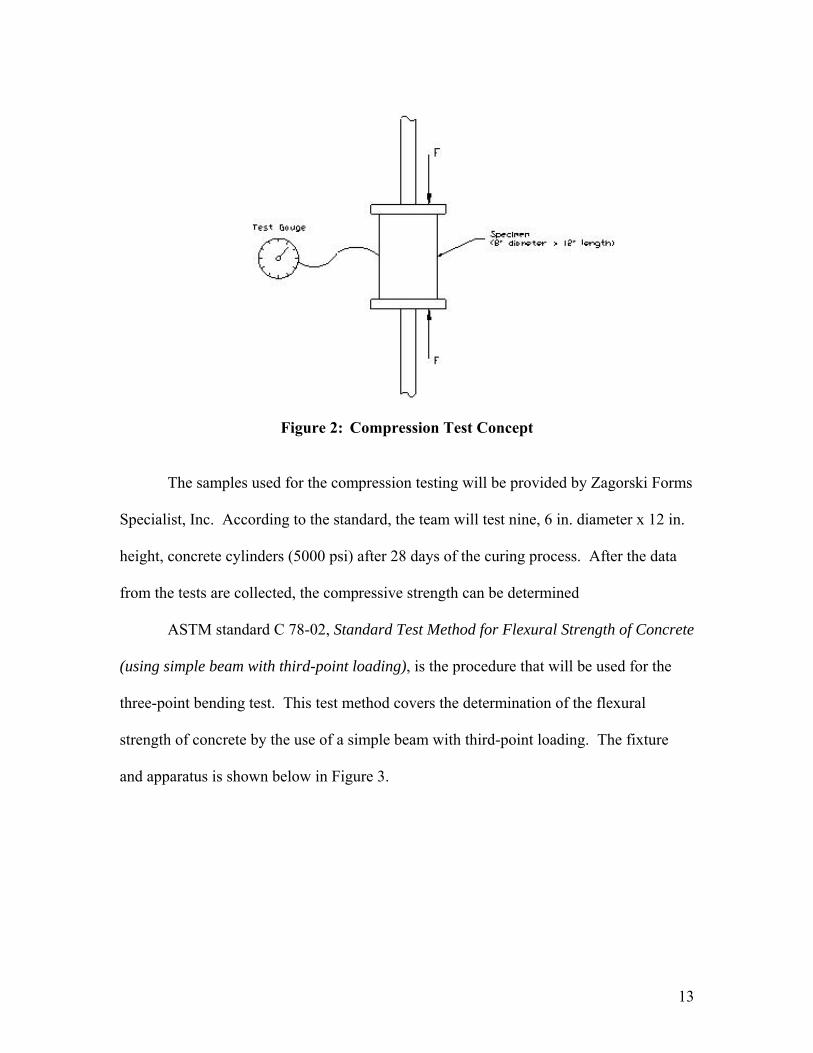
Figure 2: Compression Test Concept
The samples used for the compression testing will be provided by Zagorski Forms
Specialist, Inc. According to the standard, the team will test nine, 6 in. diameter x 12 in.
height, concrete cylinders (5000 psi) after 28 days of the curing process. After the data
from the tests are collected, the compressive strength can be determined
ASTM standard C 78-02, Standard Test Method for Flexural Strength of Concrete
(using simple beam with third-point loading), is the procedure that will be used for the
three-point bending test. This test method covers the determination of the flexural
strength of concrete by the use of a simple beam with third-point loading. The fixture
and apparatus is shown below in Figure 3.
13
Figure 3: 3-Point Bending Setup
The samples used for this testing will also be provided by Zagorski Forms
Specialist, Inc. According to the standard, the team will test nine, 14 in. x 4 in. x 4 in.,
concrete samples (5000 psi) after 28 days of the curing process. After the data from the
tests are collected, the flexural strength or modulus of rupture can be determined.
2.2 Finite Element Analysis Concept
Finite element analysis (FEA) is a numerical approach to solving systems.
Generally, it is performed on complex systems with no closed form solution. FEA is
used to discretize a continuous system into many simpler elements. This yields a finite
number of equations that are solved simultaneously to approximate the general solution.
For this application, FEA is used to find areas of maximum/minimum stress and strain of
the OZ Saferoom.
14
The finite element analysis will be conducted using I-DEAS. This is a computer
program used for the structural analysis of proposed designs. The software assists in
calculating stress, shear force, loads, deflections, and other parameters. The first step in
FEA is to decompose the structure into many small meshes. Each mesh is then analyzed
individually to gain a larger perspective of what is happening to the model. I-DEAS was
selected because it is the program that team is familiar with.
The FEA conducted will be used to find stresses, deflections and the frequency
response of the structure. In order to verify the model, various mesh sizes will be
implemented. After the impact test is conducted, the results will be compared with the
FEA. The FEA will also be used to quantify the limitations of OZ Saferooms.
The team will use I-DEAS to conduct finite element analysis for four different
sized structures. These structures include:
• Existing 78 in. x 78 in. x 92 in. (outside dimensions) safe room
• 102 in. x 102 in. x 92 in. (outside dimensions) safe room
• 126 in. x 126 in. x 92 in. (outside dimensions) safe room
• 20 ft. x 30 ft. x 92 in. (outside dimensions) safe room
2.3 Experimental Impact Testing Concept
2.3.1 Laser Pointer Concept
To measure the deflection of the roof under static loading, a laser pointer will be
mounted flat against the ceiling. The laser pointer will then be calibrated to project
perpendicularly onto a wall. The wall will be marked so that as the test is being done, the
change in the angle projected onto the wall by the laser pointer will be measured. The
test will be done by applying a static load to the structure using a hydraulic ram. As the
15
ram deflects the wall, the change in angle of the laser pointer will be used to calculate the
deflection of the structure. The experimental test data will be compared with the finite
element I-DEAS model. If the finite element model correlates with the hydraulic ram
test, the finite element model can then be tested to failure. This will help the team in
determining the weakest points of the structure. The hydraulic ram test will ultimately
help to determine where to place the accelerometers during an impact test.
2.3.2 Strain Gauge Concept
The purpose of this experiment is to apply forces to the OZ Saferoom in order to
assess the stress of the structure during a tornado. This test will involve applying static
loads to the roof of the structure. To calculate the stress induced on the structure, a strain
gauge will be used. The structure will be loaded using a uniform weight, at a
predetermined force, simulating tornado debris. Sufficient simulation and research will
be conducted to ensure proper experimental loading. A uniform weight is appropriate to
ensure control and repeatability. The strain gauge and data acquisition system will be
purchased from Durham Geo. The experimental test data will be compared to the finite
element I-DEAS model.
2.3.3 Accelerometer Concept
The purpose of this experiment is to apply forces simulating those imposed during
an F5 tornado, and measure the response of the structure’s roof. The test will involve
raising a large uniform load to a specified height, and releasing it. From the data
recorded during the impact test, the induced stress will be calculated and compared with
the theoretical maximum stresses of the OZ Saferoom’s roof. The data will also be used
16
to compare the frequency response and deflection of the structure’s roof with the FEA.
While obtaining the frequency response is not the primary objective, it will provide
another basis of comparison with the FEA.
To measure the force on the structure during the test, an accelerometer will be
placed on the ceiling of the safe room. This will yield the acceleration of the structure
and the time duration of impact. Through dynamic principles, the resulting impact force
can then be calculated.
In order to simulate actual tornado debris, research will be conducted to ensure
the proper loading is chosen. The accelerometers will be purchased by funds allotted by
Zagorski Forms Specialists, Inc. The corresponding data acquisition system and signal
conditioning will be provided by RIT. The experimental test data will be compared with
a simulated structure modeled with the I-DEAS software package.
3 Feasibility Assessment
All of the concepts presented in the previous chapter are the results of the team
brainstorming sessions and initial investigation. Once each idea was clearly defined and
well understood by all members of the team, a feasibility assessment was conducted on
each concept. The feasibility assessment was governed by a list of questions which
covered technical, economic, schedule, resource and performance issues that can be
equally applied to each design concept.
17
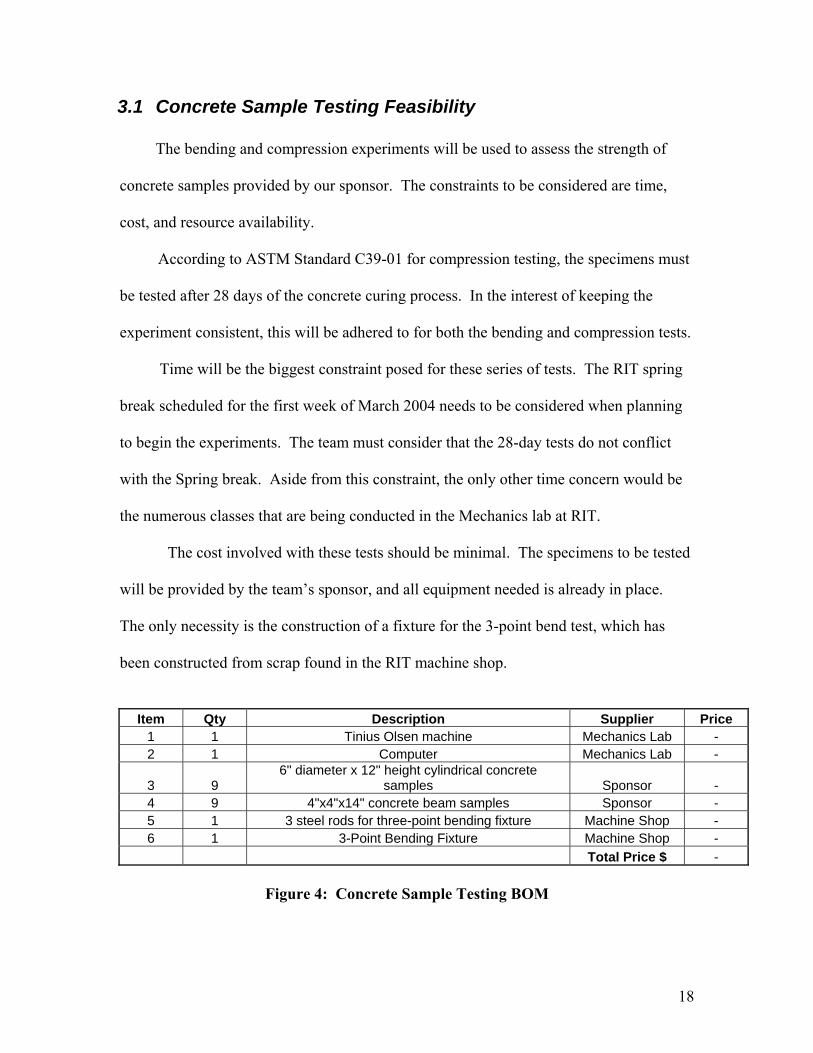
3.1 Concrete Sample Testing Feasibility
The bending and compression experiments will be used to assess the strength of
concrete samples provided by our sponsor. The constraints to be considered are time,
cost, and resource availability.
According to ASTM Standard C39-01 for compression testing, the specimens must
be tested after 28 days of the concrete curing process. In the interest of keeping the
experiment consistent, this will be adhered to for both the bending and compression tests.
Time will be the biggest constraint posed for these series of tests. The RIT spring
break scheduled for the first week of March 2004 needs to be considered when planning
to begin the experiments. The team must consider that the 28-day tests do not conflict
with the Spring break. Aside from this constraint, the only other time concern would be
the numerous classes that are being conducted in the Mechanics lab at RIT.
The cost involved with these tests should be minimal. The specimens to be tested
will be provided by the team’s sponsor, and all equipment needed is already in place.
The only necessity is the construction of a fixture for the 3-point bend test, which has
been constructed from scrap found in the RIT machine shop.
Item Qty Description Supplier Price
1 1 Tinius Olsen machine Mechanics Lab - 2 1 Computer Mechanics Lab -
3 9 6" diameter x 12" height cylindrical concrete
samples Sponsor - 4 9 4"x4"x14" concrete beam samples Sponsor - 5 1 3 steel rods for three-point bending fixture Machine Shop - 6 1 3-Point Bending Fixture Machine Shop -
Total Price $ -
Figure 4: Concrete Sample Testing BOM
18
3.2 FEA Feasibility
There are many technical aspects of the finite element analysis. The knowledge
to create the model and perform the FEA is essential to this concept. Utilizing the I-
DEAS software package enables the team to complete the FEA. The team is relatively
familiar with this program and a large volume of information is available. The correct
material properties will have to be determined to ensure success of the analysis. Once the
FEA is complete, the values will be compared with tested and calculated data.
Next, the economic feasibility was assessed. The I-DEAS software package is
readily available in the Mechanical Engineering computer lab. The labor cost for FEA is
non-existent because it will all be done in house, and no additional resources are needed.
The tutorials and instruction manuals also have no cost associated with them.
All necessary resources to complete the FEA are available. The material
properties that must be entered during the meshing phase of the FEA are available in
many textbooks and located on many engineering websites dealing with material
properties. The resources used to guide the team members during the FEA are readily
available. All resources used in the post-processing phase of the FEA are also accessible,
including the appropriate text books for computing material properties and structural
forces. These are based on sample tests and real world experiments.
The FEA must be done throughout the duration of the project. The initial FEA
will precede any experimental testing in order to verify its feasibility and aid in
preliminary design decisions. Future FEA will follow as additional testing is done to
verify models and assist in sensor placement decisions. The timing of each FEA will
accord with project scheduling. This will allow each FEA to comply with team
19
scheduling issues and provide the benefit of having each FEA ready to be used when
necessary. In summation, the scheduling of this facet of the project should not be an
issue.
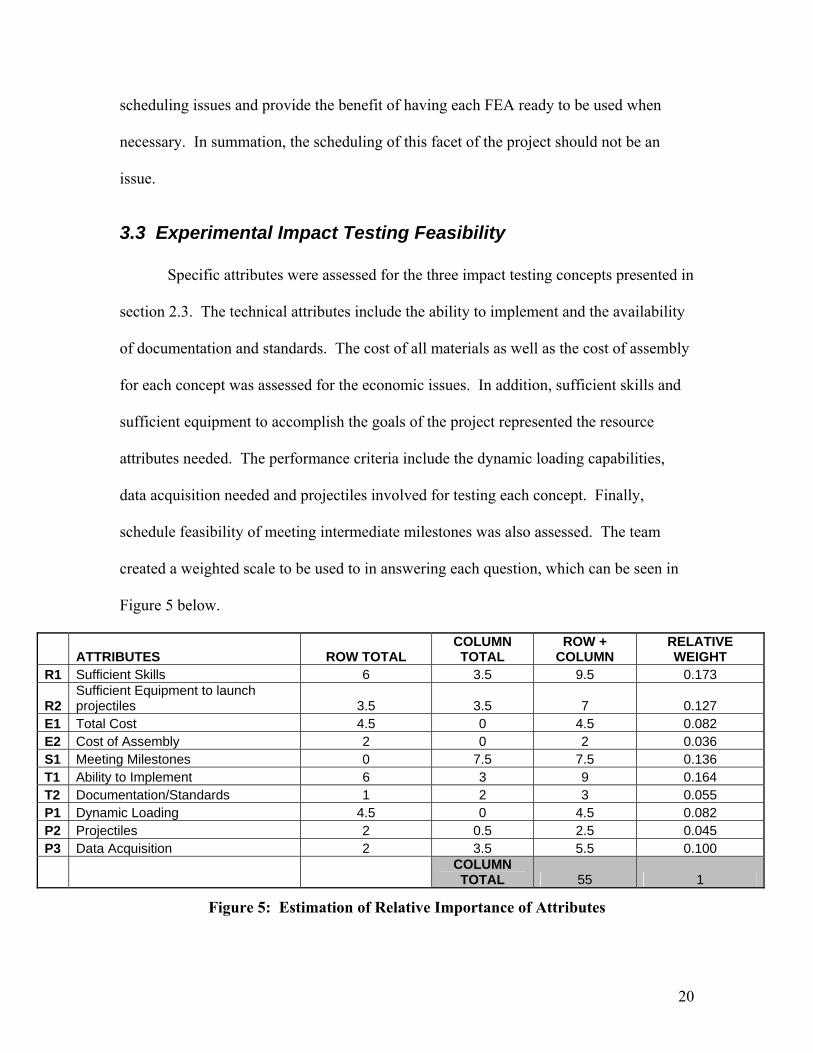
3.3 Experimental Impact Testing Feasibility
Specific attributes were assessed for the three impact testing concepts presented in
section 2.3. The technical attributes include the ability to implement and the availability
of documentation and standards. The cost of all materials as well as the cost of assembly
for each concept was assessed for the economic issues. In addition, sufficient skills and
sufficient equipment to accomplish the goals of the project represented the resource
attributes needed. The performance criteria include the dynamic loading capabilities,
data acquisition needed and projectiles involved for testing each concept. Finally,
schedule feasibility of meeting intermediate milestones was also assessed. The team
created a weighted scale to be used to in answering each question, which can be seen in
Figure 5 below.
ATTRIBUTES ROW TOTAL COLUMN TOTAL
ROW + COLUMN
RELATIVE WEIGHT
R1 Sufficient Skills 6 3.5 9.5 0.173
R2 Sufficient Equipment to launch projectiles 3.5 3.5 7 0.127
E1 Total Cost 4.5 0 4.5 0.082 E2 Cost of Assembly 2 0 2 0.036 S1 Meeting Milestones 0 7.5 7.5 0.136 T1 Ability to Implement 6 3 9 0.164 T2 Documentation/Standards 1 2 3 0.055 P1 Dynamic Loading 4.5 0 4.5 0.082 P2 Projectiles 2 0.5 2.5 0.045 P3 Data Acquisition 2 3.5 5.5 0.100
COLUMN TOTAL 55 1
Figure 5: Estimation of Relative Importance of Attributes
20
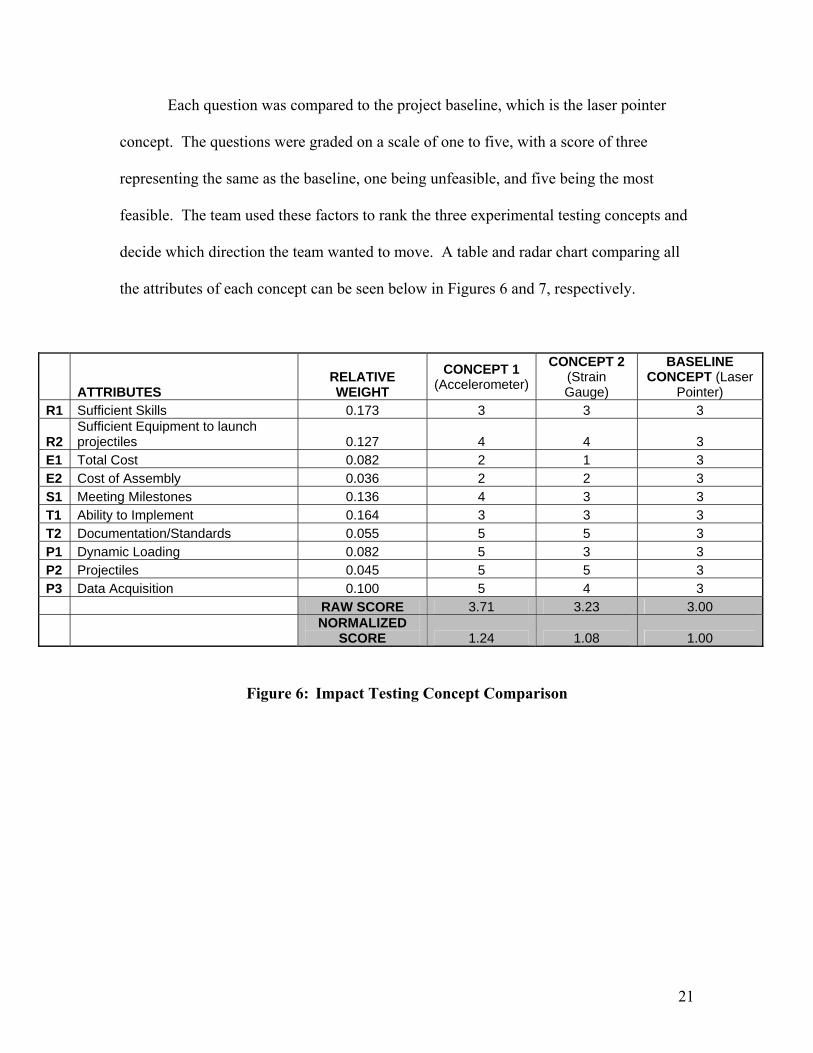
Each question was compared to the project baseline, which is the laser pointer
concept. The questions were graded on a scale of one to five, with a score of three
representing the same as the baseline, one being unfeasible, and five being the most
feasible. The team used these factors to rank the three experimental testing concepts and
decide which direction the team wanted to move. A table and radar chart comparing all
the attributes of each concept can be seen below in Figures 6 and 7, respectively.
ATTRIBUTES RELATIVE WEIGHT
CONCEPT 1 (Accelerometer)
CONCEPT 2 (Strain Gauge)
BASELINE CONCEPT (Laser
Pointer) R1 Sufficient Skills 0.173 3 3 3
R2 Sufficient Equipment to launch projectiles 0.127 4 4 3
E1 Total Cost 0.082 2 1 3 E2 Cost of Assembly 0.036 2 2 3 S1 Meeting Milestones 0.136 4 3 3 T1 Ability to Implement 0.164 3 3 3 T2 Documentation/Standards 0.055 5 5 3 P1 Dynamic Loading 0.082 5 3 3 P2 Projectiles 0.045 5 5 3 P3 Data Acquisition 0.100 5 4 3 RAW SCORE 3.71 3.23 3.00
NORMALIZED
SCORE 1.24 1.08 1.00
Figure 6: Impact Testing Concept Comparison
21
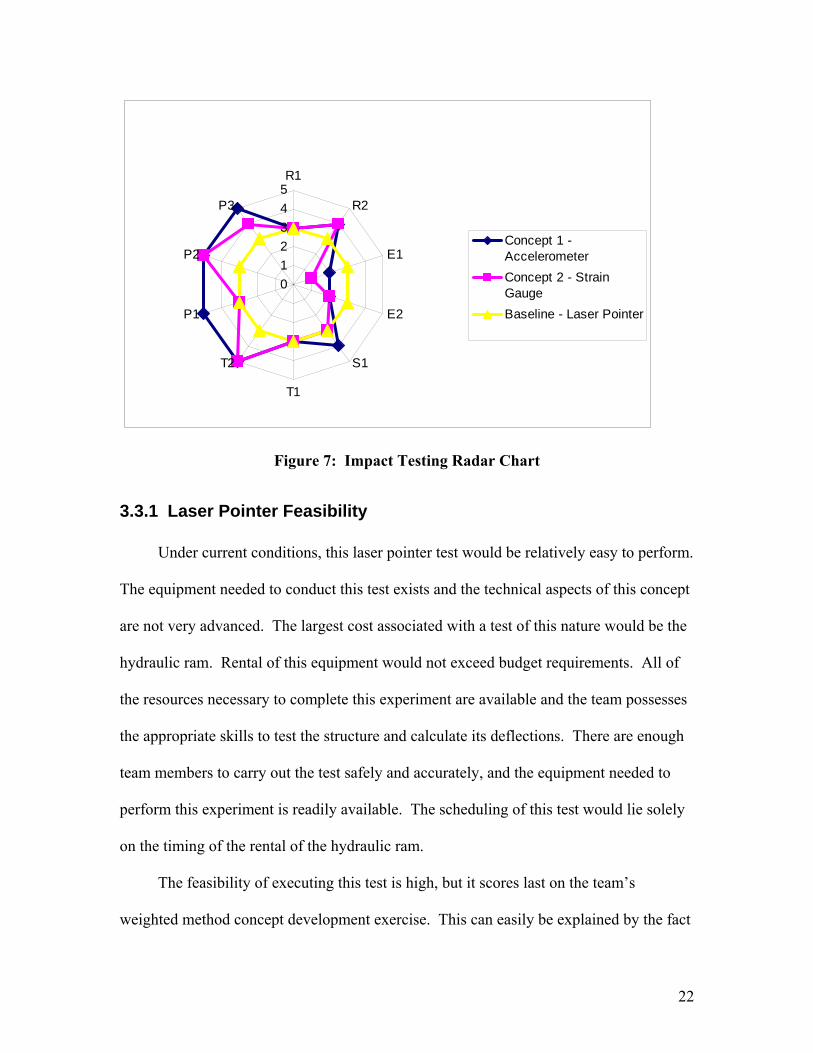
012345R1
R2
E1
E2
S1
T1
T2
P1
P2
P3
Concept 1 -AccelerometerConcept 2 - StrainGaugeBaseline - Laser Pointer
Figure 7: Impact Testing Radar Chart
3.3.1 Laser Pointer Feasibility
Under current conditions, this laser pointer test would be relatively easy to perform.
The equipment needed to conduct this test exists and the technical aspects of this concept
are not very advanced. The largest cost associated with a test of this nature would be the
hydraulic ram. Rental of this equipment would not exceed budget requirements. All of
the resources necessary to complete this experiment are available and the team possesses
the appropriate skills to test the structure and calculate its deflections. There are enough
team members to carry out the test safely and accurately, and the equipment needed to
perform this experiment is readily available. The scheduling of this test would lie solely
on the timing of the rental of the hydraulic ram.
The feasibility of executing this test is high, but it scores last on the team’s
weighted method concept development exercise. This can easily be explained by the fact
22
that this test does not calculate the dynamic loads that the structure would be experience
in an actual tornado. Dynamic loading is a key element to the project because of the
momentary contact point loads experienced by the structure during a tornado. The test
could be used to calculate the strength properties of the structure, but would not be very
useful for achieving the team’s objectives.
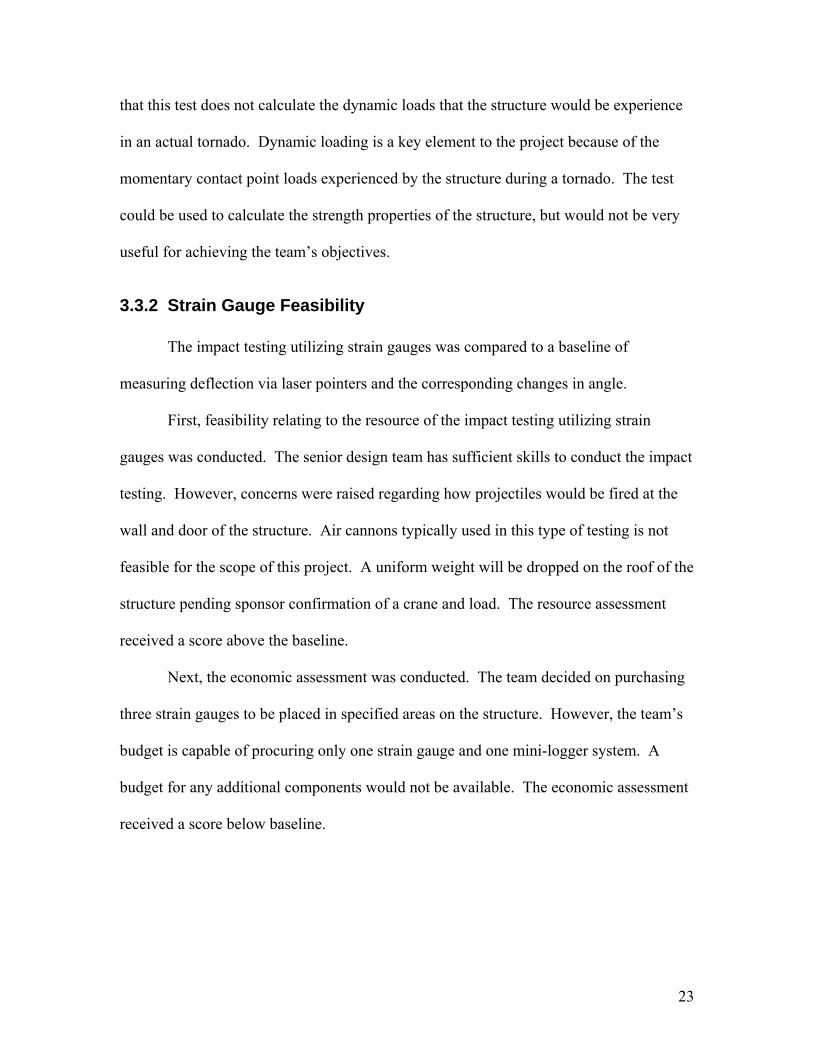
3.3.2 Strain Gauge Feasibility
The impact testing utilizing strain gauges was compared to a baseline of
measuring deflection via laser pointers and the corresponding changes in angle.
First, feasibility relating to the resource of the impact testing utilizing strain
gauges was conducted. The senior design team has sufficient skills to conduct the impact
testing. However, concerns were raised regarding how projectiles would be fired at the
wall and door of the structure. Air cannons typically used in this type of testing is not
feasible for the scope of this project. A uniform weight will be dropped on the roof of the
structure pending sponsor confirmation of a crane and load. The resource assessment
received a score above the baseline.
Next, the economic assessment was conducted. The team decided on purchasing
three strain gauges to be placed in specified areas on the structure. However, the team’s
budget is capable of procuring only one strain gauge and one mini-logger system. A
budget for any additional components would not be available. The economic assessment
received a score below baseline.
23

P/N Description $/per Qty Total Supplier 52650306 Surface mount Strain gauge $120.00 3 $360.00 Durham Slope 52650330 Mounting plates for concrete (2) $24.00 3 $72.00 Durham Slope 52650380 Installation tool* $90.00 1 $90.00 Durham Slope
50613324F Signal Cable (/ft.) $0.55 30 $16.50 Durham Slope 52613310 VW Minilogger $540.00 3 $1,620.00 Durham Slope
TOTAL $2,158.50
Figure 8: Strain Gauge and Data Acquisition System BOM
The next assessment conducted related to technical feasibility. The senior design
team has the ability to implement this testing and is more than capable of meeting
documentation standards. However, concerns were raised that strain gauges are not
suitable for the dynamic loading. The technical assessment received a score equal to
baseline.
The final assessment conducted related to process feasibility. The team was
confident that the data acquisition system would work for our application. The strain
gauges and DAQ are portable and easy to use. Durham Slope experts also indicated they
were confident the data acquisition system would suit this application. Strain gauges are
better suited than the baseline concept. However, strain gauges are not suitable for
projectile testing and dynamic loading.
3.3.3 Accelerometer Feasibility
An accelerometer will be used to measure the applied force. This was compared
to the baseline concept of using a laser pointer to measure the deflection angle at the
applied contact point. The original design for an experimental test consisted of an
applied static load. Although dynamic forces can be simulated statically, material
behavior is altered by sudden changes. Thus, after further research and consideration, a
dynamic test was deemed more accurate and appropriate. Comparisons between the two
24
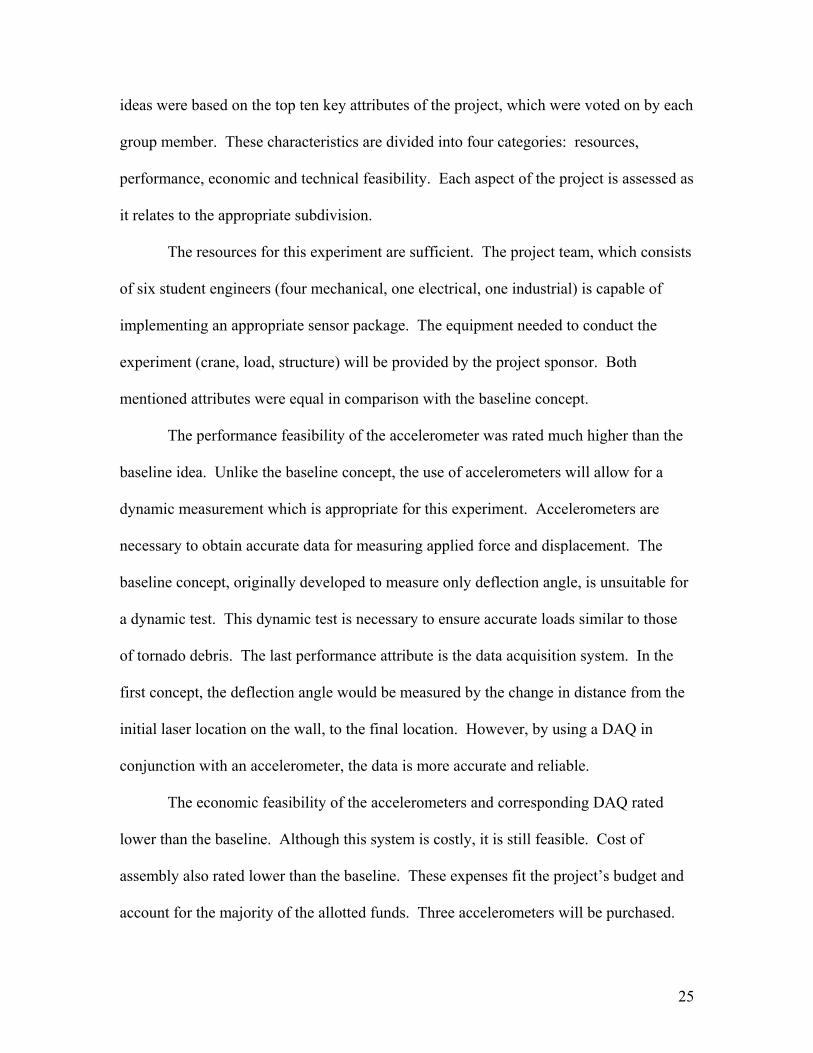
ideas were based on the top ten key attributes of the project, which were voted on by each
group member. These characteristics are divided into four categories: resources,
performance, economic and technical feasibility. Each aspect of the project is assessed as
it relates to the appropriate subdivision.
The resources for this experiment are sufficient. The project team, which consists
of six student engineers (four mechanical, one electrical, one industrial) is capable of
implementing an appropriate sensor package. The equipment needed to conduct the
experiment (crane, load, structure) will be provided by the project sponsor. Both
mentioned attributes were equal in comparison with the baseline concept.
The performance feasibility of the accelerometer was rated much higher than the
baseline idea. Unlike the baseline concept, the use of accelerometers will allow for a
dynamic measurement which is appropriate for this experiment. Accelerometers are
necessary to obtain accurate data for measuring applied force and displacement. The
baseline concept, originally developed to measure only deflection angle, is unsuitable for
a dynamic test. This dynamic test is necessary to ensure accurate loads similar to those
of tornado debris. The last performance attribute is the data acquisition system. In the
first concept, the deflection angle would be measured by the change in distance from the
initial laser location on the wall, to the final location. However, by using a DAQ in
conjunction with an accelerometer, the data is more accurate and reliable.
The economic feasibility of the accelerometers and corresponding DAQ rated
lower than the baseline. Although this system is costly, it is still feasible. Cost of
assembly also rated lower than the baseline. These expenses fit the project’s budget and
account for the majority of the allotted funds. Three accelerometers will be purchased.
25
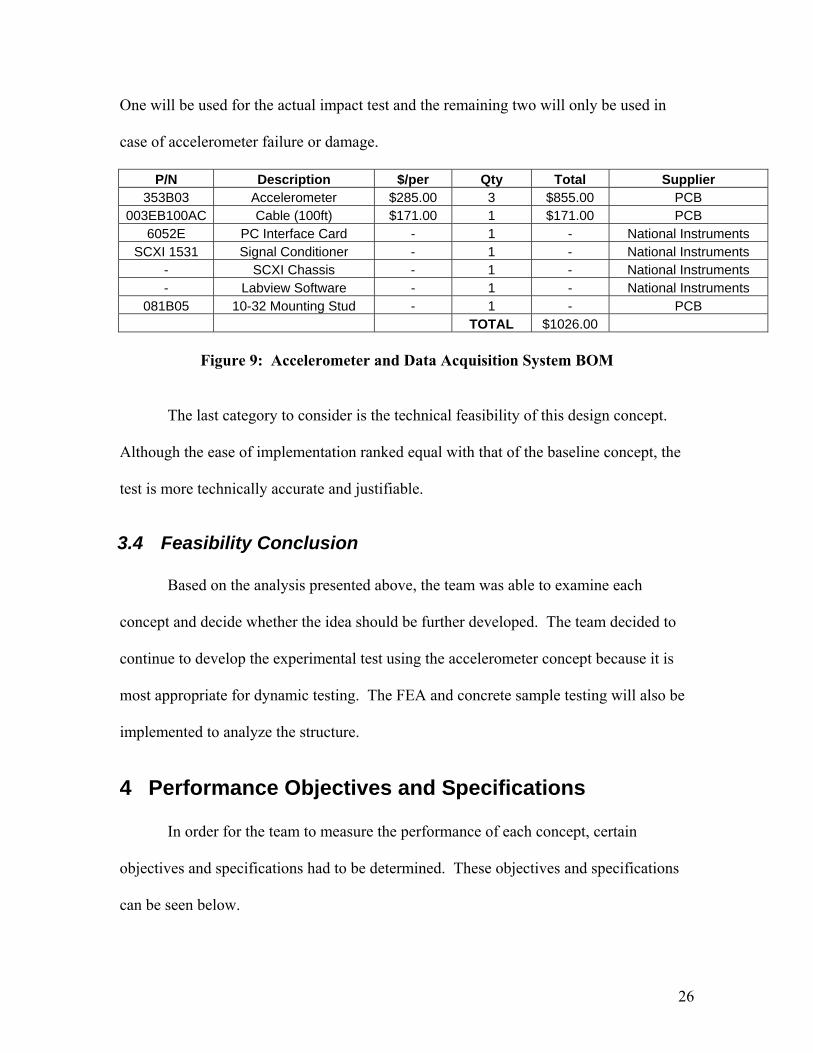
One will be used for the actual impact test and the remaining two will only be used in
case of accelerometer failure or damage.
P/N Description $/per Qty Total Supplier 353B03 Accelerometer $285.00 3 $855.00 PCB
003EB100AC Cable (100ft) $171.00 1 $171.00 PCB 6052E PC Interface Card - 1 - National Instruments
SCXI 1531 Signal Conditioner - 1 - National Instruments - SCXI Chassis - 1 - National Instruments - Labview Software - 1 - National Instruments
081B05 10-32 Mounting Stud - 1 - PCB TOTAL $1026.00
Figure 9: Accelerometer and Data Acquisition System BOM
The last category to consider is the technical feasibility of this design concept.
Although the ease of implementation ranked equal with that of the baseline concept, the
test is more technically accurate and justifiable.
3.4 Feasibility Conclusion
Based on the analysis presented above, the team was able to examine each
concept and decide whether the idea should be further developed. The team decided to
continue to develop the experimental test using the accelerometer concept because it is
most appropriate for dynamic testing. The FEA and concrete sample testing will also be
implemented to analyze the structure.
4 Performance Objectives and Specifications In order for the team to measure the performance of each concept, certain
objectives and specifications had to be determined. These objectives and specifications
can be seen below.
26
4.1 Design Objectives
There are a number of design objectives that need to be specified in order for the
team to have a list of goals and aims to achieve. These objectives are listed below.
1) The impact test shall be designed to simulate tornado forces applied to the OZ
Saferoom. This is important for proper evaluation of the OZ Saferoom.
2) The team must research the most severe tornado conditions.
3) Ensure the accelerometers and data acquisition system used are appropriate for
the dynamic load applied through preliminary testing.
4) Recommendations for installation of sensor package into safe room design
5) Use CAD blueprints provided by Zagorski Forms to correctly model the existing
structure in I-DEAS.
6) Finite element analysis shall assess the stresses and displacements induced by the
simulated tornado load. Preliminary analysis of the larger structure specified by
our sponsor is also included in this objective.
7) Four different size structures will be modeled and analyzed using I-DEAS.
8) Impact test data will be compared to the FEA results.
9) The stress imposed on the structure’s roof will be compared with theoretical
calculations.
10) Sample testing will be used to determine the modulus of elasticity. This will be
used in the final finite element analysis models.
11) The results from all tests will provide data that will be reviewed by our sponsor.
27
4.2 Performance Specifications
A number of performance specifications must be met in order to fulfill the project
objectives and successfully complete the project. These minimal requirements are listed
below.
1) Results of the impact test shall allow for determination of deflection and induced
stress on the structure.
2) The results obtained from finite element analysis and impact testing should be
within 10% of one another.
3) The mechanical properties obtained from the compression and 3-point bending
tests shall be compared with known concrete properties.
4) The data from the impact test and finite element analysis should be comparable
with the analytical solution.
5 Analysis of Problem and Synthesis of Design After all final concepts of the design were chosen, several aspects of each concept
were analyzed. The team partitioned the analysis into three main sections: the design of
concrete sample testing, finite element analysis, and experimental impact testing. The
first section of this chapter analyzes the design and test methods for determining the
mechanical properties of the concrete used in OZ Saferooms. This will be done by
testing concrete samples provided by Zagorski Forms Specialists, Inc. The next section
of this chapter focuses on the finite element analysis and structural integrity of various
OZ Saferoom structures. This final section focuses on the design of the experimental
impact testing concept, which includes the methodology of applying the correct loads to
28
the structure, as well as the sensing and data acquisition system needed to analyze the
structure’s response.
5.1 Concrete Sample Testing
For a valid finite element analysis to be conducted, the mechanical properties of
the concrete used, need to be determined. Two factors that directly influence the
performance of concrete are the bending and compressive strength. ASTM standards C
78-02 and C-39 were used for conducting three-point bending and compression testing
respectively. From the sample testing experimentation, the Modulus of Elasticity and
mass density of the concrete can be determined.
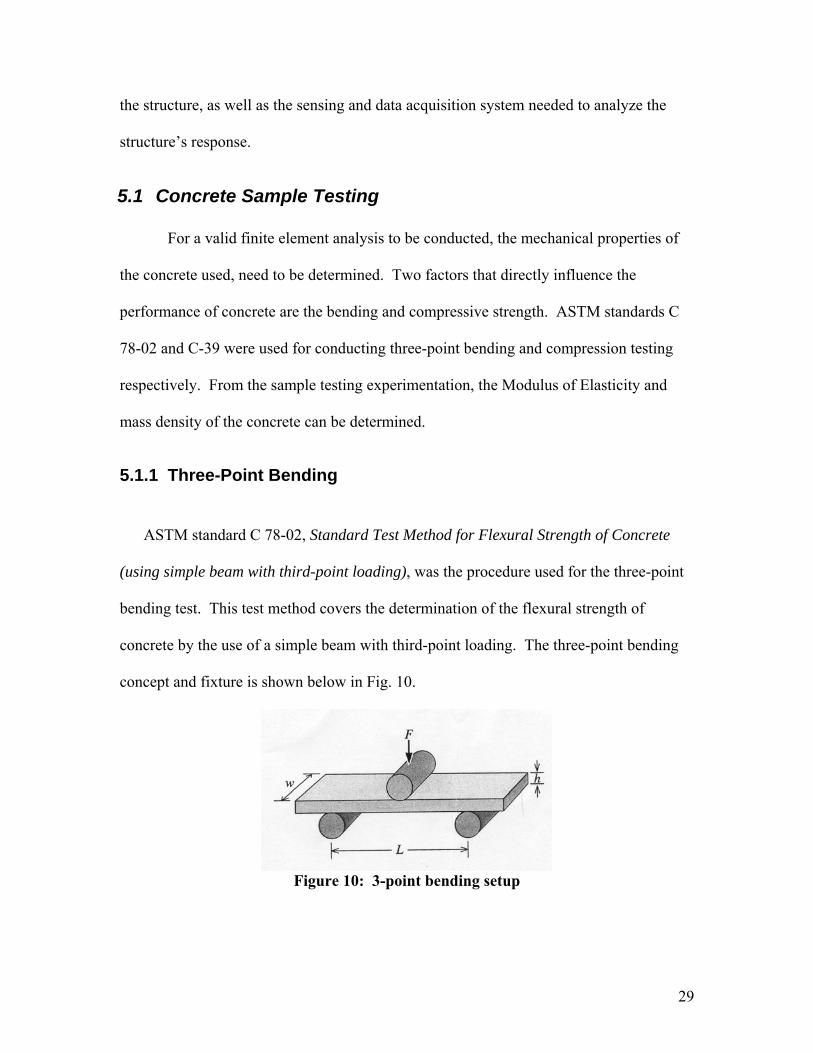
5.1.1 Three-Point Bending
ASTM standard C 78-02, Standard Test Method for Flexural Strength of Concrete
(using simple beam with third-point loading), was the procedure used for the three-point
bending test. This test method covers the determination of the flexural strength of
concrete by the use of a simple beam with third-point loading. The three-point bending
concept and fixture is shown below in Fig. 10.
Figure 10: 3-point bending setup
29
Zagorski Forms supplied nine rectangular samples with 14 in. length, 4 in. width,
and 4 in. height. All testing was conducted using a Tinius Olsen machine located in the
Mechanics Lab at Rochester Institute of Technology.
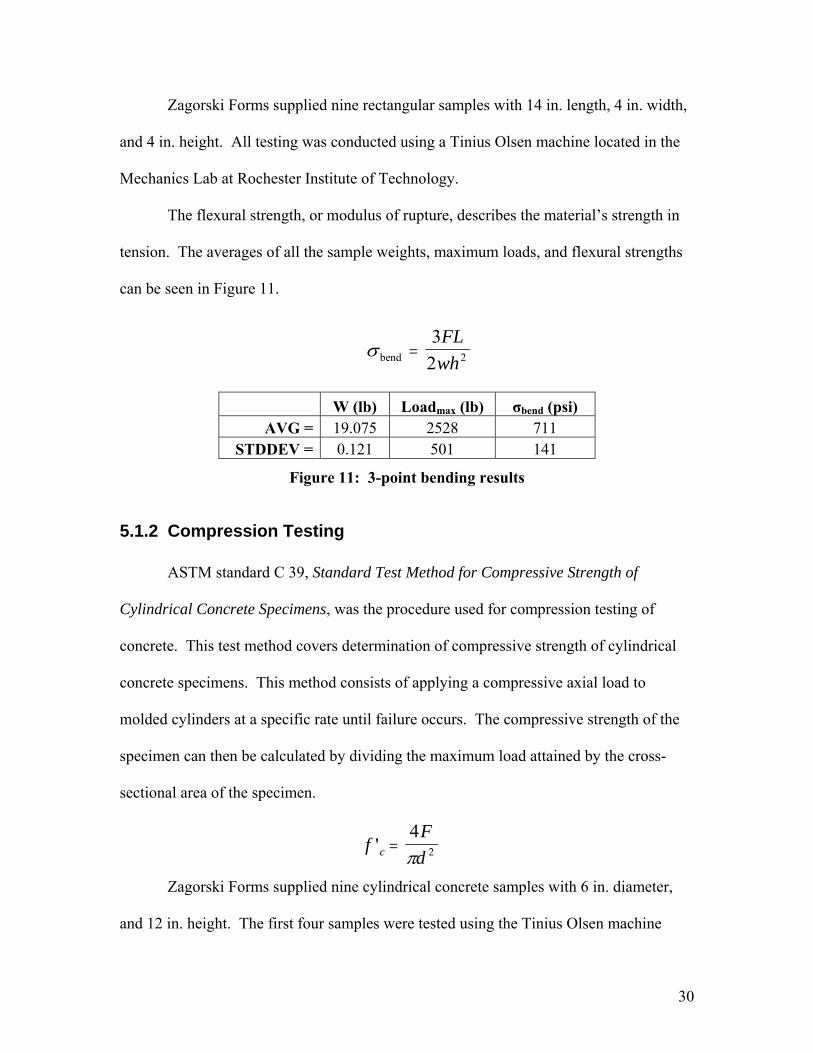
The flexural strength, or modulus of rupture, describes the material’s strength in
tension. The averages of all the sample weights, maximum loads, and flexural strengths
can be seen in Figure 11.
σ bend =3
2 2
FLwh
W (lb) Loadmax (lb) σbend (psi)
AVG = 19.075 2528 711 STDDEV = 0.121 501 141
Figure 11: 3-point bending results
5.1.2 Compression Testing
ASTM standard C 39, Standard Test Method for Compressive Strength of
Cylindrical Concrete Specimens, was the procedure used for compression testing of
concrete. This test method covers determination of compressive strength of cylindrical
concrete specimens. This method consists of applying a compressive axial load to
molded cylinders at a specific rate until failure occurs. The compressive strength of the
specimen can then be calculated by dividing the maximum load attained by the cross-
sectional area of the specimen.
fFdc' =
42π
Zagorski Forms supplied nine cylindrical concrete samples with 6 in. diameter,
and 12 in. height. The first four samples were tested using the Tinius Olsen machine
30
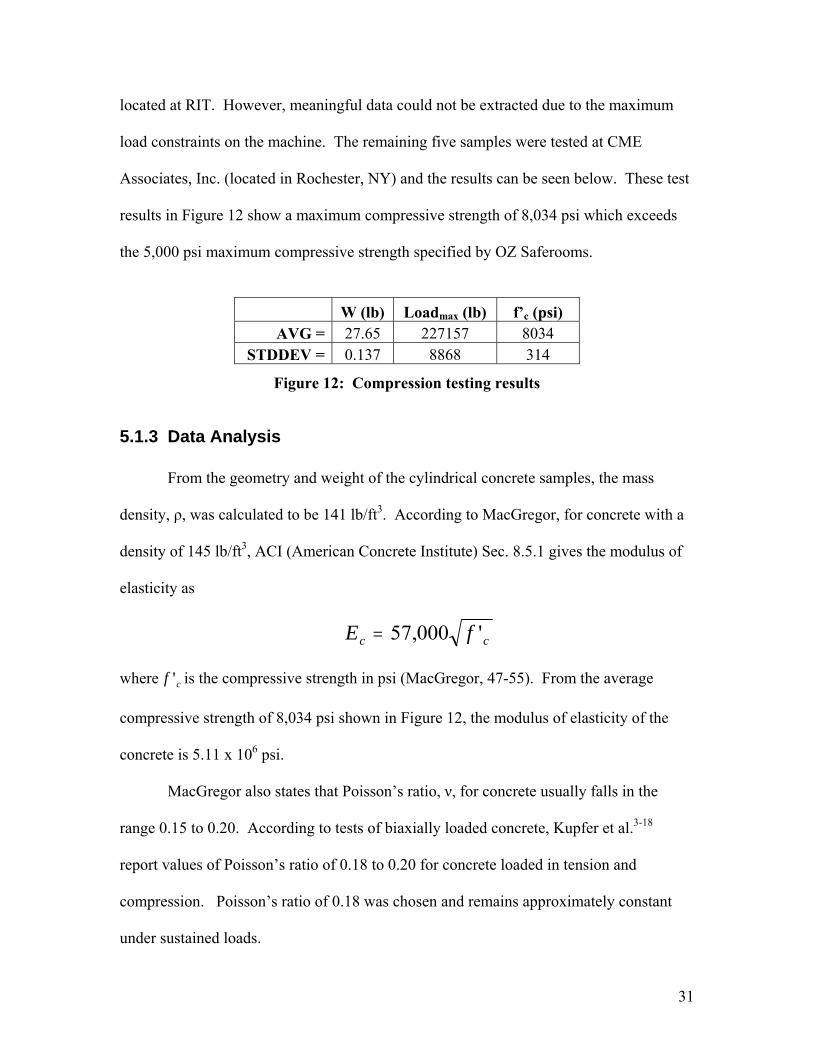
located at RIT. However, meaningful data could not be extracted due to the maximum
load constraints on the machine. The remaining five samples were tested at CME
Associates, Inc. (located in Rochester, NY) and the results can be seen below. These test
results in Figure 12 show a maximum compressive strength of 8,034 psi which exceeds
the 5,000 psi maximum compressive strength specified by OZ Saferooms.
W (lb) Loadmax (lb) f’c (psi)
AVG = 27.65 227157 8034 STDDEV = 0.137 8868 314
Figure 12: Compression testing results
5.1.3 Data Analysis
From the geometry and weight of the cylindrical concrete samples, the mass
density, ρ, was calculated to be 141 lb/ft3. According to MacGregor, for concrete with a
density of 145 lb/ft3, ACI (American Concrete Institute) Sec. 8.5.1 gives the modulus of
elasticity as
E fc c= 57 000, '
where is the compressive strength in psi (MacGregor, 47-55). From the average
compressive strength of 8,034 psi shown in Figure 12, the modulus of elasticity of the
concrete is 5.11 x 10
f c'
6 psi.
MacGregor also states that Poisson’s ratio, ν, for concrete usually falls in the
range 0.15 to 0.20. According to tests of biaxially loaded concrete, Kupfer et al.3-18
report values of Poisson’s ratio of 0.18 to 0.20 for concrete loaded in tension and
compression. Poisson’s ratio of 0.18 was chosen and remains approximately constant
under sustained loads.
31
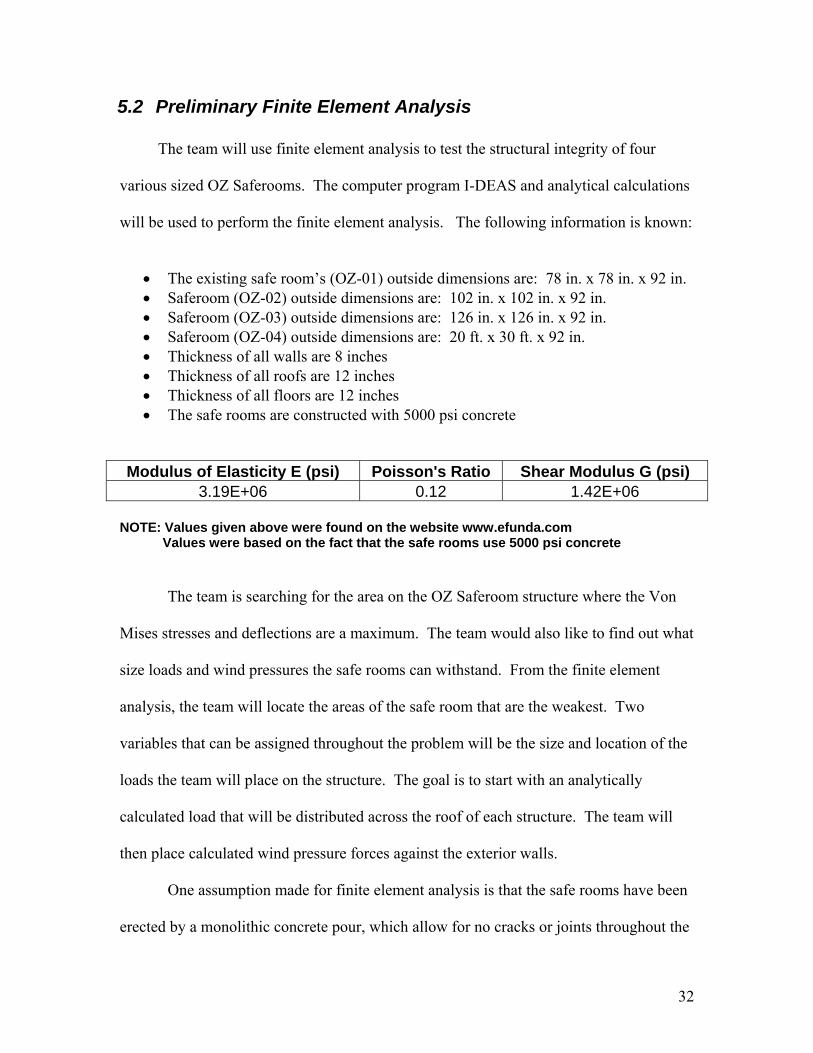
5.2 Preliminary Finite Element Analysis
The team will use finite element analysis to test the structural integrity of four
various sized OZ Saferooms. The computer program I-DEAS and analytical calculations
will be used to perform the finite element analysis. The following information is known:
• The existing safe room’s (OZ-01) outside dimensions are: 78 in. x 78 in. x 92 in. • Saferoom (OZ-02) outside dimensions are: 102 in. x 102 in. x 92 in. • Saferoom (OZ-03) outside dimensions are: 126 in. x 126 in. x 92 in. • Saferoom (OZ-04) outside dimensions are: 20 ft. x 30 ft. x 92 in. • Thickness of all walls are 8 inches • Thickness of all roofs are 12 inches • Thickness of all floors are 12 inches • The safe rooms are constructed with 5000 psi concrete
Modulus of Elasticity E (psi) Poisson's Ratio Shear Modulus G (psi)
3.19E+06 0.12 1.42E+06 NOTE: Values given above were found on the website www.efunda.com Values were based on the fact that the safe rooms use 5000 psi concrete
The team is searching for the area on the OZ Saferoom structure where the Von
Mises stresses and deflections are a maximum. The team would also like to find out what
size loads and wind pressures the safe rooms can withstand. From the finite element
analysis, the team will locate the areas of the safe room that are the weakest. Two
variables that can be assigned throughout the problem will be the size and location of the
loads the team will place on the structure. The goal is to start with an analytically
calculated load that will be distributed across the roof of each structure. The team will
then place calculated wind pressure forces against the exterior walls.
One assumption made for finite element analysis is that the safe rooms have been
erected by a monolithic concrete pour, which allow for no cracks or joints throughout the
32
structure. The safe rooms are assumed isotropic to simplify the analysis for the problem
at hand. Since the rebar is not pre-tensioned, this assumption is valid. The team also
assumed that the CAD drawings supplied by the sponsor are correct.
Preliminary assumptions made regarding the results are that the maximum
deflection will occur at the location of the load. The walls and floor will have little to no
deflection or stress and the roof will be weaker than the walls and floor.
The first step in generating an FEA in I-DEAS is to create a model in the Master
Modeler. After the model is complete, the Simulation program can be activated. In the
Simulation program, the boundary conditions are applied. Upon assigning boundary
conditions, the mesh is generated. To verify the mesh our team will conduct a series of
finite element analyses using different size meshes for each trial. The series of analyses
will help the team conclude which mesh size is optimal for our application. After
completing this step, the Model Solution sub-routine can be initiated. Once the model has
run through the simulation, the Post Processing sub-routine is employed to create visual
models of the structure showing the results of the simulation.
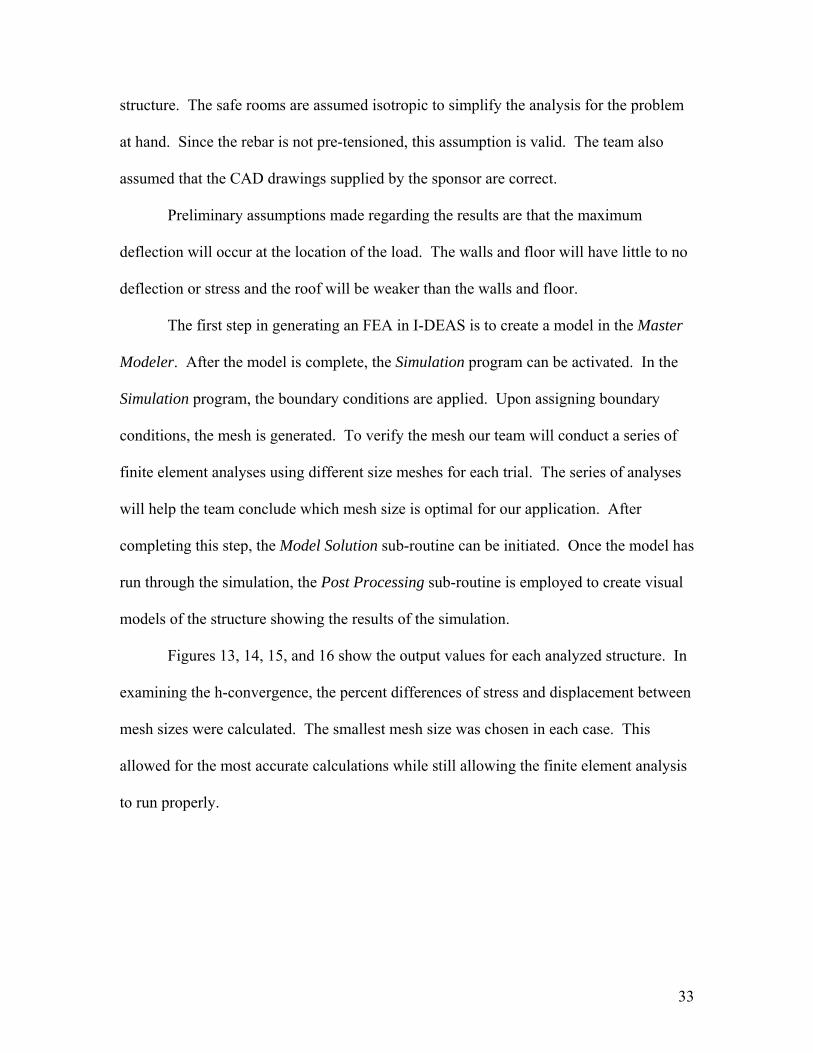
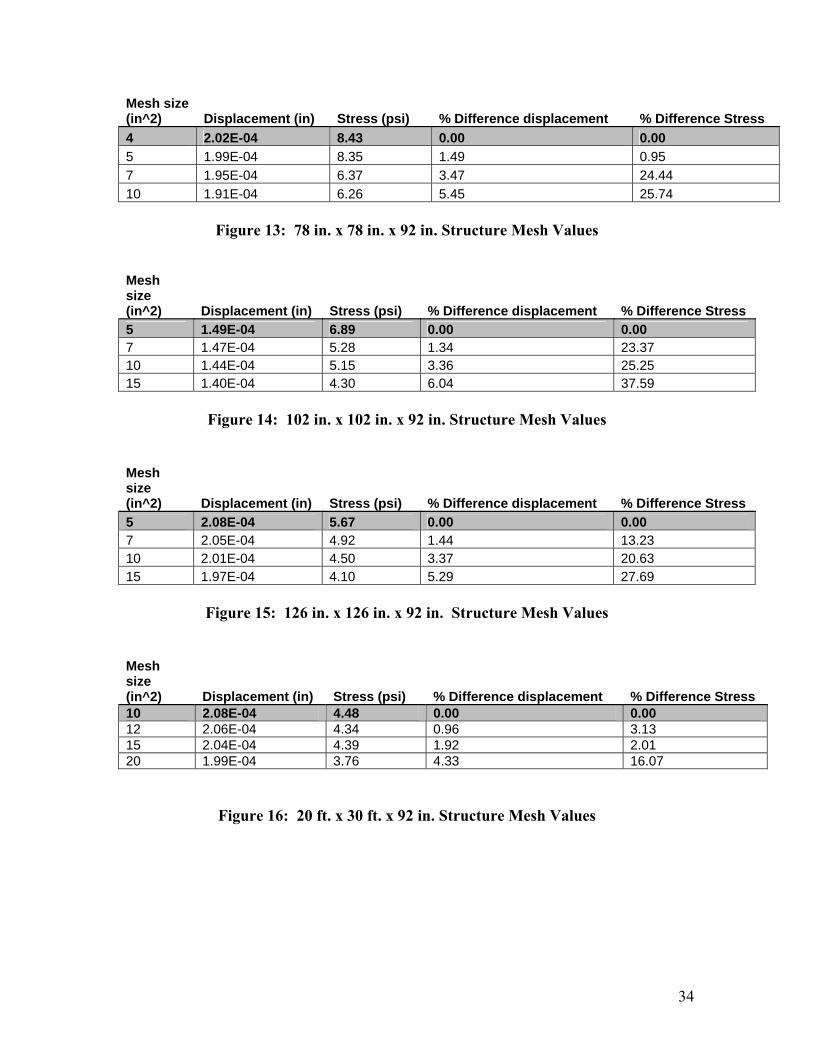
Figures 13, 14, 15, and 16 show the output values for each analyzed structure. In
examining the h-convergence, the percent differences of stress and displacement between
mesh sizes were calculated. The smallest mesh size was chosen in each case. This
allowed for the most accurate calculations while still allowing the finite element analysis
to run properly.
33
Mesh size (in^2) Displacement (in) Stress (psi) % Difference displacement % Difference Stress 4 2.02E-04 8.43 0.00 0.00 5 1.99E-04 8.35 1.49 0.95 7 1.95E-04 6.37 3.47 24.44 10 1.91E-04 6.26 5.45 25.74
Figure 13: 78 in. x 78 in. x 92 in. Structure Mesh Values
Mesh size (in^2) Displacement (in) Stress (psi) % Difference displacement % Difference Stress 5 1.49E-04 6.89 0.00 0.00 7 1.47E-04 5.28 1.34 23.37 10 1.44E-04 5.15 3.36 25.25 15 1.40E-04 4.30 6.04 37.59
Figure 14: 102 in. x 102 in. x 92 in. Structure Mesh Values
Mesh size (in^2) Displacement (in) Stress (psi) % Difference displacement % Difference Stress 5 2.08E-04 5.67 0.00 0.00 7 2.05E-04 4.92 1.44 13.23 10 2.01E-04 4.50 3.37 20.63 15 1.97E-04 4.10 5.29 27.69
Figure 15: 126 in. x 126 in. x 92 in. Structure Mesh Values
Mesh size (in^2) Displacement (in) Stress (psi) % Difference displacement % Difference Stress 10 2.08E-04 4.48 0.00 0.00 12 2.06E-04 4.34 0.96 3.13 15 2.04E-04 4.39 1.92 2.01 20 1.99E-04 3.76 4.33 16.07
Figure 16: 20 ft. x 30 ft. x 92 in. Structure Mesh Values
34
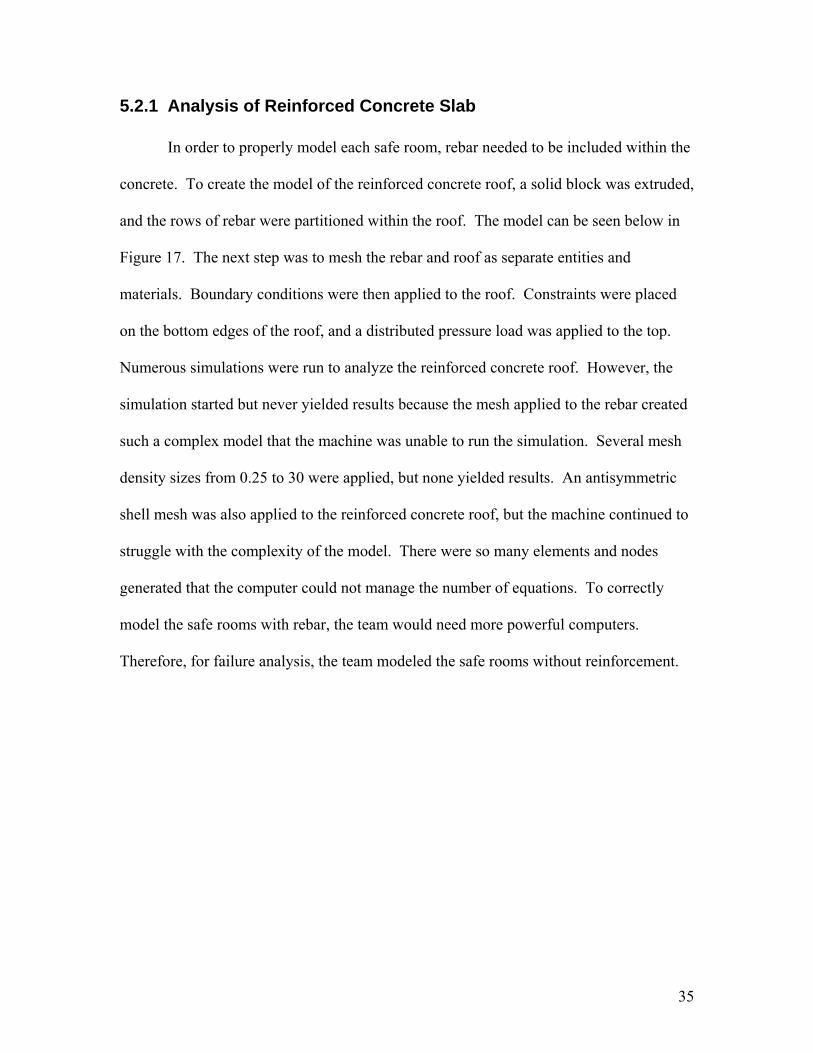
5.2.1 Analysis of Reinforced Concrete Slab
In order to properly model each safe room, rebar needed to be included within the
concrete. To create the model of the reinforced concrete roof, a solid block was extruded,
and the rows of rebar were partitioned within the roof. The model can be seen below in
Figure 17. The next step was to mesh the rebar and roof as separate entities and
materials. Boundary conditions were then applied to the roof. Constraints were placed
on the bottom edges of the roof, and a distributed pressure load was applied to the top.
Numerous simulations were run to analyze the reinforced concrete roof. However, the
simulation started but never yielded results because the mesh applied to the rebar created
such a complex model that the machine was unable to run the simulation. Several mesh
density sizes from 0.25 to 30 were applied, but none yielded results. An antisymmetric
shell mesh was also applied to the reinforced concrete roof, but the machine continued to
struggle with the complexity of the model. There were so many elements and nodes
generated that the computer could not manage the number of equations. To correctly
model the safe rooms with rebar, the team would need more powerful computers.
Therefore, for failure analysis, the team modeled the safe rooms without reinforcement.
35
Figure 17: Reinforced concrete roof
5.2.2 Structural Integrity of OZ Saferooms
Finite element analysis was conducted on four OZ Saferoom structures to
determine the maximum load each structure could withstand before failure. These forces
were applied to the roof and wall of the structure and the Von Mises stress and maximum
deflection were found. After ASTM concrete sample testing for 3-point bending and
compression were completed, the material properties of the concrete used in the
construction of OZ Saferooms were found and applied to the finite element model. The
properties that were most vital for the analysis were the Modulus of Elasticity and the
material density. The Modulus of Elasticity was determined experimentally and the
material density was calculated from the geometry of the samples.
In order to determine the survivability (maximum load before cracking) of each
structure, the finite element models were loaded until failure. By comparing the stresses
observed to the yield strength of the structure, one can determine the load which causes
the structure to fail. Concrete is strong in compression and weak in tension. As a result,
36
cracks develop whenever loads induce tensile stresses in excess of the tensile strength.
ACI Sec. 11.4.2.1 defines the modulus of rupture for use in strength calculations as
f fr c= 6 '
The resulting modulus of rupture or tensile strength was 538 psi (MacGregor, 47-55).
Therefore, in order to take the structures to failure, the pressure applied to the roof and
wall of each structure had to yield a maximum Von Mises stress that was larger than 538
psi. From experimental analysis, the modulus of rupture was determined to be 711 psi ±
141 psi. The value of 538 psi calculated in the equation above will be used in the FEA,
as it corresponds to the worst case scenario found in the experimental analysis.
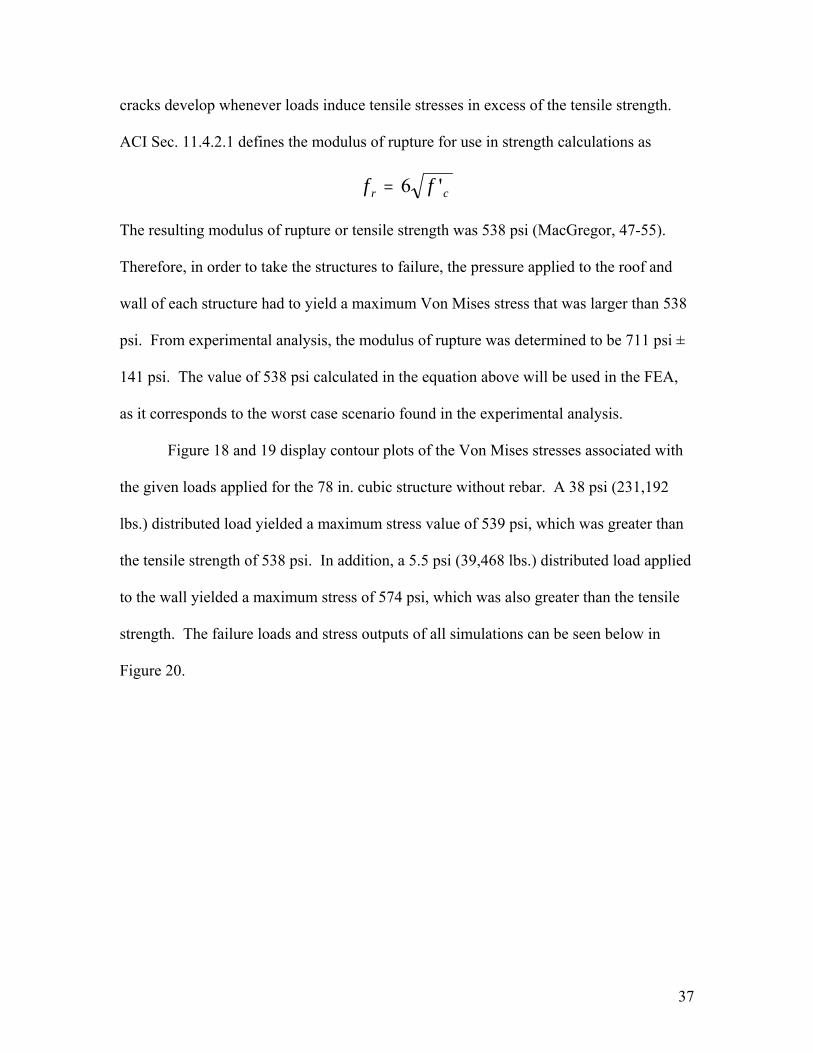
Figure 18 and 19 display contour plots of the Von Mises stresses associated with
the given loads applied for the 78 in. cubic structure without rebar. A 38 psi (231,192
lbs.) distributed load yielded a maximum stress value of 539 psi, which was greater than
the tensile strength of 538 psi. In addition, a 5.5 psi (39,468 lbs.) distributed load applied
to the wall yielded a maximum stress of 574 psi, which was also greater than the tensile
strength. The failure loads and stress outputs of all simulations can be seen below in
Figure 20.
37
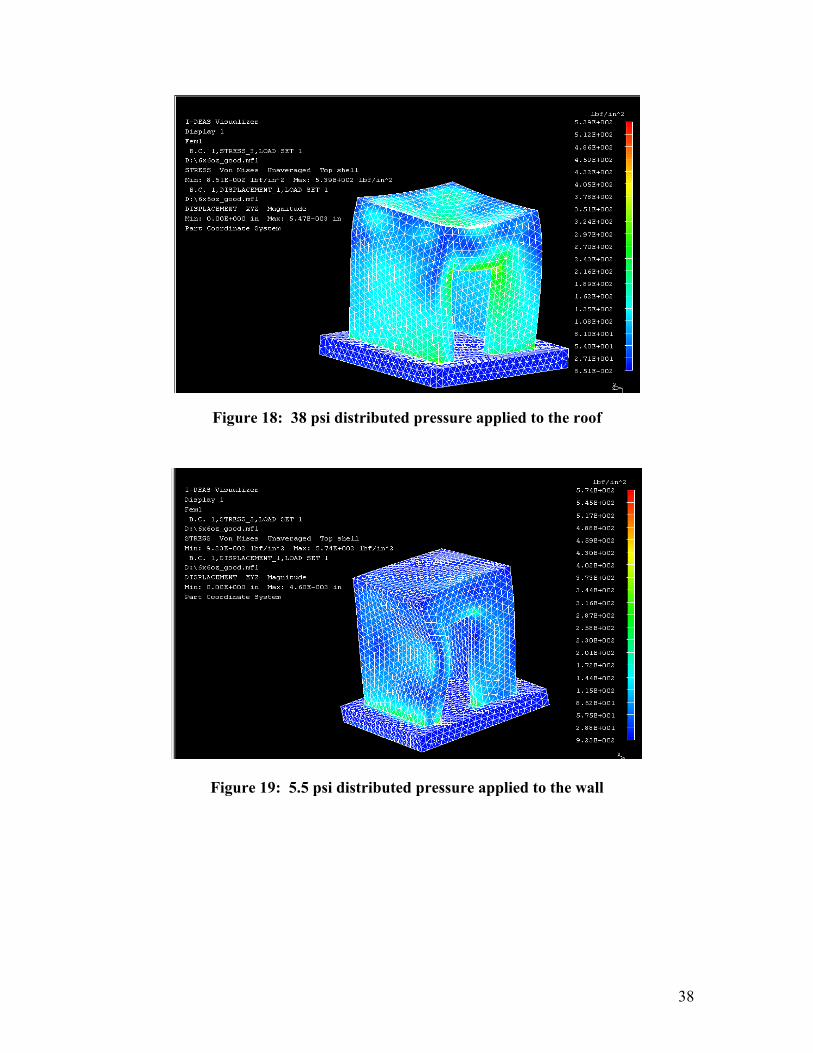
Figure 18: 38 psi distributed pressure applied to the roof
Figure 19: 5.5 psi distributed pressure applied to the wall
38
Structure
Applied Pressure -
Roof
(psi)
Equivalent Applied Load - Roof
(lbs.)
Von Mises Stress
(psi)
Applied Pressure -
Wall
(psi)
Equivalent Applied Load - Wall
(lbs.)
Von Mises Stress
(psi)
78 in. x 78 in. x 92 in. 38 231192 539 5.5 39468 574
102 in. x 102 in. x 92 in. 21.5 223686 545 6 56304 610
126 in. x 126 in. x 92 in. 15.5 246078 544 7 81144 542
240 in. x 360 in. x 92 in. 2.8 241920 540 19 629280 538
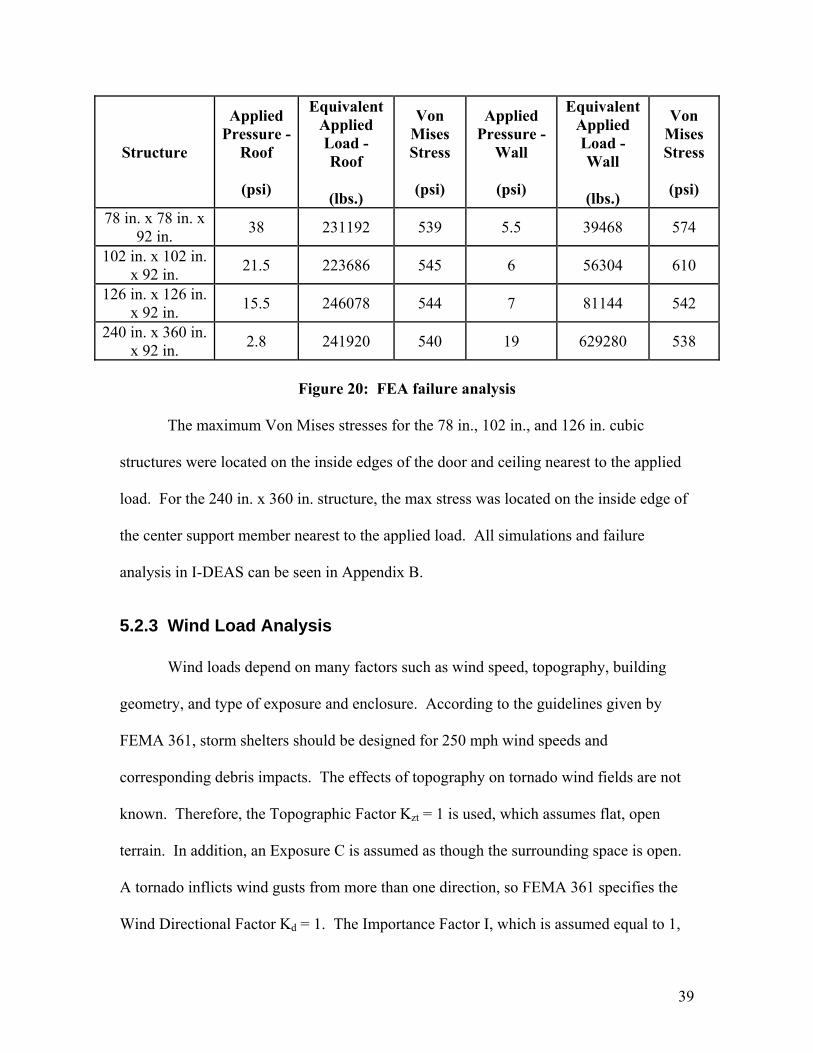
Figure 20: FEA failure analysis
The maximum Von Mises stresses for the 78 in., 102 in., and 126 in. cubic
structures were located on the inside edges of the door and ceiling nearest to the applied
load. For the 240 in. x 360 in. structure, the max stress was located on the inside edge of
the center support member nearest to the applied load. All simulations and failure
analysis in I-DEAS can be seen in Appendix B.
5.2.3 Wind Load Analysis
Wind loads depend on many factors such as wind speed, topography, building
geometry, and type of exposure and enclosure. According to the guidelines given by
FEMA 361, storm shelters should be designed for 250 mph wind speeds and
corresponding debris impacts. The effects of topography on tornado wind fields are not
known. Therefore, the Topographic Factor Kzt = 1 is used, which assumes flat, open
terrain. In addition, an Exposure C is assumed as though the surrounding space is open.
A tornado inflicts wind gusts from more than one direction, so FEMA 361 specifies the
Wind Directional Factor Kd = 1. The Importance Factor I, which is assumed equal to 1,
39
reflects the probability that the structure will experience winds exceeding the design wind
speed during the structure’s expected life. Furthermore, the Wind Directional Factor (Kd
=1) considers the fact that it is unlikely that the maximum wind from any direction will
impact the structure in the direction of its greatest vulnerability. A Wind Gust Factor of
0.85 and an External Pressure Coefficient of 0.8 are also assumed for this analysis.
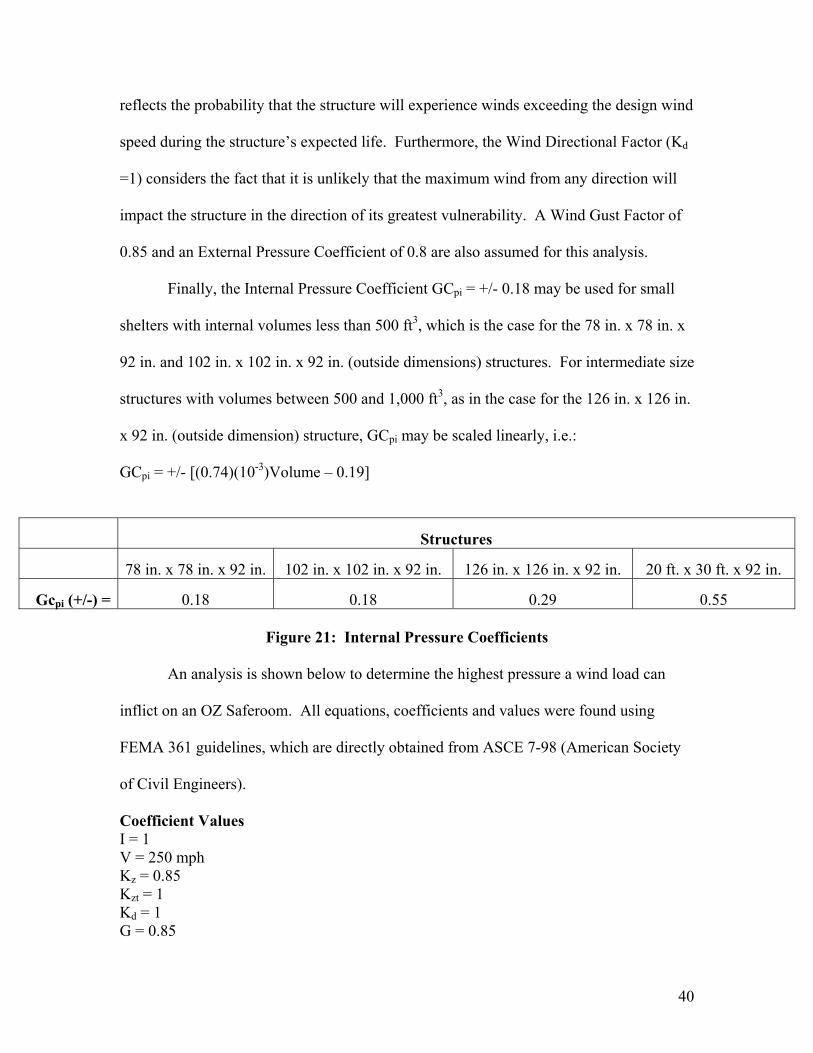
Finally, the Internal Pressure Coefficient GCpi = +/- 0.18 may be used for small
shelters with internal volumes less than 500 ft3, which is the case for the 78 in. x 78 in. x
92 in. and 102 in. x 102 in. x 92 in. (outside dimensions) structures. For intermediate size
structures with volumes between 500 and 1,000 ft3, as in the case for the 126 in. x 126 in.
x 92 in. (outside dimension) structure, GCpi may be scaled linearly, i.e.:
GCpi = +/- [(0.74)(10-3)Volume – 0.19]
Structures
78 in. x 78 in. x 92 in. 102 in. x 102 in. x 92 in. 126 in. x 126 in. x 92 in. 20 ft. x 30 ft. x 92 in.
Gcpi (+/-) = 0.18 0.18 0.29 0.55
Figure 21: Internal Pressure Coefficients
An analysis is shown below to determine the highest pressure a wind load can
inflict on an OZ Saferoom. All equations, coefficients and values were found using
FEMA 361 guidelines, which are directly obtained from ASCE 7-98 (American Society
of Civil Engineers).
Coefficient Values I = 1 V = 250 mph Kz = 0.85 Kzt = 1 Kd = 1 G = 0.85
40
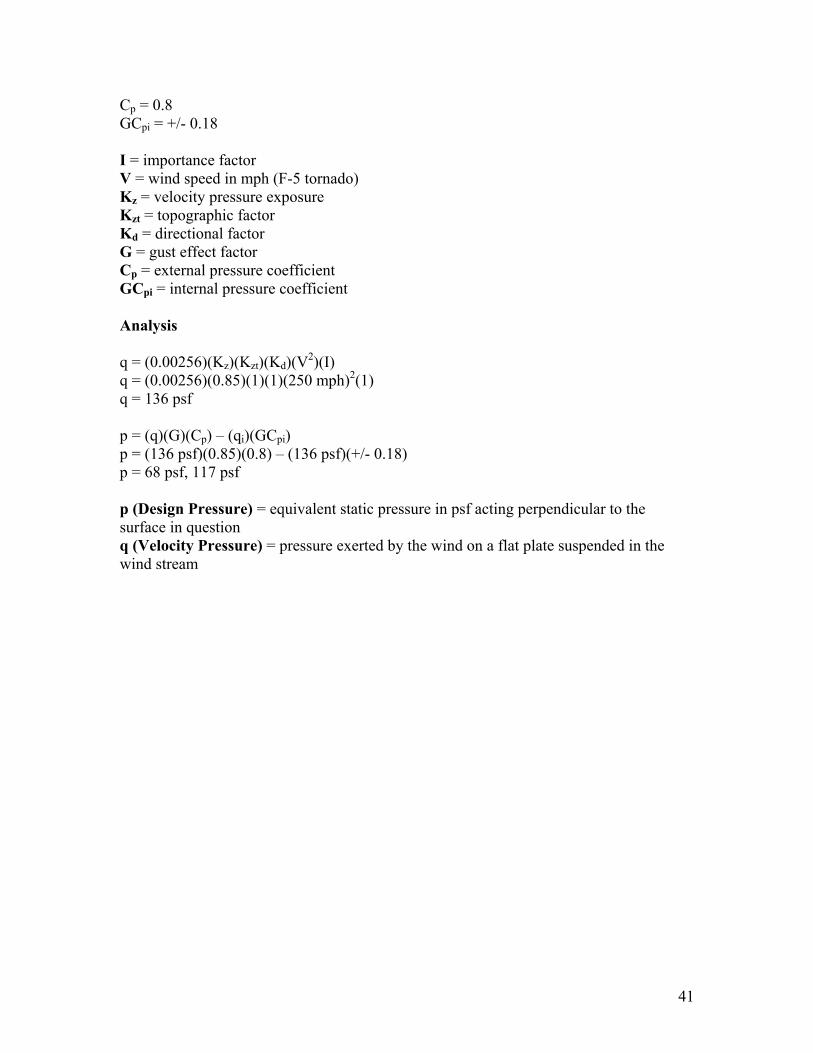
Cp = 0.8 GCpi = +/- 0.18 I = importance factor V = wind speed in mph (F-5 tornado) Kz = velocity pressure exposure Kzt = topographic factor Kd = directional factor G = gust effect factor Cp = external pressure coefficient GCpi = internal pressure coefficient Analysis q = (0.00256)(Kz)(Kzt)(Kd)(V2)(I) q = (0.00256)(0.85)(1)(1)(250 mph)2(1) q = 136 psf p = (q)(G)(Cp) – (qi)(GCpi) p = (136 psf)(0.85)(0.8) – (136 psf)(+/- 0.18) p = 68 psf, 117 psf p (Design Pressure) = equivalent static pressure in psf acting perpendicular to the surface in question q (Velocity Pressure) = pressure exerted by the wind on a flat plate suspended in the wind stream
41
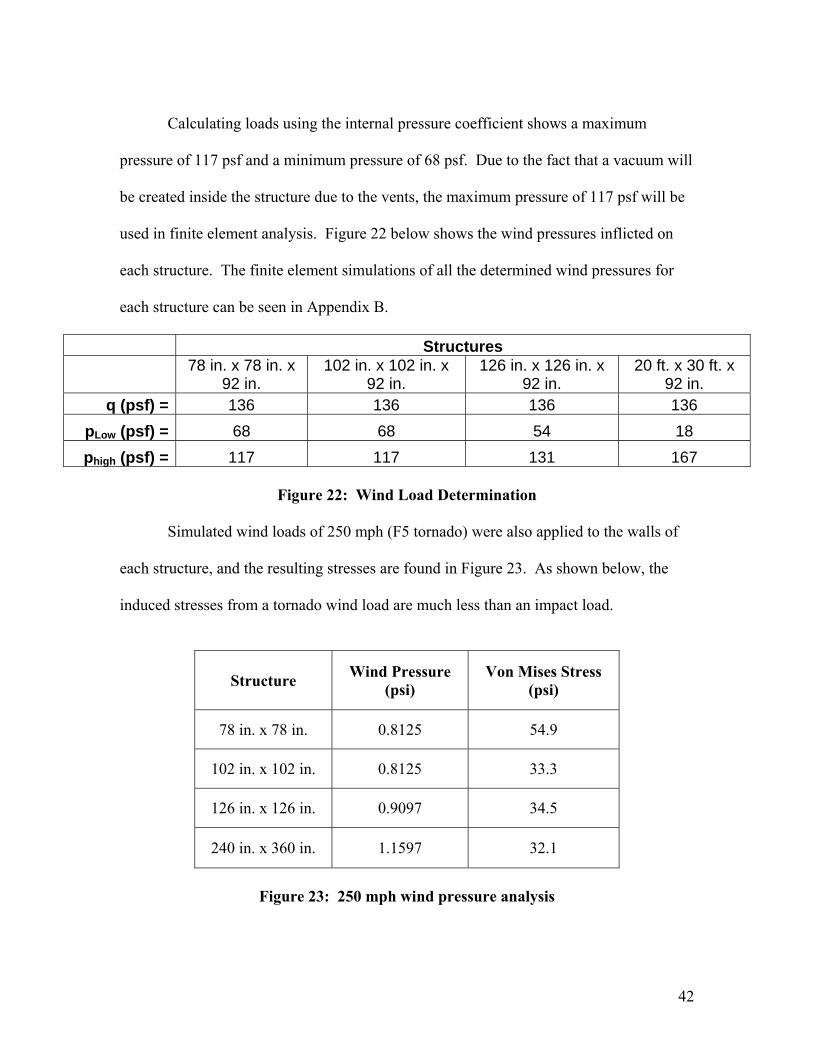
Calculating loads using the internal pressure coefficient shows a maximum
pressure of 117 psf and a minimum pressure of 68 psf. Due to the fact that a vacuum will
be created inside the structure due to the vents, the maximum pressure of 117 psf will be
used in finite element analysis. Figure 22 below shows the wind pressures inflicted on
each structure. The finite element simulations of all the determined wind pressures for
each structure can be seen in Appendix B.
Structures
78 in. x 78 in. x
92 in. 102 in. x 102 in. x
92 in. 126 in. x 126 in. x
92 in. 20 ft. x 30 ft. x
92 in. q (psf) = 136 136 136 136
pLow (psf) = 68 68 54 18 phigh (psf) = 117 117 131 167
Figure 22: Wind Load Determination
Simulated wind loads of 250 mph (F5 tornado) were also applied to the walls of
each structure, and the resulting stresses are found in Figure 23. As shown below, the
induced stresses from a tornado wind load are much less than an impact load.
Structure Wind Pressure (psi)
Von Mises Stress (psi)
78 in. x 78 in. 0.8125 54.9
102 in. x 102 in. 0.8125 33.3
126 in. x 126 in. 0.9097 34.5
240 in. x 360 in. 1.1597 32.1
Figure 23: 250 mph wind pressure analysis
42
5.3 Experimental Impact Testing
The impact testing is divided into two areas of focus: properly loading the
structure and obtaining reliable data from the acquisition system. A detailed explanation
of the team’s approach and final decision is discussed in the following section.
5.3.1 Determination of Load
To properly simulate tornado debris, many parameters are involved. A
projectile’s mass, volume, effective stiffness, velocity and angle of impact are crucial
factors to accurately determine an applied load. For this project, the focus will lie in the
projectile’s mass, stiffness and velocity.
The team’s initial testing concept was to load the roof of the structure statically
and correlate this with a dynamic force. This would provide measurable deflections and
allow calculations of the stress induced on the structure. After researching the concept,
this idea was abandoned since the structure will respond differently under dynamic
loading.
The final design included loading the roof with a uniform wooden pallet stacked
with sandbags, from a specified height. Such a weight was chosen so that it would
absorb some energy transferred during impact, and prevent the structure from cracking.
The weight was hoisted by a crane and released onto the structure. The response was
measured with an accelerometer mounted in the center of the structure’s ceiling.
Collected data allowed for calculations of the deflections and frequency response of the
structure.
43
5.3.2 Data Acquisition
The initial design concept involved a data acquisition system, utilizing data
loggers, to read data from strain gauges mounted to the roof. A laptop would be used to
extract the data from the data logger. Upon further review, this design was proved
unfeasible. The necessary strain gauges and data loggers exceed the team’s budget.
Also, strain gauges are not suitable for dynamic loading.
The final design utilized a PCB Piezotronics shock accelerometer, model 353B03.
Due to budget limitations, the mechanical engineering department at the Rochester
Institute of Technology allowed the team to use its data acquisition system and Labview
software.
The response of the structure was measured with an accelerometer mounted in the
structure’s ceiling using a fixture designed by the team. The mounting device for the
accelerometer consisted of a 0.5 in. diameter steel rod of 3 in. length with a 10-32 female
thread (for the accelerometer stud). In order to install this device, a hole needed to be
drilled in the structure’s roof. The accelerometer screwed onto a mounting stud, which
was screw into a metal rod. The rod was embedded into the structures ceiling using a
special epoxy to keep the fixture in place.
44
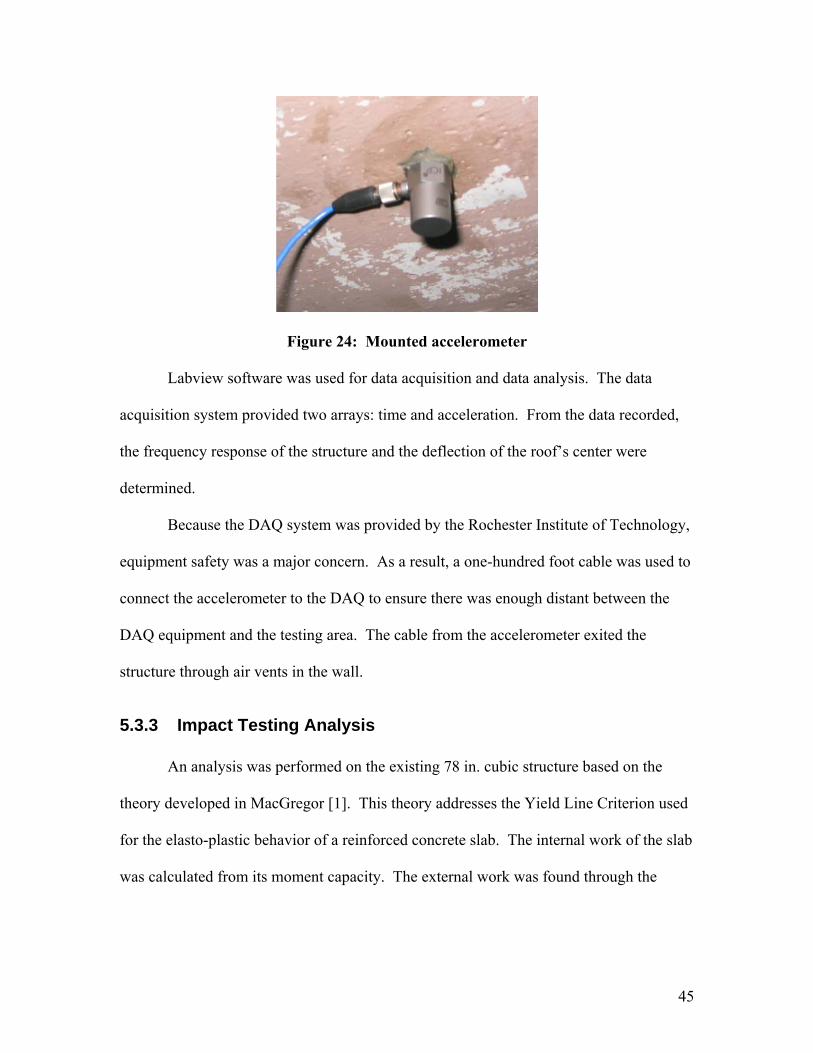
Figure 24: Mounted accelerometer Labview software was used for data acquisition and data analysis. The data
acquisition system provided two arrays: time and acceleration. From the data recorded,
the frequency response of the structure and the deflection of the roof’s center were
determined.
Because the DAQ system was provided by the Rochester Institute of Technology,
equipment safety was a major concern. As a result, a one-hundred foot cable was used to
connect the accelerometer to the DAQ to ensure there was enough distant between the
DAQ equipment and the testing area. The cable from the accelerometer exited the
structure through air vents in the wall.
5.3.3 Impact Testing Analysis
An analysis was performed on the existing 78 in. cubic structure based on the
theory developed in MacGregor [1]. This theory addresses the Yield Line Criterion used
for the elasto-plastic behavior of a reinforced concrete slab. The internal work of the slab
was calculated from its moment capacity. The external work was found through the
45
deflection and the applied pressure. The internal work and external work were then
equated to find the maximum applied load using the following equation.
wLm
2
38
δδ=
where L is the length of the slab, w is the uniform distributed load, d is the deflection,
and m is the maximum moment per unit width. Using this method, the maximum
theoretical distributed load was calculated at 14.5 psi (88,218 lb).
In an impact test of a reinforced concrete slab, the concrete will fail in tension
before compression. When a uniform distributed load of 14.5 psi was applied to the
finite element model with no rebar, the resulting stress was 615 psi. This is about 15%
higher than the theoretical result of 538 psi. The finite element model was not reinforced
because of the limitations in available computing power. Comparing a slab with and
without rebar, a difference of 15% in ultimate strength can be accepted.
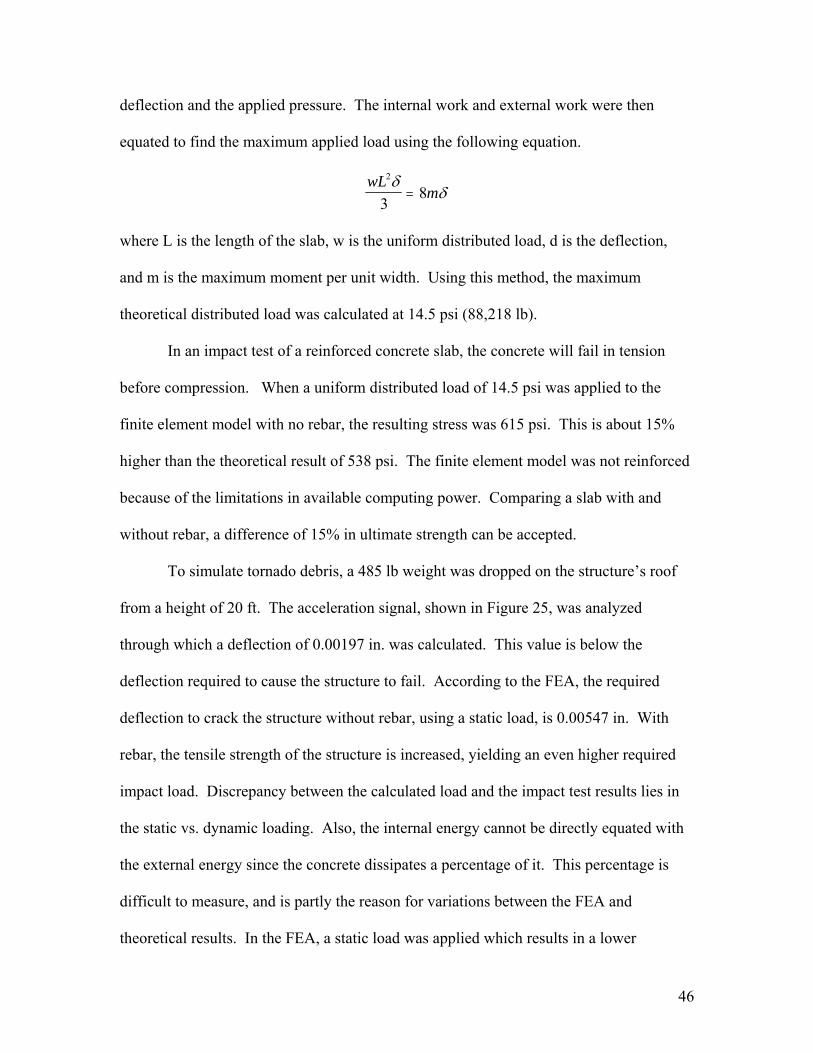
To simulate tornado debris, a 485 lb weight was dropped on the structure’s roof
from a height of 20 ft. The acceleration signal, shown in Figure 25, was analyzed
through which a deflection of 0.00197 in. was calculated. This value is below the
deflection required to cause the structure to fail. According to the FEA, the required
deflection to crack the structure without rebar, using a static load, is 0.00547 in. With
rebar, the tensile strength of the structure is increased, yielding an even higher required
impact load. Discrepancy between the calculated load and the impact test results lies in
the static vs. dynamic loading. Also, the internal energy cannot be directly equated with
the external energy since the concrete dissipates a percentage of it. This percentage is
difficult to measure, and is partly the reason for variations between the FEA and
theoretical results. In the FEA, a static load was applied which results in a lower
46
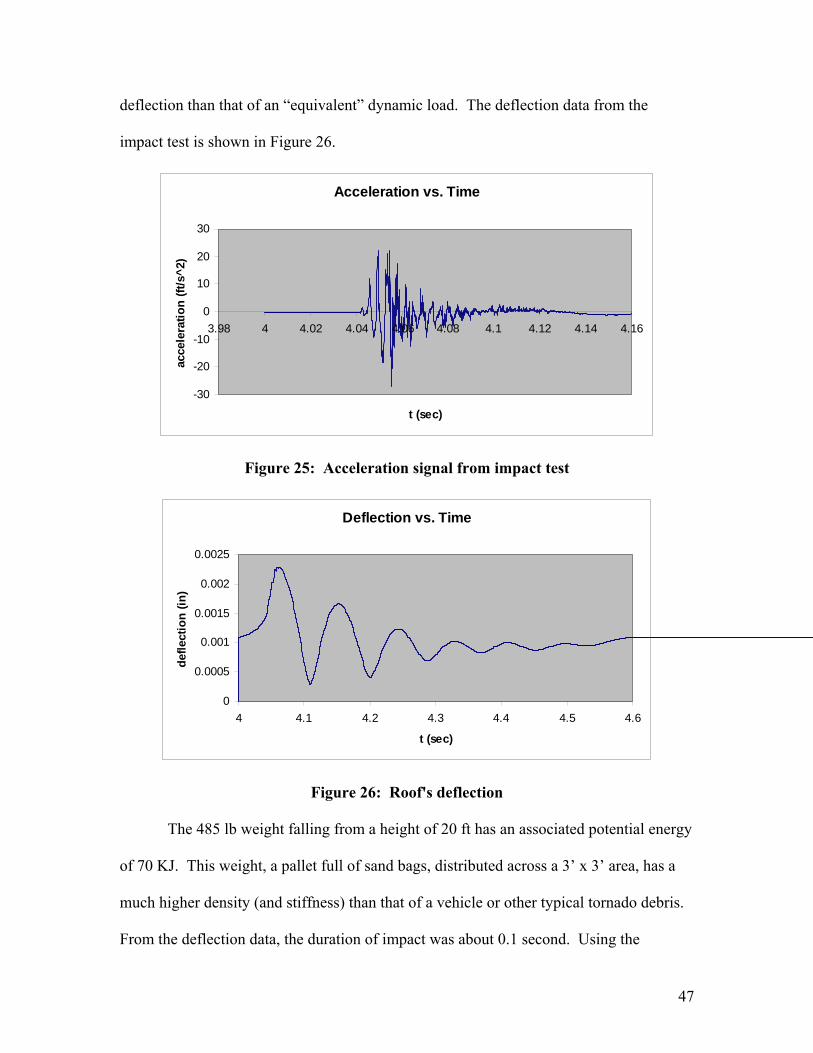
deflection than that of an “equivalent” dynamic load. The deflection data from the
impact test is shown in Figure 26.
Acceleration vs. Time
-30
-20
-10
0
10
20
30
3.98 4 4.02 4.04 4.06 4.08 4.1 4.12 4.14 4.16
t (sec)
acce
lera
tion
(ft/s
^2)
Figure 25: Acceleration signal from impact test
Deflection vs. Time
0
0.0005
0.001
0.0015
0.002
0.0025
4 4.1 4.2 4.3 4.4 4.5 4.6
t (sec)
defle
ctio
n (in
)
Figure 26: Roof's deflection
The 485 lb weight falling from a height of 20 ft has an associated potential energy
of 70 KJ. This weight, a pallet full of sand bags, distributed across a 3’ x 3’ area, has a
much higher density (and stiffness) than that of a vehicle or other typical tornado debris.
From the deflection data, the duration of impact was about 0.1 second. Using the
47
impulse-force equation, where, p is the loads momentum, F is the resulting force and t is
time,
Fpt
=∆∆
resulted in an impact force of 5,600 lb distributed over nine square feet, resulting in a
pressure of 4 psi on the structure. This is about 1/10 of the pressure applied in the FEA
which caused the structure to fail. In comparing a vehicle falling on the structure to the
test load, the mass would be about ten times as great, distributed over an area about twice
as large. For a worst case scenario, the time duration will be assumed the same. Using
these parameters to achieve the required maximum stress found in the FEA, it would
require the energy of about 4 cars (4000 KJ) falling on the structure at the same time.
Again, this would be higher if the FEA were built with rebar. While the purpose of this
paper is not to endorse OZ Saferooms, it is worth mentioning that such debris is not
common in the most severe tornados.
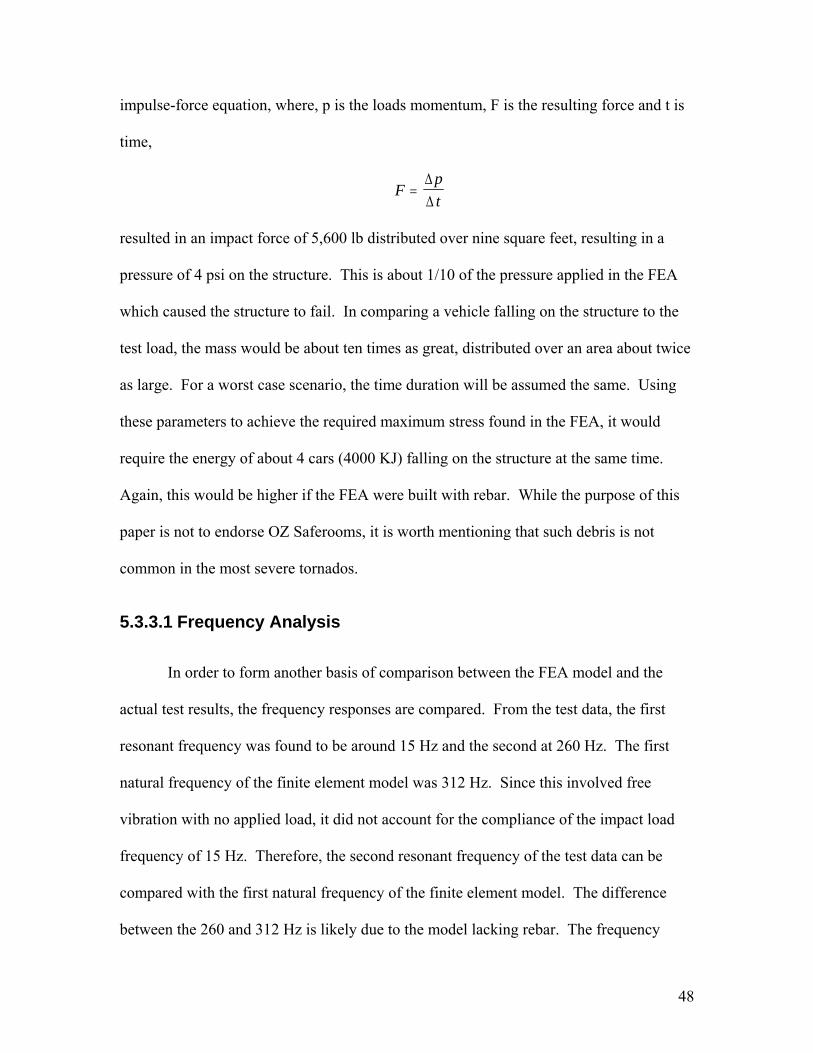
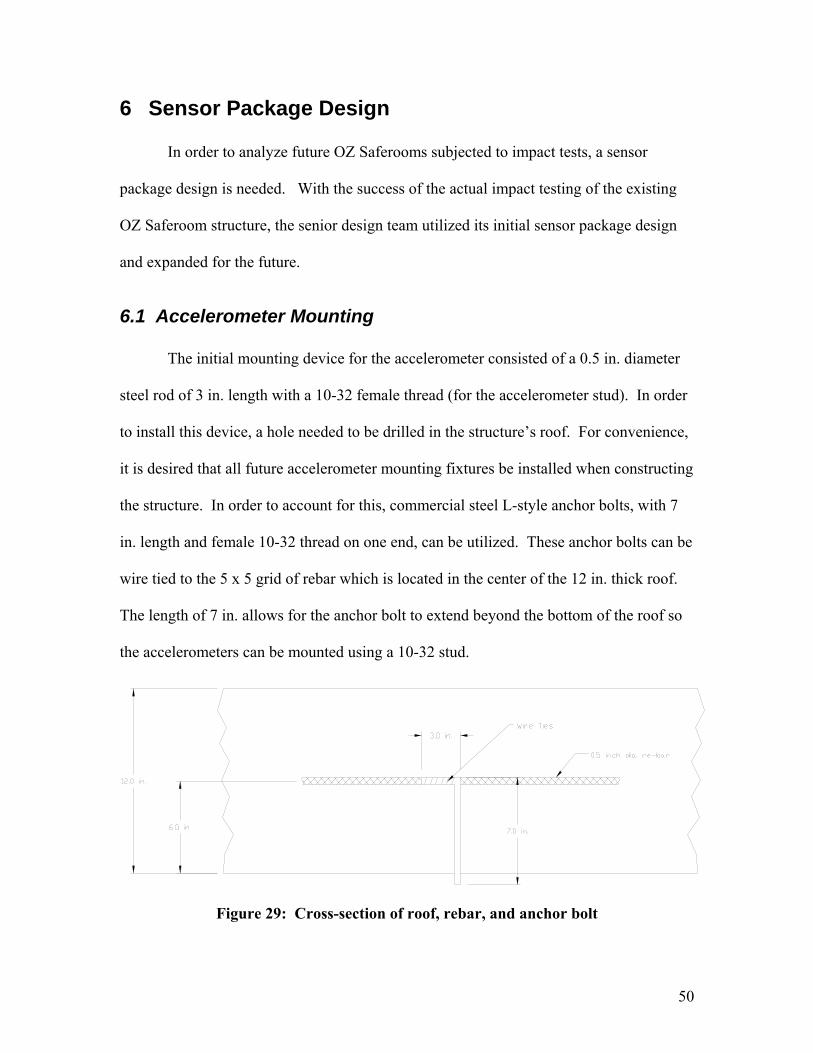
5.3.3.1 Frequency Analysis
In order to form another basis of comparison between the FEA model and the
actual test results, the frequency responses are compared. From the test data, the first
resonant frequency was found to be around 15 Hz and the second at 260 Hz. The first
natural frequency of the finite element model was 312 Hz. Since this involved free
vibration with no applied load, it did not account for the compliance of the impact load
frequency of 15 Hz. Therefore, the second resonant frequency of the test data can be
compared with the first natural frequency of the finite element model. The difference
between the 260 and 312 Hz is likely due to the model lacking rebar. The frequency
48
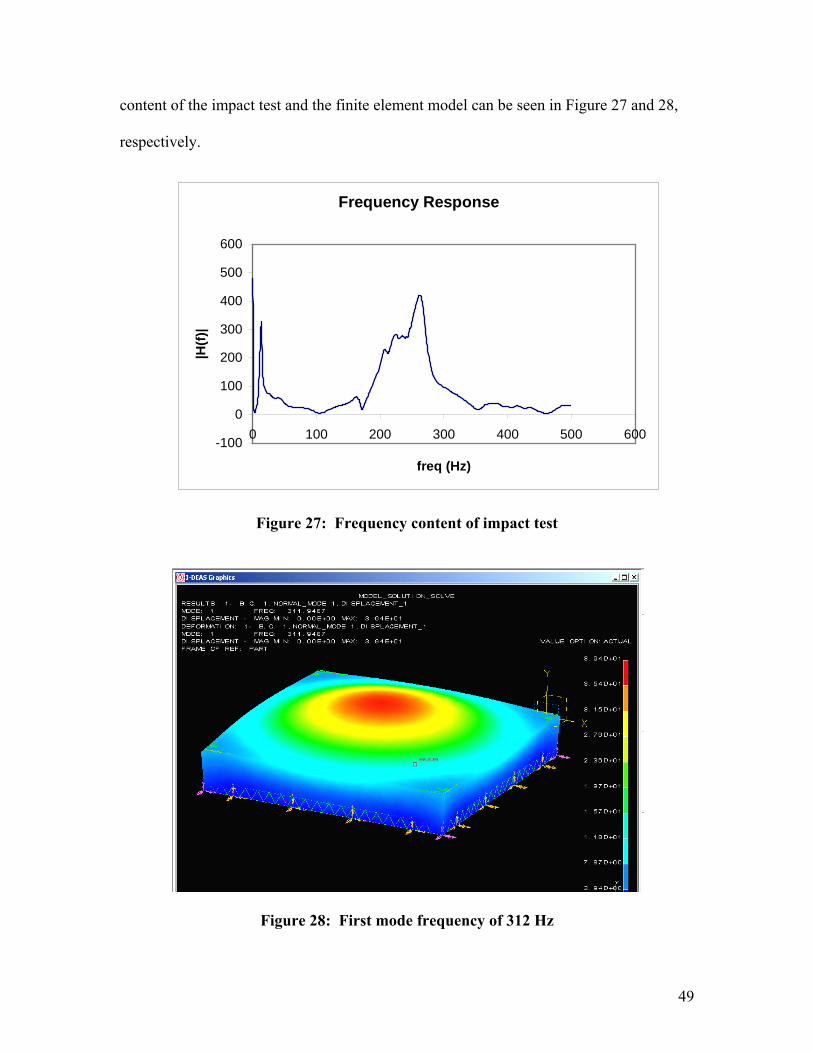
content of the impact test and the finite element model can be seen in Figure 27 and 28,
respectively.
Frequency Response
-100
0
100
200
300
400
500
600
0 100 200 300 400 500 600
freq (Hz)
|H(f)
|
Figure 27: Frequency content of impact test
Figure 28: First mode frequency of 312 Hz
49
6 Sensor Package Design
In order to analyze future OZ Saferooms subjected to impact tests, a sensor
package design is needed. With the success of the actual impact testing of the existing
OZ Saferoom structure, the senior design team utilized its initial sensor package design
and expanded for the future.
6.1 Accelerometer Mounting
The initial mounting device for the accelerometer consisted of a 0.5 in. diameter
steel rod of 3 in. length with a 10-32 female thread (for the accelerometer stud). In order
to install this device, a hole needed to be drilled in the structure’s roof. For convenience,
it is desired that all future accelerometer mounting fixtures be installed when constructing
the structure. In order to account for this, commercial steel L-style anchor bolts, with 7
in. length and female 10-32 thread on one end, can be utilized. These anchor bolts can be
wire tied to the 5 x 5 grid of rebar which is located in the center of the 12 in. thick roof.
The length of 7 in. allows for the anchor bolt to extend beyond the bottom of the roof so
the accelerometers can be mounted using a 10-32 stud.
Figure 29: Cross-section of roof, rebar, and anchor bolt
50
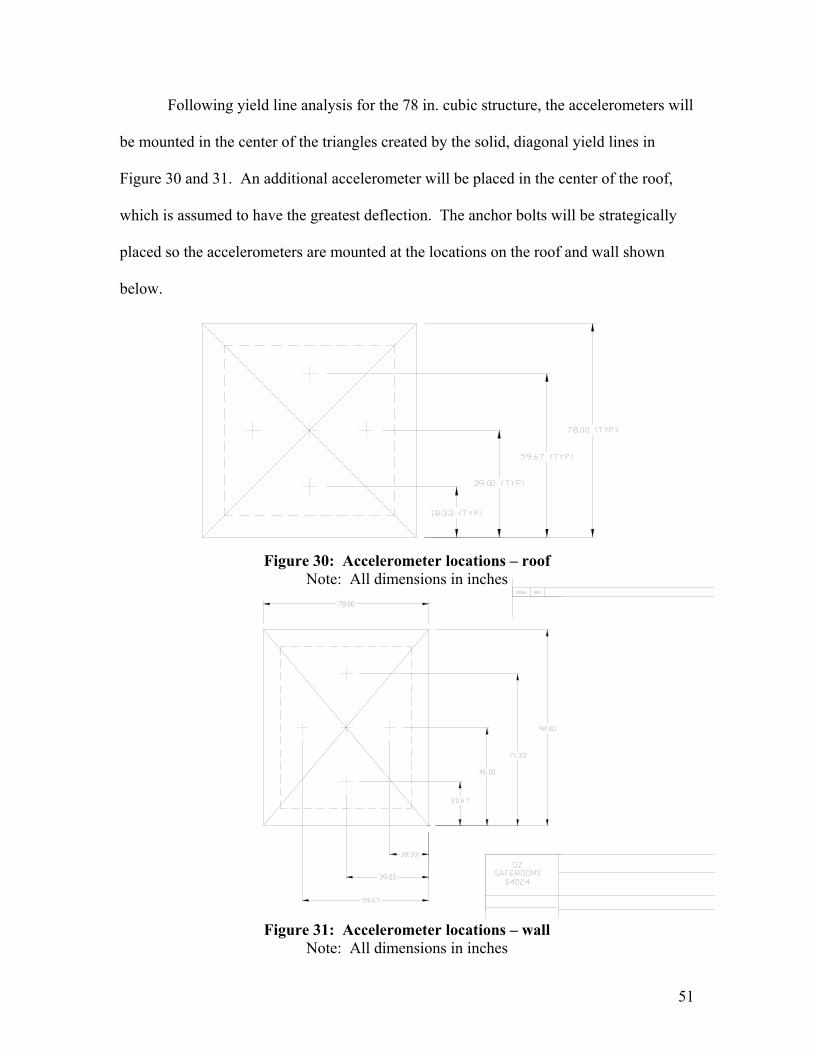
Following yield line analysis for the 78 in. cubic structure, the accelerometers will
be mounted in the center of the triangles created by the solid, diagonal yield lines in
Figure 30 and 31. An additional accelerometer will be placed in the center of the roof,
which is assumed to have the greatest deflection. The anchor bolts will be strategically
placed so the accelerometers are mounted at the locations on the roof and wall shown
below.
Figure 30: Accelerometer locations – roof
Note: All dimensions in inches
Figure 31: Accelerometer locations – wall
Note: All dimensions in inches
51
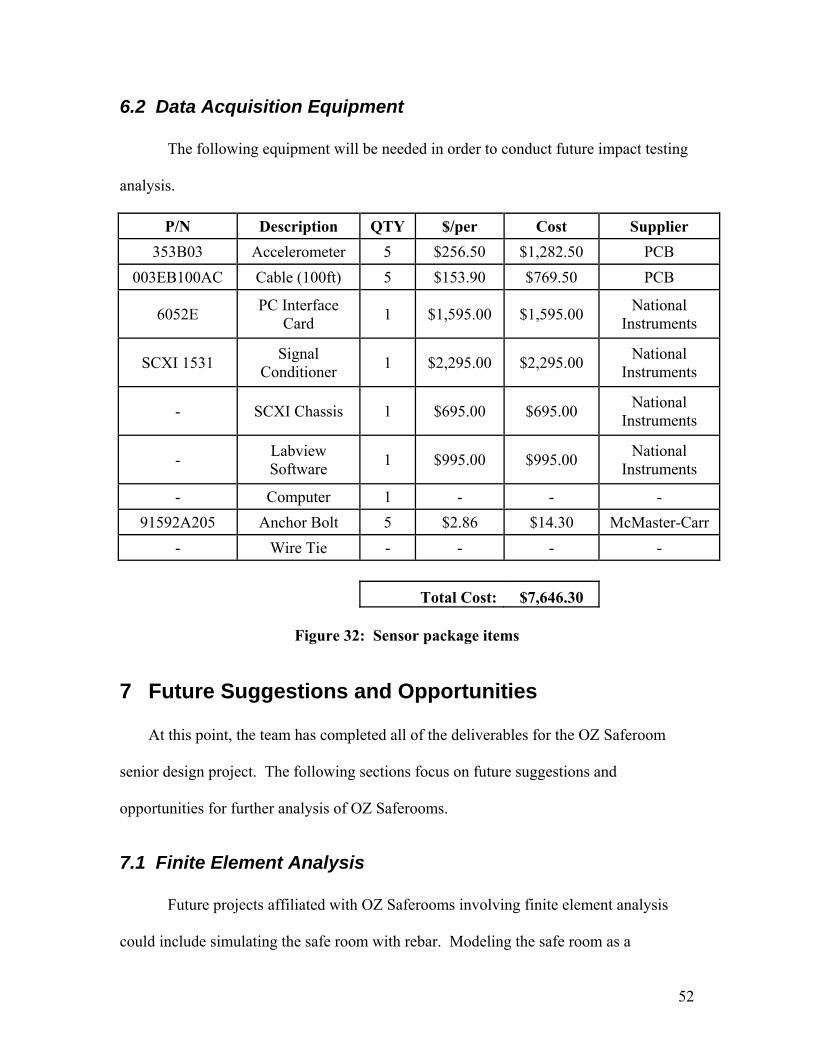
6.2 Data Acquisition Equipment
The following equipment will be needed in order to conduct future impact testing
analysis.
P/N Description QTY $/per Cost Supplier 353B03 Accelerometer 5 $256.50 $1,282.50 PCB
003EB100AC Cable (100ft) 5 $153.90 $769.50 PCB
6052E PC Interface Card 1 $1,595.00 $1,595.00 National
Instruments
SCXI 1531 Signal Conditioner 1 $2,295.00 $2,295.00 National
Instruments
- SCXI Chassis 1 $695.00 $695.00 National Instruments
- Labview Software 1 $995.00 $995.00 National
Instruments
- Computer 1 - - - 91592A205 Anchor Bolt 5 $2.86 $14.30 McMaster-Carr
- Wire Tie - - - -
Total Cost: $7,646.30
Figure 32: Sensor package items
7 Future Suggestions and Opportunities
At this point, the team has completed all of the deliverables for the OZ Saferoom
senior design project. The following sections focus on future suggestions and
opportunities for further analysis of OZ Saferooms.
7.1 Finite Element Analysis
Future projects affiliated with OZ Saferooms involving finite element analysis
could include simulating the safe room with rebar. Modeling the safe room as a
52
reinforced structure would more accurately depict the stress and displacement results
found in an actual reinforced OZ Saferoom. To simulate this complex model, a more
powerful computer or workstation is needed.
The second opportunity or suggestion that would involve FEA would be to
subject the safe room to dynamic loads. With dynamic loading, it would be easier to
portray debris such as trees, cars or parts of buildings striking the safe room. Dynamic
loading would also yield more precise impact test result for stress and displacement.
7.2 Impact Testing
This project has successfully demonstrated the durability of the existing OZ
Saferoom, yet there are many opportunities for further projects relating to impact testing.
Due to resource constraints, the team was only able to dynamically load the structure’s
roof. It may also be worthwhile to consider an impact test to the structure’s walls and
door. This may be accomplished through the use of a swinging projectile or other
innovative methods. It may be in Zagorski Forms’ best interest to load a structure to
failure, in order to realize its true ultimate strength. Also, further projects could be
initiated using a strain gage on the structure’s rebar during an impact test. This would
provide experimental data for the stress seen by the rebar. From all of these possible
concepts, Zagorski Forms could alter the design of the structure as needed.
53
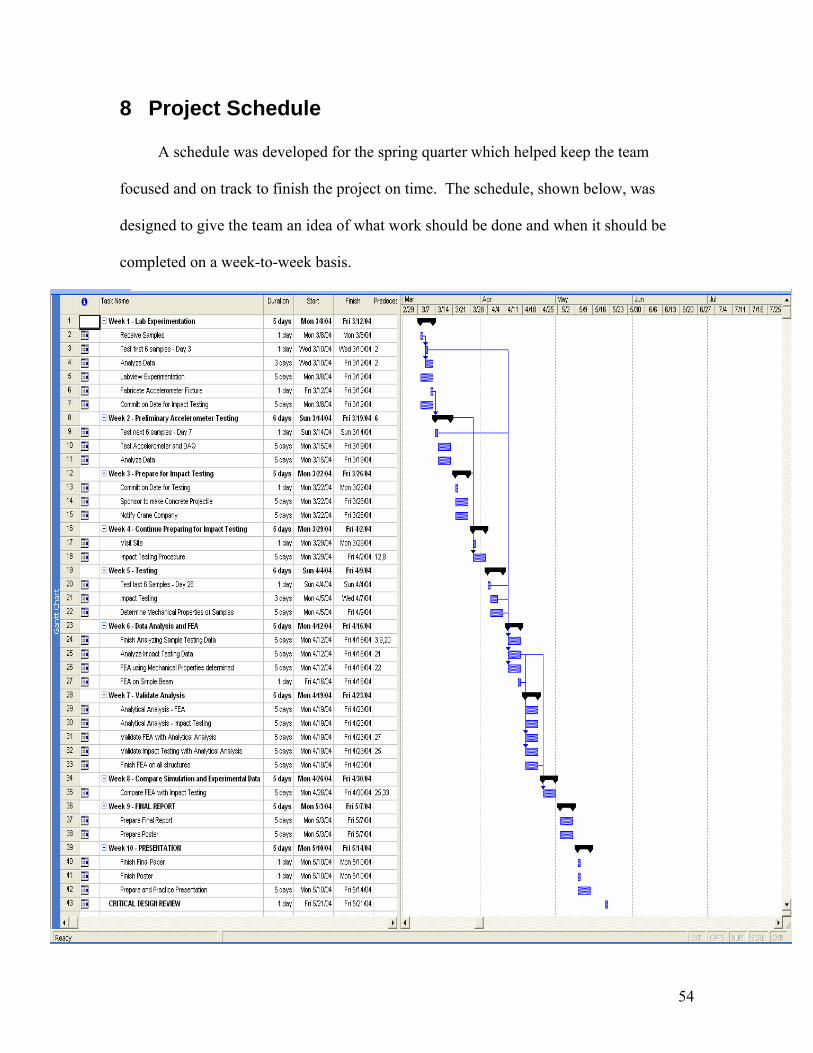
8 Project Schedule
A schedule was developed for the spring quarter which helped keep the team
focused and on track to finish the project on time. The schedule, shown below, was
designed to give the team an idea of what work should be done and when it should be
completed on a week-to-week basis.
54
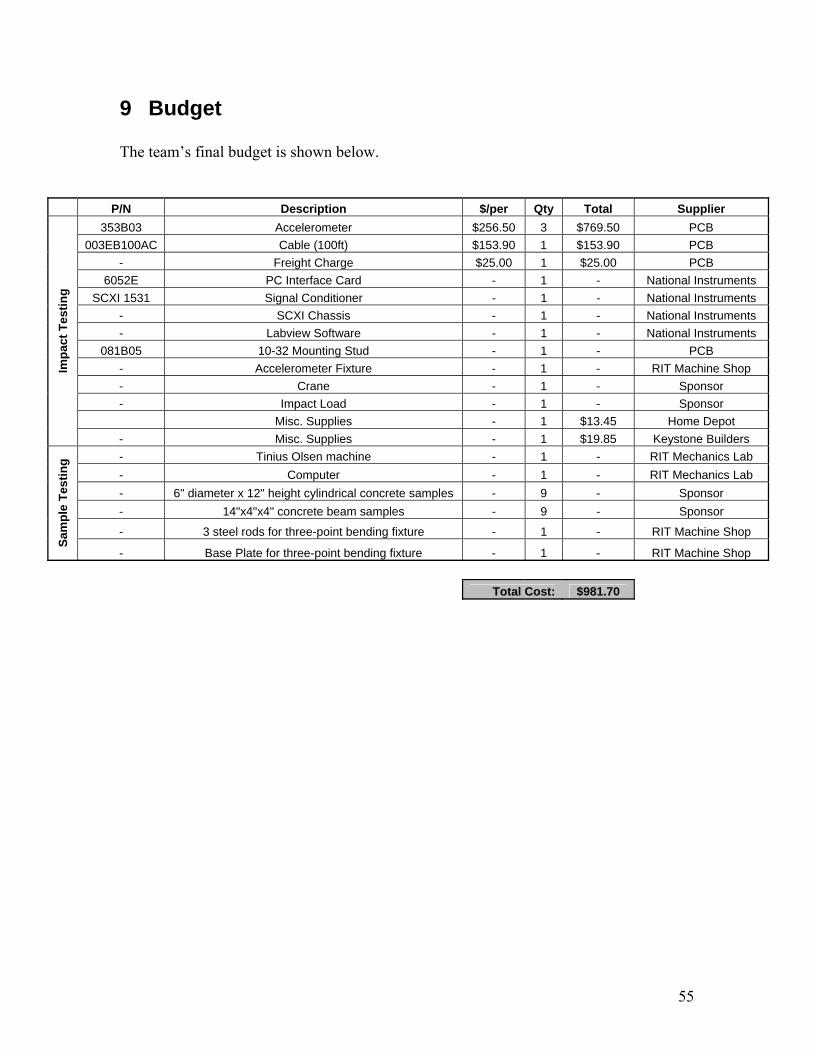
9 Budget The team’s final budget is shown below.
P/N Description $/per Qty Total Supplier 353B03 Accelerometer $256.50 3 $769.50 PCB
003EB100AC Cable (100ft) $153.90 1 $153.90 PCB - Freight Charge $25.00 1 $25.00 PCB
6052E PC Interface Card - 1 - National Instruments SCXI 1531 Signal Conditioner - 1 - National Instruments
- SCXI Chassis - 1 - National Instruments - Labview Software - 1 - National Instruments
081B05 10-32 Mounting Stud - 1 - PCB - Accelerometer Fixture - 1 - RIT Machine Shop - Crane - 1 - Sponsor - Impact Load - 1 - Sponsor Misc. Supplies - 1 $13.45 Home Depot
Impa
ct T
estin
g
- Misc. Supplies - 1 $19.85 Keystone Builders - Tinius Olsen machine - 1 - RIT Mechanics Lab - Computer - 1 - RIT Mechanics Lab - 6" diameter x 12" height cylindrical concrete samples - 9 - Sponsor - 14"x4"x4" concrete beam samples - 9 - Sponsor
- 3 steel rods for three-point bending fixture - 1 - RIT Machine Shop
Sam
ple
Test
ing
- Base Plate for three-point bending fixture - 1 - RIT Machine Shop Total Cost: $981.70
55
10 References “Design and Construction Guidance for Community Shelters,” Federal Emergency
Management Agency, FEMA 361, First Edition, July 2000.
“Taking Shelter from the Storm,” Federal Emergency Management Agency, FEMA 320,
2nd Edition, August 1999.
“Association Standards for the Design, Construction, and Performance of Storm
Shelters,” National Storm Shelter Association, First Edition, April 2001.
ASCE 7-98, (1999), “Minimum Design Loads for Buildings and Other Structures,”
American Society of Civil Engineers.
ASTM C78-02, (2003), “Standard Test Method for Flexural Strength of Concrete,”
American Society for Testing and Materials, Volume 4.
ASTM C39, (2003), “Standard Test Method for Compressive Strength of Cylindrical
Concrete Specimens,” American Society for Testing and Materials, Volume 4.
MacGregor, J. G., 1992, “Reinforced Concrete Mechanics and Design,” 2nd edition,
Prentice Hall, pp. 47-55, 659-672.
Askeland, D. R. and Phule, P. P., 2003, "The Science and Engineering of Materials," 4th
edition, Brooks/Cole, p. 255.
OZ Saferooms. 5 Dec. 2003 <http://www.ozsaferooms.com/>.
56
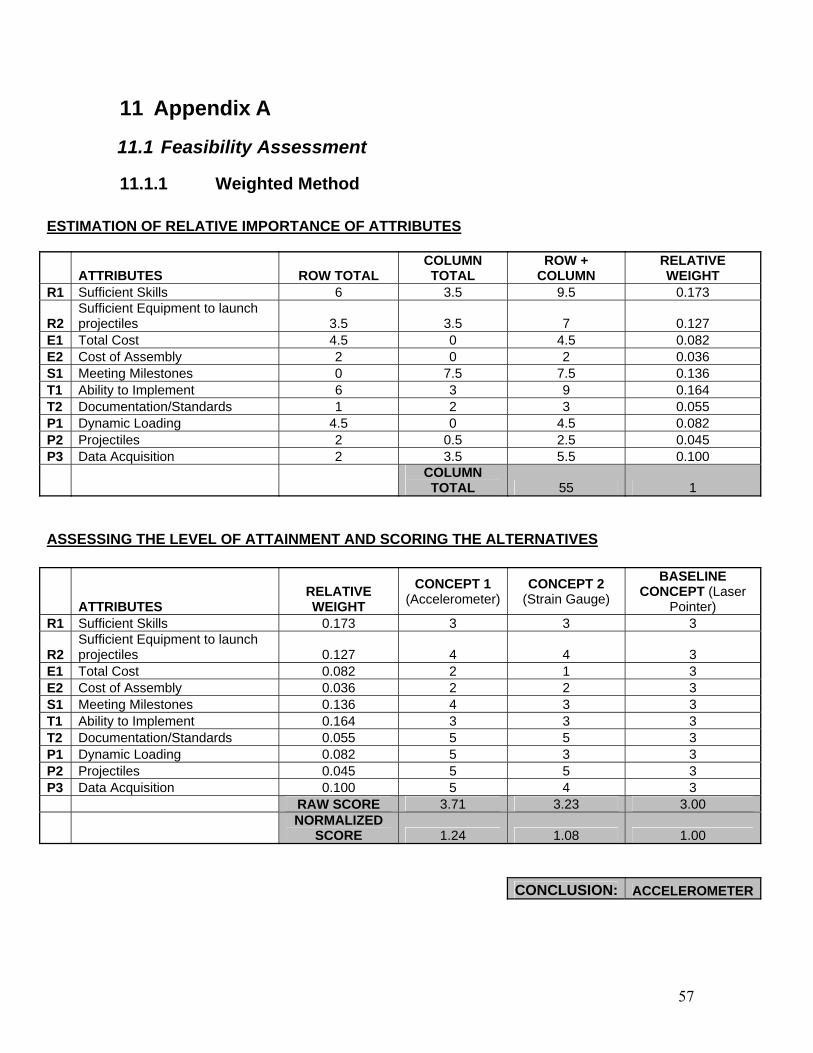
11 Appendix A
11.1 Feasibility Assessment
11.1.1 Weighted Method
ESTIMATION OF RELATIVE IMPORTANCE OF ATTRIBUTES
ATTRIBUTES ROW TOTAL COLUMN TOTAL
ROW + COLUMN
RELATIVE WEIGHT
R1 Sufficient Skills 6 3.5 9.5 0.173
R2 Sufficient Equipment to launch projectiles 3.5 3.5 7 0.127
E1 Total Cost 4.5 0 4.5 0.082 E2 Cost of Assembly 2 0 2 0.036 S1 Meeting Milestones 0 7.5 7.5 0.136 T1 Ability to Implement 6 3 9 0.164 T2 Documentation/Standards 1 2 3 0.055 P1 Dynamic Loading 4.5 0 4.5 0.082 P2 Projectiles 2 0.5 2.5 0.045 P3 Data Acquisition 2 3.5 5.5 0.100
COLUMN TOTAL 55 1
ASSESSING THE LEVEL OF ATTAINMENT AND SCORING THE ALTERNATIVES
ATTRIBUTES RELATIVE WEIGHT
CONCEPT 1 (Accelerometer)
CONCEPT 2 (Strain Gauge)
BASELINE CONCEPT (Laser
Pointer) R1 Sufficient Skills 0.173 3 3 3
R2 Sufficient Equipment to launch projectiles 0.127 4 4 3
E1 Total Cost 0.082 2 1 3 E2 Cost of Assembly 0.036 2 2 3 S1 Meeting Milestones 0.136 4 3 3 T1 Ability to Implement 0.164 3 3 3 T2 Documentation/Standards 0.055 5 5 3 P1 Dynamic Loading 0.082 5 3 3 P2 Projectiles 0.045 5 5 3 P3 Data Acquisition 0.100 5 4 3 RAW SCORE 3.71 3.23 3.00
NORMALIZED
SCORE 1.24 1.08 1.00 CONCLUSION: ACCELEROMETER
57
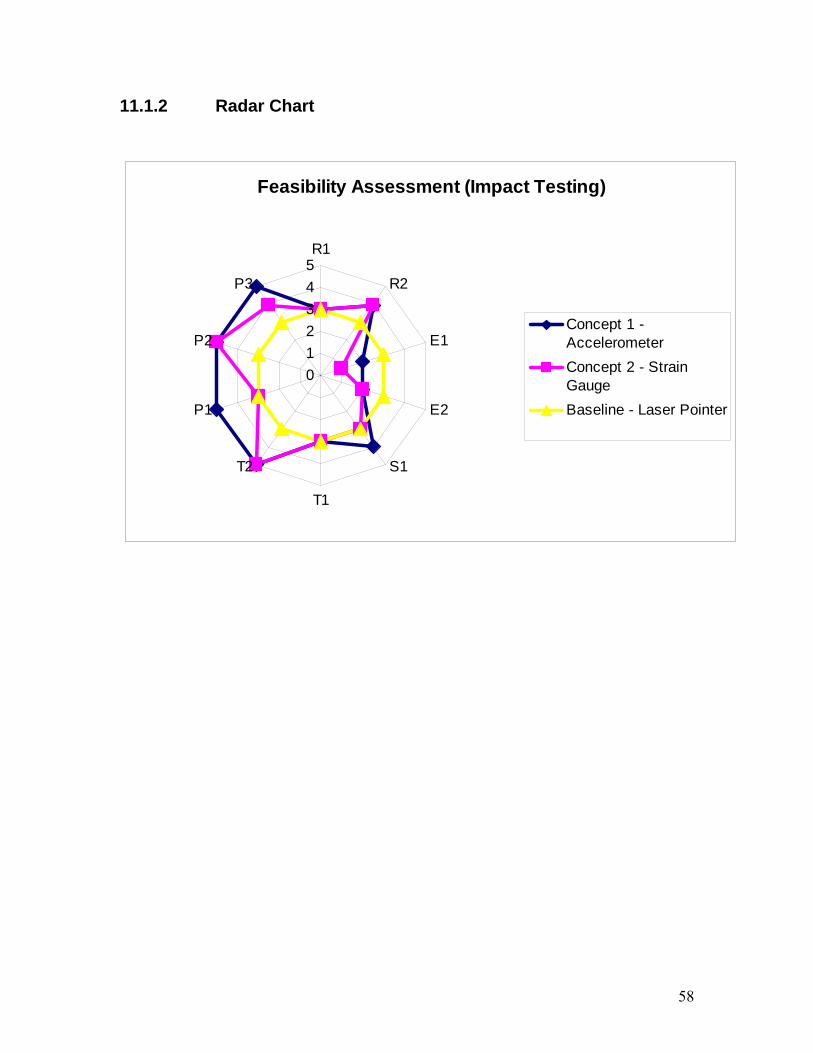
11.1.2 Radar Chart
Feasibility Assessment (Impact Testing)
012345R1
R2
E1
E2
S1
T1
T2
P1
P2
P3
Concept 1 -AccelerometerConcept 2 - StrainGaugeBaseline - Laser Pointer
58
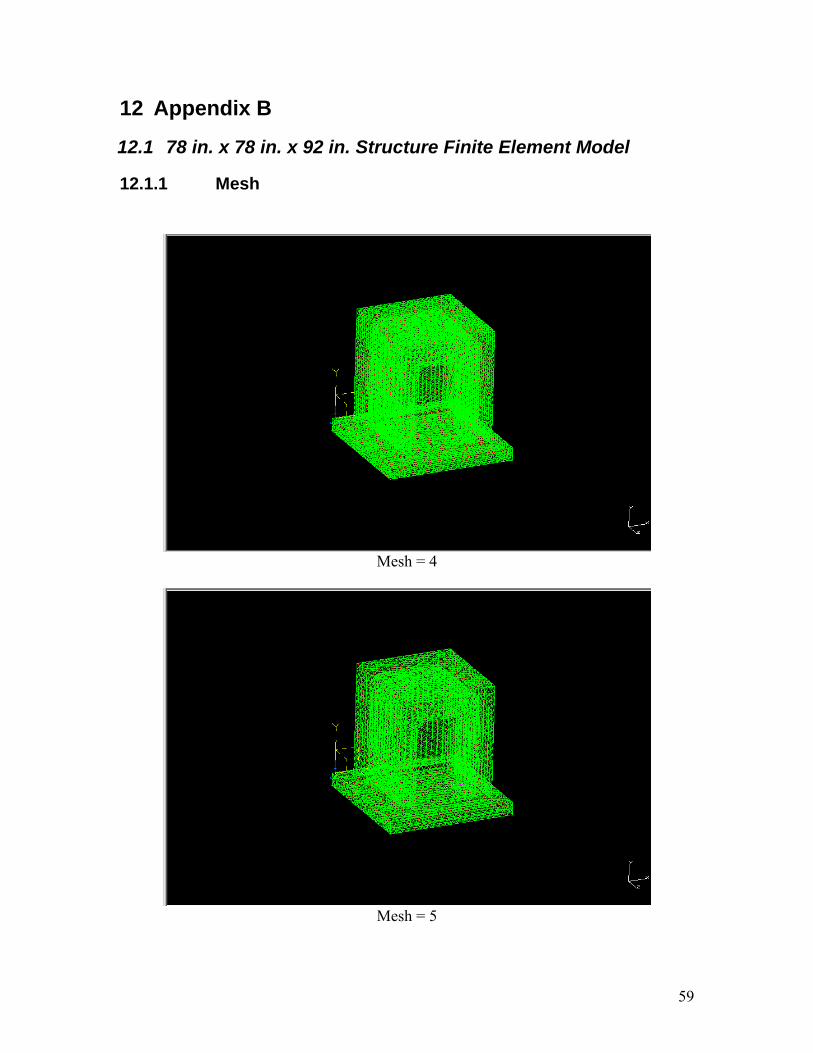
12 Appendix B
12.1 78 in. x 78 in. x 92 in. Structure Finite Element Model
12.1.1 Mesh
Mesh = 4
Mesh = 5
59
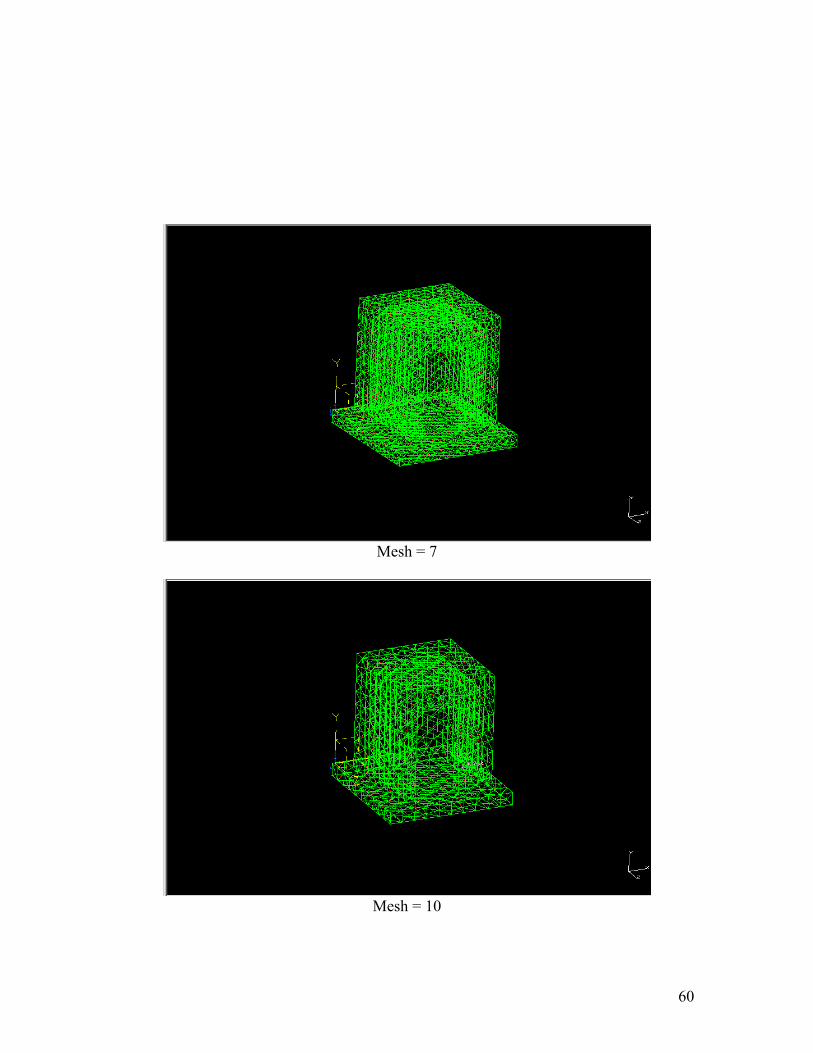
Mesh = 7
Mesh = 10
60
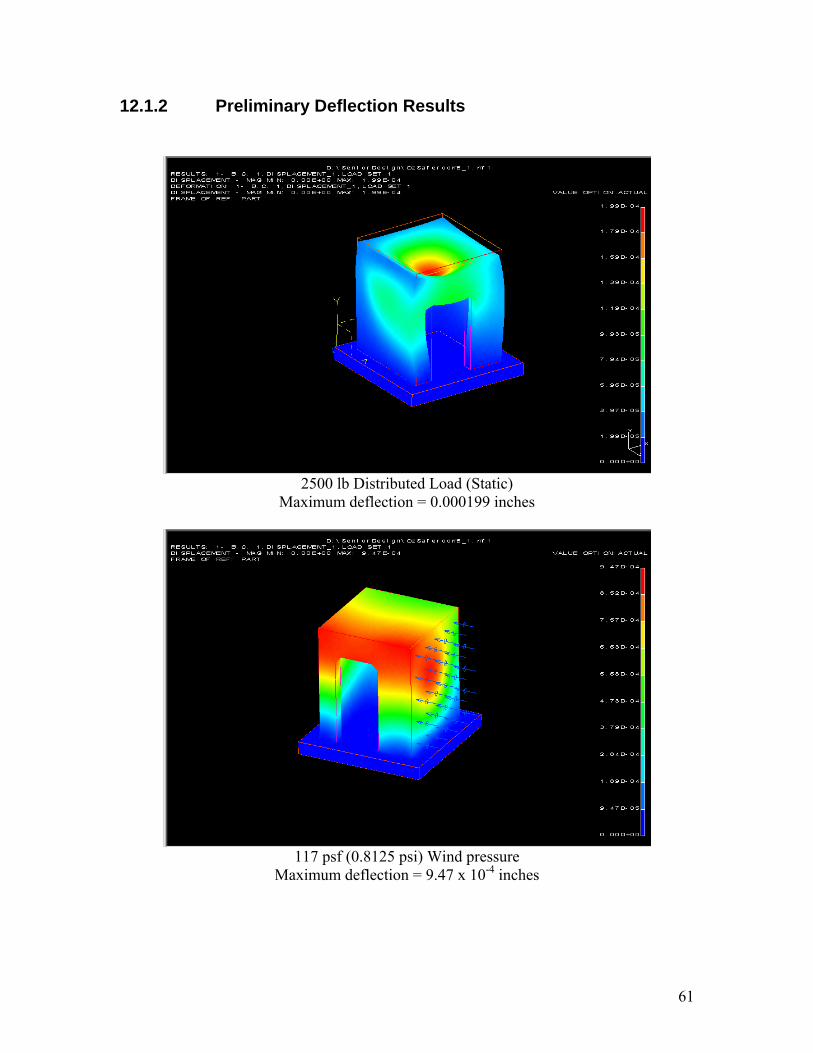
12.1.2 Preliminary Deflection Results
2500 lb Distributed Load (Static)
Maximum deflection = 0.000199 inches
117 psf (0.8125 psi) Wind pressure
Maximum deflection = 9.47 x 10⁻⁴ inches
61
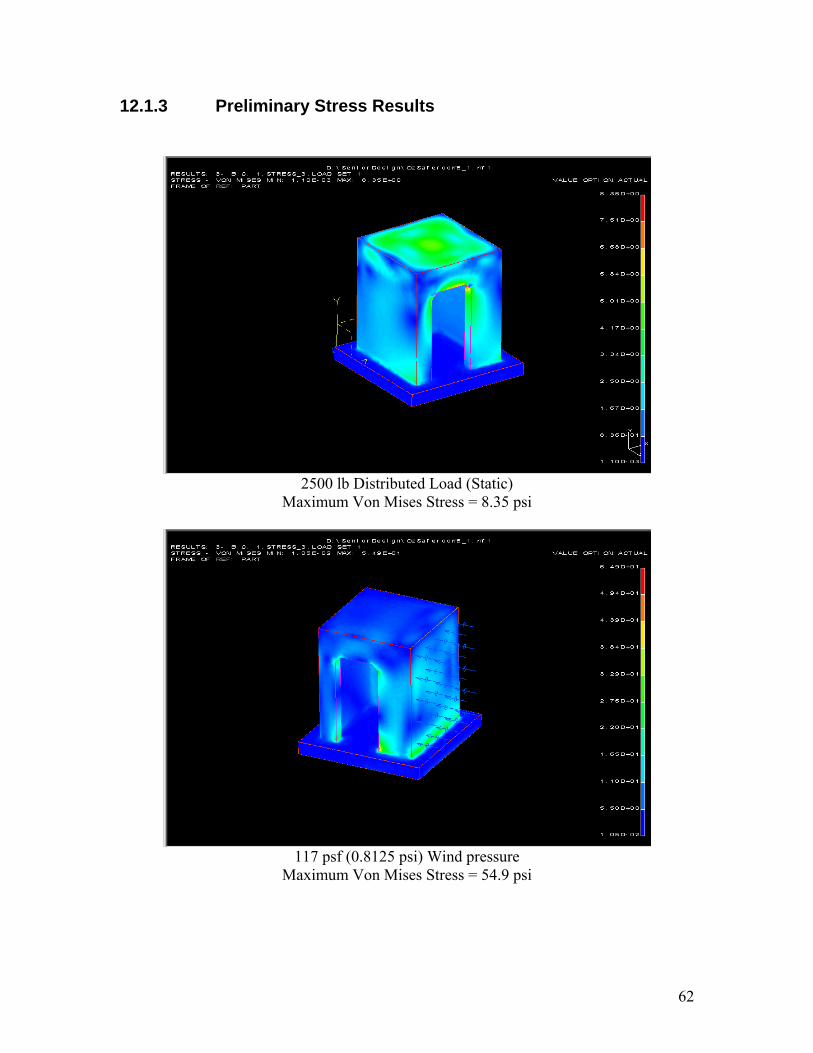
12.1.3 Preliminary Stress Results
2500 lb Distributed Load (Static)
Maximum Von Mises Stress = 8.35 psi
117 psf (0.8125 psi) Wind pressure
Maximum Von Mises Stress = 54.9 psi
62
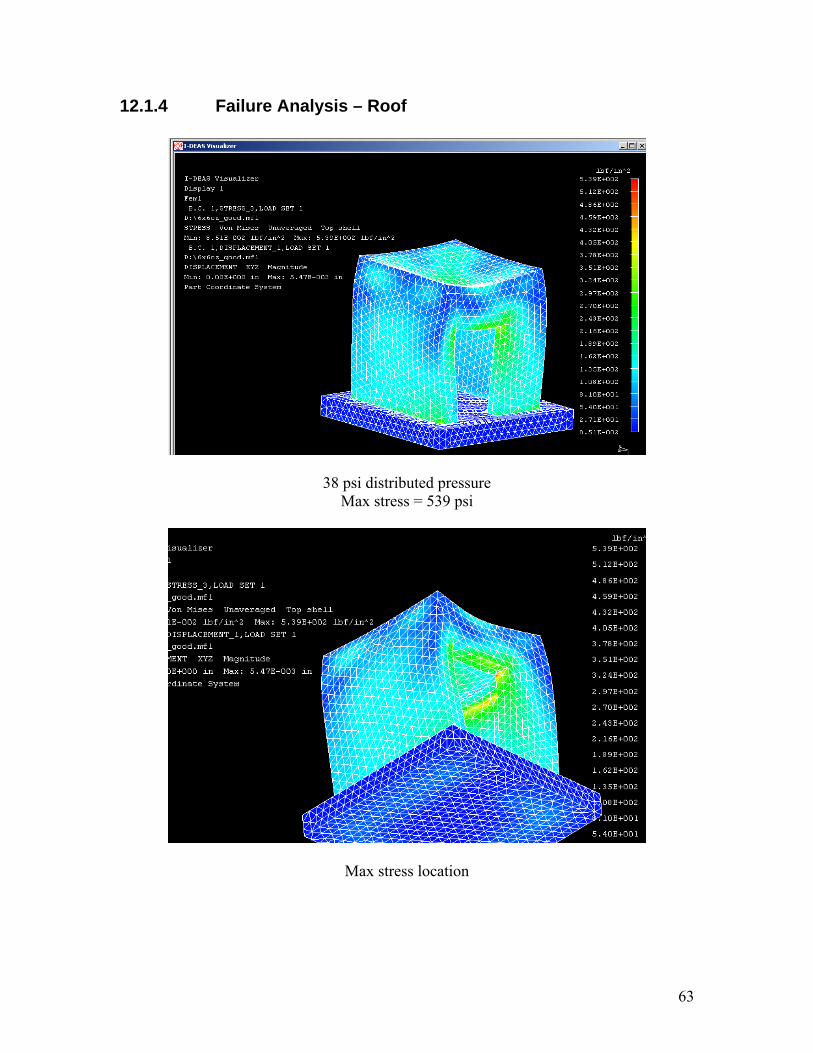
12.1.4 Failure Analysis – Roof
38 psi distributed pressure Max stress = 539 psi
Max stress location
63
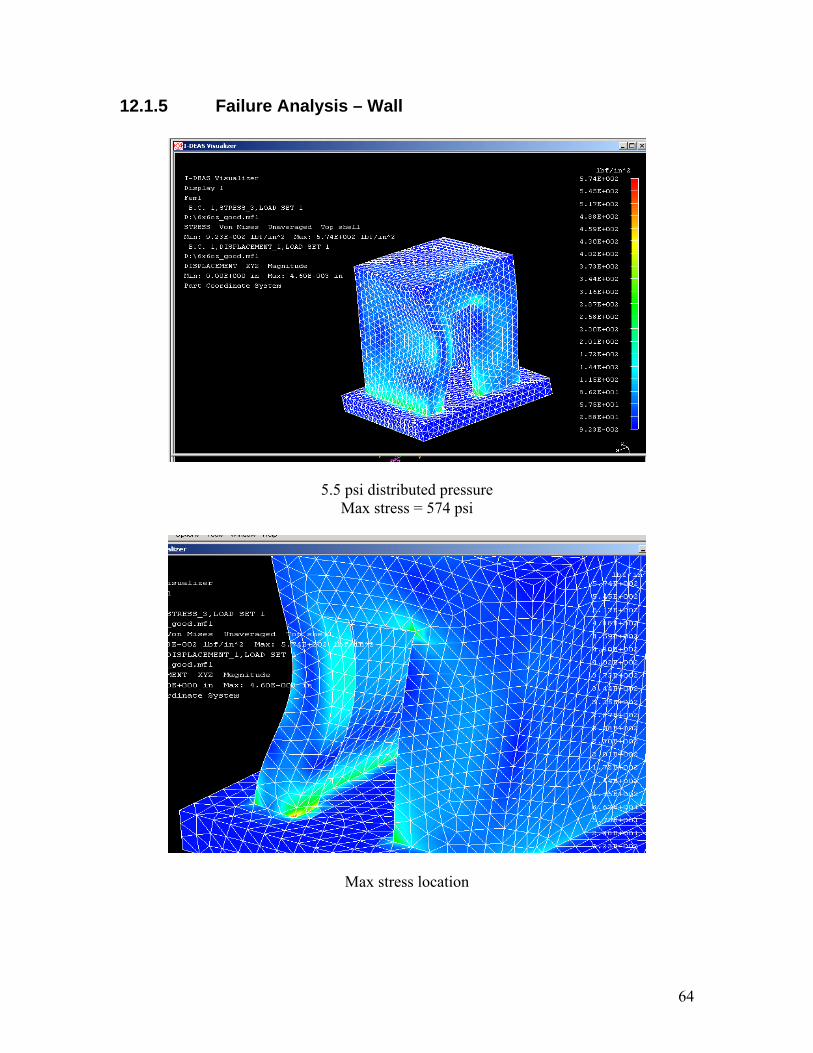
12.1.5 Failure Analysis – Wall
5.5 psi distributed pressure Max stress = 574 psi
Max stress location
64
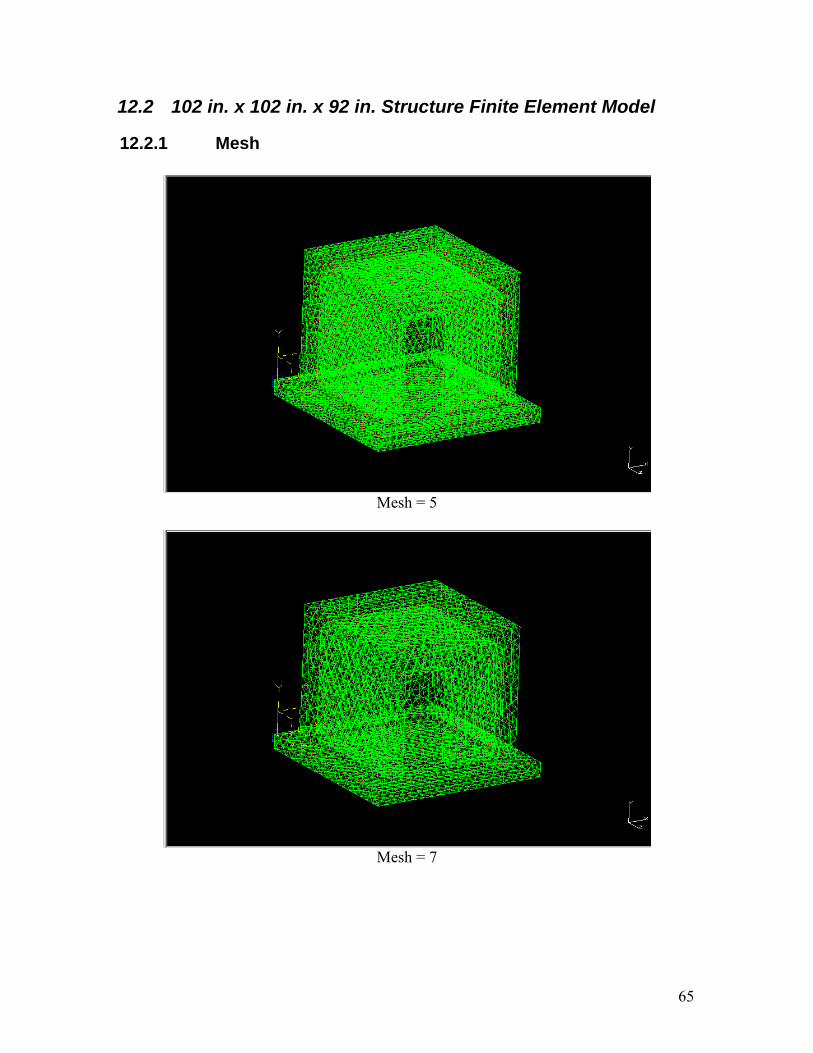
12.2 102 in. x 102 in. x 92 in. Structure Finite Element Model
12.2.1 Mesh
Mesh = 5
Mesh = 7
65
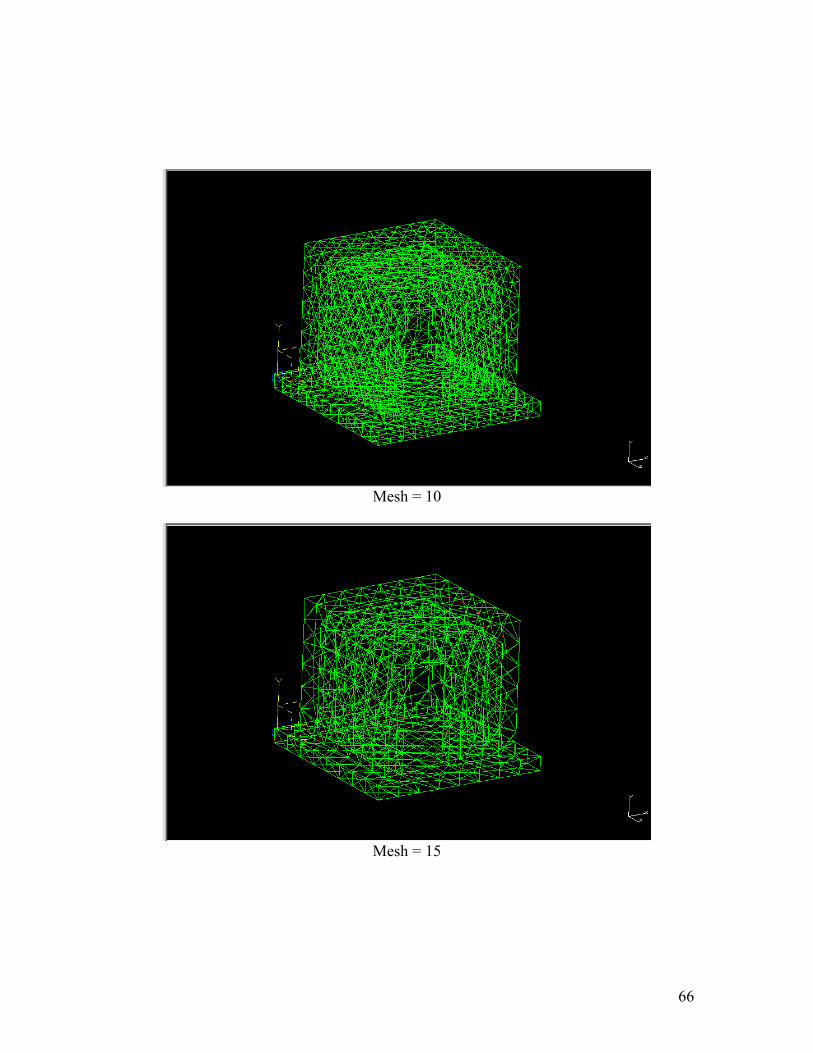
Mesh = 10
Mesh = 15
66
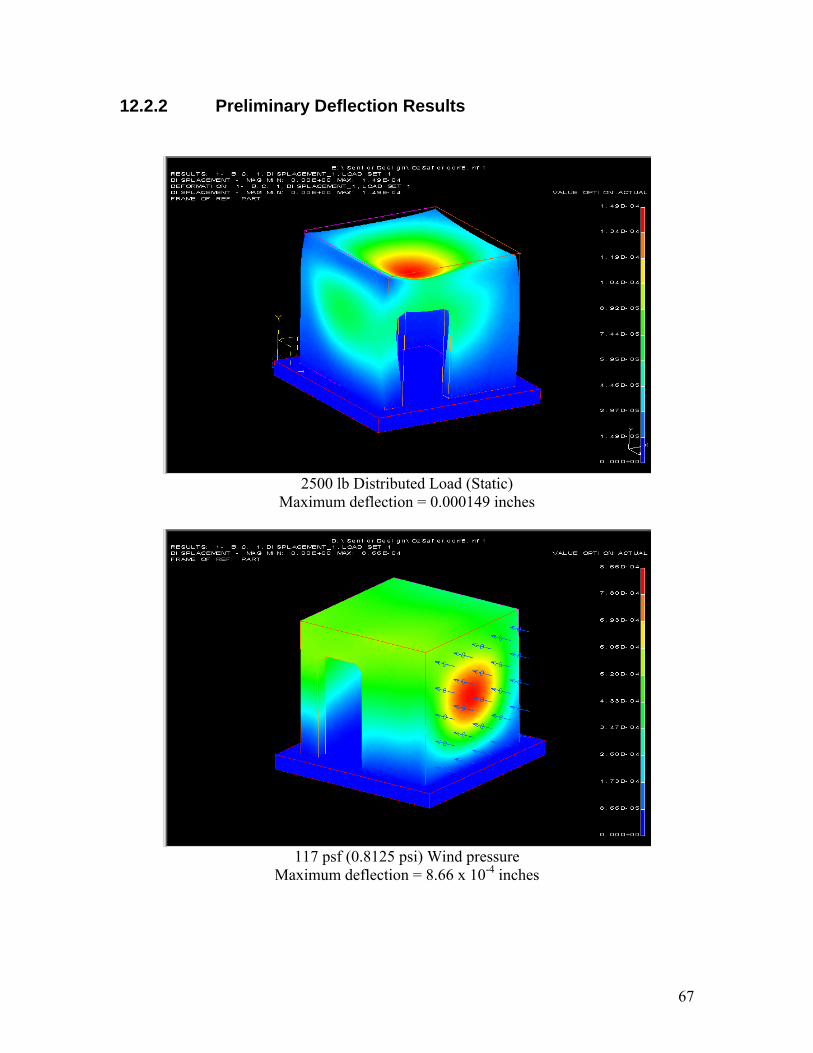
12.2.2 Preliminary Deflection Results
2500 lb Distributed Load (Static)
Maximum deflection = 0.000149 inches
117 psf (0.8125 psi) Wind pressure
Maximum deflection = 8.66 x 10⁻⁴ inches
67
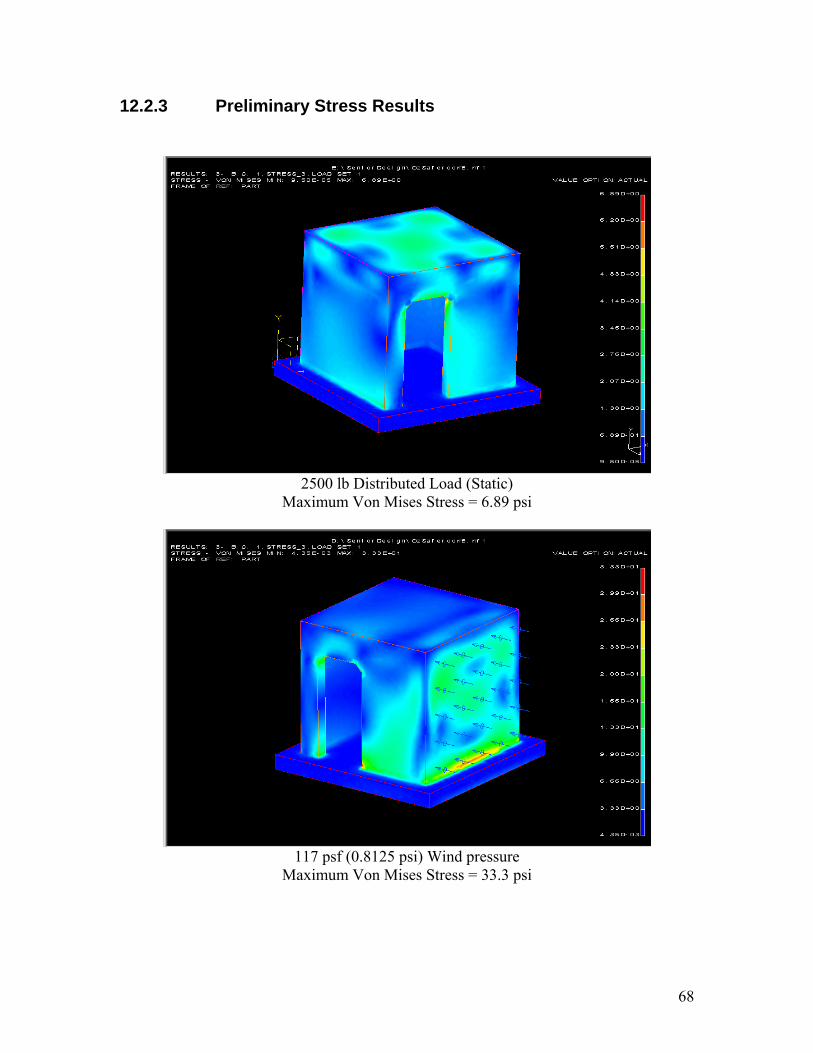
12.2.3 Preliminary Stress Results
2500 lb Distributed Load (Static)
Maximum Von Mises Stress = 6.89 psi
117 psf (0.8125 psi) Wind pressure
Maximum Von Mises Stress = 33.3 psi
68
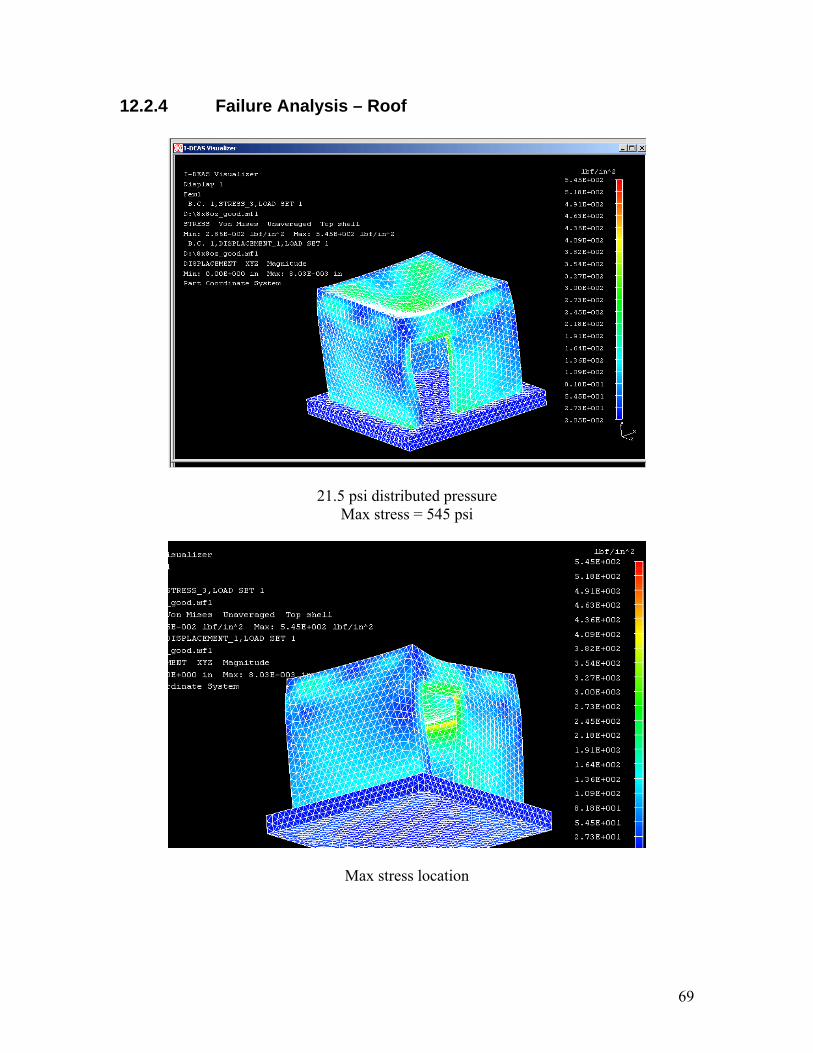
12.2.4 Failure Analysis – Roof
21.5 psi distributed pressure Max stress = 545 psi
Max stress location
69
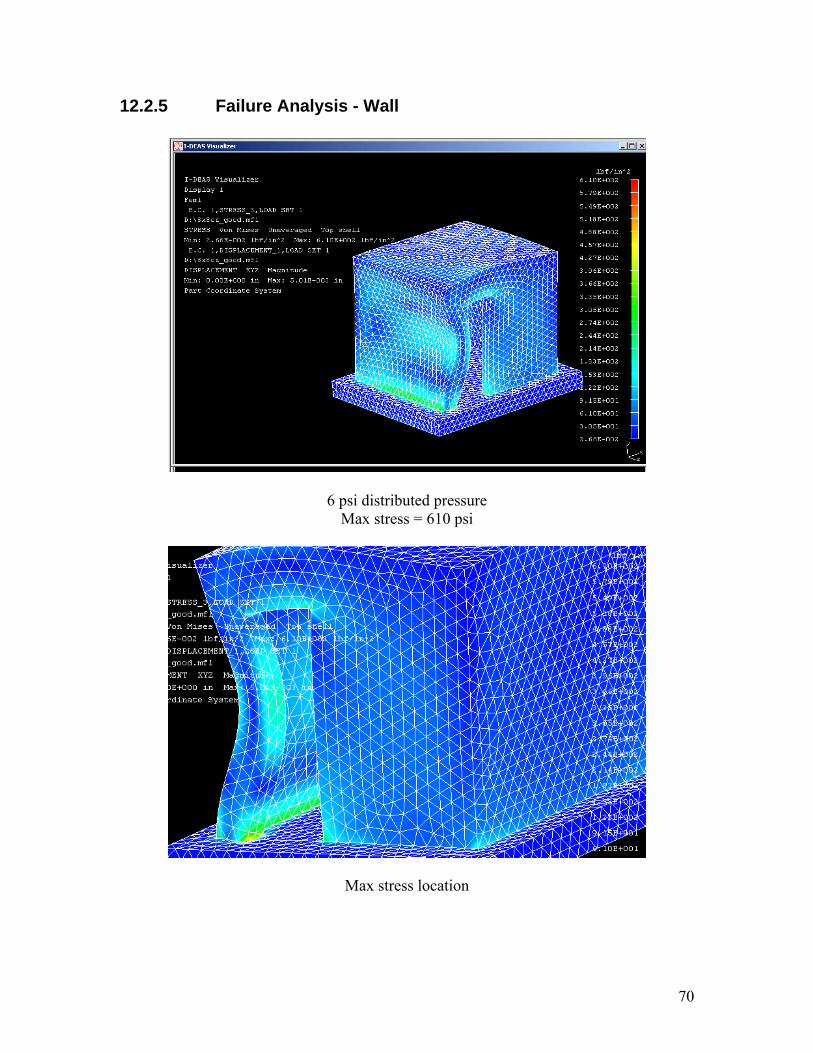
12.2.5 Failure Analysis - Wall
6 psi distributed pressure Max stress = 610 psi
Max stress location
70
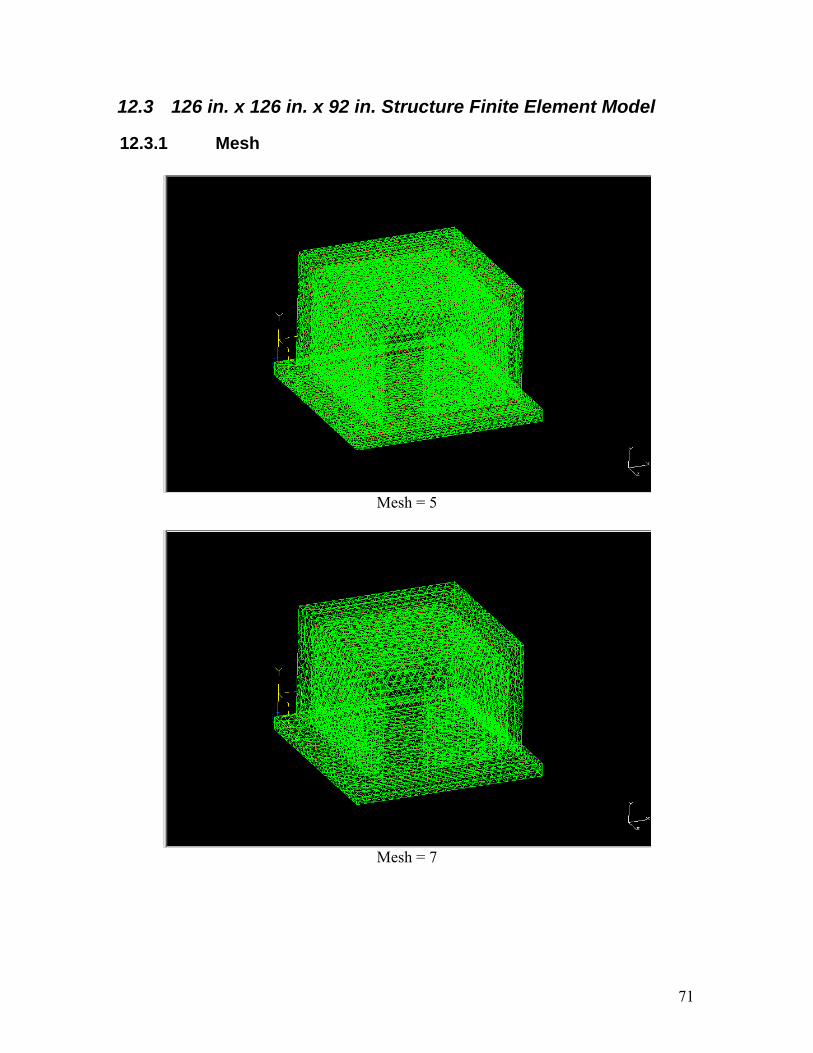
12.3 126 in. x 126 in. x 92 in. Structure Finite Element Model
12.3.1 Mesh
Mesh = 5
Mesh = 7
71
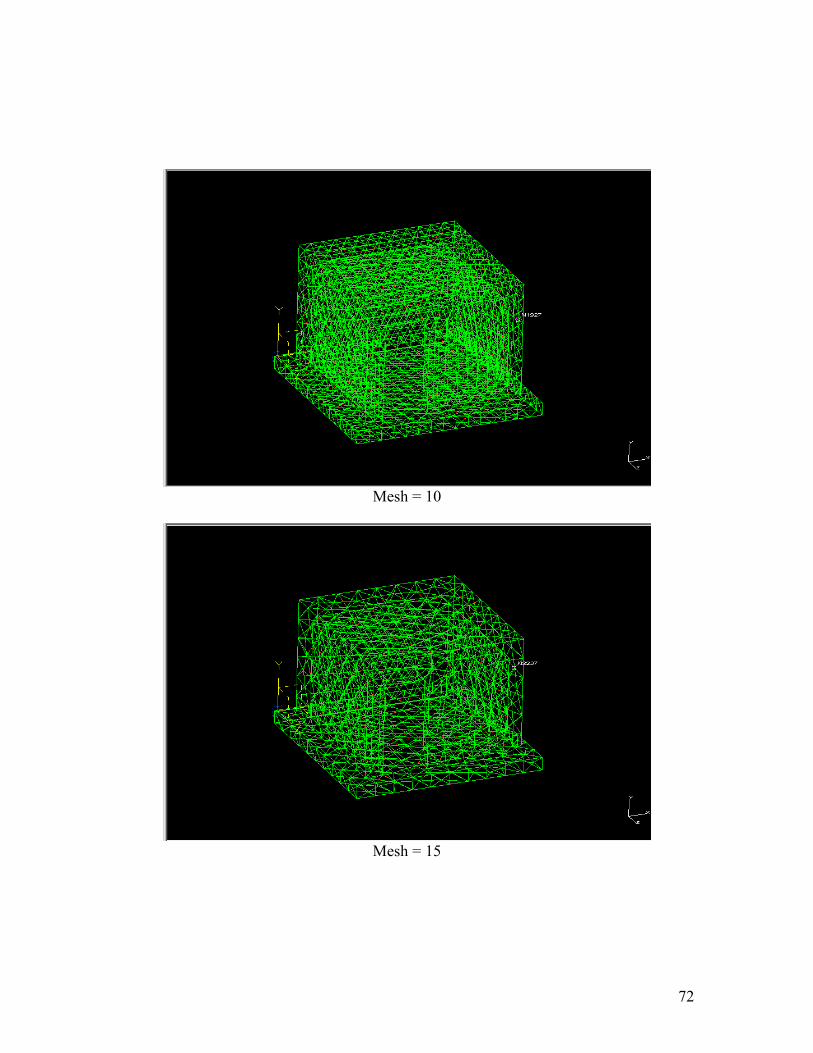
Mesh = 10
Mesh = 15
72
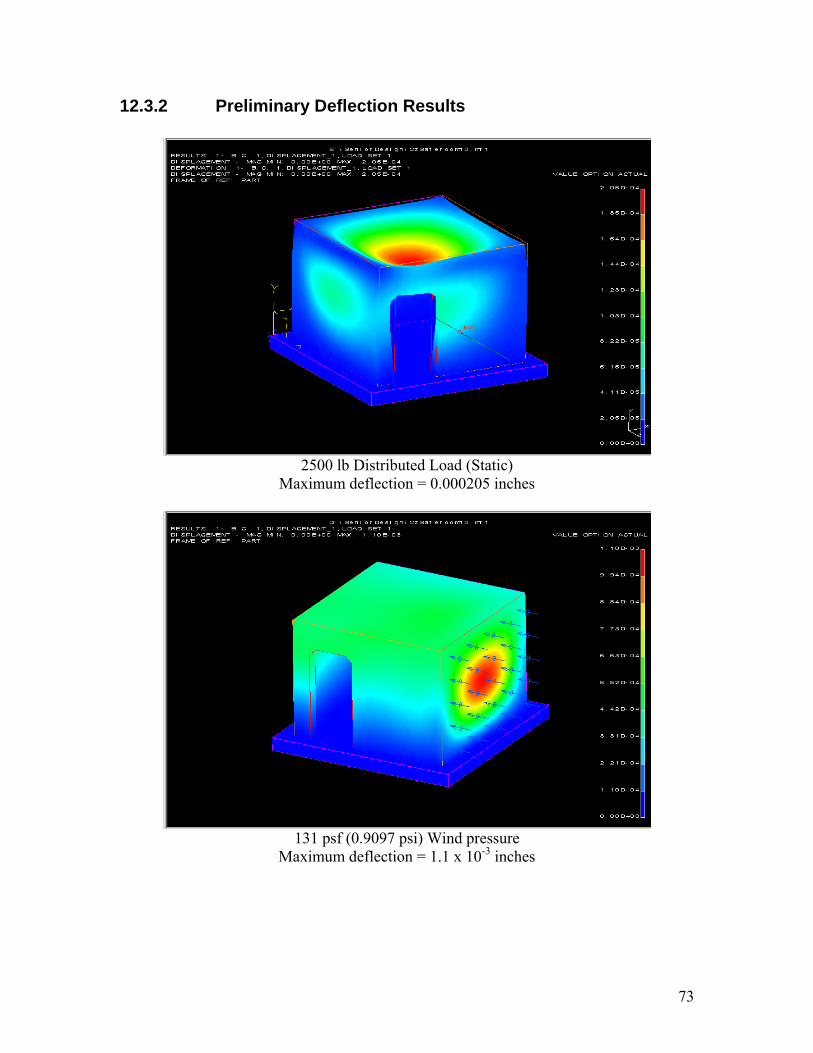
12.3.2 Preliminary Deflection Results
2500 lb Distributed Load (Static)
Maximum deflection = 0.000205 inches
131 psf (0.9097 psi) Wind pressure
Maximum deflection = 1.1 x 10⁻³ inches
73
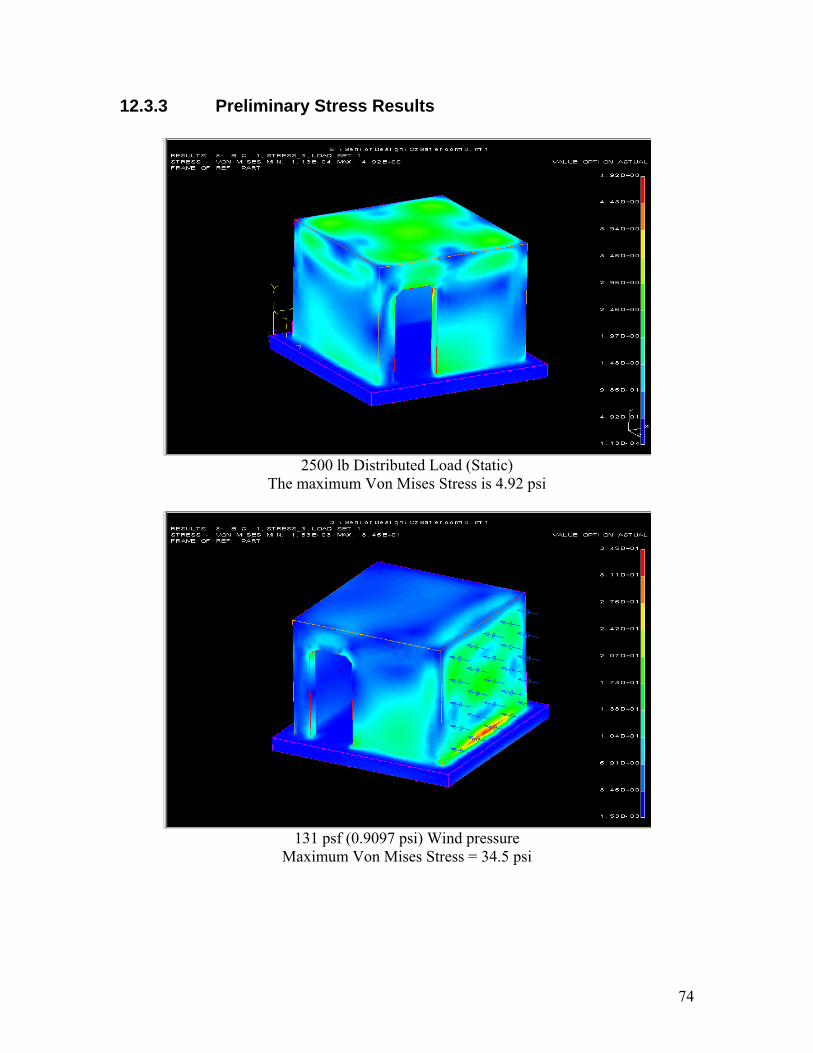
12.3.3 Preliminary Stress Results
2500 lb Distributed Load (Static)
The maximum Von Mises Stress is 4.92 psi
131 psf (0.9097 psi) Wind pressure
Maximum Von Mises Stress = 34.5 psi
74
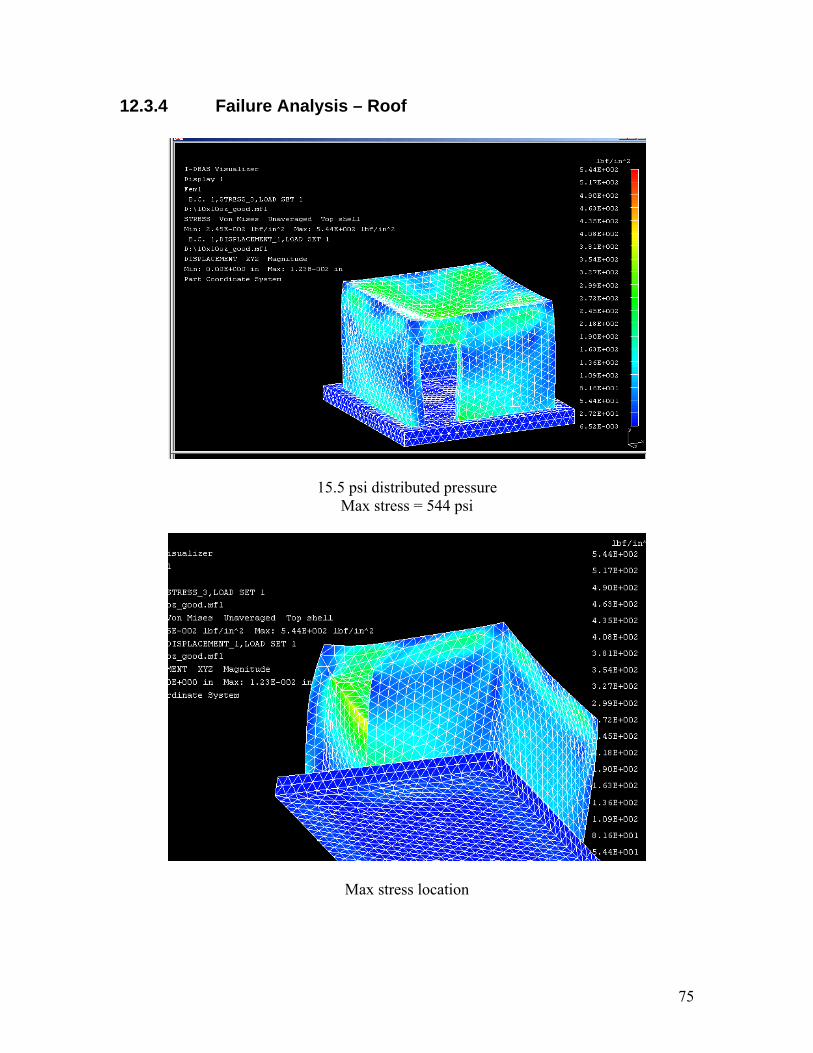
12.3.4 Failure Analysis – Roof
15.5 psi distributed pressure Max stress = 544 psi
Max stress location
75
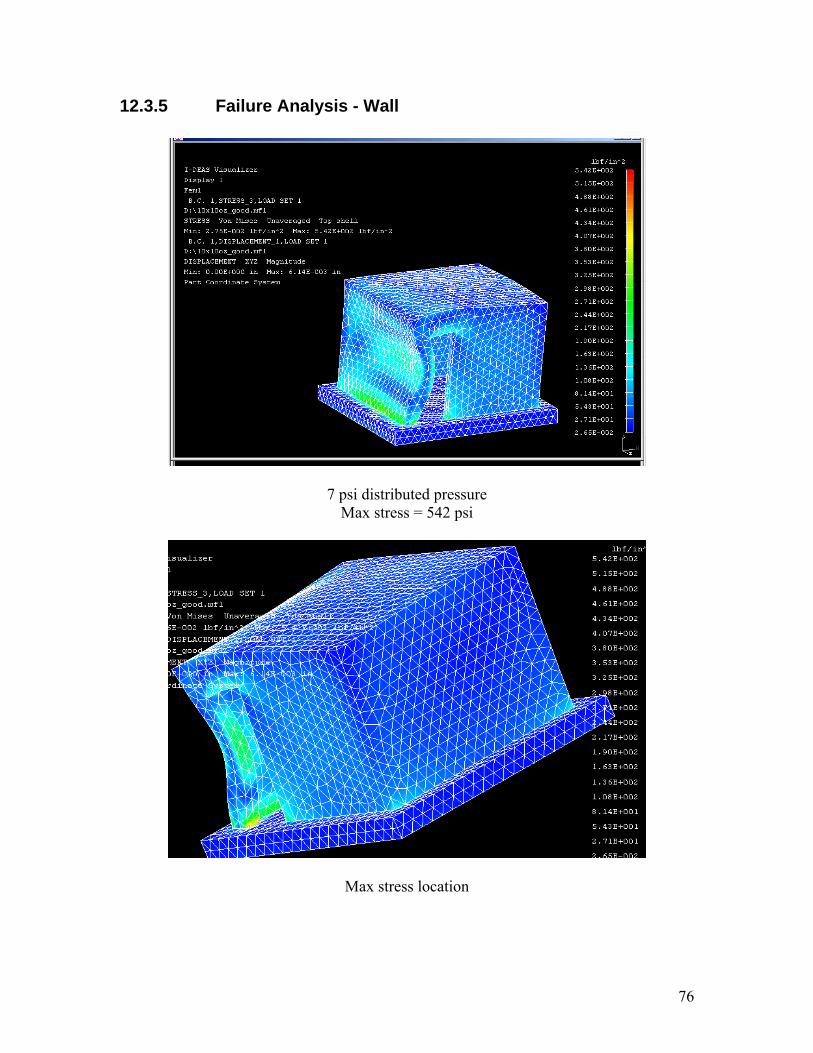
12.3.5 Failure Analysis - Wall
7 psi distributed pressure Max stress = 542 psi
Max stress location
76
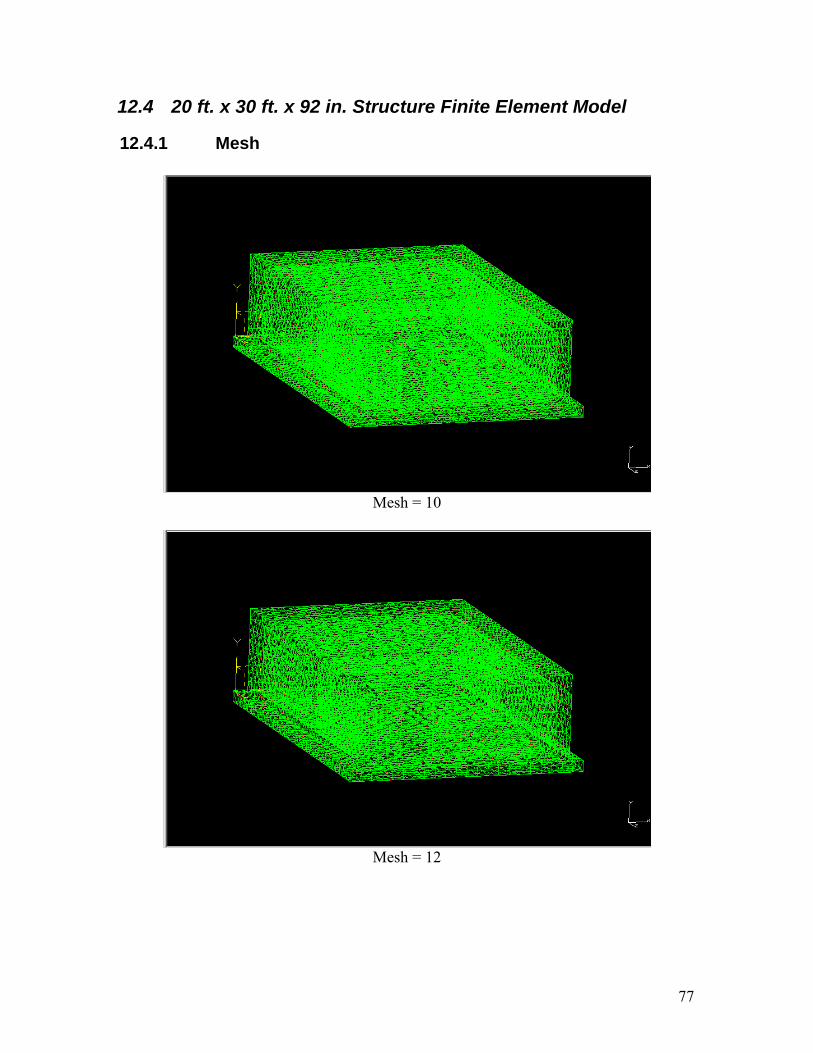
12.4 20 ft. x 30 ft. x 92 in. Structure Finite Element Model
12.4.1 Mesh
Mesh = 10
Mesh = 12
77
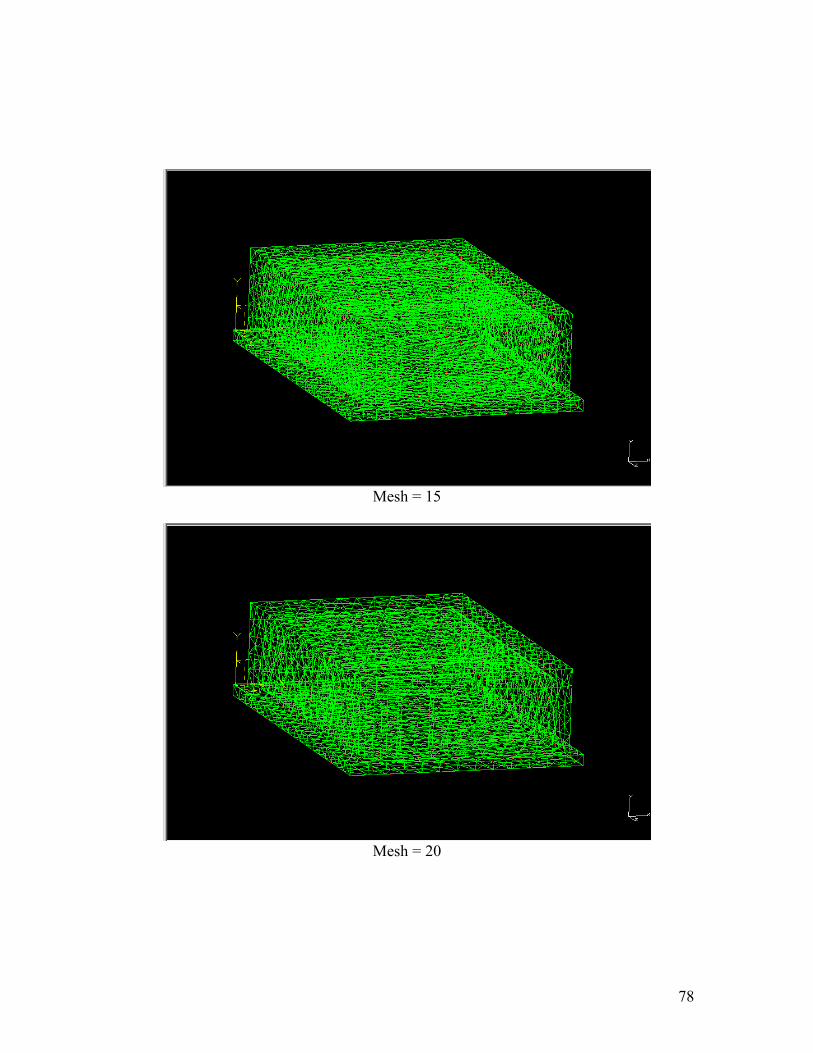
Mesh = 15
Mesh = 20
78
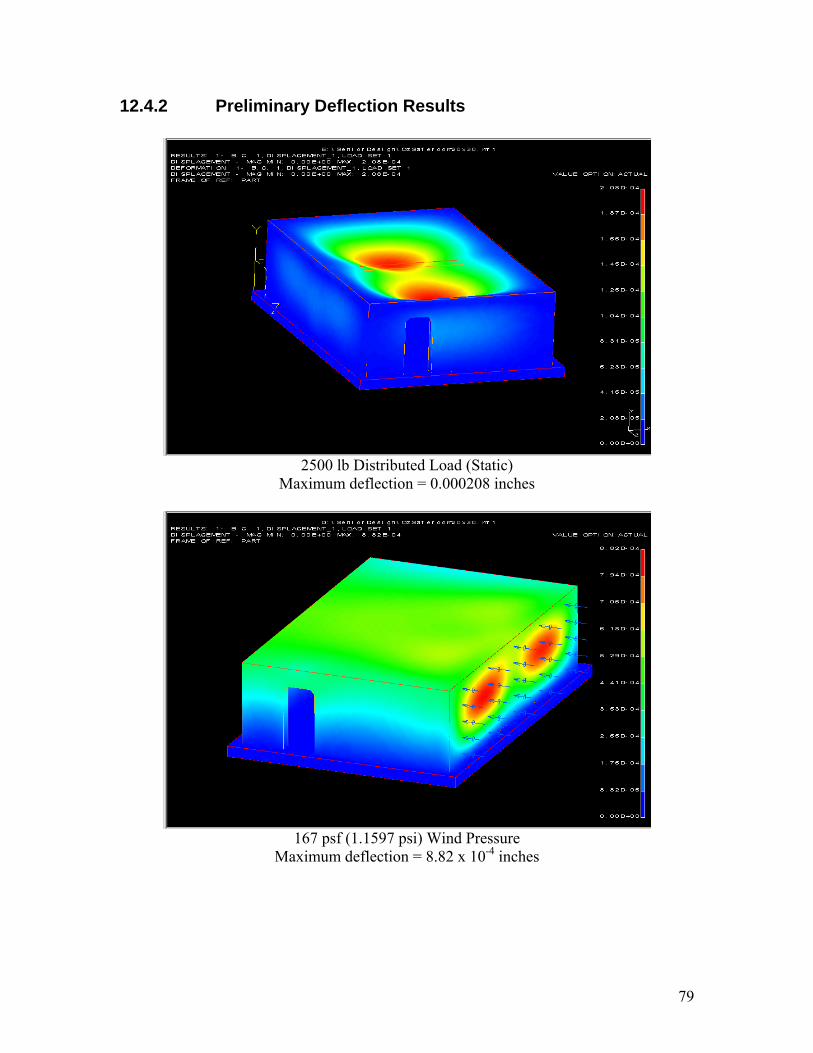
12.4.2 Preliminary Deflection Results
2500 lb Distributed Load (Static)
Maximum deflection = 0.000208 inches
167 psf (1.1597 psi) Wind Pressure
Maximum deflection = 8.82 x 10⁻⁴ inches
79
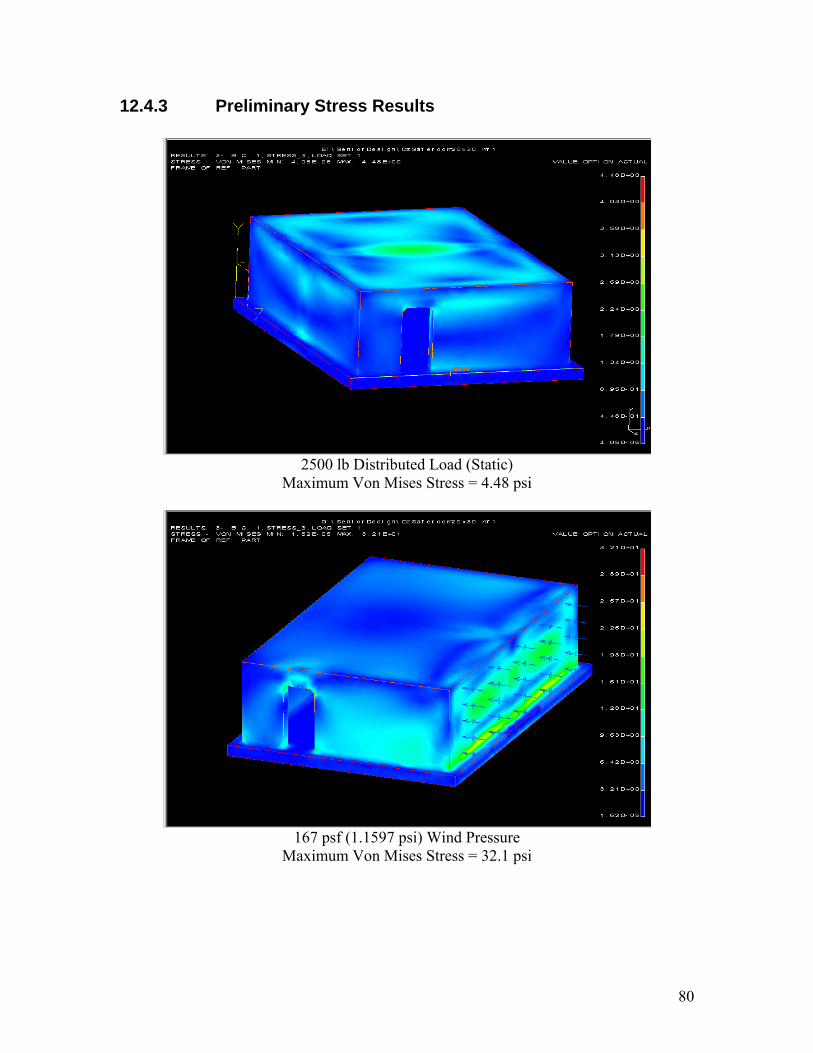
12.4.3 Preliminary Stress Results
2500 lb Distributed Load (Static)
Maximum Von Mises Stress = 4.48 psi
167 psf (1.1597 psi) Wind Pressure
Maximum Von Mises Stress = 32.1 psi
80
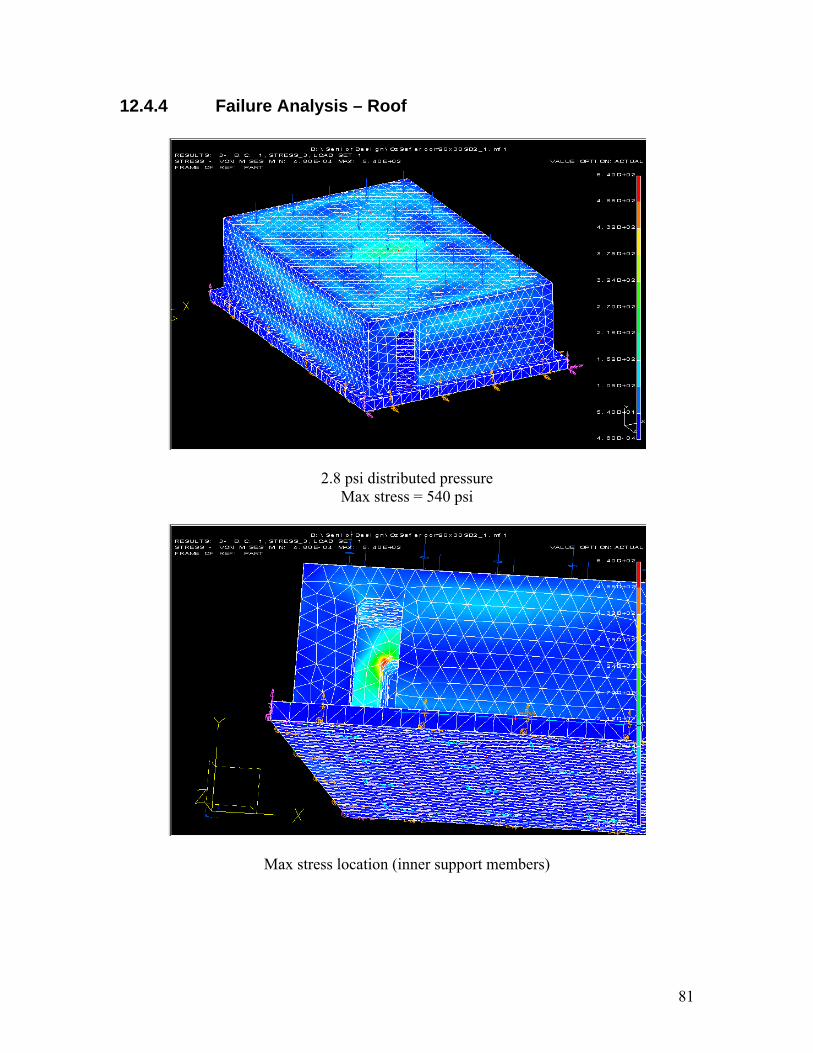
12.4.4 Failure Analysis – Roof
2.8 psi distributed pressure Max stress = 540 psi
Max stress location (inner support members)
81
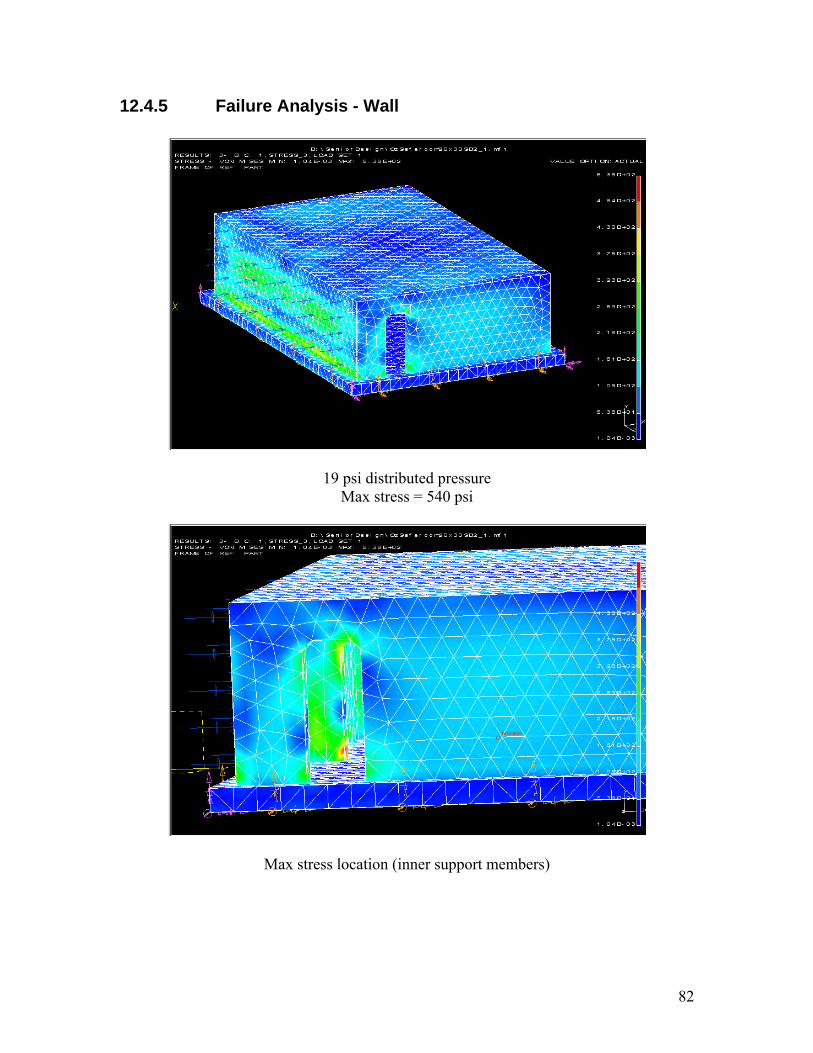
12.4.5 Failure Analysis - Wall
19 psi distributed pressure Max stress = 540 psi
Max stress location (inner support members)
82
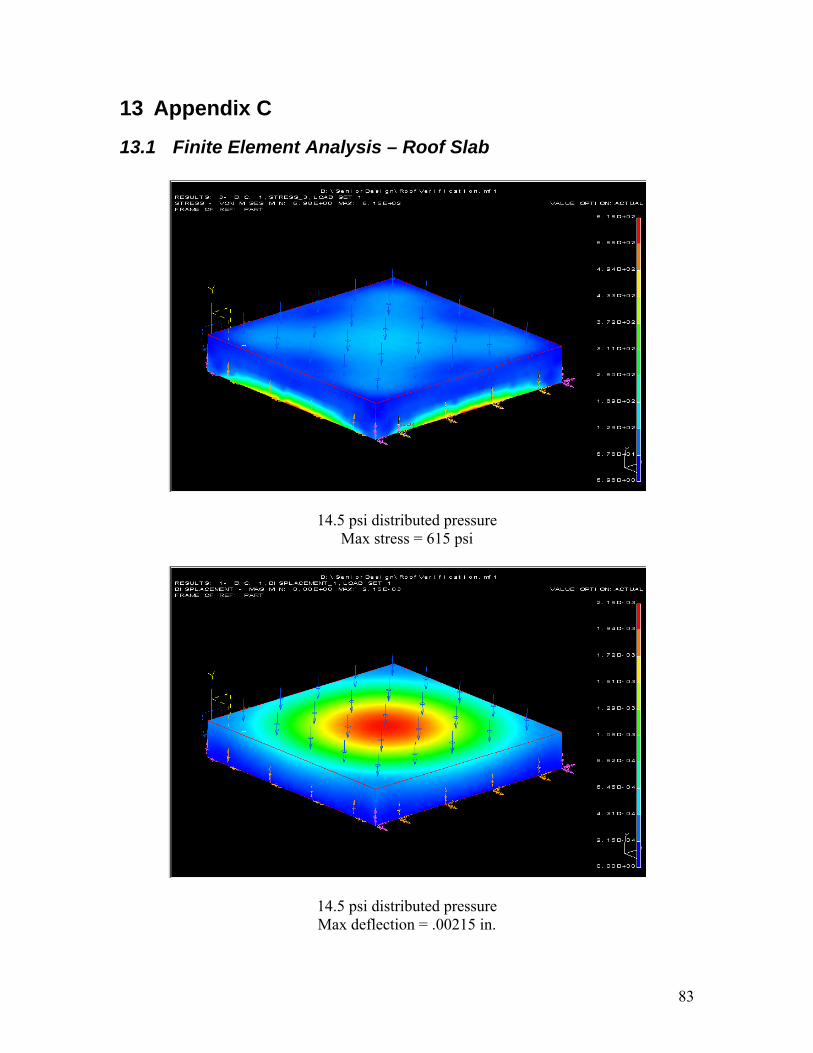
13 Appendix C
13.1 Finite Element Analysis – Roof Slab
14.5 psi distributed pressure Max stress = 615 psi
14.5 psi distributed pressure Max deflection = .00215 in.
83
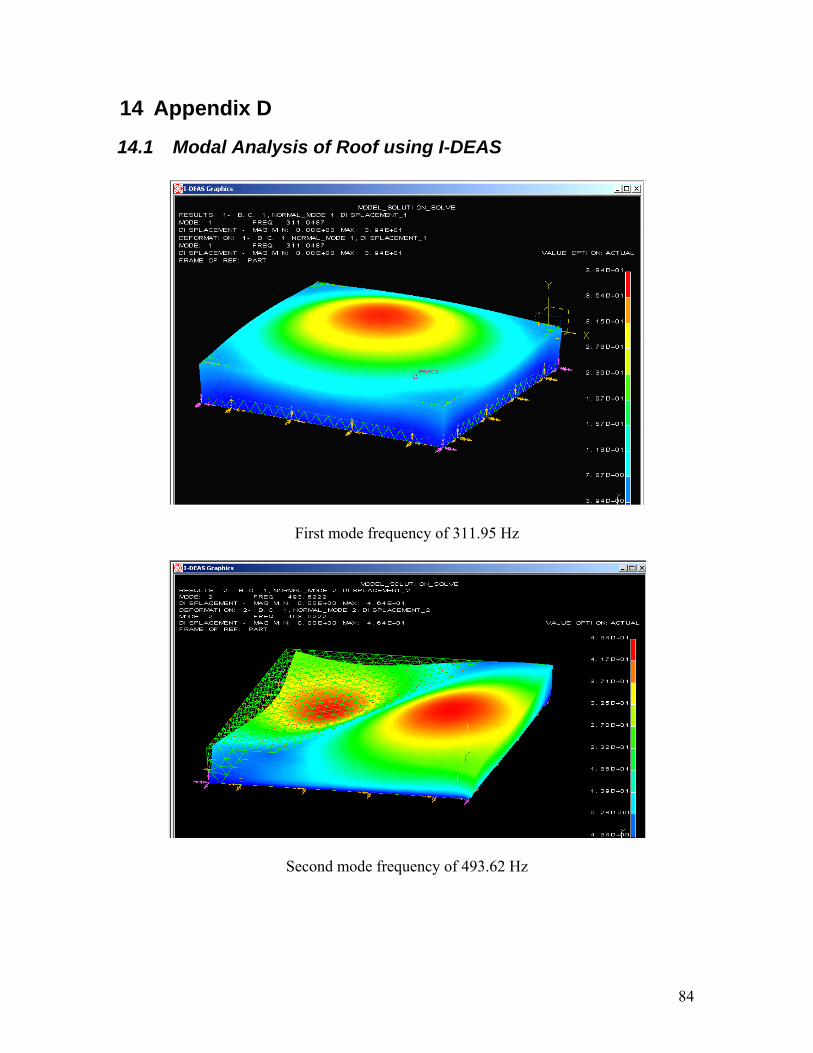
14 Appendix D
14.1 Modal Analysis of Roof using I-DEAS
First mode frequency of 311.95 Hz
Second mode frequency of 493.62 Hz
84
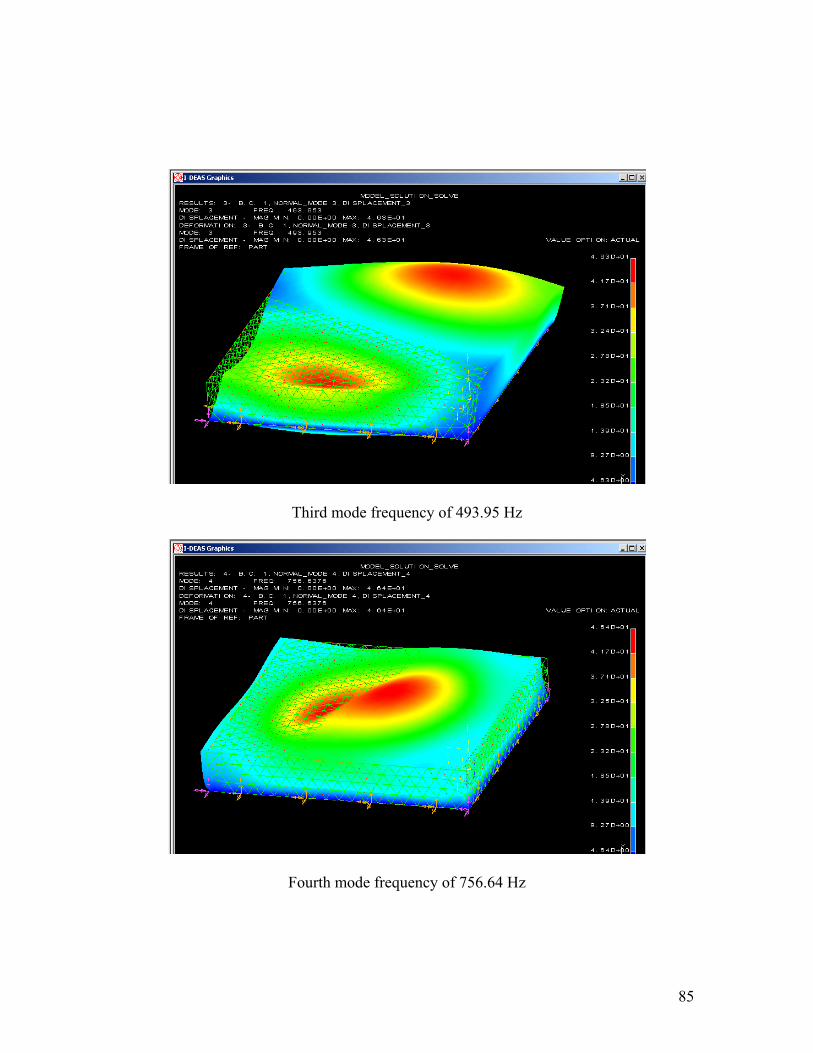
Third mode frequency of 493.95 Hz
Fourth mode frequency of 756.64 Hz
85
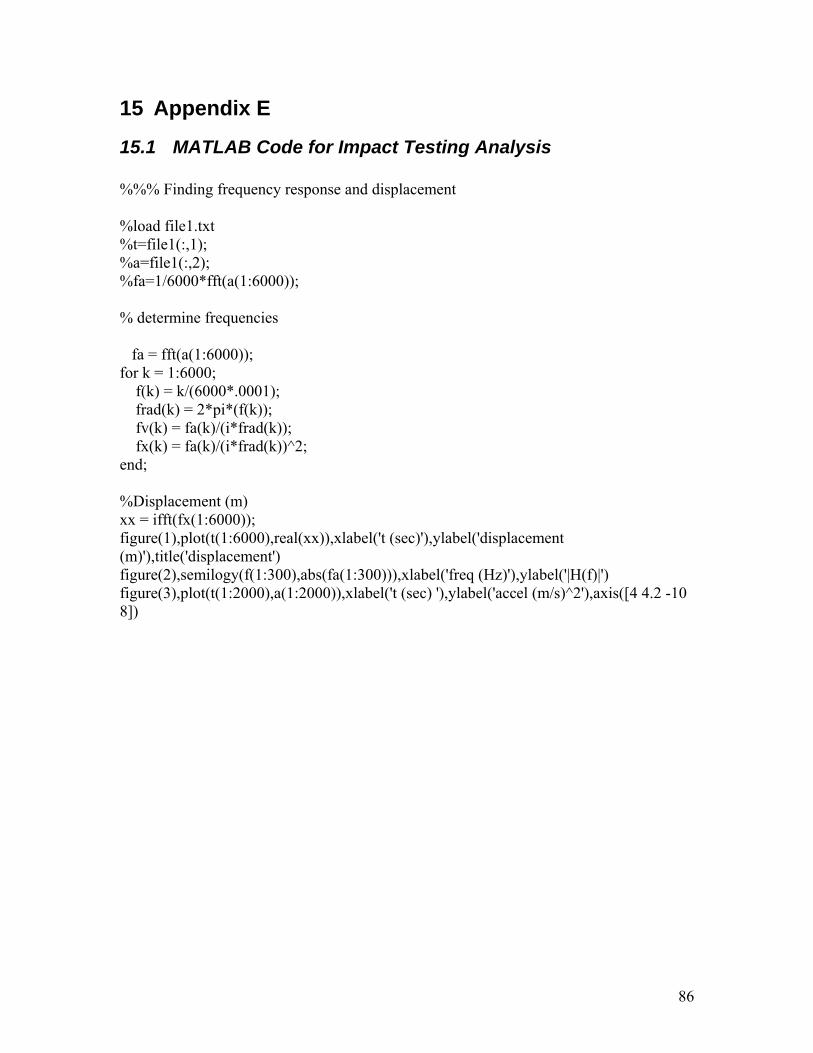
15 Appendix E
15.1 MATLAB Code for Impact Testing Analysis %%% Finding frequency response and displacement %load file1.txt %t=file1(:,1); %a=file1(:,2); %fa=1/6000*fft(a(1:6000)); % determine frequencies fa = fft(a(1:6000)); for k = 1:6000; f(k) = k/(6000*.0001); frad(k) = 2*pi*(f(k)); fv(k) = fa(k)/(i*frad(k)); fx(k) = fa(k)/(i*frad(k))^2; end; %Displacement (m) xx = ifft(fx(1:6000)); figure(1),plot(t(1:6000),real(xx)),xlabel('t (sec)'),ylabel('displacement (m)'),title('displacement') figure(2),semilogy(f(1:300),abs(fa(1:300))),xlabel('freq (Hz)'),ylabel('|H(f)|') figure(3),plot(t(1:2000),a(1:2000)),xlabel('t (sec) '),ylabel('accel (m/s)^2'),axis([4 4.2 -10 8])
86

15.2 Theoretical Hand Calculations
87
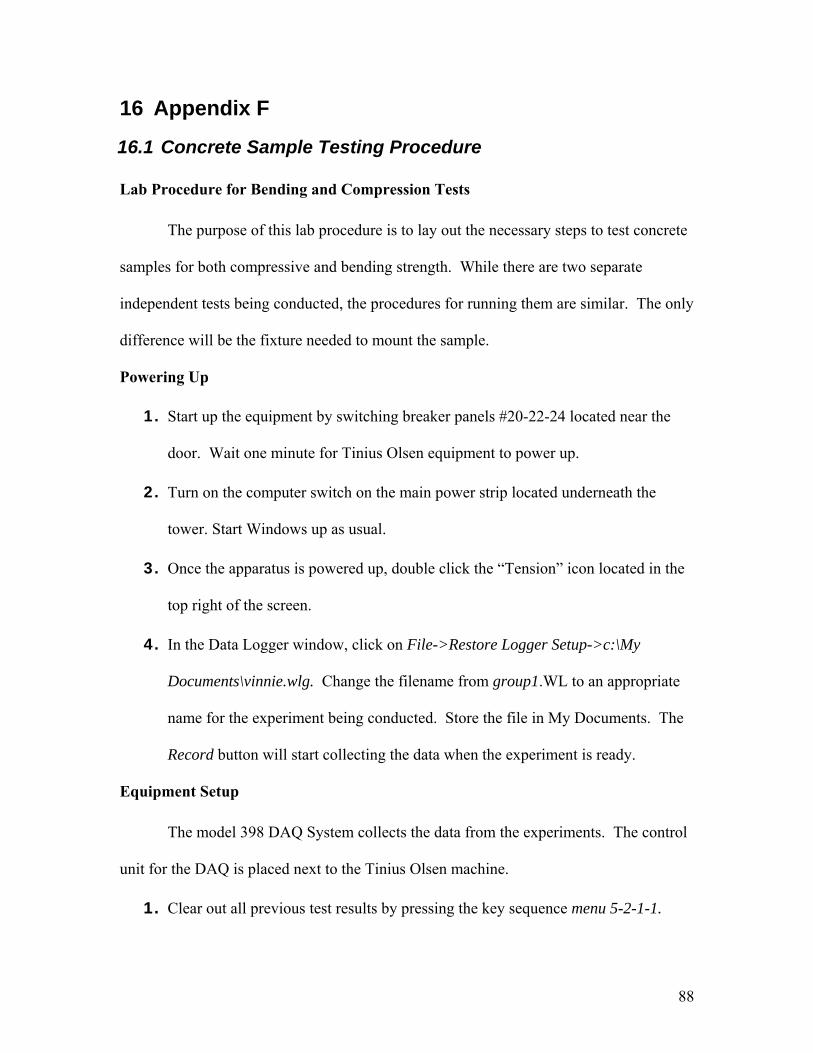
16 Appendix F
16.1 Concrete Sample Testing Procedure Lab Procedure for Bending and Compression Tests
The purpose of this lab procedure is to lay out the necessary steps to test concrete
samples for both compressive and bending strength. While there are two separate
independent tests being conducted, the procedures for running them are similar. The only
difference will be the fixture needed to mount the sample.
Powering Up
1. Start up the equipment by switching breaker panels #20-22-24 located near the
door. Wait one minute for Tinius Olsen equipment to power up.
2. Turn on the computer switch on the main power strip located underneath the
tower. Start Windows up as usual.
3. Once the apparatus is powered up, double click the “Tension” icon located in the
top right of the screen.
4. In the Data Logger window, click on File->Restore Logger Setup->c:\My
Documents\vinnie.wlg. Change the filename from group1.WL to an appropriate
name for the experiment being conducted. Store the file in My Documents. The
Record button will start collecting the data when the experiment is ready.
Equipment Setup
The model 398 DAQ System collects the data from the experiments. The control
unit for the DAQ is placed next to the Tinius Olsen machine.
1. Clear out all previous test results by pressing the key sequence menu 5-2-1-1.
88
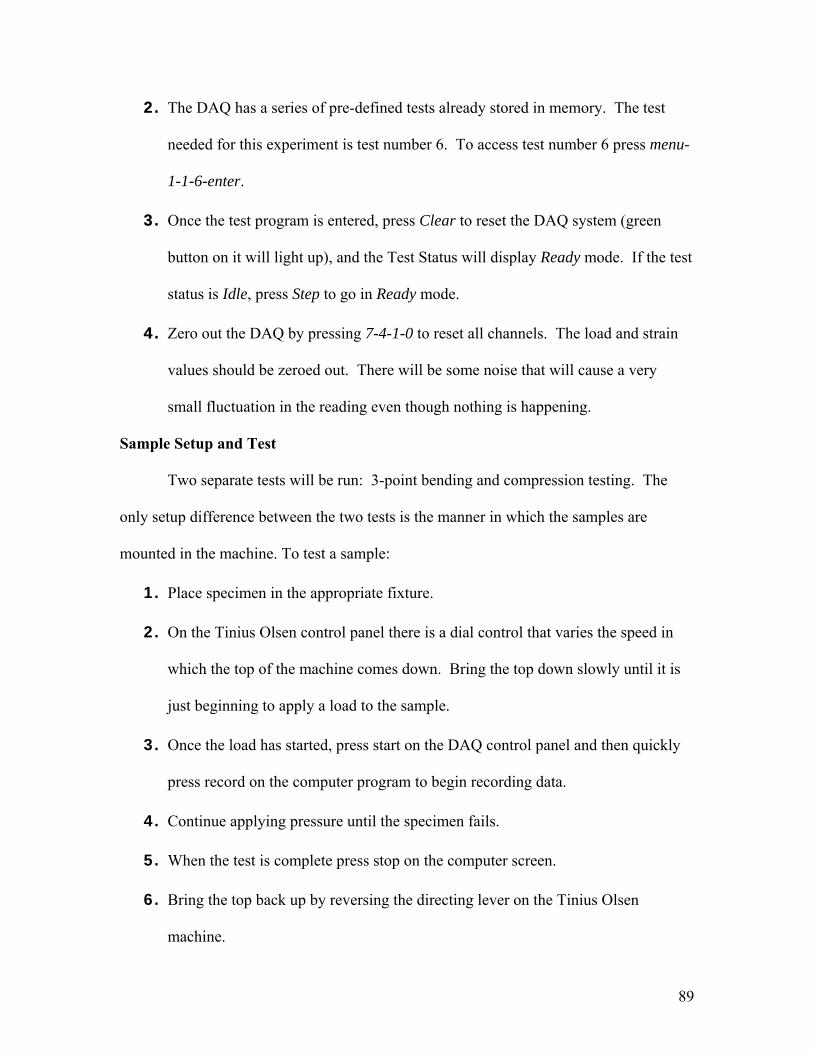
2. The DAQ has a series of pre-defined tests already stored in memory. The test
needed for this experiment is test number 6. To access test number 6 press menu-
1-1-6-enter.
3. Once the test program is entered, press Clear to reset the DAQ system (green
button on it will light up), and the Test Status will display Ready mode. If the test
status is Idle, press Step to go in Ready mode.
4. Zero out the DAQ by pressing 7-4-1-0 to reset all channels. The load and strain
values should be zeroed out. There will be some noise that will cause a very
small fluctuation in the reading even though nothing is happening.
Sample Setup and Test
Two separate tests will be run: 3-point bending and compression testing. The
only setup difference between the two tests is the manner in which the samples are
mounted in the machine. To test a sample:
1. Place specimen in the appropriate fixture.
2. On the Tinius Olsen control panel there is a dial control that varies the speed in
which the top of the machine comes down. Bring the top down slowly until it is
just beginning to apply a load to the sample.
3. Once the load has started, press start on the DAQ control panel and then quickly
press record on the computer program to begin recording data.
4. Continue applying pressure until the specimen fails.
5. When the test is complete press stop on the computer screen.
6. Bring the top back up by reversing the directing lever on the Tinius Olsen
machine.
89
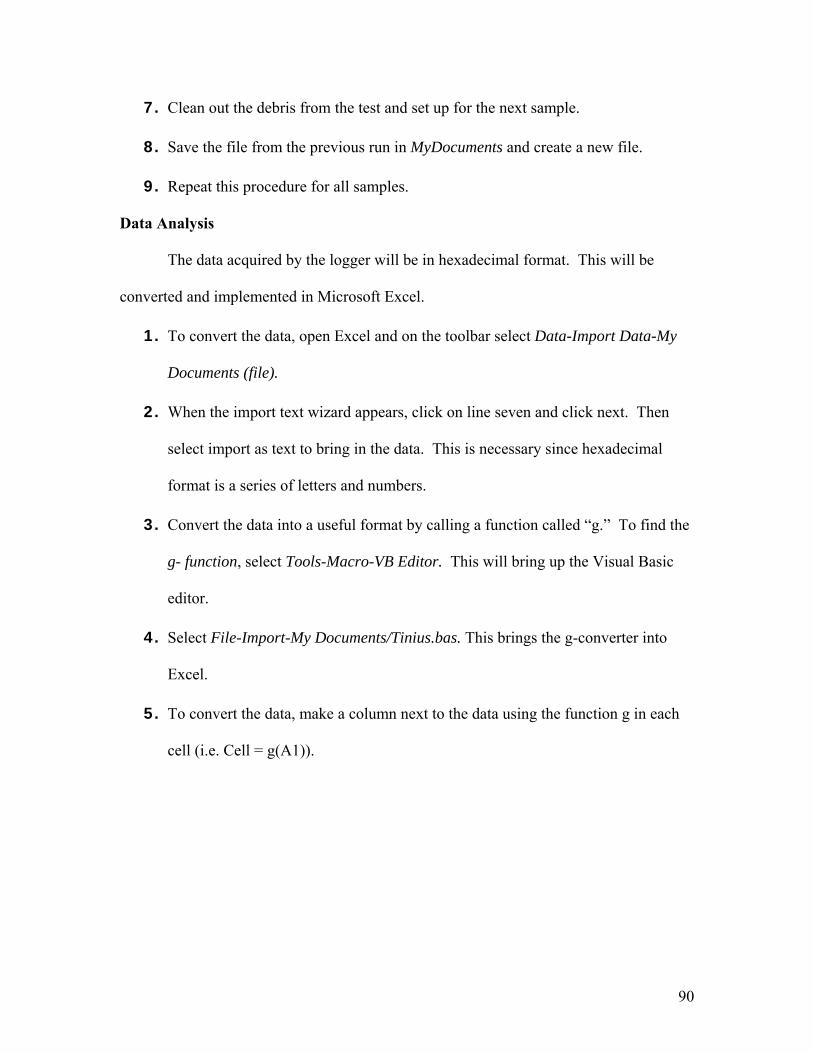
7. Clean out the debris from the test and set up for the next sample.
8. Save the file from the previous run in MyDocuments and create a new file.
9. Repeat this procedure for all samples.
Data Analysis
The data acquired by the logger will be in hexadecimal format. This will be
converted and implemented in Microsoft Excel.
1. To convert the data, open Excel and on the toolbar select Data-Import Data-My
Documents (file).
2. When the import text wizard appears, click on line seven and click next. Then
select import as text to bring in the data. This is necessary since hexadecimal
format is a series of letters and numbers.
3. Convert the data into a useful format by calling a function called “g.” To find the
g- function, select Tools-Macro-VB Editor. This will bring up the Visual Basic
editor.
4. Select File-Import-My Documents/Tinius.bas. This brings the g-converter into
Excel.
5. To convert the data, make a column next to the data using the function g in each
cell (i.e. Cell = g(A1)).
90

17 Appendix G
17.1 Mechanical Drawings
17.2 Spec Sheets
91
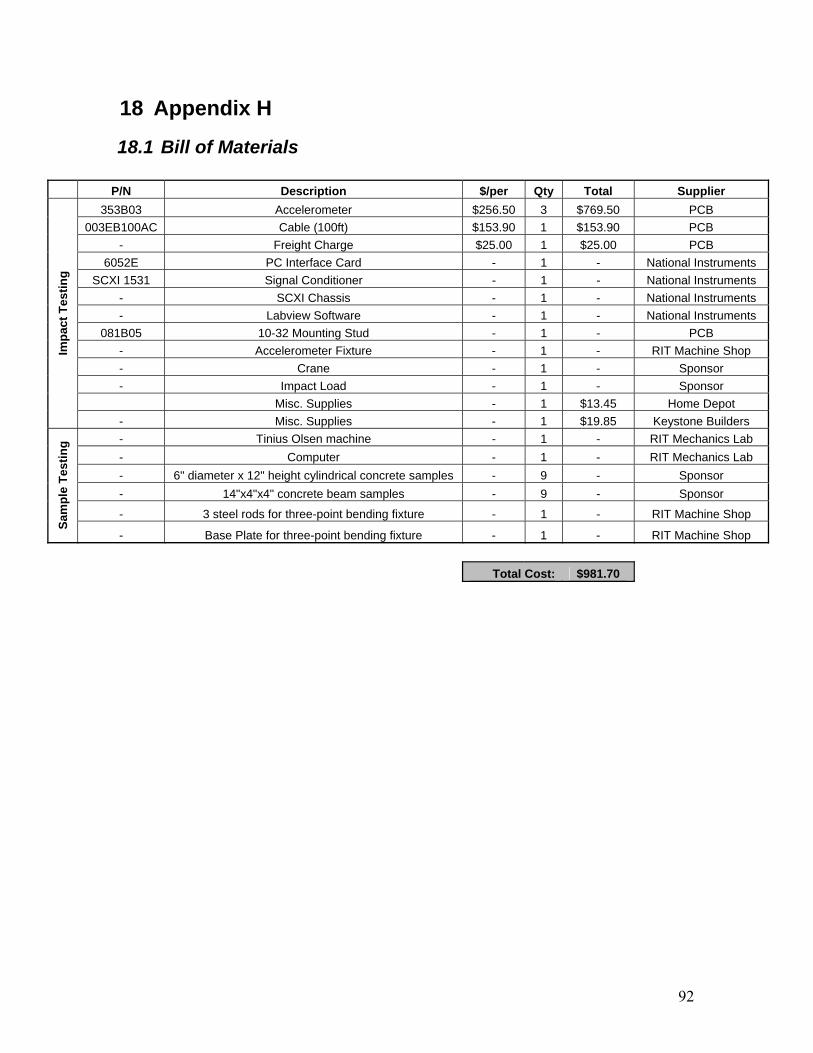
18 Appendix H
18.1 Bill of Materials
P/N Description $/per Qty Total Supplier 353B03 Accelerometer $256.50 3 $769.50 PCB
003EB100AC Cable (100ft) $153.90 1 $153.90 PCB - Freight Charge $25.00 1 $25.00 PCB
6052E PC Interface Card - 1 - National Instruments SCXI 1531 Signal Conditioner - 1 - National Instruments
- SCXI Chassis - 1 - National Instruments - Labview Software - 1 - National Instruments
081B05 10-32 Mounting Stud - 1 - PCB - Accelerometer Fixture - 1 - RIT Machine Shop - Crane - 1 - Sponsor - Impact Load - 1 - Sponsor Misc. Supplies - 1 $13.45 Home Depot
Impa
ct T
estin
g
- Misc. Supplies - 1 $19.85 Keystone Builders - Tinius Olsen machine - 1 - RIT Mechanics Lab - Computer - 1 - RIT Mechanics Lab - 6" diameter x 12" height cylindrical concrete samples - 9 - Sponsor - 14"x4"x4" concrete beam samples - 9 - Sponsor
- 3 steel rods for three-point bending fixture - 1 - RIT Machine Shop
Sam
ple
Test
ing
- Base Plate for three-point bending fixture - 1 - RIT Machine Shop Total Cost: $981.70
92
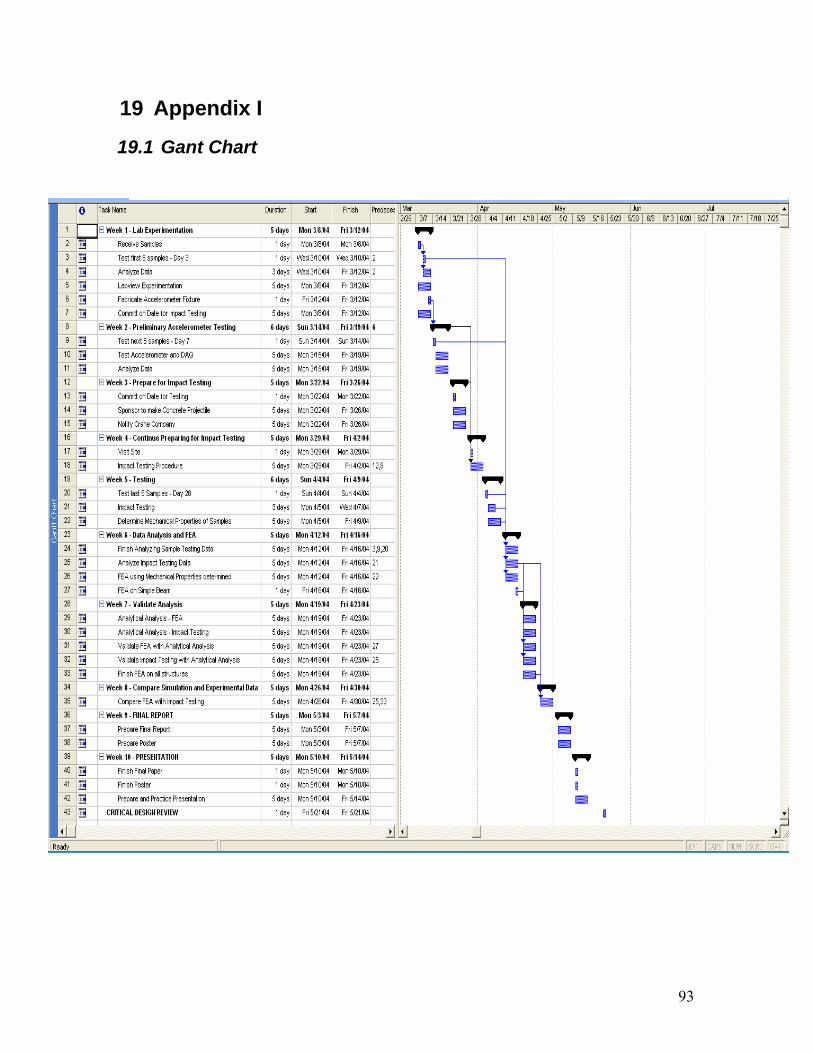
19.1 Gant Chart
93
19 Appendix I
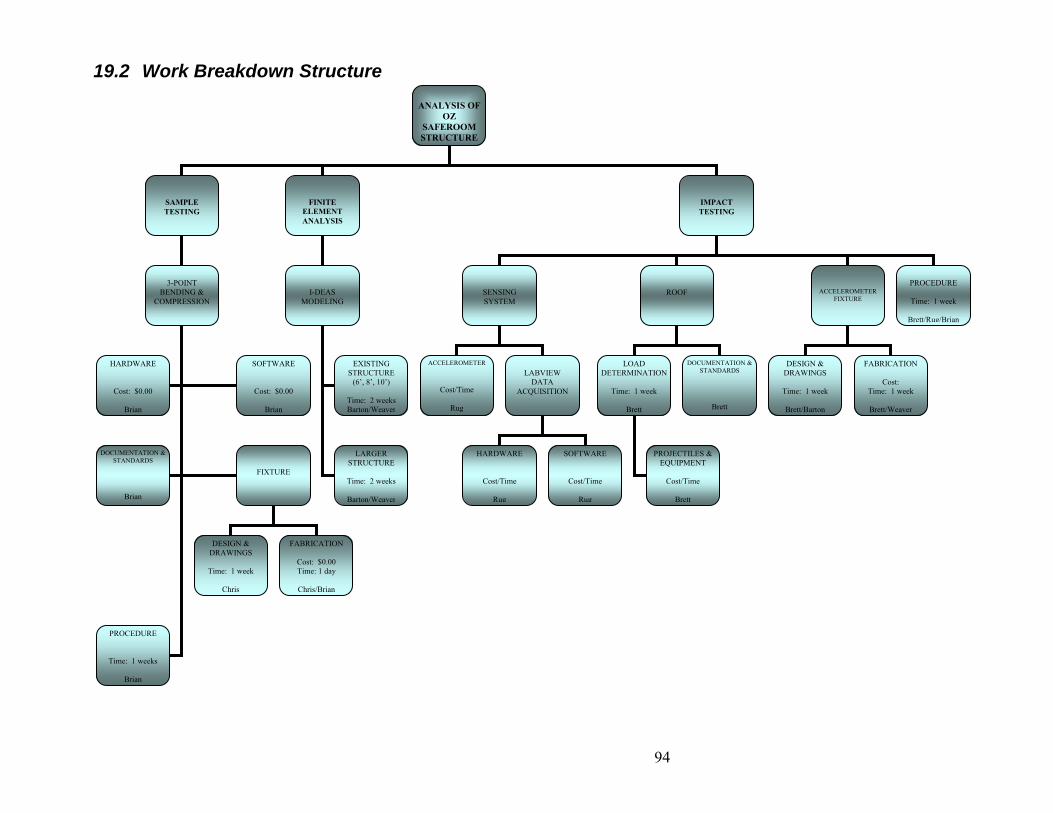
19.2 Work Breakdown Structure
ANALYSIS OF
OZ SAFEROOM STRUCTURE
SAMPLE TESTING
FINITE ELEMENT ANALYSIS
IMPACT TESTING
3-POINT
BENDING & PROCEDURE
I-DEAS SENSING SYSTEM
ACCELEROMETER FIXTURE
ROOF Time: 1 week COMPRESSION MODELING
Brett/Rug/Brian
HARDWARE SOFTWARE EXISTING STRUCTURE
LOAD DETERMINATION
DESIGN & DRAWINGS
FABRICATION ACCELEROMETER DOCUMENTATION & STANDARDS LABVIEW
(6’, 8’, 10’) DATA ACQUISITION
Cost: Cost/Time Cost: $0.00 Cost: $0.00 Time: 1 week Time: 1 week Time: 1 week Time: 2 weeks
Brett RugBrian Brian Barton/Weaver Brett Brett/Barton Brett/Weaver
LARGER STRUCTURE
HARDWARE SOFTWARE PROJECTILES & EQUIPMENT
DOCUMENTATION & STANDARDS
FIXTURE Time: 2 weeks Cost/Time Cost/Time Cost/Time
Brian Barton/Weaver Rug Rug Brett
DESIGN & DRAWINGS
FABRICATION
Cost: $0.00 Time: 1 week Time: 1 day
Chris Chris/Brian
PROCEDURE
Time: 1 weeks
Brian
94
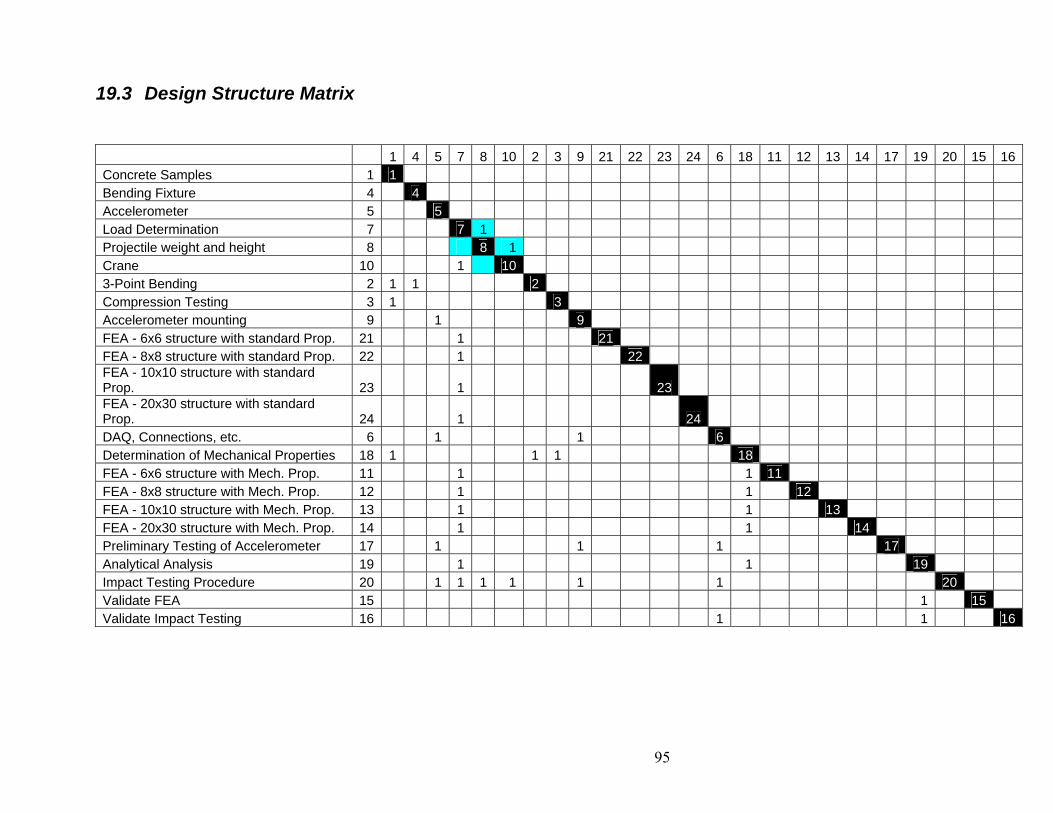
95
19.3 Design Structure Matrix
1 4 5 7 8 10 2 3 9 21 22 23 24 6 18 11 12 13 14 17 19 20 15 16 Concrete Samples 1 1 Bending Fixture 4 4 Accelerometer 5 5 Load Determination 7 7 1 Projectile weight and height 8 8 1 Crane 10 1 10 3-Point Bending 2 1 1 2 Compression Testing 3 1 3 Accelerometer mounting 9 1 9 FEA - 6x6 structure with standard Prop. 21 1 21 FEA - 8x8 structure with standard Prop. 22 1 22 FEA - 10x10 structure with standard Prop. 23 1 23 FEA - 20x30 structure with standard Prop. 24 1 24 DAQ, Connections, etc. 6 1 1 6 Determination of Mechanical Properties 18 1 1 1 18 FEA - 6x6 structure with Mech. Prop. 11 1 1 11 FEA - 8x8 structure with Mech. Prop. 12 1 1 12 FEA - 10x10 structure with Mech. Prop. 13 1 1 13 FEA - 20x30 structure with Mech. Prop. 14 1 1 14 Preliminary Testing of Accelerometer 17 1 1 1 17 Analytical Analysis 19 1 1 19 Impact Testing Procedure 20 1 1 1 1 1 1 20 Validate FEA 15 1 15 Validate Impact Testing 16 1 1 16

96

97

98