Embed Size (px)
Citation preview

UNIVERSIDADE NOVA DE LISBOA
Faculdade de Ciências e Tecnologia
Filipe dos Santos Folgosa
Structural and Mechanistic Studies of Iron Containing Proteins
Lisboa
2008


Filipe dos Santos Folgosa
Structural and Mechanistic Studies of Iron Containing Proteins
Lisboa 2008
Dissertação apresentada para obtenção
do Grau de Doutor em Bioquímica, ramo
de Bioquímica-Física, pela Universidade
Nova de Lisboa, Faculdade de Ciências e
Tecnologia


Nº de arquivo “Copyright”


Agradecimentos
i
Agradecimentos
A execução desta tese só foi possível com a colaboração de algumas pessoas.
Assim, em primeiro lugar gostaria de agradecer ao Prof. Pedro Tavares, meu
orientador, não só por me ter recebido aquando do meu estágio de licenciatura mas
principalmente por me ter guiado ao longo da realização deste trabalho. Muito
obrigado pela dedicação. Muito obrigado por tudo!
Seguidamente gostaria de agradecer à Prof. Alice Pereira, não só pela enorme ajuda
científica, mas principalmente pela amizade, disponibilidade e por todos os bons
conselhos.
Aos Profs. José Moura e Isabel Moura agradeço o facto de me terem recebido nos
seus laboratórios e facultado a utilização dos seus equipamentos, bem como pela
amizade demonstrada.
Aos meus colegas Américo, Márcia e Cristina Timóteo gostaria de agradecer não só
pela amizade e companheirismo demonstrado mas sobretudo pela ajuda importante
para a realização do segundo capitulo desta tese.
Gostaria também de agradecer ao Prof. Boi Hanh (Vincent) Huynh, ao Doutor Sunil
Naik e ao Doutor Danilo Ortillo pela forma de como fui recebido no Departamento de
Física da Universidade de Emory e pela ajuda não só na obtenção de alguns dos
dados desta tese como da discussão cientifica.
À Joana Santos gostaria de agradecer não só a ajuda (fantástica!) no plano cientifico
mas sobretudo pela boa disposição e pelos momentos de “gargalhada” no
laboratório.
Não posso também deixar de agradecer ao Rui Almeida pela amizade,
companheirismo, disponibilidade e ajuda sempre prestada ao longo destes anos, em
especial na revisão desta tese.
Aos meus colegas de laboratório Andrea, Carlos, Cristina Cordas, Cristiano, Simone,
Susana, Tiago e Rui Duarte, bem como a todos os outros que cá continuam e aos

Structural and Mechanistic Studies of Iron Containing Proteins
ii
que já foram embora (Anders e Patrícia Raleiras), gostaria de agradecer a vossa
ajuda, amizade e disponibilidade em alguns momentos ao longo destes anos.
Aos outros colegas “doutorandos” do DQ, António Nunes, Diogo Latino, Inês Gomes
e Vítor Rosa gostaria de agradecer os grandes momentos de boa disposição e
companheirismo.
Ao grande amigo Bruno Pedras gostaria de agradecer os todos os bons momentos
passados ao longo destes anos e em especial por me fazer sempre lembrar que há
outras coisas na vida para além da ciência!
À Margarida queria agradecer por, de uma forma ou de outra, ter estado sempre
comigo quer nos momentos bons quer nos menos bons. Muito obrigado por estares
“aqui”...
Aos todos os outros meus amigos, especialmente ao David, Inês, Marta, Miguel,
Pedro, Ricardo, gostaria de agradecer o facto de terem estado sempre presentes,
mesmo quando eu não podia estar! Prometo que um dia vos vou recompensar!
Aos meus pais e a toda a minha família (aos que estão e ao que já não podem
assistir...) tenho de agradecer por todo o apoio demonstrado desde sempre, nunca
dizendo que não a nada. Assim é bem mais fácil andar para a frente.
À Fundação para a Ciência e Tecnologia pelo financiamento (SFRH/BD/18905/2004)
sem o qual a execução deste trabalho não seria possível.

Resumo
iii
Resumo
Ao longo das últimas décadas tem-se assistido a um grande desenvolvimento no
campo da bioquímica estrutural e funcional tendo por base o estudo de proteínas,
especificamente enzimas, que possuem na sua constituição centros metálicos.
Nesta tese são abordadas diferentes proteínas com diferentes tipos de centros de
ferro não-hémico. A relação destas quer com o oxigénio molecular quer com
espécies reactivas de oxigénio encontra-se também em estudo.
Na realização deste trabalho foram utilizadas diversas técnicas de cinética rápida,
acopladas a técnicas espectroscópicas como a Ressonância Paramagnética
Electrónica (RPE), Espectroscopia de Mössbauer e UV-Visível.
Incorporação de ferro pela ferritina de Desulfovibrio vulgaris Hildenborough
As ferritinas são proteínas globulares compostas por 24 subunidades e que podem
comportar no seu interior até 4500 átomos de ferro provenientes da sua actividade
ferroxidática.
Este tipo de proteínas pode ser encontrado em praticamente todos os organismos e
tem quase sempre como substrato, para além do ferro, o oxigénio molecular.
O objectivo deste trabalho visa a caracterização não só cinética mas também
espectroscópica (espectroscopias de RPE e Mössbauer) da incorporação de ferro
pela ferritina de Desulfovibrio vulgaris Hildenborough.
A elaboração destes estudos também com uma proteína contendo um aminoácido
mutado, E130A, ajudou a compreender a importância de um terceiro sítio de ligação
ao ferro (presente nesta proteína) para a formação de algumas espécies
intermediárias, como um radical tirosil e uma espécie de valência mista, não
identificadas noutras ferritinas.

Structural and Mechanistic Studies of Iron Containing Proteins
iv
A redução do radical anião superóxido pelo redutase do superóxido
Os redutases do superóxido são enzimas não-hémicos, de pequena massa
molecular, com centros metálicos de ferro coordenados por enxofre, normalmente
associado à protecção contra o stress oxidativo.
Foi estudado o processo de transferência electrónica entre três diferentes formas
deste enzima e o seu doador electrónico. Um estudo da transferência electrónica
mediada pelo consumo de superóxido foi também realizado. O conjunto destes
dados permitiu compreender a relevância de um dos centros desta proteína para a
sua actividade.
Finalmente, foi efectuada uma caracterização por espectroscopia de Mössbauer de
uma SOR, pertencente à classe II.
Estudo da incorporação de metais numa forma Apo da rubredoxina de Desulfovibrio
gigas
A caracterização, bem como o estudo de metaloproteínas, envolve maioritariamente
a utilização de técnicas espectroscópicas (espectroscopias de RPE, Mössbauer,
Ressonância Raman, Fluorescência, entre outras). Contudo, a complexidade das
proteínas e dos seus centros metálicos pode causar algumas dificuldades quer na
escolha da técnica a usar, quer na análise dos dados obtidos.
O estudo de proteínas estruturalmente mais simples ou que possuam características
espectroscópicas singulares pode torná-las modelos para proteínas mais complexas.
Neste caso, a proteína em estudo, a rubredoxina de Desulfovibrio gigas, foi utilizada
não só como modelo para as espectroscopias de UV-Visível e Mössbauer mas
também para a incorporação de metais em proteínas.
Com este estudo ficou também claro que a incorporação de um metal numa proteína
é um processo que depende de outros factores (estabilidade ou potencial redox)
para além da cinética da sua incorporação.

Abstract
v
Abstract
Over the last few decades a large effort has been done in the structural biochemistry
field. This effort is based on the study of some proteins, namely metalloproteins, that
contain cofactors and/or active sites with metal ions in their constitution.
This thesis will focus on different studies performed in metalloproteins that contain
non-heme iron centers. An important point is their relation to oxygen and reactive
oxygen species.
To perform these studies, fast kinetic techniques were used coupled to spectroscopic
techniques, such as Electronic Paramagnetic Resonance (EPR), Mössbauer and UV-
Visible.
Metal incorporation by Desulfovibrio vulgaris Hildenborough ferritin
Ferritins are globular proteins composed by 24 subunits that are able to store about
4500 iron atoms in an inner central cavity. These iron atoms are rescued from
solution and concomitantly oxidized from the ferrous to the ferric state using
molecular oxygen as co-substrate. Such activity is, for fast ferritins, called ferroxidase
activity.
These proteins are found in most organisms (including bacteria, plants and animals)
and serve the dual purpose of regulating iron concentration and detoxification.
The metal incorporation process performed by Desulfovibrio vulgaris Hildenborough
ferritin was studied by fast kinetic techniques coupled to spectroscopies like EPR and
Mössbauer.
The use of a mutant protein, E130A, to perform the same studies brought new
insights about the relevance of a third metal binding site to the formation of
intermediate species like tyrosyl radical and mixed-valence species, that were not
identified in other ferritins.

Structural and Mechanistic Studies of Iron Containing Proteins
vi
Superoxide reduction by superoxide reductase
Superoxide reductases (SOR) are small proteins with non-heme iron centers
coordinated by sulfur, oxygen and nitrogen atoms. These proteins are usually
associated with oxidative stress regulation.
Three different forms of a class I SOR were studied. The studies performed aimed
the characterization of both direct and superoxide mediated electron transfer
between SOR and it physiological donor, rubredoxin.
The results obtained were helpful in order to understand the relevance of center I of
class I SOR to the enzyme’s activity.
Another study based on Mössbauer spectroscopy was also performed in a class II
SOR.
Metal incorporation in an Apoprotein form of Desulfovibrio gigas rubredoxin
As mentioned before, the characterization of metalloproteins is directly connected to
the use of spectroscopic techniques like EPR, Mössbauer, Resonance Raman,
Fluorescence and others). However, some proteins have a complex assortment of
several metallic centers making difficult a complete spectral analysis.
The use of smaller, less complex proteins and enzymes that contain in their structure
features that simplify the spectroscopic analysis can be very helpful since they can
be used as model to more complex systems.
In this thesis, a small electron transfer protein, rubredoxin from Desulfovibrio gigas,
was used not only as a model for techniques like Mössbauer spectroscopy and UV-
Visible, but also to study metal incorporation processes in this type of proteins.
These studies also pointed out that the metal incorporation process inside of a living
cell should not depend only on the kinetics but also in other factors like stability or
redox potential.

Symbols and Abbreviations
vii
Symbols and Abbreviations
Symbols
ΔEQ Quadrupole Splitting
δ Isomer shift
Γ Mössbauer spectrum linewidth
v Reaction rate
k Kinetic rate constant
k’ Apparent kinetic rate constant
V Volt
Abbreviations
a.a Amino acid
Apo Apoprotein
BSA Bovine Serum Albumin
CcO Cytochrome c Oxidase (EC 1.9.3.1)
CcP Cytochrome c Peroxidase (EC 1.11.1.5)
CCR Closed-Cycle Refrigerator
D. Desulfovibrio
DEAE Diethylaminoethylethane
Dfx Desulfoferredoxin
Dg Desulfovibrio gigas
DNA Deoxyribonucleic acid
Dps DNA protection during starvation
Dv Desulfovibrio vulgaris Hildenborough
DTT Dithiothreitol
EDTA Ethylenediaminetetraacetic acid
EPR Electron Paramagnetic Resonance
E. coli Escherichia coli
FAD Flavin Adenine Dinucleotide

Structural and Mechanistic Studies of Iron Containing Proteins
viii
Ftn Ferritin
FtnA Ferritin A from E. coli
HPLC High Performance Liquid Chromatography,
LB Luria-Bertani broth or medium
M. Methanobacterium
MES 4-Morpholineethanesulfonic acid
MMO Methane Monooxygenase (EC 1.14.13.25)
NADH Nicotinamide Adenine Dinucleotide
Nlr Neelaredoxin (EC 1.15.1.2)
NOS Nitric Oxide Synthase (EC 1.14.13.39)
O.D. Optical Density
PDB Protein Data Bank
RFQ Rapid Freeze-Quench
Rd Rubredoxin
RNR-R2 Ribonucleotide Reductase R2 (EC 1.17.4.1)
RO Rieske Oxygenase (EC 1.14.12.18)
SDS-PAGE Sodium Dodecyl Sulfate Polyacrylamide Gel Electrophoresis
SF Stopped-Flow
SOD Superoxide dismutase (EC 1.15.1.1)
SOR Superoxide reductases (EC 1.15.1.2)
TCA Trichloroacetic Acid
TPTZ Tripyridyl-s-triazine
Tris-HCl Tris(hydroxymethyl)aminomethane
Tyr Tyrosine
UV-Vis UV-Visible
wt Wild type

General Index
ix
Index
Chapter I
General Introduction I.1 – Biological Mechanisms of Oxygen Activation 3
I.1.1 – Heme monooxygenases 4
I.1.2 – Non-Heme monooxygenases 12
I.1.3 – Bacterial Ferritins 15
I.2 – Detoxification of Reaction Oxygen Species 18
I.2.1 – Superoxide Reductases 18
I.2.2 – SOR Electron Donor, Rubredoxin 23
I.3 – References 25
Chapter II Structural and mechanistic features of Ferritin from Desulfovibrio vulgaris
Hildenborough
II.1 – Overview 39
II.2. – Experimental 40
II.2.1 – Dv Ferritin, overexpression and isolation 40
II.2.2 – Stopped-Flow and Rapid Freeze-Quench EPR and Mössbauer
studies of pre-loaded wild type ferritin and E130A mutant 40
II.2.2.1 - Rapid Freeze-Quench EPR and Mössbauer studies 40
II.2.2.2 – Stopped-Flow studies 50
II.3 – Discussion 65
II.4 – References 68
Chapter III Structural and mechanistic features of SORs from Desulfovibrio vulgaris Hildenborough and Desulfovibrio gigas III.1 – Overview 73
III.2 - Experimental 73
III.2.1 – Dv SOR, overexpression and isolation 73
III.2.2 – Biochemical and spectroscopic characterization of the new “blue”
form of Dv SOR 76

Structural and Mechanistic Studies of Iron Containing Proteins
x
III.2.3 – Overexpression of Dv SORZn-Fe 83
III.2.4 – Direct electron transfer between recombinant SOR forms and
rubredoxin from Desulfovibrio vulgaris Hildenborough 84
III.2.5 – Superoxide Reductase Activity 96
III.2.6 – Desulfovibrio gigas SOR, Mössbauer studies 105
III.3 – Discussion 112
III.4 – References 116
Chapter IV Structural and mechanistic studies of metal incorporation in rubredoxin from Desulfovibrio gigas IV.1 – Overview 121
IV.2 - Experimental 122
IV.2.1 – Overexpression and purification of recombinant D. gigas
rubredoxin 122
IV.2.2 – Production of apoprotein of D. gigas rubredoxin 123
IV.2.3 – Co, Ni, Zn and Fe incorporation in apo rubredoxin. Stopped-flow
approach 125
IV.2.4 – Iron incorporation by apoprotein form of rubredoxin: Rapid
Freeze-Quench 57Fe Mössbauer spectroscopy 139
IV.3 - Discussion 143
IV.4 – References 146
Appendix A Methods A.1 – E.coli BL21(DE3) transformation protocol 150
A.2 – SDS-PAGE electrophoresis: Solutions and methods 151
A.3 – Protein quantification: Lowry method 153
A.4 – Growth media description: LB, M9 and SOC 155
A.4.1 – Luria-Bertani broth 155
A.4.2 – M9 growth medium 156
A.4.3 – SOC medium 157

General Index
xi
A.5 – Buffer solutions 158
A.6.1 – Tris-HCl buffer 158
A.6.2 – Phosphate buffer 159
A.6.3 – MES Buffer 159
A.6 – References 160
Appendix B
Equipment
B.1 – Stopped-Flow apparatus: aerobic and anaerobic setup 162
B.2 – Rapid Freeze-Quench apparatus: aerobic and anaerobic setup 164
B.3 – Closed-Cycle Refrigerator (CCR) Mössbauer spectrometer: a general
overview 166
B.4 – References 170

Structural and Mechanistic Studies of Iron Containing Proteins
xii
Figures Index
Chapter I
General Introduction
Figure I. 1 – Schematic representation of CcO function. The blue arrows
represent the O2 reduction to water. The red arrows represent the proton
translocation coupled to the enzymatic activity. Adapted from [10].
6
Figure I. 2 – Schematic representation of CcO enzymatic mechanism. Adapted
from[12]. 7
Figure I. 3 - Schematic representation of NOS enzymatic mechanism. Adapted
from[12]. 9
Figure I. 4 – Schematic representation of cytochrome P450 catalytic cycle.
Adapted from [17]. 10
Figure I. 5 – Schematic representation of sMMO catalytic cycle. Adapted from
[6, 24, 25]. 13
Figure I. 6 – Schematic representation of the three components of a Rieske
Oxygenase system. Adapted from [26]. 14
Figure I. 7 - A) 3D Structure of 24-mer FtnA from Escherichia coli (PDB Id.
1EUM). 2.05 Å resolution (Stillman, T.J., [41]). B) Subunit of the FtnA from
Escherichia coli. 16
Figure I. 8 - Generic scheme of ferritin catalytic cycle. Adapted from [42-45]. 17
Figure I. 9 – A) 3D Structure of SOR from Desulfovibrio desulfuricans ATCC
27774 (PDB Id. 1DFX). 1.9 Å resolution (Coelho et al., [89]). B) Scheme of
SOR’s center I. C) Scheme of SOR’s center II. The dark orange spheres
represent the iron atom and the blue sphere represents the calcium atom.
21
Figure I. 10 – Schematic representation of a proposed catalytic mechanism of
SOR considering the following forms: (a) ferrous active state; (b) ferric peroxo
intermediate; (c) ferric hydroperoxo intermediate; (d) an extra water molecule is
recruited; (e) rearrangement leading to protonation; (f) ferric hydroxyl-bound
resting state and (h) ferric carboxylate-bound resting state. Adapted from [82].
22
Figure I. 11 – A) 3D Structure of rubredoxin from Desulfovibrio vulgaris strain
Hildenborough (PDB Id. 1RB9). 0.92 Å resolution. (Dauter Z., et al.). B)
Schematic representation of rubredoxin’s iron center. Iron atom coordinated by
the four cysteine residues. The dark orange spheres represent the iron atom.
24

Figures Index
xiii
Chapter II Structural and mechanistic features of Ferritin from Desulfovibrio vulgaris
Hildenborough Figure II. 1 – A) Ferroxidase center of human H-chain ferritin. B) Ferroxidase
center of E. coli FtnA. The glutamic acid at position 130 is marked in red.
Adapted from [3]. 39
Figure II. 2 - Time dependent Mössbauer spectra of the reaction of Dv ferritin,
62 irons/protein, with O2-saturated buffer. The solid lines over the experimental
data are simulations of a sum of a ferrous species, a peroxodiferric species and
a ferric species. The Mössbauer spectra were recorded at 4.2 K in the presence
of a weak magnetic field of 500 G parallel to the γ radiation beam.
42
Figure II. 3 - Time dependent Mössbauer spectra of the reaction of Dv ferritin,
62 irons/protein, with O2-saturated buffer. The Mössbauer spectra were
recorded at 4.2 K in the presence of a strong magnetic field of 80 kG parallel to
the γ radiation beam.
43
Figure II. 4 - Time dependent EPR spectra of the reaction of Dv ferritin with
O2-saturated buffer. The experimental conditions used were: temperature 12 K;
microwave frequency 9.656 GHz; microwave power 2 mW; modulation
amplitude 5 mT; receiver gain 1.26 x 10⁵ and attenuation of 30 dB.
46
Figure II. 5 – A) Time dependent Mössbauer spectra of the reaction of E130A
mutant, 62 irons/protein, with O2-saturated buffer. The solid lines over the
experimental data are simulations of a sum of a ferrous component and a
peroxodiferric species. B) The experimental spectra are the same as in A) but
the solid line represents only the simulation for the peroxodiferric species in
each sample. The Mössbauer spectra were recorded at 4.2 K in the presence of
a weak magnetic field of 500 G parallel to the γ radiation beam.
47
Figure II. 6 - Time dependent Mössbauer spectra of the reaction of E130A
mutant with O2-saturated buffer. The solid lines over the experimental data are
simulations of the peroxodiferric species present in each sample. The
Mössbauer spectra were recorded at 4.2 K in the presence of a strong magnetic
field of 80 kG parallel to the γ radiation beam.
48
Figure II. 7 - 2D Spectral evolution of Fe2+ incorporation in ferritin. The assay
was performed to a final concentration of 25 μM Ftn and 62 Fe/protein at pH 7.6
in 200 mM Tris-HCl plus 200 mM NaCl. The arrow points to the 412 nm peak.
50

Structural and Mechanistic Studies of Iron Containing Proteins
xiv
Figure II. 8 - 3D Spectral evolution of Fe2+ incorporation in ferritin. The assay
was performed to a final concentration of 25 μM Ftn and 62 Fe/protein at pH 7.6
in 200 mM Tris-HCl plus 200 mM NaCl.
51
Figure II. 9 – Kinetic trace recorded at 412 nm of a 1:1 mixture (v/v) of 50 μM
Ftn incubated anaerobically with FeSO4 to a final ratio of 62 Fe/protein at pH 7.6
in 200 mM Tris-HCl plus 200mM NaCl. The green line represents the values
obtained from fit of the theoretical model to the experimental data.
53
Figure II. 10 - Kinetic trace recorded at 581 nm of a mixture 1:1 (v/v) of 50 μM
Ftn incubated anaerobically with FeSO4 to a final ratio of 62 Fe/protein at pH 7.6
in 200 mM Tris-HCl plus 200mM NaCl. The green line represents the values
obtained from the fit of the theoretical model to the experimental data.
54
Figure II. 11 – Simulated species evolution through time of a 1:1 mixture (v/v) of
50 μM Ftn incubated anaerobically with FeSO4 to a final ratio of 62 Fe/protein at
pH 7.6 and 200 mM Tris-HCl plus 200 mM NaCl. Red line corresponds to B
species (peroxodiferric), green line corresponds to C species (tyrosyl radical),
pink line corresponds to D species and orange line corresponds to E species
(young mineral core).
55
Figure II. 12 – Visible spectra obtained for each species isolated according to
the kinetic model applied. Light gray stands for the peroxodiferric species, gray
for tyrosyl radical species (B and C in the proposed mechanism, respectively),
dark gray for D species and black for young mineral core (E in the proposed
mechanism). These species were obtained from a 1:1 mixture (v/v) of 50 μM Ftn
incubated anaerobically with FeSO4 to a final ratio of 62 Fe/protein at pH 7.6 in
200 mM Tris-HCl plus 200mM NaCl.
56
Figure II. 13 – Normalized absorbance at 412 nm superimposed with
percentages obtained from the Mössbauer spectra for peroxodiferric species. 57
Figure II. 14 - 2D Spectral evolution of Fe2+ incorporation in E130A mutant. The
assay was performed to a final concentration of 28 μM E130A and 62 Fe/protein
at pH 7.6 in 200 mM Tris-HCl plus 200 mM NaCl.
58
Figure II. 15 - 3D Spectral evolution of Fe2+ incorporation in E130A mutant. The
assay was performed to a final concentration of 28 μM E130A and 62 Fe/protein
at pH 7.6 in 200 mM Tris-HCl plus 200 mM NaCl.
59

Figures Index
xv
Figure II. 16 – Kinetic trace recorded at 575 nm of a 1:1 mixture (v/v) of 56 μM
E130A mutant incubated anaerobically with FeSO4 to a final ratio of 62
Fe/protein at pH 7.6 in 200 mM Tris-HCl plus 200mM NaCl. The green line
represents the values obtained from the fit of the theoretical model to the
experimental data.
60
Figure II. 17 - Species evolution in time of a 1:1 mixture (v/v) of 56 μM E130A
mutant incubated anaerobically with FeSO4 to a final ratio of 62 Fe/protein at pH
7.6 in 200 mM Tris-HCl plus 200mM NaCl. Red line corresponds to A species,
green line corresponds to B species (peroxodiferric), pink line corresponds to C
species (peroxodiferric) and orange line corresponds to D species (young
mineral core).
61
Figure II. 18 - Visible spectra obtained for each species isolated according the
kinetic model applied. Light gray stands for the peroxodiferric species, gray for
the second peroxodiferric species (B and C in the proposed mechanism,
respectively), black for young mineral core (D in the proposed mechanism).
These species were obtained from a 1:1 mixture (v/v) of 56 μM E130A
incubated anaerobically with FeSO4 to a final ratio of 62 Fe/protein at pH 7.6 in
200 mM Tris-HCl plus 200mM NaCl.
62
Figure II. 19 - Normalized absorbance at 575 nm superimposed with
percentages obtained from the Mössbauer spectra for peroxodiferric species. 63
Chapter III Structural and mechanistic features of SORs from Desulfovibrio vulgaris
Hildenborough and Desulfovibrio gigas Figure III. 1 – Absorbance spectrum of the oxidized form of the new “blue” form
of Dv SOR. 76
Figure III. 2 – UV-Vis spectra of both gray form (A) and pink form (B) of Dv SOR
and a difference spectrum (C) between A and B showing the isolated center II.
Adapted from Tavares and coworkers[4]. 77
Figure III. 3 – UV-Vis spectrum of the oxidized form of Desulfovibrio gigas SOR.
The protein concentration was 40 μM. Adapted from Chen and coworkers[8]. 78
Figure III. 4 – Comparison between the NH2-terminal sequence of the new
“blue” form of Dv SOR and the deduced amino acid sequence predicted from
the Dv SOR encoding gene. 79
Structural and Mechanistic Studies of Iron Containing Proteins
xvi
Figure III. 5 – Schematic representation of class I SOR. A) SORFe-Fe, where the
orange dots represent the iron atoms in both centers. B) SORZn-Fe, where the
green dots represent the zinc atoms in center I and orange dots represent the
iron atoms in center II.
80
Figure III. 6 – EPR spectra of A) as purified SORZn-Fe and B) Oxidized SORZn-Fe
(by incubation with sodium hexachloroiridate (IV)). The experimental conditions
used were: temperature 4.1 K; microwave frequency 9.653 GHz; microwave
power 2.002 mW; modulation amplitude 1 mT; receiver gain 1.26 x 10⁵.
81
Figure III. 7 – Temperature dependence of EPR spectra of as-purified SORZn-Fe.
A) T = 4.2 K; B) T = 10 K; C) T = 15 K; D) T = 20 K; E) T = 25 K. Other
conditions used were: microwave frequency 9.653 GHz; microwave power
2.002 mW; modulation amplitude 1 mT; receiver gain 1.26 x 10⁵.
82
Figure III. 8 - Stopped-flow kinetics of the oxidation of reduced rubredoxin by
the pink form of SORFe-Fe. The variation was measured by the absorbance
changes at 500 nm and converted to concentration. The gray line represents the
experimental data and the black line represents the theoretical fit. Solutions of
50 μM reduced rubredoxin were mixed (1:1) (v/v) with 50 μM oxidized SOR at
10 ºC.
86
Figure III. 9 - Stopped-flow kinetics of the oxidation of reduced rubredoxin by
the gray form of SORFe-Fe. The variation was measured by the absorbance
changes at 500 nm. The gray line represents the experimental data and the
black line represents the theoretical fit. Solutions of 50 μM reduced rubredoxin
were mixed (1:1) (v/v) with 50 μM oxidized SOR at 10 ºC.
87
Figure III. 10 - Stopped-flow kinetics of the reduction of gray form SORFe-Fe by
reduced rubredoxin. The variation was measured by the absorbance changes at
650 nm and converted to concentration. The gray line represents the
experimental data and the black line represents the theoretical fit. Solutions of
50μM of reduced rubredoxin were mixed (1:1) (v/v) with 50 μM of oxidized SOR
at 10ºC.
88

Figures Index
xvii
Figure III. 11 - Stopped-flow kinetics of the reduction of gray form SORFe-Fe by
reduced rubredoxin. The variation was measured by the absorbance changes at
500 nm and converted to concentration. The gray line represents the
experimental data and the black line represents the theoretical fit. Solutions of
50 μM reduced rubredoxin were mixed (2:1) (v/v) with 50 μM oxidized SOR at
10 ºC.
89
Figure III. 12 - Stopped-flow kinetics of the reduction of gray form SORFe-Fe by
reduced rubredoxin. The variation was measured by the absorbance changes at
650 nm and converted to concentration. The gray line represents the
experimental data and the black line represents the theoretical fit. Solutions of
50 μM reduced rubredoxin were mixed (2:1) (v/v) with 50 μM oxidized SOR at
10 ºC.
90
Figure III. 13 – Stopped-flow kinetics of the oxidation of reduced rubredoxin by
oxidized SORZn-Fe. The variation was measured by the absorbance changes at
500 nm and converted to concentration. The gray line represents the
experimental data and the black line represents the theoretical fit. Solutions of
12 μM reduced rubredoxin were mixed (1:1) (v/v) with 12 μM oxidized SOR at
10ºC.
91
Figure III. 14 - Stopped-flow kinetics of the reduction of oxidized SORZn-Fe by
reduced rubredoxin. The variation was measured by the absorbance changes at
650 nm and converted to concentration. The gray line represents the
experimental data and the black line represents the theoretical fit. Solutions of
25 μM reduced rubredoxin were mixed (1:1) (v/v) with 25 μM oxidized SOR at
10ºC.
92
Figure III. 15 - Comparison of stopped-flow kinetics of the reduction of oxidized
SORZn-Fe by reduced rubredoxin (A) and oxidized gray form of SORFe-Fe by
reduced rubredoxin (B). The variation was measured by the absorbance
changes at 650 nm and converted to concentration.
93
Figure III. 16 – Rubredoxin oxidized by direct electron transfer to different
amounts of SOR. The experimental data are represented in gray dots for the
gray form of SORFe-Fe; in pink for the pink form of SORFe-Fe and in blue for the
oxidized form of SORZn-Fe; the trend lines are the best fits for the experimental
data.
95

Structural and Mechanistic Studies of Iron Containing Proteins
xviii
Figure III. 17 – Illustration of superoxide-mediated electron transfer assay.
Rubredoxin concentration was 15 μM and the SOR concentration ranged from
10 nM to 1 μM. All the assays were performed in 50 mM phosphate buffer
pH 7.6 with 0.1 mM EDTA at 23 ºC. Sodium dithionite was used to perform the
initial stoichiometric reduction of rubredoxin.
97
Figure III. 18 – Kinetic traces of superoxide-mediated electron transfer between
rubredoxin and the pink form of SORFe-Fe. The different traces represent
different amounts of SOR added, a) 0 μM; b) 0.04 μM; c) 0.08 μM; d) 0.2 μM
and e) 0.4 μM. The assays were performed in 50 mM phosphate buffer pH 7.6
with 0.1 mM EDTA at 23ºC.
99
Figure III. 19 - Kinetic traces of superoxide-mediated electron transfer between
rubredoxin and the gray form of SORFe-Fe. The different traces represent
different amounts of SOR added, a) 0 μM; b) 0.08 μM; c) 0.2 μM; d) 0.4 μM and
e) 1 μM. The assays were performed in 50 mM phosphate buffer pH 7.6 with 0.1
mM EDTA at 23ºC.
100
Figure III. 20 - Kinetic traces of superoxide-mediated electron transfer between
rubredoxin and the oxidized form of SORZn-Fe. The different traces represent
different amounts of SOR added, a) 0 μM; b) 0.02 μM; c) 0,2 μM; d) 0.6 μM and
e) 1 μM. The assays were performed in 50 mM phosphate buffer pH 7.6 with 0.1
mM EDTA at 23ºC.
101
Figure III. 21 – Representation of rubredoxin oxidation rate by superoxide-
mediated electron transfer. The pink squares stand for the pink form of
SORFe-Fe, gray triangles for the gray form of SORFe-Fe and blue dots for the
oxidized form of SORZn-Fe.
102
Figure III. 22 - Representation of rubredoxin oxidation rate by superoxide-
mediated electron transfer. The pink squares stand for the reduced SORFe-Fe,
and blue dots for the reduced SORZn-Fe. 103
Figure III. 23 – A) Mössbauer spectrum of the as-purified neelaredoxin recorded
at 4.5 K in the presence of a weak magnetic field of 600G parallel to the γ
radiation beam. B) Mössbauer spectrum of the as-purified neelaredoxin
recorded at 4.5 K in the presence of a weak magnetic field of 600G
perpendicular to the γ radiation beam. The solid lines represent the theoretical
fits for the 47% of the reduced component of neelaredoxin.
106

Figures Index
xix
Figure III. 24 – A) Mössbauer spectrum of the 53% oxidized component of
neelaredoxin recorded at 4.5 K in the presence of a weak magnetic field of 600
G parallel to the γ radiation beam. C) Mössbauer spectrum of the 53% oxidized
component of neelaredoxin recorded at 4.5K in the presence of a weak
magnetic field of 600 G perpendicular to the γ radiation beam. The solid lines B)
and D) represent the theoretical fits for the oxidized component of neelaredoxin.
107
Figure III. 25 - Mössbauer spectrum of the as-purified neelaredoxin recorded at
200 K with no applied magnetic field. 109
Figure III. 26 – Mössbauer spectra of temperature dependence performed for
the dithionite reduced form of neelaredoxin. A) 4.5 K; B) 50 K; C) 100 K;
D) 150 K; E) 200 K. The solid lines are fits of a single quadrupole doublet o the
experimental data obtained for each temperature.
110
Figure III. 27 – Temperature dependence obtained for δ (gray squares) and ΔEQ
(black dots). The spectra of the dithionite reduced form of neelaredoxin were
recorded between 4.5 K and 200 K, with no applied magnetic field.
111
Figure III. 28 – A) Superficial charge of Dv rubredoxin calculated by Poisson-
Boltzmann. B) Superficial charge of Dd SOR calculated by Poisson-Boltzmann.
The blue color stands for positive charges and the negative charges are
represented by the red color. The calculations were performed using WebLab
ViewerPro 3.7, molecular Simulations Inc. C) Top 50 docking solutions
calculated for the interaction between rubredoxin and SOR, ranked according to
the minimization of electrostatic repulsion energy upon formation of the
complex. D) Top 50 docking solutions calculated for the interaction between
rubredoxin and SOR, ranked according to the best side chain interaction upon
formation of the complex. The rubredoxin molecules are represented by their
geometric center only for clarification purposes. The calculations were
performed using the Chemera 3.0 software
(http://www.cqfb.fct.unl.pt/bioin/chemera/Chemera/Intro.html).
114

Structural and Mechanistic Studies of Iron Containing Proteins
xx
Chapter IV Structural and mechanistic studies of metal incorporation in rubredoxin from Desulfovibrio gigas
Figure IV. 1 – UV-Vis spectrum of Dg rubredoxin apoprotein. 124
Figure IV. 2 – 2D Spectral evolution of a 1:1 mixture (v/v) of 30 μM ApoRd with
840 μM NiCl2, in 50 mM MES buffer pH 6.25. The arrow points the evolution of
the spectra with time.
126
Figure IV. 3 - 3D Spectral evolution of a 1:1 mixture (v/v) of 30 μM ApoRd with
840 μM NiCl2, in 50 mM MES buffer pH 6.25. 127
Figure IV. 4 – Kinetic trace of a 1:1 mixture (v/v) of 30 μM ApoRd with 840μM
NiCl2, in 50 mM MES buffer pH 6.25. The green line represents the theoretical
values obtained at this wavelength (459 nm). The inset represents the residuals
for the fit of the overall data.
128
Figure IV. 5 – Metal concentration dependence for the calculated k’. The slope
of the trend line indicates the second order rate constant for the first step. 129
Figure IV. 6 – Species evolution with time of a 1:1 mixture (v/v) of 30 μM ApoRd
with 840 μM NiCl2, in 50 mM MES buffer pH 6.25. The concentration of the
species was determined using the calculated rate constants for this assay.
130
Figure IV. 7 - 2D Spectral evolution of a 1:1 mixture (v/v) of 30 μM ApoRd with
840 μM CoCl2, in 50 mM MES buffer pH 6.25. 131
Figure IV. 8 - 3D Spectral evolution of a 1:1 mixture (v/v) of 30 μM ApoRd with
840 μM CoCl2, in 50 mM MES buffer pH 6.25. 132
Figure IV. 9 - Kinetic trace of a 1:1 mixture (v/v) of 30 μM ApoRd with 840 μM
CoCl2, in 50 mM MES buffer pH 6.25. The green line represents the theoretical
values obtained at this wavelength (696 nm). The inset represents the residuals
for the fit of the overall data.
133
Figure IV. 10 - Metal concentration dependence for the calculated k'. The slope
of the trend line indicates the second order rate constant for the first step. 134
Figure IV. 11 - Species evolution with time of a mixture 1:1 (v/v) of 30 μM
ApoRd with 840 μM CoCl2, in 50 mM MES buffer pH 6.25. The concentration of
the species was determined with the calculated rate constants for this assay.
135

Figures Index
xxi
Figure IV. 12 – Kinetic traces followed at 320 nm of several ratios of
protein/Fe2+ mixed 1:1 (v/v) in 50 mM MES buffer pH 6.25. The protein
concentration was 30 μM and the iron varied from 0 to 700 μM; A) 0 μM,
B) 175 μM, C) 263 μM, D) 350 μM, E) 467 μM and F) 700 μM.
136
Figure IV. 13 - Metal concentration dependence for the calculated k’. The slope
of the trend line indicates the second order rate constant for this step. 137
Figure IV. 14 – Mössbauer spectra of A) 700 μM 57Fe in 50 mM MES buffer,
pH 6.25 and B) 700 μM Dg rubredoxin reconstituted with 57Fe in the same
buffer. The solid lines represent the best fits for the experimental data.
140
Figure IV. 15 – Mössbauer plot with the spectra obtained for the RFQ time
course. A) 10 ms; B) 16 ms; C) 80 ms; D) 125 ms; E) 500 ms; F) 5 s; G) 1 min
15 s; H) Intermediate 1; I) Intermediate 2; The overlapped solid lines represent
the best fits to the experimental data.
141
Appendix A
Methods Figure A. 1 – Typical calibration curve obtained with the BSA standard for the
Lowry method. 154
Appendix B Equipment Figure B. 1 – A) Scheme of Bio-Logic SFM300 module used for the stopped-
flow and rapid freeze-quench experiments. Adapted from [1]. B) Generic
scheme of a rapid freeze -quench apparatus. 163
Figure B. 2 – A) Scheme of the Bio-Logic TC 100/10 cuvette, used for the
stopped-flow experiments. B) Vertical cut of the TC 100/10 cuvette. The dashed
arrow represents the light path. Adapted from [1]. 163
Figure B. 3 – Anaerobic stopped-flow apparatus (SFM-300 from Bio-Logic)
installed inside a UniLab glove box (from mBraun). The inset shows the custom
made connectors designed to fit the equipment that is used for the anaerobic
RFQ experiments.
165
Structural and Mechanistic Studies of Iron Containing Proteins
xxii
Figure B. 4 – A) Weak field Mössbauer spectrometer installed in Chemistry
Department of Faculdade de Ciências e Tecnologia da Universidade Nova de
Lisboa. B) Schematic figure of a Mössbauer spectrometer equipped with a CCR,
adapted from[3].
167
Figure B. 5 – Generic scheme of the Gifford-McMahon principle used in
Closed-Cycle Refrigerators. Adapted from [4, 5]. 169

Tables Index
xxiii
Tables Index
Chapter II Structural and mechanistic features of Ferritin from Desulfovibrio vulgaris
Hildenborough Table II. 1 - Mössbauer parameters of ferrous species, peroxodiferric species
and ferric species at weak magnetic field. 44
Table II. 2 - Mössbauer parameters of the mixed-valence species 44
Table II. 3 - Mössbauer percentage of the total Fe absorption of the different
species at various reaction times 45
Table II. 4 - Mössbauer parameters of ferrous and peroxodiferric species 48
Table II. 5 – Mössbauer percentage of the total Fe absorption of the different
species at various reaction times 49
Table II. 6 – Kinetic rate constants calculated from the fit of the stopped-flow
data 61
Table II. 7 – Extinction coefficient values published for different peroxodiferric
species[18]. The values for E130A are the ones obtained in this work. 64
Chapter III Structural and mechanistic features of SORs from Desulfovibrio vulgaris
Hildenborough and Desulfovibrio gigas Table III. 1 – Plasma emission results obtained for the protein analysis 79
Table III. 2 – Second order rate constants of electron transfer between reduced
rubredoxin and SORs 94
Table III. 3 – Calculated stoichiometry for each rubredoxin/SOR pair 95
Table III. 4 – k’ values calculated for the superoxide-mediated electron transfer
between rubredoxin and the three SOR forms in study 102
Table III. 5 – k’ values calculated for the superoxide-mediated electron transfer
between rubredoxin and all SOR forms in study 104
Table III. 6 – Parameters used to fit both components of Mössbauer spectra of
as-purified neelaredoxin 108

Structural and Mechanistic Studies of Iron Containing Proteins
xxiv
Chapter IV Structural and mechanistic studies of metal incorporation in rubredoxin from Desulfovibrio gigas Table IV. 1 – Values of the rate constants obtained for the metal incorporation in
the ApoRd 138
Table IV. 2 – Parameters used to fit the Mössbauer spectra of the samples
obtained in the rapid freeze-quench experiment. 142
Table IV. 3 – Percentage for species of table IV.2 in each sample studied 142
Appendix A
Methods
Table A. 1 - Volumes used for transformation 150
Table A. 2 – Volumes of each solution used for the SDS-PAGE gel
electrophoresis. 151
Table A. 3 – Stock solutions used for the SDS-PAGE gel electrophoresis 152
Table A. 4 - Solutions used for Lowry method 153
Table A. 5 – Reagents used for LB medium preparation 155
Table A. 6 – Solutions used to supplement the M9 medium. 156
Table A. 7 - Reagents used for M9 medium preparation 157
Table A. 8 - Reagents used for SOC medium preparation 157
Table A. 4 – Volumes of HCl 37% (w/v) added to obtain the desired pH value 158
Table A. 5 – Volume ratios used to obtain a 1 M solution of phosphate buffer at
a certain pH 159

Chapter I
1
General Introduction

Structural and Mechanistic Studies of Iron Containing Proteins
2
Index
Chapter I
Introduction I.1 – Biological Mechanisms of Oxygen Activation 3
I.1.1 – Heme monooxygenases 4
I.1.2 – Non-Heme monooxygenases 12
I.1.3 – Bacterial Ferritins 15
I.2 – Detoxification of Reaction Oxygen Species 18
I.2.1 – Superoxide Reductases 18
I.2.2 – SOR Electron Donor, Rubredoxin 23
I.3 – References 25

Chapter I
3
I. – Introduction
Life, as we know it, is supported by several chemical elements. Two of them, iron and
oxygen, are essential for all organisms. Despite that, iron and oxygen metabolisms
are yet to be fully understood. This thesis aims to gather further understanding of iron
and oxygen interplay in biology and reveal details related to iron and oxygen toxicity.
The first chapter of this thesis provides a brief description of several concepts
important for the understanding of the presented work.
I.1 – Biological Mechanisms of Oxygen Activation
Oxygen was discovered in 1774 by the British chemist Joseph Priestley and,
independently, by the Swedish pharmacist Carl Wilhelm Scheele. Scheele had
produced oxygen gas by heating mercuric oxide and various nitrates. He called the
gas “fire air” because it was the only known supporter of combustion[1, 2].
About the same time, the French chemist Antoine Laurent Lavoisier claimed the
discovery of the new substance. However, Priestley visited Lavoisier in October 1774
and told him about his experiment and how he liberated the new gas. Scheele also
posted a letter to Lavoisier on September 30, 1774 that described his own discovery
of the previously-unknown substance, but Lavoisier never acknowledged receiving it
(a copy of the letter was found in Scheele's belongings after his death)[2].
What Lavoisier undoubtedly did was to conduct the first adequate quantitative
experiments on oxidation and give the first correct explanation of how combustion
works.
Since then, several techniques of molecular oxygen production have been developed
making possible its use in many different purposes, like science, space industry and
heavy industry, among others.

Structural and Mechanistic Studies of Iron Containing Proteins
4
Molecular oxygen also plays a key role in Nature as a powerful oxidant, reducing
itself into species such as water or hydrogen peroxide. Although the oxidation of
almost all biological molecules is a thermodynamically favorable process, it doesn’t
occur spontaneously. This is due to the fact that, in its ground state, O2 is a triplet
while most of reactants are singlets leading to spin forbidden processes. Thus,
reactions between molecular oxygen and other molecules should be kinetically
unfavorable, requiring a large activation energy[3, 4]. Over the years, Nature
overcame this problem by using transition metals for pairing electrons. This process
is called “oxygen activation”.
This complementarity enables oxygen to participate in biological cycles but can lead
also to the formation of reactive oxygen species (ROS). This behavior requires a
large protection mechanism in order to overcome the possible lethal effects of the
reactive species formed.
Thus, if we look inside a cell we will see a complementary system that involves
groups of enzymes that use O2 for catalysis and another group that eliminates the
excess of hazardous metabolites formed.
In this subject several enzymes will be described. Since the main goal is to give
introductory remarks on mechanisms of oxygen activation and ROS detoxification,
only bacterial ferritin and superoxide reductases (SOR) will be described with detail.
The description of all the other mentioned proteins will serve only as an
overview/review of oxygen activation and as a guide to understand both ferritin and
SOR unanswered questions, and will be based only in recently published reviews.
I.1.1 – Heme monooxygenases
Peroxidases
Despite peroxidases not being monooxygenases, it is important to refer them since
much of the terminology used to define monooxygenase complexes derives from the
ones established for these enzymes.

Chapter I
5
Peroxidases were the first enzymes in which high-valent iron intermediates were
detected[5, 6]. These enzymes promote peroxides heterolysis, mainly hydrogen
peroxide, in order to obtain a potent oxidizing agent used to react with the substrate.
Heterolysis is a two electron process where an oxidized intermediate is formed,
compound I, which is a ferryl heme complex (Fe4+=O)[3, 6]. Depending on the
organism, the second oxidizing equivalent can be stored either on the porphyrin ring
as a porphyrin π–cation radical or on a tryptophan residue[6].
On the other hand, there are other peroxidases such as cytochrome c peroxidases
(CcP) (EC 1.11.1.5), isolated from organisms like Pseudomonas stutzeri, that are
able to reduce hydrogen peroxide to water. Formation of high-valent species such as
a ferryl intermediate (Fe4+=O) also occurs in these type peroxidases[7].
Due to the relatively long half-life of peroxidases intermediate species and their
similarities with the ones found in monooxygenases, they are commonly used as
model for extrapolation.
Cytochrome c Oxidase
Cytochrome c Oxidase (CcO) (EC 1.9.3.1) is a membrane bound metalloprotein,
involved in the respiratory chains of mitochondria and aerobic bacteria. It catalyzes
the 4e-/4H
+ reduction of O2 to H2O without the formation of ROS as shown in Eq.
I.1[8, 9].
4CcO2+
+ 8Hin+ + O2 4CcO
3+ + 4Hout
+ + 2H2O Eq.I. 1
The other important feature of this enzyme is its ability to translocate protons across
the membrane. These protons will be used later for ATP synthase for the endergonic
synthesis of ATP[10, 11].

Structural and Mechanistic Studies of Iron Containing Proteins
6
Figure I. 1 – Schematic representation of CcO function. The blue arrows represent
the O2 reduction to water. The red arrows represent the proton translocation coupled
to the enzymatic activity. Adapted from [10].
Despite the biological importance of the mechanism of proton translocation, this
subject will focus only on the oxygen activation mechanism performed by this
enzyme.
CcO has two subunits, one inside of the membrane, where one CuB atom, one
heme a and one heme a3 (myoglobin-type iron center) is located. The 3D structures
demonstrate that the O2 activation site is formed by the CuB and heme a3 [8, 12].
The characterization of the enzymatic mechanism has been described essentially by
Resonance Raman spectroscopy coupled with X-ray data, pointing to a first
heme a
cytochrome c
hemea3

Chapter I
7
intermediate formed between O2 and Fea32+
, Fe2+
-O2. The Cu1+
B interaction is thought
to be weak due to the trigonal planar geometry[13].
The next step involves a conformational change consistent with the formation of a
hydrogen bond between a tyrosine (Tyr) residue and the Fe2+
-O2 site, giving rise to a
hydroperoxy state Fe3+
-O-OH. The covalent bond between the tyrosine and the
histidine coordinated to CuB provides an effective electron transfer pathway from CuB
to the OH group of tyrosine[12, 13].
The reaction follows with the appearance of a ferryl intermediate, Fe4+
=O2, formed
via two electron reduction. One electron is provided by Fea33+, which is converted to
Fea34+
, and the other electron from Tyr-O- which is converted to a Tyr radical. This
third intermediate is finally converted into a ferric Fe3+
-OH- (figure I.2)[8, 12, 13].
In order to clarify and thus provide additional data related with the CcO O2 activation
mechanism, several studies have been performed[8, 14].
Figure I. 2 – Schematic representation of CcO enzymatic mechanism. Adapted
from[12].
O2
4 e-
H+ H+

Structural and Mechanistic Studies of Iron Containing Proteins
8
Nitric Oxide Synthase
Nitric Oxide Synthase (NOS) (EC 1.14.13.39) is one of the most complex enzymes
involved in oxygen activation. This is probably due to the fact that this enzyme is
related to the production of a vital molecule in mammals, NO. Depending on the
location, the NO produced is not only used as second messenger by activation of
soluble guanylyl cyclase in the cardiovascular and nervous systems, but also as a
cytotoxic agent in the immune system[15].
NOS produce NO from L-arginine in the presence of O2 and NADPH. The enzymatic
mechanism is very similar to other heme monooxygenases, exception being the
presence of another redox cofactor called tetrahydrobiopterin, H4B, and a regulatory
protein, calmodulin (CaM)[12, 15].
The redox cofactor H4B is thought to have a main function which is related to the high
rigidity of NOS structure, which leads to the exposure of the catalytic site to solvent
that would cause the formation of Fe3+OOH-. This species, in turn, could be subjected
to uncoupling by the solvent, with possible release of H2O2. Therefore, a fast and
coupled proton-electron transfer system is needed to ensure the formation of
Fe3+-OOH2[16].
Besides the structural complexity of this enzyme compared to other heme
monooxygenases, there is an additional issue for the overall mechanism. The final
product, NO, is a heme diatomic ligand, like O2, which leads NOS to feedback
inhibition[15].
NOS mechanism presents a resting state Fe3+/H4B, which is reduced to Fe2+/H4B to
be able to bind O2. The oxygen binding will set up an equilibrium between the
(Fe2+-O2)/H4B and (Fe3+-O2-)/H4B forms. The iron-oxygen complex is then reduced by
H4B, forming (Fe3+-O22-
)/H4B+. It is assumed that the next step involves the
consecutive addition of two protons for O-O bond cleavage, giving
(Fe3+-O-O-H2)/H4B, resulting in a Fe3+-O or its electronic equivalent Fe4+=O state.
However, these last intermediates are yet to be trapped and characterized
spectroscopicaly. The reaction ends with the formation of the products, NO and
citrulline[12, 15, 16].

Chapter I
9
Figure I. 3 - Schematic representation of NOS enzymatic mechanism. Adapted
from[12].
P450
Cytochrome P450 is probably the most recognized of all heme monooxygenases.
This is probably due to its presence in a large number of organisms from bacteria to
humans. P450s are able to catalyze the hydroxylation and epoxidation of a wide
range of organic compounds. These enzymes are involved in several metabolisms,
like sexual hormones, vitamin D, bile acids, drugs and xenobiotics, among others.
They are so important for the overall metabolism that one single organism can
contain several dozens of different P450s. For instance a small flowering plant,
Arabidopsis, has 273 sequences in the genome that codify to P450s (or
homologues)[17].
One of the interesting features of this enzyme is its 3D structure. Contrary to NOS,
P450 presents structural changes depending on the presence of substrate. These
changes can be related to the control of enzyme activity. Like in NOS, it is important
to prevent the exposure to solvent and the consequent Fe3+
-OOH- uncoupling, with
formation of hydrogen peroxide[16].
e- + O2
e- + O2
L-citrulline + NO.
e- OH-
H+

Structural and Mechanistic Studies of Iron Containing Proteins
10
From the catalytic point of view P450, is not so different from other heme
monooxygenases like NOS. The catalytic cycle begins with a low-spin Fe3+
heme,
coordinated to a water molecule. This water molecule will be displaced by the
substrate turning it into a high-spin Fe3+
heme. The following step comprises a one
electron reduction coupled to the oxygenation process, forming the oxy intermediate
Fe3+
-O2-. A second electron will generate the peroxy species Fe
3+-O2
2-. The capture
of two protons will drive the O-O cleavage via hydroperoxy (Fe3+
-O-O-H-) and
dihydroperoxy (Fe3+
-O-O-H2) leading to the formation of the ferryl intermediate
(Fe4+
=O) the so called compound I (named due to the similarity to peroxidases’
reaction intermediates)[3, 16-18].
Figure I. 4 – Schematic representation of cytochrome P450 catalytic cycle. Adapted
from [17].

Chapter I
11
For the past few years, the scientific community has performed several studies in
order to isolate and characterize the catalytic intermediates. However, contrary to the
results obtained for peroxidases, only the first intermediates could be trapped. This
may mean that some steps, such as the addition of the second proton, occur too fast
(little stability of the formed species), in the experimental timescale, and can only be
assumed by comparison to similar mechanisms like peroxidases or based on density
functional theory (DFT) calculations[16, 17].
From the examples given it is possible to conclude that oxygen activation processes
will, in principle, undergo several intermediates like, oxy, peroxy, hydroperoxy,
dihydroperoxy and ferryl.
Most of the studies performed, concern the understanding of electron pathways and
proton delivery. These are the main steps for the heterolytic cleavage of O-O bond
and subsequent formation of the ferryl species (active), which consists of an O atom
with six valence electrons, a strong oxidant. Another important aspect is the
uncoupling reaction, which can be promoted by the inappropriate protonation of the
hydroperoxy species, leading to H2O2 release.
Structural changes are also important for catalysis since they are strongly related to
the regulation of the enzymatic activity. In NOS, for example, it is important to ensure
that the product, NO, is released while in P450 these changes ensure that the
catalysis follows the correct pathway without uncoupling.

Structural and Mechanistic Studies of Iron Containing Proteins
12
I.1.2 – Non-Heme monooxygenases
Like heme monooxygenases, non-heme monooxygenases are also involved in a
variety of reactions that use molecular oxygen to metabolize a wide range of
compounds. However, the fact that they have a binuclear iron center as cofactor
instead of an heme group, make them a unique case study in terms of both
spectroscopic and biochemical characterization.
Methane Monooxygenases
Soluble Methane Monooxygenases (sMMO) (EC 1.14.13.25) belong to a large group
of bacterial oxygenases that are responsible for the oxidation of the highly stable
methane molecule to methanol in a NADH-dependent reaction[19].
Like other non-heme oxygenases, sMMOs have been described as a
multicomponent class of enzymes. Structural analysis shows that sMMO has 3
components, a hydroxylase subunit (MMOH), a reductase subunit (MMOR) and a
regulatory protein subunit (MMOB)[19, 20].
The active site is composed of a carboxylate-bridge diiron center located at the
MMOH component. The MMOR subunit transfers electrons from NADH through its
FAD and [2Fe-2S] cofactors to the active site. MMOB is a small α/β protein related to
putidaredoxin both in structure and genetics. Despite its function not being yet well
understood, some studies point to its role in electron transfer and in substrate binding
during catalysis[19, 20].
The fine interaction between these three components is fundamental for proper
catalysis. Like in heme monooxygenases, it is important to ensure that the cycle
undergoes the correct pathway to prevent incorrect reduction of the oxygenated
species, which would lead to the formation of ROS. This control is provided by the
competition between MMOB and MMOR for binding the MMOH. Recent studies
reveal that the electron transfer is dependent of the ratio on MMOB and MMOR,
since it may be related to a structural change in MMOH, thus modifying the electron
transfer rates[21].

Chapter I
13
The catalytic cycle begins with a two-electron reduction of the diferric center with
generation of the reactive all ferrous state. The existent oxo/hydroxo bridges are lost,
presumably, by protonation upon reduction. The ferrous diiron species reacts rapidly
with molecular oxygen to form a peroxodiferric (Fe3+
-O-O-Fe3+
). This first
intermediate decays into a higher-valent species Q (Fe4+
(μ-O2)Fe4+
), similar to X
species in ribonucleotide reductase R2 (RNR-R2). Both peroxodiferric and Q species
are reactive with substrates, in a manner similar to the one observed in cytochrome
P450[21, 22].
Studies with several substrates were performed in order to compare the reactivity of
both intermediates. The results showed that the difference between these two
species was related to the type of substrate used, since they have different ways to
metabolize substrates. The peroxodiferric species reacts preferentially by two-
electron or hydride abstraction, whereas the Q species follows one-electron
oxidation[20, 21]. In order to understand the biochemical and spectroscopic
characteristics of these systems, several synthetic compounds were used[20, 23].
Figure I. 5 – Schematic representation of sMMO catalytic cycle. Adapted from [6, 24,
25].
2 e- O2
H2O Substrate Product
OO
OO
OOOO
Structural and Mechanistic Studies of Iron Containing Proteins
14
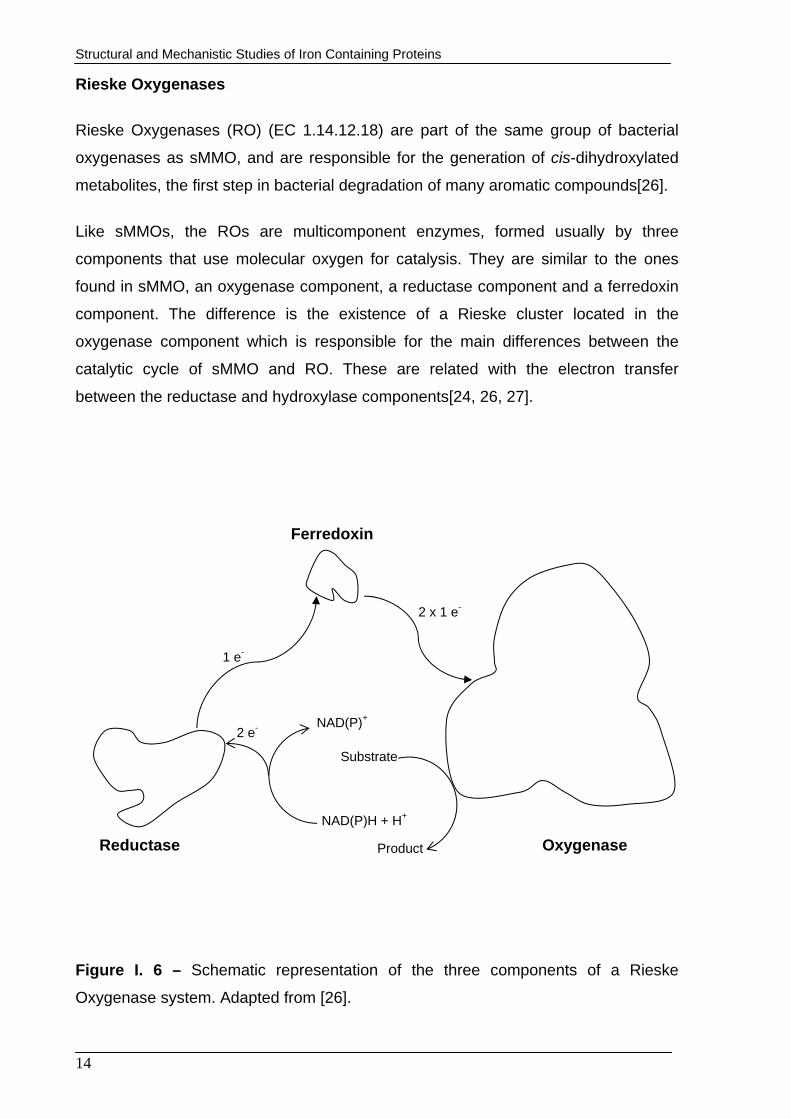
Rieske Oxygenases
Rieske Oxygenases (RO) (EC 1.14.12.18) are part of the same group of bacterial
oxygenases as sMMO, and are responsible for the generation of cis-dihydroxylated
metabolites, the first step in bacterial degradation of many aromatic compounds[26].
Like sMMOs, the ROs are multicomponent enzymes, formed usually by three
components that use molecular oxygen for catalysis. They are similar to the ones
found in sMMO, an oxygenase component, a reductase component and a ferredoxin
component. The difference is the existence of a Rieske cluster located in the
oxygenase component which is responsible for the main differences between the
catalytic cycle of sMMO and RO. These are related with the electron transfer
between the reductase and hydroxylase components[24, 26, 27].
Figure I. 6 – Schematic representation of the three components of a Rieske
Oxygenase system. Adapted from [26].
Ferredoxin
Oxygenase Reductase
NAD(P)+
NAD(P)H + H+
Substrate
Product
2 e-
1 e-
2 x 1 e-

Chapter I
15
I.1.3 – Bacterial Ferritins
In the beginning of this chapter, the relationship between iron and oxygen was
mentioned and some examples of enzymes that use molecular oxygen to perform
their catalysis have been described.
In the examples mentioned above, iron was part of the catalytic site of the protein.
There is, however, a class of enzymes that uses iron not only to build the catalytic
site but also as one of the substrates for catalysis (the other being molecular
oxygen). These enzymes are called ferritins.
Ferritins are large spherical protein cages (10-12 nm) that, depending on the type,
can have 24 (maxi-ferritin) or 12 (mini-ferritin) subunits. Each subunit has about
20 kDa and is composed by four-helixes bundles with a fifth short helix in the
C-terminal region. Depending on the organism (and sometimes the organ), ferritin
can be either a homo or heteropolymer. In mammals for example, ferritin can appear
with different proportions of H-chain and L-chain while in bacteria it will appear mostly
as a homopolymer of H-chain homologue[28, 29]. The difference between these two
chains is related to the presence of conserved binuclear iron site, known as
ferroxidase center, responsible for the catalysis in the H-chain[30].
Ferritins are present in almost all living organisms, from humans to anaerobic
bacteria. The absence of these proteins is incompatible with life in animals and very
harmful for bacteria (increasing their oxygen sensitivity)[31-35]. This ability to protect
the organism is related to ferritin’s catalytic mechanism.
Ferritins can use either molecular oxygen (for the majority of maxi-ferritins) or
hydrogen peroxide (for the majority of mini-ferritins) as a co-substrate for iron
storage. Iron storage capacity is particularly important if we consider that only Fe2+ is
moderately soluble (10-4 M) in aqueous solutions at pH 7, while Fe3+ is extremely
insoluble (10-18 M)[36, 37]. As such, ferritin becomes fundamental for cells both as an
iron homeostasis “regulator” (chelating the iron and releasing it only when needed)
and as an oxygen/hydrogen peroxide “removal tool”[36-40]. In addition to these
functions, ferritins are also related to DNA protection in cells. The so called DNA
protection during starvation proteins, Dps, are mini-ferritins that bind DNA and protect
it against several types of stress situations[37].

Structural and Mechanistic Studies of Iron Containing Proteins
16
Figure I. 7 - A) 3D Structure of 24-mer FtnA from Escherichia coli (PDB Id. 1EUM).
2.05 Å resolution (Stillman, T.J., [41]). B) Subunit of the FtnA from Escherichia coli.
From the mechanistic point of view, bacterial ferritins are similar to the previously
described proteins involved in oxygen activation, presenting catalytic intermediates
with comparable spectroscopic behaviour.
According to the published reports, iron oxidation proceeds via the formation of an
μ-1,2-peroxodiferric intermediate, with a characteristic blue colour (with maximum
absorption near 600 nm)[42-44]. This species will decay to a more stable
μ-1,2-oxodiferric species with the concomitant release of hydrogen peroxide. The
amount of hydrogen peroxide produced is not always stoichiometric in relation to the
amount of oxo intermediate produced[45, 46]. Mössbauer studies revealed that this
μ-1,2-oxodiferric species will decay spontaneously to a μ-1,2-hydroxo-bridged
dimer[47]. The formation of the mineral core would be the last step.
A) B)

Chapter I
17
Like in some monooxygenases such as RNR-R2, in ferritin it was also reported the
formation of a tyrosyl radical during the ferroxidatic process[48-55].
Regarding the stoichiometry, these reactions show in general a 2:1 ratio between the
iron and oxygen where two electrons from the iron oxidation will reduce the oxygen to
hydrogen peroxide[56, 57]. However, the presence of a third site (site C) in some
bacterial ferritins, like FtnA from E. coli, introduced some complexity to the
mechanism, and so, in this cases a 3-4:1 iron-oxygen ratio is observed[58]. The
possibility of a 4:1 stoichiometry instead of 3:1 that would be expected in this
particular case can be related to the presence of a fourth iron binding site or an
active amino acid residue. In this case, the oxygen would be reduced to water rather
than to hydrogen peroxide.
Figure I. 8 - Generic scheme of ferritin catalytic cycle. Adapted from [42-45].
Ferritin
Ferritin-2Fe2+
Peroxodiferric species Oxodiferric species
Hydroxodiferric species
Mineral core
2Fe2+
O2
H2O2

Structural and Mechanistic Studies of Iron Containing Proteins
18
I.2 – Detoxification of Reactive Oxygen Species
As mentioned in the beginning of this chapter, there is a complementarity between
the enzymes that use oxygen for catalysis like ferritins and the enzymes that
metabolize the ROS formed in the oxygen activation reactions.
ROS can be divided in two groups, radical (superoxide, hydroxyl, peroxyl, alkoxyl and
hydroperoxyl) and nonradical (hydrogen peroxide, ozone, singlet oxygen,
peroxynitrite and hypochlorous acid). When in excess, these species are usually
involved in cellular destruction by different mechanisms like lipid oxidation and DNA
and amino acid damage[59-64]. This thesis will focus on the superoxide degradation
by SORs.
Superoxide radical can be generated by different sources through a variety of
mechanisms. In an aqueous solution, at pH 7.0, superoxide will dismutate into
hydrogen peroxide and O2 with a very high rate constant, about 5 x 10⁵ M-1.s-1. Thus,
once generated, superoxide can be harmful to the cell both directly, and indirectly via
the formation of hydrogen peroxide[65, 66].
I.2.1 – Superoxide Reductases
Since the beginning of the 90’s several unusual non-heme iron proteins have been
isolated and characterized [67-76]. Although the function of these proteins was
partially unveiled in 1996 when Touati and coworkers reported that a protein from
Desulfovibrio baarsii suppressed all the effects caused by the absence of superoxide
dismutase (SOD) (EC 1.15.1.1) in E. coli, only in 1999 the real function of these
proteins was assigned[77-79]. The so called superoxide reductases (SORs)
(EC 1.15.1.2) revealed their ability to reduce the superoxide anion to hydrogen
peroxide instead of the common dismutation, performed by the well know SOD[71,
74, 77, 80].

Chapter I
19
O2- + 2H+ + e- H2O2 (SOR) Eq.I.2
2O2- + 2H+ O2 + H2O2 (SOD) Eq.I.3
This ability has an enormous biological relevance if we consider that the major part of
these SOR proteins were first purified from anaerobes, thus enabling them to survive
when exposed to small amounts of oxygen[81].
SORs are usually divided in three classes according to both the number of iron
centers (1Fe-SOR and 2Fe-SOR) and the presence in their primary structure of an N-
terminal domain[82].
Class I SORs, historically called desulfoferrodoxins, were first isolated by Moura and
coworkers and are characterized by the presence of two iron centers. Center I is very
similar to the one found in desulforedoxin isolated from D. gigas (one iron atom
coordinated by four cysteine residues) and center II (one iron atom coordinated by
four histidine residues in the equatorial plane and one cysteine in the axial plane) [68,
70, 83, 84]. These class I SORs can attain three different oxidation states: fully-
reduced (colorless, with both centers in the ferrous state), half-reduced (“pink” form,
due to the oxidized center I and reduced center II) and fully-oxidized (“gray” form, due
to the both oxidized center I and II).
In the pink form the protein exhibits spectroscopic features of a high-spin ferric ion
(S=5/2) with absorption maxima at 495, 368 and 279 nm. The EPR spectrum shows
resonances at g=7.7, 5.7, 4.1 and 1.8 with E/D = 0.08, while the Mössbauer
spectroscopy characterization indicates the presence of two high-spin iron centers,
one ferric and one ferrous. The gray form shows additional absorption bands at 335
and 635 nm and the EPR spectrum has additional resonances at g = 4.3 and 9.6.
The Mössbauer spectrum reveals another component characteristic of a high-spin
ferric ion with E/D = 1/3 [70, 85, 86].
Class II SORs, historically called neelaredoxins (the protein exhibited a blue color
when in the oxidized state and “neela” means “blue” in Sanskrit), were first isolated
by Chen and coworkers and are characterized by the presence of one iron center,
similar to center II of class I SORs[68]. The absorption spectrum shows features at
666 (pH dependent), 325 and 280 nm.

Structural and Mechanistic Studies of Iron Containing Proteins
20
Contrary to class I and II, which were only found in anaerobic or microaerotolerant
bacteria, a new class of SOR was isolated from a microaerophilic organism, the
syphilis spirochete Treponema pallidum[69, 74, 87]. This new class, class III, is
spectroscopicaly similar to class II, presenting only one iron center coordinated by
four histidine residues in the equatorial plane and one cysteine residue in the axial
plane. Gene sequence analysis showed that the gene product should be a 14 kDa
protein with two domains, homologous to class I SOR. However, in this protein, three
of the four cysteine residues of center I were not present. The crystal structure of this
class III SOR shows a homodimeric protein, very similar to the structure obtained for
class I SOR despite possessing only iron center[88].
Besides the biochemical and spectroscopic characterization of these enzymes,
several studies concerning the characterization of reaction intermediates have been
performed in order to obtain an overall reaction mechanism for these enzymes.
Therefore, a possible mechanism can be described by having a pentacoordinate
ferrous active site which is in a pH-dependent equilibrium with the hexacoordinate
resting ferric state.

Chapter I
21
Figure I. 9 – A) 3D Structure of SOR from Desulfovibrio desulfuricans ATCC 27774
(PDB Id. 1DFX). 1.9 Å resolution (Coelho et al., [89]). B) Scheme of SOR’s center I.
C) Scheme of SOR’s center II. The dark orange spheres represent the iron atom and
the blue sphere represents the calcium atom.
This ferric state can have either a hydroxide or a glutamate as the sixth ligand in a pH
dependent equilibrium (high pH values favor the hydroxide binding). After substrate
binding to the ferrous site a ferric peroxo species is formed with a rate constant close
to 109 M-1.s-1. The presence of a second intermediate species is currently under
discussion, since some authors claim that the direct protonation of the ferric-peroxo
species yields the final product, while others suggest the formation of a hydroperoxo
species in a process dependent on the proton concentration of the solvent[90-93].
A) B)
C)

Structural and Mechanistic Studies of Iron Containing Proteins
22
Figure I. 10 – Schematic representation of a proposed catalytic mechanism of SOR
considering the following forms: (a) ferrous active state; (b) ferric peroxo
intermediate; (c) ferric hydroperoxo intermediate; (d) an extra water molecule is
recruited; (e) rearrangement leading to protonation; (f) ferric hydroxyl-bound resting
state and (h) ferric carboxylate-bound resting state. Adapted from [82].
The protonation of this second intermediate leads to the formation of the product,
hydrogen peroxide.
However, this catalytic process depends not only on protonation but also on electrons
that are necessary for superoxide reduction. Until now, two possibilities could be
considered: the electron could be transferred directly to the center II to reduce the
substrate, or to the center I and then transferred to the center II via intramolecular

Chapter I
23
electron transfer. The reduction via center I could be an important way to prevent the
formation of a glutamate-coordinated species[94].
On the other hand, there are evidences that prove that it is possible to reduce
superoxide without the involvement of center I, like in the C13S mutant from D.
vulgaris strain Hildenborough SOR. The resulting protein (lacking center I) revealed
catalytic properties similar to the wild type protein[95]. Thus, this result could
eliminate the biological relevance of center I. This subject will be studied and
discussed later on in this thesis.
I.2.2 – SOR Electron Donor, Rubredoxin
Rubredoxins (Rd) are small (in average, just over 50 amino acids residues),
monomeric, non-heme iron proteins with approximately 6 kDa molecular mass[96,
97]. These proteins contain a single iron center, coordinated by four cysteine
residues very similar to the center I in the SORs[98-101].
Rds were first isolated from Clostridium pasteurianum by Lovenberg and coworkers
more than forty years ago. Since then several other rubredoxins have been isolated
and characterized both structurally and spectroscopically[96, 101-104]. A large
number of X-Ray crystal structures can be found in the Protein Data Bank (PDB).
Rubredoxins are often associated with electron transfer processes in biological
systems, working as an electron donor to proteins in many different pathways, like
cellular detoxification[96, 105, 106]. Several electron transfer studies between
rubredoxin and SORs were recently published[94, 107-109].
In the work presented in this thesis two different recombinant rubredoxins (from D.
vulgaris Hildenborough and D. gigas) will be used. The first will be used as an
electron donor to the D. vulgaris Hildenborough SOR. These studies will be based on
rubredoxin’s ability to reduce SOR[82, 94, 107-109].
A different study, involving D. gigas rubredoxin, intends to characterize, kinetic and
spectroscopicaly, metal incorporation into an apo form of the protein. The absence of

Structural and Mechanistic Studies of Iron Containing Proteins
24
both metallochaperones and inorganic sulfide (or other cofactors) may indicate that
rubredoxin doesn’t need specialized machinery to incorporate iron during its
expression[97]. This information, combined with the previously published work
concerning rubredoxin stability, makes it a perfect probe for understanding, from a
biological point of view, the metal incorporation in these type of metallic centers[110,
111].
Figure I. 11 – A) 3D Structure of rubredoxin from Desulfovibrio vulgaris strain
Hildenborough (PDB Id. 1RB9). 0.92 Å resolution. (Dauter Z., et al.). B) Schematic
representation of rubredoxin’s iron center. Iron atom coordinated by the four cysteine
residues. The dark orange spheres represent the iron atom.
Recent studies also point to a flexible structure of apo rubredoxin which folds into the
“native” structure upon the incorporation of iron. These studies also show that the
metal incorporation follows a number of steps that are dependent from the iron
binding to the protein. This incorporation is also dependent on the use of high
concentrations of denaturating agents such as urea and guanidine hydrochloride[97].
A) B)

Chapter I
25
I.3 – References
[1] L.O. Bram, N.H. Dickey, Funk & Wagnalls New Encyclopedia, Funk & Wagnalls
Corporation, New York, 1983.
[2] J. Emsley, "Oxygen", Nature's Building Blocks: An A-Z Guide to the Elements.,
Oxford University Press, Oxford, 2001.
[3] T.L. Poulos, Structural biology of heme monooxygenases, Biochem Biophys Res
Commun 338 (2005) 337-345.
[4] E.F. Elstner, Oxygen Activation and Oxygen-Toxicity, Annual Review of Plant
Physiology and Plant Molecular Biology 33 (1982) 73-96.
[5] A.N. Hiner, E.L. Raven, R.N. Thorneley, F. Garcia-Canovas, J.N. Rodriguez-
Lopez, Mechanisms of compound I formation in heme peroxidases, J Inorg Biochem
91 (2002) 27-34.
[6] J.M. Bollinger, Jr., C. Krebs, Stalking intermediates in oxygen activation by iron
enzymes: motivation and method, J Inorg Biochem 100 (2006) 586-605.
[7] G.W. Pettigrew, A. Echalier, S.R. Pauleta, Structure and mechanism in the
bacterial dihaem cytochrome c peroxidases, J Inorg Biochem 100 (2006) 551-567.
[8] Y. Naruta, T. Sasaki, F. Tani, Y. Tachi, N. Kawato, N. Nakamura, Heme-Cu
complexes as oxygen-activating functional models for the active site of cytochrome c
oxidase, J Inorg Biochem 83 (2001) 239-246.
[9] B. Ludwig, E. Bender, S. Arnold, M. Huttemann, I. Lee, B. Kadenbach,
Cytochrome C oxidase and the regulation of oxidative phosphorylation,
Chembiochem 2 (2001) 392-403.
[10] M. Wikstrom, Cytochrome c oxidase: 25 years of the elusive proton pump,
Biochim Biophys Acta 1655 (2004) 241-247.

Structural and Mechanistic Studies of Iron Containing Proteins
26
[11] M. Wikstrom, M.I. Verkhovsky, Mechanism and energetics of proton
translocation by the respiratory heme-copper oxidases, Biochim Biophys Acta 1767 (2007) 1200-1214.
[12] T.L. Poulos, H. Li, C.S. Raman, Heme-mediated oxygen activation in biology:
cytochrome c oxidase and nitric oxide synthase, Curr Opin Chem Biol 3 (1999) 131-
137.
[13] S. Yoshikawa, K. Muramoto, K. Shinzawa-Itoh, H. Aoyama, T. Tsukihara, T.
Ogura, K. Shimokata, Y. Katayama, H. Shimada, Reaction mechanism of bovine
heart cytochrome c oxidase, Biochim Biophys Acta 1757 (2006) 395-400.
[14] E.E. Chufan, S.C. Puiu, K.D. Karlin, Heme-copper/dioxygen adduct formation,
properties, and reactivity, Acc Chem Res 40 (2007) 563-572.
[15] H. Li, T.L. Poulos, Structure-function studies on nitric oxide synthases, Journal of
Inorganic Biochemistry 99 (2005) 293-305.
[16] T.L. Poulos, Structural and functional diversity in heme monooxygenases, Drug
Metab Dispos 33 (2005) 10-18.
[17] T.L. Poulos, Intermediates in P450 catalysis, Philos Transact A Math Phys Eng
Sci 363 (2005) 793-806; discussion 1035-1040.
[18] T.M. Makris, R. Davydov, I.G. Denisov, B.M. Hoffman, S.G. Sligar, Mechanistic
enzymology of oxygen activation by the cytochromes P450, Drug Metab Rev 34 (2002) 691-708.
[19] J.G. Leahy, P.J. Batchelor, S.M. Morcomb, Evolution of the soluble diiron
monooxygenases, FEMS Microbiol Rev 27 (2003) 449-479.
[20] S.J. Lippard, Hydroxylation of C-H bonds at carboxylate-bridged diiron centres,
Philos Transact A Math Phys Eng Sci 363 (2005) 861-877; discussion 1035-1040.
[21] L.J. Murray, S.J. Lippard, Substrate trafficking and dioxygen activation in
bacterial multicomponent monooxygenases, Acc Chem Res 40 (2007) 466-474.

Chapter I
27
[22] L. Que, Jr., The oxo/peroxo debate: a nonheme iron perspective, J Biol Inorg
Chem 9 (2004) 684-690.
[23] I.V. Korendovych, S.V. Kryatov, E.V. Rybak-Akimova, Dioxygen activation at
non-heme iron: insights from rapid kinetic studies, Acc Chem Res 40 (2007) 510-521.
[24] E.G. Kovaleva, M.B. Neibergall, S. Chakrabarty, J.D. Lipscomb, Finding
intermediates in the O2 activation pathways of non-heme iron oxygenases, Acc
Chem Res 40 (2007) 475-483.
[25] S.K. Lee, J.C. Nesheim, J.D. Lipscomb, Transient intermediates of the methane
monooxygenase catalytic cycle, J Biol Chem 268 (1993) 21569-21577.
[26] D.J. Ferraro, L. Gakhar, S. Ramaswamy, Rieske business: structure-function of
Rieske non-heme oxygenases, Biochem Biophys Res Commun 338 (2005) 175-190.
[27] D.T. Gibson, R.E. Parales, Aromatic hydrocarbon dioxygenases in environmental
biotechnology, Curr Opin Biotechnol 11 (2000) 236-243.
[28] P.M. Harrison, P. Arosio, The ferritins: molecular properties, iron storage function
and cellular regulation, Biochim Biophys Acta 1275 (1996) 161-203.
[29] E.C. Theil, The ferritin family of iron storage proteins, Adv Enzymol Relat Areas
Mol Biol 63 (1990) 421-449.
[30] D.M. Lawson, P.J. Artymiuk, S.J. Yewdall, J.M. Smith, J.C. Livingstone, A.
Treffry, A. Luzzago, S. Levi, P. Arosio, G. Cesareni, et al., Solving the structure of
human H ferritin by genetically engineering intermolecular crystal contacts, Nature
349 (1991) 541-544.
[31] L. Chen, L. Keramati, J.D. Helmann, Coordinate regulation of Bacillus subtilis
peroxide stress genes by hydrogen peroxide and metal ions, Proc Natl Acad Sci U S
A 92 (1995) 8190-8194.

Structural and Mechanistic Studies of Iron Containing Proteins
28
[32] O.M. Hartford, B.C. Dowds, Isolation and characterization of a hydrogen
peroxide resistant mutant of Bacillus subtilis, Microbiology 140 ( Pt 2) (1994) 297-
304.
[33] A. Kauko, S. Haataja, A.T. Pulliainen, J. Finne, A.C. Papageorgiou, Crystal
structure of Streptococcus suis Dps-like peroxide resistance protein Dpr: implications
for iron incorporation, J Mol Biol 338 (2004) 547-558.
[34] E.R. Rocha, G. Owens, Jr., C.J. Smith, The redox-sensitive transcriptional
activator OxyR regulates the peroxide response regulon in the obligate anaerobe
Bacteroides fragilis, J Bacteriol 182 (2000) 5059-5069.
[35] C. Ferreira, D. Bucchini, M.E. Martin, S. Levi, P. Arosio, B. Grandchamp, C.
Beaumont, Early embryonic lethality of H ferritin gene deletion in mice, J Biol Chem
275 (2000) 3021-3024.
[36] E.C. Theil, M. Matzapetakis, X. Liu, Ferritins: iron/oxygen biominerals in protein
nanocages, J Biol Inorg Chem 11 (2006) 803-810.
[37] A. Lewin, G.R. Moore, N.E. Le Brun, Formation of protein-coated iron minerals,
Dalton Trans (2005) 3597-3610.
[38] X. Liu, E.C. Theil, Ferritins: dynamic management of biological iron and oxygen
chemistry, Acc Chem Res 38 (2005) 167-175.
[39] X. Liu, E.C. Theil, Ferritin as an iron concentrator and chelator target, Ann N Y
Acad Sci 1054 (2005) 136-140.
[40] M.A. Carrondo, Ferritins, iron uptake and storage from the bacterioferritin
viewpoint, Embo J 22 (2003) 1959-1968.
[41] T.J. Stillman, P.D. Hempstead, P.J. Artymiuk, S.C. Andrews, A.J. Hudson, A.
Treffry, J.R. Guest, P.M. Harrison, The high-resolution X-ray crystallographic
structure of the ferritin (EcFtnA) of Escherichia coli; comparison with human H ferritin
(HuHF) and the structures of the Fe(3+) and Zn(2+) derivatives, J Mol Biol 307 (2001) 587-603.

Chapter I
29
[42] A.S. Pereira, W. Small, C. Krebs, P. Tavares, D.E. Edmondson, E.C. Theil, B.H.
Huynh, Direct spectroscopic and kinetic evidence for the involvement of a
peroxodiferric intermediate during the ferroxidase reaction in fast ferritin
mineralization, Biochemistry 37 (1998) 9871-9876.
[43] F. Bou-Abdallah, G.C. Papaefthymiou, D.M. Scheswohl, S.D. Stanga, P. Arosio,
N.D. Chasteen, mu-1,2-Peroxobridged di-iron(III) dimer formation in human H-chain
ferritin, Biochem J 364 (2002) 57-63.
[44] P. Moenne-Loccoz, C. Krebs, K. Herlihy, D.E. Edmondson, E.C. Theil, B.H.
Huynh, T.M. Loehr, The ferroxidase reaction of ferritin reveals a diferric mu-1,2
bridging peroxide intermediate in common with other O2-activating non-heme diiron
proteins, Biochemistry 38 (1999) 5290-5295.
[45] G.N. Jameson, W. Jin, C. Krebs, A.S. Pereira, P. Tavares, X. Liu, E.C. Theil,
B.H. Huynh, Stoichiometric production of hydrogen peroxide and parallel formation of
ferric multimers through decay of the diferric-peroxo complex, the first detectable
intermediate in ferritin mineralization, Biochemistry 41 (2002) 13435-13443.
[46] G. Zhao, F. Bou-Abdallah, X. Yang, P. Arosio, N.D. Chasteen, Is hydrogen
peroxide produced during iron(II) oxidation in mammalian apoferritins?, Biochemistry
40 (2001) 10832-10838.
[47] E.R. Bauminger, A. Treffry, M.A. Quail, Z. Zhao, I. Nowik, P.M. Harrison, Stages
in iron storage in the ferritin of Escherichia coli (EcFtnA): analysis of Mossbauer
spectra reveals a new intermediate, Biochemistry 38 (1999) 7791-7802.
[48] G.S. Waldo, E.C. Theil, Formation of iron(III)-tyrosinate is the fastest reaction
observed in ferritin, Biochemistry 32 (1993) 13262-13269.
[49] G.S. Waldo, J. Ling, J. Sanders-Loehr, E.C. Theil, Formation of an Fe(III)-
tyrosinate complex during biomineralization of H-subunit ferritin, Science 259 (1993)
796-798.

Structural and Mechanistic Studies of Iron Containing Proteins
30
[50] D. Yun, R. Garcia-Serres, B.M. Chicalese, Y.H. An, B.H. Huynh, J.M. Bollinger,
Jr., (Mu-1,2-peroxo)diiron(III/III) complex as a precursor to the diiron(III/IV)
intermediate X in the assembly of the iron-radical cofactor of ribonucleotide reductase
from mouse, Biochemistry 46 (2007) 1925-1932.
[51] D. Yun, L. Saleh, R. Garcia-Serres, B.M. Chicalese, Y.H. An, B.H. Huynh, J.M.
Bollinger, Jr., Addition of oxygen to the diiron(II/II) cluster is the slowest step in
formation of the tyrosyl radical in the W103Y variant of ribonucleotide reductase
protein R2 from mouse, Biochemistry 46 (2007) 13067-13073.
[52] J.M. Bollinger, Jr., D.E. Edmondson, B.H. Huynh, J. Filley, J.R. Norton, J.
Stubbe, Mechanism of assembly of the tyrosyl radical-dinuclear iron cluster cofactor
of ribonucleotide reductase, Science 253 (1991) 292-298.
[53] N. Ravi, J.M. Bollinger, B.H. Huynh, D.E. Edmondson, J. Stubbe, Mechanism of
Assembly of the Tyrosyl Radical-Diiron(Iii) Cofactor of Escherichia-Coli
Ribonucleotide Reductase .1. Mossbauer Characterization of the Diferric Radical
Precursor, Journal of the American Chemical Society 116 (1994) 8007-8014.
[54] J.M. Bollinger, W.H. Tong, N. Ravi, B.H. Huynh, D.E. Edmondson, J. Stubbe,
Mechanism of Assembly of the Tyrosyl Radical-Diiron(Iii) Cofactor of Escherichia-Coli
Ribonucleotide Reductase .3. Kinetics of the Limiting Fe2+ Reaction by Optical, Epr,
and Mossbauer Spectroscopies, Journal of the American Chemical Society 116 (1994) 8024-8032.
[55] J.M. Bollinger, W.H. Tong, N. Ravi, B.H. Huynh, D.E. Edmondson, J. Stubbe,
Mechanism of Assembly of the Tyrosyl Radical-Diiron(Iii) Cofactor of Escherichia-Coli
Ribonucleotide Reductase .2. Kinetics of the Excess Fe2+ Reaction by Optical, Epr,
and Mossbauer Spectroscopies, Journal of the American Chemical Society 116 (1994) 8015-8023.
[56] X. Yang, Y. Chen-Barrett, P. Arosio, N.D. Chasteen, Reaction paths of iron
oxidation and hydrolysis in horse spleen and recombinant human ferritins,
Biochemistry 37 (1998) 9743-9750.

Chapter I
31
[57] B. Xu, N.D. Chasteen, Iron oxidation chemistry in ferritin. Increasing Fe/O2
stoichiometry during core formation, J Biol Chem 266 (1991) 19965-19970.
[58] A. Treffry, Z. Zhao, M.A. Quail, J.R. Guest, P.M. Harrison, How the presence of
three iron binding sites affects the iron storage function of the ferritin (EcFtnA) of
Escherichia coli, FEBS Lett 432 (1998) 213-218.
[59] K. Keyer, A.S. Gort, J.A. Imlay, Superoxide and the production of oxidative DNA
damage, J Bacteriol 177 (1995) 6782-6790.
[60] B. Halliwell, J.M. Gutteridge, C.E. Cross, Free radicals, antioxidants, and human
disease: where are we now?, J Lab Clin Med 119 (1992) 598-620.
[61] B. Halliwell, M. Dizdaroglu, The measurement of oxidative damage to DNA by
HPLC and GC/MS techniques, Free Radic Res Commun 16 (1992) 75-87.
[62] C.E. Cross, P.A. Motchnik, B.A. Bruener, D.A. Jones, H. Kaur, B.N. Ames, B.
Halliwell, Oxidative damage to plasma constituents by ozone, FEBS Lett 298 (1992)
269-272.
[63] J.M. Gutteridge, B. Halliwell, Iron toxicity and oxygen radicals, Baillieres Clin
Haematol 2 (1989) 195-256.
[64] J.M. Gutteridge, Iron and oxygen: a biologically damaging mixture, Acta Paediatr
Scand Suppl 361 (1989) 78-85.
[65] J.M. Gutteridge, B. Halliwell, Free Radicals in Biology and Medicine, 4th ed.,
Oxford University Press, 2007.
[66] I. Fridovich, Superoxide radical and superoxide dismutases, Annu Rev Biochem
64 (1995) 97-112.
[67] Y.K. Chae, Expression, purification, and characterization of the oligomeric states
of rubredoxin oxidoreductase from Methanobacterium thermoautotrophicum, Mol
Cells 13 (2002) 259-263.

Structural and Mechanistic Studies of Iron Containing Proteins
32
[68] L. Chen, P. Sharma, J. Le Gall, A.M. Mariano, M. Teixeira, A.V. Xavier, A blue
non-heme iron protein from Desulfovibrio gigas, Eur J Biochem 226 (1994) 613-618.
[69] M. Lombard, D. Touati, M. Fontecave, V. Niviere, Superoxide reductase as a
unique defense system against superoxide stress in the microaerophile Treponema
pallidum, J Biol Chem 275 (2000) 27021-27026.
[70] I. Moura, P. Tavares, J.J. Moura, N. Ravi, B.H. Huynh, M.Y. Liu, J. LeGall,
Purification and characterization of desulfoferrodoxin. A novel protein from
Desulfovibrio desulfuricans (ATCC 27774) and from Desulfovibrio vulgaris (strain
Hildenborough) that contains a distorted rubredoxin center and a mononuclear
ferrous center, J Biol Chem 265 (1990) 21596-21602.
[71] I.A. Abreu, L.M. Saraiva, J. Carita, H. Huber, K.O. Stetter, D. Cabelli, M.
Teixeira, Oxygen detoxification in the strict anaerobic archaeon Archaeoglobus
fulgidus: superoxide scavenging by neelaredoxin, Mol Microbiol 38 (2000) 322-334.
[72] J.V. Rodrigues, L.M. Saraiva, I.A. Abreu, M. Teixeira, D.E. Cabelli, Superoxide
reduction by Archaeoglobus fulgidus desulfoferrodoxin: comparison with
neelaredoxin, J Biol Inorg Chem 12 (2007) 248-256.
[73] A.P. Yeh, Y. Hu, F.E. Jenney, Jr., M.W. Adams, D.C. Rees, Structures of the
superoxide reductase from Pyrococcus furiosus in the oxidized and reduced states,
Biochemistry 39 (2000) 2499-2508.
[74] T. Jovanovic, C. Ascenso, K.R. Hazlett, R. Sikkink, C. Krebs, R. Litwiller, L.M.
Benson, I. Moura, J.J. Moura, J.D. Radolf, B.H. Huynh, S. Naylor, F. Rusnak,
Neelaredoxin, an iron-binding protein from the syphilis spirochete, Treponema
pallidum, is a superoxide reductase, J Biol Chem 275 (2000) 28439-28448.
[75] R.G. Zhang, Y. Kim, T. Skarina, S. Beasley, R. Laskowski, C. Arrowsmith, A.
Edwards, A. Joachimiak, A. Savchenko, Crystal structure of Thermotoga maritima
0065, a member of the IclR transcriptional factor family, J Biol Chem 277 (2002)
19183-19190.

Chapter I
33
[76] F.E. Jenney, M. Verhagen, M.W.W. Adams, Neelaredoxin from Pyrococcus
furiosus is a novel type of superoxide dismutase, Journal of Inorganic Biochemistry
74 (1999) 181-181.
[77] F.E. Jenney, Jr., M.F. Verhagen, X. Cui, M.W. Adams, Anaerobic microbes:
oxygen detoxification without superoxide dismutase, Science 286 (1999) 306-309.
[78] M.J. Pianzzola, M. Soubes, D. Touati, Overproduction of the rbo gene product
from Desulfovibrio species suppresses all deleterious effects of lack of superoxide
dismutase in Escherichia coli, J Bacteriol 178 (1996) 6736-6742.
[79] S.I. Liochev, I. Fridovich, A mechanism for complementation of the sodA sodB
defect in Escherichia coli by overproduction of the rbo gene product
(desulfoferrodoxin) from Desulfoarculus baarsii, J Biol Chem 272 (1997) 25573-
25575.
[80] M. Lombard, M. Fontecave, D. Touati, V. Niviere, Reaction of the
desulfoferrodoxin from Desulfoarculus baarsii with superoxide anion. Evidence for a
superoxide reductase activity, J Biol Chem 275 (2000) 115-121.
[81] J.K. Voordouw, G. Voordouw, Deletion of the rbo gene increases the oxygen
sensitivity of the sulfate-reducing bacterium Desulfovibrio vulgaris Hildenborough,
Appl Environ Microbiol 64 (1998) 2882-2887.
[82] A.S. Pereira, P. Tavares, F. Folgosa, R.M. Almeida, I. Moura, J.J.G. Moura,
Superoxide reductases, European Journal of Inorganic Chemistry (2007) 2569-2581.
[83] B. Devreese, P. Tavares, J. Lampreia, N. Van Damme, J. Le Gall, J.J. Moura, J.
Van Beeumen, I. Moura, Primary structure of desulfoferrodoxin from Desulfovibrio
desulfuricans ATCC 27774, a new class of non-heme iron proteins, FEBS Lett 385 (1996) 138-142.
[84] I. Moura, M. Bruschi, J. Le Gall, J.J. Moura, A.V. Xavier, Isolation and
characterization of desulforedoxin, a new type of non-heme iron protein from
Desulfovibrio gigas, Biochem Biophys Res Commun 75 (1977) 1037-1044.

Structural and Mechanistic Studies of Iron Containing Proteins
34
[85] P. Tavares, N. Ravi, J.J. Moura, J. LeGall, Y.H. Huang, B.R. Crouse, M.K.
Johnson, B.H. Huynh, I. Moura, Spectroscopic properties of desulfoferrodoxin from
Desulfovibrio desulfuricans (ATCC 27774), J Biol Chem 269 (1994) 10504-10510.
[86] I. Moura, P. Tavares, N. Ravi, Characterization of three proteins containing
multiple iron sites: rubrerythrin, desulfoferrodoxin, and a protein containing a six-iron
cluster, Methods Enzymol 243 (1994) 216-240.
[87] K.R. Hazlett, D.L. Cox, R.A. Sikkink, F. Auch'ere, F. Rusnak, J.D. Radolf,
Contribution of neelaredoxin to oxygen tolerance by Treponema pallidum, Methods
Enzymol 353 (2002) 140-156.
[88] T. Santos-Silva, J. Trincao, A.L. Carvalho, C. Bonifacio, F. Auchere, I. Moura,
J.J. Moura, M.J. Romao, Superoxide reductase from the syphilis spirochete
Treponema pallidum: crystallization and structure determination using soft X-rays,
Acta Crystallogr Sect F Struct Biol Cryst Commun 61 (2005) 967-970.
[89] A.V. Coelho, P. Matias, V. Fulop, A. Thompson, A. Gonzalez, M.A. Carrondo,
Desulfoferrodoxin Structure Determined by MAD Phasing and Refinement to 1.9
Angstroms Resolution Reveals a Unique Combination of a Tetrahedral Fes4 Centre
with a Square Pyramidal Fesn4 Centre, J.Biol.Inorg.Chem. 2 (1997) 680-689.
[90] V. Niviere, M. Lombard, M. Fontecave, C. Houee-Levin, Pulse radiolysis studies
on superoxide reductase from Treponema pallidum, FEBS Lett 497 (2001) 171-173.
[91] M. Lombard, C. Houee-Levin, D. Touati, M. Fontecave, V. Niviere, Superoxide
reductase from Desulfoarculus baarsii: reaction mechanism and role of glutamate 47
and lysine 48 in catalysis, Biochemistry 40 (2001) 5032-5040.
[92] V. Niviere, M. Asso, C.O. Weill, M. Lombard, B. Guigliarelli, V. Favaudon, C.
Houee-Levin, Superoxide reductase from Desulfoarculus baarsii: identification of
protonation steps in the enzymatic mechanism, Biochemistry 43 (2004) 808-818.
[93] J.P. Emerson, E.R. Farquhar, L. Que, Jr., Structural "snapshots" along reaction
pathways of non-heme iron enzymes, Angew Chem Int Ed Engl 46 (2007) 8553-
8556.

Chapter I
35
[94] J.V. Rodrigues, I.A. Abreu, D. Cabelli, M. Teixeira, Superoxide reduction
mechanism of Archaeoglobus fulgidus one-iron superoxide reductase, Biochemistry
45 (2006) 9266-9278.
[95] J.P. Emerson, D.E. Cabelli, D.M. Kurtz, Jr., An engineered two-iron superoxide
reductase lacking the [Fe(SCys)4] site retains its catalytic properties in vitro and in
vivo, Proc Natl Acad Sci U S A 100 (2003) 3802-3807.
[96] W. Lovenberg, B.E. Sobel, Rubredoxin: a new electron transfer protein from
Clostridium pasteurianum, Proc Natl Acad Sci U S A 54 (1965) 193-199.
[97] F. Bonomi, S. Iametti, P. Ferranti, D.M. Kurtz, Jr., A. Morleo, E.M. Ragg, "Iron
priming" guides folding of denatured aporubredoxins, J Biol Inorg Chem (2008).
[98] M. Frey, L. Sieker, F. Payan, R. Haser, M. Bruschi, G. Pepe, J. LeGall,
Rubredoxin from Desulfovibrio gigas. A molecular model of the oxidized form at 1.4 A
resolution, J Mol Biol 197 (1987) 525-541.
[99] E.T. Adman, L.C. Sieker, L.H. Jensen, M. Bruschi, J. Le Gall, A structural model
of rubredoxin from Desulfovibrio vulgaris at 2 A resolution, J Mol Biol 112 (1977) 113-
120.
[100] M. Bruschi, Non-heme iron proteins. The amino acid sequence of rubredoxin
from Desulfovibrio vulgaris, Biochim Biophys Acta 434 (1976) 4-17.
[101] E.J. Laishley, J. Travis, H.D. Peck, Jr., Amino acid composition of ferredoxin
and rubredoxin isolated from Desulfovibrio gigas, J Bacteriol 98 (1969) 302-303.
[102] W. Lovenberg, W.M. Williams, Further observations on the chemical nature of
rubredoxin from Clostridium pasteurianum, Biochemistry 8 (1969) 141-148.
[103] J.A. Peterson, M.J. Coon, Enzymatic omega-oxidation. 3. Purification and
properties of rubredoxin, a component of the omega-hydroxylation system of
Pseudomonas oleovorans, J Biol Chem 243 (1968) 329-334.

Structural and Mechanistic Studies of Iron Containing Proteins
36
[104] J. Le Gall, [Partial purification and study of NAD:rubredoxin oxidoreductase
from D. gigas], Ann Inst Pasteur (Paris) 114 (1968) 109-115.
[105] J.A. Peterson, M. Kusunose, E. Kusunose, M.J. Coon, Enzymatic omega-
oxidation. II. Function of rubredoxin as the electron carrier in omega-hydroxylation, J
Biol Chem 242 (1967) 4334-4340.
[106] M.J. Brumlik, G. Voordouw, Analysis of the transcriptional unit encoding the
genes for rubredoxin (rub) and a putative rubredoxin oxidoreductase (rbo) in
Desulfovibrio vulgaris Hildenborough, J Bacteriol 171 (1989) 4996-5004.
[107] F. Auchere, S.R. Pauleta, P. Tavares, I. Moura, J.J. Moura, Kinetics studies of
the superoxide-mediated electron transfer reactions between rubredoxin-type
proteins and superoxide reductases, J Biol Inorg Chem 11 (2006) 433-444.
[108] J.V. Rodrigues, I.A. Abreu, L.M. Saraiva, M. Teixeira, Rubredoxin acts as an
electron donor for neelaredoxin in Archaeoglobus fulgidus, Biochem Biophys Res
Commun 329 (2005) 1300-1305.
[109] F. Auchere, R. Sikkink, C. Cordas, P. Raleiras, P. Tavares, I. Moura, J.J.
Moura, Overexpression and purification of Treponema pallidum rubredoxin; kinetic
evidence for a superoxide-mediated electron transfer with the superoxide reductase
neelaredoxin, J Biol Inorg Chem 9 (2004) 839-849.
[110] B.J. Henriques, L.M. Saraiva, C.M. Gomes, Combined spectroscopic and
calorimetric characterisation of rubredoxin reversible thermal transition, J Biol Inorg
Chem 11 (2006) 73-81.
[111] B.J. Henriques, L.M. Saraiva, C.M. Gomes, Probing the mechanism of
rubredoxin thermal unfolding in the absence of salt bridges by temperature jump
experiments, Biochem Biophys Res Commun 333 (2005) 839-844.
Chapter II
37
19 ms
10 s
Structural and mechanistic features of Ferritin from Desulfovibrio vulgaris
Hildenborough

Structural and Mechanistic Studies of Iron Containing Proteins
38
Index
Chapter II Structural and mechanistic features of Ferritin from Desulfovibrio vulgaris
Hildenborough
II.1 – Overview 39
II.2. – Experimental 40
II.2.1 – Dv Ferritin, overexpression and isolation 40
II.2.2 – Stopped-Flow and Rapid Freeze-Quench EPR and Mössbauer
studies of pre-loaded wild type ferritin and E130A mutant 40
II.2.2.1 - Rapid Freeze-Quench EPR and Mössbauer studies 40
II.2.2.2 – Stopped-Flow studies 50
II.3 – Discussion 65
II.4 – References 68

Chapter II
39
II.1 – Overview
As described up to this point, organisms such as anaerobic bacteria occasionally
have to deal with the presence of toxic compounds, like molecular oxygen or ROS.
Thus, over the years, evolution favored bacteria like D. vulgaris Hildenborough, which
use mechanisms that, together or on their own, are able to deal with those threats.
Bacterial ferritin is going to be the first enzyme implicated in such mechanism
described on this thesis.
Since this is a very complex subject, the main goal of this chapter is to present, in
general, the results obtained until now concerning the capture and characterization of
reaction intermediates, using fast kinetic techniques like stopped-flow (coupled with
UV-Vis) and rapid freeze-quench (coupled with EPR and Mössbauer spectroscopy).
The experiments were performed with both the wild type protein and with a mutant
protein, E130A. In this mutant, the glutamic acid at position 130 is substituted by an
alanine. This mutation was designed to eliminate the third iron site that is thought to
be present in this protein[1, 2]. The mechanistic changes due to this mutation will be
discussed.
Figure II. 1 – A) Ferroxidase center of human H-chain ferritin. B) Ferroxidase center
of E. coli FtnA. The glutamic acid at position 130 is marked in red. Adapted from [3].
A) B)

Structural and Mechanistic Studies of Iron Containing Proteins
40
II.2 – Experimental
II.2.1 – Dv Ferritin, overexpression and isolation
Both forms of recombinant ferritin, wild type (Ftn) and mutant (E130A), from
Desulfovibrio vulgaris Hildenborough used in this work were cloned, overexpressed
and isolated in our laboratory by Duarte and Guilherme[4]. All the protein samples
that were used were analyzed for the iron content and purity. All samples contained
less than 3 Fe/protein (data obtained by induced coupled plasma emission).
II.2.2 – Stopped-Flow and Rapid Freeze-Quench EPR and Mössbauer studies of pre-
loaded wild type ferritin and E130A mutant
Two batches of protein, Ftn and E130A, were anaerobically incubated with a correct
amount of a FeSO4 solution in order to obtain a final ratio of 62 iron/protein. Each of
these solutions was then mixed with an equal volume of an oxygen saturated buffer
solution at 4 ºC and, depending on the experimental method, reactions were followed
by EPR, Mössbauer or UV-Visible spectroscopies. At this temperature, it was
expected to obtain a saturation of 1.2 mM O2 in the buffer solution. Since oxygen is
one of the reagents, it was important to have a concentration that ensures that it was
not limiting. All these assays were performed at pH 7.6 in 200 mM Tris-HCl and
200 mM NaCl at pH 7.6.
II.2.2.1 - Rapid Freeze-Quench EPR and Mössbauer studies
The experimental setup and the procedures used in this work were identical to the
previously described by Ravi and coworkers and consist of a set of drive syringes
controlled by a Ram Unit and a home-built quenching bath. The bath holds liquid
isopentane which is cooled and maintained at -140 ºC by liquid nitrogen and a
precision temperature controller[5].

Chapter II
41
The RFQ procedure involves mixing two reactants rapidly and efficiently through a
mixing chamber, allowing the reaction to proceed for a specific period of time,
ranging from 19 ms to 1h and 30 min, freeze-quenching the reaction mixture by
squirting it into the quenching bath containing isopentane at -140 ºC, and packing the
frozen ice crystals of the reaction mixture through a sample-collecting apparatus into
a Mössbauer sample cell. The different reaction times are controlled by the length,
and diameter, of the aging hose as well as flow rate. For example, for a flow rate of
0.833 mL/s a hose with a cross-sectional area of 0.00203 cm2 and a length of 40.7
cm one obtains a 100 ms reaction time[5-7].
As mentioned before, these experiments were carried out at 4 ºC. To accomplish this
experimental request, both drive syringes and aging hoses were submerged in a
temperature controlled water bath.
Mössbauer measurements were carried out at 4.2 K with an applied magnetic field
parallel to the γ radiation beam either in a weak-field Mössbauer spectrometer or on a
strong-field Mössbauer spectrometer. Both spectrometers were operated in a
constant acceleration mode and the zero velocity of the Mössbauer spectra refers to
the centroid of the room temperature spectrum of a metallic iron foil. The Mössbauer
spectra analysis was performed using WMOSS software (WEB Research).
The experimental procedure used for the RFQ EPR experiments was similar to the
one described for the RFQ Mössbauer. In this case, the samples were packed into an
EPR tube instead.
EPR measurements were carried out at 12 K. The obtained spectra were converted
with Condor software and analyzed with WinEPR and SimFonia (Bruker).

Structural and Mechanistic Studies of Iron Containing Proteins
42
Figure II. 2 - Time dependent Mössbauer spectra of the reaction of Dv ferritin,
62 irons/protein, with O2-saturated buffer. The solid lines over the experimental data
are simulations of a sum of a ferrous species, a peroxodiferric species and a ferric
species. The Mössbauer spectra were recorded at 4.2 K in the presence of a weak
magnetic field of 500 G parallel to the γ radiation beam.
19 ms
1 h 30 min
1 s
205 ms
87 ms
34 ms

Chapter II
43
Figure II. 3 - Time dependent Mössbauer spectra of the reaction of Dv ferritin,
62 irons/protein, with O2-saturated buffer. The Mössbauer spectra were recorded at
4.2 K in the presence of a strong magnetic field of 80 kG parallel to the γ radiation
beam.
From the data analysis of both weak-field and strong-field Mössbauer spectra it was
possible to detect the formation of two intermediate species between the initial
ferrous species and the final young mineral core. One is a peroxodiferric species with
parameters, ΔEQ = 1.11 mm/s and δ = 0.58 mm/s, which are characteristic of this
type of complexes and similar to the previously published in other diiron enzymes[8,
19 ms
1 h 30 min
1 s
87 ms

Structural and Mechanistic Studies of Iron Containing Proteins
44
9]. The other is a mixed-valence species (Fe2+-Fe3+) with parameters,
ΔEQ = -1.03 mm/s and δ = 0.51 corresponding to a Fe3+ site (S=5/2) and
ΔEQ = 2.25 mm/s and δ = 1.16 corresponding to a Fe2+ site (S=2). The parameters
calculated for the ferric species, ΔEQ = 0.69 mm/s and δ = 0.50 mm/s, can represent
a fast relaxation young core. The ferrous components with parameters
ΔEQ = 3.35 mm/s and δ = 1.25 mm/s for doublet I and ΔEQ = 2.72 mm/s and
δ = 1.20 mm/s for doublet II, correspond to the not-yet-reacted Fe2+. All the
parameters calculated for the Mössbauer spectra are summarized in the next tables.
Table II. 1 - Mössbauer parameters of ferrous species, peroxodiferric species and
ferric species at weak magnetic field
Ferrous species
Doublet I Doublet II
Peroxodiferric
species Ferric species
δ (mm/s) 1.25 ± 0.04 1.20 ± 0.03 0.58 ± 0.03 0.50 ± 0.03
ΔEQ (mm/s) 3.35 ± 0.03 2.72 ± 0.03 1.11 ± 0.03 0.69 ± 0.04
Γ (G) -0.45/-0.45 0.35/0.45 0.35/0.35 0.40/0.40
Table II. 2 - Mössbauer parameters of the mixed-valence species
Fe3+ site Fe2+ site
δ (mm/s) 0.51 ± 0.03 1.16 ± 0.03
ΔEQ (mm/s) –1.03 ± 0.03 2.25 ± 0.03
η 1.0 0
A/gNβN (G) (–458, –531, –560) (299, 203, 188)
Γ (G) 0.5 0.5
g-values 1.95, 1.82, 1.82

Chapter II
45
Table II. 3 - Mössbauer percentage of the total Fe absorption of the different species
at various reaction times
time Ferrous
species
Peroxodiferric
species
Ferric
species
Mixed-
valence
Young
mineral core
19 ms 47 23 19 11 0
34 ms 46 21 20 13 0
87 ms 36 19 22 23 0
205 ms 21 13 20 27 19
1 s 22 11 14 36 17
Given the information obtained from the above data, it was expected to identify the
formation of a mixed-valence species in the EPR experiments. However, no mixed-
valence species were identified. This fact can be associated to a possible light
sensitivity of this mixed-valence species.
The formation of a radical species was identified instead. This species is similar to
the previously identified as a tyrosyl radical in other diiron proteins such as RNR-
R2[5, 10-12]. According to the samples studied, the tyrosyl radical is already formed
at 19 ms and increases its signal until 1 s reaction time. Because this is an ongoing
project, there is insufficient data to calculate formation and decay rates. Thus, it is
difficult to predict the role of this species in the catalytic mechanism in study.

Structural and Mechanistic Studies of Iron Containing Proteins
46
Figure II. 4 - Time dependent EPR spectra of the reaction of Dv ferritin with
O2-saturated buffer. The experimental conditions used were: temperature 12 K;
microwave frequency 9.656 GHz; microwave power 2 mW; modulation amplitude
5 mT; receiver gain 1.26 x 10⁵ and attenuation of 30 dB.
From the data analysis of both weak-field (figure II.5) and strong-field (figure II.6)
Mössbauer spectra of E130A mutant samples, it was possible to detect the formation
of only one intermediate species between the initial ferrous species and the final
young mineral core. The calculated parameters point to a peroxodiferric species with,
ΔEQ = 1.11 mm/s and δ = 0.58 mm/s. These values are similar to the ones calculated
for Ftn meaning that they are also similar to the previously published in other diiron
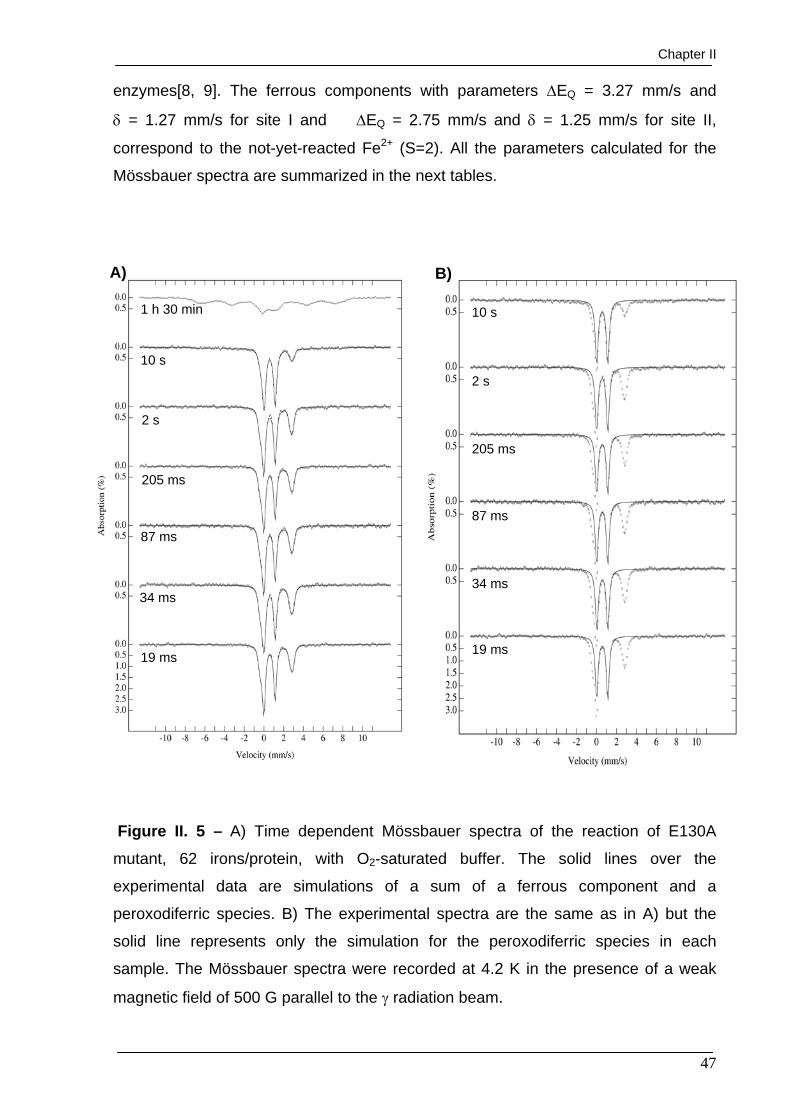
Chapter II
47
enzymes[8, 9]. The ferrous components with parameters ΔEQ = 3.27 mm/s and
δ = 1.27 mm/s for site I and ΔEQ = 2.75 mm/s and δ = 1.25 mm/s for site II,
correspond to the not-yet-reacted Fe2+ (S=2). All the parameters calculated for the
Mössbauer spectra are summarized in the next tables.
Figure II. 5 – A) Time dependent Mössbauer spectra of the reaction of E130A
mutant, 62 irons/protein, with O2-saturated buffer. The solid lines over the
experimental data are simulations of a sum of a ferrous component and a
peroxodiferric species. B) The experimental spectra are the same as in A) but the
solid line represents only the simulation for the peroxodiferric species in each
sample. The Mössbauer spectra were recorded at 4.2 K in the presence of a weak
magnetic field of 500 G parallel to the γ radiation beam.
A) B)
19 ms
34 ms
87 ms
205 ms
2 s
10 s
1 h 30 min
19 ms
10 s
34 ms
87 ms
205 ms
2 s

Structural and Mechanistic Studies of Iron Containing Proteins
48
Figure II. 6 - Time dependent Mössbauer spectra of the reaction of E130A mutant
with O2-saturated buffer. The solid lines over the experimental data are simulations of
the peroxodiferric species present in each sample. The Mössbauer spectra were
recorded at 4.2 K in the presence of a strong magnetic field of 80 kG parallel to the γ
radiation beam.
Table II. 4 - Mössbauer parameters of ferrous and peroxodiferric species
Ferrous Peroxodiferric
Weak field
Site I Site II Weak field Strong field
δ (mm/s) 1.27 ± 0.03 1.25 ± 0.03 0.58 ± 0.03 0.57 ± 0.03
ΔEQ (mm/s) 3.27 ± 0.03 2.75 ± 0.03 1.11 ± 0.03 1.13 ± 0.03
η – – – 0.96
Width (G) -0.44/-0.42 0.35/0.45 0.34 0.40
19 ms
10 s

Chapter II
49
Table II. 5 – Mössbauer percentage of the total Fe absorption of the different species
at various reaction times
time Ferrous Peroxodiferric Core
19 ms 42 58 0
34 ms 45 55 0
87 ms 41 59 0
205 ms 39 61 0
2 s 38 62 0
10 s 19 61 20
1 h 30 min 0 <5.0 95-100
Contrary to the data obtained in the RFQ EPR studies performed with Ftn, the
experiments with the E130A mutant didn’t reveal any paramagnetic features in the
EPR spectra. In a certain way this is in accordance with the absence of mixed-
valence species detection in the Mössbauer spectra. Considering that, in this case,
only the peroxodiferric species was observed besides the ferrous species and the
mineral core it is possible to assume, in a first approach, that the glutamic acid 130 is
directly related to the catalytic mechanism of the enzyme, preventing the formation of
mixed-valence and tyrosyl radical species. On the other hand, it was observed that
this mutation does not affect the formation of mineral core. Another difference is the
formation and decay profile of the peroxodiferric species that, in this case, is
somehow stabilized.

Structural and Mechanistic Studies of Iron Containing Proteins
50
II.2.2.2 – Stopped-Flow studies
In order to have parallel UV-Vis data for these experiments, a similar study was
performed by stopped-flow, coupled to a diode array spectrophotometer. In this case
the entire procedure was performed anaerobically inside a glove box (UniLab from
mBraun) (see Appendix B). The protein solutions were degassed in a Schlenk line
before being introduced inside the glove box. The results were used to compare to
the data obtained from the RFQ EPR and Mössbauer.
Figure II. 7 - 2D Spectral evolution of Fe2+ incorporation in ferritin. The assay was
performed to a final concentration of 25 μM Ftn and 62 Fe/protein at pH 7.6 in
200 mM Tris-HCl plus 200 mM NaCl. The arrow points to the 412 nm peak.
As mentioned before, due to its complexity this project is still under study. However, it
is possible to point out some experimental observations that, together with the data
obtained by Mössbauer spectroscopy and EPR spectroscopy, can lead to a few
preliminary conclusions. Thus, from the 2D spectra obtained from the stopped-flow

Chapter II
51
experiment it is possible to identify the appearance of two features, a broad peak with
maximum absorbance at 580 nm, and a sharp peak with maximum absorbance at
412 nm. Together with the information obtained from Mössbauer spectroscopy, it is
possible to assume that the band around 580 nm can be due to the formation of a
peroxodiferric species, similar to the described for other diiron proteins[9, 13, 14]. On
the other hand, the sharp band with maximum at 412 nm resembles the tyrosyl
radical species previously described by Bollinger and coworkers, for the RNR-R2
mechanism[8, 11, 15, 16]. This band can be also related to the radical species
observed in the EPR spectra of the RFQ parallel samples.
Figure II. 8 - 3D Spectral evolution of Fe2+ incorporation in ferritin. The assay was
performed to a final concentration of 25 μM Ftn and 62 Fe/protein at pH 7.6 in
200 mM Tris-HCl plus 200 mM NaCl.

Structural and Mechanistic Studies of Iron Containing Proteins
52
For an improved analysis, the data was collected in 3D mode. Thus, a special
software, SPECFIT© (from Spectrum Software Associates), was used to in order to fit
the original 3D data and calculate a reaction mechanism model where all
wavelengths contribute to the kinetic constants calculation. Another advantage of this
software is its ability to isolate the spectra of all intermediate species present in the
reaction.
In order to fit the experimental data a set of different kinetic mechanisms were used.
The best results were obtained when a four consecutive exponential model was
applied. Each of these exponentials corresponds to a first order rate constant
according to Eq. II.1.
Eq. II.1
In this model A corresponds to a species, with no visible spectrum, where the ferrous
iron is possibly attached to the protein, B corresponds to the peroxodiferric species,
C corresponds to the tyrosyl radical, D corresponds to an unidentified reaction
intermediate and E corresponds to the young mineral core. The formation of B was
determined to be a very fast process, impossible to detect with this technique. Thus,
only k2, k3 and k4 were calculated and determined to be (222 ± 2) s-1, (20.6± 0.1) s-1
and 0.02 s-1, respectively.
A B C D Ek1 k4 k3 k2

Chapter II
53
Figure II. 9 – Kinetic trace recorded at 412 nm of a 1:1 mixture (v/v) of 50 μM Ftn
incubated anaerobically with FeSO4 to a final ratio of 62 Fe/protein at pH 7.6 in
200 mM Tris-HCl plus 200mM NaCl. The green line represents the values obtained
from the fit of the theoretical model to the experimental data.

Structural and Mechanistic Studies of Iron Containing Proteins
54
Figure II. 10 - Kinetic trace recorded at 581 nm of a mixture 1:1 (v/v) of 50 μM Ftn
incubated anaerobically with FeSO4 to a final ratio of 62 Fe/protein at pH 7.6 in
200 mM Tris-HCl plus 200mM NaCl. The green line represents the values obtained
from the fit of the theoretical model to the experimental data.
From the two examples presented above (figure II.9 and figure II.10) it is possible to
assume that the model applied is a good fit for the experimental data. This model
also makes possible the spectral deconvolution of each species. To do that, the
concentration of each species is calculated along the experimental time based on the
respective extinction coefficients.

Chapter II
55
Figure II. 11 – Simulated species evolution through time of a 1:1 mixture (v/v) of
50 μM Ftn incubated anaerobically with FeSO4 to a final ratio of 62 Fe/protein at
pH 7.6 and 200 mM Tris-HCl plus 200 mM NaCl. Red line corresponds to B species
(peroxodiferric), green line corresponds to C species (tyrosyl radical), pink line
corresponds to D species and orange line corresponds to E species (young mineral
core).
In accordance with the described above, figure II. 11 also shows that, in the
experimental timescale, the peroxodiferric was already formed and is the first
observable species, followed by the formation of the tyrosyl radical. These two
species present distinct visible spectra, as showed in figure II.12. With the exception
of the tyrosyl radical, the spectral properties of the observable species are very
similar to the ones previously described by Bou-Abdallah and coworkers for the
Human H-chain ferritin[17].

Structural and Mechanistic Studies of Iron Containing Proteins
56
Figure II. 12 – Visible spectra obtained for each species isolated according to the
kinetic model applied. Light gray stands for the peroxodiferric species, gray for tyrosyl
radical species (B and C in the proposed mechanism, respectively), dark gray for D
species and black for young mineral core (E in the proposed mechanism). These
species were obtained from a 1:1 mixture (v/v) of 50 μM Ftn incubated anaerobically
with FeSO4 to a final ratio of 62 Fe/protein at pH 7.6 in 200 mM Tris-HCl plus
200 mM NaCl.
When the stopped-flow data was compared to the quantifications obtained from
Mössbauer spectroscopy (figure II.13) it was possible to observe that the
peroxodiferric species decay was superimposable to the 412 nm kinetic trace. This is
a strange behaviour because the absorbance at 412 nm was attributed to the
formation of a radical species and from the stopped-flow data the peroxodiferric
species is formed before the tyrosyl radical. This aspect is still under study.
0.0
0.2
0.4
0.6
380 580 780 980Wavelength (nm)
Abs
orba
nce

Chapter II
57
Figure II. 13 – Normalized absorbance at 412 nm superimposed with percentages
obtained from the Mössbauer spectra for peroxodiferric species.
In order to compare the behaviour of Ftn versus the E130A mutant, the same set of
experiments (in similar experimental conditions) was performed. The results will,
hopefully, help to understand the existence and functionality of the third iron site in
this ferritin.
0.0
0.1
0.2
0.3
0.001 0.01 0.1 1 10 100 1000
Time (s)
Nor
mal
ized
abs
orba
nce
0
10
20
30%
Peroxo
Abs 412 nmPeroxo

Structural and Mechanistic Studies of Iron Containing Proteins
58
Figure II. 14 - 2D Spectral evolution of Fe2+ incorporation in E130A mutant. The
assay was performed to a final concentration of 28 μM E130A and 62 Fe/protein at
pH 7.6 in 200 mM Tris-HCl plus 200 mM NaCl.
Contrary to the observed in the wt protein, in the E130A mutant only the formation of
a broad peak with maximum near 580 nm is observed. Like in Ftn, this feature is
related to the formation of a peroxodiferric species, similar to the ones described for
other diiron proteins[9, 13, 14]. The lack of the absorption band at 412 nm could also
mean that, in this case, no tyrosyl radical is formed during the ferroxidatic process.
This fact is consistent with the absence of paramagnetic species in the EPR spectra
of parallel samples. Considering that experimental conditions were the same in both
cases, it is also clear that in this case the peroxodiferric intermediate is again
stabilized.

Chapter II
59
Figure II. 15 - 3D Spectral evolution of Fe2+ incorporation in E130A mutant. The
assay was performed to a final concentration of 28 μM E130A and 62 Fe/protein at
pH 7.6 in 200 mM Tris-HCl plus 200 mM NaCl.
Since there is no structural information about the influence of the mutation it is not
possible to associate the observed differences to the lack of the third site.
Nevertheless, by direct comparison with the wild type protein, this mutation clearly
changes the enzymatic mechanism of this protein.
In accordance with the observable differences, the global analysis also raises
another difference. In this case a different model was applied in order to get a good
fit to the experimental data. Contrary to what was used for Ftn, a three consecutive
exponential model was used to fit the experimental data of E130A mutant.
Eq. II.2 A B C D
k1 k3 k2

Structural and Mechanistic Studies of Iron Containing Proteins
60
In this model, A corresponds to a species (with no visible spectrum) where the
ferrous iron is possibly attached to the protein, B and C are very similar
spectroscopically and probably correspond to two different peroxodiferric species and
D is the iron core. The assumption of two different peroxodiferric species was based
on the fact that they have different visible spectra (figure II.18) and the kinetic data
cannot be fitted assuming only one peroxodiferric species. This difference is not
observable in the Mössbauer spectroscopy data. Contrary to Ftn, it was possible to
calculate all the kinetic rate constants. Thus, k1, k2 and k3 were calculated and
determined to be (180 ± 1) s-1, (3.18 ± 0.02) s-1 and 0.004 s-1, respectively.
Figure II. 16 – Kinetic trace recorded at 575 nm of a 1:1 mixture (v/v) of 56 μM
E130A mutant incubated anaerobically with FeSO4 to a final ratio of 62 Fe/protein at
pH 7.6 in 200 mM Tris-HCl plus 200 mM NaCl. The green line represents the values
obtained from the fit of the theoretical model to the experimental data.

Chapter II
61
Figure II.16 illustrates the fit between the theoretical model and the experimental
data. The following table resumes the values obtained for the kinetic rate constants.
Table II. 6 – Kinetic rate constants calculated from the fit of the stopped-flow data
k (s-1) Protein
k1 k2 k3 k4
Ftn n.d. 222 ± 2 20.6 ± 0.1 0.02 ± 0.00
E130A 180 ± 1 3.18 ± 0.02 0.004 ± 0.00 -
Figure II. 17 - Species evolution in time of a 1:1 mixture (v/v) of 56 μM E130A mutant
incubated anaerobically with FeSO4 to a final ratio of 62 Fe/protein at pH 7.6 in
200 mM Tris-HCl plus 200mM NaCl. Red line corresponds to A species, green line
corresponds to B species (peroxodiferric), pink line corresponds to C species
(peroxodiferric) and orange line corresponds to D species (young mineral core).

Structural and Mechanistic Studies of Iron Containing Proteins
62
Figure II.17 shows that a peroxodiferric species is the first one to be formed and is
followed by the formation of a second peroxodiferric species. They are both more
stable than the equivalent species in the wt protein leading, in this case, to a slower
reaction.
Figure II. 18 - Visible spectra obtained for each species isolated according the kinetic
model applied. Light gray stands for the peroxodiferric species, gray for the second
peroxodiferric species (B and C in the proposed mechanism, respectively), black for
young mineral core (D in the proposed mechanism). These species were obtained
from a 1:1 mixture (v/v) of 56 μM E130A incubated anaerobically with FeSO4 to a
final ratio of 62 Fe/protein at pH 7.6 in 200 mM Tris-HCl plus 200mM NaCl.
0.0
0.1
0.2
0.3
0.4
380 580 780 980Wavelength (nm)
Abs
orba
nce
120 ms15 s180 s

Chapter II
63
In Figure II.19 the kinetic trace recorded at 575 nm is superimposed with the
percentages obtained from the Mössbauer spectra for the peroxodiferric species.
This figure proves, as expected, that the formation and decay profiles are identical in
both techniques. Using this information it was also possible to calculate the extinction
coefficient for the peroxodiferric species in this protein. Thus, it was determined to be
ε575 ≈ 1600 M-1.cm-1. A comparison between the extinction coefficients of some
peroxodiferric species is presented in table II.7.
Figure II. 19 - Normalized absorbance at 575 nm superimposed with percentages
obtained from the Mössbauer spectra for peroxodiferric species.
0.3
0.4
0.5
0.6
0.7
0.001 0.01 0.1 1 10 100 1000
Time (s)
Nor
mal
ized
abs
orba
nce
30
40
50
60
70
% Peroxo
Abs 575 nmPeroxo

Structural and Mechanistic Studies of Iron Containing Proteins
64
Table II. 7 – Extinction coefficient values published for different peroxodiferric
species[18]. The values for E130A are the ones obtained in this work.
Protein λ (nm) ε (M-1.cm-1)
E130A 575 ≈ 1600
Frog M ferritin 650 ≈ 1000
Methylococcus capsulatus MMO 700 ≈ 1800
RNR-R2 mutants 700 ≈ 1500
Δ9 Desaturase 700 ≈ 1200

Chapter II
65
II.3 – Discussion
Even though this is a complex and still ongoing project, it is possible to highlight
some experimental evidence obtained in this work. One of the main goals was the
characterization of the enzymatic mechanism of this protein, as well as the
physiological relevance of the putative third iron site.
The experiments performed with the wt protein revealed some common features with
other diiron proteins, such as the formation of a peroxodiferric species, a tyrosyl
radical and mixed-valence intermediates [5, 6, 10-12, 18-20]. The absence of
formation of both tyrosyl radical and mixed-valence species in the E130A mutant may
indicate that the third iron site is directly involved in the catalytic mechanism,
probably as a complementary electron pathway to the binuclear iron center. Like in
ferritin A from E. coli (FtnA), this additional (third) iron site can confer a biological
advantage to the cell since it may enable the complete reduction of oxygen to water,
avoiding the formation of ROS like hydrogen peroxide[21].
Another observed difference between the two proteins was the rate of iron oxidation,
corroborated by the distinct kinetic rate constants calculated for both proteins. The wt
protein was shown to perform a faster iron oxidation. In accordance with this
observation, the peroxodiferric intermediates formed in the E130A mutant are in
some way stabilized, leading to a slower process.
From the direct observation of the data obtained by EPR spectroscopy it was
possible to conclude that only the wt protein produces paramagnetic species. This
species is spectroscopically similar to the tyrosyl radical species previously described
for RNR-R2 [8, 11, 12, 15, 16]. The absence of a detectable mixed-valence species
(identified by Mössbauer spectroscopy) can be explained with a possible light
sensitivity of this species, meaning that, in this case, the energy received by the
protein when exposed to light was enough to promote the decay of the mixed-
valence species. On the other hand, the E130A mutant does not produce any EPR-
active species, which is in accordance with the absence of mixed-valence species in
the Mössbauer spectra and a tyrosyl radical in visible spectra.
The data collected from Mössbauer spectroscopy also revealed differences between
the Ftn and E130A forms. The spectra collected for the E130A mutant only show one

Structural and Mechanistic Studies of Iron Containing Proteins
66
intermediate species (peroxodiferric), and the initial high-spin ferrous (S=2) and the
final product, young mineral core. Besides these species, the Ftn Mössbauer spectra
shows additional paramagnetic species, such as the mixed-valence, with parameters
characteristic of a high-spin ferrous (S=2) coupled to a high-spin ferric (S=5/2),
typical of a dinuclear iron cluster mixed-valence form.
The different behavior of these two protein forms is also demonstrated in the visible
spectroscopy data obtained in the stopped-flow experiments. The kinetic models
used for both wt and mutant proteins also provided information about the possible
catalytic relevance of the third site. For the wt protein a four consecutive steps model
was applied, meaning that the catalytic activity of this protein generates, at least,
three intermediate species (with clear changes in the visible spectrum).
Furthermore, this model not only proved to be a good approach to the experimental
data but also helped to isolate the visible spectrum of each species formed. The
isolated spectra are in accordance with the previously published for other diiron
proteins, meaning that the intermediate species formed in this case are
spectroscopicaly similar [17].
The experimental data obtained for the E130A mutant can be fitted with a three
consecutive step model, meaning that in this case only two intermediate species are
observed. These intermediate species have similar visible spectra, resembling a
peroxodiferric species, like the ones observed for the wt and for other diiron proteins.
The formation of this peroxodiferric intermediate is, in this case, in good agreement
with the percentages calculated based on the Mössbauer spectra for that species.
Thus, the absence (or simply the structural change promoted by the mutation) of the
third iron site in this protein appears to be related to the observed mechanistic
changes, including the absence of formation of some intermediate species such as
the tyrosyl radical, mixed-valence and the stability of the peroxodiferric species.
This may also indicate that these intermediate species are formed between the third
iron site and one of the others that form the usual binuclear iron site. Hence, even
though we do not have information concerning the structural changes in E130A, it is
possible to assume that the mutated amino acid acts like a bridge between the
binuclear iron site and the third iron site, making possible their interaction as well as

Chapter II
67
the formation reactive species such as the tyrosyl radical and the mixed-valence
species.
Therefore, the existence of this third iron site can be relevant from the biological point
of view if we consider that, since the protein has more iron sites, it can promote the
incorporation of not only more iron ions but also more molecular oxygen per protein
monomer, raising the efficiency of the enzyme when compared to others that only
have two iron sites.
This is a very important fact considering that this protein is expressed in an anaerobe
organism and therefore it can be useful both as an iron storage protein and an
oxygen tolerance protein.

Structural and Mechanistic Studies of Iron Containing Proteins
68
II.4 – References
[1] F. Bou-Abdallah, M.R. Woodhall, A. Velazquez-Campoy, S.C. Andrews, N.D.
Chasteen, Thermodynamic analysis of ferrous ion binding to Escherichia coli ferritin
EcFtnA, Biochemistry 44 (2005) 13837-13846.
[2] T.J. Stillman, P.D. Hempstead, P.J. Artymiuk, S.C. Andrews, A.J. Hudson, A.
Treffry, J.R. Guest, P.M. Harrison, The high-resolution X-ray crystallographic
structure of the ferritin (EcFtnA) of Escherichia coli; comparison with human H ferritin
(HuHF) and the structures of the Fe(3+) and Zn(2+) derivatives, J Mol Biol 307 (2001) 587-603.
[3] A. Lewin, G.R. Moore, N.E. Le Brun, Formation of protein-coated iron minerals,
Dalton Trans (2005) 3597-3610.
[4] A.G. Duarte, Biomineralização em bactérias Anaerobias. Caracterização de
intermediários Catalíticos, Dep. Química, Universidade Nova de Lisboa, Lisboa,
2007.
[5] N. Ravi, J.M. Bollinger, B.H. Huynh, D.E. Edmondson, J. Stubbe, Mechanism of
Assembly of the Tyrosyl Radical-Diiron(Iii) Cofactor of Escherichia-Coli
Ribonucleotide Reductase .1. Mossbauer Characterization of the Diferric Radical
Precursor, Journal of the American Chemical Society 116 (1994) 8007-8014.
[6] J.M. Bollinger, Jr., W.H. Tong, N. Ravi, B.H. Huynh, D.E. Edmondson, J.A.
Stubbe, Use of rapid kinetics methods to study the assembly of the diferric-tyrosyl
radical cofactor of E. coli ribonucleotide reductase, Methods Enzymol 258 (1995)
278-303.
[7] L.J. Murray, S.G. Naik, D.O. Ortillo, R. Garcia-Serres, J.K. Lee, B.H. Huynh, S.J.
Lippard, Characterization of the arene-oxidizing intermediate in ToMOH as a
diiron(III) species, Journal of the American Chemical Society 129 (2007) 14500-
14510.
[8] D. Yun, R. Garcia-Serres, B.M. Chicalese, Y.H. An, B.H. Huynh, J.M. Bollinger,
Jr., (Mu-1,2-peroxo)diiron(III/III) complex as a precursor to the diiron(III/IV)

Chapter II
69
intermediate X in the assembly of the iron-radical cofactor of ribonucleotide reductase
from mouse, Biochemistry 46 (2007) 1925-1932.
[9] A.S. Pereira, W. Small, C. Krebs, P. Tavares, D.E. Edmondson, E.C. Theil, B.H.
Huynh, Direct spectroscopic and kinetic evidence for the involvement of a
peroxodiferric intermediate during the ferroxidase reaction in fast ferritin
mineralization, Biochemistry 37 (1998) 9871-9876.
[10] J.M. Bollinger, Jr., D.E. Edmondson, B.H. Huynh, J. Filley, J.R. Norton, J.
Stubbe, Mechanism of assembly of the tyrosyl radical-dinuclear iron cluster cofactor
of ribonucleotide reductase, Science 253 (1991) 292-298.
[11] J.M. Bollinger, W.H. Tong, N. Ravi, B.H. Huynh, D.E. Edmondson, J. Stubbe,
Mechanism of Assembly of the Tyrosyl Radical-Diiron(Iii) Cofactor of Escherichia-Coli
Ribonucleotide Reductase .2. Kinetics of the Excess Fe2+ Reaction by Optical, Epr,
and Mossbauer Spectroscopies, Journal of the American Chemical Society 116 (1994) 8015-8023.
[12] J.M. Bollinger, W.H. Tong, N. Ravi, B.H. Huynh, D.E. Edmondson, J. Stubbe,
Mechanism of Assembly of the Tyrosyl Radical-Diiron(Iii) Cofactor of Escherichia-Coli
Ribonucleotide Reductase .3. Kinetics of the Limiting Fe2+ Reaction by Optical, Epr,
and Mossbauer Spectroscopies, Journal of the American Chemical Society 116 (1994) 8024-8032.
[13] F. Bou-Abdallah, G.C. Papaefthymiou, D.M. Scheswohl, S.D. Stanga, P. Arosio,
N.D. Chasteen, mu-1,2-Peroxobridged di-iron(III) dimer formation in human H-chain
ferritin, Biochem J 364 (2002) 57-63.
[14] P. Moenne-Loccoz, C. Krebs, K. Herlihy, D.E. Edmondson, E.C. Theil, B.H.
Huynh, T.M. Loehr, The ferroxidase reaction of ferritin reveals a diferric mu-1,2
bridging peroxide intermediate in common with other O2-activating non-heme diiron
proteins, Biochemistry 38 (1999) 5290-5295.
[15] D. Yun, C. Krebs, G.P. Gupta, D.F. Iwig, B.H. Huynh, J.M. Bollinger, Jr., Facile
electron transfer during formation of cluster X and kinetic competence of X for tyrosyl

Structural and Mechanistic Studies of Iron Containing Proteins
70
radical production in protein R2 of ribonucleotide reductase from mouse,
Biochemistry 41 (2002) 981-990.
[16] D. Yun, L. Saleh, R. Garcia-Serres, B.M. Chicalese, Y.H. An, B.H. Huynh, J.M.
Bollinger, Jr., Addition of oxygen to the diiron(II/II) cluster is the slowest step in
formation of the tyrosyl radical in the W103Y variant of ribonucleotide reductase
protein R2 from mouse, Biochemistry 46 (2007) 13067-13073.
[17] F. Bou-Abdallah, G. Zhao, H.R. Mayne, P. Arosio, N.D. Chasteen, Origin of the
unusual kinetics of iron deposition in human H-chain ferritin, J Am Chem Soc 127 (2005) 3885-3893.
[18] J. Hwang, C. Krebs, B.H. Huynh, D.E. Edmondson, E.C. Theil, J.E. Penner-
Hahn, A short Fe-Fe distance in peroxodiferric ferritin: control of Fe substrate versus
cofactor decay?, Science 287 (2000) 122-125.
[19] Y. Kim, X. Feng, S.J. Lippard, Synthesis, structure, and properties of a mixed-
valent triiron complex of tetramethyl reductic acid, an ascorbic acid analogue, and its
relationship to a functional non-heme iron oxidation catalyst system, Inorg Chem 46 (2007) 6099-6107.
[20] L. Xie, S. Liu, C. Gao, R. Cao, J. Cao, C. Sun, Z. Su, Mixed-valence iron(II, III)
trimesates with open frameworks modulated by solvents, Inorg Chem 46 (2007)
7782-7788.
[21] A. Treffry, Z. Zhao, M.A. Quail, J.R. Guest, P.M. Harrison, How the presence of
three iron binding sites affects the iron storage function of the ferritin (EcFtnA) of
Escherichia coli, FEBS Lett 432 (1998) 213-218.

Chapter III
71
Structural and mechanistic features of SORs from Desulfovibrio vulgaris
Hildenborough and Desulfovibrio gigas

Structural and Mechanistic Studies of Iron Containing Proteins
72
Index
Chapter III Structural and mechanistic features of SORs from Desulfovibrio vulgaris Hildenborough and Desulfovibrio gigas III.1 – Overview 73
III.2 - Experimental 73
III.2.1 – Dv SOR, overexpression and isolation 73
III.2.2 – Biochemical and spectroscopic characterization of the new “blue”
form of Dv SOR 76
III.2.3 – Overexpression of Dv SORZn-Fe 83
III.2.4 – Direct electron transfer between recombinant SOR forms and
rubredoxin from Desulfovibrio vulgaris Hildenborough 84
III.2.5 – Superoxide Reductase Activity 96
III.2.6 – Desulfovibrio gigas SOR, Mössbauer studies 105
III.3 – Discussion 112
III.4 – References 116

Chapter III
73
III.1 – Overview
As mentioned in Chapter I, the SOR proteins play an essential role in cellular
detoxification, making it possible for anaerobic organisms to survive exposure to
small amounts of oxygen[1].
This chapter will focus on several aspects concerning not only the isolation of the
different forms of this protein, but also its biochemical and spectroscopic properties.
The interaction with its proposed physiological electron donor, rubredoxin was also
investigated and relevant results will be discussed in this chapter, focusing mainly on
the design of a possible catalytic mechanism.
III.2 - Experimental
III.2.1 – Dv SOR, overexpression and isolation
Commercial competent E. coli cells (strain BL21(DE3), Invitrogen®) were
transformed with the correspondent plasmid for the desired recombinant protein[2].
All the transformation procedures were carried out according to the manufacturer’s
recommendations (Appendix A). After the transformation process, the cells were
plated in LB-Agar medium containing 0.1 mg/mL ampicillin and left to grow overnight
at 37 ºC. Resulting colonies were used to start the overexpression of the desired
proteins.
The overexpression procedure was as described in the literature with minor
changes[2, 3]. Two steps of pre-cultures were performed prior to the main
overexpression growth. The first step consisted in a 5 mL pre-culture in LB media
containing 0.1 mg/mL ampicillin, that was grown overnight (from 10 to 12 hours) at
37 ºC at 225 rpm. The second step consisted in the addition of 1 mL of this grown
medium to 100 mL LB media containing 0.1mg/mL ampicillin. This medium was left
overnight (from 14 to 16 hours) at 37 ºC at 225 rpm. Finally, 5 mL of this culture were
inoculated into 500mL (usually 4 L total, 8 x 500 mL) of LB media containing
0.1 mg/mL ampicillin and 0.1 mM FeCl2. The cells were allowed to grow at 37 ºC at

Structural and Mechanistic Studies of Iron Containing Proteins
74
230 rpm until its O.D. was near 0.8 at 600 nm. At this time 1 mM IPTG and 0.1 mM
FeCl2 were added and the culture was able to grow for approximately 14 hours at
room temperature (between 20 and 25 ºC) at 230 rpm. All these growth procedures
were performed aerobically.
After growth, cells were harvested by centrifugation at 10,000 x g for 8 min at 4 ºC.
The supernatant was discarded and the cells were suspended in 50 mM Tris-HCl
pH 7.6 buffer. A combination of freeze-thaw cycles (for 3 times, with liquid nitrogen
and tepid water) and a French Press® (28,000 Psi) apparatus were used for cell
disruption. During this process, a small amount of DNAse (purchased from Sigma)
was added to ensure DNA degradation and, consequently, a cleaner sample. Cell
disruption was followed by ultracentrifugation at 138,000 x g at 4 ºC for 1 h 30 min, in
order to separate the fraction containing the desired protein from the rest.
After obtaining the fraction containing the recombinant SOR, three chromatographic
steps were applied in order to isolate the protein. All purification steps were carried
out at 4 ºC and at pH 7.6.
The first step consisted in loading the fraction into a XK26/40 column (2.6 x 40 cm,
GE HealthCare®) filled with a DEAE-Sepharose FF® medium (GE HealthCare®),
previously equilibrated with 50 mM Tris-HCl pH 7.6 buffer. After loading the column it
was washed with two volumes of the equilibrating buffer in order to remove all the
proteins that did not adsorbed to the matrix. An 800 mL gradient was applied (50 –
500 mM Tris-HCl pH 7.6) and the protein was collected between 250 – 300 mM.
After this chromatographic step three fractions were made according to the purity, as
verified by UV-Visible spectra and SDS-PAGE electrophoresis (described in
Appendix A). Two fractions contained the pink form of the protein and another
contained a new “blue” form, which presented UV-Visible features resembling
classes II and III SORs. All the three fractions were concentrated using a Diaflo®
apparatus with an YM10 membrane.
In the second chromatographic step, the samples were loaded independently into a
XK26/70 column packed with Superdex75® (Amersham Biosciences®), previously
equilibrated with 300 mM Tris-HCl pH 7.6. Judging by the UV-Visible spectra and
SDS-PAGE electrophoresis, it was clear that this second chromatographic step was
not helpful to enhance the protein purification. The fractions were then concentrated

Chapter III
75
as described before and the buffer was exchanged to 50 mM Tris-HCl pH 7.6 by
successive addition.
A third chromatographic step was applied using another ionic exchange resin, Q-
Sepharose FF® (GE HealthCare®) packed in a XK26/40 (2.6 x 40 cm). The
procedure was similar to the one used in the first step, with the column being
equilibrated with 50 mM Tris-HCl pH 7.6, washed with the same buffer and then
applying a gradient from 50 – 1000 mM Tris-HCl pH 7.6 to remove the adsorbed
proteins. As in the previous steps, the collected fractions were analyzed by UV-
Visible and SDS-PAGE and divided according to their purity.
With this procedure it was possible to collect a final fraction containing the pure pink
form of the SOR with a purity ratio of 6.2 (Abs280/Abs490), and another fraction
containing the new “blue” form with a purity ratio of 21 (Abs280/Abs644).
The UV-Visible features of the blue protein raised a few questions about metal center
composition, redox potential and catalytic activity. To characterize this new form and
assess its functionality a series of biochemical and spectroscopic assays were
devised.

Structural and Mechanistic Studies of Iron Containing Proteins
76
III.2.2 – Biochemical and spectroscopic characterization of the new “blue” form of Dv
SOR
As mentioned before, the UV-Visible features presented by this protein are very
similar to those already known for class II and III SORs. The figure below represents
a UV-Vis spectrum of the new “blue” form of Dv SOR.
Figure III. 1 – Absorbance spectrum of the oxidized form of the new “blue” form of Dv
SOR.
The absorption spectrum has three main features, at 280 nm (ε280 = 28650 M-1.cm-1),
314 nm (ε314 = 6089 M-1.cm-1) and 644 nm (ε644 = 1746 M-1.cm-1). The maximum at
644 nm is in accordance with the previously presented for the difference spectrum
between the gray and the pink forms of Dv SOR and also for the DfxC (a modified Dv
SOR which has the center II only)[2, 4, 5]. The shoulder around 314 nm should
0
10
20
30
250 350 450 550 650 750 850
Wavelength (nm)
ε (m
M-1
.cm
-1)
0
3
6
250 450 650 850

Chapter III
77
correspond to the cysteine-iron charge transfer band, also present in other proteins
with similar iron centers like rubredoxin[2, 4-7].
Figure III. 2 – UV-Vis spectra of both gray form (A) and pink form (B) of Dv SOR and
a difference spectrum (C) between A and B showing the isolated center II. Adapted
from Tavares and coworkers[4].
300 400 500 600 700 800
Wavelength (nm)

Structural and Mechanistic Studies of Iron Containing Proteins
78
Figure III. 3 – UV-Vis spectrum of the oxidized form of Desulfovibrio gigas SOR. The
protein concentration was 40 μM. Adapted from Chen and coworkers[8].
The protein was then subjected to sequential Edman degradation on an automatic
protein sequencer (Applied Biosystem model LC491) and the NH2-terminal sequence
of the first 21 amino acid residues was determined. This analysis was made to
ensure that the recombinant protein did not suffer an unexpected mutation/deletion
that would remove some, or all, of the center I amino acid ligands. If this were to be
the case, the UV-Visible spectrum could be explained by the absence of a metal ion
in the center I.
300 400 500 600 700 800 900
Wavelength (nm)
0
1.05
2.10

Chapter III
79
The analysis indicated that the first 21 amino acids had 100% identity when
compared to the sequence predicted by the gene analysis as shown below.
Figure III. 4 – Comparison between the NH2-terminal sequence of the new “blue”
form of Dv SOR and the deduced amino acid sequence predicted from the Dv SOR
encoding gene.
The amount of iron per protein, as well as the screening of other metals in the
protein, became essential to understand the spectroscopic behavior. To quantify the
total amount of metal ions a sample was analyzed by induction-coupled plasma
emission (Lab. de Análises, Dept. Química, CQFB/REQUIMTE, FCT/UNL) and the
results are presented in table 1. The metal analysis performed doesn’t reveal the
presence of metal ions other than iron and zinc.
Table III. 1 – Plasma emission results obtained for the protein analysis
Metal (ppm) Sample
Iron Zinc
Protein 0.5793 2.1288
Control - 0.7663
Dv SOR”new” Dv SORFe-Fe

Structural and Mechanistic Studies of Iron Containing Proteins
80
The obtained results show an iron concentration of 1.04 x 10⁻⁵ M and a zinc
concentration of 2.08 x 10⁻⁵ M, which may indicate that the sample has a mixture of
Zn-Fe and Zn-Zn forms. According to the theoretical ratio this mixture should have
66% of Zn/Fe and 33% of Zn-Zn. However, with the modifications applied to the
overexpression method it was possible to obtain a pure Zn-Fe sample (see section
III.2.3).
The metal analysis results, in conjunction with the obtained UV-Visible spectrum,
point to the fact that the new "blue" form of the recombinant protein is an
heterometallic form with a zinc replacing a iron ion in center I and a ferric ion in
center II. In accordance, this form will be designated by SORZn-Fe from now on.
Figure III. 5 – Schematic representation of class I SOR. A) SORFe-Fe, where the
orange dots represent the iron atoms in both centers. B) SORZn-Fe, where the green
dots represent the zinc atoms in center I and orange dots represent the iron atoms in
center II.
Further spectroscopic studies consisted in the characterization of SORZn-Fe by EPR in
order to compare with the signals obtained for the iron only form, SORFe-Fe. The next
figure presents a plot of the obtained spectra.
A) B)

Chapter III
81
Figure III. 6 – EPR spectra of A) as purified SORZn-Fe and B) Oxidized SORZn-Fe (by
incubation with sodium hexachloroiridate (IV)). The experimental conditions used
were: temperature 4.1 K; microwave frequency 9.653 GHz; microwave power 2.002
mW; modulation amplitude 1 mT; receiver gain 1.26 x 10⁵.
100 600 1100 1600 2100 2600
Magnetic Field (Gauss)
A)
B)

Structural and Mechanistic Studies of Iron Containing Proteins
82
The EPR spectra of this SORZn-Fe revealed resonances at g = 8.93, g = 4.76 and
g = 4.30, similar to the presented for the center II of SORFe-Fe, which is indicative that
the iron center should be structurally in the same environment[4, 6, 8].
Figure III. 7 – Temperature dependence of EPR spectra of as-purified SORZn-Fe.
A) T = 4.2 K; B) T = 10 K; C) T = 15 K; D) T = 20 K; E) T = 25 K. Other conditions
used were: microwave frequency 9.653 GHz; microwave power 2.002 mW;
modulation amplitude 1 mT; receiver gain 1.26 x 10⁵.
100 600 1100 1600 2100 2600
Magnetic Field (Gauss)
A)
B)
C)
D)
E)
8.93 4.76
4.3

Chapter III
83
With all the spectroscopic and biochemical data pointing to a similar structure
between SORZn-Fe and SORFe-Fe, it seemed interesting to characterize not only the
enzymatic function of this new form, but also its interaction with the proposed
physiological electron donor, rubredoxin. However, for that kind of studies, a large
amount of protein would be needed. To overcome that problem it became
fundamental to improve the overexpression system in order to obtain a higher yield of
recombinant SORZn-Fe protein. The next section will describe the approach used to
accomplish this purpose.
III.2.3 – Overexpression of Dv SORZn-Fe
One of the causes pointed for the appearance of SORZn-Fe form was the large amount
of different metals in LB medium. Therefore, the production of more protein should
not depend on a random distribution of metals in the overexpressed protein. The first
approach to increase expression of the heterometallic form consisted in changing the
growth medium to another that would allow the control of not only the relative
concentrations but also the type of metal ions of interest. The chosen medium was
M9 (described in Appendix A). It allowed the determination of the exact amount of
metal desired for the correct overexpression of SORZn-Fe.
The overall process was based in an already described method for the LB medium
growth, with minor changes that proved to be more efficient during the several
attempts to improve the process[2]. The overexpression procedure was exactly the
same until the first pre-culture. The second pre-culture was done in M9 medium and
consisted in the addition of 1 mL of the first pre-culture, made in LB medium, to
100 mL M9 medium containing 0.1 mg/mL ampicillin. The culture was left overnight at
37 ºC at 225 rpm. Then, 10 mL of this culture were inoculated into 1000 mL (usually
5L total, 5 x 1000 mL) of M9 medium containing 0.1 mg/mL ampicillin and 0.1 mM
FeCl2. The cells were allowed to grow at 37 ºC at 250 rpm until the culture O.D. was
near 0.8 at 600 nm. At this time, 1 mM IPTG and 0.1 mM FeCl2 and 0.1 mM ZnCl2
were added and the culture was able to grow for approximately 14 hours at room

Structural and Mechanistic Studies of Iron Containing Proteins
84
temperature (between 20 and 25 ºC) at 250 rpm. Just like for LB medium, all these
growth procedures were made aerobically.
From this point on, the isolation procedures were the same as described before, with
the exception that in this case the second purification step (the molecular exclusion
with Superdex75®, Amersham Biosciences®), was removed from the procedure and
only two ionic exchange steps were performed.
This improved overexpression and isolation procedure was also applied for the
expression of the SORFe-Fe form of the protein. With this process the initial batch,
after the ultracentrifugation step, was much cleaner, with fewer amounts of other
undesired proteins.
III.2.4 – Direct electron transfer between recombinant SOR forms and rubredoxin
from Desulfovibrio vulgaris Hildenborough
The first chapter of this thesis pointed out some unanswered questions regarding the
enzymatic activity of SORs and their mechanism. One of the questions is based on
SOR ability to receive electrons from its proposed physiological partner, rubredoxin.
Until now several studies presented kinetic information for the direct electron
transfer[3, 9-12].
However, all the approaches took into account only the electron transfer but the
relevance of the presence, or not, of center I remained always unclear[3, 9, 11]. Even
when Kurtz and coworkers modified the D. vulgaris SOR obtaining a mutant protein,
C13S SOR, in which one ligand residue of the [Fe(SCys)4] site, cysteine 13, was
changed to serine, it was not possible to clearly state what would be the function of
center I[12].
The isolation of SORZn-Fe represents a step forward to answer these questions. In this
protein both centers are present but center I possesses a "silent", i.e. non-redox
active, zinc ion. No mutations are present and the structure of the entire protein
should be exactly the same as the SORFe-Fe. All these features were fundamental for
Chapter III
85
the validation of the results and make a difference when compared to the other
similar works.
In this work, several pairs of electron donor/acceptor were studied in order to build up
a complete scheme for electron transfer and catalysis. The final purpose is to assign
the physiological relevance of both center I and II.
To evaluate the direct electron transfer rate constant a stopped-flow experiment was
designed. The objective was to follow not only the oxidation of rubredoxin but also
the reduction of center II, for the case of gray form of SORFe-Fe and SORZn-Fe. These
experiments were performed in anaerobic conditions, inside a glove box (UniLab
from mBraun, less than 1 ppm of oxygen), and should describe directly the electron
transfer between the two proteins. All the assays were performed in 50 mM
Phosphate buffer at pH 7.6 with 0.1 mM EDTA.
The main experiment consisted in a 1:1 mixture between reduced rubredoxin and
oxidized SOR. As they had the same initial concentration, a second order kinetic law
was applied to obtain a second order constant, correspondent to the electron
transfer. A second experiment consisted in mixing different concentrations of SOR
with the same amount of rubredoxin. The main objective was to relate the amount of
oxidized rubredoxin with SOR added. With this experiment it was also possible to
establish the reaction stoichiometry.
To perform the experiments both rubredoxin and SOR were degassed in a Schlenk
line before being introduced inside the glove box. Rubredoxin was then reduced with
a slight excess of sodium dithionite and SOR was prepared according to the desired
protein form. The pink form was obtained by incubating SOR with a slight excess of
ascorbic acid. The gray and “Zn-Fe” forms were prepared with an excess of sodium
hexachloroiridate (IV) (purchased from Aldrich®) in order to obtain the fully oxidized
form. All the samples were desalted, prior to use, in a 5 mL Hitrap™ desalting column
(GE Healthcare®).
The obtained data was best fitted with a second order rate constant (Eq. III.1), with
[Rd]0 = [SOR]0 and where [Rdox] is the amount of oxidized rubredoxin, [Rd]0 and
[SOR]0 are the initial concentrations of reduced rubredoxin and oxidized SOR
respectively and k’ = k x [Rdred]0, where k is the second order rate constant.[9, 13]

Structural and Mechanistic Studies of Iron Containing Proteins
86
[ ]
t κ'1Rd
][Rd ][Rd 0red0redox ×+
−= Eq.III.1
The rate constant calculations were performed based on, at least, three replicates of
each assay.
Figure III. 8 - Stopped-flow kinetics of the oxidation of reduced rubredoxin by the pink
form of SORFe-Fe. The variation was measured by the absorbance changes at 500 nm
and converted to concentration. The gray line represents the experimental data and
the black line represents the theoretical fit. Solutions of 50 μM reduced rubredoxin
were mixed (1:1) (v/v) with 50 μM oxidized SOR at 10 ºC.
14
15
16
17
18
0,00 0,01 0,02 0,03 0,04 0,05
Time (s)
[Rd]
ox ( μ
M)

Chapter III
87
The data analysis for all the replicates of the pink form of SORFe-Fe revealed a second
order rate constant of (2.8 ± 0.4) x 107 M-1.s-1, which corresponds to the electron
transfer rate from rubredoxin to the center I.
Figure III. 9 - Stopped-flow kinetics of the oxidation of reduced rubredoxin by the
gray form of SORFe-Fe. The variation was measured by the absorbance changes at
500 nm. The gray line represents the experimental data and the black line represents
the theoretical fit. Solutions of 50 μM reduced rubredoxin were mixed (1:1) (v/v) with
50 μM oxidized SOR at 10 ºC.
0.20
0.22
0.24
0.26
0.28
0.00 0.02 0.04 0.06 0.08 0.10
Time (s)
Abs
500n
m

Structural and Mechanistic Studies of Iron Containing Proteins
88
Figure III. 10 - Stopped-flow kinetics of the reduction of gray form SORFe-Fe by
reduced rubredoxin. The variation was measured by the absorbance changes at 650
nm and converted to concentration. The gray line represents the experimental data
and the black line represents the theoretical fit. Solutions of 50 μM of reduced
rubredoxin were mixed (1:1) (v/v) with 50 μM of oxidized SOR at 10ºC.
The electron transfer to the gray form, analyzed at both 500 nm and 650 nm, near the
maxima of rubredoxin and SORFe-Fe center II, respectively, should give some
information about the pathway of the electron transfer between the two proteins. The
values obtained for both wavelengths were (4.3 ± 1.9) x 106 M-1.s-1 and
1.9 x 10⁶ M-1.s-1, for 500 nm and 650 nm respectively. These values are considered
identical within the experimental error.
4
7
10
13
0,00 0,05 0,10 0,15 0,20
Time (s)
[SO
R] o
x (μ
M)

Chapter III
89
From the presented data it becomes clear that the observed absorbance value at
500 nm does not correspond to the total oxidized rubredoxin, but to a sum of total
amount of oxidized rubredoxin and the pink form of SORFe-Fe. This observation raised
the question about the exact location where electron transfer occurs or even if there
is some sort of intramolecular electron transfer. To further understand the electron
transfer process, a similar experiment was performed but with a 2:1 proportion
between the two proteins.
Figure III. 11 - Stopped-flow kinetics of the reduction of gray form SORFe-Fe by
reduced rubredoxin. The variation was measured by the absorbance changes at 500
nm and converted to concentration. The gray line represents the experimental data
and the black line represents the theoretical fit. Solutions of 50 μM reduced
rubredoxin were mixed (2:1) (v/v) with 50 μM oxidized SOR at 10 ºC.
20
22
24
26
28
30
0,00 0,05 0,10 0,15 0,20
Time (s)
[Rd]
ox ( μ
M)

Structural and Mechanistic Studies of Iron Containing Proteins
90
Figure III. 12 - Stopped-flow kinetics of the reduction of gray form SORFe-Fe by
reduced rubredoxin. The variation was measured by the absorbance changes at 650
nm and converted to concentration. The gray line represents the experimental data
and the black line represents the theoretical fit. Solutions of 50 μM reduced
rubredoxin were mixed (2:1) (v/v) with 50 μM oxidized SOR at 10 ºC.
From the collected data the calculated values for both wavelengths were
(1.3 ± 0.2) x 106 M-1.s-1 and (1.7 ± 0.3) x 106 M-1.s-1, for 500 nm and 650 nm
respectively. Once again, these values are considered identical within the
experimental error.
3
5
7
9
11
0,00 0,05 0,10 0,15 0,20
Time (s)
[SO
R] o
x (μ
M)

Chapter III
91
In this case, the values obtained for the amount of oxidized rubredoxin are in
agreement with the expected, meaning that all the rubredoxin was oxidized and all
the SOR was converted to the reduced form. The significance of the obtained values
will be discussed later on.
Finally, the experiments were repeated with the oxidized SORZn-Fe in order to try to
find differences between this form and the SORFe-Fe.
Figure III. 13 – Stopped-flow kinetics of the oxidation of reduced rubredoxin by
oxidized SORZn-Fe. The variation was measured by the absorbance changes at 500
nm and converted to concentration. The gray line represents the experimental data
and the black line represents the theoretical fit. Solutions of 12 μM reduced
rubredoxin were mixed (1:1) (v/v) with 12 μM oxidized SOR at 10ºC.
3,0
3,5
4,0
4,5
5,0
0,0 0,1 0,2 0,3
Time (s)
[Rd]
ox ( μ
M)

Structural and Mechanistic Studies of Iron Containing Proteins
92
Figure III. 14 - Stopped-flow kinetics of the reduction of oxidized SORZn-Fe by
reduced rubredoxin. The variation was measured by the absorbance changes at
650 nm and converted to concentration. The gray line represents the experimental
data and the black line represents the theoretical fit. Solutions of 25 μM reduced
rubredoxin were mixed (1:1) (v/v) with 25 μM oxidized SOR at 10ºC.
In this case, the calculated values for both wavelengths were (3.2 ± 1.5) x 106 M-1.s-1
and (2.9 ± 0.4) x 106 M-1.s-1, for 500 nm and 650 nm respectively. Again, these
values can be considered similar within the experimental error. They are also similar
to the ones obtained for the gray form of the SOR. To demonstrate this similarity, the
comparison between oxidized SORZn-Fe and gray SOR reactions is presented in
figure III.15.
0,0
2,0
4,0
6,0
8,0
10,0
0,00 0,05 0,10 0,15 0,20
Time (s)
[SO
R] o
x (μ
M)

Chapter III
93
Figure III. 15 - Comparison of stopped-flow kinetics of the reduction of oxidized
SORZn-Fe by reduced rubredoxin (A) and oxidized gray form of SORFe-Fe by reduced
rubredoxin (B). The variation was measured by the absorbance changes at 650 nm
and converted to concentration.
As expected, rubredoxin was able to reduce all the SOR forms. However, the
electron transfer rate constants are different for the different forms. In the table
below, a summary of all the obtained values are presented.
0,0
3,0
6,0
9,0
12,0
0,00 0,05 0,10 0,15 0,20
Time (s)
[SO
R]o
x (m
M)

Structural and Mechanistic Studies of Iron Containing Proteins
94
Table III. 2 – Second order rate constants of electron transfer between reduced
rubredoxin and SORs
Second order rate constant (M-1.s-1) Wavelength
(nm) Pink Gray (1:1) Gray (2:1) SORZn-Fe
500 (2.8±0.4) x 107 (4.3±1.9) x 106 (1.3±0.2) x 106 (3.2±1.5) x 106
650 - 1.9 x 10⁶ (1.7±0.3) x 106 (2.9±0.4) x 106
The values presented in table III.2 clearly show that the electron transfer is much
faster (by one order of magnitude) to the pink form of SORFe-Fe than to the other
forms. Previous studies always pointed for the existence of an electron transfer to all
previously known forms, even for the Dv C13S mutant, but none had reported such a
difference in the calculated rate constants[9, 12, 13].
This difference itself could be related not only to the mechanism of the enzyme itself
but also to some possible structure modification between the pink and gray forms.
Another interesting feature was seen in the second set of experiments, when different
SOR concentrations were mixed with a fixed amount of reduced rubredoxin. This
data not only raises the interest for the biological need of the center I, but also points
to new questions regarding the existence of different oxidation states of SOR in the
cell. This experiment showed, as expected, that the amount of oxidized rubredoxin
was SOR dependent[10]. From the slope of each trend line in figure III.16 it is
possible to calculate the stoichiometry of this electron transfer. Table III.3
summarizes the obtained values.

Chapter III
95
Figure III. 16 – Rubredoxin oxidized by direct electron transfer to different amounts of
SOR. The experimental data are represented in gray dots for the gray form of
SORFe-Fe; in pink for the pink form of SORFe-Fe and in blue for the oxidized form of
SORZn-Fe; the trend lines are the best fits for the experimental data.
Table III. 3 – Calculated stoichiometry for each rubredoxin/SOR pair
SOR protein
Pink Gray SORZn-Fe
Stoichiometry 0.94 ± 0.13 2.06 ± 0.09 1.08 ± 0.06
0
3
6
9
12
15
0 3 6 9 12 15
[SOR] (μM) in the assay
[Rd]
( μM
) oxi
dize
d by
ele
ctro
n tra
nsfe
r

Structural and Mechanistic Studies of Iron Containing Proteins
96
The stoichiometry obtained for both pink and Zn-Fe forms of SOR corresponds to the
theoretical prediction since it means that for every oxidized rubredoxin molecule there
is one reduced SOR molecule. The same theory is applied for the gray form, but
since in this case SOR has two oxidized iron centers, the stoichiometry obtained was
two. However, the values obtained for this form are higher than the expected. This
could be due to the contribution of the pink form (due to one-electron reduction of
gray form) which has absorption maxima similar to rubredoxin, leading to a
deconvolution error that results in the over estimation of the oxidized rubredoxin
concentration. Such a fact is in accordance with the stopped-flow results, where it
could be seen that a mixture of pink form and oxidized rubredoxin is achieved for 1:1
protein ratios.
III.2.5 – Superoxide Reductase Activity
The previous experiments proved that the electron transfer between rubredoxin and
SORZn-Fe is possible. However, there is still a need to evaluate the ability to catalyze
superoxide anion reduction and compare it with the SORFe-Fe form.
In order to calculate the superoxide reductase activity, an experimental procedure
was established based on a previously reported assay[3]. It consisted in the
reduction of superoxide anion by catalytic amounts of SOR. Reduced rubredoxin is
used as electron donor, and its oxidation is also used to calculate the reaction rate.
The next figure illustrates one typical assay.

Chapter III
97
Figure III. 17 – Illustration of superoxide-mediated electron transfer assay.
Rubredoxin concentration was 15 μM and the SOR concentration ranged from 10 nM
to 1 μM. All the assays were performed in 50 mM phosphate buffer pH 7.6 with
0.1 mM EDTA at 23 ºC. Sodium dithionite was used to perform the initial
stoichiometric reduction of rubredoxin.
The reagents were always added in the same order and within the same time scale in
order to keep the same experimental conditions. The rubredoxin was added to the
assay in the oxidized form and reduced with sodium dithionite. The amount of sodium
dithionite added was calibrated to ensure that there was no excess and at the same
time, all the rubredoxin was reduced and ready to react. The amounts of xanthine
(1.5 mM) and xanthine oxidase (0.058 U/mL) were such as to ensure a constant flux
of superoxide during the reaction (ca. 14 μM.min-1). The use of catalase (150 U/mL)
was necessary to remove the hydrogen peroxide formed by spontaneous superoxide
0
5
10
15
20
25
0 1 2 3 4
Time (min)
Rub
redo
xin
( μM
)
catalase
xanthine
xanthine oxidase
Dfx
Sodium dithionite
SOR
Oxi
dize
d R
ubre
doxi
n ( μ
M)

Structural and Mechanistic Studies of Iron Containing Proteins
98
dismutation, xanthine/xanthine oxidase system (also a reaction product) and
superoxide reduction (with SOR), in order to prevent any inhibition by product[14-16].
All the data was fitted assuming that the reaction rate was proportional to the
concentration of the reagents and a kinetic constant k. In order to facilitate the
calculation, the concentration of both rubredoxin and superoxide used were
significantly bigger than SOR and so, considered constant at t = 0. The obtained
equation was as follows:
v = k’ [SOR] Eq. III.2
Were k’ is
k’ = k [Rd] [O2.-] Eq. III.3
The value for v0 was obtained directly from the experimental data and plotted against
the correspondent amount of SOR. The results are presented in the following figures.

Chapter III
99
Figure III. 18 – Kinetic traces of superoxide-mediated electron transfer between
rubredoxin and the pink form of SORFe-Fe. The different traces represent different
amounts of SOR added, a) 0 μM; b) 0.04 μM; c) 0.08 μM; d) 0.2 μM and e) 0.4 μM.
The assays were performed in 50 mM phosphate buffer pH 7.6 with 0.1 mM EDTA at
23 ºC.
6
10
14
18
2 3 4 5 6
Time (min)
[Rd]
ox ( μ
M)
a)
b)
c) d)
e)

Structural and Mechanistic Studies of Iron Containing Proteins
100
Figure III. 19 - Kinetic traces of superoxide-mediated electron transfer between
rubredoxin and the gray form of SORFe-Fe. The different traces represent different
amounts of SOR added, a) 0 μM; b) 0.08 μM; c) 0.2 μM; d) 0.4 μM and e) 1 μM. The
assays were performed in 50 mM phosphate buffer pH 7.6 with 0.1 mM EDTA at
23 ºC.
4
8
12
16
20
2 3 4 5 6
Time (min)
[Rd]
ox ( μ
M)
e) d)
c)
b)
a)

Chapter III
101
Figure III. 20 - Kinetic traces of superoxide-mediated electron transfer between
rubredoxin and the oxidized form of SORZn-Fe. The different traces represent different
amounts of SOR added, a) 0 μM; b) 0.02 μM; c) 0,2 μM; d) 0.6 μM and e) 1 μM. The
assays were performed in 50 mM phosphate buffer pH 7.6 with 0.1 mM EDTA at
23 ºC.
The initial rubredoxin oxidation rate values were plotted against the initial
concentration of SOR. The slopes indicate the k’ of the three SOR types in study.
The following figure and table summarize all the data obtained.
6
10
14
18
2 3 4 5 6
Time (min)
[Rd]
ox ( μ
M)
e) d)
c) b)
a)

Structural and Mechanistic Studies of Iron Containing Proteins
102
Figure III. 21 – Representation of rubredoxin oxidation rate by superoxide-mediated
electron transfer. The pink squares stand for the pink form of SORFe-Fe, gray triangles
for the gray form of SORFe-Fe and blue dots for the oxidized form of SORZn-Fe.
Table III. 4 – k’ values calculated for the superoxide-mediated electron transfer
between rubredoxin and the three SOR forms in study
k’ (min-1)
Pink Gray SORZn-Fe
12.34 ± 0.08 9.72 ± 0.06 8.98 ± 0.04
0.0
2.0
4.0
6.0
8.0
10.0
0.0 0.2 0.4 0.6 0.8 1.0 1.2
SOR (μM)
Rub
redo
xin
oxid
atio
n ra
te ( μ
M.m
im-1
)

Chapter III
103
As for the direct electron transfer, it was verified that in a superoxide-mediated
reaction the rubredoxin oxidation rate was higher with the pink form than for the other
forms. This fact could be due to the presence of an already reduced center II, where
the catalysis takes part. To test this hypothesis a new experiment was performed,
where both forms SORFe-Fe and SORZn-Fe were fully reduced at the beginning of the
experiment. Since initial reaction rate is the only data used for the rate constant
calculations, the result of this experiment, whether there is difference or not between
them, should answer the question. The results are shown in the next figure.
Figure III. 22 - Representation of rubredoxin oxidation rate by superoxide-mediated
electron transfer. The pink squares stand for the reduced SORFe-Fe, and blue dots for
the reduced SORZn-Fe.
0.0
0.5
1.0
1.5
2.0
0.00 0.04 0.08 0.12 0.16
SOR (μM)
Rub
redo
xin
oxid
atio
n ra
te ( μ
M.m
in-1
)

Structural and Mechanistic Studies of Iron Containing Proteins
104
Table III. 5 – k’ values calculated for the superoxide-mediated electron transfer
between rubredoxin and all SOR forms in study
k’ (min-1)
Pink Gray SORZn-Fe Red. SORFe-Fe Red. SORZn-Fe
12.34 ± 0.08 9.72 ± 0.06 8.98 ± 0.04 11.79 ± 0.86 12.12 ± 0.73
This last experiment revealed that, within the experimental error, similar initial
oxidation rates were verified for both reduced forms of SOR and for the pink form of
SORFe-Fe. This may indicate that when the center II is reduced at the beginning of the
reaction, the presence of center I is not relevant for catalysis. The smaller reaction
rate constants observed in the gray and oxidized SORZn-Fe forms are in accordance
with this fact, since in both of these cases center II has to be reduced prior to the
reaction with superoxide radical, leading to a slower reaction rate.

Chapter III
105
III.2.6 – Desulfovibrio gigas SOR, Mössbauer studies
To complete the spectroscopic studies of SOR proteins, the Desulfovibrio gigas SOR
(originally denominated neelaredoxin) was studied by Mössbauer spectroscopy. As
was mentioned in chapter I, this protein is a class II SORs and has only the center II
in it constitution. Spectroscopicaly, the Mössbauer spectra should be similar to those
found for the gray form of Desulfovibrio desulfuricans ATCC 27774 SOR[4, 6].
In order to obtain these data, several studies were preformed where a 57Fe enriched
protein was used. These experiments consisted in studying both as-purified and
reduced states of the enzyme.
Two Mössbauer spectra of the as-purified form of neelaredoxin were recorded at
4.5 K in the presence of an applied weak magnetic field. The spectra were acquired
with a 600 G field applied either parallel or perpendicular to the γ radiation beam.
Both spectra are similar, presenting two major components corresponding to a
quadrupole doublet (47%) with the following parameters, ΔEQ = 3.00 mm/s and
δ = 1.07 mm/s. These parameters are assigned to high-spin (S=2) ferrous iron
coordinated by oxygen or nitrogen ligands.
The second component, accounting for 53%, revealed, as expected, characteristic
parameters of a high-spin (S=5/2) ferric iron, very similar to those found for the gray
forms of Dd SOR. All the parameters are listed in table III.6.

Structural and Mechanistic Studies of Iron Containing Proteins
106
Figure III. 23 – A) Mössbauer spectrum of the as-purified neelaredoxin recorded at
4.5 K in the presence of a weak magnetic field of 600G parallel to the γ radiation
beam. B) Mössbauer spectrum of the as-purified neelaredoxin recorded at 4.5 K in
the presence of a weak magnetic field of 600 G perpendicular to the γ radiation
beam. The solid lines represent the theoretical fits for the 47% of the reduced
component of neelaredoxin.
A)
B)

Chapter III
107
Figure III. 24 – A) Mössbauer spectrum of the 53% oxidized component of
neelaredoxin recorded at 4.5 K in the presence of a weak magnetic field of 600 G
parallel to the γ radiation beam. C) Mössbauer spectrum of the 53% oxidized
component of neelaredoxin recorded at 4.5K in the presence of a weak magnetic
field of 600 G perpendicular to the γ radiation beam. The solid lines B) and D)
represent the theoretical fits for the oxidized component of neelaredoxin.
A)
B)
C)
D)

Structural and Mechanistic Studies of Iron Containing Proteins
108
Table III. 6 – Parameters used to fit both components of Mössbauer spectra of as-
purified neelaredoxin
Parameter Component A Component B
D (cm-1) 0 < -5
E/D 0 0.31 ± 0.02
ΔEQ (mm/s) 3.00 ± 0.01 0.56 ± 0.02
δ (mm/s) 1.07 ± 0.02 0.55 ± 0.01
Axx, Ayy, Azz (kG) 0 -200 ± 5, -200 ± 5, -213 ± 1
η 0 -2.20± 0.02
Γ 0.37 0.32
The Mössbauer spectrum recorded at high temperature (200 K with no applied
magnetic field) shows that at this temperature, the oxidized component of as-purified
neelaredoxin is still not totally collapsed, contributing to the broad shape of the
quadrupole doublet correspondent to the reduced component. For that reason it was
also not possible to calculate Mössbauer parameters for the ferric species.

Chapter III
109
Figure III. 25 - Mössbauer spectrum of the as-purified neelaredoxin recorded at
200 K with no applied magnetic field.
Upon dithionite reduction of the as-isolated sample, the 4.5K spectrum consists of a
single quadrupole doublet with ΔEQ = 3.01 mm/s and δ = 1.03 mm/s, consistent with
the conversion of the ferric into the ferrous species. Such observation indicates the
presence of a single iron site that, due to the formal redox potential (E0´= 190 mV), is
in the as-purified state in a mixture of redox states[8].

Structural and Mechanistic Studies of Iron Containing Proteins
110
Finally, a temperature dependence study was performed. The Mössbauer spectra of
dithionite reduced neelaredoxin were recorded with no applied magnetic field,
between 4.5 K and 200 K. All the spectra were fitted with a single quadrupole doublet
corresponding to the high-spin (S=2) ferrous iron coordinated by either oxygen or
nitrogen ligands.
Figure III. 26 – Mössbauer spectra of temperature dependence performed for the
dithionite reduced form of neelaredoxin. A) 4.5 K; B) 50 K; C) 100 K; D) 150 K;
E) 200 K. The solid lines are fits of a single quadrupole doublet o the experimental
data obtained for each temperature.
A)
B)
C)
D)
E)

Chapter III
111
Figure III.27 represents dependence of ΔEQ and δ the temperature.
Figure III. 27 – Temperature dependence obtained for δ (gray squares) and ΔEQ
(black dots). The spectra of the dithionite reduced form of neelaredoxin were
recorded between 4.5 K and 200 K, with no applied magnetic field.
0.96
0.98
1.00
1.02
1.04
0 50 100 150 200
Temperature (K)
δ (m
m/s
)
2.80
2.90
3.00
3.10
ΔE Q
(mm
/s)

Structural and Mechanistic Studies of Iron Containing Proteins
112
III.3 – Discussion
At the beginning of this chapter it was proposed to try to understand both the
interaction between Dv SOR and rubredoxin as well as the possible advantage of
having two iron centers for catalysis (instead of one iron center, such as in class II
and class III SORs). The overexpression of modified SOR containing zinc in center I
instead of iron improved the chances of obtaining more and better data.
This new form revealed some spectroscopic features similar to class II and III SORs,
such as the UV-Vis and EPR spectra. On the other hand, the a. a. sequence analysis
proved that this protein was identical to the original Dv SOR (predicted by gene
analysis). With these data and without any further structural information, it was
possible to assume a structurally intact but chemically different SOR.
The first experiments performed focused on the direct electron transfer between
rubredoxin (the proposed physiological electron donor) and the three different forms
of SOR (pink, gray and Zn-Fe). The experiments revealed the existence of electron
transfer between rubredoxin and all the three forms of SOR in study. The kinetic rate
constants calculated for both gray and Zn-Fe forms were comparable to previously
published data, but a 10 fold increase was observed in the pink form, suggesting an
easier reduction of center I [9, 11, 17, 18]. In a first approach, this could mean that
the preferential electron transfer pathway from rubredoxin to SOR is through center I.
Nevertheless, the kinetic evidences obtained in this work could also point to a direct
electron transfer to center II. This was supported by the similarity of the rate
constants found in the gray form for 500 nm (oxidation of rubredoxin) and 650 nm
(reduction of center II), which were themselves similar to the calculated for the Zn-Fe
form (where center I is not available). So, what could explain the faster direct electron
transfer to center I of the protein when it is in the pink form?
Because the reduced center II is the catalytic active site and center I is, according to
the stopped-flow data, reduced faster by ferrous rubredoxin (when in the pink form),
probably there is some sort of intramolecular electron transfer that maintains not only
the center II always in a reduced state, ready for catalysis but also the protein in the
pink form, the most favorable to receive electrons and to continue the catalytic cycle.

Chapter III
113
Besides, the faster electron transfer to center I could be also promoted by a
conformational change in the protein when center II is in the reduced state (pink
form). This type of long range (22 Å) intramolecular electron transfer, coupled to
conformational change is not unique in Nature, being found in other examples like
cytochrome c Oxidase (CcO), described in chapter I of this thesis[19, 20]. If this was
the case, the pink form “conformation” would not only increase the protein’s ability to
receive electrons (at center I), but also promote an effective reduction of the oxidized
center II (via center I due to the intramolecular electron transfer) during catalytic
cycle. All this together would maintain the protein in the most favorable form.
Probably, this behavior has a biological significance, since even for the superoxide-
mediated electron transfer assay, the pink form is again the most effective. This could
mean that inside a living cell, the pink form would be an “always ready” form, that not
only is the most catalytically effective but also the easiest to reduce, contributing to
an efficient degradation of superoxide anion and, consequently, less damage to the
cell[1].
Confer these functions to center I could also explain the experimental observations
when completely reduced forms of both Fe-Fe and Zn-Fe were used to the
superoxide-mediated electron transfer. In this case, no difference in the k’ was
observed which means that the catalysis itself does not depend directly on center I
but is favored by its presence (proved by the pink form assay).
Therefore, the existence of center I can be seen as a structural advantage to the
enzyme, enabling it to be more efficient in the metabolic pathway and helping the cell
to keep a pool of “ready” enzyme for catalysis.
Computational studies performed using the protein crystallographic structures (from
Dv rubredoxin and Dd SOR), didn’t provide conclusive answers with respect to the
docking site between these two proteins. However they also don’t exclude the
previous postulated hypothesis. Figure III.28 illustrates the results obtained.

Structural and Mechanistic Studies of Iron Containing Proteins
114
Figure III. 28 – A) Superficial charge of Dv rubredoxin calculated by Poisson-
Boltzmann. B) Superficial charge of Dd SOR calculated by Poisson-Boltzmann. The
blue color stands for positive charges and the negative charges are represented by
the red color. The calculations were performed using WebLab ViewerPro 3.7,
molecular Simulations Inc. C) Top 50 docking solutions calculated for the interaction
between rubredoxin and SOR, ranked according to the minimization of electrostatic
repulsion energy upon formation of the complex. D) Top 50 docking solutions
calculated for the interaction between rubredoxin and SOR, ranked according to the
best side chain interaction upon formation of the complex. The rubredoxin molecules
are represented by their geometric center only for clarification purposes. The
calculations were performed using the Chemera 3.0 software
(http://www.cqfb.fct.unl.pt/bioin/chemera/Chemera/Intro.html).
A) B)
C) D)

Chapter III
115
The Mössbauer studies of neelaredoxin revealed, as expected, similar characteristics
to the previously reported for the center II of class I SOR[4, 6]. The parameters
obtained correspond to a high spin iron center, S=2 for the reduced form and S=5/2
for the oxidized form, coordinated with either oxygen or nitrogen. From the
Mössbauer study it was also possible to conclude that the as-purified form is in redox
equilibrium between the ferric and ferrous state (53% of ferric iron and 47% of ferrous
iron).

Structural and Mechanistic Studies of Iron Containing Proteins
116
III.4 – References
[1] A.S. Pereira, P. Tavares, F. Folgosa, R.M. Almeida, I. Moura, J.J.G. Moura,
Superoxide reductases, European Journal of Inorganic Chemistry (2007) 2569-2581.
[2] C. Ascenso, F. Rusnak, I. Cabrito, M.J. Lima, S. Naylor, I. Moura, J.J. Moura,
Desulfoferrodoxin: a modular protein, J Biol Inorg Chem 5 (2000) 720-729.
[3] F. Auchere, S.R. Pauleta, P. Tavares, I. Moura, J.J. Moura, Kinetics studies of the
superoxide-mediated electron transfer reactions between rubredoxin-type proteins
and superoxide reductases, J Biol Inorg Chem 11 (2006) 433-444.
[4] P. Tavares, N. Ravi, J.J. Moura, J. LeGall, Y.H. Huang, B.R. Crouse, M.K.
Johnson, B.H. Huynh, I. Moura, Spectroscopic properties of desulfoferrodoxin from
Desulfovibrio desulfuricans (ATCC 27774), J Biol Chem 269 (1994) 10504-10510.
[5] M.F. Verhagen, W.G. Voorhorst, J.A. Kolkman, R.B. Wolbert, W.R. Hagen, On the
two iron centers of desulfoferrodoxin, FEBS Lett 336 (1993) 13-18.
[6] I. Moura, P. Tavares, J.J. Moura, N. Ravi, B.H. Huynh, M.Y. Liu, J. LeGall,
Purification and characterization of desulfoferrodoxin. A novel protein from
Desulfovibrio desulfuricans (ATCC 27774) and from Desulfovibrio vulgaris (strain
Hildenborough) that contains a distorted rubredoxin center and a mononuclear
ferrous center, J Biol Chem 265 (1990) 21596-21602.
[7] M.J. Winter, d-Block chemistry, Oxford University Press, 1994.
[8] L. Chen, P. Sharma, J. Le Gall, A.M. Mariano, M. Teixeira, A.V. Xavier, A blue
non-heme iron protein from Desulfovibrio gigas, Eur J Biochem 226 (1994) 613-618.
[9] J.V. Rodrigues, I.A. Abreu, L.M. Saraiva, M. Teixeira, Rubredoxin acts as an
electron donor for neelaredoxin in Archaeoglobus fulgidus, Biochem Biophys Res
Commun 329 (2005) 1300-1305.
[10] F. Auchere, R. Sikkink, C. Cordas, P. Raleiras, P. Tavares, I. Moura, J.J. Moura,
Overexpression and purification of Treponema pallidum rubredoxin; kinetic evidence

Chapter III
117
for a superoxide-mediated electron transfer with the superoxide reductase
neelaredoxin, J Biol Inorg Chem 9 (2004) 839-849.
[11] J.P. Emerson, E.D. Coulter, R.S. Phillips, D.M. Kurtz, Jr., Kinetics of the
superoxide reductase catalytic cycle, J Biol Chem 278 (2003) 39662-39668.
[12] J.P. Emerson, D.E. Cabelli, D.M. Kurtz, Jr., An engineered two-iron superoxide
reductase lacking the [Fe(SCys)4] site retains its catalytic properties in vitro and in
vivo, Proc Natl Acad Sci U S A 100 (2003) 3802-3807.
[13] J.V. Rodrigues, L.M. Saraiva, I.A. Abreu, M. Teixeira, D.E. Cabelli, Superoxide
reduction by Archaeoglobus fulgidus desulfoferrodoxin: comparison with
neelaredoxin, J Biol Inorg Chem 12 (2007) 248-256.
[14] E.M. Link, P.A. Riley, Role of hydrogen peroxide in the cytotoxicity of the
xanthine/xanthine oxidase system, Biochem J 249 (1988) 391-399.
[15] E.W. Kellogg, 3rd, I. Fridovich, Superoxide, hydrogen peroxide, and singlet
oxygen in lipid peroxidation by a xanthine oxidase system, J Biol Chem 250 (1975)
8812-8817.
[16] I. Fridovich, Superoxide dismutases, Annu Rev Biochem 44 (1975) 147-159.
[17] J.V. Rodrigues, I.A. Abreu, D. Cabelli, M. Teixeira, Superoxide reduction
mechanism of Archaeoglobus fulgidus one-iron superoxide reductase, Biochemistry
45 (2006) 9266-9278.
[18] E.D. Coulter, D.M. Kurtz, Jr., A role for rubredoxin in oxidative stress protection
in Desulfovibrio vulgaris: catalytic electron transfer to rubrerythrin and two-iron
superoxide reductase, Arch Biochem Biophys 394 (2001) 76-86.
[19] T.L. Poulos, H. Li, C.S. Raman, Heme-mediated oxygen activation in biology:
cytochrome c oxidase and nitric oxide synthase, Curr Opin Chem Biol 3 (1999) 131-
137.
Structural and Mechanistic Studies of Iron Containing Proteins
118
[20] C.C. Page, C.C. Moser, X. Chen, P.L. Dutton, Natural engineering principles of
electron tunnelling in biological oxidation-reduction, Nature 402 (1999) 47-52.

Chapter IV
119
Structural and mechanistic studies of metal incorporation in rubredoxin from
Desulfovibrio gigas

Structural and Mechanistic Studies of Iron Containing Proteins
120
Index
Chapter IV Structural and mechanistic studies of metal incorporation in rubredoxin from Desulfovibrio gigas IV.1 – Overview 121
IV.2 - Experimental 122
IV.2.1 – Overexpression and purification of recombinant D. gigas
rubredoxin 122
IV.2.2 – Production of apoprotein of D. gigas rubredoxin 123
IV.2.3 – Co, Ni, Zn and Fe incorporation in apo rubredoxin. Stopped-flow
approach 125
IV.2.4 – Iron incorporation by apoprotein form of rubredoxin: Rapid
Freeze-Quench 57Fe Mössbauer spectroscopy 139
IV.3 - Discussion 143
IV.4 – References 146

Chapter IV
121
IV.1 – Overview
As described before, D. gigas rubredoxin (Rd) is a small monomeric protein,
containing only one iron atom and also a single tryptophan. From the physiological
point of view, rubredoxins have been characterized as electron donors of several
enzymatic systems[1-3]. But, more than a good electron donor, rubredoxin is also an
excellent model for structural studies in metalloproteins.
Since the 90’s, several authors reported procedures for metal incorporation in
different proteins[4]. Rubredoxin is one of the proteins mentioned in this type of
studies, and is able to receive several other metals besides iron. This fact is relevant
if we consider that for some spectroscopic studies, such as Nuclear Magnetic
Resonance, it is important to have “silent” metals, like the diamagnetic Zn2+, in order
to obtain data that would be impossible to obtain if the “original” metal, in this case
iron, was present.
However, little is known about the mechanism involved in the metal incorporation.
Does metal bind in a single step? Is the oxidation state of the metal important for the
incorporation? Do all the metals get incorporated by the same mechanism?
This chapter aims to answer those questions by studying the incorporation of
different metals in an apoprotein form of rubredoxin. For these studies, UV-visible
stopped-flow techniques will be used. For the iron incorporation, Mössbauer
spectroscopy, coupled with anaerobic rapid-freeze quench techniques, was also
chosen.

Structural and Mechanistic Studies of Iron Containing Proteins
122
IV.2 - Experimental
IV.2.1 – Overexpression and purification of recombinant D. gigas rubredoxin
Commercial competent E. coli cells (strain BL21(DE3), Invitrogen®) were
transformed with the correspondent plasmid in order to obtain desired recombinant
protein. All the transformation procedures were carried out according to the
manufacturer’s recommendations (Appendix A). After the transformation process, the
cells were plated in LB-Agar medium containing 0.1 mg/mL ampicillin and left to grow
overnight at 37 ºC. Resulting colonies were used to start the overexpression of the
desired proteins.
The overexpression procedure was as described in the literature with minor
changes[5]. Two steps of pre-cultures were performed prior to the main
overexpression growth. The first step consisted in a 5 mL pre-inoculum in LB media
containing 0.1 mg/mL ampicillin, that was grown overnight (from 10 to 12 hours) at
37 ºC at 225 rpm. The second step consisted in the addition of 1 mL of this pre-
culture to 100 mL LB media containing 0.1 mg/mL ampicillin. This culture was left to
grow overnight at 37 ºC at 225 rpm. Finally, 10 mL of this culture were inoculated into
1000 mL (usually 6 L total, 6 x 1000 mL) of LB media containing 0.1 mg/mL ampicillin
and 0.1 mM FeCl2. The cells were allowed to grow at 37 ºC at 230 rpm until its O.D.
was near 0.8 at 600 nm. At this time 1 mM IPTG and 0.1 mM FeCl2 were added and
the culture was able to grow for approximately 14 hours at room temperature
(between 20 and 25 ºC) at 230 rpm. All the growth procedures were made
aerobically.
After growth, the cells were harvested by centrifugation at 10,000 x g for 8 min at
4 ºC. After centrifugation the supernatant was discarded and the cells were
suspended in 50 mM Tris-HCl pH 7.8 buffer. A combination of three freeze-thaw
cycles (using liquid nitrogen and tepid water) and a French Press® (28000 Psi)
apparatus were used for cell disruption. During this process a small amount of
DNAse (purchased from Sigma) was added to ensure DNA degradation and,
consequently, a cleaner sample. Cell disruption was followed by ultracentrifugation,
138,000 x g at 4ºC for 1h 30 min, in order to separate the fraction containing the
desired protein from other cellular components.

Chapter IV
123
The resulting supernatant was then purified to homogeneity by an anionic exchange
chromatography followed by a gel filtration chromatography. All purification steps
were carried out at 4 ºC and at pH 7.8.
The first step consisted in loading the fraction into a column XK26/40 (2.6 x 30cm)
(GE HealthCare®) filled with a DEAE-Sepharose FF® resin (GE HealthCare®),
previously equilibrated with 50 mM Tris-HCl pH 7.8 buffer. After loading, the column
was washed with two volumes of the equilibrating buffer in order to remove all the
proteins that did not adsorb to the matrix. An 800 mL gradient was applied
(50 – 1000 mM Tris-HCl pH 7.8) and the protein was collected between
250 – 350 mM.
After this chromatographic step two fractions were made according to the purity
verified by UV-Visible spectra and SDS-PAGE electrophoresis (see Appendix A).
Both fractions containing rubredoxin were concentrated using a Diaflo® apparatus
with an YM3 membrane.
In the second chromatographic step, the samples were loaded into a XK26/100
column packed with Superdex75® (Amersham Biosciences®), previously
equilibrated with 300mM Tris-HCl pH 7.8. Judging by the UV-Visible spectra and
SDS-PAGE electrophoresis, it was clear that this second chromatographic step was
very effective for complete protein isolation. Thus, a fraction containing pure Dg
rubredoxin (purity ratio of Abs280/Abs490 = 2.2) was then concentrated as described
before and the buffer was exchanged to 50 mM Tris-HCl pH 7.8 by successive buffer
addition.
IV.2.2 – Production of apoprotein of D. gigas rubredoxin
As mentioned before, it is important to have the protein in an apoprotein form to be
used for metal incorporation experiments. The procedures described by Moura and
coworkers were followed with some modifications[4].
Depending on the experiment, an initial concentration of recombinant rubredoxin
(containing iron, RdFe) was calculated in order to achieve the desired final

Structural and Mechanistic Studies of Iron Containing Proteins
124
concentration of apoprotein. Production of clean, reduced apoprotein was
accomplished in four steps.
The first step consisted of incubation with 0.5M Dithiothreitol (DTT) and 5% (w/v)
Trichloroacetic Acid (TCA) at 45 ºC for about 30 minutes. After this time, a white
pellet (precipitated protein) was formed. The second step consisted in the separation
of the apoprotein by centrifugation at 7700 x g at 8 ºC for 30 minutes. After this step,
the supernatant was discarded and the pellet was dissolved in a 2mL solution of
0.5M Tris-Base and 60mM DTT. This solution was degassed in a Schlenk line with
argon/vacuum cycles and, finally, desalted anaerobically with 50 mM MES buffer pH
6.25, using a 5mL HiTrap™ column (GEHealthcare) inside a glove box. All the metal
incorporation assays, as well as the rapid freeze-quench experiments, were
performed anaerobicaly in 50 mM MES buffer pH 6.25.
After each procedure, the condition of the apoprotein produced was evaluated
spectrophotometricaly in anaerobic conditions. The spectrum shown below provides
an example of the typically obtained spectra.
Figure IV. 1 – UV-Vis spectrum of Dg rubredoxin apoprotein.
Wavelength

Chapter IV
125
The UV-Visible spectrum does not show any features usually observed when iron is
present in rubredoxin. The cysteine-metal charge transfer band, around 320nm, is
also not present indicating that the cysteines are reduced and ready to interact with
the metal ion[6].
IV.2.3 – Co, Ni, Zn and Fe incorporation in apo rubredoxin. Stopped-flow approach
It is well known from the literature that the UV-Visible features of rubredoxin change
according to the metal present in its center[4]. So, a good approach to study this
process and its possible intermediates is to follow the spectral changes in time. For
that purpose, a stopped-flow experiment was designed in order to obtain the spectral
evolution until the final form of the protein.
These experiments consisted in mixing a certain amount of apoprotein with the
desired metal and measuring the spectral evolution using a diode array
spectrophotometer. Since the purpose was to characterize the possible reaction
intermediates and their rates of formation and decay, several kinetic approaches
were used. For these studies a second order reaction was assumed with the
following equation,
v = k [Rdapo] [M] Eq. IV. 1
where k is the second order rate constant (M-1.s-1), [Rdapo] is the concentration of
apoprotein form of rubredoxin and [M] is a generic symbol for concentration of the
different metals used. In order to simplify the calculations, pseudo first order
conditions were applied assuming,
k’ = k [M] Eq. IV. 2
where k’ is an apparent first order rate constant (s-1) and the [M] value is so large
compared to [Rdapo] that it is considered constant during the experiment.

Structural and Mechanistic Studies of Iron Containing Proteins
126
In order to calculate k, several assays were performed with different metal
concentrations. The following figures illustrate the results obtained for the assays with
Ni2+ and Co2+, in the previously described conditions.
Figure IV. 2 – 2D Spectral evolution of a 1:1 mixture (v/v) of 30 μM ApoRd with
840 μM NiCl2, in 50 mM MES buffer pH 6.25. The arrow points the evolution of the
spectra with time.
From figure IV.2 it is possible to observe the formation of a broad peak around
460 nm. The final spectra is similar to the previously described spectra by Moura and
coworkers for a nickel substituted rubredoxin[4].

Chapter IV
127
Figure IV. 3 - 3D Spectral evolution of a 1:1 mixture (v/v) of 30 μM ApoRd with
840 μM NiCl2, in 50 mM MES buffer pH 6.25.
Since the incorporation of nickel contains features all over the visible region of the
spectrum, the data was analyzed in 3D. Similar to the ferritin experiments presented
in chapter 2, SPECFIT© (from Spectrum Software Associates), was also used for
data analysis.
From the global analysis it was then possible to determine that this reaction could
only be fitted with four consecutive first order rate constants. These data show that
the reaction forms three intermediate species before the formation of the final
product.

Structural and Mechanistic Studies of Iron Containing Proteins
128
Figure IV. 4 – Kinetic trace of a 1:1 mixture (v/v) of 30 μM ApoRd with 840μM NiCl2,
in 50 mM MES buffer pH 6.25. The green line represents the theoretical values
obtained at this wavelength (459 nm). The inset represents the residuals for the fit of
the overall data.
As was mentioned before, the experimental procedure was designed for a pseudo-
first order experiment. So, the obtained values for the first rate constant are the k’
shown in equations IV.1 and IV.2. In order to obtain the second order rate constant,
these values were plotted against the nickel concentration in each assay. The results
are presented in the following figure.

Chapter IV
129
Figure IV. 5 – Metal concentration dependence for the calculated k’. The slope of the
trend line indicates the second order rate constant for the first step.
From this plot the calculated second order rate constant for the first step of the
reaction was determined to be (1.40 ± 0.02) x 104 M-1.s-1. All the other rate constants
are independent from the metal concentration and were determined as (1.1 ± 0.9) s-1,
(0.7 ± 0.3) s-1 and (0.1 ± 0.04) s-1, for k2, k3 and k4, respectively. The evolution with
time of each intermediate is showed in the next figure (figure IV.6).
0
3
6
9
12
15
0.0 0.2 0.4 0.6 0.8 1.0
[Nickel] (mM)
k' (s-1
)

Structural and Mechanistic Studies of Iron Containing Proteins
130
Figure IV. 6 – Species evolution with time of a 1:1 mixture (v/v) of 30 μM ApoRd with
840 μM NiCl2, in 50 mM MES buffer pH 6.25. The concentration of the species was
determined using the calculated rate constants for this assay.
The same studies were then performed with cobalt. Just like for the assays with
nickel, with cobalt it was also possible to observe bands in the visible part of the
spectrum. These bands were again similar to the previously described in the
literature (figure IV.7)[4].

Chapter IV
131
Figure IV. 7 - 2D Spectral evolution of a 1:1 mixture (v/v) of 30 μM ApoRd with
840 μM CoCl2, in 50 mM MES buffer pH 6.25.
A 3D analysis was also performed in order to obtain a kinetic mechanism to fit the
experimental data. The next figure (figure IV.8) represents a 3D image of one of the
assays.

Structural and Mechanistic Studies of Iron Containing Proteins
132
Figure IV. 8 - 3D Spectral evolution of a 1:1 mixture (v/v) of 30 μM ApoRd with
840 μM CoCl2, in 50 mM MES buffer pH 6.25.

Chapter IV
133
Figure IV. 9 - Kinetic trace of a 1:1 mixture (v/v) of 30 μM ApoRd with 840 μM CoCl2,
in 50 mM MES buffer pH 6.25. The green line represents the theoretical values
obtained at this wavelength (696nm). The inset represents the residuals for the fit of
the overall data.
Applying the obtained data to the previously described software, it was also possible
to fit the data with four first order rate constants, as in the nickel assay. The first of
the four constants is a pseudo-first order constant and as such it was plotted against
the concentration of Co2+ (Fig.IV.10). The other constants were again independent of
metal concentration and were determined to be (11± 3) s-1, (1.2 ± 0.7) s-1 and
(0.5 ± 0.03) s-1, for k2, k3 and k4, respectively.

Structural and Mechanistic Studies of Iron Containing Proteins
134
Figure IV. 10 - Metal concentration dependence for the calculated k’. The slope of
the trend line indicates the second order rate constant for the first step.
From the presented plot, the second order rate constant corresponding to the first
step of the reaction was determined to be (5.51 ± 0.15) x 104 M-1.s-1. Once again the
evolution of each species in time was determined by the formation/decay rate
constants. An example is show figure IV.11.
0
10
20
30
0.0 0.1 0.2 0.3 0.4 0.5 0.6
[Cobalt] (mM)
k' (s-1
)

Chapter IV
135
Figure IV. 11 - Species evolution with time of a mixture 1:1 (v/v) of 30 μM ApoRd
with 840 μM CoCl2, in 50 mM MES buffer pH 6.25. The concentration of the species
was determined with the calculated rate constants for this assay.
For Fe2+ and Zn2+ (two other metals under study) no visible spectroscopic bands
exist. For this reason the experimental procedure was slightly changed. In this case,
the appearance of the cysteine-ligand charge transfer band (320nm) was used to
follow the reaction and to obtain the kinetic data.
With this approach it is not possible to obtain spectral data of the intermediates, but it
is enough to obtain kinetic data of metal incorporation. So, the evolution of a single
wavelength was followed at 320 nm, corresponding to the cysteine charge transfer
band[6]. For this purpose, MOS-250 (Bio-Logic™) was used instead of the Diode
Array. This device is also connected to the observation head with optical fibers
(Appendix A).

Structural and Mechanistic Studies of Iron Containing Proteins
136
Figure IV. 12 – Kinetic traces followed at 320 nm of several ratios of protein/Fe2+
mixed 1:1 (v/v) in 50 mM MES buffer pH 6.25. The protein concentration was 30 μM
and the iron varied from 0 to 700 μM; A) 0 μM, B) 175 μM, C) 263 μM, D) 350 μM,
E) 467 μM and F) 700 μM.
The obtained data was fitted with only two first order rate constants, contrary to the
previous four used for nickel and cobalt. As only a single wavelength was used to
study the iron incorporation, the possibility of a 3D spectral analysis was eliminated.
However, the obtained k’ values were plotted against iron concentrations in the
assays and the second order rate constant for the first step was calculated as being
(9.71 ± 0.24) x 102 M-1.s-1.
0.00
0.02
0.04
0.06
0.08
0.10
0 10 20 30 40
Time (s)
Abs
orba
nce
A)
C)
D)
E)
F)
B)
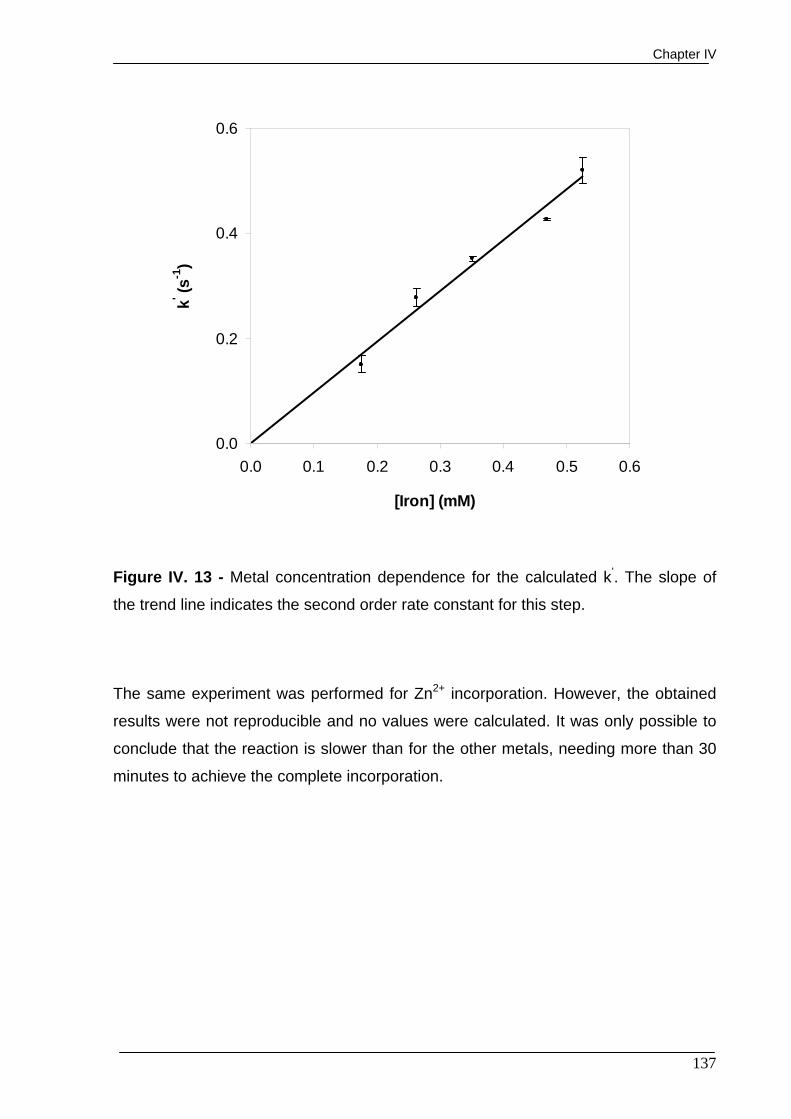
Chapter IV
137
Figure IV. 13 - Metal concentration dependence for the calculated k’. The slope of
the trend line indicates the second order rate constant for this step.
The same experiment was performed for Zn2+ incorporation. However, the obtained
results were not reproducible and no values were calculated. It was only possible to
conclude that the reaction is slower than for the other metals, needing more than 30
minutes to achieve the complete incorporation.
0.0
0.2
0.4
0.6
0.0 0.1 0.2 0.3 0.4 0.5 0.6
[Iron] (mM)
k' (s-1
)

Structural and Mechanistic Studies of Iron Containing Proteins
138
Table IV. 1 – Values of the rate constants obtained for the metal incorporation in the
ApoRd
Rate Constants
Metal k1 (M-1.s-1) k2 (s-1) k3 (s-1) k4 (s-1)
Ni2+ (1.40 ± 0.02) x 104 1.1 ± 0.9 0.7 ± 0.3 0.1 ± 0.04
Co2+ (5.51 ± 0.15) x 104 11 ± 3 1.2 ± 0.7 0.5 ± 0.03
Fe2+ (9.71 ± 0.24) x 102 0.06 ± 0.01 - -
Looking at the data obtained, it is possible to assume that, apparently, rubredoxin
does not incorporate all the metals with the same mechanism. There are changes in
the reaction rate and also in the number of reaction steps. Apparently the Ni2+ and
Co2+ incorporation involves three intermediate species, with four rate constants in a
scheme such as, the one presented by Eq. IV.3.
Eq. IV.3
On the other hand, Fe2+ incorporation follows, apparently, a different mechanism
from cobalt and nickel, with only two rate constants observable. In a first approach
this could mean that the apoprotein is able to bind the iron in only two steps, with
only one intermediate. This reaction also needs more time than the one with other
transition metals (cobalt and nickel) to be completed. Because of this, we could think
that it is more difficult to incorporate iron than cobalt or nickel. However, from the
biological point of view and according to the natural abundance of iron rubredoxin,
the opposite seems to occur. Because for this metal there are no other Uv-Vis
features than the one observed at 320 nm, it could be possible that the obtained data
lacks sufficient information for a complete explanation of the iron center assembly.
Another experimental approach was necessary to study this hypothesis. The fact that
this is an iron protein allowed us the use of Mössbauer spectroscopy which is
particularly suited to the study of ferrous iron centers.
A B C D Ek1 k4 k3 k2

Chapter IV
139
IV.2.4 – Iron incorporation by apoprotein form of rubredoxin: Rapid Freeze-Quench 57Fe Mössbauer spectroscopy
57Fe Mössbauer spectroscopy proved to be very useful to understand and monitor
iron containing proteins[7]. This technique is even more powerful when coupled to
fast kinetic techniques like Rapid Freeze-Quench which enables the capture of
reaction intermediates[8, 9]. In this particular case, these two techniques combined
can provide clear information not only on the number of intermediates, but also on
the reaction kinetics.
Since there are some experimental limitations, the experiment had to be changed in
order to fulfil the needed requirements. The kinetic approach is no longer pseudo-first
order, because for this experiment the initial concentrations of both apoprotein and
metal were the same. As before, this experiment was also performed in anaerobic
conditions (see Appendix B) and in 50 mM MES buffer pH 6.25.
In order to help with data analysis two samples were prepared to study the spectral
features of the initial iron environment (free Fe2+ in buffer solution) and the final
reaction product (57Fe rubredoxin). The spectrum for the initial iron environment was
fitted with a quadrupole doublet with an average ΔEQ = 3.29mm/s and δ = 1.37 mm/s.
These parameters correspond to a high-spin ferrous iron (S=2) coordinated either by
oxygen or nitrogen ligands. This is in accordance with the fact that the iron ions are
free in solution (aqua complex). This fact also justifies the abnormally large line width
that indicates that the data should be fitted with more than one quadrupole doublet,
due to the distribution of iron species in solution. The 57Fe reconstituted rubredoxin
was also fitted with a single quadrupole doublet with ΔEQ = 3.25 mm/s and
δ = 0.70 mm/s. These parameters correspond to a high-spin ferrous iron (S=2)
coordinated by sulphur ligands, and they are in accordance with the previously
published values for native, reduced as-isolated rubredoxins[10-12]. The next data
was obtained for the samples generated in the RFQ experiment.

Structural and Mechanistic Studies of Iron Containing Proteins
140
Figure IV. 14 – Mössbauer spectra of A) 700 μM 57Fe in 50 mM MES buffer, pH 6.25
and B) 700 μM Dg rubredoxin reconstituted with 57Fe in the same buffer. The solid
lines represent the best fits for the experimental data.
A)
B)

Chapter IV
141
Figure IV. 15 – Mössbauer plot with the spectra obtained for the RFQ time course.
A) 10 ms; B) 16 ms; C) 80 ms; D) 125 ms; E) 500 ms; F) 5 s; G) 1 min 15 s;
H) Intermediate 1; I) Intermediate 2; The overlapped solid lines represent the best fits
to the experimental data.
A)
B)
C)
D)
E)
F)
G)
H)
I)

Structural and Mechanistic Studies of Iron Containing Proteins
142
The analysis of the data obtained in the RFQ experiment revealed a three step
reaction, with two intermediate species. In the table below are shown the parameters
used to fit the experimental data. The evolution of each species with time is
presented in the table IV.3.
Table IV. 2 – Parameters used to fit the Mössbauer spectra of the samples obtained
in the rapid freeze-quench experiment.
Species
I1 I2 Reduced
Rubredoxin
δ (mm/s) 1.38 ± 0.02 1.40 ± 0.02 0.70 ± 0.01
ΔEQ (mm/s) 2.93 ± 0.05 2.19 ± 0.02 3.26 ± 0.02
Γ 0.35 ± 0.03 0.34 ± 0.03 0.35 ± 0.02
Table IV. 3 – Percentage for species of table IV.2 in each sample studied
%
Sample Fe2+
Reduced Rubredoxin
I1 I2
10 ms 52 10 27 11
16 ms 50 15 25 10
80 ms 48 28 17 7
125 ms 42 37 15 6
500 ms 22 64 9 5
5 s 8 86 4 2
1 min 15 s 0 100 0 0

Chapter IV
143
The values presented in table IV.2 show at least two different iron environments. One
is similar to that observed in the iron solution, without the protein, and corresponds to
a high-spin ferrous iron (S=2) coordinated either by oxygen or nitrogen ligands, with
ΔEQ ranging from 2 to 3 mm/s and δ always close to 1.4 mm/s. The other can be
attributed to the reconstituted rubredoxin with ΔEQ = 3.26 mm/s and δ = 0.70 mm/s,
which correspond to a high-spin ferrous iron (S=2) coordinated by sulphur.
IV.3 - Discussion
Metallic centers have an enormous relevance in biology. They are responsible for
several functions that range from catalysis to electron transfer. The difference
between all the centers and their function must lie on its nature (metal ion and
coordination). So, how does Nature “decide” which metal to incorporate in a certain
cluster/protein? Maybe studying the incorporation of a certain metal in well
characterized proteins will help to understand why a certain metal ion is “chosen”
instead of another.
In this case an iron center was studied. The iron centers represent only one example,
even though they are associated with several types of reactions/mechanisms.
Rubredoxin, for example, is normally associated with electron transfer[2, 3, 5, 13].
The data presented in this chapter reveal some apparently unexpected results. Since
the native protein is an iron protein, it was expected that from all the studied metals,
the fastest to be incorporated in the protein was iron. However, the data obtained by
stopped-flow pointed, in a first approach, not only to a faster process for incorporation
reactions of both nickel and cobalt, but also to a different mechanism between these
two metal ions when compared to iron.
With the conditions used in this experiment, cobalt and nickel follow a four
consecutive step mechanism, where the first rate constant is dependent on the
reagents’ concentration (second order). Despite being difficult to assign the obtained
rate constants to a specific path in the metal incorporation, it is possible to assume
that, in these cases (cobalt and nickel), the metal binds to the protein (to one or more

Structural and Mechanistic Studies of Iron Containing Proteins
144
cysteine residues) in the first step. The following steps can be attributed either to the
binding of the other cysteines or to some sort of conformational change.
On the other hand, the stopped-flow data collected for iron incorporation showed a
mechanism defined by only two rate constants. The first remained dependent on the
reagents’ concentration, and the second remained independent. These data could
point to a different pathway for iron incorporation. Also, the obtained values were
much smaller than for cobalt and nickel.
However, the data obtained from the rapid freeze-quench Mössbauer brought some
important aspects to the forefront. Despite the differences in the experimental
procedure, the data obtained indicated not only to the presence of at least two
intermediate species, but also a fast appearance of a first intermediate (27 % of the
total in the first 10 ms).
Another interesting aspect lies in the values obtained from the fit of the Mössbauer
data. The intermediate species parameters point to a high-spin ferrous iron
coordinated by either oxygen or nitrogen (similar to what was found for iron solution)
which means, in a first approach, that the iron is not coordinated by the cysteine
residues. These parameters are also different from the ones previously published by
Yoo and coworkers, referring to the C9S and C42S rubredoxin mutants from
Clostridium pasteurianum. In these proteins the metallic center was modified in order
to have one cysteine less as a ligand for iron. As a result, in that work two different
species were reported, A and B, that were characterized and presented
ΔEQ = 2.95 mm/s and δ = 0.79 mm/s for form A and ΔEQ = -3.27 mm/s and δ = 0.79
mm/s for form B[10].
Thus, a possible explanation could be related to some kind of “chelating” behavior
from apoRd which removes the iron from the solution and goes through several
conformational adjustments until it reaches its final structure. As it is difficult to assign
the steps obtained with cobalt and nickel, maybe the process is similar and the
obtained rate constants for the mechanism kinetically describe the process.
The fact that rubredoxin has only one tryptophan in its sequence makes possible the
use of other techniques like stopped-flow coupled to fluorescence, for example, to
understand if there are conformational adjustments during metal incorporation[14,
15].

Chapter IV
145
Therefore, since it is not possible to assume large differences between the
incorporation of the studied metals, it is possible to assume that in Nature the
“choice” for iron instead of other metal can be related to other properties of this type
of centers, like redox potentials for example, that favor the reactions in which they are
involved. Thus, in a biological approach, a cobalt-rubredoxin or a nickel-rubredoxin,
could not be adapted in order to accomplish the role in the cell metabolism.
Besides, this study only aimed the metal incorporation by the protein, meaning that
there is not data concerning the stability of the rubredoxins formed (cobalt and
nickel), and the fact that they are faster in the metal incorporation does not
necessarily mean that they are more stable. In addition, an unstable behavior of
these forms could also be an explanation for the use of iron instead of these metals
in the native protein.

Structural and Mechanistic Studies of Iron Containing Proteins
146
IV.4 – References
[1] A.S. Pereira, P. Tavares, F. Folgosa, R.M. Almeida, I. Moura, J.J.G. Moura,
Superoxide reductases, European Journal of Inorganic Chemistry (2007) 2569-2581.
[2] J.V. Rodrigues, I.A. Abreu, L.M. Saraiva, M. Teixeira, Rubredoxin acts as an
electron donor for neelaredoxin in Archaeoglobus fulgidus, Biochem Biophys Res
Commun 329 (2005) 1300-1305.
[3] E.D. Coulter, D.M. Kurtz, Jr., A role for rubredoxin in oxidative stress protection in
Desulfovibrio vulgaris: catalytic electron transfer to rubrerythrin and two-iron
superoxide reductase, Arch Biochem Biophys 394 (2001) 76-86.
[4] I. Moura, M. Teixeira, J. LeGall, J.J. Moura, Spectroscopic studies of cobalt and
nickel substituted rubredoxin and desulforedoxin, J Inorg Biochem 44 (1991) 127-
139.
[5] F. Auchere, S.R. Pauleta, P. Tavares, I. Moura, J.J. Moura, Kinetics studies of the
superoxide-mediated electron transfer reactions between rubredoxin-type proteins
and superoxide reductases, J Biol Inorg Chem 11 (2006) 433-444.
[6] M.J. Winter, d-Block chemistry, Oxford University Press, 1994.
[7] E. Munck, Mossbauer spectroscopy of proteins: electron carriers, Methods
Enzymol 54 (1978) 346-379.
[8] J.M. Bollinger, Jr., W.H. Tong, N. Ravi, B.H. Huynh, D.E. Edmondson, J.A.
Stubbe, Use of rapid kinetics methods to study the assembly of the diferric-tyrosyl
radical cofactor of E. coli ribonucleotide reductase, Methods Enzymol 258 (1995)
278-303.
[9] N. Ravi, J.M. Bollinger, B.H. Huynh, D.E. Edmondson, J. Stubbe, Mechanism of
Assembly of the Tyrosyl Radical-Diiron(Iii) Cofactor of Escherichia-Coli
Ribonucleotide Reductase .1. Mossbauer Characterization of the Diferric Radical
Precursor, J. Am. Chem. Soc. 116 (1994) 8007-8014.

Chapter IV
147
[10] S.J. Yoo, J. Meyer, C. Achim, J. Peterson, M.P. Hendrich, E. Munck, Mossbauer,
EPR, and MCD studies of the C9S and C42S variants of Clostridium pasteurianum
rubredoxin and MDC studies of the wild-type protein, J Biol Inorg Chem 5 (2000) 475-
487.
[11] I. Moura, B.H. Huynh, R.P. Hausinger, J. Le Gall, A.V. Xavier, E. Munck,
Mossbauer and EPR studies of desulforedoxin from Desulfovibrio gigas, J Biol Chem
255 (1980) 2493-2498.
[12] C. Schulz, P.G. Debrunner, Rubredoxin, a simple iron-sulfur protein: its spin
Hamiltonian and hyperfine parameters Journal de Physique Colloques 37 (1976) 153
- 158.
[13] F. Auchere, R. Sikkink, C. Cordas, P. Raleiras, P. Tavares, I. Moura, J.J. Moura,
Overexpression and purification of Treponema pallidum rubredoxin; kinetic evidence
for a superoxide-mediated electron transfer with the superoxide reductase
neelaredoxin, J Biol Inorg Chem 9 (2004) 839-849.
[14] M. Frey, L. Sieker, F. Payan, R. Haser, M. Bruschi, G. Pepe, J. LeGall,
Rubredoxin from Desulfovibrio gigas. A molecular model of the oxidized form at 1.4 A
resolution, J Mol Biol 197 (1987) 525-541.
[15] M. Bruschi, The amino acid sequence of rubredoxin from the sulfate reducing
bacterium, Desulfovibrio gigas, Biochem Biophys Res Commun 70 (1976) 615-621.

Structural and Mechanistic Studies of Iron Containing Proteins
148

Appendix A
149
Methods

Structural and Mechanistic Studies of Iron Containing Proteins
150
A.1 – E.coli BL21(DE3) transformation protocol
The transformation protocol used in this work was based on the one recommended
by the manufacturer[1]. It will be briefly described in this section.
1. Thaw the competent cells on ice.
2. Aliquot the cells in three prechilled eppendorf tubes.
3. Add to each tube 1.7 μL of a freshly prepared sterile β-mercaptoethanol
solution (1:10 dilution). Swirl the tubes gently.
4. Incubate the reactions on ice for 10 minutes, swirling gently every two
minutes.
5. Add the DNA desired for the transformation to each eppendorf following the
table below.
Table A. 1 - Volumes used for transformation
Reaction Positive control Negative control
Plasmid 3-4 μL - -
pUC18 - 1 μL -
H20 Sterile - - 1 μL
6. Incubate the reactions on ice for 30 minutes.
7. Preheat SOC medium (see A.5.3) in a 42 ºC water bath. This medium will
be used in step 10.
8. Heat-shock each transformation reaction at 42 ºC for 42 seconds. This is a critical step, every condition of temperature and time must be exactly followed.
9. Incubate the reactions on ice for 2 minutes.
10. Add 450 μL of SOC medium to each eppendorf and incubate for 1 hour at
37 ºC and 225 rpm.

Appendix A
151
11. Using a sterile spreader, spread 3 different volumes of the grown cells
(such as 50, 100 and 200 μL) onto LB-Agar plates supplemented with
0.1 mg/mL ampicillin. For positive and negative control, plate only one
volume, such as 200 μL.
12. Incubate the plates overnight at 37 ºC.
When using this protocol it is expected to obtain enough colonies for use in the next
steps of overexpression.
A.2 – SDS-PAGE electrophoresis: Solutions and methods
The sodium dodecyl sulfate polyacrylamide gel electrophoresis (SDS-PAGE) is a
technique widely used for both determination of protein molecular mass and to
evaluate the purity of protein fractions. It is based on the technique described by
Laemmli and in this thesis it was used mainly for purity assessment[2]. The following
tables describe the solutions used for this technique.
Table A. 2 – Volumes of each solution used for the SDS-PAGE gel electrophoresis.
Stacking gel Running gel
5 % of
Acrylamide % of Acrylamide (volumes in mL) Solution
(volumes in mL) 5 7.5 10 12.5 15
I - 0.75 0.75 0.75 0.75 0.75
II 0.45 - - - - -
III 0.30 1.25 1.33 1.67 2.08 2.5
10% SDS 0.018 0.05 0.05 0.05 0.05 0.05
dH2O 0.94 2.93 2.85 2.51 2.1 1.66
10% PSA 13.5 μL 38 μL 38 μL 38 μL 38 μL 38 μL
TEMED 2 μL 2.5 μL 2.5 μL 2.5 μL 2.5 μL 2.5 μL

Structural and Mechanistic Studies of Iron Containing Proteins
152
Table A. 3 – Stock solutions used for the SDS-PAGE gel electrophoresis
Solution Reagents Amount Obs.
2.5 M Tris Base 30.3 g
37% HCl until pH8.8 I Running gel Buffer
H2O until 100 mL
pH 8.8-9.0
0.5 M Tris Base 6.06 g
37% HCl until pH 6.8 II Stacking gel buffer
H2O until 100 mL
pH 6.6-6.8
Acrylamide 30 g
Bisacrylamide 0.8 g III
Acrylamide/
Bisacrylamide
(30:0.8) H2O Up to 100mL
-
SDS 10 g IV 10% SDS
H20 Up to 100 mL -
Ammonium Persulfate 0.5 g V 10 % APS
H2O Up to 5 mL
Prepare prior
to use
0.25 M Tris Base 30.3 g
1.92 M Glycine 144.1 g
SDS 10 g VI Tris-Glycine Buffer
H2O Up to 1000 mL
pH 8.3
Dilute 1:10
prior to use
Solution II 5 mL
10% SDS 8 mL
b-Mercaptoethanol 1 mL
Glycerol 2 mL
Bromophenol Blue 4 mg
VII Sample Buffer
H2O Up to 20 mL
Add 1:1 to
the sample
Coomassie Blue
R-250 1 g
Glacial Acetic Acid 15 mL
Methanol 90 mL
VIII Coomassie Brilliant
Blue Staining
H2O Up to 200 mL
-
Glacial Acetic Acid 75 mL
Methanol 450 mL IX Distaining solution
H2O Up to 1000 mL
-

Appendix A
153
A.3 – Protein quantification: Lowry method
Nowadays, there are several methods available for protein quantification. In this work
the method described by Lowry and coworkers was used[3] .
1. Prepare three protein samples with different concentrations into a final
volume of 0.1 mL.
2. Add to each sample 1 mL of solution C and incubate for 10 minutes.
3. Add 0.1 mL of solution D, mix and incubate for 30 minutes.
4. Measure the absorbance at 580, 680 and 750 nm.
The solutions used in this method are described in the table below. A bovine serum
albumin (BSA solution 2 mg/mL purchased from Sigma®) was used as standard.
Table A. 4 - Solutions used for Lowry method
Solution Description Preparation details
A 2% Na2CO3 in 0.1 N NaOH2 g of 2% Na2CO3 + 0.4g of
NaOH in 100 mL of H20
B1 1% CuSO4.5H20 1 g of CuSO4.5H20 in 100 mL
of H20
B2 2% Sodium tartarate 2 g of sodium tartarate in 100
mL of H20
B 1:1 mixture of B1 and B2 -
(prepared prior to use)
C Alkaline copper solution 50 mL of A + 1 mL of B
(prepared prior to use)
D Folin reagent 1:1 diluted -
(prepared prior to use)

Structural and Mechanistic Studies of Iron Containing Proteins
154
Figure A. 1 – Typical calibration curve obtained with the BSA standard for the Lowry method.
0,0
0,2
0,4
0,6
0,8
0 20 40 60 80
Protein (μg)
Abs
orba
nce
Abs750 Abs680 Abs580

Appendix A
155
A.4 – Growth media description: LB, M9 and SOC
All the proteins used in the work described in this thesis were obtained using
overexpression systems. In this section all the growth media used for this work will be
described. All the volumes mentioned are for 1 L of culture medium.
A.4.1 – Luria-Bertani broth
The Luria-Bertani broth is widely used for bacterial growth. It provides a large amount
of nutrients and other important elements for cell growth and protein overexpression.
Table A. 5 – Reagents used for LB medium preparation
Reagent Amount per Liter
NaCl 10 g
Tryptone 10 g
Yeast extract 5 g
The solution is made with deionized water and the pH is adjusted to 7.0 with a
concentrated solution of NaOH. The solution is finally autoclaved for 15min at 121 ºC
to keep sterile. The LB-Agar solution used for plates has the same preparation but
with addition of 20 g of agar.

Structural and Mechanistic Studies of Iron Containing Proteins
156
A.4.2 – M9 growth medium
The necessity of controlling the growth conditions sometimes requires the use of a
defined growth media. In this thesis the chosen medium was the M9. This medium
allows us to control not only the amount but also the type of metal ions available for
cell growth.
Table A. 6 – Solutions used to supplement the M9 medium.
M9 Salts (10x) Vitamin (200x)
Reagent Amount per Liter Reagent Amount per Liter
Na2HPO4 128 g Thiamine -HCl 1 g
KH2PO4 30 g Biotin 0.2 g
NH4Cl 10 g Choline chloride 0.2 g
NaCl 5 g Folic acid 0.2 g
Nicotinic acid 0.2 g
Calcium
pantothenate 0.2 g
Pyridoxine 0.2 g
Riboflavin 0.02 g
The M9 salts should be diluted with Millipore® grade water (100 mL M9 salts plus
880 mL of water) and autoclaved. The vitamin solution should be filtered sterile and
stored at 4 ºC.

Appendix A
157
Table A. 7 - Reagents used for M9 medium preparation
M9 Medium
Reagent Amount per Liter
1M MgSO4 1 mL
0.1M CaCl2 1 mL
20% Glucose 20 mL
0.1% Thiamine -HCl 0.5 mL
Vitamin (200x) 5 mL
0.1M Metal ion solution 1 mL
100 mg/mL Ampicillin 1 mL
These reagents should be added to the diluted M9 salts solution prior to use. The
amount of “metal ion solution” used should take into account the solubility of the
metal and its toxicity to the cells. All the solutions used should be kept sterile.
A.4.3 – SOC medium
Like LB, the SOC is a rich culture medium that provides a large amount of nutrients
important for the fast cell growth. As such, it is widely used in transformation
procedures, were a fast cell growth is important to obtain good results.
Table A. 8 - Reagents used for SOC medium preparation
Reagent Amount per Liter
Tryptone 20 g
Yeast extract 5 g
NaCl 0.5 g
1M MgCl2 10 mL
1M MgSO4 10 mL
20% Glucose 20 mL

Structural and Mechanistic Studies of Iron Containing Proteins
158
The solution should be autoclaved before the addition of MgCl2, MgSO4, and
glucose. At the end it should be filtered and kept sterile.
A.5 – Buffer solutions
All the buffer solutions used in this work were prepared by dilution from the
correspondent 1 M stock solution at room temperature. The stock solutions and the
buffers used for HPLC were filtered (45 μm filter pore size) prior to use.
A.5.1 – Tris-HCl buffer
In order to prepare 1000 mL of a 1 M of Tris-HCl buffer solution, 121 g of
Tris(hydroxymethyl)aminomethane (purchased from Sigma®) powder was dissolved
in about 800 mL of deionized water. Then, a certain amount of concentrated HCl
solution (37% (w/v)) was added in order to obtain the desired pH value. Finally, the
pH value was verified and the volume was adjusted to 1000 mL. The table below
shows the volumes of hydrochloric acid necessary to obtain the desired pH value in a
1 M buffer solution.
Table A. 9 – Volumes of HCl 37% (w/v) added to obtain the desired pH value
Volume Added (mL) Final pH
68.5 7.4
63.6 7.6
53.8 7.8
44.4 8.0

Appendix A
159
A.5.2 – Phosphate buffer
In order to prepare 100 mL of a 1 M solution of phosphate buffer, two solutions were
prepared (solution A and B).
Solution A is a 1 M solution of monobasic potassium phosphate (139 g in 1000 mL of
H2O). Solution B is a 1 M solution of dibasic potassium phosphate (268 g in 1000 mL
of H2O). These two solutions were mixed in different ratios to obtain a final 1 M
solution of phosphate buffer with the desired pH.
Table A. 10 – Volume ratios used to obtain a 1 M solution of phosphate buffer at a
certain pH
Volume A (mL) Volume B (mL) Final pH
19.0 81.0 7.4
13.0 87.0 7.6
8.5 91.5 7.8
5.3 94.7 8.0
A.5.3 – MES Buffer
The 4-morpholineethanesulfonic acid (MES) sodium salt was used as buffer for the
rubredoxin metal incorporation experiments. This salt can serve as an efficient buffer
for pH values ranging from 5.5 to 6.7. This buffer was prepared by adding 21.72 g of
MES in 100 mL of Millipore® grade water, up to 1 M final concentration. The final pH
was adjusted with an HCl 37 % (w/v) solution.
Like for the other buffers, all the solutions used were made by dilution of the 1M
solution with Millipore® grade water.

Structural and Mechanistic Studies of Iron Containing Proteins
160
A.6 – References
[1] Stratagene, BL21(DE3) Competent Cells, Instruction Manual, Stratagene, La
Jolla, 2004.
[2] U.K. Laemmli, Cleavage of structural proteins during the assembly of the head of
bacteriophage T4, Nature 227 (1970) 680-685.
[3] O.H. Lowry, N.J. Rosebrough, A.L. Farr, R.J. Randall, Protein measurement with
the Folin phenol reagent, J Biol Chem 193 (1951) 265-275.

Appendix B
161
Equipment

Structural and Mechanistic Studies of Iron Containing Proteins
162
As was mentioned before, for this work several setups were used in order to achieve
the best experimental conditions. For this purpose, some commercial equipment had
to be customized. This customization will be briefly described in this Appendix.
B.1 – Stopped-Flow apparatus: aerobic and anaerobic setup
All the stopped-flow experiments were performed using a Bio-Logic apparatus. Our
equipment is composed by two SFM-300 modules (each one composed by three
syringes and three independent stepping motors, one per syringe), powered by a
MPS-60 unit and controlled by a PC with BioKine32 v.4.45 software provided by Bio-
Logic. One of these SFM-300 modules is kept under anaerobic conditions inside a
glove box (mBraun UniLab, less than 1 ppm of oxygen) to achieve the best
conditions for the experiments. The SFM-300 module also allows temperature
control, an important feature that was used in all the procedures and was particularly
important for the electron transfer experiments where the temperature was lowered
to 10 ºC to reduce the velocity of the reaction.
In the experiments described in this thesis two detection methods were used coupled
to the stopped-flow equipment. The first was a Diode Array spectrophotometer
(TIDAS, J&M) with 256 diodes ranging from 300 to 1100 nm. This diode array is able
to collect as many as 3690 spectra at 0.8 ms/spectrum. For better signal to noise
ratio, larger integration times were used (never lower than 1 ms/spectrum). This
equipment is particularly useful when 3D analysis is needed.
The second detection apparatus used was a MOS-250 (Bio-Logic). This is a fast
UV-Vis spectrophotometer that is able to cover an emission spectral range from 220
to 1010 nm. This equipment is able to work in three different modes: as a transient
recorder, a scanning spectrophotometer and a chart recorder. However, it was only
used as a transient recorder. In this mode it is able to collect data (single wavelength
at a time) from 50 μs to 1000 s per point.
Both equipments are connected via optical fibers to the observation head (where the
cuvette is placed) of SFM-300 and are controlled with the same software. The
anaerobic experiments were performed inside a glove box (UniLab model from
mBraun) which was adapted for this purpose. The modifications included a set of

Appendix B
163
custom made doors specially built (ERT, Equipamentos e Reparações Técnicas,
Lda) to allow the total electronic control of the equipment from outside.
Figure B. 1 – A) Scheme of Bio-Logic SFM300 module used for the stopped-flow
and rapid freeze-quench experiments. Adapted from [1]. B) Generic scheme of a
rapid freeze -quench apparatus.
Figure B. 2 – A) Scheme of the Bio-Logic TC 100/10 cuvette, used for the stopped-
flow experiments. B) Vertical cut of the TC 100/10 cuvette. The dashed arrow
represents the light path. Adapted from [1].
Syringes
Mixer
Aging Hose
Spray nozzle
Isopentane bath
A) B)
A) B)

Structural and Mechanistic Studies of Iron Containing Proteins
164
B.2 – Rapid Freeze-Quench apparatus: aerobic and anaerobic setup
The RFQ setup installed in Chemistry Department of Faculdade de Ciências e
Tecnologia da Universidade Nova de Lisboa consists of a set of drive syringes, RFQ
module, a power unit, a computer and a quenching bath.
In order to perform the rapid freeze-quench experiments presented in chapter 4 of
this thesis, it was necessary to fit the RFQ module (Update Instrument Inc) to our
stopped-flow machine and isopentane bath equipments (Bio-Logic). The RFQ
module consist of a set of small nylon hoses that connect the SFM-300 module to a
mixing chamber, a set of different aging hoses that allow different reaction times and
a spray nozzle which is used to vaporize the sample into an isopentane bath. This
cooling bath is kept at -140 ºC with a liquid nitrogen refrigerated system.
Therefore, the RFQ experiment involves mixing two or three reagents rapidly and
efficiently through the mixing chamber, allowing the reaction to proceed for a specific
period of time (from 10 millisecond to hours depending on the volume of the tube),
freeze-quenching the reaction mixture by squirting it into the quenching bath and
packing the frozen sample into a Mössbauer sample cell. A similar setup was
previously described by Ravi and coworkers[2].
The anaerobic apparatus is based on the one described above but in this case only
the aging hose and the isopentane bath stand outside the glove box, meaning that all
the other manipulations are performed in anaerobic conditions. Because the aging
hose is accessible from the outside it is simple to change it in order to obtain different
reaction times. Another advantage of this equipment is the fact that it is totally
controlled from the outside.
Like for the anaerobic stopped-flow experiments, another set of structural
modifications was performed in the glove box in order to allow the equipment
control/communication from the outside. These modifications consisted in a set of
custom made doors specially designed and built (ERT, Equipamentos e Reparações
Técnicas, Lda) to allow the collection of the sample outside the glove box. The
following figure illustrates the setup.

Appendix B
165
Figure B. 3 – Anaerobic stopped-flow apparatus (SFM-300 from Bio-Logic) installed
inside a UniLab glove box (from mBraun). The inset shows the custom made
connectors designed to fit the equipment that is used for the anaerobic RFQ
experiments.

Structural and Mechanistic Studies of Iron Containing Proteins
166
B.3 – Closed-Cycle Refrigerator (CCR) Mössbauer spectrometer: a general overview
As has been showed in this thesis, Mössbauer spectroscopy is very useful to
characterize iron containing proteins. However, because of the spectroscopic
properties of these samples it is necessary to achieve very low temperatures to
obtain significant data. This process can be very expensive if we consider that most
of the times the cryogenic temperatures are obtained using liquid Helium.
In the Mössbauer facility installed in Chemistry Department of Faculdade de Ciências
e Tecnologia da Universidade Nova de Lisboa, the low temperatures are achieved
with a Closed-Cycle Refrigerator (CCR). The CCR is used to cool down the sample
reaching temperatures that range from 4.2 K to 325 K. This type of equipment
circulates a fixed volume of gas during operation and is based on the
Gifford-McMahon thermodynamic cycle, based on the controlled compression and
expansion of helium gas.
In this type of refrigerators a compressor unit is used to provide the high pressure
helium gas needed for the cycle. This unit is physically separated from Mössbauer
spectrometer. The connection is made via flexible pressure tubes with self-sealing
screw-couplings, virtually excluding any loss of helium gas even when screwed on
and off repeatedly. The refrigerator includes two cold stages, one for cooling the
sample and one for cooling a radiation shield that surrounds the sample.
This separation between compressor unit and cold head proved to be the great
advantage of the Gifford-McMahon principle. This provides higher flexibility as the
lighter weight cold head can be operated in any mounting position.

Appendix B
167
Figure B. 4 – A) Weak field Mössbauer spectrometer installed in Chemistry
Department of Faculdade de Ciências e Tecnologia da Universidade Nova de
Lisboa. B) Schematic figure of a Mössbauer spectrometer equipped with a CCR,
adapted from[3].
A) B)

Structural and Mechanistic Studies of Iron Containing Proteins
168
In a simplified view, the Gifford-McMahon principle can be divided into four steps
(see figure B.5).
1. The displacer is on the left-hand side of the expansion volume (V) which in
this position corresponds to the dead volume. The low-pressure side is
blocked by the respective valve position, the high-pressure side is opened. In
the pV diagram this means a rise from low pressure (pL) toward high pressure
(pH) at constant minimum volume (Vmin)
2. The displacement piston is drawn back, with the high-pressure valve open,
whereby the volume (V), at constant pressure pH increases to its maximum
value (Vmax).
3. Now the high-pressure valve (H) is closed and the low-pressure valve (L) is
opened. The helium gas expands from pressure pH to pressure pL at constant
volume Vmax.
4. Now, at constant pressure pL, the displacer is brought to its initial position
whereby the helium gas cycle is completed.
The theoretical value of the transferred amount of heat during one cycle corresponds
to the rectangular area in the pV diagram:
Qideal = (Vmax - Vmin) (pH - pL) Eq. B1
In the cold head the high-pressure or low-pressure helium gas is controlled by means
of a rotary valve fitted on the shaft of an electric synchronous motor. The rotary valve
rotates on the control disk. The displacer with integrated regenerator is pneumatically
actuated by a control piston. Through additional holes in the control disk the control
chamber is supplied alternatingly with high pressure and low pressure by means of
the control piston. The operating frequency is around 2 Hz.

Appendix B
169
Figure B. 5 – Generic scheme of the Gifford-McMahon principle used in
Closed-Cycle Refrigerators. Adapted from [4, 5].

Structural and Mechanistic Studies of Iron Containing Proteins
170
B.4 – References
[1] Bio-Logic, http://www.bio-logic.info/rapid-kinetics/spectros.html#spectros_2, 2008.
[2] N. Ravi, J.M. Bollinger, B.H. Huynh, D.E. Edmondson, J. Stubbe, Mechanism of
Assembly of the Tyrosyl Radical-Diiron(Iii) Cofactor of Escherichia-Coli
Ribonucleotide Reductase .1. Mossbauer Characterization of the Diferric Radical
Precursor, J. Am. Chem. Soc. 116 (1994) 8007-8014.
[3] Janis, http://www.janis.com/p-a4k23.html, (2008).
[4] E.S.R. F.,
http://www.esrf.eu/exp_facilities/ID18/pages/exp/cryo/ccr/ccr.html#pictures, (2008).
[5] Janis, http://www.janis.com/p-ccrs2.html, 2008.