Embed Size (px)
Citation preview
Zentrum für Zahn-, Mund- und Kieferheikunde
Poliklinik für Kieferorthopädie
der Universität Hamburg
Direktorin: Universitätsprofessorin Dr. Bärbel Kahl-Nieke
Structural aspects of bleaching and fluoride
application on dental enamel
Dissertation
zur Erlangung des Grades eines Doktors der Zahnmedizin
der Medizinischen Fakultät der Universität Hamburg vorgelegt von
Xiaojie Wang
aus Heilongjiang, P. R. China
Hamburg, 2008
Angenommen von der Medizinischen Fakultät
der Universität Hamburg am: 24th November, 2008
Veröffentlicht mit der Genehmigung
der Medizinischen Fakultät Hamburg
Prüfungsausschuss, der / die Vorsitzende: Prof. Dr. Bärbel Kahl-Nieke
Prüfungsausschuss: 2. Gutachter/in: Prof. Dr. Arndt Klocke
Prüfungsausschuss: 3. Gutachter/in: Prof. Dr. Ulrich Bismayer

To my family
I
Table of Contents:
Abstract IV
Abbreviations VI
1 Introduction 1
2 Literature review 3
2.1 Dental enamel 3
Enamel structure 3
The pH value and enamel erosion 7
Fluoride and enamel erosion 9
2.2 Tooth color 11
Natural tooth color 11
Tooth discoloration 11
Extrinsic stains 11
Intrinsic stains 12
Age-related stains 13
2.3 Bleaching 13
History 13
Methods of tooth bleaching 15
Vital tooth bleaching 15
Non-vital tooth bleaching 16
The mechanism of tooth bleaching 17
Peroxide-based bleaching agents 17
Non-peroxide-based bleaching agents 20
Composition of commercial bleaching agents 20
2.4 Effects of tooth bleaching 21
Peroxide-based bleaching agents 21
Effects on soft tissues 21
Effects on enamel 22
Effects on dentine 24
Effects on restorations 25
II
Non-peroxide-based bleaching agents 25
2.5 Aims of this study 26
3 Materials and methods 28
3.1 Sample preparation 28
3.2 Experimental materials 29
Commercial bleaching agents 29
Aqueous solutions 31
3.3 Treatment procedures 32
Bleaching treatment of dental enamel 32
Sodium fluoride treatment of dental enamel 35
Bleaching and sodium fluoride treatment of geological hydroxyapatite 37
3.4 Methods of analysis 37
Scanning electron microscopy (SEM) 37
Electron probe microanalysis (EPMA) 38
Vibrational spectroscopy (ATR IR and Raman) 40
X-ray diffraction (XRD) 44
Flame atomic absorption spectrophotometer (FAAS) and total reflection x-ray fluorescence
(TXRF) 45
4 Results 48
4.1 Effects of bleaching treatment on dental enamel 48
SEM analysis 48
XRD and IR analyses on powders 48
ATR IR analysis 50
Peroxide-based bleaching agents 50
Non-peroxide-based bleaching agents 53
Raman scattering spectroscopy analysis 56
EPMA analysis 57
FAAS and TXRF analyses 61
4.2 Effects of sodium fluoride treatment on enamel 62
Enamel erosion-reversing effect 62
Enamel erosion-preventing effect 62
III
The combined application of sodium fluoride and citric acid 63
4.3 Effects of different treatments on geological hydroxyapatite 68
5 Discussion 71
5.1 Effects of peroxide-based bleaching agents on enamel 71
5.2 Effects of non-peroxide-based bleaching agents on enamel 72
5.3 Effects of sodium fluoride on enamel 75
5.4 Comparison of treated enamel and geological hydroxyapatite 78
6 Conclusions 79
References 81
Acknowledgements 94
Curriculum Vitae 96
Eidesstattliche Versicherung 98
Abstract
IV
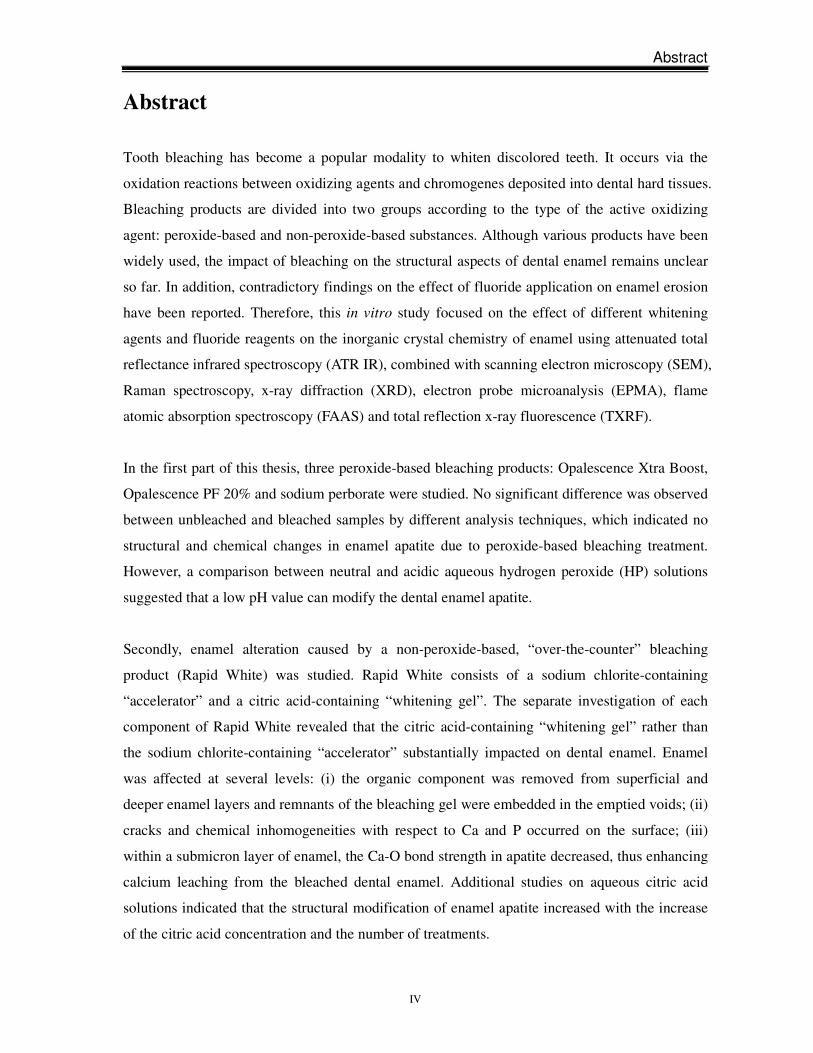
Abstract
Tooth bleaching has become a popular modality to whiten discolored teeth. It occurs via the
oxidation reactions between oxidizing agents and chromogenes deposited into dental hard tissues.
Bleaching products are divided into two groups according to the type of the active oxidizing
agent: peroxide-based and non-peroxide-based substances. Although various products have been
widely used, the impact of bleaching on the structural aspects of dental enamel remains unclear
so far. In addition, contradictory findings on the effect of fluoride application on enamel erosion
have been reported. Therefore, this in vitro study focused on the effect of different whitening
agents and fluoride reagents on the inorganic crystal chemistry of enamel using attenuated total
reflectance infrared spectroscopy (ATR IR), combined with scanning electron microscopy (SEM),
Raman spectroscopy, x-ray diffraction (XRD), electron probe microanalysis (EPMA), flame
atomic absorption spectroscopy (FAAS) and total reflection x-ray fluorescence (TXRF).
In the first part of this thesis, three peroxide-based bleaching products: Opalescence Xtra Boost,
Opalescence PF 20% and sodium perborate were studied. No significant difference was observed
between unbleached and bleached samples by different analysis techniques, which indicated no
structural and chemical changes in enamel apatite due to peroxide-based bleaching treatment.
However, a comparison between neutral and acidic aqueous hydrogen peroxide (HP) solutions
suggested that a low pH value can modify the dental enamel apatite.
Secondly, enamel alteration caused by a non-peroxide-based, “over-the-counter” bleaching
product (Rapid White) was studied. Rapid White consists of a sodium chlorite-containing
“accelerator” and a citric acid-containing “whitening gel”. The separate investigation of each
component of Rapid White revealed that the citric acid-containing “whitening gel” rather than
the sodium chlorite-containing “accelerator” substantially impacted on dental enamel. Enamel
was affected at several levels: (i) the organic component was removed from superficial and
deeper enamel layers and remnants of the bleaching gel were embedded in the emptied voids; (ii)
cracks and chemical inhomogeneities with respect to Ca and P occurred on the surface; (iii)
within a submicron layer of enamel, the Ca-O bond strength in apatite decreased, thus enhancing
calcium leaching from the bleached dental enamel. Additional studies on aqueous citric acid
solutions indicated that the structural modification of enamel apatite increased with the increase
of the citric acid concentration and the number of treatments.
Abstract
V
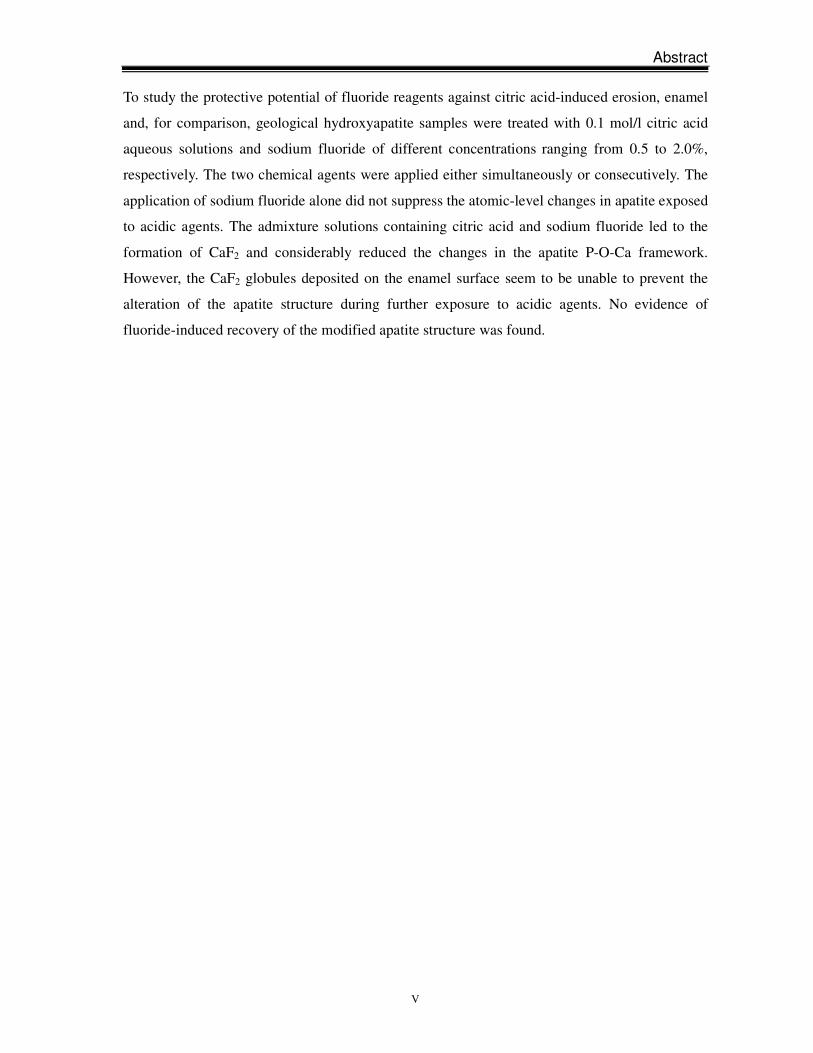
To study the protective potential of fluoride reagents against citric acid-induced erosion, enamel
and, for comparison, geological hydroxyapatite samples were treated with 0.1 mol/l citric acid
aqueous solutions and sodium fluoride of different concentrations ranging from 0.5 to 2.0%,
respectively. The two chemical agents were applied either simultaneously or consecutively. The
application of sodium fluoride alone did not suppress the atomic-level changes in apatite exposed
to acidic agents. The admixture solutions containing citric acid and sodium fluoride led to the
formation of CaF2 and considerably reduced the changes in the apatite P-O-Ca framework.
However, the CaF2 globules deposited on the enamel surface seem to be unable to prevent the
alteration of the apatite structure during further exposure to acidic agents. No evidence of
fluoride-induced recovery of the modified apatite structure was found.
Abbreviations
VI
Abbreviations
Abbreviation Meaning
ATR IR Attenuated total reflectance infrared spectroscopy
ClAP Chlorapatite
CP Carbamide peroxide
EPMA Electron probe microanalysis
FAAS Flame atomic absorption spectroscopy
FAP Fluorapatite
HA Hydroxyapatite
HP Hydrogen peroxide
OTC Over-the-counter
SEM Scanning electron microscopy
SP Sodium perborate
TXRF Total reflection x-ray fluorescence
XRD X-ray diffraction
1 Introduction
1
1 Introduction
In the past decade, tooth bleaching has become the fastest growing field in esthetic dentistry
[Haywood, 2000; Attin et al., 2005]. It has been reported that 28% of adults in the UK are
dissatisfied with their current tooth color [Qualtrough et al., 1994] and in the United States the
number reaches 34% [Odioso et al., 2000]. As a more simple, less invasive and less expensive
means available to lighten discolored teeth when compared to bonding veneers, crowns and laser
bleaching [Haywood, 1992; Sulieman et al., 2004; Matis et al., 2005], tooth bleaching has shown
favorable clinical long-term results and high patient satisfaction [Attin et al., 2005].
Tooth bleaching, also called tooth whitening, refers to a technique where chemical bleaching
materials are applied to brighten discolored teeth. Tooth bleaching materials usually contain a
strong oxidizing agent and the ability to whiten teeth is chiefly due to oxidation reactions
[Gregus and Klaassen, 1995; Attin et al., 2005]. Hydrogen peroxide (HP) or one of its precursors
(carbamide peroxide or sodium perborate) is a popular oxidizing agent used to whiten teeth
[Tredwin et al., 2006]. Bleaching occurs because of the decomposition of peroxide into free
oxygen radicals, which can break down large pigmented molecules deposited in teeth into
smaller, less pigmented molecules [Haywood, 1992]. In recent years, an “over-the-counter”
bleaching product (Rapid White) based on sodium chlorite (NaClO2) has been introduced onto
the market [Attin et al., 2004; Ünlü et al., 2004]. Sodium chlorite can be used as a tooth
bleaching agent resulting from the generation of chlorine dioxide (ClO2) in the presence of acid
[Attin et al., 2004; Zantner et al., 2007]. The oxidation capability of chlorine dioxide (ClO2) has
been confirmed in water treatment and in paper pulp industry [Tzanavaras et al., 2007].
The population’s increasing interest in whitening their teeth has prompted many manufacturers
to develop products for use either in the dental office or at home. It was estimated that bleaching
has been performed on more than one million patients in the dental office [Watts and Addy,
2001]. The fact that more than 35 million tooth whitening kits have been sold worldwide from
May 2001 to March 2005 [SCCP, 2005] points out that a large number of people have used
self-administered home bleaching products. The effect of peroxide-based bleaching products on
dental hard tissues has been investigated [Seghi et al., 1992; Leonard et al., 1997; Tam, 1999;
Potocnik et al., 2000; Dahl, 2003; Park et al., 2004; Ünlü et al., 2004; Attin et al., 2005].
However, the results are conflicting and, therefore, claims that all bleaching systems are safe
cannot be generally accepted [Sulieman et al., 2004; Added et al., 2006; Duschner et al., 2006].
1 Introduction
2
A limited number of studies investigated the influence of non-peroxide-based bleaching
materials on dental hard tissues [Attin et al., 2004; Zantner et al., 2006]. These peroxide-free
bleaching materials can be obtained “over-the-counter” and applied without the dentist’s
supervision. Citric acid contained in Rapid White “whitening gel” normally exists in a variety of
fruits and vegetables and can cause enamel demineralization [Hughes et al., 2000; Eisenburger et
al., 2004; Newby et al., 2006]. The erosive potential of citric acid on dental enamel implies that
Rapid White may lead to enamel erosion. The effect of fluoride application on enamel erosion
was controversially discussed [Ganss et al., 2001; Larsen, 2001], even though fluoride has been
successfully used to inhibit dental caries [Rølla et al., 1993; Ten Cate, 1997]. Therefore, it could
also be questioned whether or not the application of fluoride may prevent or reverse enamel
erosion due to dental bleaching treatment.
In summary, further studies on bleaching-induced changes in the enamel chemistry and structure,
as well as the role of fluoride reagents in preserving the apatite structure, are required.
2 Literature review
3
2 Literature review
2.1 Dental enamel
Enamel structure
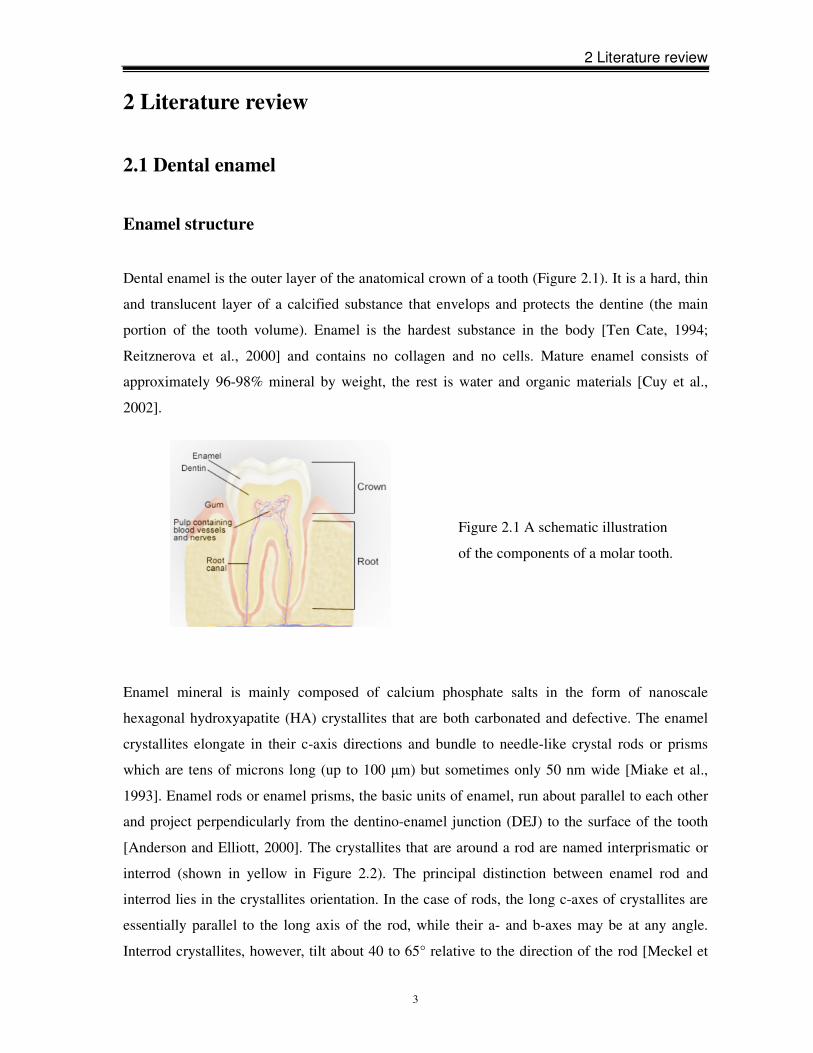
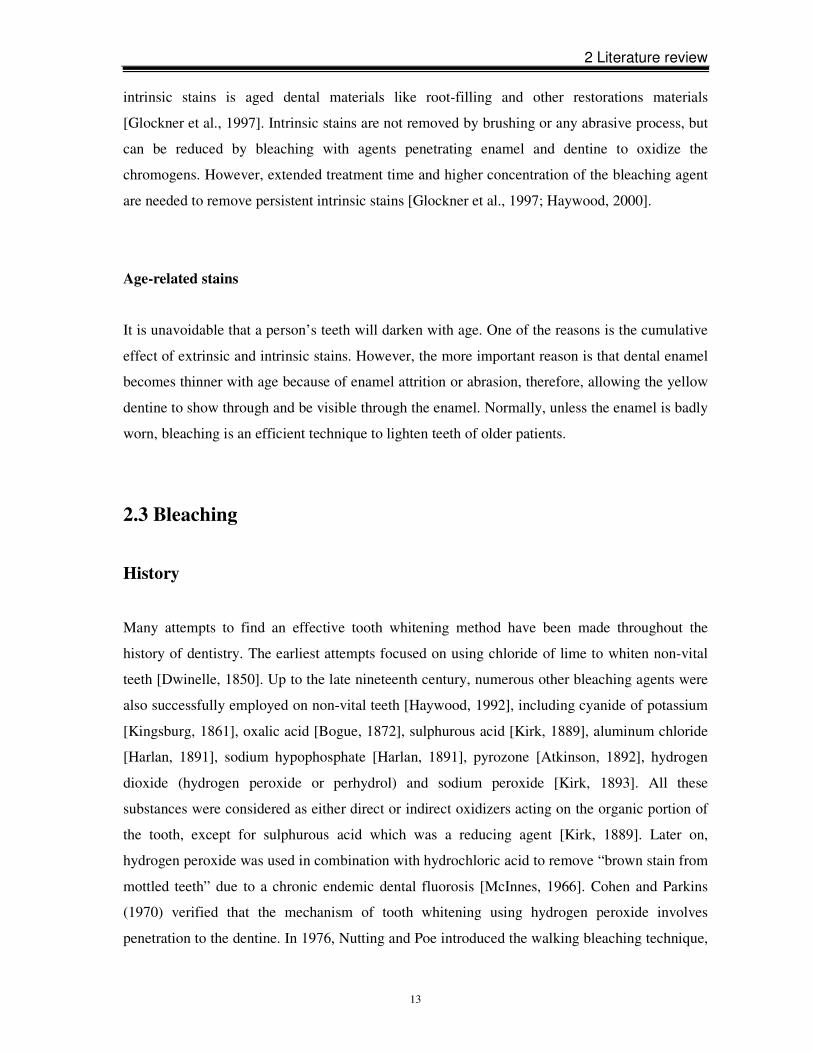
Dental enamel is the outer layer of the anatomical crown of a tooth (Figure 2.1). It is a hard, thin
and translucent layer of a calcified substance that envelops and protects the dentine (the main
portion of the tooth volume). Enamel is the hardest substance in the body [Ten Cate, 1994;
Reitznerova et al., 2000] and contains no collagen and no cells. Mature enamel consists of
approximately 96-98% mineral by weight, the rest is water and organic materials [Cuy et al.,
2002].
Enamel mineral is mainly composed of calcium phosphate salts in the form of nanoscale
hexagonal hydroxyapatite (HA) crystallites that are both carbonated and defective. The enamel
crystallites elongate in their c-axis directions and bundle to needle-like crystal rods or prisms
which are tens of microns long (up to 100 µm) but sometimes only 50 nm wide [Miake et al.,
1993]. Enamel rods or enamel prisms, the basic units of enamel, run about parallel to each other
and project perpendicularly from the dentino-enamel junction (DEJ) to the surface of the tooth
[Anderson and Elliott, 2000]. The crystallites that are around a rod are named interprismatic or
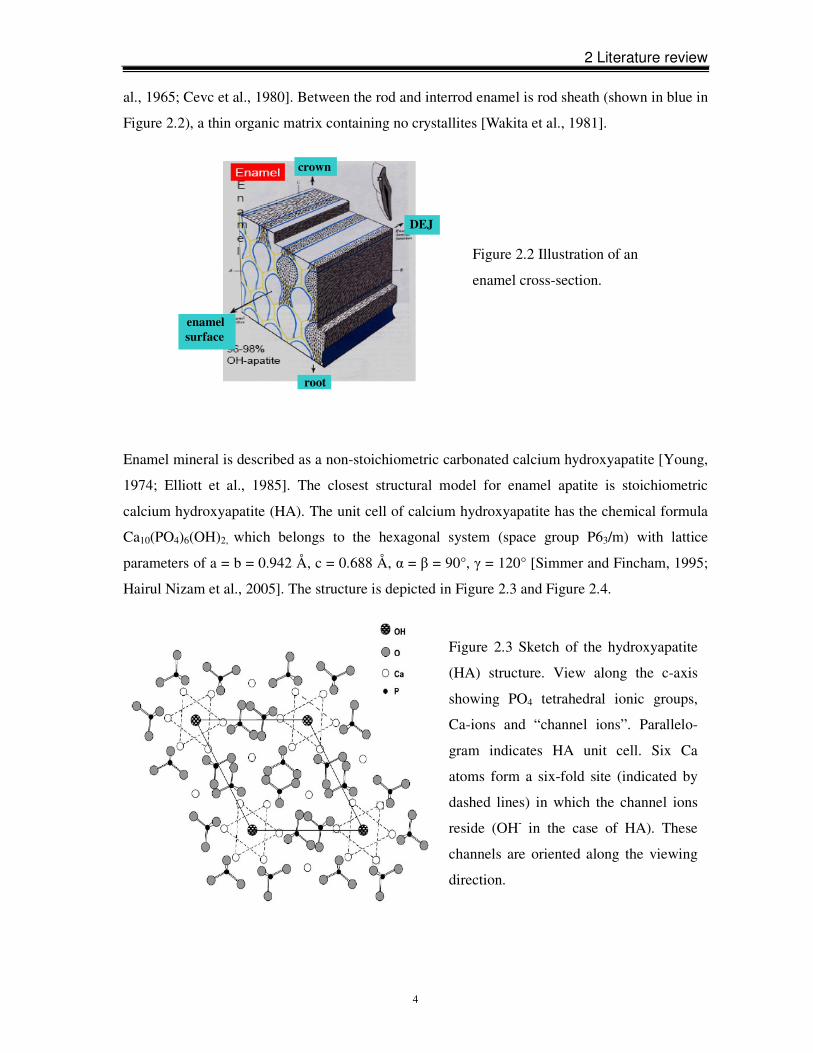
interrod (shown in yellow in Figure 2.2). The principal distinction between enamel rod and
interrod lies in the crystallites orientation. In the case of rods, the long c-axes of crystallites are
essentially parallel to the long axis of the rod, while their a- and b-axes may be at any angle.
Interrod crystallites, however, tilt about 40 to 65° relative to the direction of the rod [Meckel et
Figure 2.1 A schematic illustration
of the components of a molar tooth.
2 Literature review
4
al., 1965; Cevc et al., 1980]. Between the rod and interrod enamel is rod sheath (shown in blue in
Figure 2.2), a thin organic matrix containing no crystallites [Wakita et al., 1981].
Enamel mineral is described as a non-stoichiometric carbonated calcium hydroxyapatite [Young,
1974; Elliott et al., 1985]. The closest structural model for enamel apatite is stoichiometric
calcium hydroxyapatite (HA). The unit cell of calcium hydroxyapatite has the chemical formula
Ca10(PO4)6(OH)2, which belongs to the hexagonal system (space group P63/m) with lattice
parameters of a = b = 0.942 Å, c = 0.688 Å, α = β = 90°, γ = 120° [Simmer and Fincham, 1995;
Hairul Nizam et al., 2005]. The structure is depicted in Figure 2.3 and Figure 2.4.
Figure 2.2 Illustration of an
enamel cross-section.
enamel
surface
DEJ
crown
root
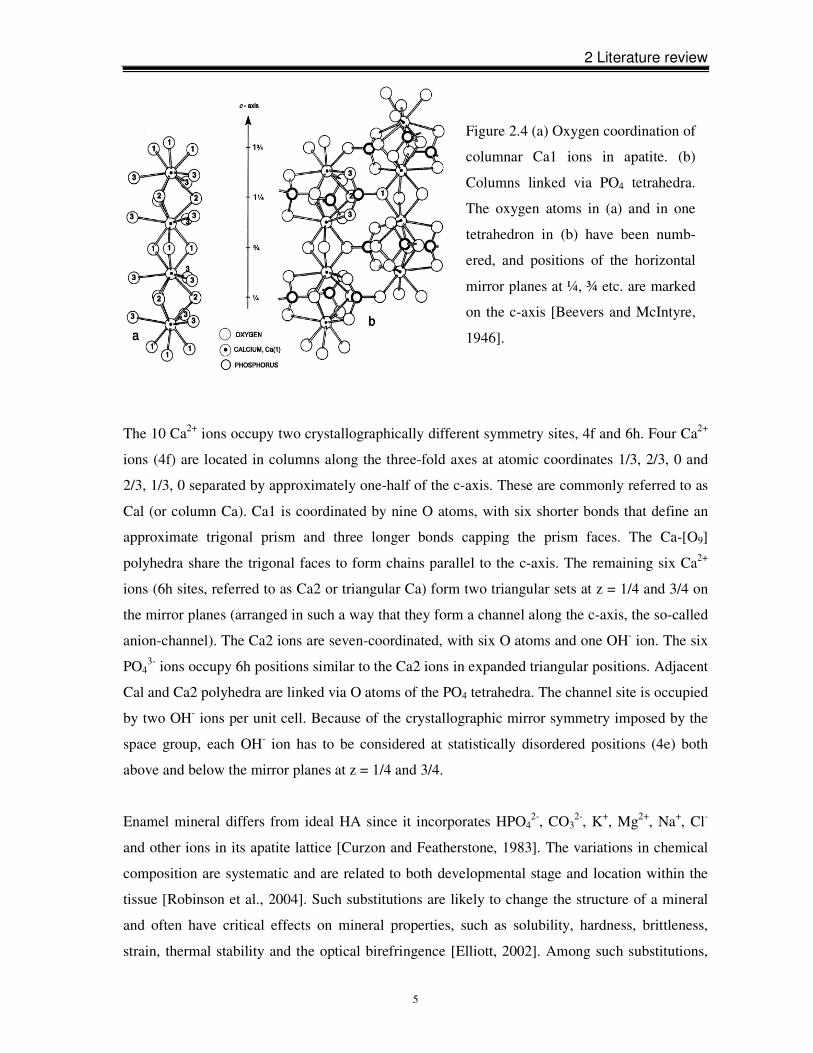
Figure 2.3 Sketch of the hydroxyapatite
(HA) structure. View along the c-axis
showing PO4 tetrahedral ionic groups,
Ca-ions and “channel ions”. Parallelo-
gram indicates HA unit cell. Six Ca
atoms form a six-fold site (indicated by
dashed lines) in which the channel ions
reside (OH- in the case of HA). These
channels are oriented along the viewing
direction.
2 Literature review
5
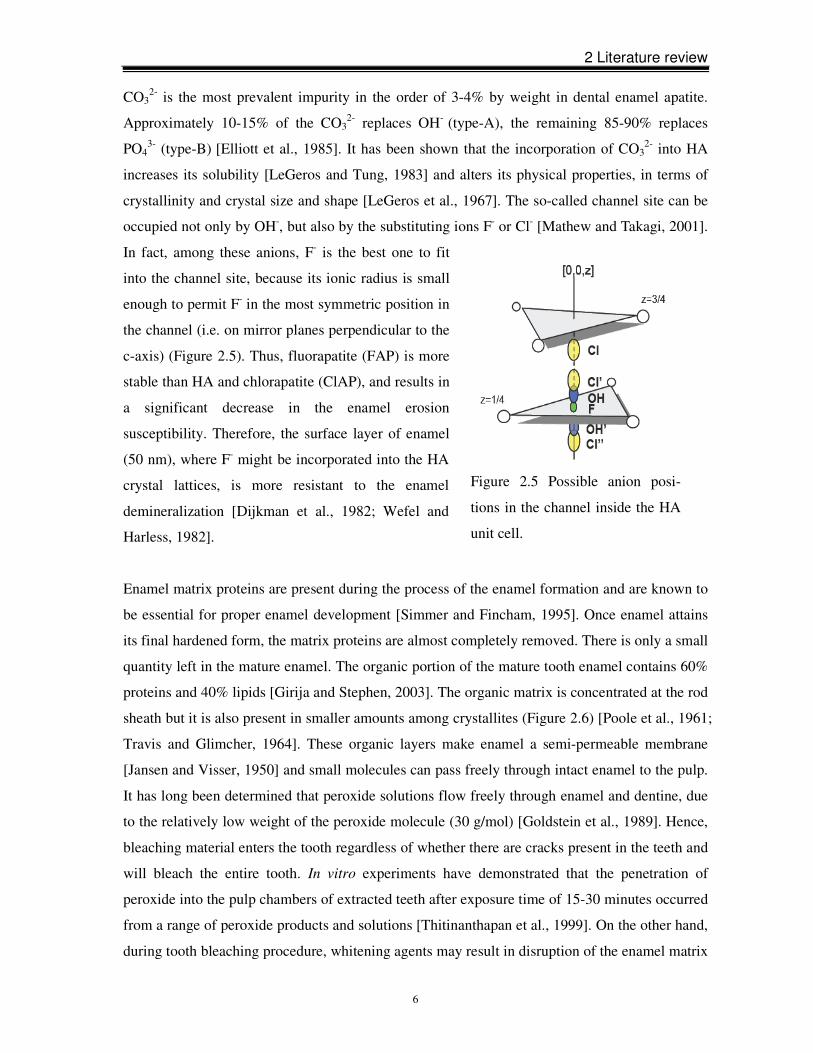
The 10 Ca2+ ions occupy two crystallographically different symmetry sites, 4f and 6h. Four Ca2+
ions (4f) are located in columns along the three-fold axes at atomic coordinates 1/3, 2/3, 0 and
2/3, 1/3, 0 separated by approximately one-half of the c-axis. These are commonly referred to as
Cal (or column Ca). Ca1 is coordinated by nine O atoms, with six shorter bonds that define an
approximate trigonal prism and three longer bonds capping the prism faces. The Ca-[O9]
polyhedra share the trigonal faces to form chains parallel to the c-axis. The remaining six Ca2+
ions (6h sites, referred to as Ca2 or triangular Ca) form two triangular sets at z = 1/4 and 3/4 on
the mirror planes (arranged in such a way that they form a channel along the c-axis, the so-called
anion-channel). The Ca2 ions are seven-coordinated, with six O atoms and one OH- ion. The six
PO43- ions occupy 6h positions similar to the Ca2 ions in expanded triangular positions. Adjacent
Cal and Ca2 polyhedra are linked via O atoms of the PO4 tetrahedra. The channel site is occupied
by two OH- ions per unit cell. Because of the crystallographic mirror symmetry imposed by the
space group, each OH- ion has to be considered at statistically disordered positions (4e) both
above and below the mirror planes at z = 1/4 and 3/4.
Enamel mineral differs from ideal HA since it incorporates HPO42-, CO3
2-, K+, Mg2+, Na+, Cl-
and other ions in its apatite lattice [Curzon and Featherstone, 1983]. The variations in chemical
composition are systematic and are related to both developmental stage and location within the
tissue [Robinson et al., 2004]. Such substitutions are likely to change the structure of a mineral
and often have critical effects on mineral properties, such as solubility, hardness, brittleness,
strain, thermal stability and the optical birefringence [Elliott, 2002]. Among such substitutions,
Figure 2.4 (a) Oxygen coordination of
columnar Ca1 ions in apatite. (b)
Columns linked via PO4 tetrahedra.
The oxygen atoms in (a) and in one
tetrahedron in (b) have been numb-
ered, and positions of the horizontal
mirror planes at ¼, ¾ etc. are marked
on the c-axis [Beevers and McIntyre,
1946].
2 Literature review
6
CO32- is the most prevalent impurity in the order of 3-4% by weight in dental enamel apatite.
Approximately 10-15% of the CO32- replaces OH- (type-A), the remaining 85-90% replaces
PO43- (type-B) [Elliott et al., 1985]. It has been shown that the incorporation of CO3
2- into HA
increases its solubility [LeGeros and Tung, 1983] and alters its physical properties, in terms of
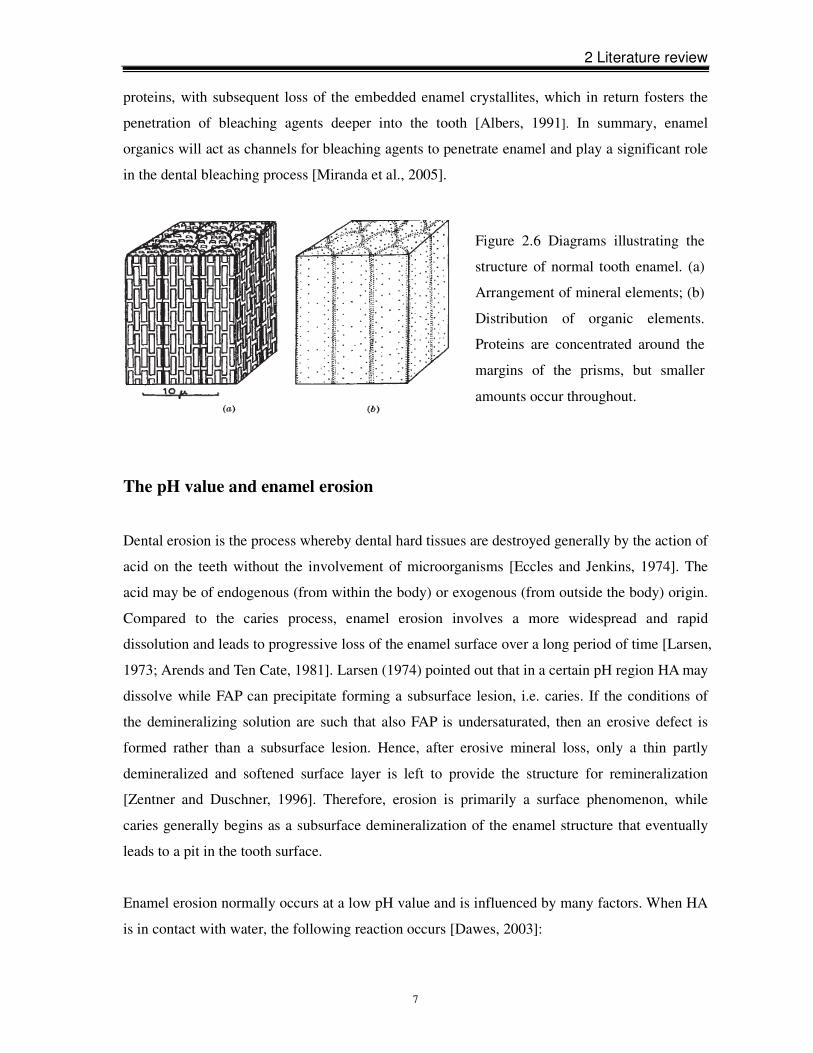
crystallinity and crystal size and shape [LeGeros et al., 1967]. The so-called channel site can be
occupied not only by OH-, but also by the substituting ions F- or Cl- [Mathew and Takagi, 2001].
In fact, among these anions, F- is the best one to fit
into the channel site, because its ionic radius is small
enough to permit F- in the most symmetric position in
the channel (i.e. on mirror planes perpendicular to the
c-axis) (Figure 2.5). Thus, fluorapatite (FAP) is more
stable than HA and chlorapatite (ClAP), and results in
a significant decrease in the enamel erosion
susceptibility. Therefore, the surface layer of enamel
(50 nm), where F- might be incorporated into the HA
crystal lattices, is more resistant to the enamel
demineralization [Dijkman et al., 1982; Wefel and
Harless, 1982].
Enamel matrix proteins are present during the process of the enamel formation and are known to
be essential for proper enamel development [Simmer and Fincham, 1995]. Once enamel attains
its final hardened form, the matrix proteins are almost completely removed. There is only a small
quantity left in the mature enamel. The organic portion of the mature tooth enamel contains 60%
proteins and 40% lipids [Girija and Stephen, 2003]. The organic matrix is concentrated at the rod
sheath but it is also present in smaller amounts among crystallites (Figure 2.6) [Poole et al., 1961;
Travis and Glimcher, 1964]. These organic layers make enamel a semi-permeable membrane
[Jansen and Visser, 1950] and small molecules can pass freely through intact enamel to the pulp.
It has long been determined that peroxide solutions flow freely through enamel and dentine, due
to the relatively low weight of the peroxide molecule (30 g/mol) [Goldstein et al., 1989]. Hence,
bleaching material enters the tooth regardless of whether there are cracks present in the teeth and
will bleach the entire tooth. In vitro experiments have demonstrated that the penetration of
peroxide into the pulp chambers of extracted teeth after exposure time of 15-30 minutes occurred
from a range of peroxide products and solutions [Thitinanthapan et al., 1999]. On the other hand,
during tooth bleaching procedure, whitening agents may result in disruption of the enamel matrix
Figure 2.5 Possible anion posi-
tions in the channel inside the HA
unit cell.
2 Literature review
7
proteins, with subsequent loss of the embedded enamel crystallites, which in return fosters the
penetration of bleaching agents deeper into the tooth [Albers, 1991]. In summary, enamel
organics will act as channels for bleaching agents to penetrate enamel and play a significant role
in the dental bleaching process [Miranda et al., 2005].
The pH value and enamel erosion
Dental erosion is the process whereby dental hard tissues are destroyed generally by the action of
acid on the teeth without the involvement of microorganisms [Eccles and Jenkins, 1974]. The
acid may be of endogenous (from within the body) or exogenous (from outside the body) origin.
Compared to the caries process, enamel erosion involves a more widespread and rapid
dissolution and leads to progressive loss of the enamel surface over a long period of time [Larsen,
1973; Arends and Ten Cate, 1981]. Larsen (1974) pointed out that in a certain pH region HA may
dissolve while FAP can precipitate forming a subsurface lesion, i.e. caries. If the conditions of
the demineralizing solution are such that also FAP is undersaturated, then an erosive defect is
formed rather than a subsurface lesion. Hence, after erosive mineral loss, only a thin partly
demineralized and softened surface layer is left to provide the structure for remineralization
[Zentner and Duschner, 1996]. Therefore, erosion is primarily a surface phenomenon, while
caries generally begins as a subsurface demineralization of the enamel structure that eventually
leads to a pit in the tooth surface.
Enamel erosion normally occurs at a low pH value and is influenced by many factors. When HA
is in contact with water, the following reaction occurs [Dawes, 2003]:
Figure 2.6 Diagrams illustrating the
structure of normal tooth enamel. (a)
Arrangement of mineral elements; (b)
Distribution of organic elements.
Proteins are concentrated around the
margins of the prisms, but smaller
amounts occur throughout.
2 Literature review
8
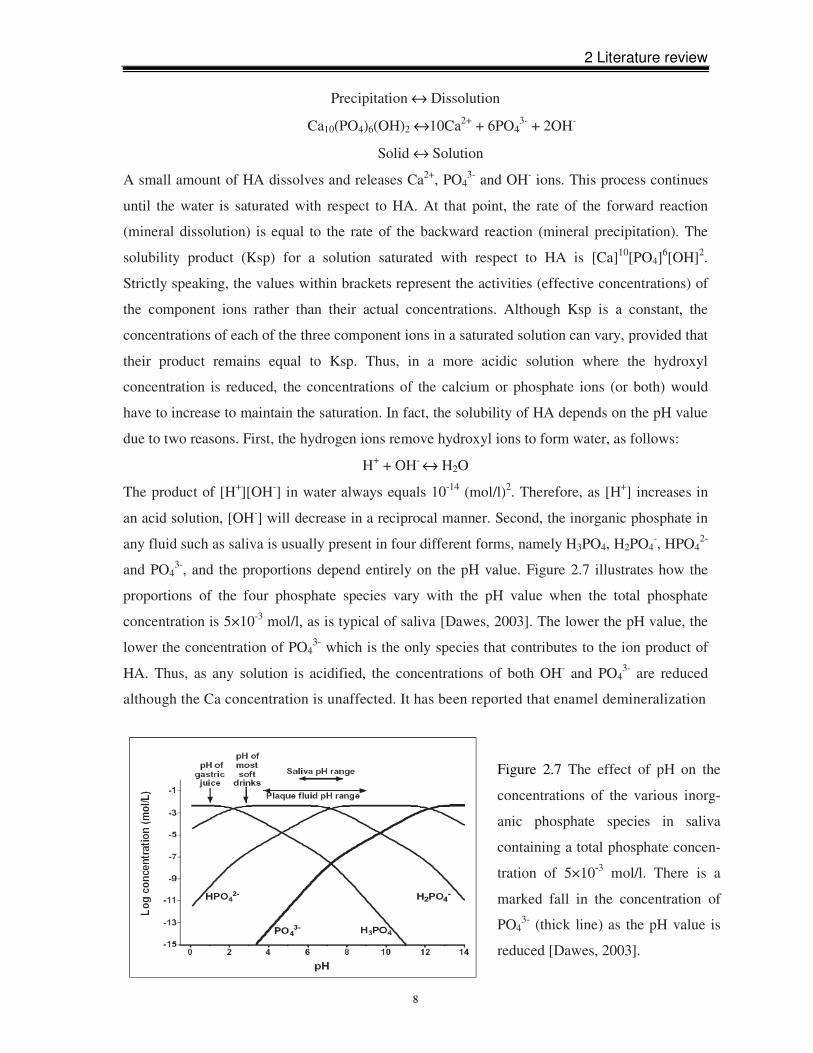
Figure 2.7 The effect of pH on the
concentrations of the various inorg-
anic phosphate species in saliva
containing a total phosphate concen-
tration of 5×10⁻³ mol/l. There is a
marked fall in the concentration of
PO43- (thick line) as the pH value is
reduced [Dawes, 2003].
Precipitation ↔ Dissolution
Ca10(PO4)6(OH)2 ↔10Ca2+ + 6PO43- + 2OH-
Solid ↔ Solution
A small amount of HA dissolves and releases Ca2+, PO43- and OH- ions. This process continues
until the water is saturated with respect to HA. At that point, the rate of the forward reaction
(mineral dissolution) is equal to the rate of the backward reaction (mineral precipitation). The
solubility product (Ksp) for a solution saturated with respect to HA is [Ca]10[PO4]6[OH]2.
Strictly speaking, the values within brackets represent the activities (effective concentrations) of
the component ions rather than their actual concentrations. Although Ksp is a constant, the
concentrations of each of the three component ions in a saturated solution can vary, provided that
their product remains equal to Ksp. Thus, in a more acidic solution where the hydroxyl
concentration is reduced, the concentrations of the calcium or phosphate ions (or both) would
have to increase to maintain the saturation. In fact, the solubility of HA depends on the pH value
due to two reasons. First, the hydrogen ions remove hydroxyl ions to form water, as follows:
H+ + OH- ↔ H2O
The product of [H+][OH-] in water always equals 10-14 (mol/l)2. Therefore, as [H+] increases in
an acid solution, [OH-] will decrease in a reciprocal manner. Second, the inorganic phosphate in
any fluid such as saliva is usually present in four different forms, namely H3PO4, H2PO4-, HPO4
2-
and PO43-, and the proportions depend entirely on the pH value. Figure 2.7 illustrates how the
proportions of the four phosphate species vary with the pH value when the total phosphate
concentration is 5×10⁻³ mol/l, as is typical of saliva [Dawes, 2003]. The lower the pH value, the
lower the concentration of PO43- which is the only species that contributes to the ion product of
HA. Thus, as any solution is acidified, the concentrations of both OH- and PO43- are reduced
although the Ca concentration is unaffected. It has been reported that enamel demineralization
2 Literature review
9
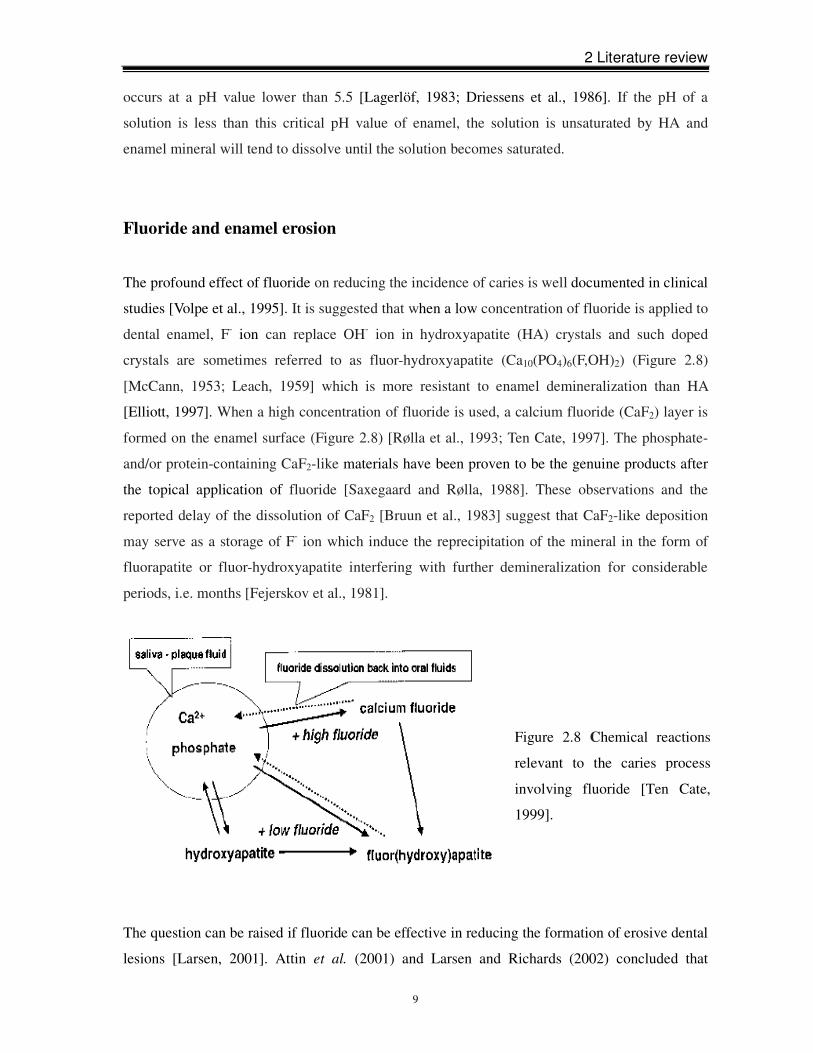
Figure 2.8 Chemical reactions
relevant to the caries process
involving fluoride [Ten Cate,
1999].
occurs at a pH value lower than 5.5 [Lagerlöf, 1983; Driessens et al., 1986]. If the pH of a
solution is less than this critical pH value of enamel, the solution is unsaturated by HA and
enamel mineral will tend to dissolve until the solution becomes saturated.
Fluoride and enamel erosion
The profound effect of fluoride on reducing the incidence of caries is well documented in clinical
studies [Volpe et al., 1995]. It is suggested that when a low concentration of fluoride is applied to
dental enamel, F- ion can replace OH- ion in hydroxyapatite (HA) crystals and such doped
crystals are sometimes referred to as fluor-hydroxyapatite (Ca10(PO4)6(F,OH)2) (Figure 2.8)
[McCann, 1953; Leach, 1959] which is more resistant to enamel demineralization than HA
[Elliott, 1997]. When a high concentration of fluoride is used, a calcium fluoride (CaF2) layer is
formed on the enamel surface (Figure 2.8) [Rølla et al., 1993; Ten Cate, 1997]. The phosphate-
and/or protein-containing CaF2-like materials have been proven to be the genuine products after
the topical application of fluoride [Saxegaard and Rølla, 1988]. These observations and the
reported delay of the dissolution of CaF2 [Bruun et al., 1983] suggest that CaF2-like deposition
may serve as a storage of F- ion which induce the reprecipitation of the mineral in the form of
fluorapatite or fluor-hydroxyapatite interfering with further demineralization for considerable
periods, i.e. months [Fejerskov et al., 1981].
The question can be raised if fluoride can be effective in reducing the formation of erosive dental
lesions [Larsen, 2001]. Attin et al. (2001) and Larsen and Richards (2002) concluded that
2 Literature review
10
moderate fluoride concentrations such as those commonly used in toothpaste could not prevent
enamel erosion, while a slight protective effect after applying topical fluoride was found by Van
Rijkom et al. (2003) and Hughes et al. (2004). In a study by Wiegand and Attin (2003),
promising results were obtained with a high concentrated fluoride application which can form
CaF2-like precipitation on the enamel surface. Erosion in enamel and dentine was found to be
decreased. Subsequently, concentrated fluoride was recommended to reduce tooth erosion
[Amaechi and Higham, 2005; Lagerweij et al., 2006]. SEM studies give evidence that the
CaF2-like precipitate is deposited in the form of small globules with diameters in the submicron
range [Nelson et al., 1983]. The quality and quantity of CaF2-like globules depend on various
factors such as the concentration and the pH value of the fluoride reagents, application duration
and tooth surface characteristics [Saxegaard and Rølla, 1988]. The higher the concentration and
the more frequent the application, the more CaF2-like compounds are deposited on the enamel
surface and, therefore, the more prevention of erosion there is [Curz et al., 1992; Duschner et al.,
1997; Attin et al., 2000; Petzold, 2001]. Acidulated fluoride agents have also been suggested to
be more effective in preventing erosion when compared to fluoride gels with neutral pH value
because of the formation of a denser and thicker CaF2-like layer [Delbem and Cury, 2002]. It is
thought that moderate acidic pH values slightly accelerate the dissolution of enamel apatite,
which increases the Ca concentration in the solution near the surface and facilitates the
deposition of CaF2-like globules [Larsen and Jensen, 1986]:
Ca5(PO4)3OH + 7 H+ → 5 Ca2+ + 3 H2PO4- + H2O
Ca2+ + 2 F- → CaF2
In neutral solutions, the pH value rises due to the release of OH- caused by the dissolution of
enamel apatite according to the reaction scheme below:
Ca5(PO4)3OH + 3 H2O → 5 Ca2+ + 3 HPO42- + 4 OH-
the released OH- ions and the increased pH quickly end the dissolution of apatite and limit the
CaF2-like layer formation. In addition, artificially eroded enamel is believed to retain more
fluoride as compared to sound enamel due to the increased surface area, which offers a higher
number of possible retention sites for the fluoride [Attin et al., 2000]. Hence, the increased
amount of adsorbed fluoride should enhance the formation of CaF2-like material. Bruun and
Givskov (1993) measured the formation of the CaF2-like layer on sound enamel and artificial
caries lesions after 1 minute exposure to 2.0% NaF solution. CaF2-like precipitation on the
enamel surfaces with caries-like lesions amounted to 30 µg F cm-2 whereas KOH-soluble
fluoride on sound enamel amounted to 1.0 µg F cm-2 only.
2 Literature review
11
2.2 Tooth color
Natural tooth color
The color of a tooth is determined by the combination of its optical properties. When light
encounters a tooth, four phenomena associated with the interactions of the tooth with the light
flux have to be considered [Jahangiri et al., 2002]: (1) specular transmission of the light through
the tooth, (2) specular reflection at the surface, (3) diffuse light reflection at the surface and (4)
absorption and scattering of light within the dental tissues. Tooth color has been shown to result
from the volume scattering of light, i.e. the illuminating light follows a highly irregular light
paths through the tooth before it emerges at the surface and reaches the eye of the observer
[O’Brien et al., 1990].
The normal color of enamel varies from light yellow to grayish white. Since enamel is
semitranslucent, the clinically perceived shade of teeth is determined by the outmost layer of
enamel and the inherent dentine and pulp shades [Fondriest, 2003].
Tooth discoloration
Over the lifetime of the tooth, there are numerous factors that affect both the color and the
brightness of teeth, and it is to a certain degree inevitable that tooth discoloration is caused.
Tooth discolorations are divided into three categories: extrinsic stains, intrinsic stains and
age-related stains.
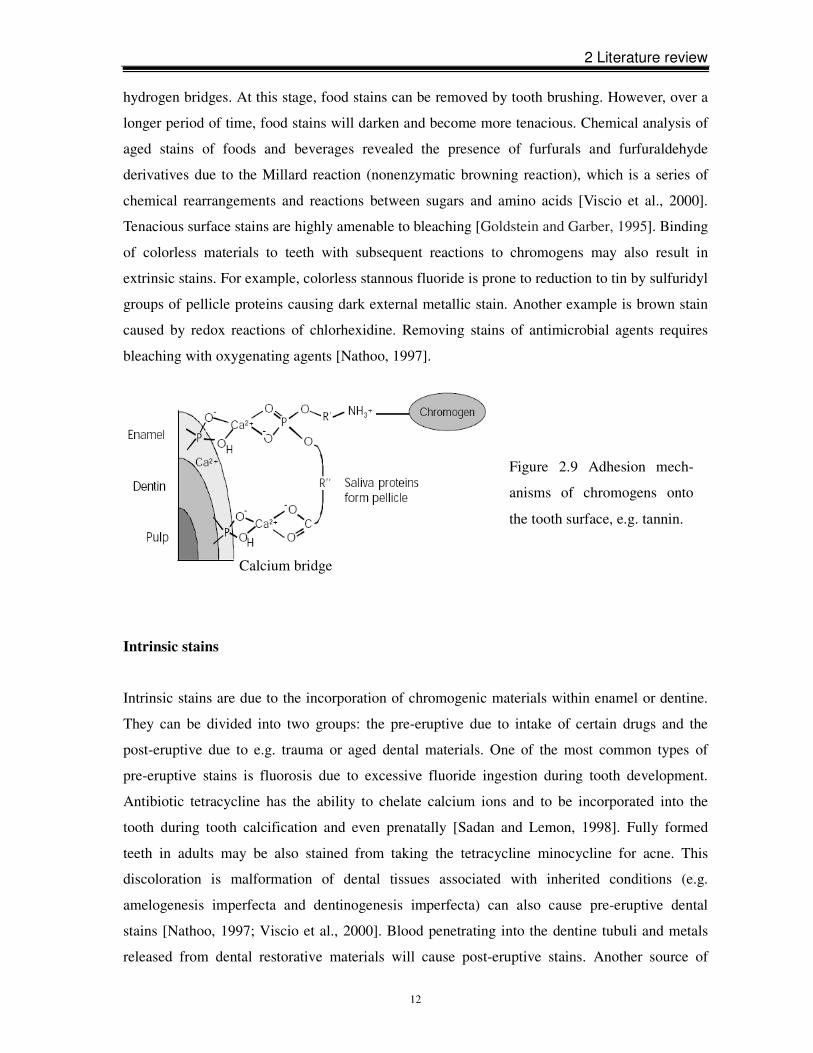
Extrinsic stains
Extrinsic stains are caused by the deposition of chromogenic materials on the tooth surface. It is
generally believed that the dietary chromogens or the pre-chromogens adhere onto the tooth
surface via saliva proteins. Figure 2.9 shows the adhesion mechanism in the case of typical
tannin chromogens causing e.g. tea, coffee and red wine stains [Nathoo, 1997]. Saliva proteins
are selectively bonded onto the enamel surface via calcium bridges, thus forming the pellicle. At
the early stage of staining, chromogens themselves are assumed to interact with the pellicle via
2 Literature review
12
hydrogen bridges. At this stage, food stains can be removed by tooth brushing. However, over a
longer period of time, food stains will darken and become more tenacious. Chemical analysis of
aged stains of foods and beverages revealed the presence of furfurals and furfuraldehyde
derivatives due to the Millard reaction (nonenzymatic browning reaction), which is a series of
chemical rearrangements and reactions between sugars and amino acids [Viscio et al., 2000].
Tenacious surface stains are highly amenable to bleaching [Goldstein and Garber, 1995]. Binding
of colorless materials to teeth with subsequent reactions to chromogens may also result in
extrinsic stains. For example, colorless stannous fluoride is prone to reduction to tin by sulfuridyl
groups of pellicle proteins causing dark external metallic stain. Another example is brown stain
caused by redox reactions of chlorhexidine. Removing stains of antimicrobial agents requires
bleaching with oxygenating agents [Nathoo, 1997].
Intrinsic stains
Intrinsic stains are due to the incorporation of chromogenic materials within enamel or dentine.
They can be divided into two groups: the pre-eruptive due to intake of certain drugs and the
post-eruptive due to e.g. trauma or aged dental materials. One of the most common types of
pre-eruptive stains is fluorosis due to excessive fluoride ingestion during tooth development.
Antibiotic tetracycline has the ability to chelate calcium ions and to be incorporated into the
tooth during tooth calcification and even prenatally [Sadan and Lemon, 1998]. Fully formed
teeth in adults may be also stained from taking the tetracycline minocycline for acne. This
discoloration is malformation of dental tissues associated with inherited conditions (e.g.
amelogenesis imperfecta and dentinogenesis imperfecta) can also cause pre-eruptive dental
stains [Nathoo, 1997; Viscio et al., 2000]. Blood penetrating into the dentine tubuli and metals
released from dental restorative materials will cause post-eruptive stains. Another source of
Figure 2.9 Adhesion mech-
anisms of chromogens onto
the tooth surface, e.g. tannin.
Calcium bridge
2 Literature review
13
intrinsic stains is aged dental materials like root-filling and other restorations materials
[Glockner et al., 1997]. Intrinsic stains are not removed by brushing or any abrasive process, but
can be reduced by bleaching with agents penetrating enamel and dentine to oxidize the
chromogens. However, extended treatment time and higher concentration of the bleaching agent
are needed to remove persistent intrinsic stains [Glockner et al., 1997; Haywood, 2000].
Age-related stains
It is unavoidable that a person’s teeth will darken with age. One of the reasons is the cumulative
effect of extrinsic and intrinsic stains. However, the more important reason is that dental enamel
becomes thinner with age because of enamel attrition or abrasion, therefore, allowing the yellow
dentine to show through and be visible through the enamel. Normally, unless the enamel is badly
worn, bleaching is an efficient technique to lighten teeth of older patients.
2.3 Bleaching
History
Many attempts to find an effective tooth whitening method have been made throughout the
history of dentistry. The earliest attempts focused on using chloride of lime to whiten non-vital
teeth [Dwinelle, 1850]. Up to the late nineteenth century, numerous other bleaching agents were
also successfully employed on non-vital teeth [Haywood, 1992], including cyanide of potassium
[Kingsburg, 1861], oxalic acid [Bogue, 1872], sulphurous acid [Kirk, 1889], aluminum chloride
[Harlan, 1891], sodium hypophosphate [Harlan, 1891], pyrozone [Atkinson, 1892], hydrogen
dioxide (hydrogen peroxide or perhydrol) and sodium peroxide [Kirk, 1893]. All these
substances were considered as either direct or indirect oxidizers acting on the organic portion of
the tooth, except for sulphurous acid which was a reducing agent [Kirk, 1889]. Later on,
hydrogen peroxide was used in combination with hydrochloric acid to remove “brown stain from
mottled teeth” due to a chronic endemic dental fluorosis [McInnes, 1966]. Cohen and Parkins
(1970) verified that the mechanism of tooth whitening using hydrogen peroxide involves
penetration to the dentine. In 1976, Nutting and Poe introduced the walking bleaching technique,
2 Literature review
14
which uses 35% hydrogen peroxide and sodium perborate for non-vital teeth bleaching. This
technique is still being used.
Vital teeth were whitened with oxalic acid as early as 1868 [Latimer, 1868], and later with
pyrozone [Atkinson, 1892] or hydrogen peroxide [Fisher, 1911]. By 1910, concentrated
hydrogen peroxide solutions had been an accepted method in dental clinics [Fisher, 1911]. The
current in-office bleaching technique typically uses 35% hydrogen peroxide with rubber dam
isolation [Haywood, 2000]. At-home bleaching began in 1968 when an American orthodontist,
Dr. Bill Klusmier, instructed his patients to use an “over-the-counter” oral antiseptic, Gly-oxide
(Marion Merell Dow), containing 10% carbamide peroxide at night to resolve inflammationory
issues. Dr. Bill Klusmier noticed that Gly-oxide not only improved the gingival health but also
whitened teeth [Haywood et al., 1990]. Later, Proxigel (a mixture of 10% carbamide peroxide,
water, glycerine and carbopol) replaced Gly-Oxide in patients’ orthodontic positioners, due to its
slow release of carbamide peroxide. In 1988, the University of North Carolina clinically
ascertained the effectiveness of the Proxigel technique. One year later, Haywood and Heymann
(1989) published their article, “Nightguard and Vital bleaching” and an at-home bleaching
product “White and Brite™” (Omnii International) was marketed. The two events marked the
beginning of “modern day” tooth bleaching. “Over-the-counter” (OTC) bleaching agents were
first launched in the United States in the 1990s. This bleaching system contains lower
concentration of hydrogen peroxide or carbamide peroxide compared to medical practice
bleaching products and is sold directly to consumers in stores for unsupervised home use
[Greenwall, 2001]. Since then, products and techniques made claims for whitening teeth and
were introduced.
The effectiveness of bleaching depends upon the ability of oxidizing agents to enter the dental
hard tissues and decompose the pigment molecules. Bleaching agents are expected to permeate
into the tooth structure deeply enough and remain there long enough to modify deep stains
[Goldstein, 1997]. The first-generation tooth bleaching materials are in a liquid form. These
materials do not remain in the trays for a long time and need more replenishment over time. The
second-generation materials are more viscous and are gelled to prolong the release of active
bleaching agents. More inactive ingredients are included in the third-generation bleaching
systems to increase effectiveness, enhance security and facilitate application. In general, quality
control by the manufacturers has improved, together with changes in the packaging and patient
instruction, to make them more patient-friendly [Fasanaro, 1992; Blankenau et al., 1999].
2 Literature review
15
Methods of tooth bleaching
According to the vitality status of the tooth to be treated, techniques to whiten tooth can be
classified into vital and non-vital tooth bleaching.
Vital tooth bleaching
Vital teeth are bleached by the application of whitening substances on the external surface of the
teeth. The whitening procedure can be carried out in the dental office or at home by patients or
by a combination of both techniques.
In-office bleaching products contain a high percentage of 30-38% of hydrogen peroxide and are
used under the supervision of the dentist while patients are seated in the dental chair. The
procedure involves the isolation of the teeth with rubber dam or alternatives [Powell and Bales,
1991] and the application of bleaching gel directly onto the tooth surface for up to 1 hour per
appointment, with or without the activation by heat, light or laser. Several appointments may be
necessary to achieve the desired result.
At-home bleaching, which was first reported in the dental literature by Haywood and Heymann
(1989), “Nightguard and Vital bleaching”, is the most popular whitening method performed. This
technique involves the application of a mild bleaching agent (10-20% carbamide peroxide,
equaling 3.5-6.5% hydrogen peroxide) onto the teeth by wearing a custom fabricated tray
overnight or during the day at home. Treatment is carried out by patients themselves, but the
process is monitored by the dentist during recall appointments. Compared to the in-office
technique, at-home tooth whitening is more cost-effective but it depends upon the patients’
compliance and requires a longer treatment time because of the comparatively lower strength of
the oxidizing agent [Russell et al., 1996]. The required treatment time depends on the
concentration of the carbamide peroxide used. The 10% carbamide peroxide is recommended to
be used for 8 hours per day, and the 15-20% carbamide peroxide for 3-4 hours per day.
The use of a combination of in-office and at-home bleaching techniques produces the most
effective result in the shortest period of time. Brightening of the tooth by in-office bleaching
2 Literature review
16
treatment can be further preserved and enhanced by follow-up treatments with an at-home
bleaching system.
Sales of “over-the-counter” (OTC) tooth bleaching products have sharply increased in recent
years because of their convenient use. Most of the OTC bleaching agents contain a small
percentage of carbamide peroxide (≤ 6%) in a certain mode of delivery, e.g. whitening
dentifrices, pre-fabricated trays, whitening strips and toothpastes [Zantner et al., 2007]. An
alternative active bleaching agent used in this type of product is sodium chlorite (NaClO2) in
combination with citric acid, which was launched several years ago. OTC products are
inexpensive and convenient to use, and represent the fastest growing segment of the dental
market [Kugel, 2003]. However, many retail products have not undergone rigorous and objective
clinical testing before the introduction onto the market and tooth whiteners are not regulated by
the Food and Drug Administration. Hence, these bleaching agents may be of highly questionable
efficiency and safety [Polydorou, 2004].
Non-vital tooth bleaching
Non-vital or internal bleaching is used to lighten a discolored tooth that has had traumatic
damages of the pulp, pulp necrosis or endodontic treatment. Sodium perborate mixed with water,
or 30% hydrogen peroxide solution alone or mixed with sodium perborate are common
formulations for non-vital tooth bleaching. The bleaching agent is supplied into the prepared
pulp chamber or/and the coronal portion of the root canal to remove tooth discoloration in two
different methods: 1. “in-office bleaching”: the bleaching agent is left inside the tooth for a
period of time, and then removed before leaving the office. This may be done once or several
times, depending on the discoloration of the tooth; 2. “walking bleaching”: the bleaching agent is
sealed into the endodontic access cavity. The patient returns to the dentist to have the bleaching
agent renewed until the satisfied shade change or the maximum effect is achieved. Root
resorption is suggested to be the potential adverse effect and can lead to the loss of the tooth
[Goon et al., 1986].
2 Literature review
17
The mechanism of tooth bleaching
Bleaching is a chemical process which is widely applied to whiten materials mostly using
oxidizing compounds, e.g. hydrogen peroxide, chlorine or sodium hypochlorite. Although
bleaching processes are a complex sequence of chemical reactions, the underlying principle of
the vast majority is the stepwise oxidation of dyes to decompose them. Total oxidation of
organic chromogens via several intermediates ends up in the final products carbon dioxide (CO2)
and water (H2O). In dentistry, according to oxidizing compounds, modern bleaching materials
can be classified into two groups: peroxide-based and non-peroxide-based.
Peroxide-based bleaching agents
Peroxide-based bleaching agents are widely used even though the mechanism by which teeth are
whitened is not fully understood [Sulieman et al., 2004]. These products generally contain
hydrogen peroxide or one of its precursors (carbamide peroxide or sodium perborate) as an
active oxidizing agent [Hägg, 1969].
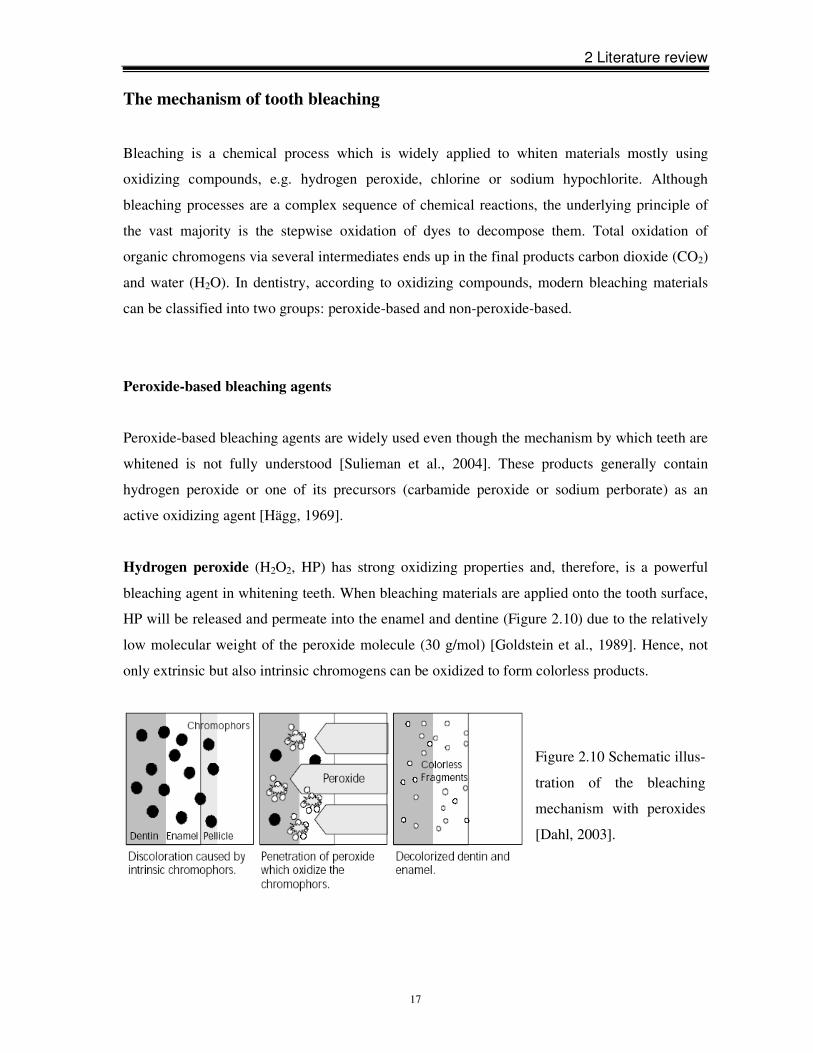
Hydrogen peroxide (H2O2, HP) has strong oxidizing properties and, therefore, is a powerful
bleaching agent in whitening teeth. When bleaching materials are applied onto the tooth surface,
HP will be released and permeate into the enamel and dentine (Figure 2.10) due to the relatively
low molecular weight of the peroxide molecule (30 g/mol) [Goldstein et al., 1989]. Hence, not
only extrinsic but also intrinsic chromogens can be oxidized to form colorless products.
Figure 2.10 Schematic illus-
tration of the bleaching
mechanism with peroxides
[Dahl, 2003].
2 Literature review
18
The oxidation process of staining organic compounds by HP is a complex series of reactions,
based on the formation of free radicals like hydroxyl (HO•), perhydroxyl radicals (HO2•) and
superoxide anions (O2•-) (A) [Gregus and Klaassen, 1995], reactive oxygen molecules {O} that
are unstable and transform to oxygen (B) and hydrogen peroxide anions (HOO-) (C) [Cotton and
Wilkinson, 1972] through:
(A) H2O2 → 2 HO•
HO• + H2O2 → H2O + HO2•
HO2• ↔ H+ + O2
•-
(B) 2 H2O2 ↔ 2 H2O + 2 {O} ↔ 2 H2O + O2
(C) H2O2 ↔ H+ + HOO-
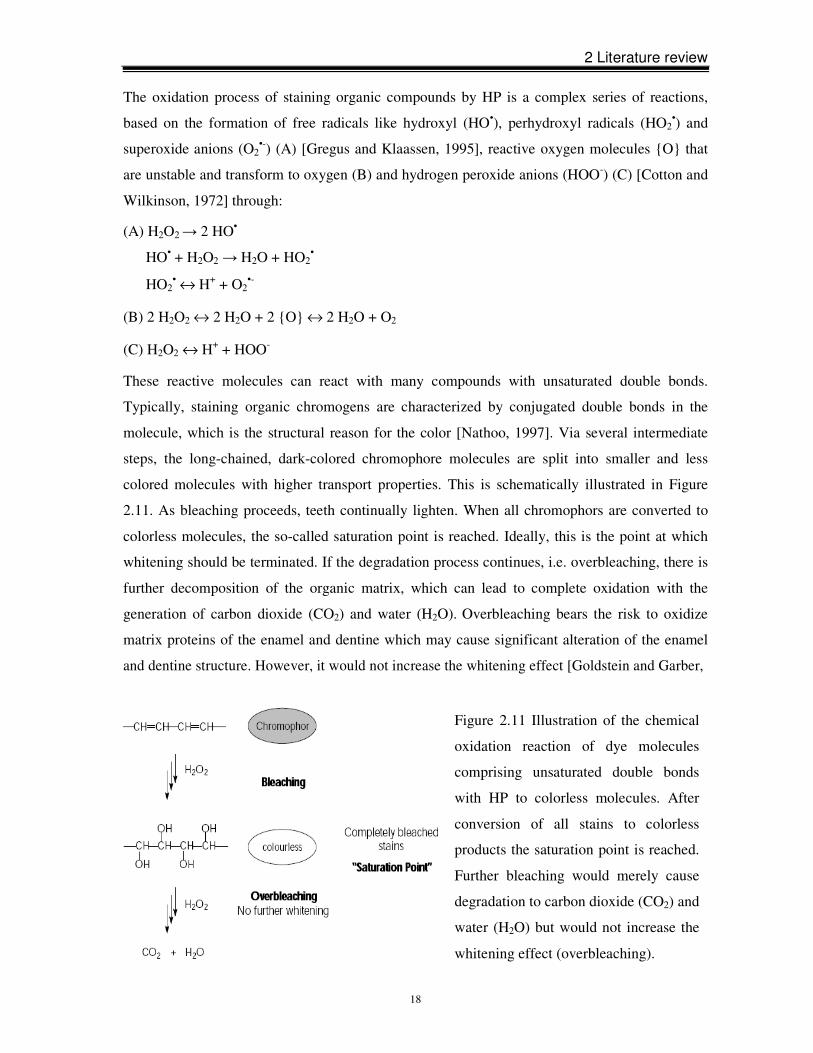
These reactive molecules can react with many compounds with unsaturated double bonds.
Typically, staining organic chromogens are characterized by conjugated double bonds in the
molecule, which is the structural reason for the color [Nathoo, 1997]. Via several intermediate
steps, the long-chained, dark-colored chromophore molecules are split into smaller and less
colored molecules with higher transport properties. This is schematically illustrated in Figure
2.11. As bleaching proceeds, teeth continually lighten. When all chromophors are converted to
colorless molecules, the so-called saturation point is reached. Ideally, this is the point at which
whitening should be terminated. If the degradation process continues, i.e. overbleaching, there is
further decomposition of the organic matrix, which can lead to complete oxidation with the
generation of carbon dioxide (CO2) and water (H2O). Overbleaching bears the risk to oxidize
matrix proteins of the enamel and dentine which may cause significant alteration of the enamel
and dentine structure. However, it would not increase the whitening effect [Goldstein and Garber,
Figure 2.11 Illustration of the chemical
oxidation reaction of dye molecules
comprising unsaturated double bonds
with HP to colorless molecules. After
conversion of all stains to colorless
products the saturation point is reached.
Further bleaching would merely cause
degradation to carbon dioxide (CO2) and
water (H2O) but would not increase the
whitening effect (overbleaching).
2 Literature review
19
1995]. Therefore, the application of bleaching, e.g. treatment procedures, the amount of agents
and duration of treatment, must be in accordance with the manufacturers’ recommendations.
Carbamide peroxide (CH6N2O3 or CH4N2O•H2O2, CP), also called urea peroxide, is introduced
as an alternative to traditional HP and its use has become widespread. This agent is very unstable
and in the presence of water immediately breaks down into urea and HP at a ratio of about 6.5
urea to 3.5 HP:
CH4N2O •H2O2 → CH4N2O + H2O2
This means that a 10% CP gel is equivalent to a 3.5% HP gel in terms of its bleaching
effectiveness [Haywood, 1992]. HP further decomposes to water and oxygen, while urea breaks
down to ammonia and carbon dioxide. The release of ammonia and carbon dioxide elevates the
pH value of the bleaching agent in the oral cavity during the bleaching process [Leonard et
al.,1994]. Moreover, adding urea to HP stabilizes the formula and improves the taste
[Christensen, 1997]. Commercial CP products normally contain either a carbopol or a glycerine
base. The carbopol base slows down release of HP without changing the efficiency of the
bleaching treatment [Haywood et al., 1990]. CP bleaching materials are suggested to have a
slightly acidic pH value to extend shelf life [Goldstein and Garber, 1995].
Hydrogen peroxide vs carbamide peroxide
An important difference between HP and CP lies in the rate that each releases peroxide
[Haywood, 2005]. The urea stabilizes CP and makes CP break down more slowly than straight
HP. CP releases about 50% of its peroxide in the first 2 hours, then the remainder over the next 6
hours [Haywood, 2005]. Hence, CP is a time-release approach to bleaching. HP breaks down
almost immediately when heat, sodium hydroxide or light is applied, releasing its peroxides
entirely within the first hour [Haywood, 2005]. It is thought that due to this immediate
bombardment of peroxides on the pulp, HP produces more sensitivity than CP of a comparable
concentration.
Sodium perborate (Na2[B2(O2)2(OH)4], SP) is the safest and most easily controlled material for
internal bleaching when prepared with HP or distilled water. When fresh, the pH value of the
distilled water-based SP paste is 9.9 [Rotstein and Friedman, 1991]. SP is stable when it is dry,
but in the presence of acid, warm air or water it decomposes to form sodium borate and HP.
2 Literature review
20
Non-peroxide-based bleaching agents
Recently, tooth bleaching materials based on sodium chlorite (NaClO2) activated by citric acid
have been investigated [Attin et al., 2004; Zantner et al., 2006]. The bleaching process consists
of two steps. The first step is to moisten the tooth surface using Rapid White “accelerator” which
is made of sodium chlorite solution; and the second is to apply Rapid White “whitening gel”
which contains citric acid and other inactive ingredients onto the moistened tooth surface to form
an interface between “accelerator” and “whitening gel”. Sodium chlorite, an inexpensive
oxidizing agent, has been extensively used in water treatment, paper, pulp and textile industries
due to the generation of chlorine dioxide (ClO2) in the acid circumstances [Geng et al., 2005;
Zantner et al., 2007]:
5 ClO2- + 4 H+ → 4 ClO2 + 2 H2O + Cl-
As an oxidant, chlorine dioxide (ClO2) readily attacks reducing substances such as organic
materials primarily by a one-electron pathway [Gallagher et al., 1994]:
ClO2 + e- ↔ ClO2-
Likewise, the tooth is whitened resulting from the presence of chlorine dioxide (ClO2) in the
interface between “accelerator” and “whitening gel”.
Composition of commercial bleaching agents
Bleaching products are based on an oxidizing agent, e.g. HP or chlorine, as active ingredient.
However, in order to improve working efficiency of the active agent and enhance patient
comfort, some other ingredients are included. The major inactive ingredients of tooth whiteners
may include carbopol, glycerin, surfactant and pigment dispersant, preservative and flavoring.
1) Thickening agents
Carbopol (carboxypolymethylene), a high molecular weight polyacrylic acid polymer, is usually
present at a 0.5 to 1.5% concentration. It is the most common thickening agent in the tooth
bleaching formula and helps to prolong the release of active bleaching ingredient. It has been
found that carbopol can extend the active oxygen-releasing time of the bleaching solution by up
to 4 times [Rodrigues et al., 2007]. Carbopol also enhances the viscosity of the bleaching
materials. The thixotropic nature of carbopol allows better retention of the slow releasing gel in
2 Literature review
21
the tray. Thus, less bleaching material is required for treatment. The viscosity also improves
adherence to the tooth.
2) Carrier
The carrier can retain moisture, impart sweetness and help to suspend or dissolve other
ingredients. Examples of common commercial carriers for active bleaching agents are glycerin
and propylene glycol. These carriers are considered non-toxic and convenient because of their
compatibility with desirable additives, e.g. thickening agents, preservatives and flavorings.
3) Surfactant and pigment dispersant
The surfactant, as a surface wetting agent, allows the active bleaching ingredient to diffuse
across the gel-tooth boundary. A pigment dispersant keeps pigments in suspension (as in
commercial water softeners). Gels with surfactant or pigment dispersants may be more effective
than those without them [Feinman et al., 1991].
4) Preservative
Preservatives, e.g. methyl, propyl paraben or sodium benzoate, are included to prevent bacterial
growth in bleaching products. Moreover, these preservatives can sequestrate transitional metals,
e.g. iron, copper and magnesium, which accelerate the breakdown of HP.
5) Flavoring
Flavorings are used in bleaching materials to enhance the patients’ acceptance of the product.
Common flavorings are peppermint, spearmint, wintergreen, sassafras and anise. Additionally,
sweeteners, e.g. saccharin, are added to further improve the taste of bleaching products.
2.4 Effects of tooth bleaching
Peroxide-based bleaching agents
Effects on soft tissues
Gingival irritation is a common side effect caused by bleaching treatment [Weitzman et al., 1986;
Tam, 1999]. Occasionally, gastrointestinal mucosal irritation, e.g. a burning palate and throat,
2 Literature review
22
and minor upsets in stomach or intestine, are also reported by patients [Howard, 1992; Pohjola et
al., 2002]. In most cases, soft tissues irritation results from an ill-fitting mouthpiece tray rather
than from the tooth bleaching agent itself. These symptoms are temporary and usually disappear
within a few days after finishing the treatment [Schulte et al., 1994].
Effects on enamel
Surface morphology
In the past two decades, effects of peroxide-containing bleaching agents on the surface
morphology of tooth enamel have been evaluated [Haywood et al., 1990; Covington et al., 1990;
Hunsaker and Christensen, 1990; Bitter and Sanders, 1993; Ernst et al., 1996; Josey et al., 1996;
Gürgan et al., 1997; Hegedüs et al., 1999]. Some studies showed that bleaching did not
significantly affect the enamel surface [Haywood et al., 1990; Covington et al., 1990; Ernst et al.,
1996]. However, other investigations demonstrated morphological alterations in the bleached
enamel surface: depressions, porosity and increased depth of enamel grooves [Bitter, 1998; Josey
et al., 1996; Hegedüs et al., 1999], indicating an erosive process due to tooth bleaching.
In a scanning electron microscopy (SEM) analysis, Haywood et al. (1990) reported no
morphological change in the enamel surface after 10% CP bleaching. Ernst et al. (1996) drew the
same conclusion based on an investigation with a concentrated bleaching agent, 35% HP. On the
contrary, McGuckin et al. (1992) observed that surface morphological patterns of the bleached
enamel were similar to type II acid etching. This type II acid-like pattern did not become more
severe after a longer bleaching period of approximately 6 months [Leonard et al., 2001]. The
results of profilometric analyses are also conflicting. Titley et al. (1992) observed a slight
increase in the surface roughness, whereas Hunsaker and Christensen (1990) and Gürgan et al.
(1997) reported that no modification of the surface roughness occurred. Using atomic force
microscopy (AFM), Hegedüs et al. (1999) observed changes in the enamel surface after 28 hours
of bleaching with 10% CP and 30% HP, and found that the samples surface became more
irregular and surface grooves became deeper after treatment.
2 Literature review
23
Mechanical properties
Microhardness changes are related to a loss or gain of mineral phases (demineralization or
remineralization) of the dental structure [Featherstone et al., 1983]. Microindentation has been
used to determine slight changes in the surface microhardness after bleaching treatment, using
Knoop hardness number (KHN) [Murchison et al., 1992; Basting et al., 2003; Joiner, 2004] or
Vickers hardness number (VHN) [Seghi and Denry, 1992; Potocnik et al., 2000; Park et al.,
2004; Ünlü et al., 2004]. Nanoindentation is emerging as a new technique. It is more sensitive to
early erosive processes [Barbour and Rees, 2004] and has been applied in recent dental bleaching
studies [Hairul Nizam et al., 2005; Chng et al., 2005]. Different results on enamel microhardness
changes due to bleaching have been published. Seghi and Dendry (1992) showed that bleaching
enamel specimens with 10% CP for 12 hours did not alter the surface microhardness values.
Potocnik et al. (2000) came to the same conclusion even though the bleaching period was
extended to 336 hours. However, Cimilli and Pameijer (2001) measured the VHN of enamel
after applying 10% CP on teeth (6 hours per day, 10 days) and found the demineralized enamel
up to 110 µm below the surface. Using a bleaching agent with higher concentration (30% HP),
Lewinstein et al. (1994) reported a decrease in the enamel microhardness after a treatment for 15
minutes. Even if samples were stored in artificial saliva, a 47% reduction in KHN of enamel
exposed to 10% CP (8 hours per day, 42 days) was observed by Rodrigues et al. (2001).
Seghi and Denry (1992) and McCracken and Haywood (1996) reported an increased fracture
susceptibility of the enamel following bleaching. In an in vitro study, Rotstein et al. (1992)
found a loss of strength and a high solubility of enamel after bleaching. Tensile strength and
Young’s modulus of enamel were also proven to be significantly decreased by bleaching [Cavalli
et al., 2004; Hairul Nizam et al., 2005].
Chemical composition
The effect of bleaching agents on dental hard tissues was also investigated by measuring the
change of constituent enamel elements [McCracken and Haywood, 1996; Rotstein et al., 1996;
Potocnik et al., 2000; Cimilli and Pameijer, 2001; Duschner et al., 2006; Lee et al., 2006; Added
et al., 2006; Tezel et al., 2007]. In a study by McCracken and Haywood (1996), teeth exposed to
commercial products based on 10% CP for 6 hours lost an average of 1.06 µg/mm2 of Ca. Using
electron probe microanalysis, Potocnik et al. (2000) reported that 10% CP decreased the
2 Literature review
24
concentration of Ca and P and the Ca:P ratio. In addition, Ca and P were found in the bleaching
gel after use. Lee et al. (2006) demonstrated that the amount of Ca loss from teeth after 120
hours of bleaching treatment was similar to the amount of Ca loss from teeth exposed to a soft
drink or a juice for a few minutes. These studies concluded that changes in the chemical
composition of enamel were slight and not clinically significant. However, Rotstein et al. (1996)
and Tezel et al. (2007) verified that the concentrated bleaching agent caused a significant loss of
Ca from the enamel surface.
Crystal structure
Several research groups investigated the crystal structure of bleached enamel. In the study of
Cimilli and Pameijer (2001), Infrared (IR), Fourier transform infrared spectrophotometer (FT-IR)
and X-ray diffraction (XRD) established a change from hydroxyapatite (HA) to primary calcium
ortho phosphate [Ca(H2PO4)2] for all experimental groups (15% Opalescence, 10 and 16% Nite
White Excel) except for 10% Opalescence. Oltu and Gürgan (2000) observed that the shift of the
IR absorption peaks happened only when enamel was treated with 35% CP. 10 and 16% CP
caused no adverse effect on the crystal structure. However, using a Fourier transform Raman
spectrophotometry (FT-Raman), Park et al. (2004) and Goo et al. (2004) reported no significant
influence of bleaching with 30% HP or 10% CP on dental enamel, respectively. Tezel et al.
(2007) drew the same conclusion using micro-Raman spectroscopy.
Effects on dentine
Hunsaker and Christensen (1990) and Zalkind et al. (1996) revealed changes in the dentine
surface morphology using SEM. Pecora et al. (1994) found a decreased microhardness values
after applying a 10% CP agent on dentine for 72 hours. In a study by Basting et al. (2005), not
only 10% CP but also the thickening agent (carbopol and/or glycerin) caused a decrease in the
microhardness of dentine. Rotstein et al. (1992) reported a loss of strength and higher solubility
of dentine after bleaching. They observed a significant reduction in the mineral content after
immersing dentine in different bleaching agents for 7 days [Rotstein et al., 1996]. In a recent
study, direct exposure to 10% CP caused a significant decrease in the flexural strength and
flexural modulus of bovine dentine [Tam et al., 2005]. Dentine bonding also may be altered after
bleaching [Della Bona et al., 1992], which suggests that adhesive dentistry should be delayed for
2 Literature review
25
2 weeks post-bleaching [Powell and Bales, 1991]. On the other hand, Nathoo et al. (1994) found
no microhardness changes in the dentine surface.
Effects on restorations
Studies evaluating the effects of bleaching agents on restorative materials give conflicting results.
Data from laboratory studies documented an increased mercury release from dental amalgams
exposed to CP solutions for periods ranging from 8 hours to 28 days [Hummert et al., 1993;
Rotstein et al., 1997]. The amount of mercury released varied with the type of amalgam and the
type of bleaching agent and it ranged from 4 to 30 times higher than in saline controls. Swift and
Perdigão (1998) suggested that bleaching may increase the solubility of glass-ionomer and other
cements. In a study by Dishman and Baughan (1992), the bond strength between enamel and
resin-based fillings was reduced in the first 24 hours after bleaching. After 24 hours, there was
no difference in the strengths of dental composite resin cement bonds to bleached and
unbleached enamel [Homewood et al., 2001]. Lai et al. (2002) suggested that HP residuals in the
enamel inhibited the polymerization of resin-based materials and thus reduced bond strength.
Therefore, tooth bleaching agents should not be used prior to restorative treatment with
resin-based materials. It was also demonstrated that bleaching treatment significantly caused
shade changes, cracks occurred and microhardness reduced in the surface of restoration materials
[Kao et al., 1991; Bailey and Swift, 1992]. However, in some cases, no adverse effect of dental
bleaching on porcelain, resin composite, amalgam or gold restorations was observed [Hunsaker
and Christensen, 1990; Haywood and Heymann, 1991].
Non-peroxide-based bleaching agents
The effect of “over-the-counter”, non-peroxide-based bleaching products on dental enamel has
been investigated only recently. Zantner et al. (2007) compared enamel bleached with different
products and found a significant decrease in the surface microhardness for agents containing
sodium chlorite (NaClO2) in combination with citric acid. Attin et al. (2005) demonstrated that
the decrease in the microhardness was not limited to the superficial enamel layer and subsurface
softening was also particularly pronounced for samples treated with Rapid White [Attin et al.,
2004], a popular peroxide-free bleaching material. Moreover, these studies showed that
2 Literature review
26
non-peroxide-based bleaching products were more aggressive to dental enamel than
peroxide-containing products. Citric acid contained in non-peroxide-based bleaching products to
active sodium chlorite might lead to enamel erosion [Attin et al., 2005; Zantner et al., 2007].
Citric acid is a tribasic carboxylic acid and may dissolve enamel by reaction of hydroxyapatite
(HA) with acid [Dorozhkin, 1997]:
Ca10(PO4)6(OH)2 + 2 H+ ↔ 10 Ca2+ + 6 PO43- + 2 H2O
Besides, the citrate ion (C6H5O7)3- (cit) is a calcium-chelating ligand and can form a soluble
Ca-cit complex, promoting further enamel dissolution [Koulourides et al., 1961; Rhee and
Tanaka, 1999]. Barbour et al. (2003) found a significant decrease in the enamel microhardness
and elastic modulus after human enamel was exposed to citric acid solutions with 2.30 ≤ pH ≤
6.30. In a study by Attin et al. (2003), the effect of a mineral supplement to citric acid on bovine
enamel was evaluated. The results showed that calcium, phosphate and fluoride exerted a
significant protective effect with respect to dental erosion caused by citric acid. However, enamel
dissolution was not completely prevented by the application of minerals of low concentrations.
Citric acid can be regarded as a potential erosive substance to enamel [White et al., 2001]. Hence,
it is of vital importance to better understand the effects of such sodium chlorite-based bleaching
materials on dental enamel.
2.5 Aims of this study
The objective of the present in vitro study was to investigate the structural aspects of bleaching
and fluoride application on dental enamel utilizing different test methods. Firstly, the effect of
different bleaching formulae (peroxide-based and non-peroxide-based) on the physicochemical
properties of dental enamel was studied. The changes in the surface morphology, chemical
composition and crystal structure of enamel treated with commercial peroxide-based bleaching
reagents (Opalescence Xtra Boost, Opalescence PF 20% and sodium perborate) and a
non-peroxide-based bleaching product (Rapid White) were observed by different techniques:
scanning electron microscopy (SEM), attenuated total reflectance infrared spectroscopy (ATR
IR), Raman spectroscopy, x-ray diffraction (XRD), electron-probe microanalysis (EPMA) and
electron-probe element mapping, as well as flame atomic absorption spectroscopy (FAAS) and
total reflection X-ray fluorescence (TXRF). Subsequently, the role of fluoride reagents in
preserving the apatite structure against bleaching-induced deterioration was studied using ATR
IR spectroscopy and complementary SEM imaging. In addition, the impact of citric
2 Literature review
27
acid-containing bleaching agents or aqueous solutions on enamel apatite was compared with that
on single-crystal hydroxyapatite (HA) of geological origin.
3 Materials and methods
28
3 Materials and methods
3.1 Sample preparation
1) Enamel samples
Extracted human molars were stored in distilled water at room temperature prior to the
experiment. Sound molar teeth with no caries, enamel defects or crazing/cracks were selected in
this study. The soft tissues of the teeth were cleaned and the roots were removed, approximately
to the cemento-enamel junction, with a water cooled high-speed hand piece.
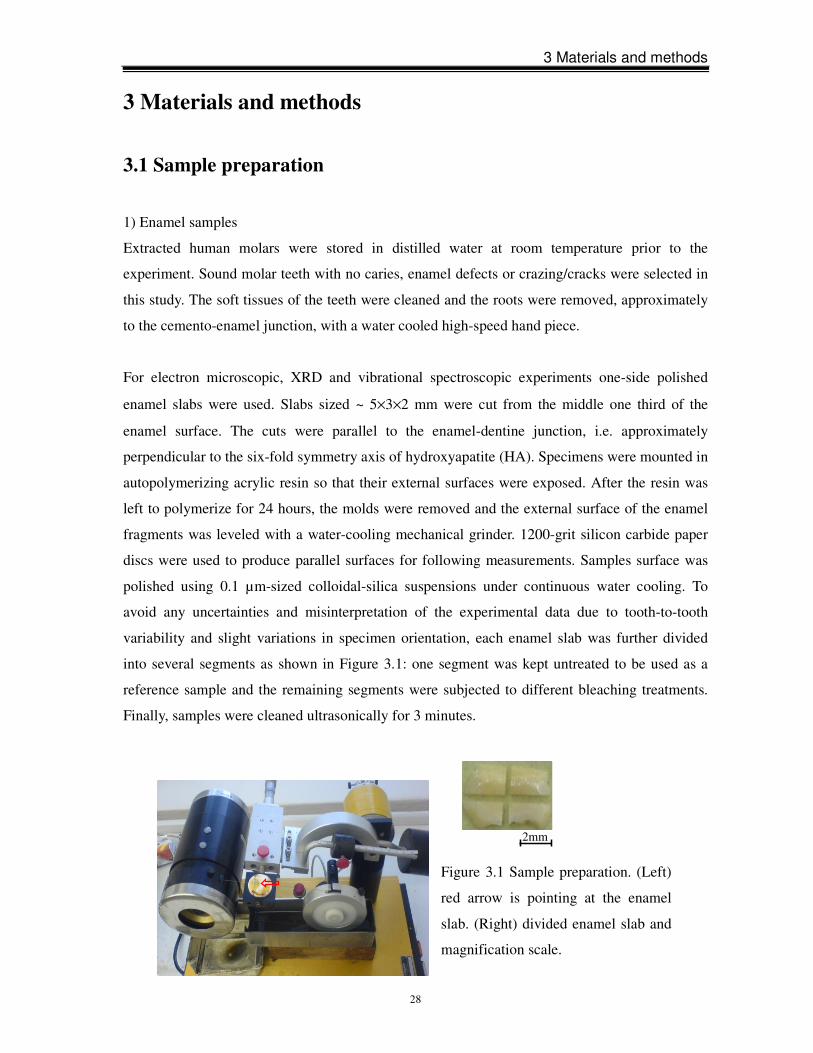
For electron microscopic, XRD and vibrational spectroscopic experiments one-side polished
enamel slabs were used. Slabs sized ~ 5×3×2 mm were cut from the middle one third of the
enamel surface. The cuts were parallel to the enamel-dentine junction, i.e. approximately
perpendicular to the six-fold symmetry axis of hydroxyapatite (HA). Specimens were mounted in
autopolymerizing acrylic resin so that their external surfaces were exposed. After the resin was
left to polymerize for 24 hours, the molds were removed and the external surface of the enamel
fragments was leveled with a water-cooling mechanical grinder. 1200-grit silicon carbide paper
discs were used to produce parallel surfaces for following measurements. Samples surface was
polished using 0.1 µm-sized colloidal-silica suspensions under continuous water cooling. To
avoid any uncertainties and misinterpretation of the experimental data due to tooth-to-tooth
variability and slight variations in specimen orientation, each enamel slab was further divided
into several segments as shown in Figure 3.1: one segment was kept untreated to be used as a
reference sample and the remaining segments were subjected to different bleaching treatments.
Finally, samples were cleaned ultrasonically for 3 minutes.
2mm
Figure 3.1 Sample preparation. (Left)
red arrow is pointing at the enamel
slab. (Right) divided enamel slab and
magnification scale.
3 Materials and methods
29
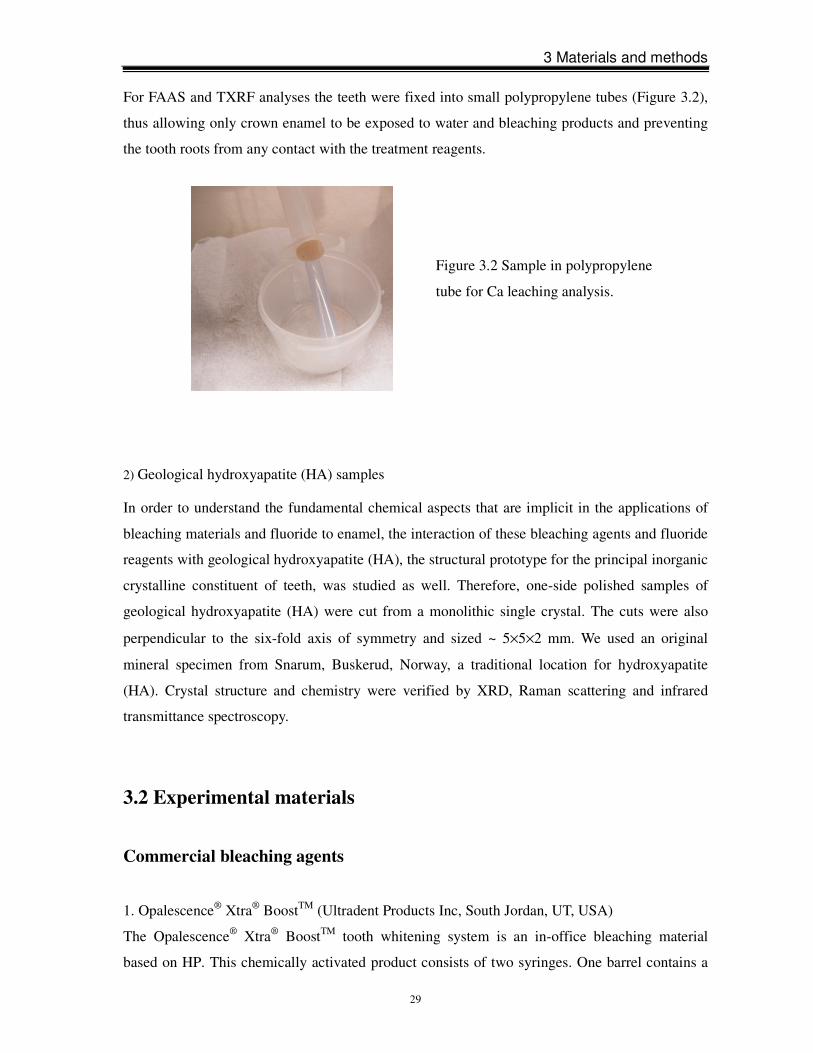
For FAAS and TXRF analyses the teeth were fixed into small polypropylene tubes (Figure 3.2),
thus allowing only crown enamel to be exposed to water and bleaching products and preventing
the tooth roots from any contact with the treatment reagents.
2) Geological hydroxyapatite (HA) samples
In order to understand the fundamental chemical aspects that are implicit in the applications of
bleaching materials and fluoride to enamel, the interaction of these bleaching agents and fluoride
reagents with geological hydroxyapatite (HA), the structural prototype for the principal inorganic
crystalline constituent of teeth, was studied as well. Therefore, one-side polished samples of
geological hydroxyapatite (HA) were cut from a monolithic single crystal. The cuts were also
perpendicular to the six-fold axis of symmetry and sized ~ 5×5×2 mm. We used an original
mineral specimen from Snarum, Buskerud, Norway, a traditional location for hydroxyapatite
(HA). Crystal structure and chemistry were verified by XRD, Raman scattering and infrared
transmittance spectroscopy.
3.2 Experimental materials
Commercial bleaching agents
1. Opalescence® Xtra® BoostTM (Ultradent Products Inc, South Jordan, UT, USA)
The Opalescence® Xtra® BoostTM tooth whitening system is an in-office bleaching material
based on HP. This chemically activated product consists of two syringes. One barrel contains a
Figure 3.2 Sample in polypropylene
tube for Ca leaching analysis.
3 Materials and methods
30
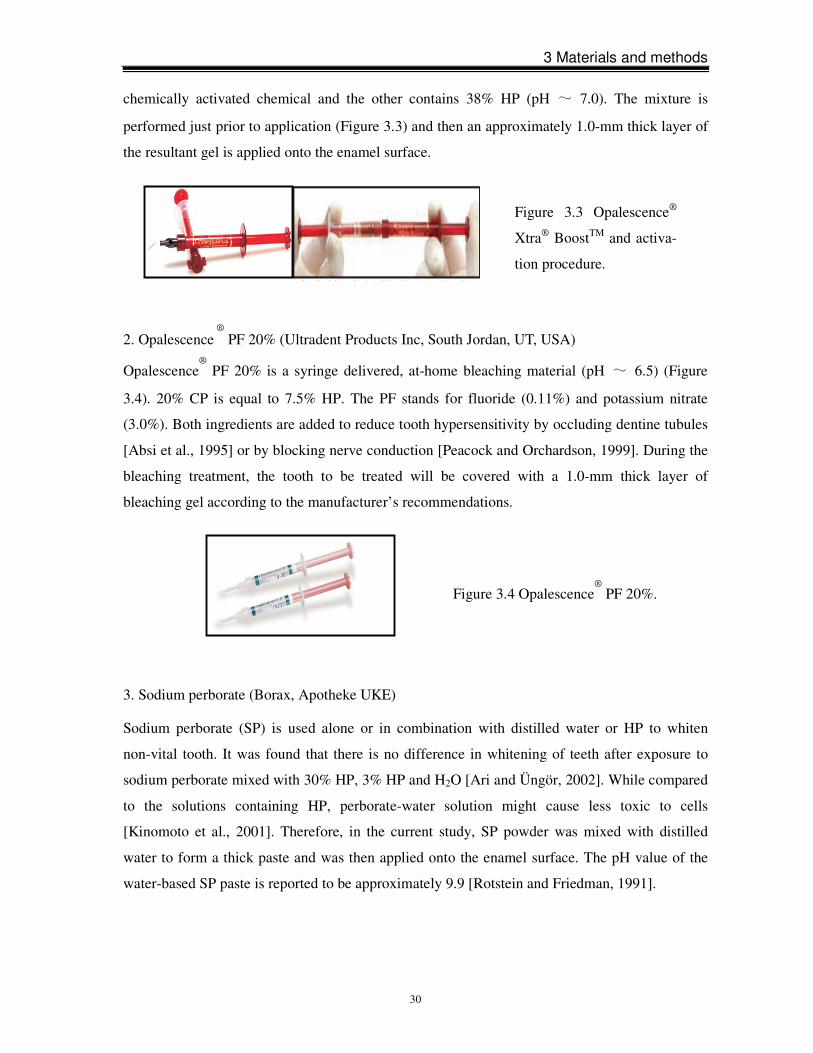
chemically activated chemical and the other contains 38% HP (pH ~ 7.0). The mixture is
performed just prior to application (Figure 3.3) and then an approximately 1.0-mm thick layer of
the resultant gel is applied onto the enamel surface.
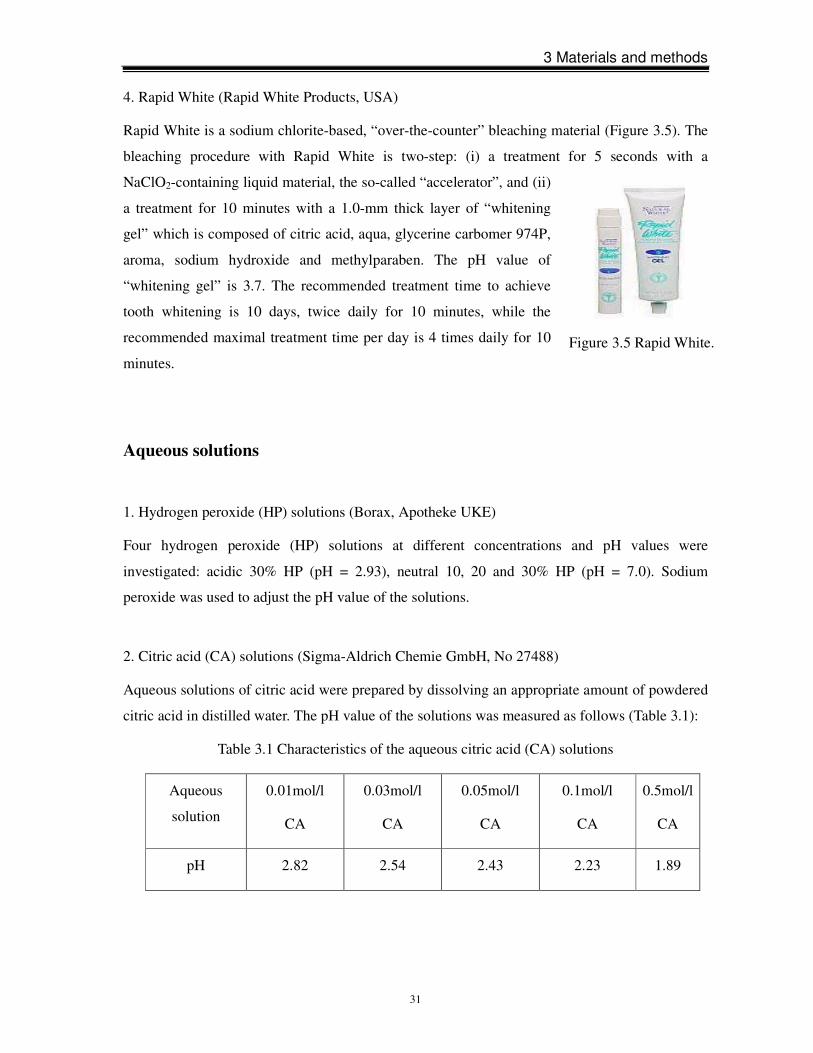
2. Opalescence ® PF 20% (Ultradent Products Inc, South Jordan, UT, USA)
Opalescence® PF 20% is a syringe delivered, at-home bleaching material (pH ~ 6.5) (Figure
3.4). 20% CP is equal to 7.5% HP. The PF stands for fluoride (0.11%) and potassium nitrate
(3.0%). Both ingredients are added to reduce tooth hypersensitivity by occluding dentine tubules
[Absi et al., 1995] or by blocking nerve conduction [Peacock and Orchardson, 1999]. During the
bleaching treatment, the tooth to be treated will be covered with a 1.0-mm thick layer of
bleaching gel according to the manufacturer’s recommendations.
3. Sodium perborate (Borax, Apotheke UKE)
Sodium perborate (SP) is used alone or in combination with distilled water or HP to whiten
non-vital tooth. It was found that there is no difference in whitening of teeth after exposure to
sodium perborate mixed with 30% HP, 3% HP and H2O [Ari and Üngör, 2002]. While compared
to the solutions containing HP, perborate-water solution might cause less toxic to cells
[Kinomoto et al., 2001]. Therefore, in the current study, SP powder was mixed with distilled
water to form a thick paste and was then applied onto the enamel surface. The pH value of the
water-based SP paste is reported to be approximately 9.9 [Rotstein and Friedman, 1991].
Figure 3.4 Opalescence®
PF 20%.
Figure 3.3 Opalescence®
Xtra® BoostTM and activa-
tion procedure.
3 Materials and methods
31
Figure 3.5 Rapid White.
4. Rapid White (Rapid White Products, USA)
Rapid White is a sodium chlorite-based, “over-the-counter” bleaching material (Figure 3.5). The
bleaching procedure with Rapid White is two-step: (i) a treatment for 5 seconds with a
NaClO2-containing liquid material, the so-called “accelerator”, and (ii)
a treatment for 10 minutes with a 1.0-mm thick layer of “whitening
gel” which is composed of citric acid, aqua, glycerine carbomer 974P,
aroma, sodium hydroxide and methylparaben. The pH value of
“whitening gel” is 3.7. The recommended treatment time to achieve
tooth whitening is 10 days, twice daily for 10 minutes, while the
recommended maximal treatment time per day is 4 times daily for 10
minutes.
Aqueous solutions
1. Hydrogen peroxide (HP) solutions (Borax, Apotheke UKE)
Four hydrogen peroxide (HP) solutions at different concentrations and pH values were
investigated: acidic 30% HP (pH = 2.93), neutral 10, 20 and 30% HP (pH = 7.0). Sodium
peroxide was used to adjust the pH value of the solutions.
2. Citric acid (CA) solutions (Sigma-Aldrich Chemie GmbH, No 27488)
Aqueous solutions of citric acid were prepared by dissolving an appropriate amount of powdered
citric acid in distilled water. The pH value of the solutions was measured as follows (Table 3.1):
Table 3.1 Characteristics of the aqueous citric acid (CA) solutions
Aqueous
solution
0.01mol/l
CA
0.03mol/l
CA
0.05mol/l
CA
0.1mol/l
CA
0.5mol/l
CA
pH 2.82 2.54 2.43 2.23 1.89
3 Materials and methods
32
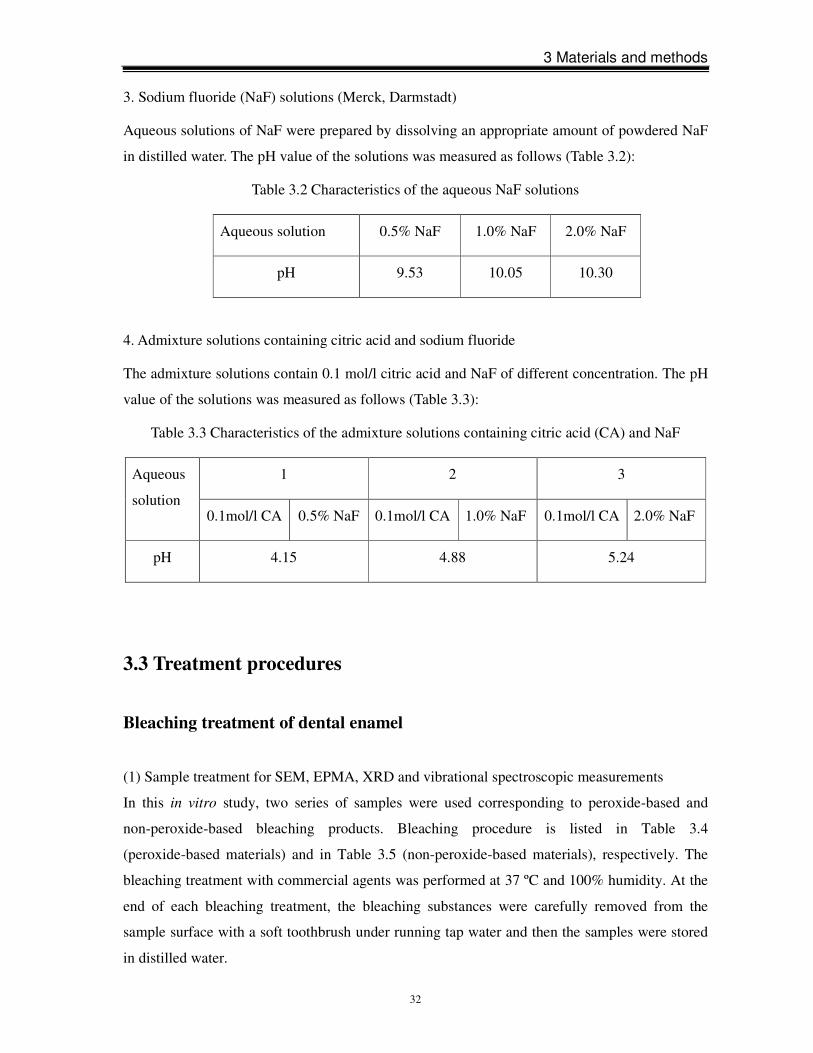
3. Sodium fluoride (NaF) solutions (Merck, Darmstadt)
Aqueous solutions of NaF were prepared by dissolving an appropriate amount of powdered NaF
in distilled water. The pH value of the solutions was measured as follows (Table 3.2):
Table 3.2 Characteristics of the aqueous NaF solutions
Aqueous solution 0.5% NaF 1.0% NaF 2.0% NaF
pH 9.53 10.05 10.30
4. Admixture solutions containing citric acid and sodium fluoride
The admixture solutions contain 0.1 mol/l citric acid and NaF of different concentration. The pH
value of the solutions was measured as follows (Table 3.3):
Table 3.3 Characteristics of the admixture solutions containing citric acid (CA) and NaF
3.3 Treatment procedures
Bleaching treatment of dental enamel
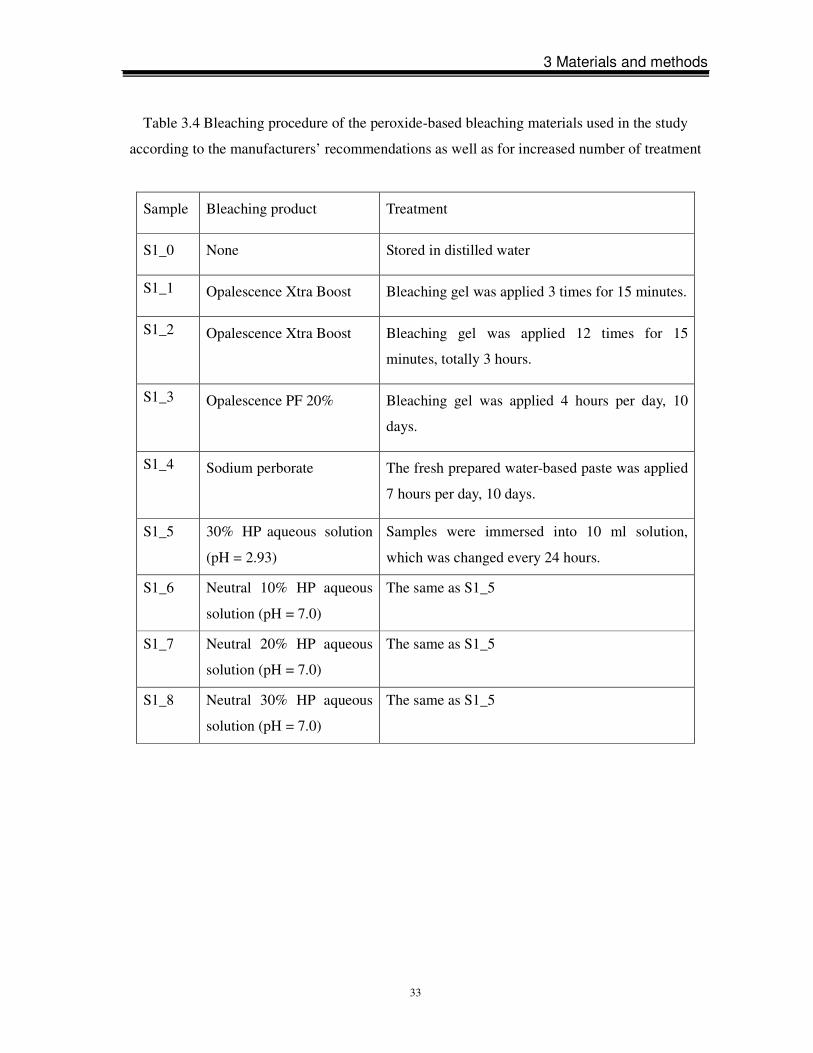
(1) Sample treatment for SEM, EPMA, XRD and vibrational spectroscopic measurements
In this in vitro study, two series of samples were used corresponding to peroxide-based and
non-peroxide-based bleaching products. Bleaching procedure is listed in Table 3.4
(peroxide-based materials) and in Table 3.5 (non-peroxide-based materials), respectively. The
bleaching treatment with commercial agents was performed at 37 ºC and 100% humidity. At the
end of each bleaching treatment, the bleaching substances were carefully removed from the
sample surface with a soft toothbrush under running tap water and then the samples were stored
in distilled water.
1 2 3 Aqueous
solution 0.1mol/l CA 0.5% NaF 0.1mol/l CA 1.0% NaF 0.1mol/l CA 2.0% NaF
pH 4.15 4.88 5.24
3 Materials and methods
33
Table 3.4 Bleaching procedure of the peroxide-based bleaching materials used in the study
according to the manufacturers’ recommendations as well as for increased number of treatment
Sample Bleaching product Treatment
S1_0 None Stored in distilled water
S1_1 Opalescence Xtra Boost Bleaching gel was applied 3 times for 15 minutes.
S1_2 Opalescence Xtra Boost Bleaching gel was applied 12 times for 15
minutes, totally 3 hours.
S1_3 Opalescence PF 20% Bleaching gel was applied 4 hours per day, 10
days.
S1_4 Sodium perborate The fresh prepared water-based paste was applied
7 hours per day, 10 days.
S1_5 30% HP aqueous solution
(pH = 2.93)
Samples were immersed into 10 ml solution,
which was changed every 24 hours.
S1_6 Neutral 10% HP aqueous
solution (pH = 7.0)
The same as S1_5
S1_7 Neutral 20% HP aqueous
solution (pH = 7.0)
The same as S1_5
S1_8 Neutral 30% HP aqueous
solution (pH = 7.0)
The same as S1_5
3 Materials and methods
34
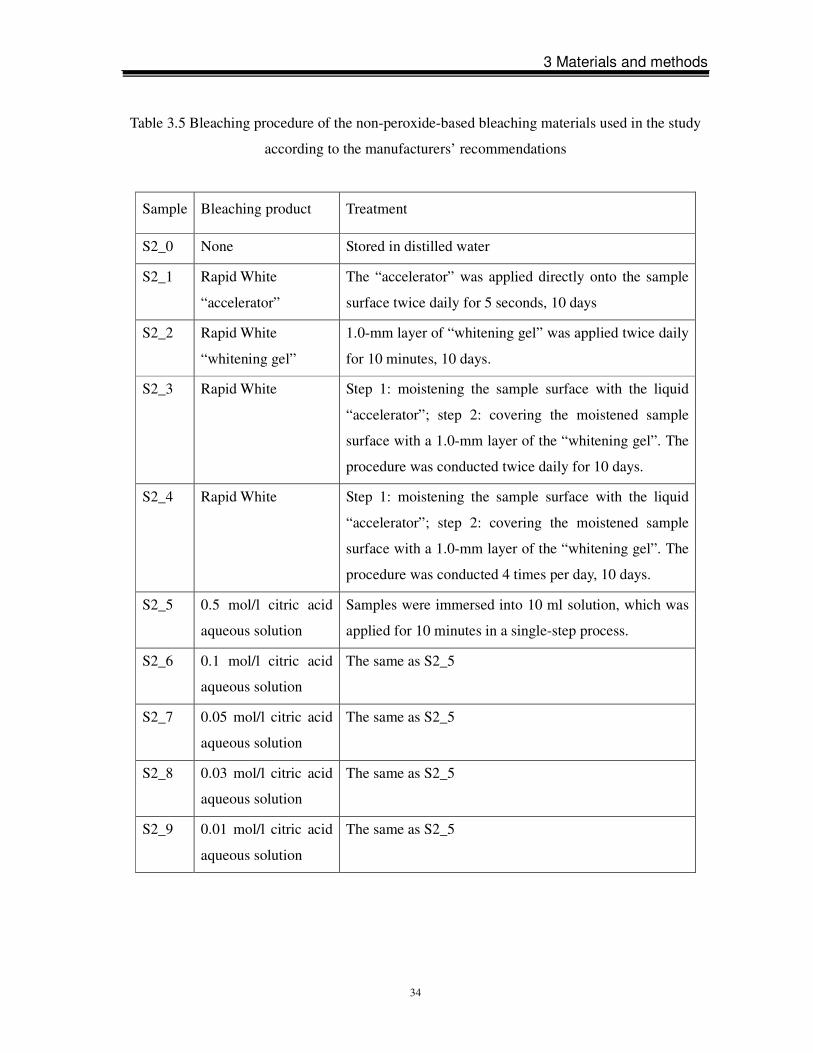
Table 3.5 Bleaching procedure of the non-peroxide-based bleaching materials used in the study
according to the manufacturers’ recommendations
Sample Bleaching product Treatment
S2_0 None Stored in distilled water
S2_1 Rapid White
“accelerator”
The “accelerator” was applied directly onto the sample
surface twice daily for 5 seconds, 10 days
S2_2 Rapid White
“whitening gel”
1.0-mm layer of “whitening gel” was applied twice daily
for 10 minutes, 10 days.
S2_3 Rapid White Step 1: moistening the sample surface with the liquid
“accelerator”; step 2: covering the moistened sample
surface with a 1.0-mm layer of the “whitening gel”. The
procedure was conducted twice daily for 10 days.
S2_4 Rapid White Step 1: moistening the sample surface with the liquid
“accelerator”; step 2: covering the moistened sample
surface with a 1.0-mm layer of the “whitening gel”. The
procedure was conducted 4 times per day, 10 days.
S2_5 0.5 mol/l citric acid
aqueous solution
Samples were immersed into 10 ml solution, which was
applied for 10 minutes in a single-step process.
S2_6 0.1 mol/l citric acid
aqueous solution
The same as S2_5
S2_7 0.05 mol/l citric acid
aqueous solution
The same as S2_5
S2_8 0.03 mol/l citric acid
aqueous solution
The same as S2_5
S2_9 0.01 mol/l citric acid
aqueous solution
The same as S2_5
3 Materials and methods
35
(2) Sample treatment for the calcium leaching experiment
The calcium leaching experiments were performed at room temperature. Solutions were prepared
in a clean bench of class 100. First, each tooth was moistened with 20 µL distilled water and
carefully rinsed to ensure that all calcium leached from the enamel surface was collected. The
solutions prepared in such a way were used as a reference for the corresponding bleaching
procedure. Then, the same tooth was subjected to a bleaching procedure. This study compared
the degree of bleaching-induced Ca leaching for teeth treated with Rapid White and with
Opalescence Xtra Boost. Both whitening products were applied following the protocol specified
by the manufacturers: (i) for Rapid White the tooth was first moistened with 20 µL of
“accelerator” and then coated with 40-50 mg of “whitening gel”; (ii) for Opalescence Xtra Boost
the two components of the bleaching agent were mixed and 30-50 mg of the resultant mixture
was applied on the tooth surface. Additionally, we prepared solutions from teeth treated with
“accelerator” alone for 5 seconds and with “whitening gel” alone for 10 minutes to investigate
the effect of each component. After 10 minutes of treatment with the corresponding reagent the
tooth surface was washed with distilled water to remove the agent and finally rinsed to collect Ca
leached from enamel. The collected aqueous solutions from both unbleached and bleached
enamel surfaces were subsequently filled up with distilled water to 2000 mg to be further
analyzed by FAAS and TXRF. To each solution 20 µl of a 0.01 g/l standard solution were added
as an internal standard for the TXRF experiments.
Sodium fluoride treatment of dental enamel
Enamel samples treated according to the following procedures were investigated: (i) treated first
with a 0.1 mol/l citric acid solution and then with aqueous NaF solutions of different
concentrations; (ii) treated first with aqueous NaF solutions of different concentrations and then
with 0.1 mol/l citric acid solution; and (iii) treated with aqueous solutions containing both citric
acid and NaF. The exact concentrations and the pH values of the corresponding solutions have
been shown in Tables 3.1-3.3.
To check if fluoride can recover the modified structure of enamel caused by citric acid, samples
of Series 1 were subjected to a multi-step treatment, where a single-step process consisted of
immersion of the sample into 10 ml citric acid solution for 10 minutes and subsequent rinsing
with distilled water, and then immersion of the sample into 10 ml NaF solution for 10 minutes
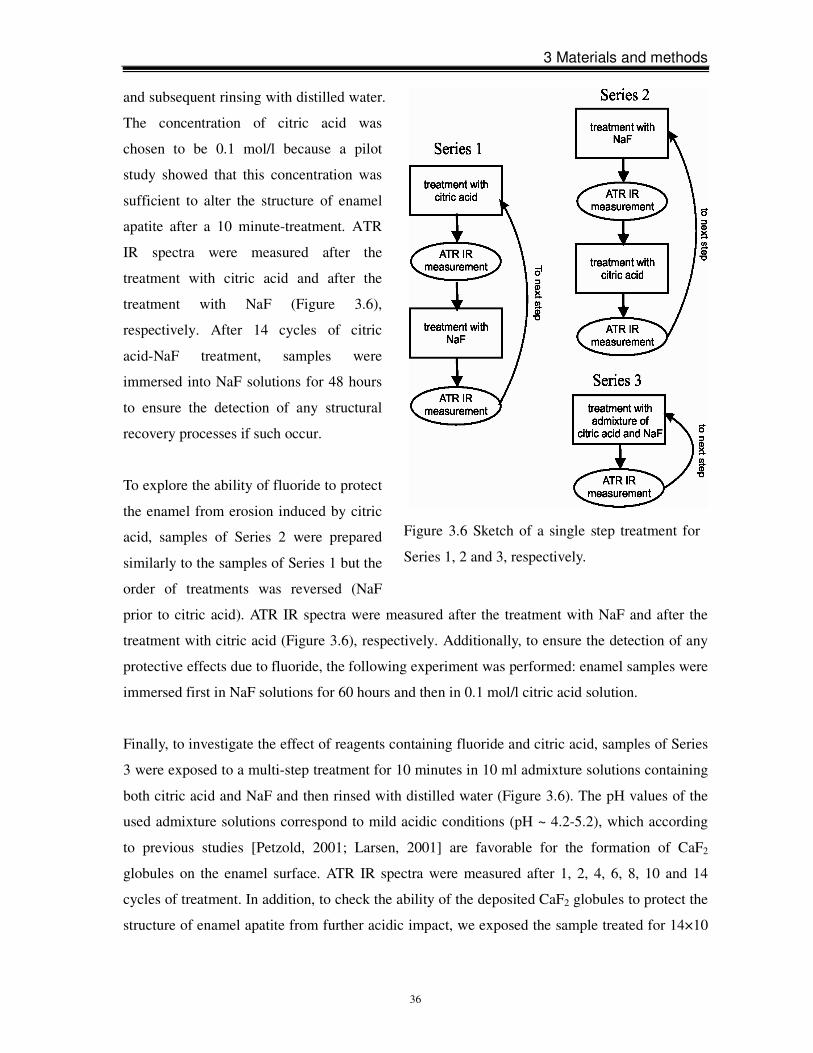
3 Materials and methods
36
and subsequent rinsing with distilled water.
The concentration of citric acid was
chosen to be 0.1 mol/l because a pilot
study showed that this concentration was
sufficient to alter the structure of enamel
apatite after a 10 minute-treatment. ATR
IR spectra were measured after the
treatment with citric acid and after the
treatment with NaF (Figure 3.6),
respectively. After 14 cycles of citric
acid-NaF treatment, samples were
immersed into NaF solutions for 48 hours
to ensure the detection of any structural
recovery processes if such occur.
To explore the ability of fluoride to protect
the enamel from erosion induced by citric
acid, samples of Series 2 were prepared
similarly to the samples of Series 1 but the
order of treatments was reversed (NaF
prior to citric acid). ATR IR spectra were measured after the treatment with NaF and after the
treatment with citric acid (Figure 3.6), respectively. Additionally, to ensure the detection of any
protective effects due to fluoride, the following experiment was performed: enamel samples were
immersed first in NaF solutions for 60 hours and then in 0.1 mol/l citric acid solution.
Finally, to investigate the effect of reagents containing fluoride and citric acid, samples of Series
3 were exposed to a multi-step treatment for 10 minutes in 10 ml admixture solutions containing
both citric acid and NaF and then rinsed with distilled water (Figure 3.6). The pH values of the
used admixture solutions correspond to mild acidic conditions (pH ~ 4.2-5.2), which according
to previous studies [Petzold, 2001; Larsen, 2001] are favorable for the formation of CaF2
globules on the enamel surface. ATR IR spectra were measured after 1, 2, 4, 6, 8, 10 and 14
cycles of treatment. In addition, to check the ability of the deposited CaF2 globules to protect the
structure of enamel apatite from further acidic impact, we exposed the sample treated for 14×10
Figure 3.6 Sketch of a single step treatment for
Series 1, 2 and 3, respectively.
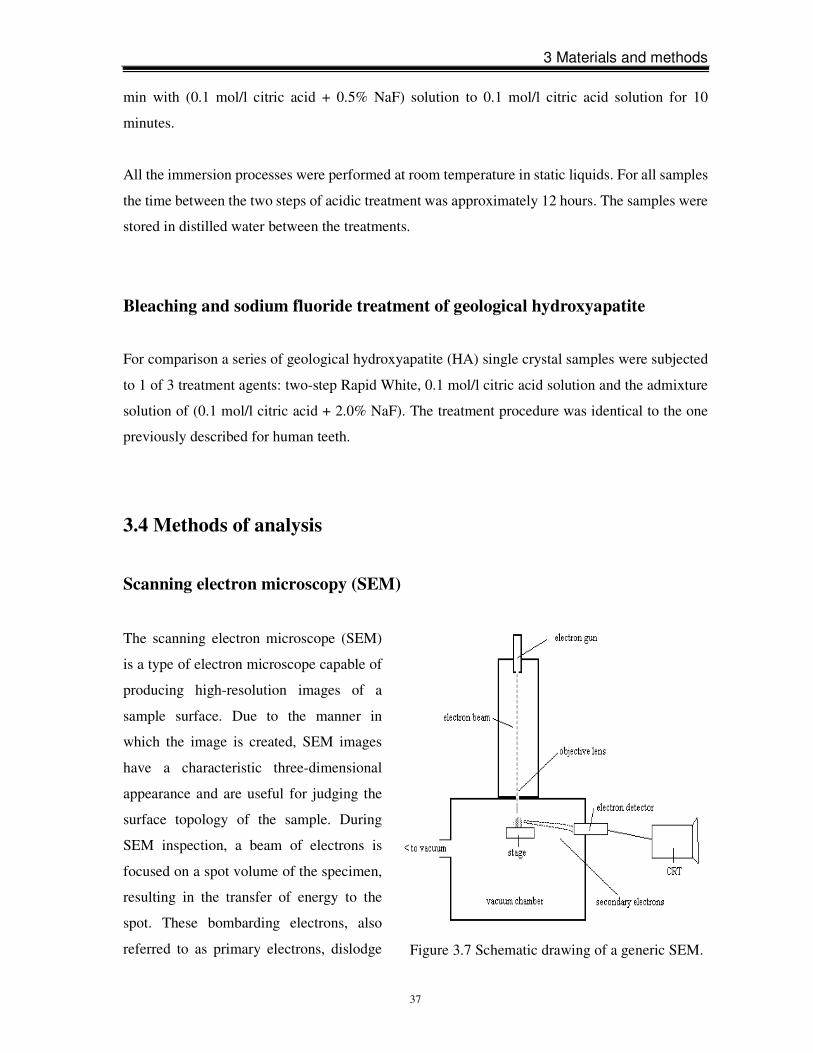
3 Materials and methods
37
min with (0.1 mol/l citric acid + 0.5% NaF) solution to 0.1 mol/l citric acid solution for 10
minutes.
All the immersion processes were performed at room temperature in static liquids. For all samples
the time between the two steps of acidic treatment was approximately 12 hours. The samples were
stored in distilled water between the treatments.
Bleaching and sodium fluoride treatment of geological hydroxyapatite
For comparison a series of geological hydroxyapatite (HA) single crystal samples were subjected
to 1 of 3 treatment agents: two-step Rapid White, 0.1 mol/l citric acid solution and the admixture
solution of (0.1 mol/l citric acid + 2.0% NaF). The treatment procedure was identical to the one
previously described for human teeth.
3.4 Methods of analysis
Scanning electron microscopy (SEM)
The scanning electron microscope (SEM)
is a type of electron microscope capable of
producing high-resolution images of a
sample surface. Due to the manner in
which the image is created, SEM images
have a characteristic three-dimensional
appearance and are useful for judging the
surface topology of the sample. During
SEM inspection, a beam of electrons is
focused on a spot volume of the specimen,
resulting in the transfer of energy to the
spot. These bombarding electrons, also
referred to as primary electrons, dislodge Figure 3.7 Schematic drawing of a generic SEM.
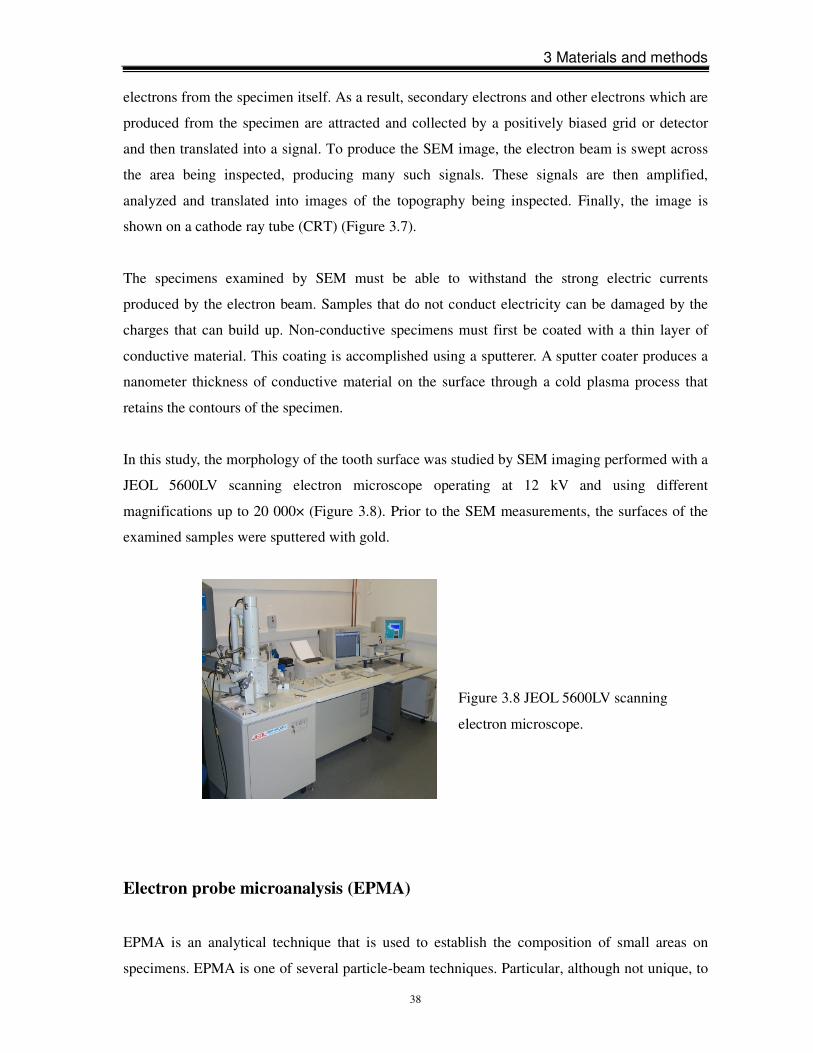
3 Materials and methods
38
electrons from the specimen itself. As a result, secondary electrons and other electrons which are
produced from the specimen are attracted and collected by a positively biased grid or detector
and then translated into a signal. To produce the SEM image, the electron beam is swept across
the area being inspected, producing many such signals. These signals are then amplified,
analyzed and translated into images of the topography being inspected. Finally, the image is
shown on a cathode ray tube (CRT) (Figure 3.7).
The specimens examined by SEM must be able to withstand the strong electric currents
produced by the electron beam. Samples that do not conduct electricity can be damaged by the
charges that can build up. Non-conductive specimens must first be coated with a thin layer of
conductive material. This coating is accomplished using a sputterer. A sputter coater produces a
nanometer thickness of conductive material on the surface through a cold plasma process that
retains the contours of the specimen.
In this study, the morphology of the tooth surface was studied by SEM imaging performed with a
JEOL 5600LV scanning electron microscope operating at 12 kV and using different
magnifications up to 20 000× (Figure 3.8). Prior to the SEM measurements, the surfaces of the
examined samples were sputtered with gold.
Electron probe microanalysis (EPMA)
EPMA is an analytical technique that is used to establish the composition of small areas on
specimens. EPMA is one of several particle-beam techniques. Particular, although not unique, to
Figure 3.8 JEOL 5600LV scanning
electron microscope.
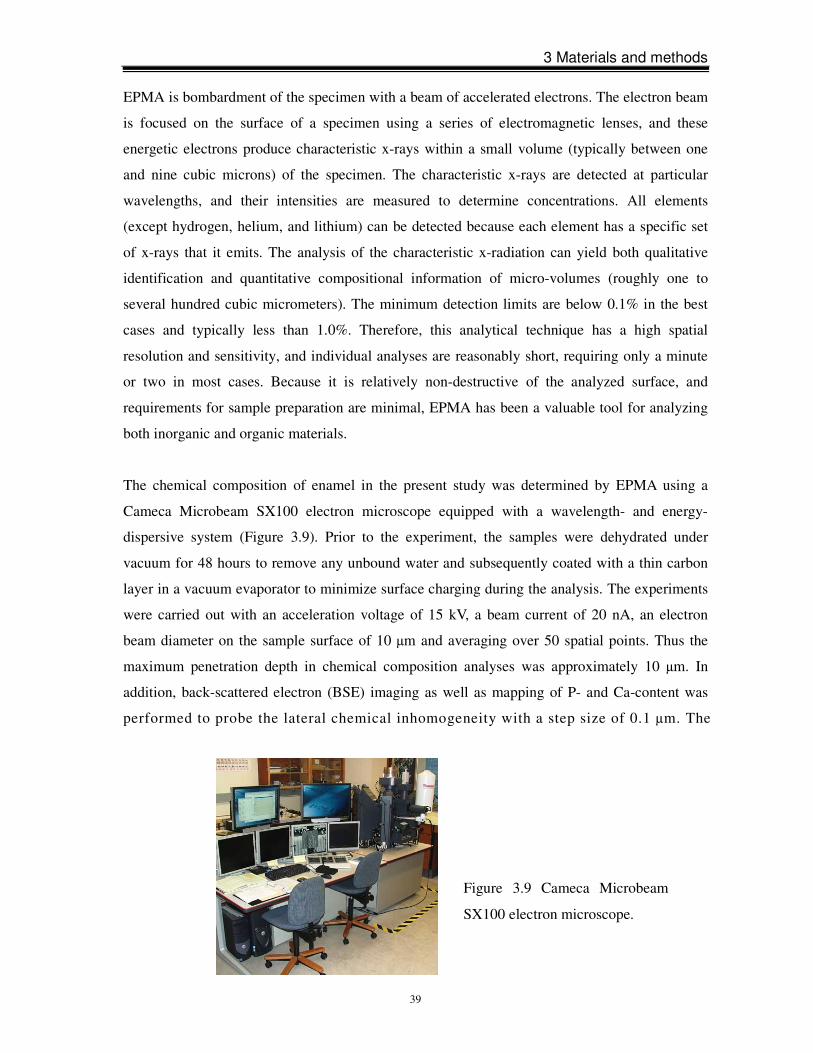
3 Materials and methods
39
EPMA is bombardment of the specimen with a beam of accelerated electrons. The electron beam
is focused on the surface of a specimen using a series of electromagnetic lenses, and these
energetic electrons produce characteristic x-rays within a small volume (typically between one
and nine cubic microns) of the specimen. The characteristic x-rays are detected at particular
wavelengths, and their intensities are measured to determine concentrations. All elements
(except hydrogen, helium, and lithium) can be detected because each element has a specific set
of x-rays that it emits. The analysis of the characteristic x-radiation can yield both qualitative
identification and quantitative compositional information of micro-volumes (roughly one to
several hundred cubic micrometers). The minimum detection limits are below 0.1% in the best
cases and typically less than 1.0%. Therefore, this analytical technique has a high spatial
resolution and sensitivity, and individual analyses are reasonably short, requiring only a minute
or two in most cases. Because it is relatively non-destructive of the analyzed surface, and
requirements for sample preparation are minimal, EPMA has been a valuable tool for analyzing
both inorganic and organic materials.
The chemical composition of enamel in the present study was determined by EPMA using a
Cameca Microbeam SX100 electron microscope equipped with a wavelength- and energy-
dispersive system (Figure 3.9). Prior to the experiment, the samples were dehydrated under
vacuum for 48 hours to remove any unbound water and subsequently coated with a thin carbon
layer in a vacuum evaporator to minimize surface charging during the analysis. The experiments
were carried out with an acceleration voltage of 15 kV, a beam current of 20 nA, an electron
beam diameter on the sample surface of 10 µm and averaging over 50 spatial points. Thus the
maximum penetration depth in chemical composition analyses was approximately 10 µm. In
addition, back-scattered electron (BSE) imaging as well as mapping of P- and Ca-content was
performed to probe the lateral chemical inhomogeneity with a step size of 0.1 µm. The
Figure 3.9 Cameca Microbeam
SX100 electron microscope.
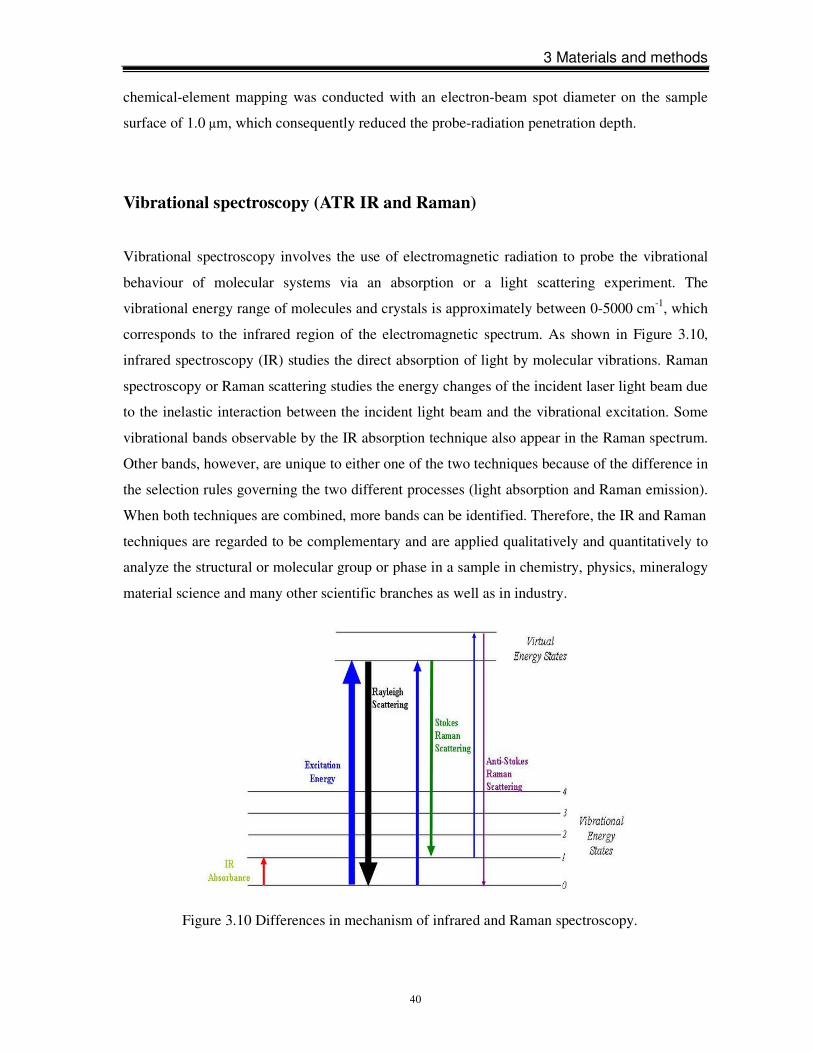
3 Materials and methods
40
chemical-element mapping was conducted with an electron-beam spot diameter on the sample
surface of 1.0 µm, which consequently reduced the probe-radiation penetration depth.
Vibrational spectroscopy (ATR IR and Raman)
Vibrational spectroscopy involves the use of electromagnetic radiation to probe the vibrational
behaviour of molecular systems via an absorption or a light scattering experiment. The
vibrational energy range of molecules and crystals is approximately between 0-5000 cm-1, which
corresponds to the infrared region of the electromagnetic spectrum. As shown in Figure 3.10,
infrared spectroscopy (IR) studies the direct absorption of light by molecular vibrations. Raman
spectroscopy or Raman scattering studies the energy changes of the incident laser light beam due
to the inelastic interaction between the incident light beam and the vibrational excitation. Some
vibrational bands observable by the IR absorption technique also appear in the Raman spectrum.
Other bands, however, are unique to either one of the two techniques because of the difference in
the selection rules governing the two different processes (light absorption and Raman emission).
When both techniques are combined, more bands can be identified. Therefore, the IR and Raman
techniques are regarded to be complementary and are applied qualitatively and quantitatively to
analyze the structural or molecular group or phase in a sample in chemistry, physics, mineralogy
material science and many other scientific branches as well as in industry.
Figure 3.10 Differences in mechanism of infrared and Raman spectroscopy.
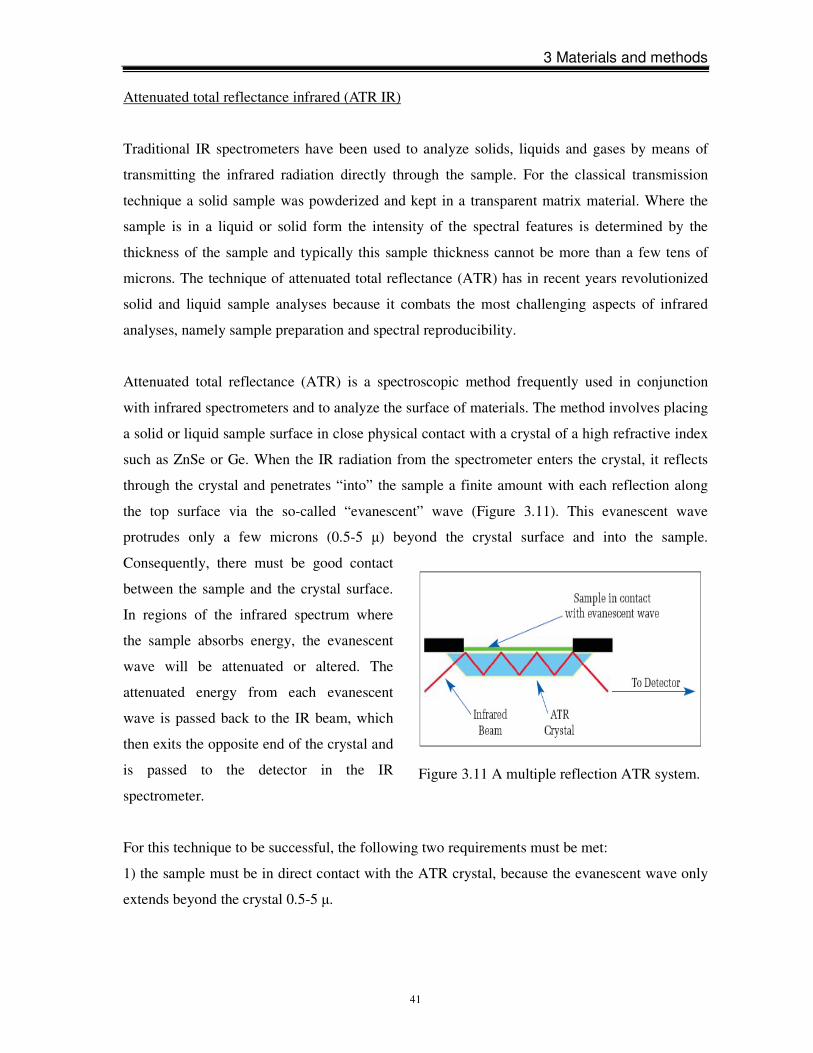
3 Materials and methods
41
Attenuated total reflectance infrared (ATR IR)
Traditional IR spectrometers have been used to analyze solids, liquids and gases by means of
transmitting the infrared radiation directly through the sample. For the classical transmission
technique a solid sample was powderized and kept in a transparent matrix material. Where the
sample is in a liquid or solid form the intensity of the spectral features is determined by the
thickness of the sample and typically this sample thickness cannot be more than a few tens of
microns. The technique of attenuated total reflectance (ATR) has in recent years revolutionized
solid and liquid sample analyses because it combats the most challenging aspects of infrared
analyses, namely sample preparation and spectral reproducibility.
Attenuated total reflectance (ATR) is a spectroscopic method frequently used in conjunction
with infrared spectrometers and to analyze the surface of materials. The method involves placing
a solid or liquid sample surface in close physical contact with a crystal of a high refractive index
such as ZnSe or Ge. When the IR radiation from the spectrometer enters the crystal, it reflects
through the crystal and penetrates “into” the sample a finite amount with each reflection along
the top surface via the so-called “evanescent” wave (Figure 3.11). This evanescent wave
protrudes only a few microns (0.5-5 µ) beyond the crystal surface and into the sample.
Consequently, there must be good contact
between the sample and the crystal surface.
In regions of the infrared spectrum where
the sample absorbs energy, the evanescent
wave will be attenuated or altered. The
attenuated energy from each evanescent
wave is passed back to the IR beam, which
then exits the opposite end of the crystal and
is passed to the detector in the IR
spectrometer.
For this technique to be successful, the following two requirements must be met:
1) the sample must be in direct contact with the ATR crystal, because the evanescent wave only
extends beyond the crystal 0.5-5 µ.
Figure 3.11 A multiple reflection ATR system.
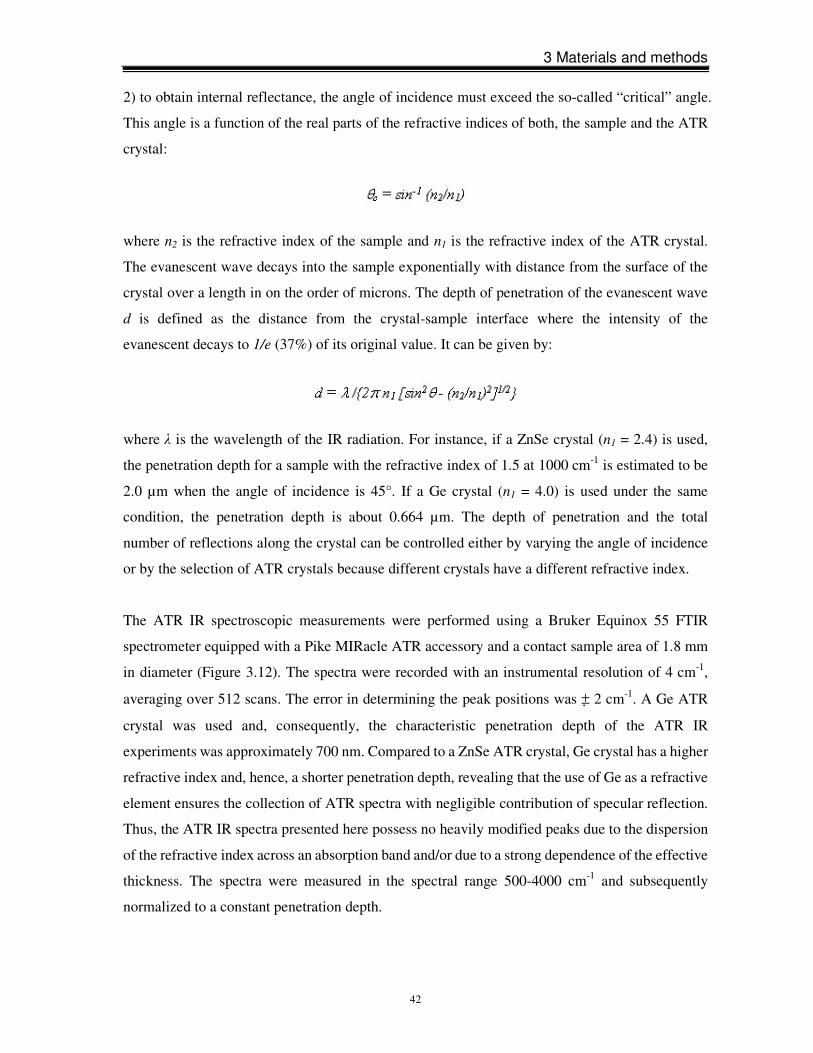
3 Materials and methods
42
2) to obtain internal reflectance, the angle of incidence must exceed the so-called “critical” angle.
This angle is a function of the real parts of the refractive indices of both, the sample and the ATR
crystal:
where n2 is the refractive index of the sample and n1 is the refractive index of the ATR crystal.
The evanescent wave decays into the sample exponentially with distance from the surface of the
crystal over a length in on the order of microns. The depth of penetration of the evanescent wave
d is defined as the distance from the crystal-sample interface where the intensity of the
evanescent decays to 1/e (37%) of its original value. It can be given by:
where λ is the wavelength of the IR radiation. For instance, if a ZnSe crystal (n1 = 2.4) is used,
the penetration depth for a sample with the refractive index of 1.5 at 1000 cm-1 is estimated to be
2.0 µm when the angle of incidence is 45°. If a Ge crystal (n1 = 4.0) is used under the same
condition, the penetration depth is about 0.664 µm. The depth of penetration and the total
number of reflections along the crystal can be controlled either by varying the angle of incidence
or by the selection of ATR crystals because different crystals have a different refractive index.
The ATR IR spectroscopic measurements were performed using a Bruker Equinox 55 FTIR
spectrometer equipped with a Pike MIRacle ATR accessory and a contact sample area of 1.8 mm
in diameter (Figure 3.12). The spectra were recorded with an instrumental resolution of 4 cm-1,
averaging over 512 scans. The error in determining the peak positions was ± 2 cm-1. A Ge ATR
crystal was used and, consequently, the characteristic penetration depth of the ATR IR
experiments was approximately 700 nm. Compared to a ZnSe ATR crystal, Ge crystal has a higher
refractive index and, hence, a shorter penetration depth, revealing that the use of Ge as a refractive
element ensures the collection of ATR spectra with negligible contribution of specular reflection.
Thus, the ATR IR spectra presented here possess no heavily modified peaks due to the dispersion
of the refractive index across an absorption band and/or due to a strong dependence of the effective
thickness. The spectra were measured in the spectral range 500-4000 cm-1 and subsequently
normalized to a constant penetration depth.
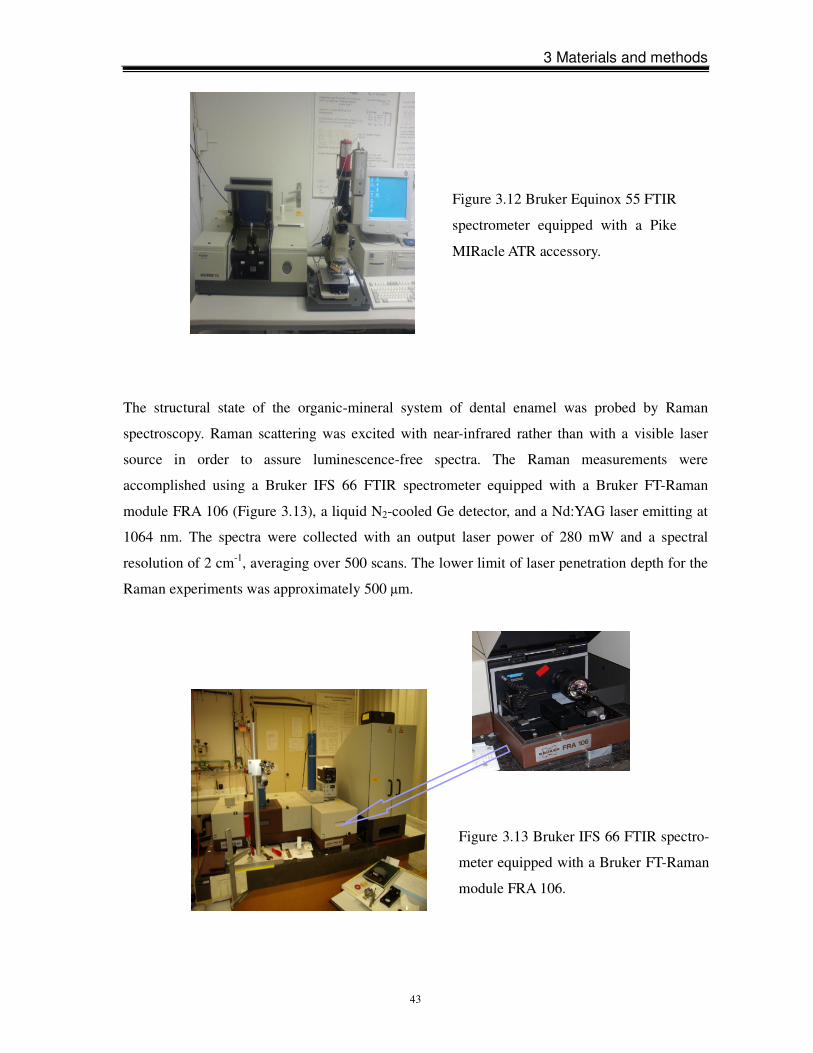
3 Materials and methods
43
The structural state of the organic-mineral system of dental enamel was probed by Raman
spectroscopy. Raman scattering was excited with near-infrared rather than with a visible laser
source in order to assure luminescence-free spectra. The Raman measurements were
accomplished using a Bruker IFS 66 FTIR spectrometer equipped with a Bruker FT-Raman
module FRA 106 (Figure 3.13), a liquid N2-cooled Ge detector, and a Nd:YAG laser emitting at
1064 nm. The spectra were collected with an output laser power of 280 mW and a spectral
resolution of 2 cm-1, averaging over 500 scans. The lower limit of laser penetration depth for the
Raman experiments was approximately 500 µm.
Figure 3.13 Bruker IFS 66 FTIR spectro-
meter equipped with a Bruker FT-Raman
module FRA 106.
Figure 3.12 Bruker Equinox 55 FTIR
spectrometer equipped with a Pike
MIRacle ATR accessory.
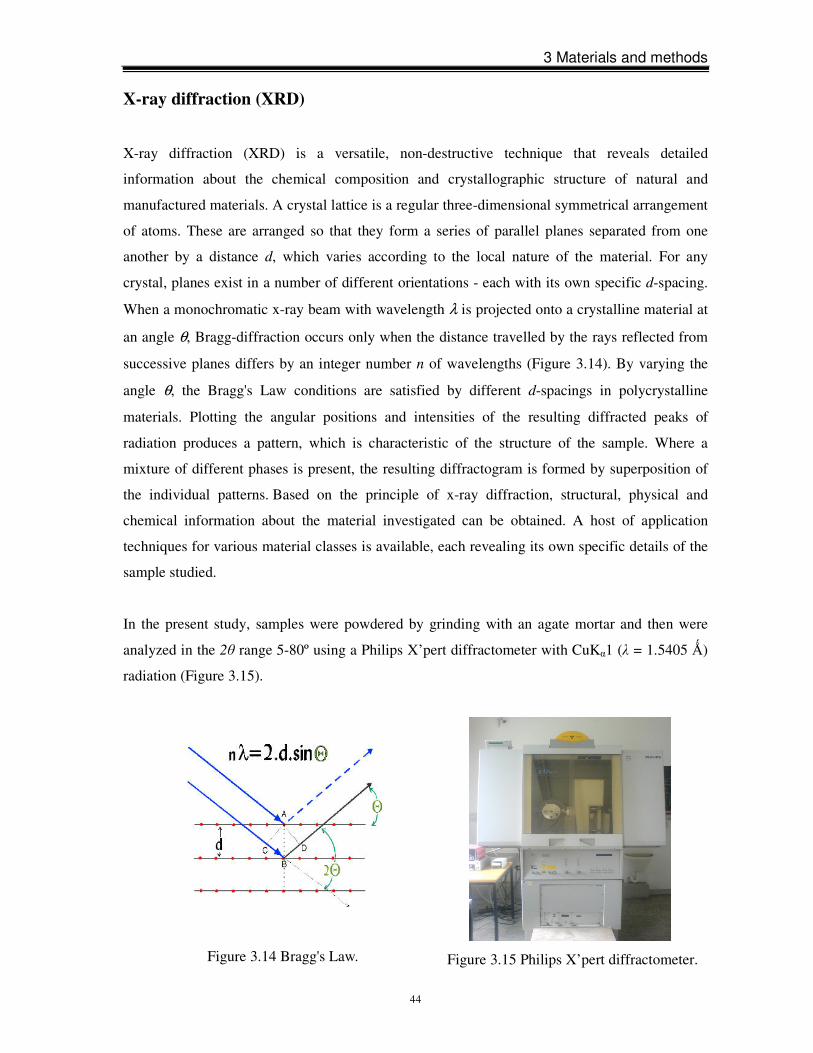
3 Materials and methods
44
X-ray diffraction (XRD)
X-ray diffraction (XRD) is a versatile, non-destructive technique that reveals detailed
information about the chemical composition and crystallographic structure of natural and
manufactured materials. A crystal lattice is a regular three-dimensional symmetrical arrangement
of atoms. These are arranged so that they form a series of parallel planes separated from one
another by a distance d, which varies according to the local nature of the material. For any
crystal, planes exist in a number of different orientations - each with its own specific d-spacing.
When a monochromatic x-ray beam with wavelength λ is projected onto a crystalline material at
an angle θ, Bragg-diffraction occurs only when the distance travelled by the rays reflected from
successive planes differs by an integer number n of wavelengths (Figure 3.14). By varying the
angle θ, the Bragg's Law conditions are satisfied by different d-spacings in polycrystalline
materials. Plotting the angular positions and intensities of the resulting diffracted peaks of
radiation produces a pattern, which is characteristic of the structure of the sample. Where a
mixture of different phases is present, the resulting diffractogram is formed by superposition of
the individual patterns. Based on the principle of x-ray diffraction, structural, physical and
chemical information about the material investigated can be obtained. A host of application
techniques for various material classes is available, each revealing its own specific details of the
sample studied.
In the present study, samples were powdered by grinding with an agate mortar and then were
analyzed in the 2θ range 5-80º using a Philips X’pert diffractometer with CuKα1 (λ = 1.5405 Ǻ)
radiation (Figure 3.15).
Figure 3.15 Philips X’pert diffractometer.
Figure 3.14 Bragg's Law.
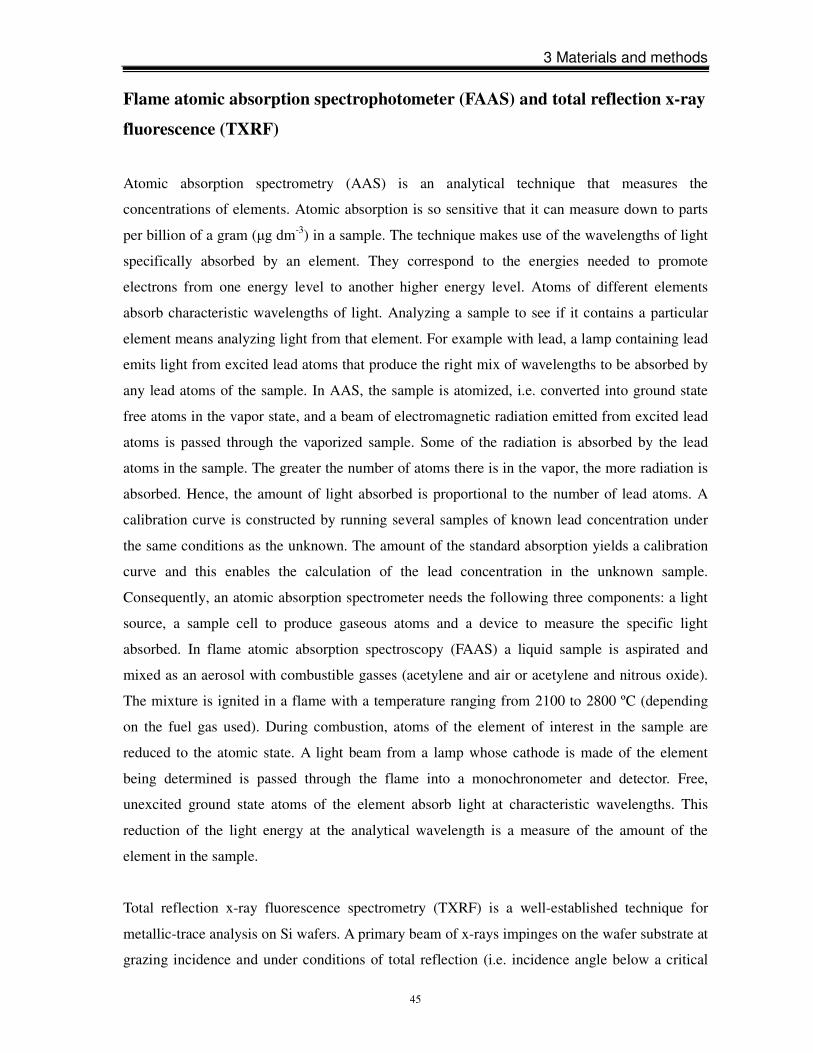
3 Materials and methods
45
Flame atomic absorption spectrophotometer (FAAS) and total reflection x-ray
fluorescence (TXRF)
Atomic absorption spectrometry (AAS) is an analytical technique that measures the
concentrations of elements. Atomic absorption is so sensitive that it can measure down to parts
per billion of a gram (µg dm-3) in a sample. The technique makes use of the wavelengths of light
specifically absorbed by an element. They correspond to the energies needed to promote
electrons from one energy level to another higher energy level. Atoms of different elements
absorb characteristic wavelengths of light. Analyzing a sample to see if it contains a particular
element means analyzing light from that element. For example with lead, a lamp containing lead
emits light from excited lead atoms that produce the right mix of wavelengths to be absorbed by
any lead atoms of the sample. In AAS, the sample is atomized, i.e. converted into ground state
free atoms in the vapor state, and a beam of electromagnetic radiation emitted from excited lead
atoms is passed through the vaporized sample. Some of the radiation is absorbed by the lead
atoms in the sample. The greater the number of atoms there is in the vapor, the more radiation is
absorbed. Hence, the amount of light absorbed is proportional to the number of lead atoms. A
calibration curve is constructed by running several samples of known lead concentration under
the same conditions as the unknown. The amount of the standard absorption yields a calibration
curve and this enables the calculation of the lead concentration in the unknown sample.
Consequently, an atomic absorption spectrometer needs the following three components: a light
source, a sample cell to produce gaseous atoms and a device to measure the specific light
absorbed. In flame atomic absorption spectroscopy (FAAS) a liquid sample is aspirated and
mixed as an aerosol with combustible gasses (acetylene and air or acetylene and nitrous oxide).
The mixture is ignited in a flame with a temperature ranging from 2100 to 2800 ºC (depending
on the fuel gas used). During combustion, atoms of the element of interest in the sample are
reduced to the atomic state. A light beam from a lamp whose cathode is made of the element
being determined is passed through the flame into a monochronometer and detector. Free,
unexcited ground state atoms of the element absorb light at characteristic wavelengths. This
reduction of the light energy at the analytical wavelength is a measure of the amount of the
element in the sample.
Total reflection x-ray fluorescence spectrometry (TXRF) is a well-established technique for
metallic-trace analysis on Si wafers. A primary beam of x-rays impinges on the wafer substrate at
grazing incidence and under conditions of total reflection (i.e. incidence angle below a critical
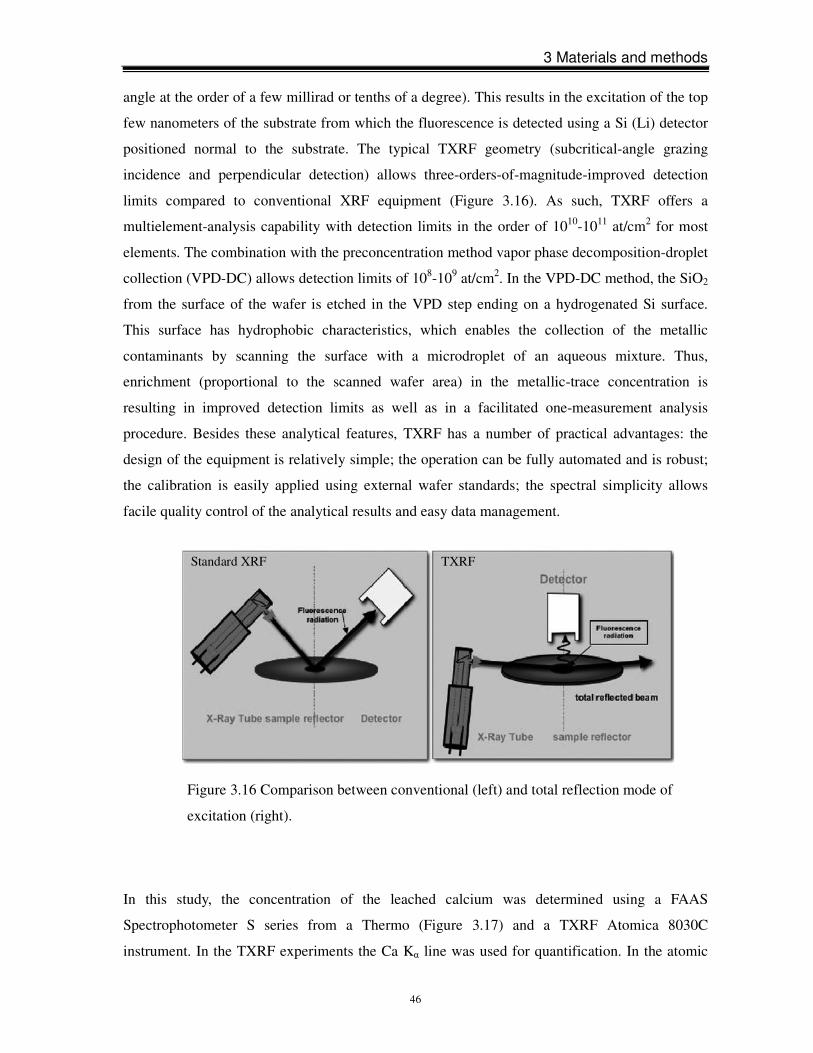
3 Materials and methods
46
angle at the order of a few millirad or tenths of a degree). This results in the excitation of the top
few nanometers of the substrate from which the fluorescence is detected using a Si (Li) detector
positioned normal to the substrate. The typical TXRF geometry (subcritical-angle grazing
incidence and perpendicular detection) allows three-orders-of-magnitude-improved detection
limits compared to conventional XRF equipment (Figure 3.16). As such, TXRF offers a
multielement-analysis capability with detection limits in the order of 1010-1011 at/cm2 for most
elements. The combination with the preconcentration method vapor phase decomposition-droplet
collection (VPD-DC) allows detection limits of 108-109 at/cm2. In the VPD-DC method, the SiO2
from the surface of the wafer is etched in the VPD step ending on a hydrogenated Si surface.
This surface has hydrophobic characteristics, which enables the collection of the metallic
contaminants by scanning the surface with a microdroplet of an aqueous mixture. Thus,
enrichment (proportional to the scanned wafer area) in the metallic-trace concentration is
resulting in improved detection limits as well as in a facilitated one-measurement analysis
procedure. Besides these analytical features, TXRF has a number of practical advantages: the
design of the equipment is relatively simple; the operation can be fully automated and is robust;
the calibration is easily applied using external wafer standards; the spectral simplicity allows
facile quality control of the analytical results and easy data management.
In this study, the concentration of the leached calcium was determined using a FAAS
Spectrophotometer S series from a Thermo (Figure 3.17) and a TXRF Atomica 8030C
instrument. In the TXRF experiments the Ca Kα line was used for quantification. In the atomic
Figure 3.16 Comparison between conventional (left) and total reflection mode of
excitation (right).
Standard XRF TXRF
3 Materials and methods
47
absorption experiments, absorption on the Ca 422.7 nm line was analyzed. For both methods the
achieved detection limit of Ca in aqueous solutions was found to be 0.2 lg/m.
Figure 3.17 Flame atomic absorption
spectrometer (FAAS).
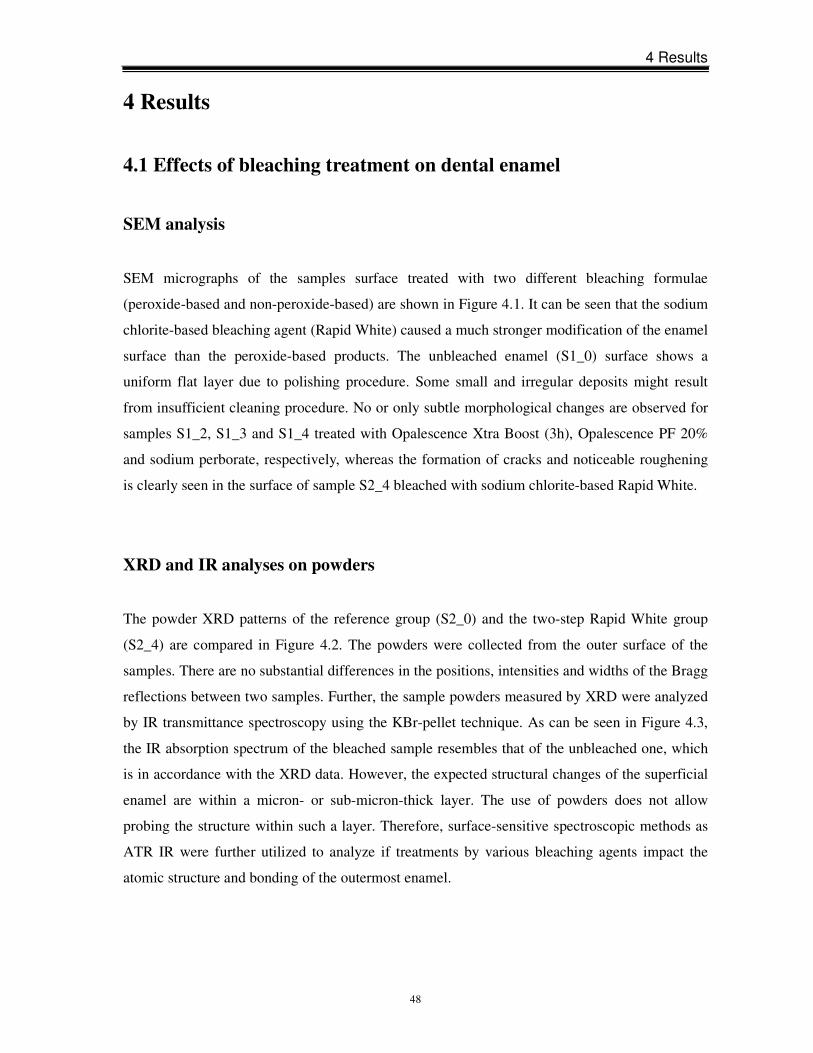
4 Results
48
4 Results
4.1 Effects of bleaching treatment on dental enamel
SEM analysis
SEM micrographs of the samples surface treated with two different bleaching formulae
(peroxide-based and non-peroxide-based) are shown in Figure 4.1. It can be seen that the sodium
chlorite-based bleaching agent (Rapid White) caused a much stronger modification of the enamel
surface than the peroxide-based products. The unbleached enamel (S1_0) surface shows a
uniform flat layer due to polishing procedure. Some small and irregular deposits might result
from insufficient cleaning procedure. No or only subtle morphological changes are observed for
samples S1_2, S1_3 and S1_4 treated with Opalescence Xtra Boost (3h), Opalescence PF 20%
and sodium perborate, respectively, whereas the formation of cracks and noticeable roughening
is clearly seen in the surface of sample S2_4 bleached with sodium chlorite-based Rapid White.
XRD and IR analyses on powders
The powder XRD patterns of the reference group (S2_0) and the two-step Rapid White group
(S2_4) are compared in Figure 4.2. The powders were collected from the outer surface of the
samples. There are no substantial differences in the positions, intensities and widths of the Bragg
reflections between two samples. Further, the sample powders measured by XRD were analyzed
by IR transmittance spectroscopy using the KBr-pellet technique. As can be seen in Figure 4.3,
the IR absorption spectrum of the bleached sample resembles that of the unbleached one, which
is in accordance with the XRD data. However, the expected structural changes of the superficial
enamel are within a micron- or sub-micron-thick layer. The use of powders does not allow
probing the structure within such a layer. Therefore, surface-sensitive spectroscopic methods as
ATR IR were further utilized to analyze if treatments by various bleaching agents impact the
atomic structure and bonding of the outermost enamel.
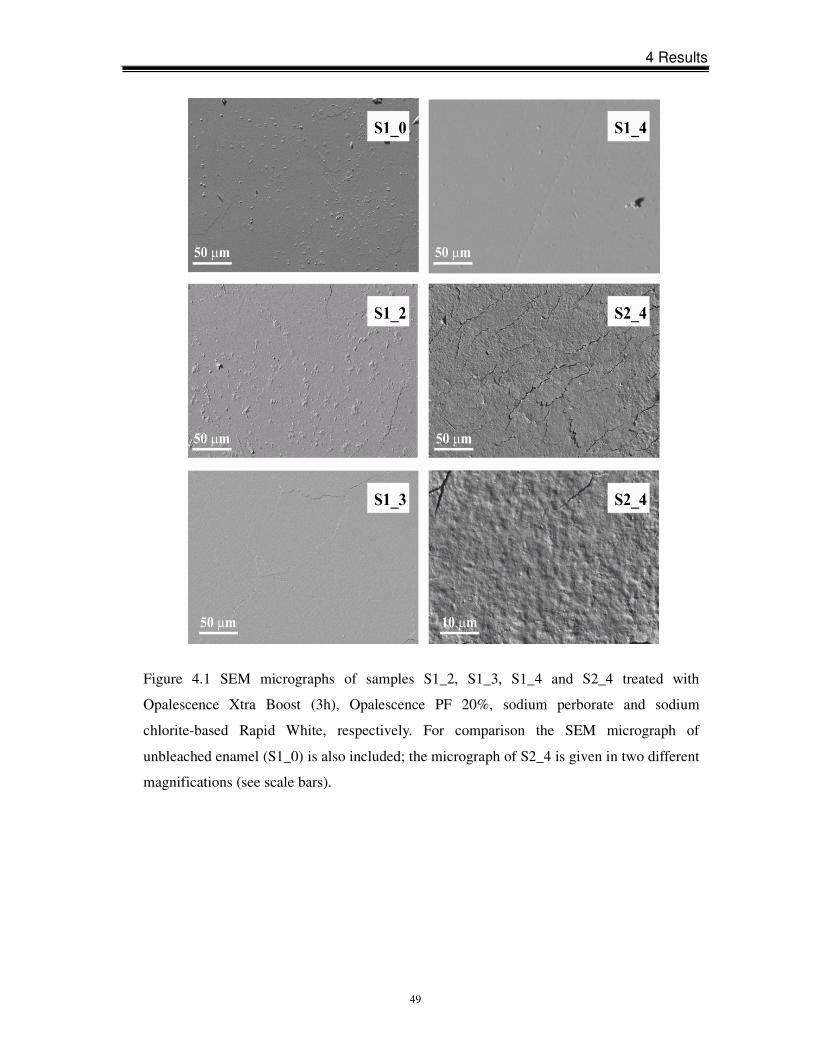
4 Results
49
Figure 4.1 SEM micrographs of samples S1_2, S1_3, S1_4 and S2_4 treated with
Opalescence Xtra Boost (3h), Opalescence PF 20%, sodium perborate and sodium
chlorite-based Rapid White, respectively. For comparison the SEM micrograph of
unbleached enamel (S1_0) is also included; the micrograph of S2_4 is given in two different
magnifications (see scale bars).
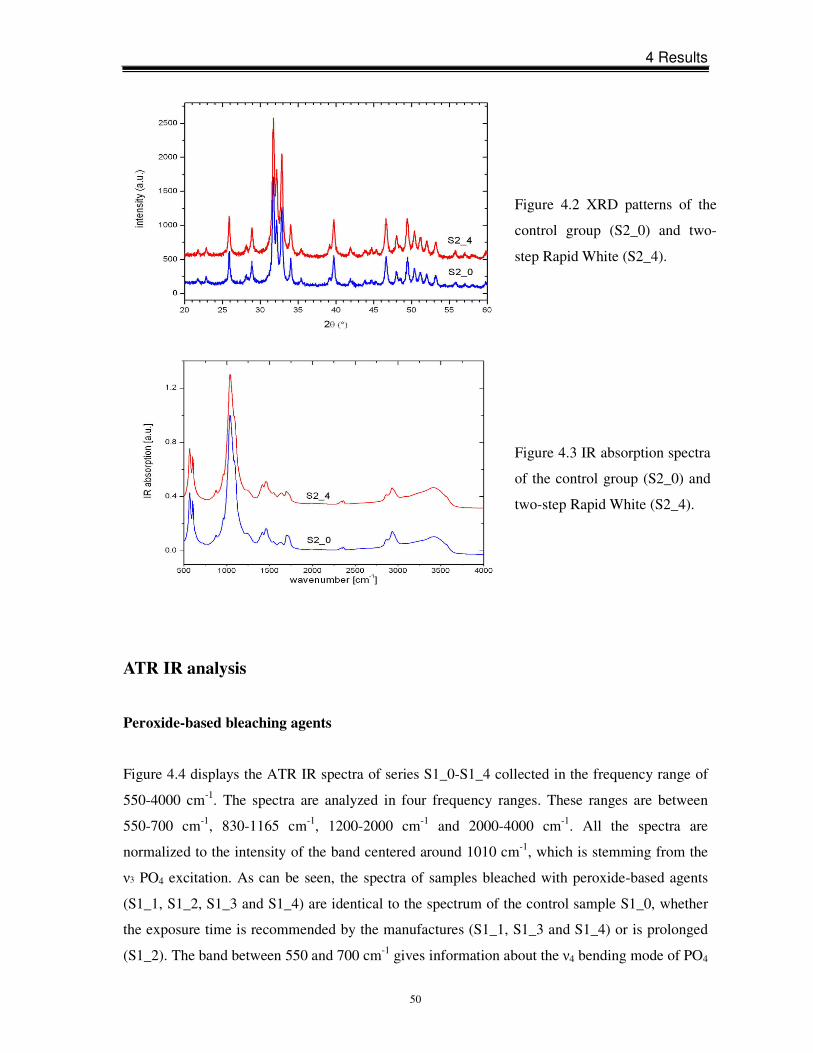
4 Results
50
ATR IR analysis
Peroxide-based bleaching agents
Figure 4.4 displays the ATR IR spectra of series S1_0-S1_4 collected in the frequency range of
550-4000 cm-1. The spectra are analyzed in four frequency ranges. These ranges are between
550-700 cm-1, 830-1165 cm-1, 1200-2000 cm-1 and 2000-4000 cm-1. All the spectra are
normalized to the intensity of the band centered around 1010 cm-1, which is stemming from the
ν3 PO4 excitation. As can be seen, the spectra of samples bleached with peroxide-based agents
(S1_1, S1_2, S1_3 and S1_4) are identical to the spectrum of the control sample S1_0, whether
the exposure time is recommended by the manufactures (S1_1, S1_3 and S1_4) or is prolonged
(S1_2). The band between 550 and 700 cm-1 gives information about the ν4 bending mode of PO4
Figure 4.3 IR absorption spectra
of the control group (S2_0) and
two-step Rapid White (S2_4).
Figure 4.2 XRD patterns of the
control group (S2_0) and two-
step Rapid White (S2_4).
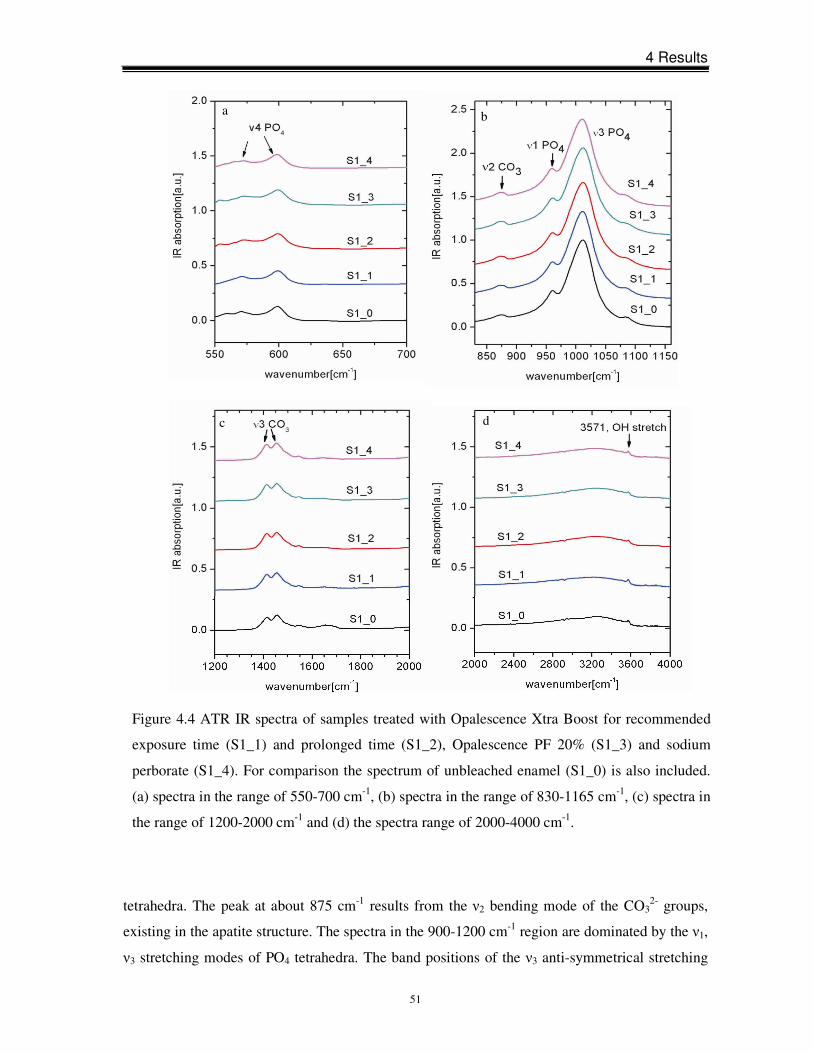
4 Results
51
tetrahedra. The peak at about 875 cm-1 results from the ν2 bending mode of the CO32- groups,
existing in the apatite structure. The spectra in the 900-1200 cm-1 region are dominated by the ν1,
ν3 stretching modes of PO4 tetrahedra. The band positions of the ν3 anti-symmetrical stretching
Figure 4.4 ATR IR spectra of samples treated with Opalescence Xtra Boost for recommended
exposure time (S1_1) and prolonged time (S1_2), Opalescence PF 20% (S1_3) and sodium
perborate (S1_4). For comparison the spectrum of unbleached enamel (S1_0) is also included.
(a) spectra in the range of 550-700 cm-1, (b) spectra in the range of 830-1165 cm-1, (c) spectra in
the range of 1200-2000 cm-1 and (d) the spectra range of 2000-4000 cm-1.
b
d
a
c
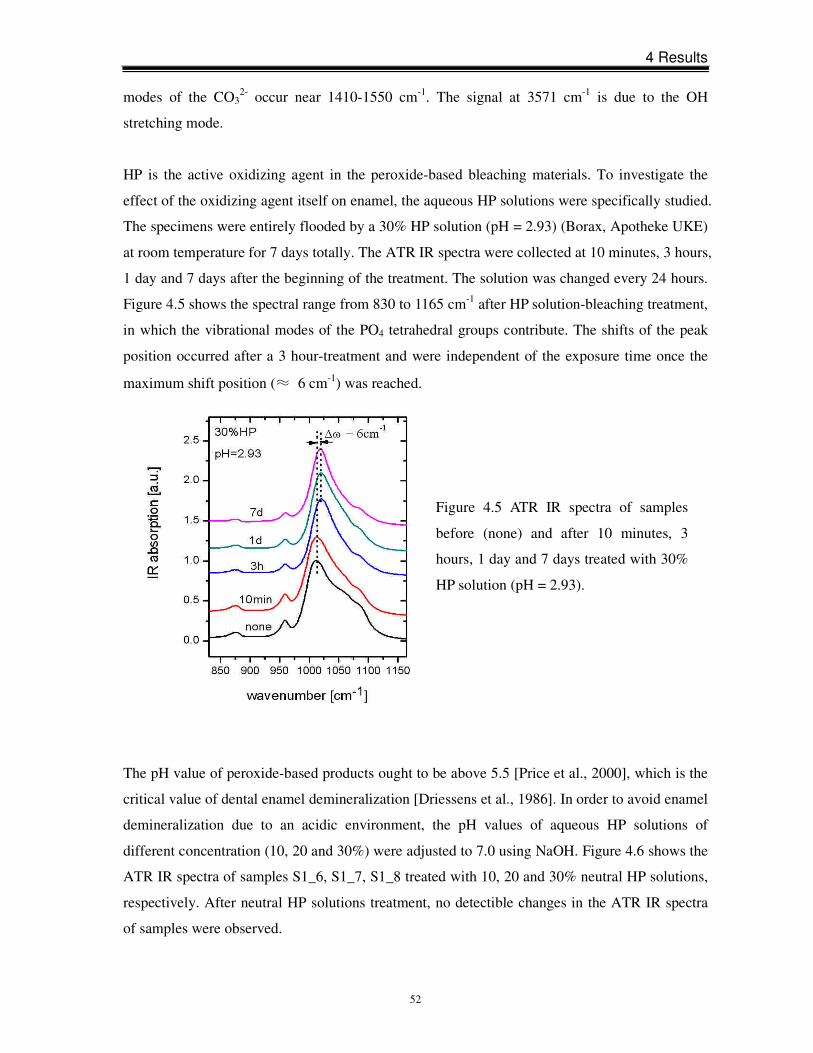
4 Results
52
modes of the CO32- occur near 1410-1550 cm-1. The signal at 3571 cm-1 is due to the OH
stretching mode.
HP is the active oxidizing agent in the peroxide-based bleaching materials. To investigate the
effect of the oxidizing agent itself on enamel, the aqueous HP solutions were specifically studied.
The specimens were entirely flooded by a 30% HP solution (pH = 2.93) (Borax, Apotheke UKE)
at room temperature for 7 days totally. The ATR IR spectra were collected at 10 minutes, 3 hours,
1 day and 7 days after the beginning of the treatment. The solution was changed every 24 hours.
Figure 4.5 shows the spectral range from 830 to 1165 cm-1 after HP solution-bleaching treatment,
in which the vibrational modes of the PO4 tetrahedral groups contribute. The shifts of the peak
position occurred after a 3 hour-treatment and were independent of the exposure time once the
maximum shift position (≈ 6 cm-1) was reached.
The pH value of peroxide-based products ought to be above 5.5 [Price et al., 2000], which is the
critical value of dental enamel demineralization [Driessens et al., 1986]. In order to avoid enamel
demineralization due to an acidic environment, the pH values of aqueous HP solutions of
different concentration (10, 20 and 30%) were adjusted to 7.0 using NaOH. Figure 4.6 shows the
ATR IR spectra of samples S1_6, S1_7, S1_8 treated with 10, 20 and 30% neutral HP solutions,
respectively. After neutral HP solutions treatment, no detectible changes in the ATR IR spectra
of samples were observed.
Figure 4.5 ATR IR spectra of samples
before (none) and after 10 minutes, 3
hours, 1 day and 7 days treated with 30%
HP solution (pH = 2.93).
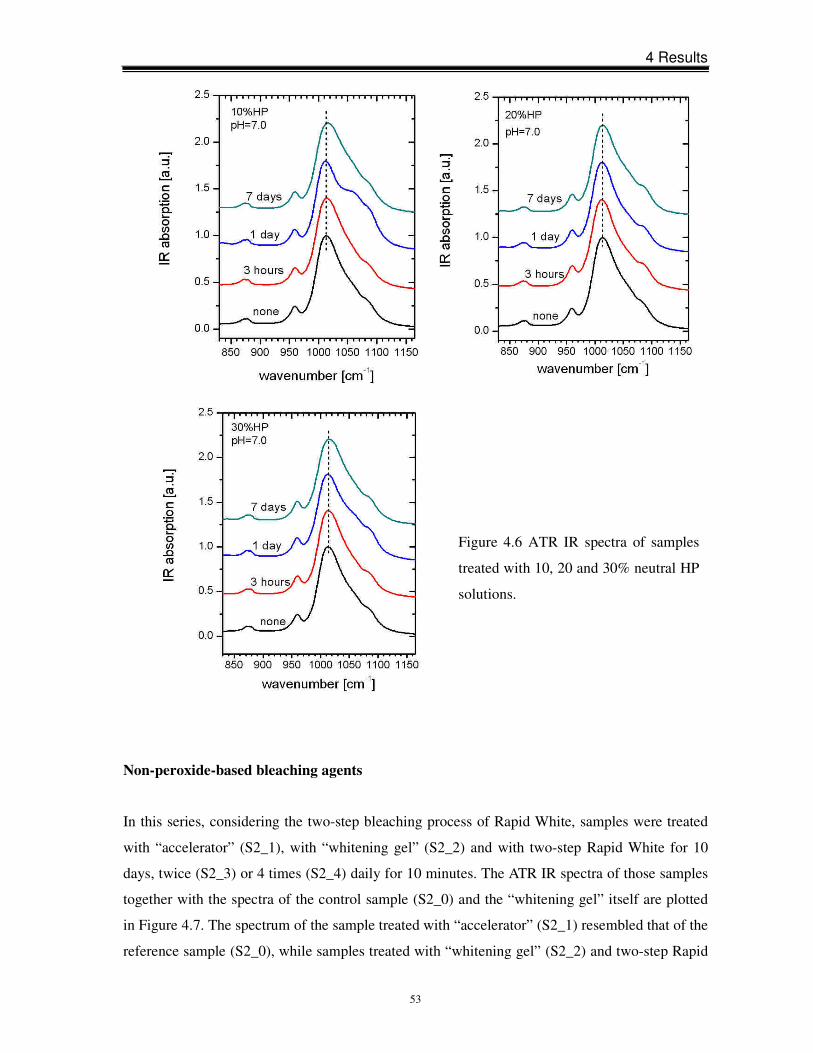
4 Results
53
Non-peroxide-based bleaching agents
In this series, considering the two-step bleaching process of Rapid White, samples were treated
with “accelerator” (S2_1), with “whitening gel” (S2_2) and with two-step Rapid White for 10
days, twice (S2_3) or 4 times (S2_4) daily for 10 minutes. The ATR IR spectra of those samples
together with the spectra of the control sample (S2_0) and the “whitening gel” itself are plotted
in Figure 4.7. The spectrum of the sample treated with “accelerator” (S2_1) resembled that of the
reference sample (S2_0), while samples treated with “whitening gel” (S2_2) and two-step Rapid
Figure 4.6 ATR IR spectra of samples
treated with 10, 20 and 30% neutral HP
solutions.
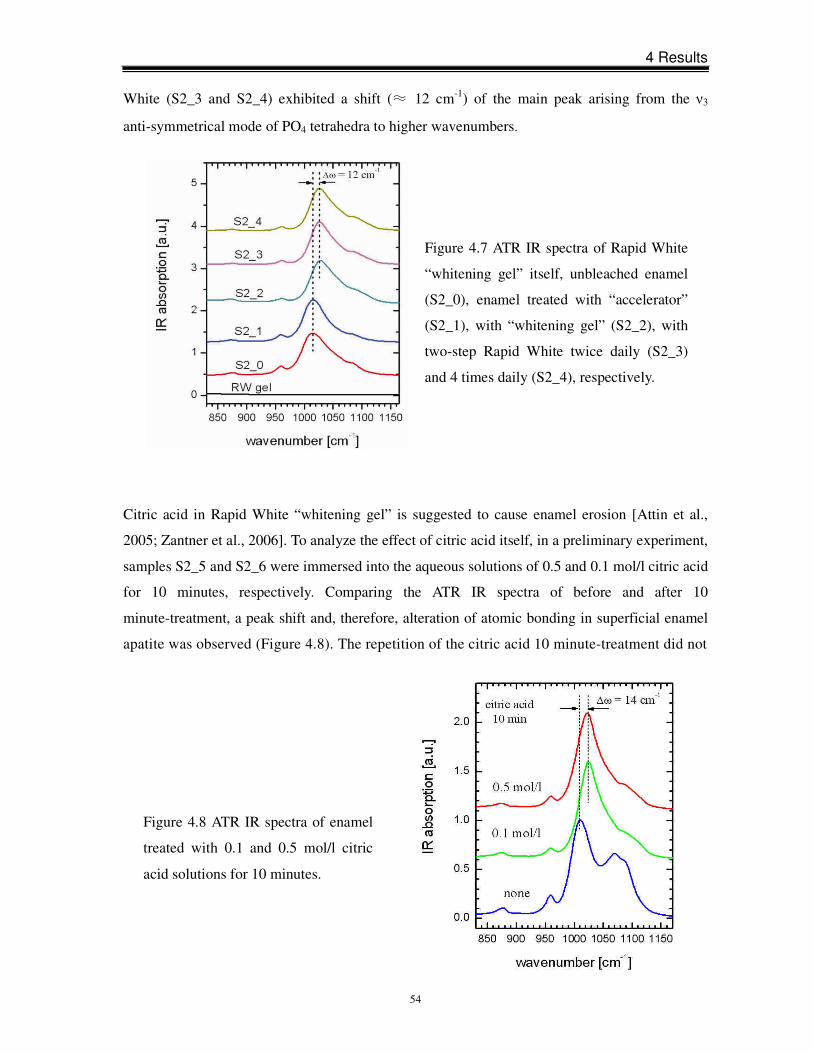
4 Results
54
White (S2_3 and S2_4) exhibited a shift (≈ 12 cm-1) of the main peak arising from the ν3
anti-symmetrical mode of PO4 tetrahedra to higher wavenumbers.
Citric acid in Rapid White “whitening gel” is suggested to cause enamel erosion [Attin et al.,
2005; Zantner et al., 2006]. To analyze the effect of citric acid itself, in a preliminary experiment,
samples S2_5 and S2_6 were immersed into the aqueous solutions of 0.5 and 0.1 mol/l citric acid
for 10 minutes, respectively. Comparing the ATR IR spectra of before and after 10
minute-treatment, a peak shift and, therefore, alteration of atomic bonding in superficial enamel
apatite was observed (Figure 4.8). The repetition of the citric acid 10 minute-treatment did not
Figure 4.7 ATR IR spectra of Rapid White
“whitening gel” itself, unbleached enamel
(S2_0), enamel treated with “accelerator”
(S2_1), with “whitening gel” (S2_2), with
two-step Rapid White twice daily (S2_3)
and 4 times daily (S2_4), respectively.
Figure 4.8 ATR IR spectra of enamel
treated with 0.1 and 0.5 mol/l citric
acid solutions for 10 minutes.
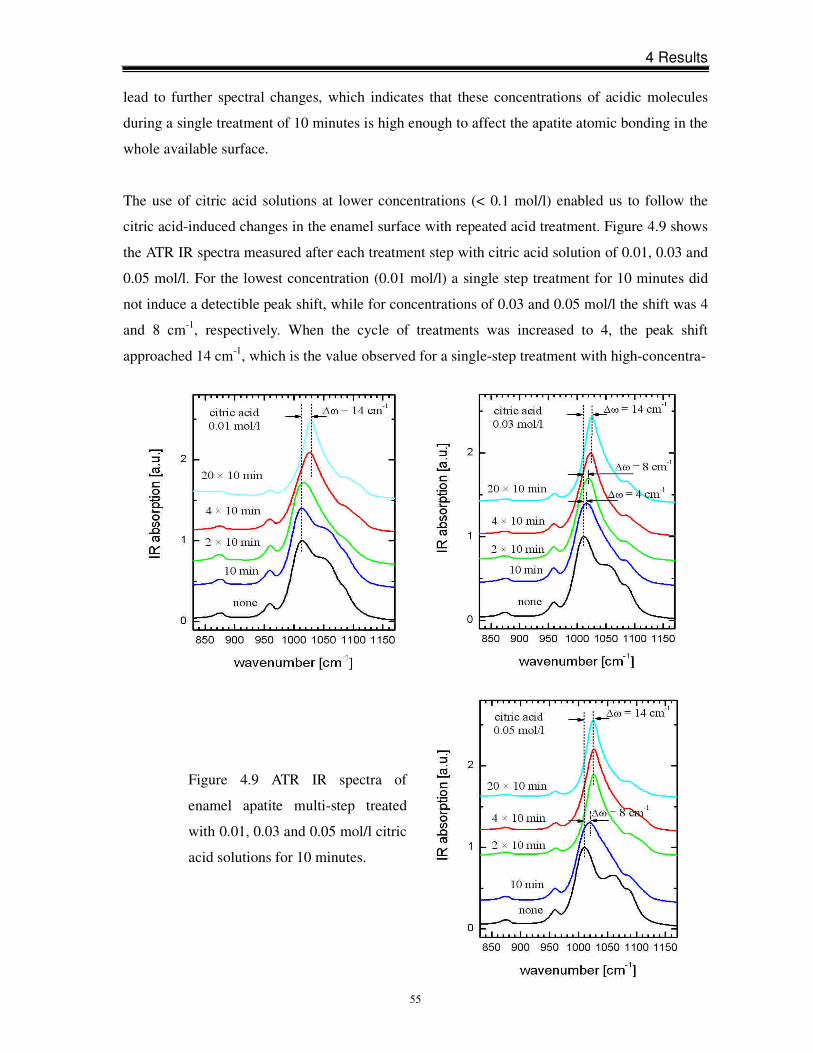
4 Results
55
lead to further spectral changes, which indicates that these concentrations of acidic molecules
during a single treatment of 10 minutes is high enough to affect the apatite atomic bonding in the
whole available surface.
The use of citric acid solutions at lower concentrations (< 0.1 mol/l) enabled us to follow the
citric acid-induced changes in the enamel surface with repeated acid treatment. Figure 4.9 shows
the ATR IR spectra measured after each treatment step with citric acid solution of 0.01, 0.03 and
0.05 mol/l. For the lowest concentration (0.01 mol/l) a single step treatment for 10 minutes did
not induce a detectible peak shift, while for concentrations of 0.03 and 0.05 mol/l the shift was 4
and 8 cm-1, respectively. When the cycle of treatments was increased to 4, the peak shift
approached 14 cm-1, which is the value observed for a single-step treatment with high-concentra-
Figure 4.9 ATR IR spectra of
enamel apatite multi-step treated
with 0.01, 0.03 and 0.05 mol/l citric
acid solutions for 10 minutes.
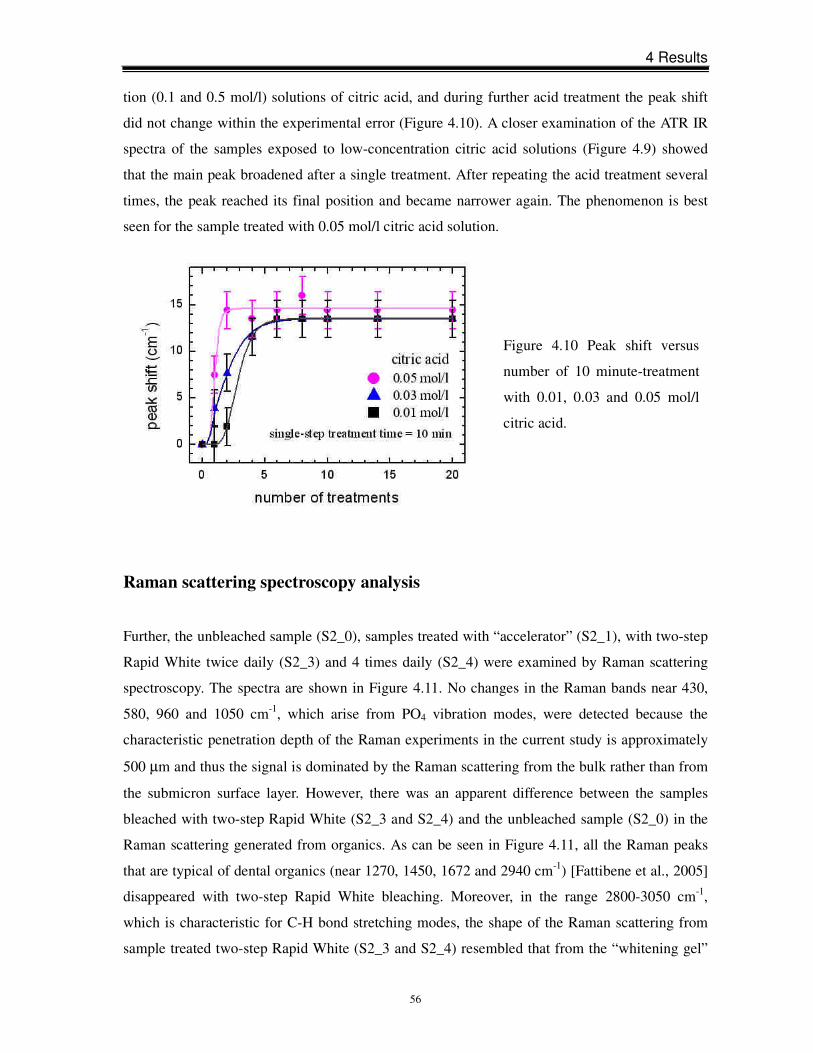
4 Results
56
Figure 4.10 Peak shift versus
number of 10 minute-treatment
with 0.01, 0.03 and 0.05 mol/l
citric acid.
tion (0.1 and 0.5 mol/l) solutions of citric acid, and during further acid treatment the peak shift
did not change within the experimental error (Figure 4.10). A closer examination of the ATR IR
spectra of the samples exposed to low-concentration citric acid solutions (Figure 4.9) showed
that the main peak broadened after a single treatment. After repeating the acid treatment several
times, the peak reached its final position and became narrower again. The phenomenon is best
seen for the sample treated with 0.05 mol/l citric acid solution.
Raman scattering spectroscopy analysis
Further, the unbleached sample (S2_0), samples treated with “accelerator” (S2_1), with two-step
Rapid White twice daily (S2_3) and 4 times daily (S2_4) were examined by Raman scattering
spectroscopy. The spectra are shown in Figure 4.11. No changes in the Raman bands near 430,
580, 960 and 1050 cm-1, which arise from PO4 vibration modes, were detected because the
characteristic penetration depth of the Raman experiments in the current study is approximately
500 µm and thus the signal is dominated by the Raman scattering from the bulk rather than from
the submicron surface layer. However, there was an apparent difference between the samples
bleached with two-step Rapid White (S2_3 and S2_4) and the unbleached sample (S2_0) in the
Raman scattering generated from organics. As can be seen in Figure 4.11, all the Raman peaks
that are typical of dental organics (near 1270, 1450, 1672 and 2940 cm-1) [Fattibene et al., 2005]
disappeared with two-step Rapid White bleaching. Moreover, in the range 2800-3050 cm-1,
which is characteristic for C-H bond stretching modes, the shape of the Raman scattering from
sample treated two-step Rapid White (S2_3 and S2_4) resembled that from the “whitening gel”
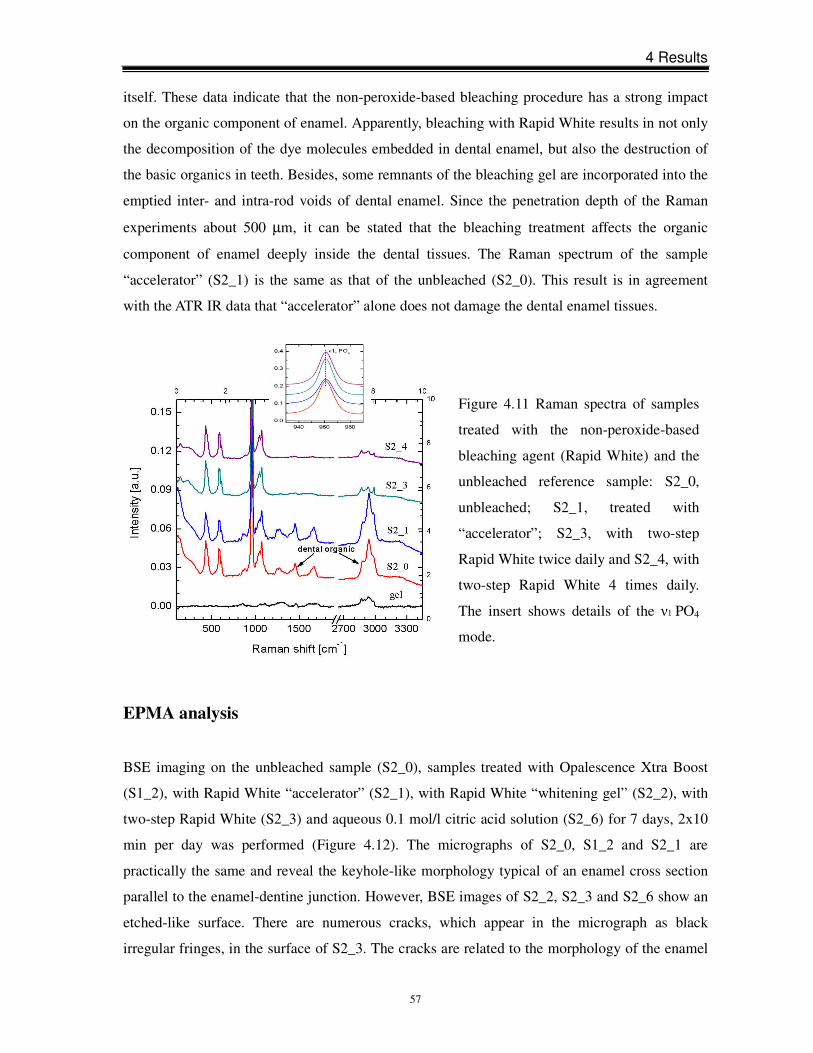
4 Results
57
Figure 4.11 Raman spectra of samples
treated with the non-peroxide-based
bleaching agent (Rapid White) and the
unbleached reference sample: S2_0,
unbleached; S2_1, treated with
“accelerator”; S2_3, with two-step
Rapid White twice daily and S2_4, with
two-step Rapid White 4 times daily.
The insert shows details of the ν1 PO4
mode.
itself. These data indicate that the non-peroxide-based bleaching procedure has a strong impact
on the organic component of enamel. Apparently, bleaching with Rapid White results in not only
the decomposition of the dye molecules embedded in dental enamel, but also the destruction of
the basic organics in teeth. Besides, some remnants of the bleaching gel are incorporated into the
emptied inter- and intra-rod voids of dental enamel. Since the penetration depth of the Raman
experiments about 500 µm, it can be stated that the bleaching treatment affects the organic
component of enamel deeply inside the dental tissues. The Raman spectrum of the sample
“accelerator” (S2_1) is the same as that of the unbleached (S2_0). This result is in agreement
with the ATR IR data that “accelerator” alone does not damage the dental enamel tissues.
EPMA analysis
BSE imaging on the unbleached sample (S2_0), samples treated with Opalescence Xtra Boost
(S1_2), with Rapid White “accelerator” (S2_1), with Rapid White “whitening gel” (S2_2), with
two-step Rapid White (S2_3) and aqueous 0.1 mol/l citric acid solution (S2_6) for 7 days, 2x10
min per day was performed (Figure 4.12). The micrographs of S2_0, S1_2 and S2_1 are
practically the same and reveal the keyhole-like morphology typical of an enamel cross section
parallel to the enamel-dentine junction. However, BSE images of S2_2, S2_3 and S2_6 show an
etched-like surface. There are numerous cracks, which appear in the micrograph as black
irregular fringes, in the surface of S2_3. The cracks are related to the morphology of the enamel
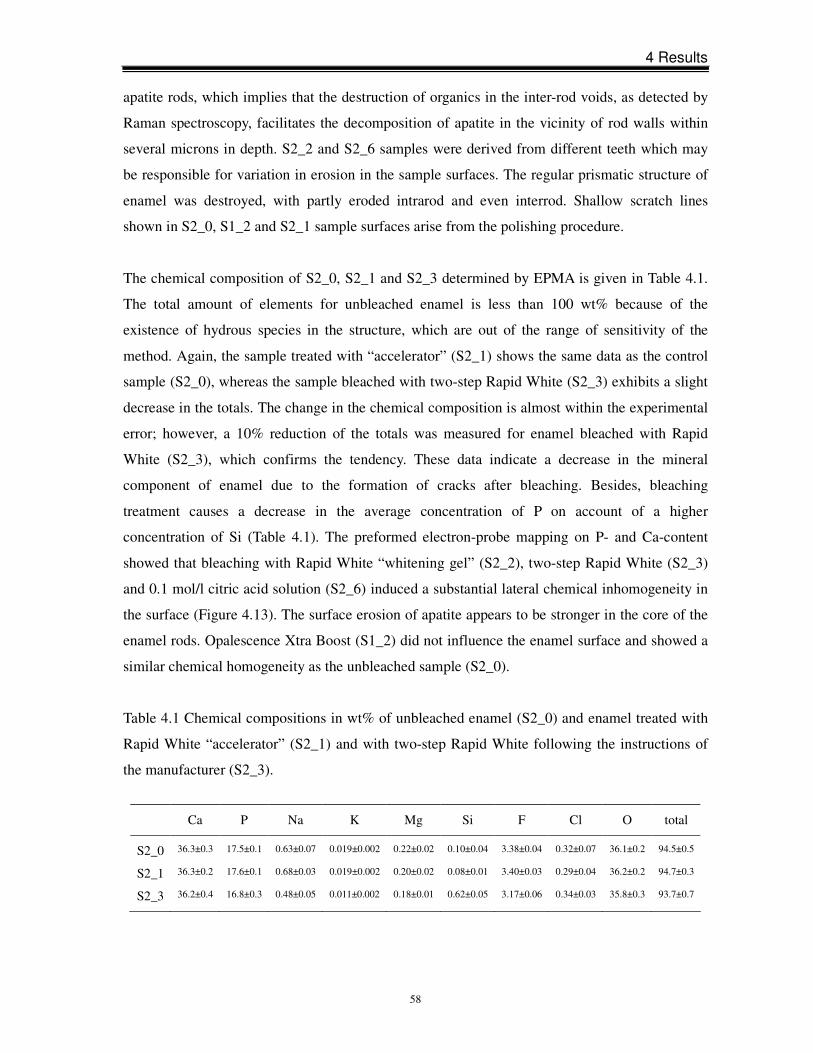
4 Results
58
apatite rods, which implies that the destruction of organics in the inter-rod voids, as detected by
Raman spectroscopy, facilitates the decomposition of apatite in the vicinity of rod walls within
several microns in depth. S2_2 and S2_6 samples were derived from different teeth which may
be responsible for variation in erosion in the sample surfaces. The regular prismatic structure of
enamel was destroyed, with partly eroded intrarod and even interrod. Shallow scratch lines
shown in S2_0, S1_2 and S2_1 sample surfaces arise from the polishing procedure.
The chemical composition of S2_0, S2_1 and S2_3 determined by EPMA is given in Table 4.1.
The total amount of elements for unbleached enamel is less than 100 wt% because of the
existence of hydrous species in the structure, which are out of the range of sensitivity of the
method. Again, the sample treated with “accelerator” (S2_1) shows the same data as the control
sample (S2_0), whereas the sample bleached with two-step Rapid White (S2_3) exhibits a slight
decrease in the totals. The change in the chemical composition is almost within the experimental
error; however, a 10% reduction of the totals was measured for enamel bleached with Rapid
White (S2_3), which confirms the tendency. These data indicate a decrease in the mineral
component of enamel due to the formation of cracks after bleaching. Besides, bleaching
treatment causes a decrease in the average concentration of P on account of a higher
concentration of Si (Table 4.1). The preformed electron-probe mapping on P- and Ca-content
showed that bleaching with Rapid White “whitening gel” (S2_2), two-step Rapid White (S2_3)
and 0.1 mol/l citric acid solution (S2_6) induced a substantial lateral chemical inhomogeneity in
the surface (Figure 4.13). The surface erosion of apatite appears to be stronger in the core of the
enamel rods. Opalescence Xtra Boost (S1_2) did not influence the enamel surface and showed a
similar chemical homogeneity as the unbleached sample (S2_0).
Table 4.1 Chemical compositions in wt% of unbleached enamel (S2_0) and enamel treated with
Rapid White “accelerator” (S2_1) and with two-step Rapid White following the instructions of
the manufacturer (S2_3).
Ca P Na K Mg Si F Cl O total
S2_0 36.3±0.3 17.5±0.1 0.63±0.07 0.019±0.002 0.22±0.02 0.10±0.04 3.38±0.04 0.32±0.07 36.1±0.2 94.5±0.5
S2_1 36.3±0.2 17.6±0.1 0.68±0.03 0.019±0.002 0.20±0.02 0.08±0.01 3.40±0.03 0.29±0.04 36.2±0.2 94.7±0.3
S2_3 36.2±0.4 16.8±0.3 0.48±0.05 0.011±0.002 0.18±0.01 0.62±0.05 3.17±0.06 0.34±0.03 35.8±0.3 93.7±0.7
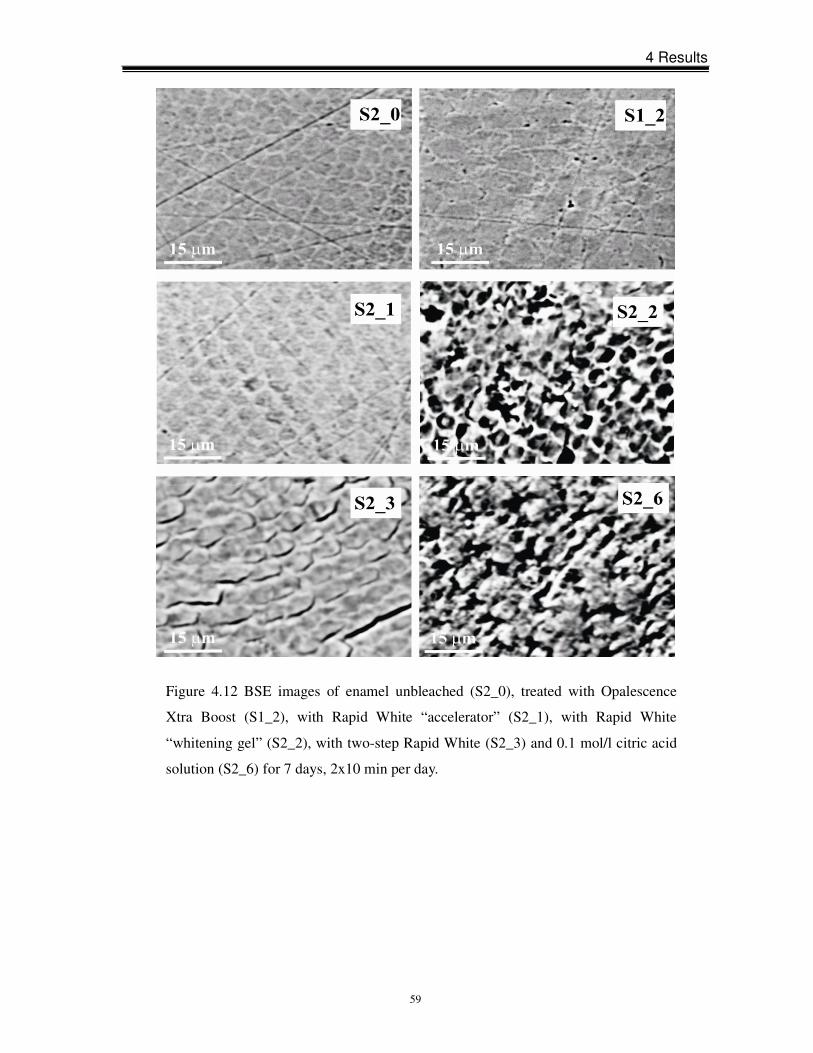
4 Results
59
Figure 4.12 BSE images of enamel unbleached (S2_0), treated with Opalescence
Xtra Boost (S1_2), with Rapid White “accelerator” (S2_1), with Rapid White
“whitening gel” (S2_2), with two-step Rapid White (S2_3) and 0.1 mol/l citric acid
solution (S2_6) for 7 days, 2x10 min per day.
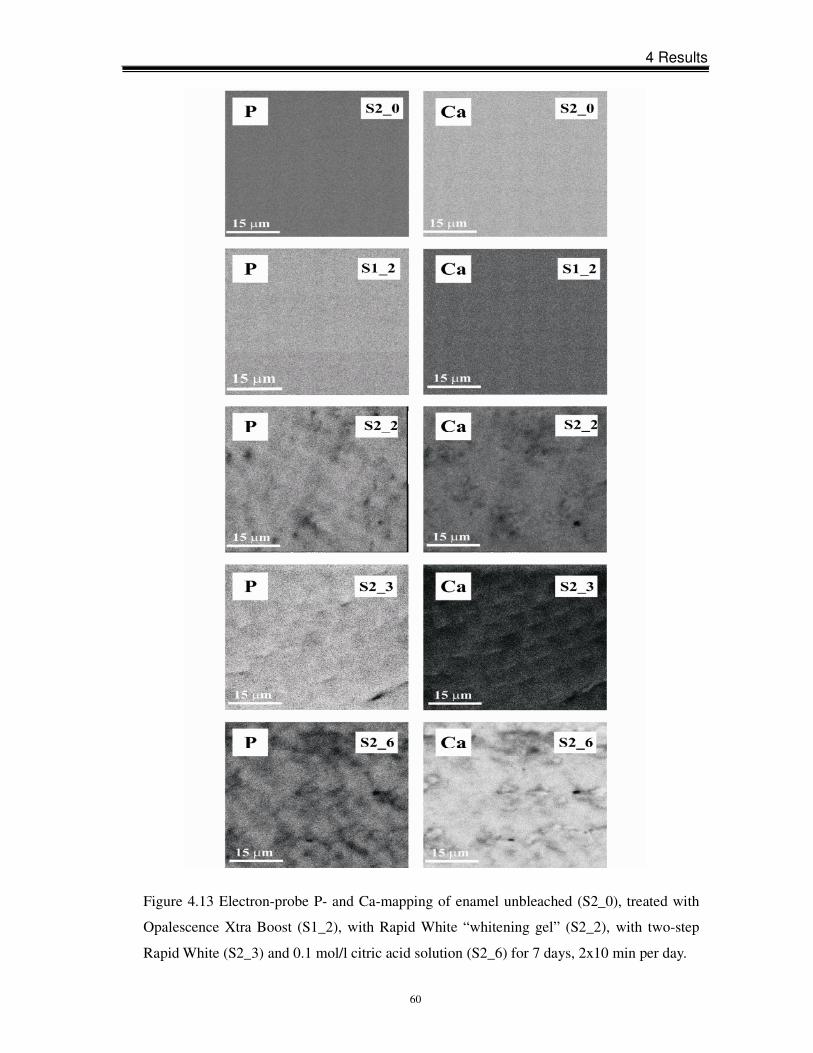
4 Results
60
Figure 4.13 Electron-probe P- and Ca-mapping of enamel unbleached (S2_0), treated with
Opalescence Xtra Boost (S1_2), with Rapid White “whitening gel” (S2_2), with two-step
Rapid White (S2_3) and 0.1 mol/l citric acid solution (S2_6) for 7 days, 2x10 min per day.
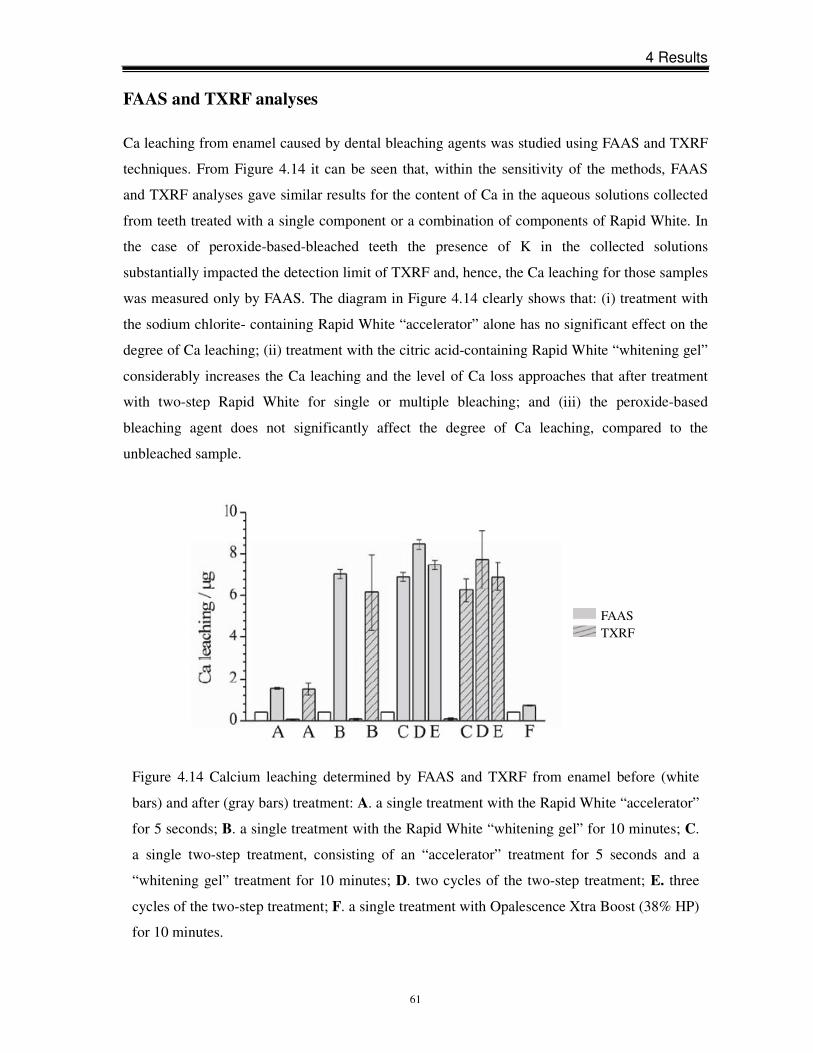
4 Results
61
FAAS and TXRF analyses
Ca leaching from enamel caused by dental bleaching agents was studied using FAAS and TXRF
techniques. From Figure 4.14 it can be seen that, within the sensitivity of the methods, FAAS
and TXRF analyses gave similar results for the content of Ca in the aqueous solutions collected
from teeth treated with a single component or a combination of components of Rapid White. In
the case of peroxide-based-bleached teeth the presence of K in the collected solutions
substantially impacted the detection limit of TXRF and, hence, the Ca leaching for those samples
was measured only by FAAS. The diagram in Figure 4.14 clearly shows that: (i) treatment with
the sodium chlorite- containing Rapid White “accelerator” alone has no significant effect on the
degree of Ca leaching; (ii) treatment with the citric acid-containing Rapid White “whitening gel”
considerably increases the Ca leaching and the level of Ca loss approaches that after treatment
with two-step Rapid White for single or multiple bleaching; and (iii) the peroxide-based
bleaching agent does not significantly affect the degree of Ca leaching, compared to the
unbleached sample.
Figure 4.14 Calcium leaching determined by FAAS and TXRF from enamel before (white
bars) and after (gray bars) treatment: A. a single treatment with the Rapid White “accelerator”
for 5 seconds; B. a single treatment with the Rapid White “whitening gel” for 10 minutes; C.
a single two-step treatment, consisting of an “accelerator” treatment for 5 seconds and a
“whitening gel” treatment for 10 minutes; D. two cycles of the two-step treatment; E. three
cycles of the two-step treatment; F. a single treatment with Opalescence Xtra Boost (38% HP)
for 10 minutes.
FAAS TXRF
4 Results
62
4.2 Effects of sodium fluoride treatment on enamel
Enamel erosion-reversing effect
Figure 4.15 displays the ATR IR spectra of enamel samples of Series 1, in which at each step the
treatment with 0.1mol/l citric acid was followed by a treatment with an aqueous NaF solution
with concentrations of 0.5, 1.0 and 2.0%. The results clearly show that fluoride treatment has no
effect on the altered structure of enamel. After a single treatment for 10 minutes with 0.1 mol/l
citric acid solution the peak shifted to higher wavenumbers by approximately 10 cm-1 and
remained at the same position after subsequent immersion in NaF solutions, regardless of the
concentration. Besides, the fluoride treatment did not reverse or diminish the peak shift during
further treatment with citric acid and after a multi-step treatment the peak shift approached a
maximum value. Even prolonged, 48 hour-immersion of the acid-affected enamel samples in
NaF solutions did not reverse any changes in the ATR IR spectra.
Enamel erosion-preventing effect
Experiments with enamel samples firstly treated with NaF solution and then with 0.1 mol/l
citric acid solution (Series 2) confirm that a single 10 minute-treatment with fluoride solutions
does not prevent the enamel apatite structure from citric acid-induced alteration. As can be
seen in Figure 4.16, a previous immersion in NaF solution did not suppress the peak shift
induced by citric acid treatment, i.e. did not protect enamel apatite against destruction by citric
acid. The ATR IR spectra of enamel firstly immersed in NaF solutions for 60 hours and then
exposed to 0.1 mol/l citric acid solution for 10 minutes are shown in Figure 4.17. It is apparent
that a complete alteration of the apatite structure occurred after a single 10 minute-treatment of
citric acid, exactly as in the case of a direct exposure to citric acid without any pretreatment
(Figure 4.8). Therefore, the resistance of enamel apatite to acid erosion was not improved even
after a prolonged (60 hours) pretreatment with NaF.
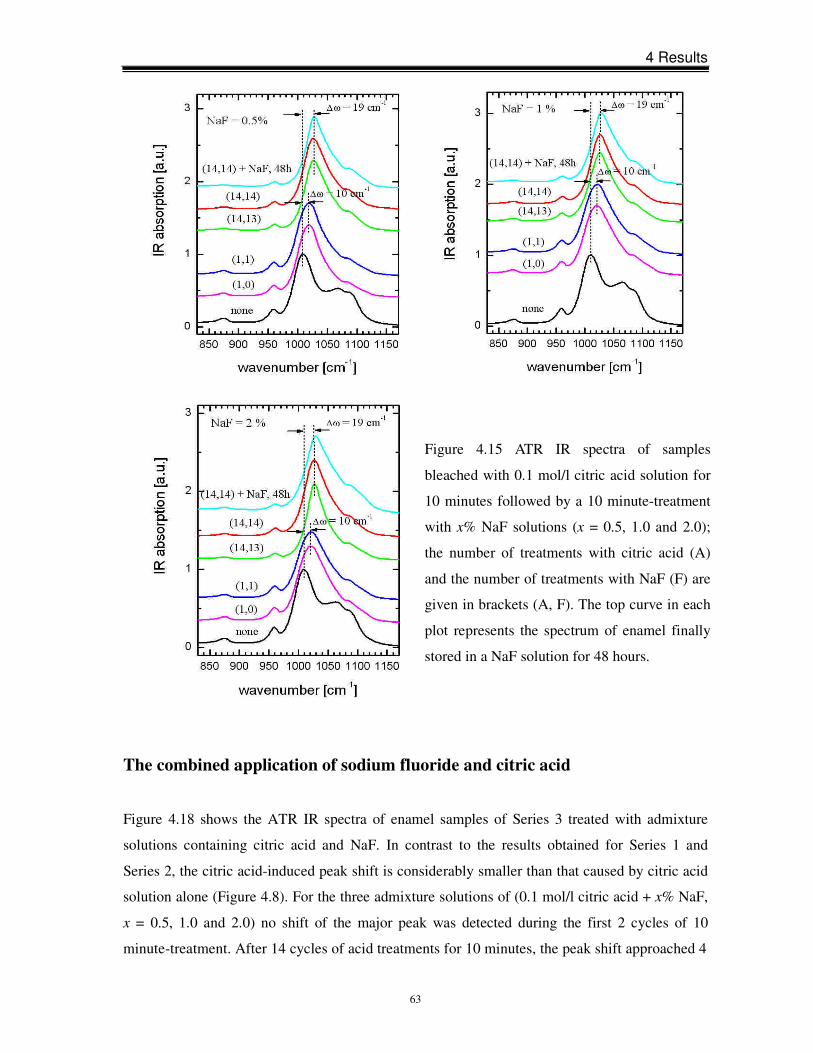
4 Results
63
The combined application of sodium fluoride and citric acid
Figure 4.18 shows the ATR IR spectra of enamel samples of Series 3 treated with admixture
solutions containing citric acid and NaF. In contrast to the results obtained for Series 1 and
Series 2, the citric acid-induced peak shift is considerably smaller than that caused by citric acid
solution alone (Figure 4.8). For the three admixture solutions of (0.1 mol/l citric acid + x% NaF,
x = 0.5, 1.0 and 2.0) no shift of the major peak was detected during the first 2 cycles of 10
minute-treatment. After 14 cycles of acid treatments for 10 minutes, the peak shift approached 4
Figure 4.15 ATR IR spectra of samples
bleached with 0.1 mol/l citric acid solution for
10 minutes followed by a 10 minute-treatment
with x% NaF solutions (x = 0.5, 1.0 and 2.0);
the number of treatments with citric acid (A)
and the number of treatments with NaF (F) are
given in brackets (A, F). The top curve in each
plot represents the spectrum of enamel finally
stored in a NaF solution for 48 hours.
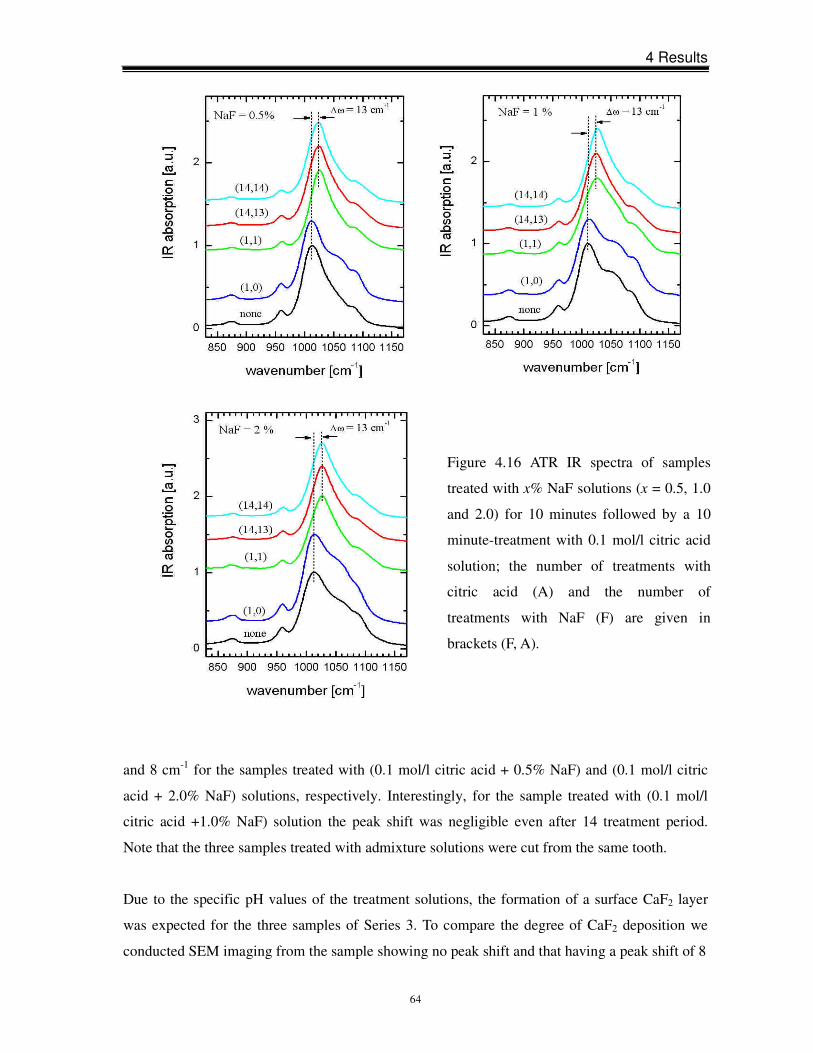
4 Results
64
and 8 cm-1 for the samples treated with (0.1 mol/l citric acid + 0.5% NaF) and (0.1 mol/l citric
acid + 2.0% NaF) solutions, respectively. Interestingly, for the sample treated with (0.1 mol/l
citric acid +1.0% NaF) solution the peak shift was negligible even after 14 treatment period.
Note that the three samples treated with admixture solutions were cut from the same tooth.
Due to the specific pH values of the treatment solutions, the formation of a surface CaF2 layer
was expected for the three samples of Series 3. To compare the degree of CaF2 deposition we
conducted SEM imaging from the sample showing no peak shift and that having a peak shift of 8
Figure 4.16 ATR IR spectra of samples
treated with x% NaF solutions (x = 0.5, 1.0
and 2.0) for 10 minutes followed by a 10
minute-treatment with 0.1 mol/l citric acid
solution; the number of treatments with
citric acid (A) and the number of
treatments with NaF (F) are given in
brackets (F, A).
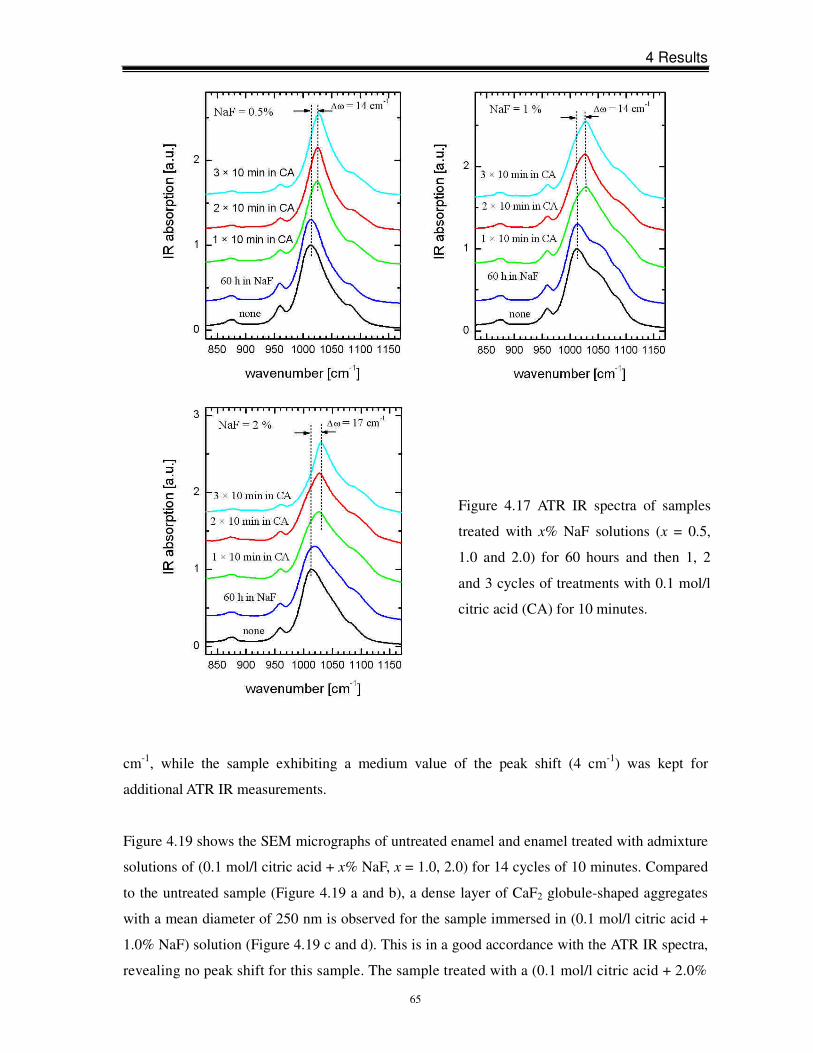
4 Results
65
cm-1, while the sample exhibiting a medium value of the peak shift (4 cm-1) was kept for
additional ATR IR measurements.
Figure 4.19 shows the SEM micrographs of untreated enamel and enamel treated with admixture
solutions of (0.1 mol/l citric acid + x% NaF, x = 1.0, 2.0) for 14 cycles of 10 minutes. Compared
to the untreated sample (Figure 4.19 a and b), a dense layer of CaF2 globule-shaped aggregates
with a mean diameter of 250 nm is observed for the sample immersed in (0.1 mol/l citric acid +
1.0% NaF) solution (Figure 4.19 c and d). This is in a good accordance with the ATR IR spectra,
revealing no peak shift for this sample. The sample treated with a (0.1 mol/l citric acid + 2.0%
Figure 4.17 ATR IR spectra of samples
treated with x% NaF solutions (x = 0.5,
1.0 and 2.0) for 60 hours and then 1, 2
and 3 cycles of treatments with 0.1 mol/l
citric acid (CA) for 10 minutes.
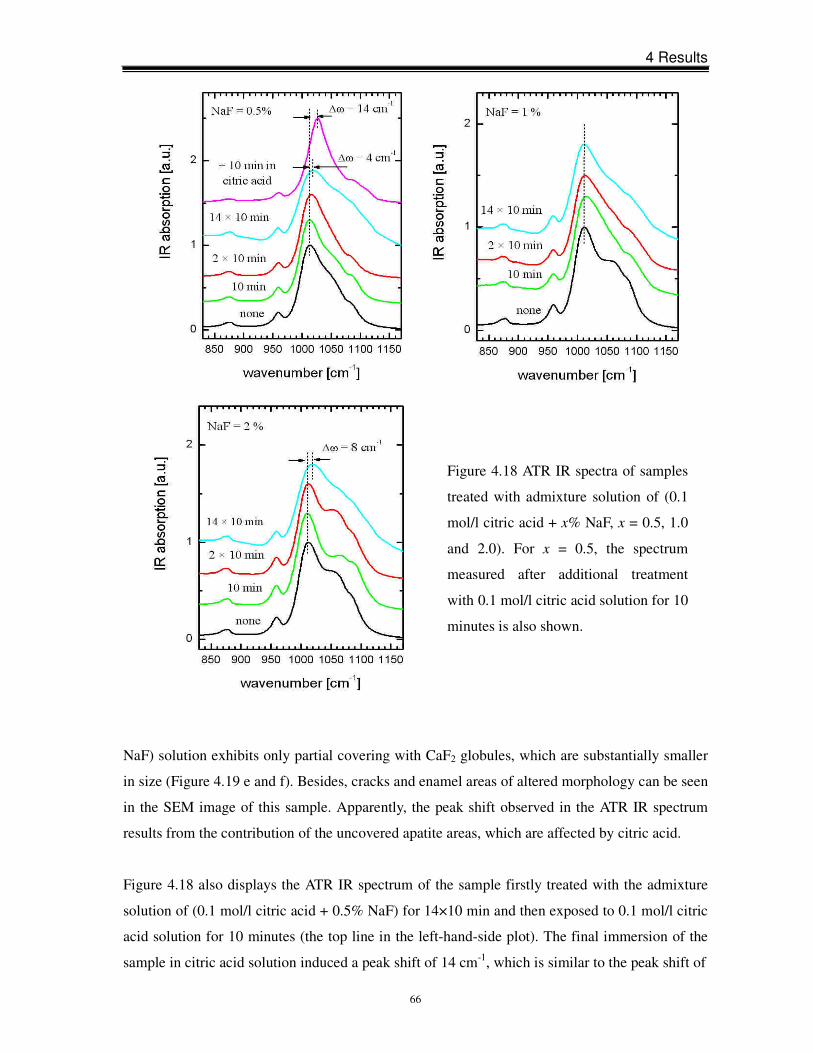
4 Results
66
Figure 4.18 ATR IR spectra of samples
treated with admixture solution of (0.1
mol/l citric acid + x% NaF, x = 0.5, 1.0
and 2.0). For x = 0.5, the spectrum
measured after additional treatment
with 0.1 mol/l citric acid solution for 10
minutes is also shown.
NaF) solution exhibits only partial covering with CaF2 globules, which are substantially smaller
in size (Figure 4.19 e and f). Besides, cracks and enamel areas of altered morphology can be seen
in the SEM image of this sample. Apparently, the peak shift observed in the ATR IR spectrum
results from the contribution of the uncovered apatite areas, which are affected by citric acid.
Figure 4.18 also displays the ATR IR spectrum of the sample firstly treated with the admixture
solution of (0.1 mol/l citric acid + 0.5% NaF) for 14×10 min and then exposed to 0.1 mol/l citric
acid solution for 10 minutes (the top line in the left-hand-side plot). The final immersion of the
sample in citric acid solution induced a peak shift of 14 cm-1, which is similar to the peak shift of
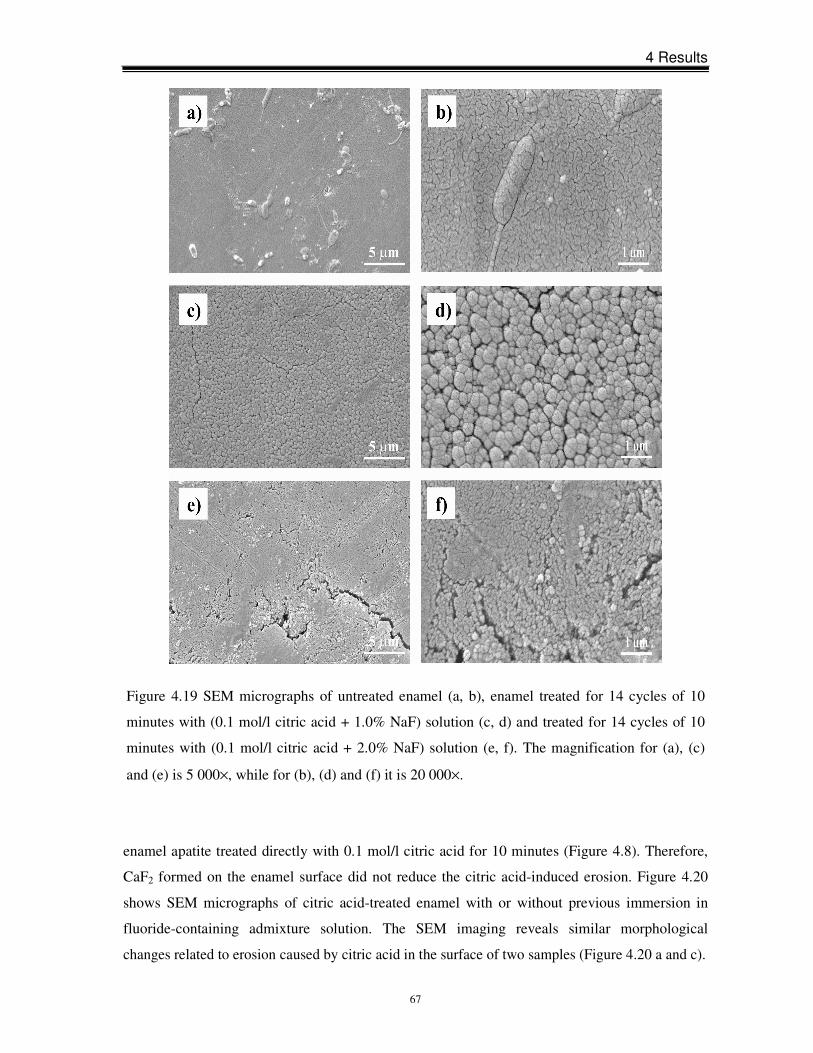
4 Results
67
enamel apatite treated directly with 0.1 mol/l citric acid for 10 minutes (Figure 4.8). Therefore,
CaF2 formed on the enamel surface did not reduce the citric acid-induced erosion. Figure 4.20
shows SEM micrographs of citric acid-treated enamel with or without previous immersion in
fluoride-containing admixture solution. The SEM imaging reveals similar morphological
changes related to erosion caused by citric acid in the surface of two samples (Figure 4.20 a and c).
Figure 4.19 SEM micrographs of untreated enamel (a, b), enamel treated for 14 cycles of 10
minutes with (0.1 mol/l citric acid + 1.0% NaF) solution (c, d) and treated for 14 cycles of 10
minutes with (0.1 mol/l citric acid + 2.0% NaF) solution (e, f). The magnification for (a), (c)
and (e) is 5 000×, while for (b), (d) and (f) it is 20 000×.
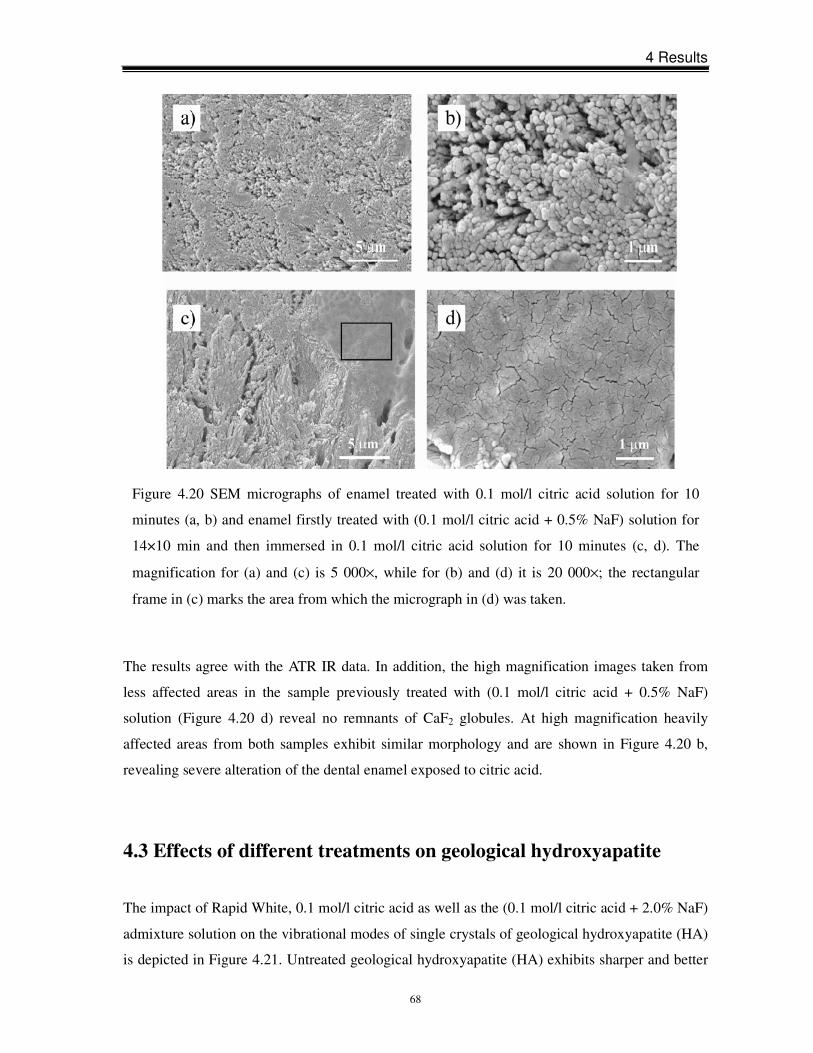
4 Results
68
The results agree with the ATR IR data. In addition, the high magnification images taken from
less affected areas in the sample previously treated with (0.1 mol/l citric acid + 0.5% NaF)
solution (Figure 4.20 d) reveal no remnants of CaF2 globules. At high magnification heavily
affected areas from both samples exhibit similar morphology and are shown in Figure 4.20 b,
revealing severe alteration of the dental enamel exposed to citric acid.
4.3 Effects of different treatments on geological hydroxyapatite
The impact of Rapid White, 0.1 mol/l citric acid as well as the (0.1 mol/l citric acid + 2.0% NaF)
admixture solution on the vibrational modes of single crystals of geological hydroxyapatite (HA)
is depicted in Figure 4.21. Untreated geological hydroxyapatite (HA) exhibits sharper and better
Figure 4.20 SEM micrographs of enamel treated with 0.1 mol/l citric acid solution for 10
minutes (a, b) and enamel firstly treated with (0.1 mol/l citric acid + 0.5% NaF) solution for
14×10 min and then immersed in 0.1 mol/l citric acid solution for 10 minutes (c, d). The
magnification for (a) and (c) is 5 000×, while for (b) and (d) it is 20 000×; the rectangular
frame in (c) marks the area from which the micrograph in (d) was taken.
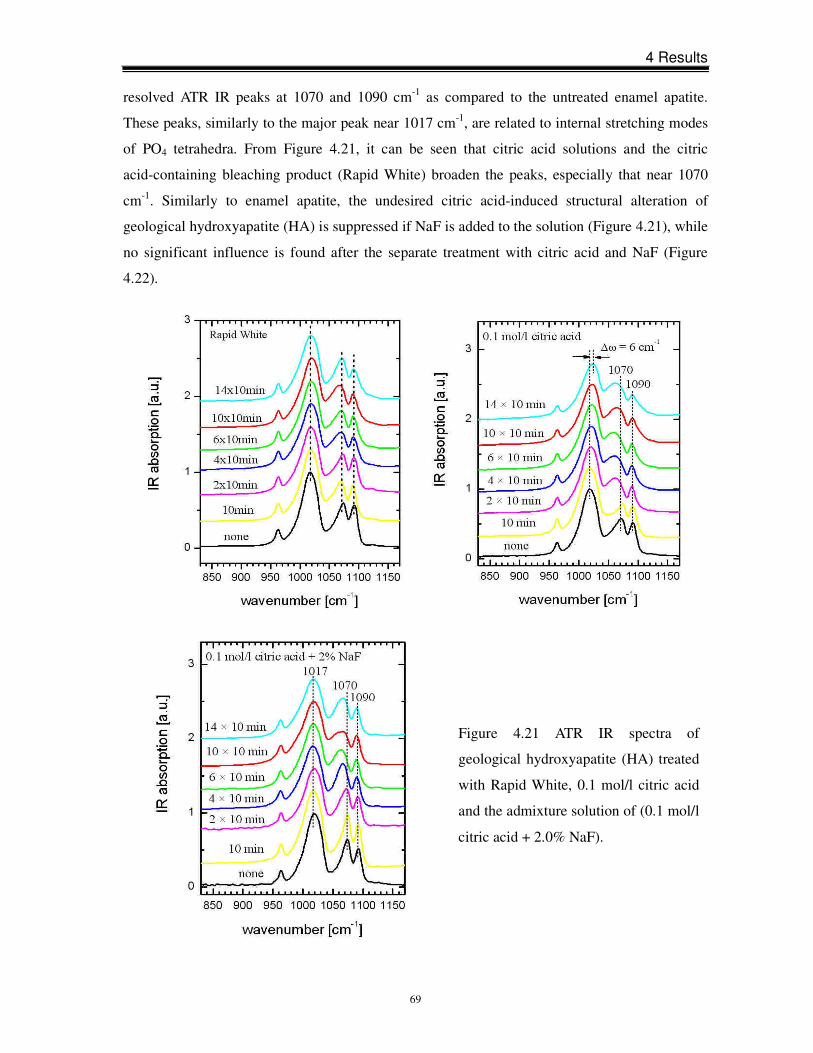
4 Results
69
resolved ATR IR peaks at 1070 and 1090 cm-1 as compared to the untreated enamel apatite.
These peaks, similarly to the major peak near 1017 cm-1, are related to internal stretching modes
of PO4 tetrahedra. From Figure 4.21, it can be seen that citric acid solutions and the citric
acid-containing bleaching product (Rapid White) broaden the peaks, especially that near 1070
cm-1. Similarly to enamel apatite, the undesired citric acid-induced structural alteration of
geological hydroxyapatite (HA) is suppressed if NaF is added to the solution (Figure 4.21), while
no significant influence is found after the separate treatment with citric acid and NaF (Figure
4.22).
Figure 4.21 ATR IR spectra of
geological hydroxyapatite (HA) treated
with Rapid White, 0.1 mol/l citric acid
and the admixture solution of (0.1 mol/l
citric acid + 2.0% NaF).
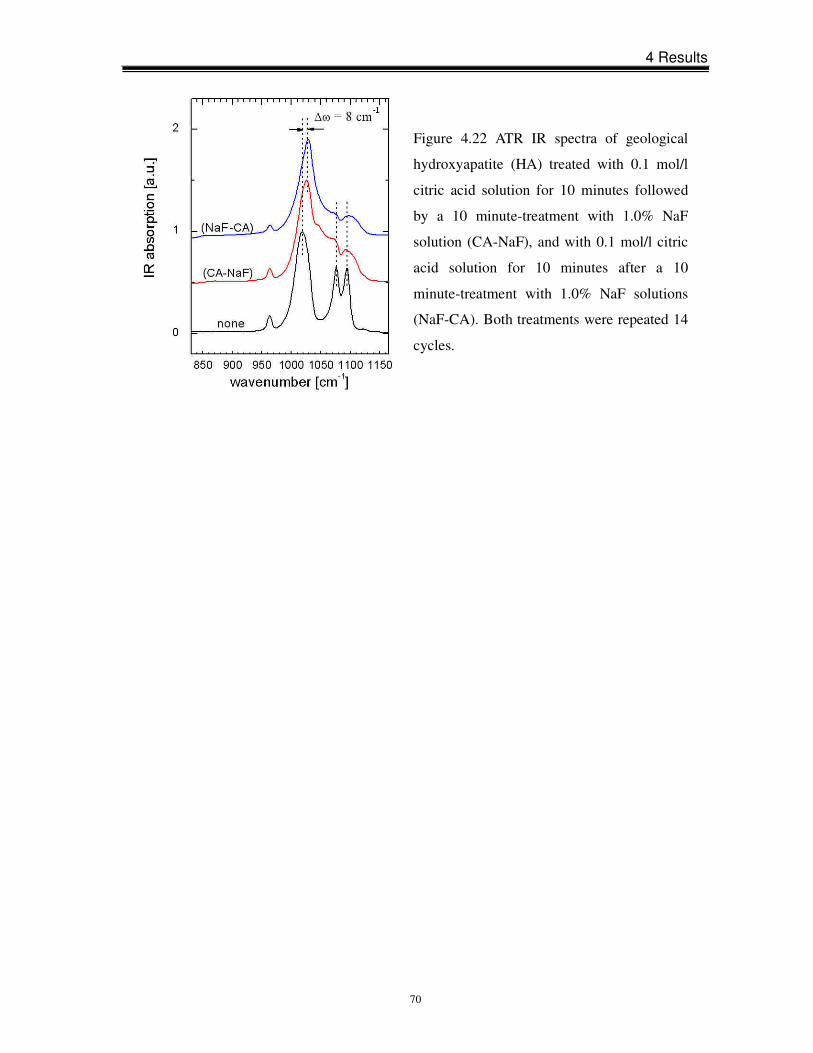
4 Results
70
Figure 4.22 ATR IR spectra of geological
hydroxyapatite (HA) treated with 0.1 mol/l
citric acid solution for 10 minutes followed
by a 10 minute-treatment with 1.0% NaF
solution (CA-NaF), and with 0.1 mol/l citric
acid solution for 10 minutes after a 10
minute-treatment with 1.0% NaF solutions
(NaF-CA). Both treatments were repeated 14
cycles.
5 Discussion
71
5 Discussion
5.1 Effects of peroxide-based bleaching agents on enamel
In the current in vitro study, the effects of peroxide-based agents on enamel were investigated
using three commercial products (Opalescence Xtra Boost, Opalescence PF 20% and sodium
perborate). Results reveal that within the sensitivity of the applied methods none of the
investigated peroxide-based products significantly affected dental enamel.
Opalescence Xtra Boost containing 38% HP is a highly concentrated bleaching product and,
therefore, most likely to cause damage to enamel if dental enamel is indeed susceptible to HP.
However, following bleaching, no significant changes in the enamel surface were observed,
whether surface morphology, crystal structure or chemical composition, even when samples
were exposed to Opalescence Xtra Boost for a long-term treatment period. An increased number
of treatment was applied to simulate conditions for patients receiving prolonged bleaching
treatments, e.g. for tetracycline stains. This corresponds to previous investigations [Monaghan et
al., 1992; Cullen et al., 1993; Basting et al., 2003; Dietschi et al., 2006].
Basic results of this comparative study are in agreement with previous reports [Potocnik et al.,
2000; Cimilli and Pameijer, 2001; Goo et al., 2004; Lee et al., 2006]. On the other hand, studies
have demonstrated that enamel surface is significantly affected by peroxide-based bleaching
products. McGuckin et al. (1992) and Josey et al. (1996) found morphological alteration of the
enamel surface after applying a low and high concentration of HP, respectively. In a study by
Oltu and Gürgan (2000), the impact of 35% CP on the inorganic structure of enamel was verified
using XRD and IR techniques. A decreased Ca concentration and Ca:P ratio in the enamel
surface were also reported [Rotstein et al., 1996; Tezel et al., 2007]. The discrepancy between
different studies may be due to the difference in the samples. Oltu and Gürgan (2000) used
unerupted molars, while Cimilli and Pameijer (2001) selected maxillary bicuspids extracted for
orthodontic reasons. Enamel is a heterogeneous material and it varies in mineral content, amount
of organic matrix and chemical construction [Goldberg et al., 1983]. Variation occurs between
individuals and teeth, and age also changes enamel surface characteristics, permeability and
color [Ten Cate, 1994]. The difficulty to obtain enough background information pertaining to the
tooth origin allows for variation in dental enamel due to age and health conditions. Therefore, it
is difficult to compare the structural changes of enamel samples in different teeth. This study
5 Discussion
72
examined a number of samples and observed slight differences in the ATR IR peak positions, in
the ratio between the organic and apatite Raman peaks as well as in the degree of Ca leaching for
different unbleached tooth samples. Thus, in order to prevent misinterpretation of results, in the
present study special attention was paid to sample preparation and comparison was limited to
samples from the same tooth.
The comparison between the acidic and neutral HP solutions confirms that HP itself does not
affect dental enamel, while low pH values have an enamel erosive potential. In order to ensure
enamel stability, many commercial bleaching systems are kept at low pH values. When the pH
value is lower than 5.5, the critical value of enamel demineralization [Lagerlöf et al., 1983;
Driessens et al., 1986], enamel erosion is expected to take place. Thickening agents are widely
used in commercial products to slow down the release of active bleaching agent. It was observed
in vitro as well as in situ that treatment with carbopol might cause a decrease in the enamel
microhardness [McCracken and Haywood, 1996; Basting et al., 2003]. However, in an in vitro
study by Rodrigues et al. (2007), no significant reduction in the enamel microhardness was
found after enamel samples were treated with 2.0% carbopol and carbowax for 6 hours daily.
This conclusion is supported indirectly by the findings in the present study that thickening agents
have no significant effect on enamel. Additionally, the present investigation did not give
evidence that the presence of urea caused the detrimental effects on dental enamel. The
morphology and crystal structure of samples treated with Opalescence PF 20%, a
urea-containing agent, resembled those treated with bleaching agents which do not release urea.
However, fluoride and KNO3 included into Opalescence PF 20% may be helpful to remineralize
the eroded enamel [Basting et al., 2003]. Thus, additional investigations should be performed to
more thoroughly assess the role of urea in enamel erosion processes.
5.2 Effects of non-peroxide-based bleaching agents on enamel
A variety of experimental techniques used in this study proved that the structure and chemistry of
dental enamel were substantially affected by an “over-the-counter”, sodium chlorite-based
whitening product (Rapid White). Through separate investigation of the single component of
Rapid White, it was revealed that the substance responsible for the bleaching-induced
deterioration of enamel is citric acid-containing “whitening gel” rather than sodium
chlorite-containing “accelerator”.
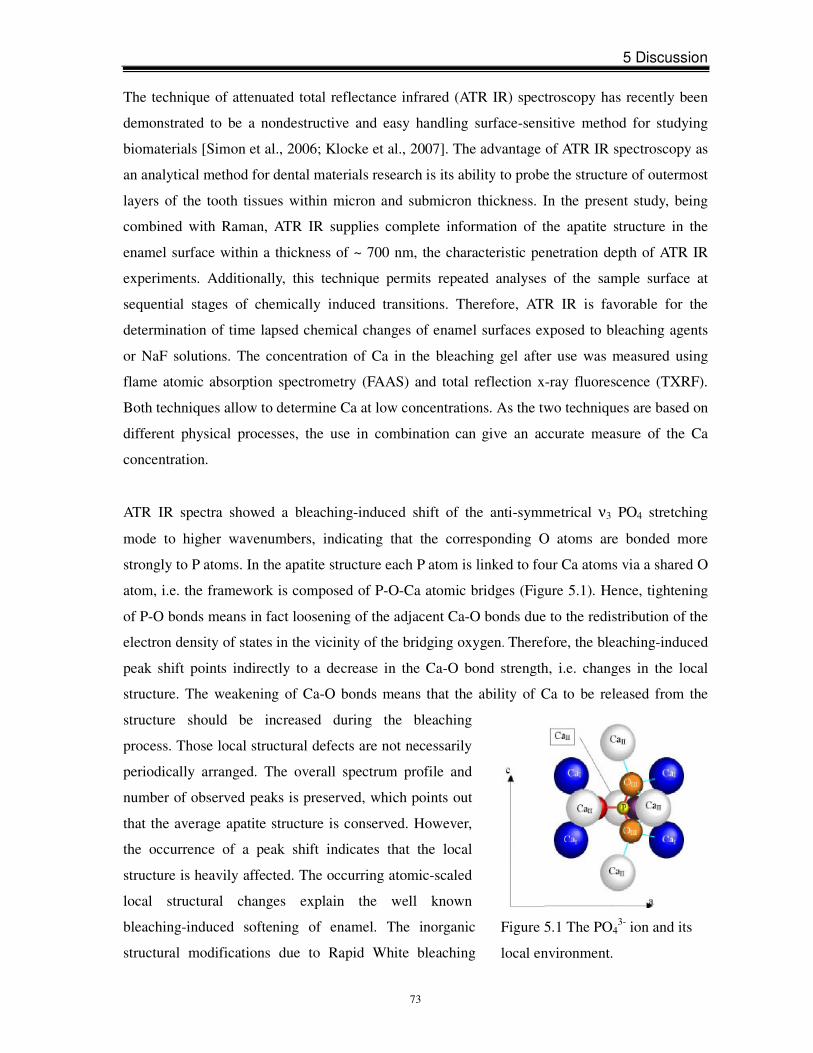
5 Discussion
73
Figure 5.1 The PO43- ion and its
local environment.
The technique of attenuated total reflectance infrared (ATR IR) spectroscopy has recently been
demonstrated to be a nondestructive and easy handling surface-sensitive method for studying
biomaterials [Simon et al., 2006; Klocke et al., 2007]. The advantage of ATR IR spectroscopy as
an analytical method for dental materials research is its ability to probe the structure of outermost
layers of the tooth tissues within micron and submicron thickness. In the present study, being
combined with Raman, ATR IR supplies complete information of the apatite structure in the
enamel surface within a thickness of ~ 700 nm, the characteristic penetration depth of ATR IR
experiments. Additionally, this technique permits repeated analyses of the sample surface at
sequential stages of chemically induced transitions. Therefore, ATR IR is favorable for the
determination of time lapsed chemical changes of enamel surfaces exposed to bleaching agents
or NaF solutions. The concentration of Ca in the bleaching gel after use was measured using
flame atomic absorption spectrometry (FAAS) and total reflection x-ray fluorescence (TXRF).
Both techniques allow to determine Ca at low concentrations. As the two techniques are based on
different physical processes, the use in combination can give an accurate measure of the Ca
concentration.
ATR IR spectra showed a bleaching-induced shift of the anti-symmetrical ν3 PO4 stretching
mode to higher wavenumbers, indicating that the corresponding O atoms are bonded more
strongly to P atoms. In the apatite structure each P atom is linked to four Ca atoms via a shared O
atom, i.e. the framework is composed of P-O-Ca atomic bridges (Figure 5.1). Hence, tightening
of P-O bonds means in fact loosening of the adjacent Ca-O bonds due to the redistribution of the
electron density of states in the vicinity of the bridging oxygen. Therefore, the bleaching-induced
peak shift points indirectly to a decrease in the Ca-O bond strength, i.e. changes in the local
structure. The weakening of Ca-O bonds means that the ability of Ca to be released from the
structure should be increased during the bleaching
process. Those local structural defects are not necessarily
periodically arranged. The overall spectrum profile and
number of observed peaks is preserved, which points out
that the average apatite structure is conserved. However,
the occurrence of a peak shift indicates that the local
structure is heavily affected. The occurring atomic-scaled
local structural changes explain the well known
bleaching-induced softening of enamel. The inorganic
structural modifications due to Rapid White bleaching
5 Discussion
74
treatment occur in the surface submicron layer (~ 700 nm) of enamel, even after the shortest
treatment recommended by the manufacturer. Additionally, Raman spectra indicated that the
Rapid White bleaching procedure affected the enamel organic component as well. The whitening
capabilities of bleaching agents are due to the oxidation reaction between oxidizing substances
and unsaturated organic pigments inside dental hard tissues. However, these oxidizing
substances are not specific and can potentially react with dental organic structures. Previous
investigations demonstrated that the breakdown of the organic enamel matrix might remove
mineral crystals embedded within the enamel matrix [Albers, 1991]. Since the penetration depth
of these Raman experiments is about 500 µm, it can be stated that bleaching affects the organic
component inside the dental tissues. Attin et al. (2005) demonstrated that the decrease in the
microhardness was not limited to the superficial enamel layer and subsurface softening was
particularly pronounced for samples treated with Rapid White. The reason for the decrease in the
subsurface microhardness is likely to be related to the decomposed enamel organic and the
accompanying mineral loss. Hence, the main reasons for bleaching-enhanced Ca leaching,
determined qualitatively and quantitatively by EPMA, FAAS and TXRF, should be (i) the
weakening of the Ca-O bonds inside the apatite crystallites and (ii) the destruction of the basic
organic component which leads to occurrence of emptied intra- and inter-rod voids. The release
of Ca from the enamel apatite may be realized mostly via atomic diffusion through the apatite
channels along the crystallographic c-axis and the inter-crystallites and inter-rod special voids
with openings on the surface.
Further experiments investigated the effect of aqueous citric acid solutions of different
concentrations on enamel. The exposure time to citric acid solutions was fixed at 10 minutes to
simulate the Rapid White bleaching treatment. Results showed that for a short-term exposure the
degree of alteration of enamel apatite depends on the concentration of citric acid solutions. A
single treatment for 10 minutes with ≥ 0.1 mol/l citric acid was sufficient to affect the atomic
P-O-Ca linkages in the whole available enamel surface. A repetition of the acid treatment did not
induce any further spectral changes. The variations in the peak shape and width when low
concentration of citric acid was used (Figure 4.9) indicate that a short-term treatment leads to the
development of an intermediate stage: spatial regions of altered enamel within a non-altered
matrix. The observed broadening of the major peak is a result of the existence of two
overlapping components, which are positioned at two different wavenumbers corresponding to
non-altered and altered enamel. The two components contribute with different weight
coefficients to the infrared absorption in the range 1010-1030 cm-1, which manifests as a shift of
5 Discussion
75
the resultant ATR IR peak. After a sufficient cycle of treatments the structure in the whole probed
volume is altered. Consequently, the component related to the non-altered enamel vanishes, thus
leading to the observation of one narrower peak shifted to a higher wavenumber. For citric acid
of low concentrations (≤ 0.05 mol/l) an approximately linear dependence of the enamel
modification on the concentration was found for a single treatment period of 10 minutes. As the
citric acid concentration increased, a continuous, time-dependent increase in the modification of
the enamel structure occurred during the first 4 cycles of 10 minute-treatment (4×10 min).
However, after this exposure time, the alteration in the enamel structure probed by ATR IR
spectroscopy reached its final, saturated stage and became independent of the concentration. This
indicates that, regardless of the concentration of citric acid, after a certain cycle of acid treatment,
the modification of the apatite atomic structure occurs within the whole surface layer with a
thickness of ~ 700 nm. The impact of citric acid on dental enamel has been well documented as
the main acid in many fruit drinks and juices and factors such as its pH value and exposure time
have been investigated. The results in this study on short-term treatment are in accordance with
already published data that the rate of enamel dissolution increases with decreasing pH [Hughes
et al., 2000; Barbour et al., 2003]. The critical pH value below which demineralization of dental
enamel occurs was found to be in the vicinity of 5.5 [Lagerlöf, 1983; Driessens et al., 1986]. The
pH values of aqueous citric acid solutions prepared in the current study are well below the
critical pH value (Table 3.1) and, hence, results on multi-step treatments are in agreement with
this conclusion.
It is worth noting that grinding and polishing procedures may change the physical and chemical
properties of enamel surface by removing the outer layer from enamel surface, which is more
resistant to demineralization [Dijkman et al., 1982; Wefel and Harless, 1982]. However, to allow
positioning of samples in the test devices, in this study, samples had to be ground and polished to
obtain a flat and smooth surface. Therefore, in the intraoral environment, enamel erosion caused
by citric acid in Rapid White might be less pronounced. Further in vivo and clinical studies are
necessary.
5.3 Effects of sodium fluoride on enamel
Protocols utilizing pH-cycling have served as a powerful means for providing mechanistic
insight into the caries process and preventive measures. A similar protocol has also been used in
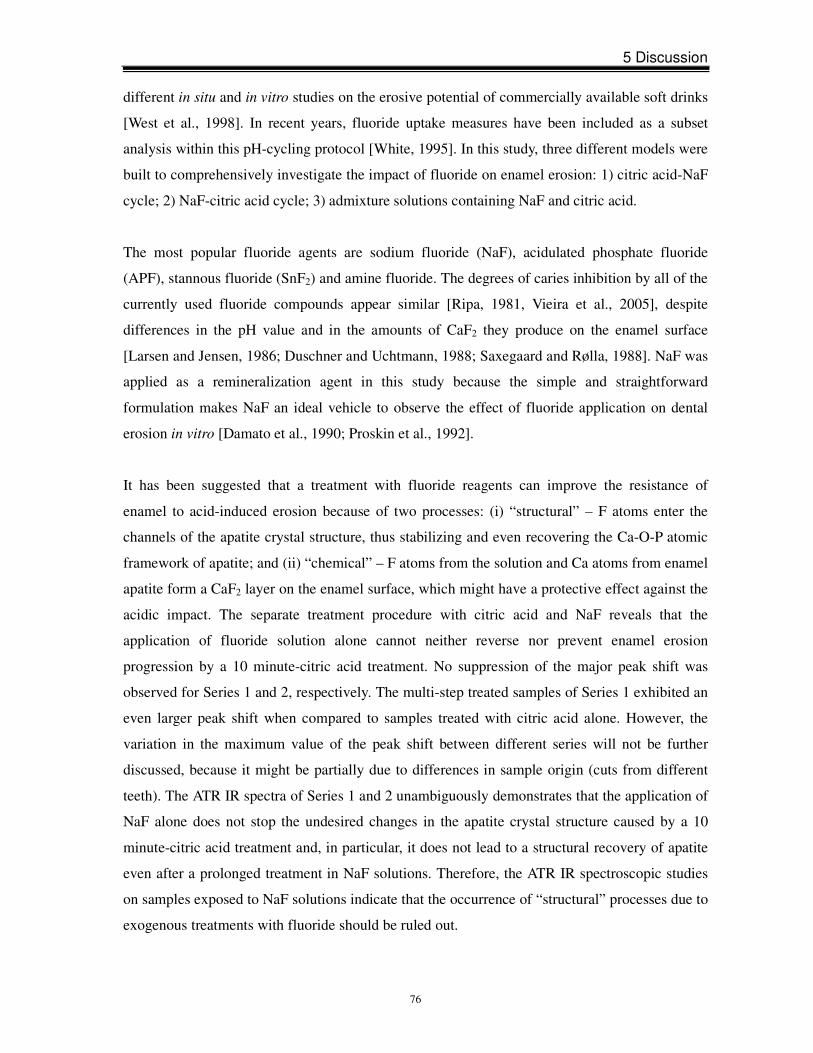
5 Discussion
76
different in situ and in vitro studies on the erosive potential of commercially available soft drinks
[West et al., 1998]. In recent years, fluoride uptake measures have been included as a subset
analysis within this pH-cycling protocol [White, 1995]. In this study, three different models were
built to comprehensively investigate the impact of fluoride on enamel erosion: 1) citric acid-NaF
cycle; 2) NaF-citric acid cycle; 3) admixture solutions containing NaF and citric acid.
The most popular fluoride agents are sodium fluoride (NaF), acidulated phosphate fluoride
(APF), stannous fluoride (SnF2) and amine fluoride. The degrees of caries inhibition by all of the
currently used fluoride compounds appear similar [Ripa, 1981, Vieira et al., 2005], despite
differences in the pH value and in the amounts of CaF2 they produce on the enamel surface
[Larsen and Jensen, 1986; Duschner and Uchtmann, 1988; Saxegaard and Rølla, 1988]. NaF was
applied as a remineralization agent in this study because the simple and straightforward
formulation makes NaF an ideal vehicle to observe the effect of fluoride application on dental
erosion in vitro [Damato et al., 1990; Proskin et al., 1992].
It has been suggested that a treatment with fluoride reagents can improve the resistance of
enamel to acid-induced erosion because of two processes: (i) “structural” – F atoms enter the
channels of the apatite crystal structure, thus stabilizing and even recovering the Ca-O-P atomic
framework of apatite; and (ii) “chemical” – F atoms from the solution and Ca atoms from enamel
apatite form a CaF2 layer on the enamel surface, which might have a protective effect against the
acidic impact. The separate treatment procedure with citric acid and NaF reveals that the
application of fluoride solution alone cannot neither reverse nor prevent enamel erosion
progression by a 10 minute-citric acid treatment. No suppression of the major peak shift was
observed for Series 1 and 2, respectively. The multi-step treated samples of Series 1 exhibited an
even larger peak shift when compared to samples treated with citric acid alone. However, the
variation in the maximum value of the peak shift between different series will not be further
discussed, because it might be partially due to differences in sample origin (cuts from different
teeth). The ATR IR spectra of Series 1 and 2 unambiguously demonstrates that the application of
NaF alone does not stop the undesired changes in the apatite crystal structure caused by a 10
minute-citric acid treatment and, in particular, it does not lead to a structural recovery of apatite
even after a prolonged treatment in NaF solutions. Therefore, the ATR IR spectroscopic studies
on samples exposed to NaF solutions indicate that the occurrence of “structural” processes due to
exogenous treatments with fluoride should be ruled out.
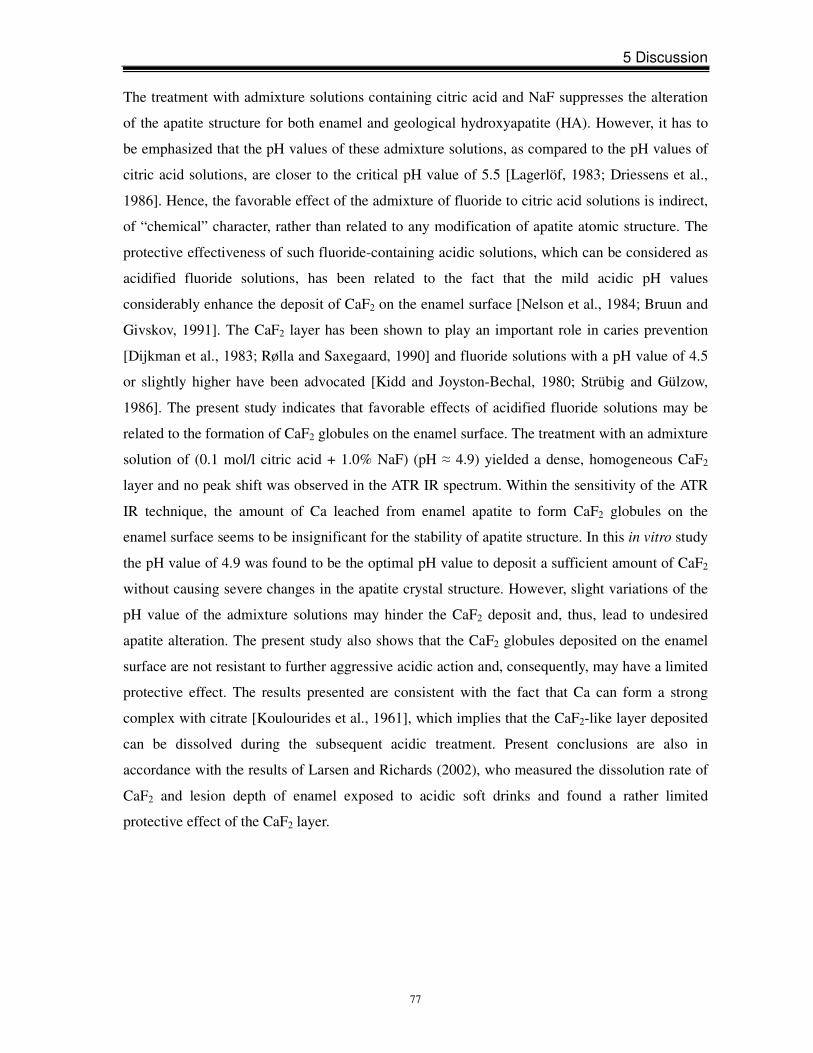
5 Discussion
77
The treatment with admixture solutions containing citric acid and NaF suppresses the alteration
of the apatite structure for both enamel and geological hydroxyapatite (HA). However, it has to
be emphasized that the pH values of these admixture solutions, as compared to the pH values of
citric acid solutions, are closer to the critical pH value of 5.5 [Lagerlöf, 1983; Driessens et al.,
1986]. Hence, the favorable effect of the admixture of fluoride to citric acid solutions is indirect,
of “chemical” character, rather than related to any modification of apatite atomic structure. The
protective effectiveness of such fluoride-containing acidic solutions, which can be considered as
acidified fluoride solutions, has been related to the fact that the mild acidic pH values
considerably enhance the deposit of CaF2 on the enamel surface [Nelson et al., 1984; Bruun and
Givskov, 1991]. The CaF2 layer has been shown to play an important role in caries prevention
[Dijkman et al., 1983; Rølla and Saxegaard, 1990] and fluoride solutions with a pH value of 4.5
or slightly higher have been advocated [Kidd and Joyston-Bechal, 1980; Strübig and Gülzow,
1986]. The present study indicates that favorable effects of acidified fluoride solutions may be
related to the formation of CaF2 globules on the enamel surface. The treatment with an admixture
solution of (0.1 mol/l citric acid + 1.0% NaF) (pH ≈ 4.9) yielded a dense, homogeneous CaF2
layer and no peak shift was observed in the ATR IR spectrum. Within the sensitivity of the ATR
IR technique, the amount of Ca leached from enamel apatite to form CaF2 globules on the
enamel surface seems to be insignificant for the stability of apatite structure. In this in vitro study
the pH value of 4.9 was found to be the optimal pH value to deposit a sufficient amount of CaF2
without causing severe changes in the apatite crystal structure. However, slight variations of the
pH value of the admixture solutions may hinder the CaF2 deposit and, thus, lead to undesired
apatite alteration. The present study also shows that the CaF2 globules deposited on the enamel
surface are not resistant to further aggressive acidic action and, consequently, may have a limited
protective effect. The results presented are consistent with the fact that Ca can form a strong
complex with citrate [Koulourides et al., 1961], which implies that the CaF2-like layer deposited
can be dissolved during the subsequent acidic treatment. Present conclusions are also in
accordance with the results of Larsen and Richards (2002), who measured the dissolution rate of
CaF2 and lesion depth of enamel exposed to acidic soft drinks and found a rather limited
protective effect of the CaF2 layer.
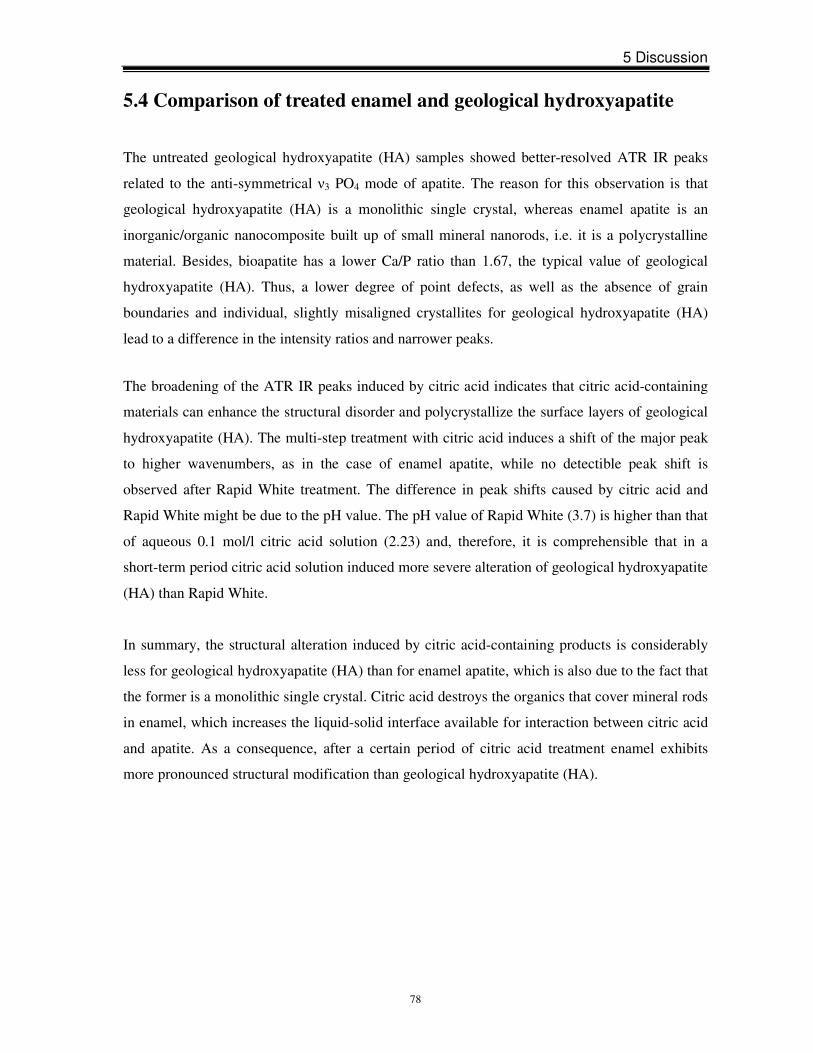
5 Discussion
78
5.4 Comparison of treated enamel and geological hydroxyapatite
The untreated geological hydroxyapatite (HA) samples showed better-resolved ATR IR peaks
related to the anti-symmetrical ν3 PO4 mode of apatite. The reason for this observation is that
geological hydroxyapatite (HA) is a monolithic single crystal, whereas enamel apatite is an
inorganic/organic nanocomposite built up of small mineral nanorods, i.e. it is a polycrystalline
material. Besides, bioapatite has a lower Ca/P ratio than 1.67, the typical value of geological
hydroxyapatite (HA). Thus, a lower degree of point defects, as well as the absence of grain
boundaries and individual, slightly misaligned crystallites for geological hydroxyapatite (HA)
lead to a difference in the intensity ratios and narrower peaks.
The broadening of the ATR IR peaks induced by citric acid indicates that citric acid-containing
materials can enhance the structural disorder and polycrystallize the surface layers of geological
hydroxyapatite (HA). The multi-step treatment with citric acid induces a shift of the major peak
to higher wavenumbers, as in the case of enamel apatite, while no detectible peak shift is
observed after Rapid White treatment. The difference in peak shifts caused by citric acid and
Rapid White might be due to the pH value. The pH value of Rapid White (3.7) is higher than that
of aqueous 0.1 mol/l citric acid solution (2.23) and, therefore, it is comprehensible that in a
short-term period citric acid solution induced more severe alteration of geological hydroxyapatite
(HA) than Rapid White.
In summary, the structural alteration induced by citric acid-containing products is considerably
less for geological hydroxyapatite (HA) than for enamel apatite, which is also due to the fact that
the former is a monolithic single crystal. Citric acid destroys the organics that cover mineral rods
in enamel, which increases the liquid-solid interface available for interaction between citric acid
and apatite. As a consequence, after a certain period of citric acid treatment enamel exhibits
more pronounced structural modification than geological hydroxyapatite (HA).
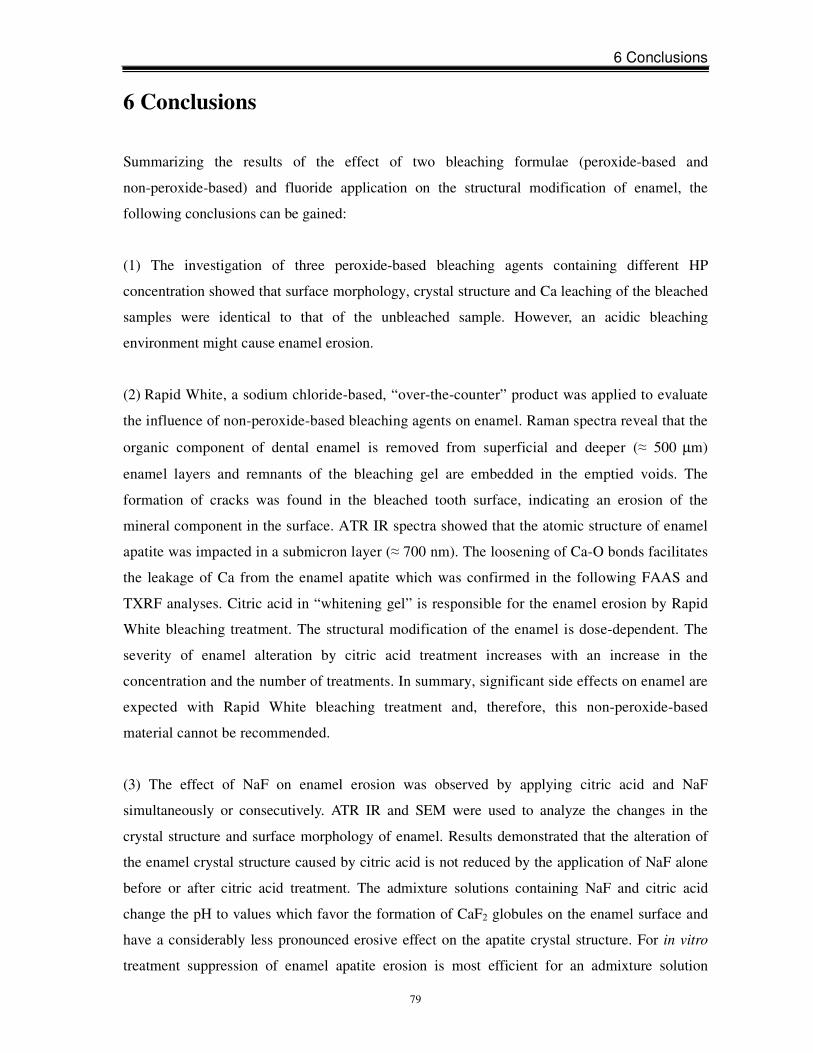
6 Conclusions
79
6 Conclusions
Summarizing the results of the effect of two bleaching formulae (peroxide-based and
non-peroxide-based) and fluoride application on the structural modification of enamel, the
following conclusions can be gained:
(1) The investigation of three peroxide-based bleaching agents containing different HP
concentration showed that surface morphology, crystal structure and Ca leaching of the bleached
samples were identical to that of the unbleached sample. However, an acidic bleaching
environment might cause enamel erosion.
(2) Rapid White, a sodium chloride-based, “over-the-counter” product was applied to evaluate
the influence of non-peroxide-based bleaching agents on enamel. Raman spectra reveal that the
organic component of dental enamel is removed from superficial and deeper (≈ 500 µm)
enamel layers and remnants of the bleaching gel are embedded in the emptied voids. The
formation of cracks was found in the bleached tooth surface, indicating an erosion of the
mineral component in the surface. ATR IR spectra showed that the atomic structure of enamel
apatite was impacted in a submicron layer (≈ 700 nm). The loosening of Ca-O bonds facilitates
the leakage of Ca from the enamel apatite which was confirmed in the following FAAS and
TXRF analyses. Citric acid in “whitening gel” is responsible for the enamel erosion by Rapid
White bleaching treatment. The structural modification of the enamel is dose-dependent. The
severity of enamel alteration by citric acid treatment increases with an increase in the
concentration and the number of treatments. In summary, significant side effects on enamel are
expected with Rapid White bleaching treatment and, therefore, this non-peroxide-based
material cannot be recommended.
(3) The effect of NaF on enamel erosion was observed by applying citric acid and NaF
simultaneously or consecutively. ATR IR and SEM were used to analyze the changes in the
crystal structure and surface morphology of enamel. Results demonstrated that the alteration of
the enamel crystal structure caused by citric acid is not reduced by the application of NaF alone
before or after citric acid treatment. The admixture solutions containing NaF and citric acid
change the pH to values which favor the formation of CaF2 globules on the enamel surface and
have a considerably less pronounced erosive effect on the apatite crystal structure. For in vitro
treatment suppression of enamel apatite erosion is most efficient for an admixture solution
6 Conclusions
80
having a pH value of 4.9. The CaF2 globules deposited on the enamel surface are not sufficient to
prevent apatite structural alterations due to further treatment with strong acidic agents.
(4) Geological hydroxyapatite (HA) is more resistant to acidic erosion than enamel apatite
because the former is monolithic, while the latter is organic-inorganic nanocomposite.
References
81
References
Absi EG, Addy M, Adams D (1995). Dentine hypersensitivity: uptake of toothpastes onto
dentine and effects of brushing, washing and dietary acid-SEM in vitro study. J Oral Rehabil
22:175-182.
Added N, Rizzutto MA, Curado JF, Francci C, Markarian R, Mori M (2006). Trace elementary
concentration in enamel after dental bleaching using HI-ERDA. Nucl Instr and Meth in Phys Res
249:684-687.
Albers H (1991). Lightening natural teeth. ADEPT report. 2:10-24.
Amaechi BT, Higham SM (2005). Dental erosion: possible approaches to prevention and control.
J Dent 33:243-252.
Anderson P, Elliott JC (2000). Rates of mineral loss in human enamel during in vitro
demineralization perpendicular and parallel to the natural surface. Caries Res 34:33-40.
Arends J, Ten Cate JM (1981). Tooth enamel remineralization. J Crystal Growth 53:135-147.
Ari H, Üngör M (2002). In vitro comparison of different types of sodium perborate used for
intracoronal bleaching of discoloured teeth. Int Endodont J 35:433-436.
Atkinson CB (1892). Fancies and some facts. Dent Cosmos 34:968-972.
Attin T, Dumont B, Buchalla W (2000). Fluoride uptake in caries, eroded and sound enamel after
application of a 2000 ppm fluoride solution. Dtsch Zahnärztl Z 55:455-460.
Attin T, Knöfel S, Buchalla W, Tütüncü R (2001). In situ evaluation of different remineralization
periods to decrease brushing abrasion of demineralized enamel. Caries Res 35:216-222.
Attin T, Meyer K, Hellwig E, Buchalla W, Lennon AM (2003). Effect of mineral supplements to
citric acid on enamel erosion. Arch Oral Biol 48:753-759.
Attin T, Muller T, Patyk A, Lennon AM (2004). Influence of different bleaching systems on
fracture toughness and hardness of enamel. Oper Dent 29:188-195.
Attin T, Vollmer D, Wiegand A, Attin R, Betke H (2005). Subsurface microhardness of enamel
and dentine after different external bleaching procedures. Am J Dent 18:8-12.
Bailey SJ, Swift EJ (1992). Effects of home bleaching products on composite resins.
Quintessence Int 23:489-494.
Barbour ME, Parker DM, Allen GC, Jandt KD (2003). Human enamel dissolution in citric acid
as a function of pH in the range 2.30 ≤ pH ≤ 6.30 - a nanoindentation study. Eur J Oral Sci
111:258-262.
Barbour ME, Rees JS (2004). The laboratory assessment of enamel erosion: a review. J Dent
32:591-602.
References
82
Basting RT, Rodrigues AL, Serra MC (2003). The effects of seven carbamide peroxide bleaching
agents on enamel microhardness over time. J Am Dent Assoc 134:1335-1342.
Basting RT, Rodrigues AL, Serra MC (2005). The effect of 10% carbamide peroxide, carbopol
and/or glycerin on enamel and dentine microhardness. Oper Dent 30:608-616.
Beevers CA, McIntyre DB (1946). The atomic structure of fluorapatite and its relation to that of
tooth and bone material. Min Mag 27:254-257.
Bitter NC (1998). A scanning electron microscope study of the long-term effect of bleaching
agents on the enamel surface in vivo. Gen Dent 46:84-88.
Bitter NC, Sanders JL (1993). The effect of four bleaching agents on the enamel surface: a
scanning electron microscopic study. Quintessence Int 24:817-824.
Blankenau R, Goldstein RE, Haywood VB (1999). The current status of vital tooth whitening
techniques. Compend Contin Educ Dent 20:781-784.
Bogue EA (1872). Bleaching teeth. Dent Cosmos 14:1-3.
Bruun C, Givskov H (1991). Formation of CaF2 on sound enamel and in caries-like enamel
lesion after different forms of fluoride application in vitro. Caries Res 25:96-100.
Bruun C, Givskov H (1993). Calcium fluoride formation in enamel from semi- or
low-concentrated F agents in vitro. Caries Res 27:96-99.
Bruun C, Moe D, Lundager Madsen HE (1983). Study on the dissolution behaviour of calcium
fluoride. Scand J Dent Res 91:247-250.
Cavalli V, Giannini M, Carvalho RM (2004). Effect of carbamide peroxide bleaching agents on
tensile strength of human enamel. Dent Mater 20:733-739.
Cevc G, Cevc P, Schara M, Skaleric U (1980). The caries resistance of human teeth is
determined by the spatial arrangement of hydroxyapatite microcrystals in the enamel. Nature
286:425-426.
Chng HK, Ramli HN, Yap AU, Lim CT (2005). Effect of hydrogen peroxide on intertubular
dentine. J Dent 33:363-369.
Christensen GJ (1997). Bleaching teeth: practitioner trends. J Am Dent Assoc 128
(Suppl):16S-18S.
Cimilli H, Pameijer CH (2001). Effect of carbamide peroxide bleaching agents on the physical
properties and chemical composition of enamel. Am J Dent 14:63-66.
Cohen S, Parkins FM (1970). Bleaching tetracycline-stained vital teeth. Oral Surg 29:465-471.
Cotton FA, Wilkinson G (1972). Oxygen. In: Advances in inorganic chemistry. A comprehensive
text. Cotton FA, Wilkinson G, editors. New York: Interscience Publisher, PP 403-420.
References
83
Covington JS, Friend GN, Lamoreaux WJ, Perry T (1990). Carbamide peroxide tooth bleaching:
effects on enamel composition and topography [abstract]. J Dent Res 69: 175.
Cullen DR, Nelson JA, Sandrik JL (1993). Peroxide bleaches: effect on tensile strength of
composite resins. J Prosthet Dent 69:247-249.
Curz R, Øgaard B, Rølla G (1992). Uptake of KOH-soluble and KOH-insoluble fluoride in
sound human enamel after topical application of a fluoride varnish (Duraphat) or a neutral 2%
NaF solution in vitro. Scand J Dent Res 100:154-158.
Curzon MEJ, Featherstone JDB (1983). In: CRC Handbook of experimental aspects of oral
biochemistry, CRC Press Inc., Boca Raton, Florida, pp 123-135.
Cuy JL, Mann AB, Livi KJ, Teaford MF, Weihs TP (2002). Nanoindentation mapping of the
mechanical properties of human molar tooth enamel. Arch Oral Biol 47:281-291.
Dahl JE (2003). Tooth bleaching-a critical review of the biological aspects. Crit Rev Oral Biol
Med 14:292-303.
Damato FA, Strang R, Stephen KW (1990). Effect of fluoride concentration on remineralization
of carious enamel: an in vitro pH-cycling study. Caries Res 24:174-180.
Dawes C (2003). What is the critical pH and why does a tooth dissolve in acid? J Can Dent
Assoc 69:722-724.
Delbem AC, Cury JA (2002). Effect of application time of APF and NaF gels on microhardness
and fluoride uptake of in vitro enamel caries. Am J Dent 15:169-172.
Della Bona A, Baghi N, Berry T, Godwin J (1992). In-vitro bond strength testing of bleached
dentine [abstract]. J Dent Res 71:659.
Dietschi D, Rossier S, Krejci I (2006). In vitro colorimetric evaluation of the efficacy of various
bleaching methods and products. Quintessence Int 37:515-526
Dijkman AG, De Boer P, Arends J (1983). In vivo investigation of the fluoride content in and on
human enamel after topical applications. Caries Res 17:392-402.
Dijkman AG, TAK J, Arends J (1982). Fluoride deposited by topical applications in enamel.
Caries Res 16:147-155.
Dishman MV, Baughan LW (1992). Vital tooth bleaching-home use review and evaluation. Va
Dent J 69:12-21.
Dorozhkin SV (1997). Surface reactions of apatite dissolution. J Colloid Interface Sci
191:489-497.
Driessens FC, Theuns HM, Borggreven JM, van Dijk JW (1986). Solubility behaviour of whole
human enamel. Caries Res 20:103-110.
References
84
Duschner H, Götz H, Ogaard B (1997). Fluoride-induced precipitates on enamel surface and
subsurface areas visualised by electron microscopy and confocal laser scanning microscopy. Eur
J Oral Sci 105:466-472.
Duschner H, Götz H, White DJ, Kozak KM, Zoladz JR (2006). Effects of hydrogen peroxide
bleaching strips on tooth surface color, surface microhardness, surface and subsurface
ultrastructure, and microchemical (Raman spectroscopic) composition. J Clin Dent 17:72-78.
Duschner H, Uchtmann H (1988). Degradation of surface enamel and formation of precipitates
after topical applications of sodium fluoride solutions in vitro. Acta Odontol Scand 46:365-374.
Dwinelle WW (1850). Ninth annual meeting of American society of dental surgeons. Am J Dent
Sci 1:57-61.
Eccles JD, Jenkins WG (1974). Dental erosion and diet. J Dent 2:153-159.
Eisenburger M, Shellis RP, Addy M (2004). Scanning electron microscopy of softened enamel.
Caries Res 38:67-74.
Elliott JC (1997). Structure, crystal chemistry and density of enamel apatite. Dental enamel.
CIBA Foundation Symposium 205, pp 54-72.
Elliott JC (2002). Calcium phosphate biominerals. Rev Miner Geochem 48:427-454.
Elliott JC, Holcomb DW, Young RA (1985). Infrared determination of the degree of substitution
of hydroxyl by carbonate ions in human dental enamel. Calcif Tissue Int 37:372-375.
Ernst CP, Marroquin BB, Willershausen-Zönnchen B (1996). Effects of hydrogen peroxide-
containing bleaching agents on the morphology of human enamel. Quintessence Int 27:53-56.
Fasanaro TS (1992). Bleaching teeth: history, chemicals, and methods used for common tooth
discolorations. J Esthet Dent 4:70-78.
Fattibene P, Carosi A, De Coste V, Sacchette A, Nucara A, Postorino P, Dore P (2005). A
comparative EPR, infrared and Raman study of natural and deproteinated tooth enamel and
dentine. Phys Med Biol 50:1095-1108.
Featherstone JDB, Ten Cate JM, Shariati M, Arends J (1983). Comparison of artificial
caries-like lesions by quantitative microradiography and microhardness profiles. Caries Res
17:385-391.
Fejerskov O, Thylstrup A, Larsen MJ (1981). Rational use of fluorides in caries prevention. A
concept based on possible cariostatic mechanisms. Acta Odontol Scand 39:241-249.
Feinman RA, Madray G, Yarborough D (1991). Chemical, optical, and physiologic mechanisms
of bleaching products: a review. Pract Periodontics Aesthet Dent 3:32-36.
Fisher G (1911). The bleaching of discolored teeth with H2O2. Dent Cosmos 53:246-247.
References
85
Fondriest J (2003). Shade matching in restorative dentistry: the science and strategies. Int J
periodontics Restorative Dent 23:467-479.
Gallagher DL, Hoehn RC, Dietrich AM (1994). Denver, CO, American Water Works Association
Research Foundation, p. 184.
Ganss C, Klimek J, Schäffer U, Spall T (2001). Effectiveness of two fluoridation measures on
erosion progression in human enamel and dentine in vitro. Caries Res 35:325-330.
Geng XL, Wang Z, Li XQ, Zhang C (2005). A simple method for epoxidation of olefins using
sodium chlorite as an oxidant without a catalyst. J Org Chem 70:9610-9613.
Girija V, Stephen HC (2003). Characterization of lipid in mature enamel using confocal laser
scanning microscopy. J Dent 31:303-311.
Glockner K, Ebeleseder K, Städtler P (1997). Das Bleichen von verfärbten Frontzähnen.
Schweiz Monatsschr Zahnmed 107:413-420.
Goldberg M, Arends J, Jongebloed WL, Schuthof J, Septier D (1983). Action of urea solutions
on human enamel surfaces. Caries Res 17:106-112.
Goldstein CE, Goldstein RE, Feinman RA (1989). Bleaching vital teeth: state of the art.
Quintessence Int 20:729-737.
Goldstein RE (1997). In-office bleaching: where we came from, where we are today. J Am Dent
Assoc 128 (Suppl):11S-15S.
Goldstein RE, Garber DA (1995). Complete dental bleaching. Quintessence Publishing Co, Inc.
Chicago, p. 165.
Goo DH, Kwon TY, Nam SH, Kim HJ, Kim KH, Kim YJ (2004). The efficiency of 10%
carbamide peroxide gel on dental enamel. Dent Mater J 23:522-527.
Goon WW, Gohen S, Borer RF (1986). External cervical root resorption following bleaching. J
Endod 12:414-418.
Greenwall L (2001). Bleaching techniques in restorative dentistry. London: Martin Dunitz, pp
88-172.
Gregus Z, Klaassen CD (1995). Mechanisms of toxicity. In: Cassarett and doull's toxicology, the
basic science of poisons. Klaassen CD, editor. New York: McGraw-Hill Companies Inc., pp
35-74.
Gürgan S, Bolay S, Alacam R (1997). In vitro adherence of bacteria to bleached or unbleached
enamel surfaces. J Oral Rehabil 24:624-627.
Hairul Nizam BR, Lim CT, Chng HK, Yap AUJ (2005). Nanoindentation study of human
premolar subjected to bleaching agent. J Biomech 38: 2204-2211.
References
86
Harlan AW (1891). The dental pulp, its destruction and methods of treatment of teeth discolored
by its retention in the pulp chamber or canals. Dent Cosmos 33:137-141.
Haywood VB (1992). History, safety, and effectiveness of current bleaching techniques and
applications of the nightguard vital bleaching technique. Quintessence Int 23:471-488.
Haywood VB (2000). Current status of nightguard vital bleaching. Compend Contin Educ Dent
21:S10-S17.
Haywood VB (2005). Treating sensitivity during tooth whitening. Compend Contin Educ Dent
26:11-20.
Haywood VB, Heymann HO (1989). Nightguard vital bleaching. Quintessence Int 20:173-176.
Haywood VB, Heymann HO (1991). Nightguard vital bleaching: how safe is it? Quintessence Int
22:515-523.
Haywood VB, Leech T, Heymann HO, Crumpler D, Bruggers K (1990). Nightguard vital
bleaching: effects on enamel surface texture and diffusion. Quintessence Int 21:801-804.
Hägg G (1969). General and inorganic chemistry. Almqvist and Wiksell, Stockholm, pp
335-338.
Hegedüs C, Bistey T, Flora-Nagy E, Keszthelyi G, Jenei A (1999). An atomic force microscopy
study on the effect of bleaching agents on enamel surface. J Dent 27:509-515.
Homewood C, Tyas M, Woods M (2001). Bonding to previously bleached teeth. Aust Orthod J
17:27-34.
Howard WR (1992). Patient-applied tooth whiteners. J Am Dent Assoc 72:57-60.
Hughes JA, West NX, Addy M (2004). The protective effect of fluoride treatments against
enamel erosion in vitro. J Oral Rehabil 31:357-363.
Hughes JA, West NX, Parker DM, van den Braak MH, Addy M (2000). Effects of pH and
concentration of citric, malic and lactic acids on enamel, in vitro. J Dent 28:147-152.
Hummert TW, Osborne JW, Norling BK, Cardenas HL (1993). Mercury in solution following
exposure of various amalgams to carbamide peroxides. Am J Dent 6:305-309.
Hunsaker KJ, Christensen GJ (1990). Tooth bleaching chemicals-influence on teeth and
restorations [Abstract]. J Dent Res 69:303.
Jahangiri L, Reinhardt SB, Mehra RV, Matheson PB (2002). Relationship between tooth shade
value and skin color: an observational study. J Prosthet Dent 87:149-152.
Jansen MT, Visser JB (1950). Permeable structures in normal enamel. J Dent Res 29:622-632.
Joiner A (2004). Evaluation of a 6% hydrogen peroxide tooth whitening gel on enamel and
dentine microhardness in vitro. J Dent 32:27-34.
References
87
Josey AL, Meyers IA, Romaniuk K, Symons AL (1996). The effect of a vital bleaching
technique on enamel surface morphology and the bonding of composite resin to enamel. J Oral
Rehabil 23:244-250.
Kao EC, Peng P, Johnston WM (1991). Color changes of teeth and restorative materials exposed
to bleaching [Abstract]. J Dent Res 70:570.
Kidd EAM, Joyston-Bechal S (1980). Histopathological appearance of caries-like lesions of
enamel created artificially in vitro in acidified gels containing fluoride. Caries Res 14:40-44.
Kingsbury CA (1861). Discoloration of dentine. Dent Cosmos 3:57-60.
Kinomoto Y, Carnes DL, Ebisu S (2001). Cytotoxicity of intracanal bleaching agents on
periodontal ligament cells in vitro. J Endod 27:574-577.
Kirk EC (1889). The chemical bleaching of teeth. Dent Cosmos 31:273-283.
Kirk EC (1893). Hints, queries, and comments: sodium peroxide. Dent Cosmos 35:1265-1267.
Klocke A, Mihailova B, Zhang SQ, Gasharova B, Stosch R, Güttler B, Kahl-Nieke B, Henriot P,
Ritschel B, Bismayer U (2007). CO2 laser-induced zonation in dental enamel: a Raman and IR
microspectroscopic study. J Biomed Mater Res Part B 81:499-507.
Koulourides T, Cueto H, Pigman W (1961). Rehardening of softened enamel surfaces of human
teeth by solutions of calcium phosphates. Nature189:226-227.
Kugel G (2003). Over-the-counter tooth-whitening systems. Compend Contin Educ Dent
24:376-382.
Lagerlöf F (1983). Effect of flow rate and pH on calcium phosphate saturation in human parotid
saliva. Caries Res 17:403-411.
Lagerweij MD, Buchalla W, Kohnke S, Becker K, Lennon AM, Attin T (2006). Prevention of
erosion and abrasion by a high fluoride concentration gel applied at high frequencies. Caries Res
40:148-153.
Lai SC, Tay FR, Cheung GS (2002). Reversal of compromised bonding in bleached enamel. J
Dent Res 81:477-481.
Larsen MJ (1973). Dissolution of enamel. Scand J Dent Res 81:518-522.
Larsen MJ (1974). Chemically induced in vitro lesions in dental enamel. Scand J Dent Res
82:496-490.
Larsen MJ (2001). Prevention by means of fluoride of enamel erosion as caused by soft drinks
and orange juice. Caries Res 25:229-234.
Larsen MJ, Jensen SJ (1986). On the properties of fluoride solutions used for topical treatment
and mouth rinse. Caries Res 20:56-64.
References
88
Larsen MJ, Richards A (2001). The influence of saliva on the formation of calcium fluoride-like
material on human dental enamel. Caries Res 35:57-60.
Larsen MJ, Richards A (2002). Fluoride is unable to reduce dental erosion from soft drinks.
Caries Res 36:75-80.
Latimer JS (1868). Notes from the discussion of the society of dental surgeons in the city of New
York. Dent Cosmos 10:257-258.
Leach SA (1959). Reactions of fluoride with powdered enamel and dentinee. Br Dent J
106:133-142.
Lee KH, Kim HI, Kim KH, Kwon YH (2006). Mineral loss from bovine enamel by a 30%
hydrogen peroxide solution. J Oral Rehabil 33:229-233.
LeGeros RZ, Trautz OR, LeGeros JP, Klein E, Shirra WP (1967). Apatite crystallites: effects of
carbonate on morphology. Science 155:1409-1411.
LeGeros RZ, Tung MS (1983). Chemical stability of carbonate- and fluoride-containing apatites.
Caries Res 17:419-429.
Leonard RH Jr, Bentley CD, Haywood VB (1994). Salivary pH changes during 10% carbamide
peroxide bleaching. Quintessence Int 25:547-550.
Leonard RH Jr, Eagle JC, Garland GE, Matthews KP, Rudd AL, Phillips C (2001). Nightguard
vital bleaching and its effect on enamel surface morphology. J Esthet Restor Dent 13:132-139.
Leonard RH Jr, Haywood VB, Phillips C (1997). Risk factors for developing tooth sensitivity
and gingival irritation associated with nightguard vital bleaching. Quintessence Int 28:527-534.
Lewinstein I, Hirschfeld Z, Stabholz A, Rotstein I (1994). Effect of hydrogen peroxide and
sodium perborate on the microhardness of human enamel and dentine. J Endod 20:61-63.
Mathew M, Takagi S (2001). Structure of biological minerals in dental research. J Res Natl Inst
Stand Technol 106:1035-1044.
Matis BA, Cochran MA, Wang G, Franco M, Eckert GJ, Carlotti RJ, Bryan C (2005). A clinical
evaluation of bleaching using whitening wraps and strips. Oper Dent 30:588-592.
McCann HG (1953). Reactions of fluoride ion with hydroxyapatite. J Biol Chem 201:247-259.
McCracken MS, Haywood VB (1996). Demineralization effects of 10 percent carbamide
peroxide. J Dent 24:395-398.
McGuckin RS, Babin JF, Meyer BJ (1992). Alterations in human enamel surface morphology
following vital bleaching. J Prosthet Dent 68:754-760.
McInnes J (1966). Removing brown stain from teeth. Ariz Dent J 12:13-15.
Meckel AH, Griebstein WJ, Neal RJ (1965). Structure of mature human dental enamel as
observed by electron microscopy. Arch Oral Biol 10:775-783.
References
89
Miake Y, Shimoda S, Fukae M, Aoba T (1993). Epitaxial overgrowth of apatite crystals on the
thin-ribbon precursor at early stages of porcine enamel mineralization. Calcif Tissue Int
53:249-256.
Miranda CB, Pagani C, Benetti AR, Matuda FS (2005). Evaluation of the bleached human
enamel by scanning electron microscopy. J Appl Oral Sci 13:204-211.
Monaghan P, Trowbridge T, Lautenschlager E (1992). Composite resin color change after vital
tooth bleaching. J Prosthet Dent 67:778-781.
Murchison DF, Charlton DG, Moore BK (1992). Carbamide peroxide bleaching: effects on
enamel surface hardness and bonding. Oper Dent 17:181-185.
Nathoo SA (1997). The chemistry and mechanisms of extrinsic and intrinsic discoloration. J Am
Dent Assoc 128:6S-10S.
Nathoo SA, Chmielewski MB, Kirkup RE (1994). Effects of Colgate Platinum professional tooth
whitening system on microhardness of enamel, dentine, and composite resins. Compend Suppl
17:627-630.
Nelson DG, Jongebloed WL, Arends J (1983). Morphology of enamel surfaces treated with
topical fluoride agents: SEM considerations. J Dent Res 62:1201-1208.
Nelson DG, Jongebloed WL, Arends J (1984). Crystallographic structure of enamel surfaces
treated with topical fluoride agents: TEM and XRD considerations. J Dent Res 63:6-12.
Newby CS, Creeth JE, Rees GD, Schemehorn BR (2006). Surface microhardness changes,
enamel fluoride uptake, and fluoride availability from commercial toothpastes. J Clin Dent
17:94-99.
Nutting EB, Poe GS (1976). A new combination for bleaching teeth. Dent Clin North Am
10:655-662.
O’Brien WJ, Johnston WM, Fanian F (1990). Double-layer color effects in porcelain systems. J
Dent Res 64:940-943.
Odioso LL, Gibb RD, Gerlach RW (2000). Impact of demographic, behavioural, and dental care
utilization parameters on tooth color and personal satisfaction. Compend Contin Educ Dent
21(Suppl 29):S35-S41.
Oltu Ü, Gürgan S (2000). Effects of three concentrations of carbamide peroxide on the structure
of enamel. J Oral Rehabil 27:332-340.
Park HJ, Kwon TY, Nam SH, Kim HJ, Kim KH, Kim YJ (2004). Changes in bovine enamel
after treatment with a 30% hydrogen peroxide bleaching agent. Dent Mater J 23:517-521.
Peacock JM, Orchardson R (1999). Action potential conduction block of nerves in vitro by
potassium citrate, potassium tartrate and potassium oxalate. J Clin Periodontol 26:33-37.
References
90
Pecora JD, Cruzfilho AM, Sousaneto MD, Silva RG (1994). In vitro action of various bleaching
agents on the microhardness of human dentine. Braz Dent J 5:129-134.
Petzold M (2001). The influence of different fluoride compounds and treatment conditions on
dental enamel: a descriptive in vitro study of the CaF2 precipitation and microstructure. Caries
Res 35:45-51.
Pohjola Rm, Browning WD, Hackman ST, Meyers ML, Downey MC (2002). Sensitivity and
tooth whitening. J Esthet Restor Dent 14:85-91.
Polydorou O (2004). The effect of two bleaching products on microhardness and surface texture
of different dental aesthetic restorative material. Dissertationschrift, Albert-Ludwig University,
Freiburg, Germany.
Poole DFG, Mortimer KV, Darling AI, Ollis WD (1961). Molecular sieve behaviour of dental
enamel. Nature 25:998-999.
Potocnik I, Kosec L, Gaspersic D (2000). Effect of 10% carbamide peroxide bleaching gel on
enamel microhardness, microstructure, and mineral content. J Endod 28:203-206.
Powell LV, Bales DJ (1991). Tooth bleaching: its effect on oral tissue. J Am Dent Assoc
122:50-54.
Price RBT, Sedarous M, Hiltz GS (2000). The pH of tooth-whitening products. J Can Dent
Assoc 66:421-426.
Proskin HM, Chilton N W, Kingman A (1992). Interim report of the ad hoc committee for the
consideration of statistical concerns related to the use of intra-oral models in submissions for
product claims approval to the American Dental Association. J Dent Res 71:949-952.
Qualtrough AJE, Burke FJT (1994). A look at dental esthetics. Quintessence Int 25:7-14.
Reitznerova E, Amarasiriwardena D, Kopcakova M, Barnes R (2000). Determination of some
trace elements in human tooth enamel. Fresenius J Anal Chem 367:748-754.
Rhee SH, Tanaka J (1999). Effect of citric acid on the nucleation of hydroxyapatite in a
simulated body fluid. Biomaterials 20:2155-2160.
Ripa LW (1981). Professionally (operator) applied topical fluoride therapy: a critique. Int Dent J
31:105-120.
Robinson C, Connell S, Kirkham J, Shorea R, Smith A (2004). Dental enamel-a biological
ceramic: regular substructures in enamel hydroxyapatite crystals revealed by atomic force
microscopy. J Mater Chem 14:2242-2248.
Rodrigues JA, Basting RT, Serra MC, Rodrigues Junior AL (2001). Effects of 10% carbamide
peroxide bleaching materials on enamel microhardness. Am J Dent 14:67-71.
References
91
Rodrigues JA, Oliveira GPF, Amaral CMI (2007). Effect of thickener agents on dental enamel
microhardness submitted to at-home bleaching. Braz Oral Res 21:170-172.
Rotstein I, Danker E, Goldman A, Heling I, Stabholz A, Zalkind M (1996). Histochemical
analysis of dental hard tissues following bleaching. J Endod 22:23-26.
Rotstein I, Friedman S (1991). pH variation among materials used for intracoronal bleaching. J
Endod 17:376-379.
Rotstein I, Lehr Z, Gedalia I (1992). Effect of bleaching agents on inorganic components of
human dentine and cementum. J Endod 18:290-293.
Rotstein I, Mor C, Arwaz JR (1997). Changes in surface levels of mercury, silver, tin, and
copper of dental amalgam treated with carbamide peroxide and hydrogen peroxide in vitro. Oral
Surg Oral Med Oral Pathol Oral Radiol Endod 83:506-509.
Rølla G, Saxegaard E (1990). Critical evaluation of the composition and use of topical fluorides,
with emphasis on the role of calcium fluoride in caries inhibition. J Dent Res 69 (special
issue):780-785.
Rølla G, Øgaard B, Cruz RA (1993). Topical application of fluorides on teeth. New concepts of
mechanisms of interaction. J Clin Periodontol 20:105-108.
Russell CM, Dickinson GL, Johnson MH, Curtis JW Jr., Downey MC, Haywood VB, Myers ML
(1996). Dentist-supervised home bleaching with ten percent carbamide peroxide gel: a six-month
study. J Esthet Dent 8:177-182.
Sadan A, Lemon RR (1998). Combining treatment modalities for tetracycline-discolored teeth.
Int J Periodont Rest Dent 18:565-571
Saxegaard E, Rølla G (1988). Fluoride acquisition on and in human enamel during topical
application in vitro. Scand J Dent Res 96:523-535.
SCCP/0844/04 (2005). European Commission Health & Consumer Protection
Directorate-General, Scientific Committee on Consumer Products SCCP. Opinion on hydrogen
peroxide in tooth whitening products. Adopted by the SCCP during the 3rd Plenary of 15 March
2005; online available under http://ec.europa.eu/health/ph_risk/
committees/04_sccp/docs/sccp_o_022.pdf.
Schulte JR, Morrissette DB, Gasior EJ, Czajewski MV (1994). The effects of bleaching
application time on the dental pulp. J Am Dent Assoc 125:1330-1335.
Seghi RR, Denry I (1992). Effects of external bleaching on indentation and abrasion
characteristics of human enamel in vitro. J Dent Res 71:1340-1344.
Simmer JP, Fincham AG (1995). Molecular mechanisms of dental enamel formation. Crit Rev
Oral Biol Med 6:84-108.
References
92
Simon V, Popa C, Muresan D, Simon S (2006). Vibrational investigation of sintered titanium
biomaterials. J Optoelectron Adv Mater 8:540-542.
Strübig W, Gülzow HJ (1986). Untersuchungen zur lokalen Wirksamkeit von Gelees mit
unterschiedlichem Fluoridgehalt und unterschiedlichem pH. Dtsch Zahnärztl Z 41:832-835.
Sulieman M, Addy M, Macdonald E, Rees JS (2004). A safety study in vitro for the effects of an
in-office bleaching system on the integrity of enamel and dentine. J Dent 32:581-590.
Swift EJ Jr, Perdigao J (1998). Effects of bleaching on teeth and restorations. Compend Contin
Educ Dent 19:815-820.
Tam L (1999). The safety of home bleaching techniques. J Can Dent Assoc 65:453-455.
Tam LE, Lim M, Khanna S (2005). Effect of direct peroxide bleach application to bovine
dentine on flexural strength and modulus in vitro. J Dent 33:451-458.
Ten Cate AR (1994). Oral history: development, structure and function. 4th Edition. Mosby, St.
Louis, MO. pp 15-44.
Ten Cate JM (1997). Review on fluoride, with special emphasis on calcium fluoride mechanisms
in caries prevention. Eur J Oral Sci 105:461-465.
Ten Cate JM (1999). Current concepts on the theories of the mechanism of action of fluoride.
Acta Odontol Scand 57:325-329.
Tezel H, Ertas OS, Ozata F, Dalgar H, Korkut ZO (2007). Effect of bleaching agents on calcium
loss from the enamel surface. Quintessence Int 38:339-347.
Thitinanthapan W, Satamanont P, Vongsavan N (1999). In vitro penetration of the pulp chamber
by three brands of carbamide peroxide. J Esthet Dent 11:259-264.
Titley KC, Torneck CD, Ruse ND (1992). The effect of carbamide-peroxide gel on the shear
bond strength of a microfil resin to bovine enamel. J Dent Res 71:20-24.
Travis D, Glimcher M (1964). The structure and organization of, and the relationship between
the organic matrix and the inorganic crystals of embryonic bovine enamel. J Cell Biol
23:447-497.
Tredwin CJ, Naik S, Lewis NJ, Scully C (2006). Hydrogen peroxide tooth-whitening (bleaching)
products: review of adverse effects and safety issues. Br Dent J 200:371-376.
Tzanavaras PD, Themelis DG, Kika FS (2007). Review of analytical methods for the
determination of chlorine dioxide. Cent Eur J Chem 5:1-12.
Ünlü N, Çobankara FK, Altinoz C, Ozer F (2004). Effect of home bleaching agents on the
microhardness of human enamel and dentine. J Oral Rehabil 31:57-61.
References
93
Van Rijkom H, Ruben J, Vieira A, Huysmans MC, Truin GJ, Mulder J (2003).
Erosion-inhibiting effect of sodium fluoride and titanium tetrafluoride treatment in vitro. Eur J
Oral Sci 111:253-257.
Vieira AE, Delbem AC, Sassaki KT, Rodrigues E, Cury JA, Cunha RF (2005). Fluoride dose
response in pH-cycling models using bovine enamel. Caries Res 39:514-520.
Viscio D, Gaffar A, Fakhry-Smith S, Xu T (2000). Present and future technologies of tooth
whitening. Compend Contin Educ Dent Suppl 28:S36-S43.
Volpe AR, Petrone ME, Davies R, Proskin HM (1995). Clinical anticaries efficacy of NaF and
SMFP dentifrices: overview and resolution of the scientific controversy. J Clin Dent 6:1-28.
Wakita M, Tsuchiya H, Gunji T, Kobayashi S (1981). Three-dimensional structure of Tomes’
processes and enamel prism formation in the kitten. Arch Histol Jpn 4:285-297.
Watts A, Addy M (2001). Tooth discoloration and staining: a review of the literature. Br Dent J
190:309-315.
Wefel JS, Harless JD (1982). The effect of topical fluoride agents on fluoride uptake and surface
morphology. J Dent Res 60:1842-1848.
Weitzman SA, Weitberg AB, Stossel TP, Schwartz J, Shklar G (1986). Effects of hydrogen
peroxide on oral carcinogenesis in hamsters. J Periodontol 57:685-688.
White DJ (1995). The application of in vitro models to research on demineralization and
remineralization of the teeth. Adv Dent Res 9:175-193.
White I, Mcintyre J, Logan R (2001). Studies on dental erosion: an in vitro model of root surface
erosion. Aust Dent J 46:203-207.
Wiegand A, Attin T (2003). Influence of fluoride on the prevention of erosive lesions--a review.
Oral Health Prev Dent 1:245-253.
Young RA (1974). Implications of atomic substitutions and other structural details in apatites. J
Dent Res 53:193-203.
Zalkind M, Arwaz JR, Goldman A, Rotstein I (1996). Surface morphology changes in human
enamel, dentine and cementum following bleaching: a scanning electron microscopy study.
Endod Dent Traumatol 12:82-88.
Zantner C, Beheim-Schwarzbach N, Neumann KT, Kielbassa AM (2007). Surface
microhardness of enamel after different home bleaching procedures. Dent Mater 23:243-250.
Zantner C, Derdilopoulou F, Martus P, Kielbassa AM (2006). Randomized clinical trial on the
efficacy of 2 over-the-counter whitening systems. Quintessence Int 37:695-706.
Zentner A, Duschner H (1996). Structural changes of acid etched enamel examined under
confocal laser scanning microscope. J Orofac Orthop 57:202-209.
Acknowledgements
94
Acknowledgements This dissertation was developed from Sep. 2005 to Sep. 2008 at the Mineralogisch-
Petrographisches Institut of the University of Hamburg and supported by the DFG-GK 611
“Design and Characterization of Functional Materials”.
I would like to express my most sincere gratitude to the following people:
Prof. Dr. Ulrich Bismayer, Managing Director of the Mineralogisch-Petrographisches Institut,
University of Hamburg, for offering me the opportunity to work in his department and to
conduct research under his supervision. Besides the help in the academic field, he also gave me
great help to solve many difficulties in my life.
Prof. Dr. Boriana Mihailova, Mineralogisch-Petrographisches Institut, University of Hamburg,
for her guidance, advice and support during the entire period of the present study.
Prof. Dr. Arndt Klocke, Department of Orthodontics, University Hospital Hamburg-Eppendorf,
for his continued help, suggestions and encouragement for my research.
I also would like to thank the following persons or organizations for their help:
Dr. Carsten Paulmann, Mineralogisch-Petrographisches Institut, University of Hamburg, for his
help and support for my reseach.
Prof. Dr. José Broekaert, Dr. Ursula Fittschen and Nicole Monien, Institute of Inorganic and
Applied Chemistry, University of Hamburg, for their help with chemical analysis.
Dr. Rainer Stosch and Dr. Bernd Güttler, Physikalisch-Technische Bundesanstalt, Braunschweig,
for their help with Raman spectroscopy analysis.
Mrs. Stefanie Heidrich, Mineralogisch-Petrographisches Institut, University of Hamburg, for her
help with electronic microprobe analysis.
Dr. Lubomira Tosheva, Division of Chemistry and Materials, Manchester Metropolitan
University, for her help with scanning electron microscopy measurement.
Acknowledgements
95
Mr. Joachim Ludwig, Mineralogisch-Petrographisches Institut, University of Hamburg, for his
help with the powder X-ray diffraction measurements.
Dr. Jochen Schlüter, Mineralogical Museum of University of Hamburg, for offering good
geological samples.
Mr. Peter Stutz, Mineralogisch-Petrographisches Institut, University of Hamburg, for the
preparation of specimens.
The Graduate School “Design and Characterization of Functional Materials” for offering me a
fellowship to survive in Hamburg.
Mr. Reinhardt Kurtz, Mrs. Regine Köllner and other students and staff members of the
Mineralogisch-Petrographisches Institut of University of Hamburg who have created a helpful
and friendly atmosphere during my stay.
and those not mentioned here but who also helped me in my work.
Curriculum Vitae
96
Curriculum Vitae
Family name: Wang
First name: Xiaojie
Gender: Female
Date of birth: 24. January, 1978
Place of birth: Heilongjiang Province, China
Nationality: Chinese
Education:
PhD student, Graduate school GK 611 “Design and characterization
of functionalized materials” and Medical Faculty, Hamburg
University, Hamburg, Germany
Sep. 2005 ~ Sep. 2008
Title of the thesis: Structural aspects of bleaching and fluoride
application on dental enamel
Master student, Biological Medical Engineering, Sichuan University,
Chengdu, China
Sep. 2002 ~ Jul. 2005
Title of the thesis: Study on the biomechanics and biological sealing
of dental implants
Sep. 1997 ~ Jul. 2002 Bachelor student, Department of Dentistry, Zhengzhou University,
Zhengzhou, China
Publications (09. 2005 - 09. 2008):
Xiaojie Wang, Boriana Mihailova, Arndt Klocke, Lubomira Tosheva, Ulrich Bismayer (2008).
New insights into structural alteration of dental apatite induced by citric acid and sodium. J Phys
Chem B 112, 8840-8848.
Curriculum Vitae
97
Xiaojie Wang, Boriana Mihailova, Arndt Klocke, Ursula E.A. Fittschen, Stefanie Heidrich,
Mathias Hill, Rainer Stosch, Bernd Güttler, José A.C. Broekaert, Ulrich Bismayer (2008).
Side effects of a non-peroxide-based home bleaching agent on dental enamel. J Biomed
Mater Res A (in print).
Xiaojie Wang, Boriana Mihailova, Arndt Klocke, Stefanie Heidrich, Ulrich Bismayer (2008).
In vitro study on bleached enamel. Key Eng Mat 361-363:833-836.
Xiaojie Wang, Arndt Klocke, Boriana Mihailova, Rainer Stosch, Bernd Güttler, Ulrich
Bismayer (2007). Effect of bleaching on dental hard tissues: a Raman and IR spectroscopic
study. Key Eng Mat 330-332:1405-1408.
Ursula Fittschen, Nicole Monien, Mathias Hill, Boriana Mihailova, Xiaojie Wang, Arndt
Klocke, Ulrich Bismayer. Calcium leaching caused by tooth bleaching agents. Anal Bioanal
Chem (in submit).
Eidesstattliche Versicherung
98
Eidesstattliche Versicherung
Ich versichere ausdrücklich, dass ich die Arbeit selbständig und ohne fremde Hilfe verfasst,
andere als die von mir angegebenen Quellen und Hilfsmittel nicht benutzt und die aus den
benutzten Werken wörtlich oder inhaltlich entnommenen Stellen einzeln nach Ausgabe (Auflage
und Jahr des Erscheinens), Band und Seite des benutzten Werkes kenntlich gemacht habe.
Ferner versichere ich, dass ich die Dissertation bisher nicht einem Fachvertreter an einer anderen
Hochschule zur Überprüfung vorgelegt oder mich anderweitig um Zulassung zur Promotion
beworben habe.
Unterschrift: ..........................................