Embed Size (px)
Citation preview

Structure
Article
Structural Basis for Calmodulinas a Dynamic Calcium SensorMiao Zhang,1 Cameron Abrams,5 Liping Wang,1 Anthony Gizzi,1 Liping He,1 Ruihe Lin,1 Yuan Chen,1,6 Patrick J. Loll,4
John M. Pascal,3 and Ji-fang Zhang1,2,*1Department of Molecular Physiology and Biophysics2Farber Institute for Neurosciences and Graduate Program in Neuroscience3Department of Biochemistry
Jefferson Medical College, 1020 Locust Street, Philadelphia, PA 19107, USA4Department of Biochemistry and Molecular Biology, College of Medicine, Drexel University, Philadelphia, PA 19102, USA5Department of Chemical and Biological Engineering, Drexel University, Philadelphia, PA 19104, USA6Present address: Center of Neurosciences, Zhongshan Medical School of Sun Yat-sen University, 74 Zhongshan Road II Guangzhou,
Guangdong 510080, People’s Republic of China
*Correspondence: [email protected]
DOI 10.1016/j.str.2012.03.019
SUMMARY
Calmodulin is a prototypical and versatile Ca2+
sensor with EF hands as its high-affinity Ca2+ bindingdomains. Calmodulin is present in all eukaryoticcells, mediating Ca2+-dependent signaling. Uponbinding Ca2+, calmodulin changes its conformationto form complexes with a diverse array of target pro-teins. Despite a wealth of knowledge on calmodulin,little is known on how target proteins regulatecalmodulin’s ability to bind Ca2+. Here, we takeadvantage of two splice variants of SK2 channels,which are activated by Ca2+-bound calmodulin butshow different sensitivity to Ca2+ for their activation.Protein crystal structures and other experimentsshow that, depending on which SK2 splice variant itbinds to, calmodulin adopts drastically differentconformations with different affinities for Ca2+ at itsC-lobe. Such target protein-induced conformationalchanges make calmodulin a dynamic Ca2+ sensorcapable of responding to different Ca2+ concentra-tions in cellular Ca2+ signaling.
INTRODUCTION
As the prototypical Ca2+ sensor, calmodulin (CaM) is widely ex-
pressed in all eukaryotic cells, mediating a variety of cellular
signaling processes, including regulation of enzymatic activities,
modulation of ion channel activities, synaptic transmission and
plasticity, and regulation of gene expression (Clapham, 2007;
Deisseroth et al., 1998; Dick et al., 2008; Drum et al., 2002;
Halling et al., 2005; McLaughlin and Murray, 2005; Wayman
et al., 2008; Xia et al., 1998; Zuhlke et al., 1999). A diverse array
of target proteins has been identified, such as CaM kinases and
ion channels, which are known to interact with CaM with or
without Ca2+. CaM is also a versatile Ca2+ sensor, capable
of responding to a wide range of Ca2+ concentrations (10�12 M–
10�6 M) in Ca2+-dependent signal transduction (Chin and
Structure 20
Means, 2000). Four canonical EF hands, two located at the
CaM N terminus (N-lobe) and the other two at the C terminus
(C-lobe), serve as the high-affinity Ca2+ binding motifs (Meador
et al., 1992, 1993). The N- and C-lobes are connected by an
extremely flexible central linker region. EF hands at the C-lobe
are generally thought to have a higher affinity for Ca2+ than those
in the N-lobe (Andersson et al., 1983; Crouch and Klee, 1980).
Upon binding Ca2+, CaM changes its conformation from the
closed configuration to the open one, exposing the hydrophobic
surfaces within the N- and C-lobes for Ca2+-dependent interac-
tions with the target proteins (Chin and Means, 2000; Halling
et al., 2005; Hoeflich and Ikura, 2002; Ikura et al., 1992; Ishida
and Vogel, 2006; Kranz et al., 2002; Meador et al., 1992, 1993;
Schumacher et al., 2004). Additional conformational changes—
most noticeably, unwinding of the a helix of the CaM linker region
(R74 to E83) to various degrees—allow CaM to adopt different
conformations in its interactions with different target proteins,
ranging from the compact (collapsed) conformation to its full
extended conformation (Drum et al., 2002; Fallon and Quiocho,
2003; Ikura et al., 1992; Meador et al., 1992, 1993; Mori et al.,
2008; Van Petegem et al., 2005).
Such structural flexibility explains howCaM is capable of inter-
acting with target proteins with distinct structural features
(Halling et al., 2005; Ishida and Vogel, 2006). So far, most struc-
tural studies have focused on how binding of Ca2+ to CaM
exposes the hydrophobic surfaces for interaction with target
proteins. Despite a wealth of knowledge on CaM, much less is
known about howCaM’s affinity for Ca2+ is determined, in partic-
ular, how binding of CaMBDs can reciprocally affect CaM’s
conformations and, consequently, change CaM’s affinities for
Ca2+. It is generally thought that formation of CaM-target protein
complexes increases CaM’s affinity for Ca2+. Furthermore, it is
also less clear how regulation of CaM’s affinity for Ca2+ by target
proteins is achieved at the molecular level. This knowledge gap
is, in part, due to technical difficulties, such as the size limitation
of proteins used in nuclear magnetic resonance experiments or
the challenges of getting protein crystals of CaM complexed
with bigger target proteins. Consequently, short CaMBD pep-
tides (typically 15-mers to 30-mers) are often used in structural
studies, and they are often too short to produce any significant
impact on CaM’s conformations.
, 911–923, May 9, 2012 ª2012 Elsevier Ltd All rights reserved 911
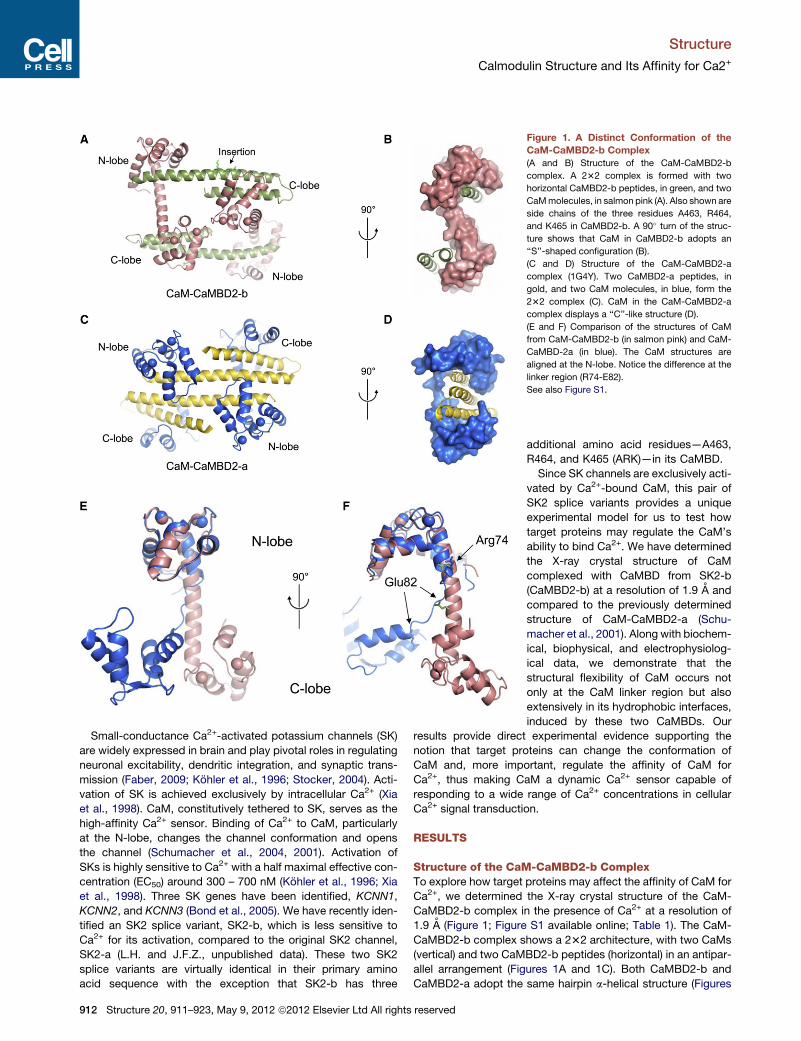
Figure 1. A Distinct Conformation of the
CaM-CaMBD2-b Complex
(A and B) Structure of the CaM-CaMBD2-b
complex. A 232 complex is formed with two
horizontal CaMBD2-b peptides, in green, and two
CaMmolecules, in salmon pink (A). Also shown are
side chains of the three residues A463, R464,
and K465 in CaMBD2-b. A 90� turn of the struc-
ture shows that CaM in CaMBD2-b adopts an
‘‘S’’-shaped configuration (B).
(C and D) Structure of the CaM-CaMBD2-a
complex (1G4Y). Two CaMBD2-a peptides, in
gold, and two CaM molecules, in blue, form the
232 complex (C). CaM in the CaM-CaMBD2-a
complex displays a ‘‘C’’-like structure (D).
(E and F) Comparison of the structures of CaM
from CaM-CaMBD2-b (in salmon pink) and CaM-
CaMBD-2a (in blue). The CaM structures are
aligned at the N-lobe. Notice the difference at the
linker region (R74-E82).
See also Figure S1.
Structure
Calmodulin Structure and Its Affinity for Ca2+
Small-conductance Ca2+-activated potassium channels (SK)
are widely expressed in brain and play pivotal roles in regulating
neuronal excitability, dendritic integration, and synaptic trans-
mission (Faber, 2009; Kohler et al., 1996; Stocker, 2004). Acti-
vation of SK is achieved exclusively by intracellular Ca2+ (Xia
et al., 1998). CaM, constitutively tethered to SK, serves as the
high-affinity Ca2+ sensor. Binding of Ca2+ to CaM, particularly
at the N-lobe, changes the channel conformation and opens
the channel (Schumacher et al., 2004, 2001). Activation of
SKs is highly sensitive to Ca2+ with a half maximal effective con-
centration (EC50) around 300 – 700 nM (Kohler et al., 1996; Xia
et al., 1998). Three SK genes have been identified, KCNN1,
KCNN2, and KCNN3 (Bond et al., 2005). We have recently iden-
tified an SK2 splice variant, SK2-b, which is less sensitive to
Ca2+ for its activation, compared to the original SK2 channel,
SK2-a (L.H. and J.F.Z., unpublished data). These two SK2
splice variants are virtually identical in their primary amino
acid sequence with the exception that SK2-b has three
912 Structure 20, 911–923, May 9, 2012 ª2012 Elsevier Ltd All rights reserved
additional amino acid residues—A463,
R464, and K465 (ARK)—in its CaMBD.
Since SK channels are exclusively acti-
vated by Ca2+-bound CaM, this pair of
SK2 splice variants provides a unique
experimental model for us to test how
target proteins may regulate the CaM’s
ability to bind Ca2+. We have determined
the X-ray crystal structure of CaM
complexed with CaMBD from SK2-b
(CaMBD2-b) at a resolution of 1.9 A and
compared to the previously determined
structure of CaM-CaMBD2-a (Schu-
macher et al., 2001). Along with biochem-
ical, biophysical, and electrophysiolog-
ical data, we demonstrate that the
structural flexibility of CaM occurs not
only at the CaM linker region but also
extensively in its hydrophobic interfaces,
induced by these two CaMBDs. Our
results provide direct experimental evidence supporting the
notion that target proteins can change the conformation of
CaM and, more important, regulate the affinity of CaM for
Ca2+, thus making CaM a dynamic Ca2+ sensor capable of
responding to a wide range of Ca2+ concentrations in cellular
Ca2+ signal transduction.
RESULTS
Structure of the CaM-CaMBD2-b ComplexTo explore how target proteins may affect the affinity of CaM for
Ca2+, we determined the X-ray crystal structure of the CaM-
CaMBD2-b complex in the presence of Ca2+ at a resolution of
1.9 A (Figure 1; Figure S1 available online; Table 1). The CaM-
CaMBD2-b complex shows a 232 architecture, with two CaMs
(vertical) and two CaMBD2-b peptides (horizontal) in an antipar-
allel arrangement (Figures 1A and 1C). Both CaMBD2-b and
CaMBD2-a adopt the same hairpin a-helical structure (Figures
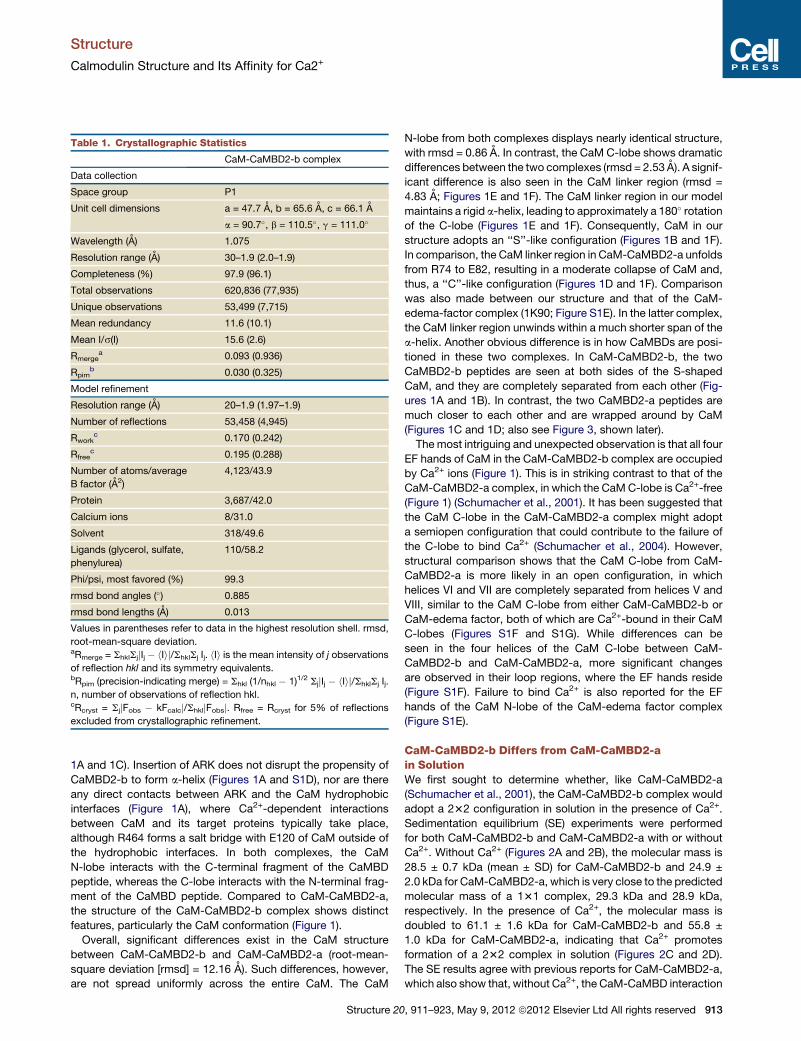
Table 1. Crystallographic Statistics
CaM-CaMBD2-b complex
Data collection
Space group P1
Unit cell dimensions a = 47.7 A, b = 65.6 A, c = 66.1 A
a = 90.7�, b = 110.5�, g = 111.0�
Wavelength (A) 1.075
Resolution range (A) 30–1.9 (2.0–1.9)
Completeness (%) 97.9 (96.1)
Total observations 620,836 (77,935)
Unique observations 53,499 (7,715)
Mean redundancy 11.6 (10.1)
Mean I/s(I) 15.6 (2.6)
Rmergea 0.093 (0.936)
Rpimb 0.030 (0.325)
Model refinement
Resolution range (A) 20–1.9 (1.97–1.9)
Number of reflections 53,458 (4,945)
Rworkc 0.170 (0.242)
Rfreec 0.195 (0.288)
Number of atoms/average
B factor (A2)
4,123/43.9
Protein 3,687/42.0
Calcium ions 8/31.0
Solvent 318/49.6
Ligands (glycerol, sulfate,
phenylurea)
110/58.2
Phi/psi, most favored (%) 99.3
rmsd bond angles (�) 0.885
rmsd bond lengths (A) 0.013
Values in parentheses refer to data in the highest resolution shell. rmsd,
root-mean-square deviation.aRmerge = ShklSjjIj � hIij/ShklSj Ij. hIi is the mean intensity of j observations
of reflection hkl and its symmetry equivalents.bRpim (precision-indicating merge) = Shkl (1/nhkl � 1)1/2 SjjIj � hIij/ShklSj Ij.
n, number of observations of reflection hkl.cRcryst = SjjFobs � kFcalcj/ShkljFobsj. Rfree = Rcryst for 5% of reflections
excluded from crystallographic refinement.
Structure
Calmodulin Structure and Its Affinity for Ca2+
1A and 1C). Insertion of ARK does not disrupt the propensity of
CaMBD2-b to form a-helix (Figures 1A and S1D), nor are there
any direct contacts between ARK and the CaM hydrophobic
interfaces (Figure 1A), where Ca2+-dependent interactions
between CaM and its target proteins typically take place,
although R464 forms a salt bridge with E120 of CaM outside of
the hydrophobic interfaces. In both complexes, the CaM
N-lobe interacts with the C-terminal fragment of the CaMBD
peptide, whereas the C-lobe interacts with the N-terminal frag-
ment of the CaMBD peptide. Compared to CaM-CaMBD2-a,
the structure of the CaM-CaMBD2-b complex shows distinct
features, particularly the CaM conformation (Figure 1).
Overall, significant differences exist in the CaM structure
between CaM-CaMBD2-b and CaM-CaMBD2-a (root-mean-
square deviation [rmsd] = 12.16 A). Such differences, however,
are not spread uniformly across the entire CaM. The CaM
Structure 20
N-lobe from both complexes displays nearly identical structure,
with rmsd = 0.86 A. In contrast, the CaM C-lobe shows dramatic
differences between the two complexes (rmsd = 2.53 A). A signif-
icant difference is also seen in the CaM linker region (rmsd =
4.83 A; Figures 1E and 1F). The CaM linker region in our model
maintains a rigid a-helix, leading to approximately a 180� rotationof the C-lobe (Figures 1E and 1F). Consequently, CaM in our
structure adopts an ‘‘S’’-like configuration (Figures 1B and 1F).
In comparison, the CaM linker region in CaM-CaMBD2-a unfolds
from R74 to E82, resulting in a moderate collapse of CaM and,
thus, a ‘‘C’’-like configuration (Figures 1D and 1F). Comparison
was also made between our structure and that of the CaM-
edema-factor complex (1K90; Figure S1E). In the latter complex,
the CaM linker region unwinds within a much shorter span of the
a-helix. Another obvious difference is in how CaMBDs are posi-
tioned in these two complexes. In CaM-CaMBD2-b, the two
CaMBD2-b peptides are seen at both sides of the S-shaped
CaM, and they are completely separated from each other (Fig-
ures 1A and 1B). In contrast, the two CaMBD2-a peptides are
much closer to each other and are wrapped around by CaM
(Figures 1C and 1D; also see Figure 3, shown later).
The most intriguing and unexpected observation is that all four
EF hands of CaM in the CaM-CaMBD2-b complex are occupied
by Ca2+ ions (Figure 1). This is in striking contrast to that of the
CaM-CaMBD2-a complex, in which the CaMC-lobe is Ca2+-free
(Figure 1) (Schumacher et al., 2001). It has been suggested that
the CaM C-lobe in the CaM-CaMBD2-a complex might adopt
a semiopen configuration that could contribute to the failure of
the C-lobe to bind Ca2+ (Schumacher et al., 2004). However,
structural comparison shows that the CaM C-lobe from CaM-
CaMBD2-a is more likely in an open configuration, in which
helices VI and VII are completely separated from helices V and
VIII, similar to the CaM C-lobe from either CaM-CaMBD2-b or
CaM-edema factor, both of which are Ca2+-bound in their CaM
C-lobes (Figures S1F and S1G). While differences can be
seen in the four helices of the CaM C-lobe between CaM-
CaMBD2-b and CaM-CaMBD2-a, more significant changes
are observed in their loop regions, where the EF hands reside
(Figure S1F). Failure to bind Ca2+ is also reported for the EF
hands of the CaM N-lobe of the CaM-edema factor complex
(Figure S1E).
CaM-CaMBD2-b Differs from CaM-CaMBD2-ain SolutionWe first sought to determine whether, like CaM-CaMBD2-a
(Schumacher et al., 2001), the CaM-CaMBD2-b complex would
adopt a 232 configuration in solution in the presence of Ca2+.
Sedimentation equilibrium (SE) experiments were performed
for both CaM-CaMBD2-b and CaM-CaMBD2-a with or without
Ca2+. Without Ca2+ (Figures 2A and 2B), the molecular mass is
28.5 ± 0.7 kDa (mean ± SD) for CaM-CaMBD2-b and 24.9 ±
2.0 kDa for CaM-CaMBD2-a, which is very close to the predicted
molecular mass of a 131 complex, 29.3 kDa and 28.9 kDa,
respectively. In the presence of Ca2+, the molecular mass is
doubled to 61.1 ± 1.6 kDa for CaM-CaMBD2-b and 55.8 ±
1.0 kDa for CaM-CaMBD2-a, indicating that Ca2+ promotes
formation of a 232 complex in solution (Figures 2C and 2D).
The SE results agree with previous reports for CaM-CaMBD2-a,
which also show that, without Ca2+, the CaM-CaMBD interaction
, 911–923, May 9, 2012 ª2012 Elsevier Ltd All rights reserved 913
CaM-CaMBD2-b (5 mM EGTA)
Radius (cm)
6.96 6.98 7.00 7.02 7.04 7.06 7.08 7.10 7.12
Abs
orba
nce
at 2
80 n
m
0.0
0.1
0.2
0.3
0.4
0.5
0.6
0.7
0.8
10000 rpm13000 rpm18000 rpm25000 rpm
resi
dual
s
-0.2
-0.1
0.0
0.1
0.2
CaM-CaMBD2-a (5 mM EGTA)
Radius (cm)
6.85 6.90 6.95 7.00 7.05 7.10
Abs
orba
nce
at 2
80 n
m
0.0
0.2
0.4
0.6
0.8
1.0
10000 rpm13000 rpm18000 rpm25000 rpm
resi
dual
s
-0.2
-0.1
0.0
0.1
0.2
A B
MW = 24.9 ± 2.04 kDaMW = 28.5 ± 0.7 kDa
CaM-CaMBD2-b (10 mM Ca2+)
Radius (cm)
6.94 6.96 6.98 7.00 7.02 7.04 7.06 7.08 7.10
Abs
orba
nce
at 2
80 n
m
0.0
0.2
0.4
0.6
0.8
1.0 10000 rpm13000 rpm18000 rpm25000 rpm
resi
dual
s
-0.2
-0.1
0.0
0.1
0.2
CaM-CaMBD2-a (10 mM Ca2+)
Radius (cm)
6.96 6.98 7.00 7.02 7.04 7.06 7.08 7.10 7.12
Abs
orba
nce
at 2
80 n
m
0.0
0.5
1.0
1.5
2.0
2.5
10000 rpm13000 rpm18000 rpm25000 rpm
resi
dual
s
-0.2
-0.1
0.0
0.1
0.2
C D
MW = 55.8 ± 1.04 kDaMW = 61.1 ± 1.62 kDa
Figure 2. Ca2+ Promotes Formation of a 232 Complex for Both CaM-CaMBD2-a and CaM-CaMBD2-b in Solution
(A and B) A 131 complex of CaM-CaMBD2-a and CaM-CaMBD2-b in the absence of Ca2+. Upper panels show raw SE data at different centrifugation speeds
(indicated with four different symbols). Curves indicate fit of the raw data to a single-component model using Sedphat. Lower panels show residuals of the fit.
Without Ca2+, both CaM-CaMBD2-a and CaM-CaMBD2-b are 131, with a predicted molecular mass of 28.9 kDa and 29.3 kDa, respectively.
(C and D) A 232 complex of CaM-CaMBD2-a and CaM-CaMBD2-b in the presence of Ca2+. Upper panels show raw SE data (symbols) with fit to a single-
component model (curves), and lower panels show residuals of the fit. Ca2+ promotes formation of a 232 complex for both CaM-CaMBD2-a and CaM-
CaMBD2-b with a predicted molecular mass of 57.8 kDa and 58.6 kDa, respectively.
Structure
Calmodulin Structure and Its Affinity for Ca2+
occurs at an interface different from that in the presence of Ca2+
(Schumacher et al., 2004; Schumacher et al., 2001).
We then turned our attention to whether both CaM complexes
might be different from each other when in solution. The struc-
tures predict that formation of the CaM-CaMBD2-b complex is
a much simpler process, involving primarily the interaction
between CaM and the CaMBD2-b peptide (Figure 3A). In con-
trast, formation of the CaM-CaMBD2-a complex includes not
only the CaM-CaMBD2-a interaction but also the extensive
914 Structure 20, 911–923, May 9, 2012 ª2012 Elsevier Ltd All rights
interactions along the longer helices of two CaMBD2-a
(Figure 3B). The interactions between two CaMBD2-a peptides
are quite substantial, with the total surface area of 1,208 A2,
compared to 1,174 A2 for the CaM-CaMBD2-a interaction at
the N-lobe and 1,149 A2 for the CaM-CaMBD2-a interaction
at the C-lobe. Thus, formation of the CaM-CaMBD2-a com-
plex in the presence of Ca2+ undergoes a thermodynamically
more complex process than that of the CaM-CaMBD2-b
complex.
reserved

A B
DC
CaM-CaMBD2-b CaM-CaMBD2-a
-40
-30
-20
-10
0
10
20
30
Site 1 Site 2ΔG
ΔH
-TΔ
S
(
kcal
/mol
)
CaM-CaMBD2-bCaM-CaMBD2-a
0.0 0.5 1.0 1.5 2.0
-30.00
-20.00
-10.00
0.00
10.00
CaMBD2-aCaMBD2-b
Molar Ratio
KC
al/M
ole
of In
ject
ant
Figure 3. Different Thermodynamic Profiles for CaM-CaMBD2-b and CaM-CaMBD2-a
(A) Surface representation of the CaM-CaMBD2-b complex. CaMBD2-b (in green) interacts with CaM (in salmon pink) only at both the N- and C-lobes. There is no
physical contact between the CaMBD2-b peptides.
(B) Surface representation of the CaM-CaMBD2-a complex. The CaMBD2-a peptides (in gold) form extensive contacts with CaM (in blue) as well as between
themselves.
(C) Results of ITC experiments. Ca2+-bound CaM was titrated into either CaMBD2-a or CaMBD2-b. For CaM-CaMBD2-a, a two-site model is required to fit the
data (smooth line). On the other hand, a single-site model can adequately fit the data, and use of the two-site model did not statistically improve the fitting.
(D) Thermodynamic profiles for formation of the CaM-CaMBD2-a and CaM-CaMBD2-b complexes. Plotted are the Gibbs free energy (DG), enthalpy (DH), and
entropy (�TDS) for formation of both CaM-CaMBD2-a and CaM-CaMBD2-b. DG is calculated from DH and TDS (Table S1), which were determined by ITC at
20�C (DG = DH � TDS).
See also Figure S2 and Table S1.
Structure
Calmodulin Structure and Its Affinity for Ca2+
Isothermal titration calorimetry (ITC) was used to examine the
thermodynamic profiles associated with formation of the 232
complex of CaM-CaMBD2-b or CaM-CaMBD2-a. For both
complexes, changes in heats becomeminuscule when themolar
ratio of CaM/CaMBD approaches 1, indicating that formation of
the 232 complex has been completed (Figures 3C and S2).
Formation of the CaM-CaMBD2-b complex shows a sigmoidal
relationship of the heat evolved versus the molar ratio of CaM/
CaMBD2-b, which is well modeled by a single-binding-site
isotherm (smooth curve; Figures 3C and S2; Table S1). In con-
trast, formation of the CaM-CaMBD2-a complex produces
a biphasic change in heats, which is best fitted by a two-
binding-site model (smooth curve; Figures 3C and S2;
Table S1). Analyses show that, for CaM-CaMBD2-a, the rising
phase is enthalpically favored (DH1 = �34.73 ± 0.96 kcal/mol),
whereas the declining phase is entropy driven (DS2 = 87.2 ±
1.98 cal/mol/K). Despite dramatic differences in DH and TDS,
the Gibbs free energy (DG) for formation of CaM-CaMBD2-a is
Structure 20
essentially the same as that of CaM-CaMBD2-b (Figure 3D).
Previous studies on other CaM complexes have shown that
CaM has the same affinity for different CaM-target proteins
despite differences in their thermodynamics for formation of
these CaM complexes (e.g., Frederick et al., 2007). Thus, in
the presence of Ca2+, formation of CaM-CaMBD2-a and CaM-
CaMBD2-b undergoes different thermodynamic processes (DH
and�TDS, respectively, in Figure 3D), indicating that, in solution,
these two CaM complexes are different from each other.
Furthermore, in the presence of Ca2+, CaM has essentially the
same affinities for both CaMBD2-a and CaMBD2-b (DG in
Figure 3D).
Structural Plasticity in the CaM Hydrophobic BindingInterfacesIn CaM-CaMBD2-b, the three additional amino acids, ARK, do
not directly interact with CaM at its hydrophobic interfaces
(Figure 1A). How can insertion of ARK in CaMBD2-b produce
, 911–923, May 9, 2012 ª2012 Elsevier Ltd All rights reserved 915

L476
L483
Q479L486
Q490L473
L480
Q476L483
Q487
A
B C
CaM-CaMBD2-b CaM-CaMBD2-a
BSA
(Å2 )
0
40
80
120CaMBD2-aCaMBD2-b
N-lobe
AAs of CaM in the 2a complex
AAs of CaM in the 2b complex
E Q R K L N D Q A N T L V D L A K T Q
M72M51 M51 F68
E54 E47 M36 L39 F19 T79 L18M51 P43 Q41 V35 K75 V35 L18 M76 A15
D50 D50 Q41 E54 L39 L32 M72 F19 A15 M72 E14E47 E54 E47 E47 Q41 M36 M51 K75 M36 F19 M71 L18 F12 F12 L18 E11
E47 E54 T44 E47 K75 Q41 M36 M51 K75 M36 F19 M71 D78 L18 F12 F12 L18 E11E47 D50 Q41 M71 L39 L32 M72 F19 A15 K75 F12
N42 K75 Q41 M36 K75 V35 F19 M76 E14P43 M51 L39 F68 K77 A15E47 F68 M72 D78 L18M51 M71
M72
472/469 490/487
Figure 4. Interactions of CaM and CaMBDs at the CaM N-Lobe
(A) Amino acid residues involved in formation of CaM-CaMBD2-b andCaM-CaMBD2-a with Ca2+. Buried surface area (BSA, bar graphs) identifies key residues in
CaMBD2-b andCaMBD2-a which interact with CaM. AC-terminal fragment, from E472/E469 to L491/L488, interacts with the CaMN-lobe. Insertion of ARK shifts
the numbering by three for CaMBD2-b. Also listed are CaM residues, in a smaller typeface, that are in contacts (within a 5 A radius) with individual CaMBD
residues. Shown in red are the CaM residues that only interact with key residues in CaMBD2-b. CaM residues in cyan form contacts only with CaMBD2-a. CaM
residues in a black bold typeface interact with both.
(B and C) Hydrophobic interfaces of the CaMN-lobe in complex with CaMBD2-b (B) or CaMBD2-a (C). Overlaid are key residues from CaMBD2-b or CaMBD2-a.
Both N-lobes are aligned from L4 to R74, with rmsd = 0.86 A, to create the graphs.
See also Figure S3.
Structure
Calmodulin Structure and Its Affinity for Ca2+
such a dramatic impact on the CaM conformation? Typically,
a complete a-helical turn requires 3.6 amino acid residues. Inser-
tion of ARK produces less than one full a-helical turn (60� less)
and therefore alters how CaM interacts with CaMBD2-b. Upon
binding Ca2+, CaM undergoes conformational changes and
exposes the hydrophobic surfaces in both its N- and C-lobes
that interact with target proteins (Chin and Means, 2000; Halling
et al., 2005; Hoeflich and Ikura, 2002; Ishida and Vogel, 2006).
Extensive structural analysis was performed to identify amino
acid residues involved in formation of the CaM-CaMBD2-b and
CaM-CaMBD2-a complexes.
Two peptide fragments in both CaMBD2-a and CaMBD2-b
interact with the CaM hydrophobic surfaces: Fragment E469/
E472 to L488/L491 (insertion of ARK shifts numbering by 3 in
CaMBD2-b) interacts with the CaM N-lobe, and fragment R419
to L440 forms contacts with the CaM C-lobe. Figures 4 and 5
show the plots of buried surface area (BSA) for CaMBD residues
in their interactions with CaM (bar graphs in Figures 4A and 5A),
as well as lists of CaM residues, within a 5-A radius of each
CaMBD residue, that are in contact with these CaMBD residues.
L480/L483, with the highest BSA, serves as the anchor residue,
which interacts with the hydrophobic pocket in the N-lobe. The
916 Structure 20, 911–923, May 9, 2012 ª2012 Elsevier Ltd All rights
corresponding anchor residue interacting with the CaM C-lobe
is L428. Clearly, the same set of key residues in CaMBD interacts
with CaM in formation of both CaM-CaMBD2-b and CaM-
CaMBD2-a.
The hydrophobic interfaces in the CaM N- and C-lobes that
interact with target proteins are formed by amino acid residues,
particularly methionines, from all four helices of each lobe.
Hydrophobic pockets, which harbor the anchor residues from
CaMBD, are thought to consist primarily of FLMM, F19, L32,
M51, and M71 at the N-lobe and F92, L105, M124, and M144
at the C-lobe (Ataman et al., 2007). In both CaM-CaMBD2-a
and CaM-CaMBD2-b, the hydrophobic pocket at the N-lobe is
made primarily of F19, L32, M36, and M51 (Figure 3A). Overall,
a similar set of CaM residues contributes to formation of the
hydrophobic interface at the N-lobe to interact with CaMBD2-b
or CaMBD2-a in the presence of Ca2+. The CaM N-lobe hydro-
phobic interfaces from CaM-CaMBD2-b and CaM-CaMBD2-a
share similar surface topology (Figures 4B, 4C, and S3).
The hydrophobic surfaces in the CaM C-lobe vary greatly
between the CaM-CaMBD2-b and CaM-CaMBD2-a complexes,
and there is very little overlap between the CaM residues that
contact a given target amino acid residue from CaMBD2-a or
reserved
2 )
0
40
80
120
CaMBD2-aCaMBD2-b
C-lobe
AAs of CaM in the 2a complex
AAs of CaM in the 2b complex
R V K N A A A N V L R E T W L I Y K N T K L
M145M144 M145 F92Q143 M144 V91I130 E127 F141T146 L112 A88A128 M144 M124 L105M145 M109 E87 E114 L112 V91
E127 E127 M124M144 L116 F92 M144 F92 E84 E84 L112 V91 E84 L112 M111 E87
N42 V91 V91 L112 A88 F92 L112 I85 I85 M109 E114 I85 L116 L116 E127 E123 M144 E127F92 G113 V91 V108G113 A88 A88 E114 M145E120 E120 M144 M145L112 F92 M109E114 F89 K115 E123 M145 T146
L112K115 F92 L116 M124 A147G113 L105 E127
M109 M145M124
419 440
K421
L428
R429
W432
Y435
K421
L428
R429
W432
Y435
CaM-CaMBD2-b CaM-CaMBD2-a
A
B C
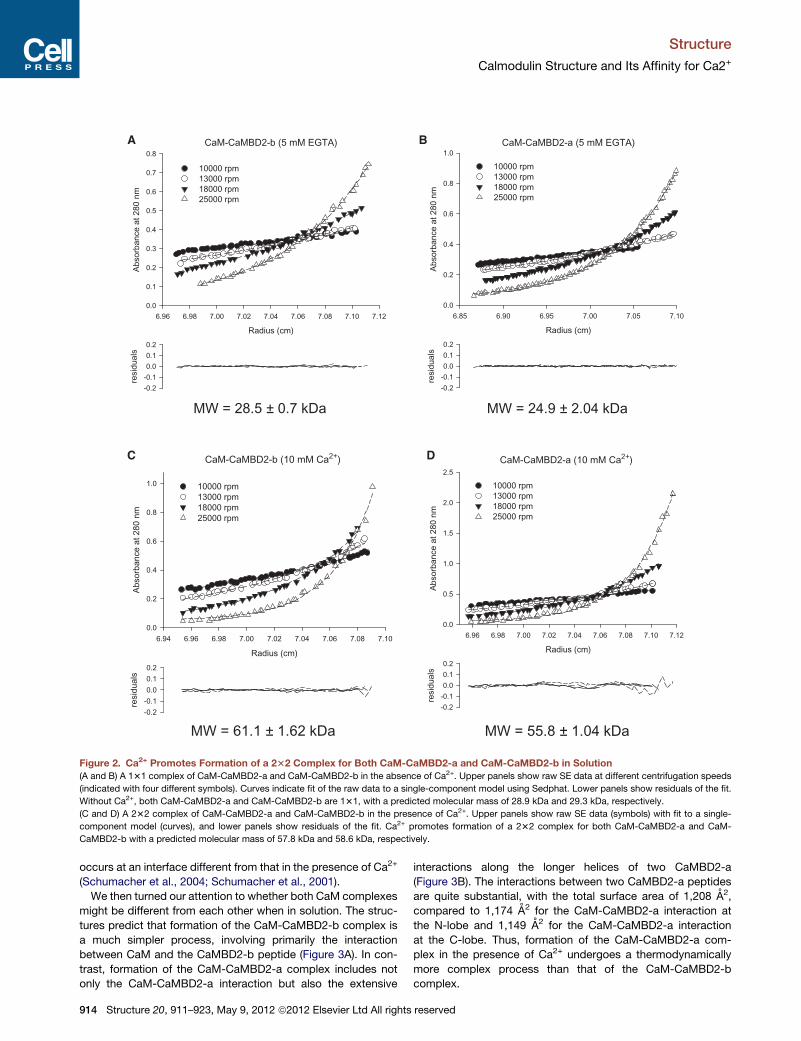
Figure 5. Interactions of CaM and CaMBDs at the CaM C-Lobe
(A) Amino acid residues involved in formation of CaM-CaMBD2-b and CaM-CaMBD2-a in the presence of Ca2+, similar to descriptions in Figure 3. An N-terminal
fragment, from R419 to L440, interacts with the CaM C-lobe.
(B and C) Hydrophobic interfaces of the CaM C-lobe in complex with CaMBD2-b (B) or CaMBD2-a (C). Both C-lobes are aligned from I85 to T146, with
rmsd = 2.53 A, to create the graphs.
See also Figure S4.
Structure
Calmodulin Structure and Its Affinity for Ca2+
CaMBD2-b (Figure 5A). In the CaM-CaMBD2-b complex, the
CaM C-lobe hydrophobic pocket includes F92, L105, F141,
M144, and M145, while the corresponding hydrophobic pocket
in CaM-CaMBD2-a is made up of I85, A88, F89, F92, L105,
V108, M109, and M124 (Figures S4A and S4B). Consequently,
the location of the hydrophobic pocket at the C-lobe changes
significantly (Figures 5B and 5C). Another example is the hydro-
phobic surface for W432 from CaMBD, which interacts primarily
with helix V in CaM-CaMBD2-b instead of helix VII in CaM-
CaMBD2-a (Figures S4C and S4D). Thus, substantial rearrange-
ment of the CaM C-lobe hydrophobic interface takes place,
depending on which CaMBD is complexed with CaM.
Effects of CaM Target Proteins on the Conformationof Individual EF Hands in CaMComparison of the structures of two CaM complexes demon-
strates that both CaMBD2-b and CaMBD2-a produce significant
impact on the conformation of CaM, in particular, rearrangement
of the hydrophobic interface at the C-lobe. In contrast, such
rearrangement of the hydrophobic interface is minimal at the
N-lobe. We next sought to determine whether rearrangement
of the hydrophobic interfaces in the CaM C-lobe affects the
conformation of the EF hands, which might provide explanations
as to why the CaM C-lobe of the CaM-CaMBD2-a complex fails
to bindCa2+. A canonical EF hand includes six Ca2+-coordinating
Structure 20
amino acid residues, located in the loop region and arranged as
follows: 1(+X), 3(+Y), 5(+Z), 7(�X), 9(�Y), and 12(�Z) (Figure S5)
(Gifford et al., 2007).
In Figure 6, the loop region of each CaM EF hand in our
structure is superimposed and compared to that of the CaM-
CaMBD2-a or CaM-edema factor complex. For the N-lobe,
where EF hands bind Ca2+ ions in both CaM-CaMBD2-a and
CaM-CaMBD2-b, the loop structure matches well for both EF
hand 1 (rmsd = 0.26 A) and EF hand 2 (rmsd = 0.46 A; Figure 6A).
On the other hand, EF hand 3 and EF hand 4 of the CaM
C-lobe display significant structural differences between CaM-
CaMBD2b and CaM-CaMBD2-a (rmsds = 1.28 A and 1.67 A,
respectively) (Figure 6B). If the comparison includes side chains,
the differences become even more significant, with rmsds of
1.96 A for EF hand 3 and 2.46 A for EF hand 4. The most signif-
icant differences lie with the glutamate residue at position 12(�Z)
of the EF hand, E104 and E140 (Figure 6B). In CaM-CaMBD2-a,
both E104 and E140 point away from the Ca2+ coordination
sphere. Significant differences are also observed at position
1(+X), D93 and D129, and at position 3(+Z), D95 and D131. Anal-
ysis shows that the structural differences at EF hand 3 and EF
hand 4 are not caused by crystal packing.
We further compared the structures of EF hands in CaM-
CaMBD2-b to those of the CaM-edema factor complex (1K90),
which fail to bind Ca2+ at the CaM N-lobe (Drum et al., 2002).
, 911–923, May 9, 2012 ª2012 Elsevier Ltd All rights reserved 917

Figure 6. Conformational Plasticity of the
CaM EF Hands
(A and B) Structures of EF hands from CaM-
CaMBD2-b (in salmon pink) and CaM-CaMBD2-
a (in blue). EF hands 1 and 2 are aligned from D20
to E31 and D56 to E67, respectively. EF hands 3
and 4 are aligned from D93 to E104 and D129 to
E140, respectively. Side chains at positions 7 and
9 are not shown.
(C and D) Structures of EF hands from CaM-
CaMBD2-b (in salmon pink) and the CaM-edema
factor (1K90, in pale cyan). Significant differences
exist in the structures of EF hands 1 and 2 but not
EF hands 3 and 4. Side chains at positions 7 and 9
are not shown.
See also Figure S5.
Structure
Calmodulin Structure and Its Affinity for Ca2+
As expected, the conformation of EF hand 1 and EF hand 2 in
1K90 is dramatically different from that of our structure (rmsds =
2.08 A and 1.68 A, respectively) (Figure 6C). Several key residues
in both EF hand 1 and EF hand 2 of 1K90 show significantly
altered spatial orientations, including D24, E31, D56, and D58.
On the other hand, there is little difference at EF hand 3 and EF
hand 4 of the CaM C-lobe between CaM-CaMBD2-b and
the CaM-edema factor complex (Figure 6D). Thus, in CaM-
CaMBD2-a, failure of binding to Ca2+ at the CaM C-lobe results
primarily from altered conformations of EF hand 3 and EF hand 4
as a consequence of rearrangement of helices V, VI, VII, and VIII.
CaMBD2-b, on the other hand, interacts with a different hydro-
phobic interface at the CaM C-lobe and restores the ability of
EF hand 3 and EF hand 4 to bind Ca2+.
CaM as a Dynamic Ca2+ SensorOur recent work has shown that SK2-b is less sensitive to Ca2+
for its activation (L.H. and J.F.Z., unpublished data). While
differences in structures between the two CaM complexes
may provide a plausible explanation, structures alone cannot
rule out other potential scenarios. Binding assays were per-
formed using AEDANS-labeled CaM(T34C or T110C), and
CaMBD2-a or CaMBD2-b at different Ca2+ concentrations to
examine the interactions between CaM and CaMBDs. The fluo-
rescence emission intensity increases with Ca2+ concentrations
in formation of both the CaM-CaMBD2-a and CaM-CaMBD2-
b complexes (Figure S6). There is, however, a significant right-
ward shift of the dose-response curve for the Ca2+-dependent
formation of the CaM-CaMBD2-b complex (Figure 7A). The
apparent Kd for Ca2+ is increased from 0.53 ± 0.04 mM (n = 7)
for formation of CaM-CaMBD2-a to 1.18 ± 0.10 mM (n = 4)
for that of CaM-CaMBD2-b (p < 0.001, Figure 7B); this
suggests that CaM, when complexed with CaMBD2-b, may
have reduced its affinity for Ca2+. The Hill coefficient is 1.13 ±
0.04 (n = 7) for CaM-CaMBD2-a and 2.05 ± 0.18 (n = 4)
for CaM-CaMBD2-b. Identical results were obtained with
CaM(T110C).
918 Structure 20, 911–923, May 9, 2012 ª2012 Elsevier Ltd All rights reserved
However, such a shift in Ca2+-depen-
dent formation of the CaM-CaMBD2-
b complex could also result from a reduc-
tion of the affinity of Ca2+-bound CaM
for CaMBD2-b (Figure S6A). Additional
binding assays were performed to test such a possibility with
or without Ca2+. At a saturating Ca2+ concentration of 10 mM (Fig-
ure 7A), the fluorescence intensity of CaM(T34C) increases with
the peptide concentrations of both CaMBD2-a and CaMBD2-b
(Figure 7C). There is no difference in the EC50 for formation of
either CaM-CaMBD2-a (0.15 ± 0.02 mM) or CaM-CaMBD2-b
(0.18 ± 0.01 mM; n = 3, p = 0.318), suggesting that CaM, once
Ca2+-bound, has the same affinity for both CaMBD2-a and
CaMBD2-b (Figure 7E). Identical results were obtained with
CaM(T110C) instead of CaM(T34C) (data not shown). The results
are consistent with our ITC data that, with saturating Ca2+, CaM
has the same affinity for CaMBD2-a and CaMBD2-b. Addi-
tional binding assays were performed at the Ca2+ concentration
of 0.3 mM to further evaluate the affinity of CaM for CaMBD2-b.
The fluorescence intensity of CaM(T34C) increases with
CaMBD2-a, with an EC50 of 0.72 ± 0.09 mM, (n = 3; Figure 7E).
In contrast, the CaMBD2-b peptide produces little change in
the fluorescence intensity, as though there is little or no interac-
tion between CaM and CaMBD2-b (Figure 7D). Identical results
were obtained CaM(T110C). Finally, when the same binding
assays were repeated without Ca2+, dose-dependent changes
in the fluorescence intensity with CaMBD2-b were observed
with CaM(T110C) but not with CaM(T34C). CaM has the same
EC50 for both CaMBD2-a and CaMBD2-b (data not shown). In
the presence of Ca2+, we never observed differential results
using CaM(T34C) or CaM(T110C). This led us to conclude that
increased fluorescence intensity in the presence of Ca2+ results
from formation of a stable 232 complex, consistent with the SE
data (Figure 2).
Collectively, the results of binding assays are consistent with
the model that CaM, when complexed with CaMBD2-b, has a
reduced affinity for Ca2+. In principle, a reduction in Ca2+ affinity
at either theN-orC-lobewill causea right shift ofCa2+-dependent
formationof theCaM-CaMBD2-bcomplex (Figure 7A).Computer
modeling using molecular dynamics (MD) was performed to test
whether the CaM N- and C-lobes in CaM-CaMBD2-b might
have different affinities for Ca2+. Thermodynamic integration
Ca2+ (μM)
0.01 0.1 1 10
Nor
mal
ized
ΔF
(%
)
0
20
40
60
80
100 CaM(T34C) + CaMBD2-aCaM(T34C) + CaMBD2-b
A B
DC
CaM-CaMBD2-a CaM-CaMBD2-b
App
aren
t Kd
(μM
)
0.0
0.2
0.4
0.6
0.8
1.0
1.2
1.4
Peptide (μM)
0.001 0.01 0.1 1 10
Flu
ores
cenc
e In
tens
ity (
a.u.
)
4000
5000
6000
7000
CaM(T34C) + CaMBD2-a + 10 μM Ca2+
CaM(T34C) + CaMBD2-b + 10 μM Ca2+
Peptide (μM)
0.001 0.01 0.1 1 10
Flu
ores
cenc
e In
tens
ity (
a.u.
)
3000
4000
5000
6000
CaM(T34C) + CaMBD2-a + 0.3 μM Ca2+
CaM(T34C) + CaMBD2-b + 0.3 μM Ca2+
CaMBD2-a CaMBD2-b CaMBD2-a CaMBD2-b
EC
50 (μM
)
0.0
0.2
0.4
0.6
SK2-a SK2-b
EC
50 (μM
)
0.0
0.2
0.4
0.6
0.8
1.0
1.2
p < 0.00110 μM Ca2+
0.3 μM Ca2+
N.D.
FE
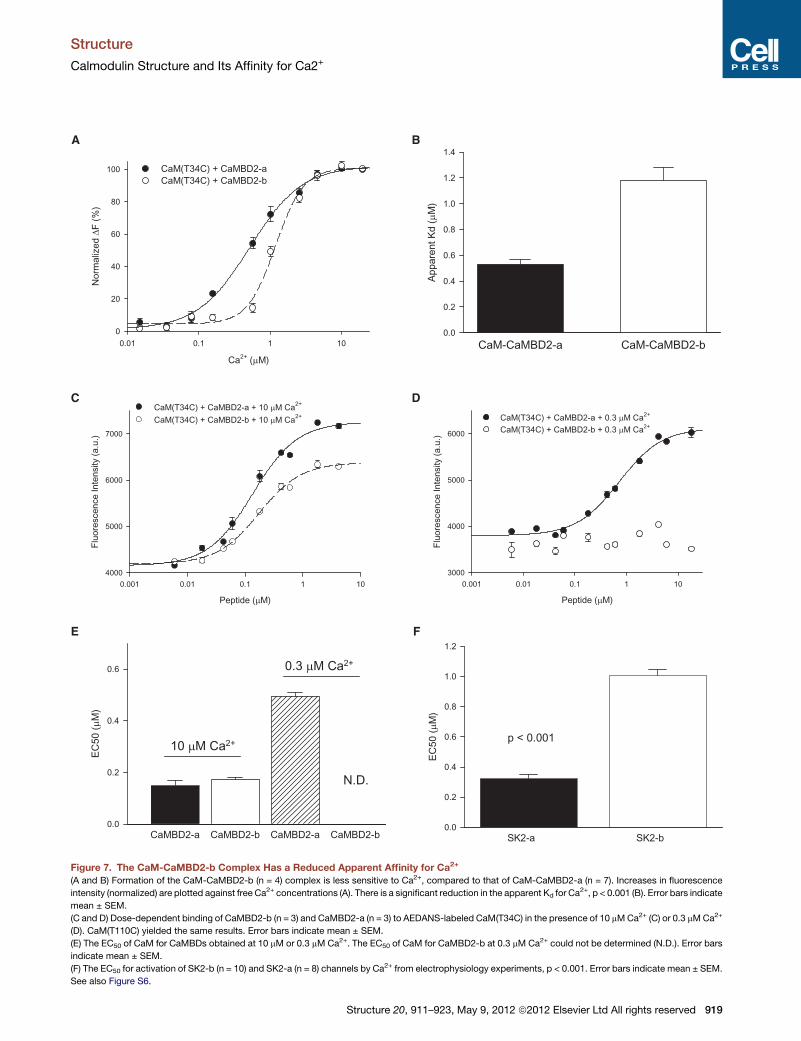
Figure 7. The CaM-CaMBD2-b Complex Has a Reduced Apparent Affinity for Ca2+
(A and B) Formation of the CaM-CaMBD2-b (n = 4) complex is less sensitive to Ca2+, compared to that of CaM-CaMBD2-a (n = 7). Increases in fluorescence
intensity (normalized) are plotted against free Ca2+ concentrations (A). There is a significant reduction in the apparent Kd for Ca2+, p < 0.001 (B). Error bars indicate
mean ± SEM.
(C and D) Dose-dependent binding of CaMBD2-b (n = 3) and CaMBD2-a (n = 3) to AEDANS-labeled CaM(T34C) in the presence of 10 mMCa2+ (C) or 0.3 mMCa2+
(D). CaM(T110C) yielded the same results. Error bars indicate mean ± SEM.
(E) The EC50 of CaM for CaMBDs obtained at 10 mM or 0.3 mM Ca2+. The EC50 of CaM for CaMBD2-b at 0.3 mM Ca2+ could not be determined (N.D.). Error bars
indicate mean ± SEM.
(F) The EC50 for activation of SK2-b (n = 10) and SK2-a (n = 8) channels by Ca2+ from electrophysiology experiments, p < 0.001. Error bars indicate mean ± SEM.
See also Figure S6.
Structure
Calmodulin Structure and Its Affinity for Ca2+
Structure 20, 911–923, May 9, 2012 ª2012 Elsevier Ltd All rights reserved 919
A
B
2 Ca2+ 2 Ca2+
2 Ca2+
K1N
K1N
K1C
CaM in the CaMBD2-a complex
CaM in the CaMBD2-b complex
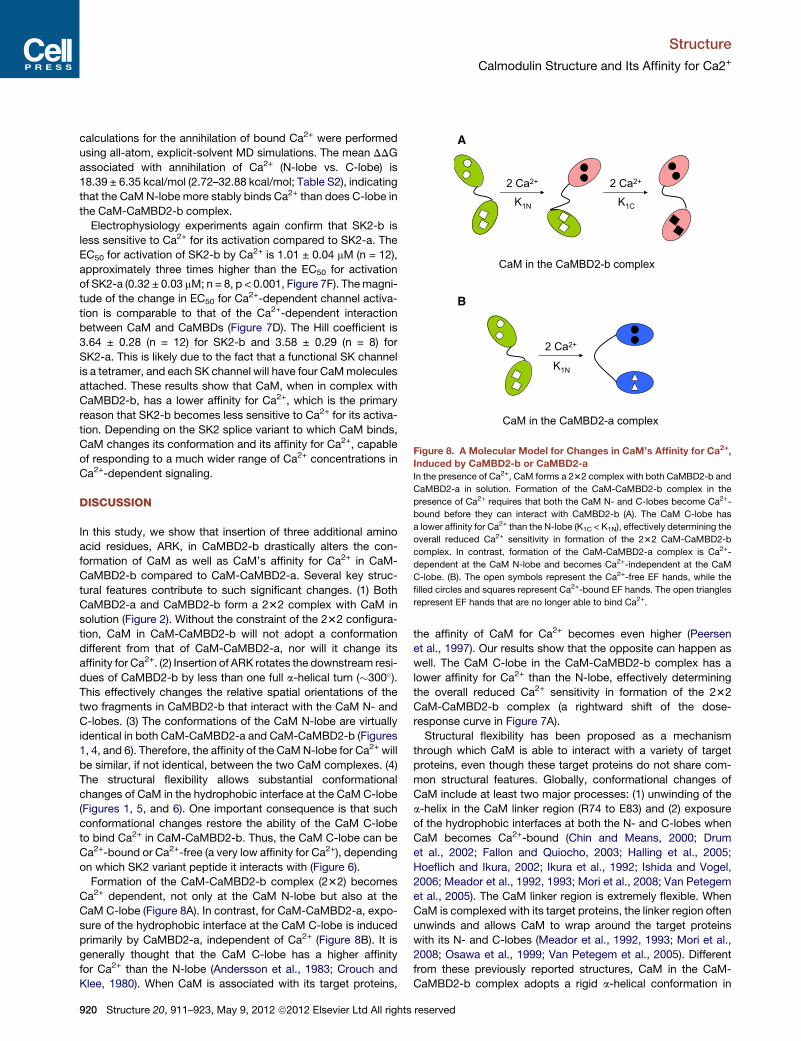
Figure 8. A Molecular Model for Changes in CaM’s Affinity for Ca2+,
Induced by CaMBD2-b or CaMBD2-a
In the presence of Ca2+, CaM forms a 232 complex with both CaMBD2-b and
CaMBD2-a in solution. Formation of the CaM-CaMBD2-b complex in the
presence of Ca2+ requires that both the CaM N- and C-lobes become Ca2+-
bound before they can interact with CaMBD2-b (A). The CaM C-lobe has
a lower affinity for Ca2+ than the N-lobe (K1C < K1N), effectively determining the
overall reduced Ca2+ sensitivity in formation of the 232 CaM-CaMBD2-b
complex. In contrast, formation of the CaM-CaMBD2-a complex is Ca2+-
dependent at the CaM N-lobe and becomes Ca2+-independent at the CaM
C-lobe. (B). The open symbols represent the Ca2+-free EF hands, while the
filled circles and squares represent Ca2+-bound EF hands. The open triangles
represent EF hands that are no longer able to bind Ca2+.
Structure
Calmodulin Structure and Its Affinity for Ca2+
calculations for the annihilation of bound Ca2+ were performed
using all-atom, explicit-solvent MD simulations. The mean DDG
associated with annihilation of Ca2+ (N-lobe vs. C-lobe) is
18.39 ± 6.35 kcal/mol (2.72–32.88 kcal/mol; Table S2), indicating
that the CaM N-lobe more stably binds Ca2+ than does C-lobe in
the CaM-CaMBD2-b complex.
Electrophysiology experiments again confirm that SK2-b is
less sensitive to Ca2+ for its activation compared to SK2-a. The
EC50 for activation of SK2-b by Ca2+ is 1.01 ± 0.04 mM (n = 12),
approximately three times higher than the EC50 for activation
of SK2-a (0.32 ± 0.03 mM; n = 8, p < 0.001, Figure 7F). Themagni-
tude of the change in EC50 for Ca2+-dependent channel activa-
tion is comparable to that of the Ca2+-dependent interaction
between CaM and CaMBDs (Figure 7D). The Hill coefficient is
3.64 ± 0.28 (n = 12) for SK2-b and 3.58 ± 0.29 (n = 8) for
SK2-a. This is likely due to the fact that a functional SK channel
is a tetramer, and each SK channel will have four CaMmolecules
attached. These results show that CaM, when in complex with
CaMBD2-b, has a lower affinity for Ca2+, which is the primary
reason that SK2-b becomes less sensitive to Ca2+ for its activa-
tion. Depending on the SK2 splice variant to which CaM binds,
CaM changes its conformation and its affinity for Ca2+, capable
of responding to a much wider range of Ca2+ concentrations in
Ca2+-dependent signaling.
DISCUSSION
In this study, we show that insertion of three additional amino
acid residues, ARK, in CaMBD2-b drastically alters the con-
formation of CaM as well as CaM’s affinity for Ca2+ in CaM-
CaMBD2-b compared to CaM-CaMBD2-a. Several key struc-
tural features contribute to such significant changes. (1) Both
CaMBD2-a and CaMBD2-b form a 232 complex with CaM in
solution (Figure 2). Without the constraint of the 232 configura-
tion, CaM in CaM-CaMBD2-b will not adopt a conformation
different from that of CaM-CaMBD2-a, nor will it change its
affinity for Ca2+. (2) Insertion of ARK rotates the downstream resi-
dues of CaMBD2-b by less than one full a-helical turn (�300�).This effectively changes the relative spatial orientations of the
two fragments in CaMBD2-b that interact with the CaM N- and
C-lobes. (3) The conformations of the CaM N-lobe are virtually
identical in both CaM-CaMBD2-a and CaM-CaMBD2-b (Figures
1, 4, and 6). Therefore, the affinity of the CaMN-lobe for Ca2+ will
be similar, if not identical, between the two CaM complexes. (4)
The structural flexibility allows substantial conformational
changes of CaM in the hydrophobic interface at the CaM C-lobe
(Figures 1, 5, and 6). One important consequence is that such
conformational changes restore the ability of the CaM C-lobe
to bind Ca2+ in CaM-CaMBD2-b. Thus, the CaM C-lobe can be
Ca2+-bound or Ca2+-free (a very low affinity for Ca2+), depending
on which SK2 variant peptide it interacts with (Figure 6).
Formation of the CaM-CaMBD2-b complex (232) becomes
Ca2+ dependent, not only at the CaM N-lobe but also at the
CaM C-lobe (Figure 8A). In contrast, for CaM-CaMBD2-a, expo-
sure of the hydrophobic interface at the CaM C-lobe is induced
primarily by CaMBD2-a, independent of Ca2+ (Figure 8B). It is
generally thought that the CaM C-lobe has a higher affinity
for Ca2+ than the N-lobe (Andersson et al., 1983; Crouch and
Klee, 1980). When CaM is associated with its target proteins,
920 Structure 20, 911–923, May 9, 2012 ª2012 Elsevier Ltd All rights
the affinity of CaM for Ca2+ becomes even higher (Peersen
et al., 1997). Our results show that the opposite can happen as
well. The CaM C-lobe in the CaM-CaMBD2-b complex has a
lower affinity for Ca2+ than the N-lobe, effectively determining
the overall reduced Ca2+ sensitivity in formation of the 232
CaM-CaMBD2-b complex (a rightward shift of the dose-
response curve in Figure 7A).
Structural flexibility has been proposed as a mechanism
through which CaM is able to interact with a variety of target
proteins, even though these target proteins do not share com-
mon structural features. Globally, conformational changes of
CaM include at least two major processes: (1) unwinding of the
a-helix in the CaM linker region (R74 to E83) and (2) exposure
of the hydrophobic interfaces at both the N- and C-lobes when
CaM becomes Ca2+-bound (Chin and Means, 2000; Drum
et al., 2002; Fallon and Quiocho, 2003; Halling et al., 2005;
Hoeflich and Ikura, 2002; Ikura et al., 1992; Ishida and Vogel,
2006; Meador et al., 1992, 1993; Mori et al., 2008; Van Petegem
et al., 2005). The CaM linker region is extremely flexible. When
CaM is complexed with its target proteins, the linker region often
unwinds and allows CaM to wrap around the target proteins
with its N- and C-lobes (Meador et al., 1992, 1993; Mori et al.,
2008; Osawa et al., 1999; Van Petegem et al., 2005). Different
from these previously reported structures, CaM in the CaM-
CaMBD2-b complex adopts a rigid a-helical conformation in
reserved
Structure
Calmodulin Structure and Its Affinity for Ca2+
its linker region (Figure 1). Such an extended conformation of
CaM has been reported in other CaM complexes (Larsson
et al., 2001; Rodrıguez-Castaneda et al., 2010).
Once Ca2+-bound, CaM undergoes significant conformational
changes in the N- and C-lobes, adopting an open mode config-
uration that exposes the hydrophobic interfaces for interactions
with the target proteins (Chin and Means, 2000; Halling et al.,
2005; Hoeflich and Ikura, 2002; Ishida and Vogel, 2006; Meador
et al., 1992, 1993; Schumacher et al., 2004). This Ca2+-
dependent transition from the closed mode to the open mode
is key to Ca2+-dependent interaction between CaM and CaM
target proteins. The consensus is that exposure of the CaM
hydrophobic interface results from binding of Ca2+ to the EF
hands at both the CaM N- and C-lobes. On the other hand, the
CaM C-lobe in CaM-CaMBD2-a fails to bind Ca2+ but never-
theless is able to expose its hydrophobic interface for its interac-
tion with CaMBD2-a. This Ca2+-independent interaction is
achieved through the semiopen conformation, particularly at
the CaM C-lobe (Chagot and Chazin, 2011; Swindells and Ikura,
1996; Urbauer et al., 1995). Our work shows that the hydro-
phobic interface at the CaM C-lobe can be made of almost
entirely different sets of amino acid residues, even though the
interacting amino acids on CaMBD remain the same (Figures 4
and 5), again demonstrating the structure plasticity of CaM in
mediating Ca2+-dependent signaling.
CaM is a dynamic Ca2+ sensor, capable of responding to a
wide range of Ca2+ concentrations (e.g., 10�12 M–10�6 M) in
Ca2+-dependent cellular signaling (Chin and Means, 2000).
Previous work on CaM-target protein complexes often used
short CaMBD peptides. While valuable information has been
obtained, one disadvantage of using short CaMBD peptides is
that the interactions between CaM and CaMBD are greatly
simplified, especially the lack of the effects of the target proteins
on the conformation of CaM. The results of this study, together
with the work on CaM-CaMBD2-a (1G4Y) and CaM-edema
factor (1K90), demonstrate that target proteins have significant
impact not only on the CaM’s structure but, more important,
on CaM’s affinity for Ca2+. For instance, CaM in the CaM-
CaMBD2-a complex has lost its ability to bind Ca2+ at its
C-lobe, while CaM in the CaM-CaMBD2-b has restored its ability
to bind Ca2+ at its C-lobe. CaM in the CaM-edema factor com-
plex fails to bind Ca2+ at its N-lobe (Drum et al., 2002). Thus,
target proteins can drastically decrease, not just increase, the
affinity of CaM for Ca2+. Thus, changes in CaM’s conformations,
induced by target proteins, provide an additional mechanism
that allows CaM to respond to Ca2+ signals of different strength,
as observed in local versus global Ca2+ sensing at sites of Ca2+
entry into the cytoplasm (Dick et al., 2008; Tadross et al., 2008).
EXPERIMENTAL PROCEDURES
Protein Expression and Purification
Rat CaM cDNA was cloned into pET-28b (Novagen), expressed in Escherichia
coli strain Rosetta2(DE3) (Novagen), and purified using a low substitution
phenyl sepharose fast flow column and an AKTA purifier (GE Healthcare).
The codons of the CaMBD2-b were optimized for expression in E. coli, and
the synthetic gene was cloned into pET-28b. The sequence of the CaMBD2-b
(including the His-tag) used for expression is as follows: MDTQLTKRVK
NAAANVLRETWLIYKNTKLVKKIDHAKVRKHQRKFLQAIHQARKLRSVKMEQR
KLNDQANTLVDLAKTQLEHHHHHH. This C-terminal His-tag fusion protein
Structure 20
fragment was expressed, solubilized with 0.2% w/v sarkosyl, and purified on
a nickel column (QIAGEN). Both CaM and CaMBD were subsequently purified
using a Sephacryl S-100 high-resolution gel filtration column (GE Healthcare).
The protein complexwas formed by slowly adding the CaMBD2-b to CaM. The
complex was then purified using the gel filtration column (GE Healthcare)
pre-equilibrated in a solution with 10 mM Tris-HCl, 50 mM NaCl, and 10 mM
CaCl2 (pH 7.5). Fractions were collected and concentrated to 3 mM. Protein
concentrations were determined by predicted extinction coefficients.
Crystallization and Structure Determination
Please see the Supplemental Experimental Procedures for details.
Sedimentation Equilibrium
SE experiments were performed as previously described (Schumacher
et al., 2001). Briefly, for SE analysis of the complexes in the presence
of Ca2+, both protein complexes were dialyzed into a solution with 50 mM
NaCl, 10 mM Tris, and 10 mMCaCl2, pH 7.5. For SE analysis of the complexes
in the absence of Ca2+, both protein complexes were dialyzed into a solution
with 50 mM NaCl, 10 mM Tris, and 5 mM EGTA, pH 7.5. Protein complexes
at 30 mM loading concentration were sedimented to equilibrium at 10,000,
13,000, 18,000, and 25,000 rpm in a Beckman XL-I Analytical Ultracentrifuge
using an An 50 Ti rotor. Radial absorbance scans measured at 280 nm
determined the distribution of the complexes in the centrifugal field. Data
analysis was performed using SEDFIT and SEDPHAT (Schuck et al., 2002).
A single component model yielded the best fit to the data.
Isothermal Titration Calorimetry
For ITC experiments, CaM, CAMBD2-a, and CaMBD2-b were expressed and
purified using affinity columns followed by gel filtrationwith the following buffer:
20 mM HEPES and 100 mM NaCl, pH 7.5. Both CaM and CaMBDs were
dialyzed into the same buffer supplemented with 10 mM CaCl2. CaM (90 mM)
was titrated into CaMBD2-a (10 mM) or CaMBD2-b (10 mM) at 20�C using
a microcalorimeter (MicroCal/GE). The injection volume was 4 ml, and the initial
cell volume of CaMBDs was 1.43 ml. For data analysis, the dilution heat gener-
ated from titration of CaM into the buffer without CaMBD peptides was
measuredandsubtracted from thatwitheitherCaMBD2-borCaMBD2-a.There
were no noticeable changes in the dilution heat. Data were fitted to standard
equations in Origin 7.0 supplied by MicroCal. Identical results were obtained
in three independent experimentswith different batches of thepurifiedproteins.
Fluorescence Measurements with Fluorophore-Labeled CaM
Dansyl-labeled CaM is often used to quantify the interaction betweenCaM and
its target proteins (e.g., Zuhlke et al., 1999). Dansyl labeling, however, will
modify the Lys residues in CaM and potentially alter the interaction between
CaM and CaMBD, since K75, K77, and K115 in CaM are clearly involved in
interacting with CaMBD (Figures 4 and 5). Instead, fluorophore-labeled CaM
was created by introducing a cysteine mutation in CaM (T34C or T110C), as
previously described (Halling et al., 2009; Spratt et al., 2007). The fluorophore
changes its fluorescence intensity in response to changes in the local environ-
ment near the fluorophore. The mutant CaM was expressed and purified as
described earlier (plus 0.5 mM TCEP) and was labeled with 5-((((2-iodoacetyl)
amino)ethyl)amino)naphthalene-1-sulfonic acid (AEDANS, Invitrogen). All
proteins were dialyzed into the solution containing (in mM) 20 mM HEPES,
100 mM NaCl, 10 mM EGTA, 10 mM HEDTA, and 0.2 mM TCEP, pH 7.0.
Binding assays were performed by mixing 0.2 mM of AEDANS-labeled
CaM(T34C) or CaM(T110C) with 3 mM of either CaMBD2-a or CaMBD2-b
and adding Ca2+ to its final free concentrations calculated with the software
by Chris Patton of Stanford University (http://www.stanford.edu/�cpatton/
maxc.html). The mixture was incubated for 3 hr at room temperature in dark.
The fluorescence was measured using a Safire II microplate reader (Texan)
with excitation at 340 nm (10 nm bandwidth) and emission between 400 and
600 nm (scanned with 20 nm bandwidth) at 28�C. The increase of fluorescenceintensity, at emission of 510 nm, was plotted as a function of the free Ca2+
concentrations and fitted with a standard dose-response curve. In a separate
experiment, AEDANS-labeled CaM (0.2 mM) was mixed with an increasing
amount of CaMBDs at Ca2+ concentrations as indicated. Changes in the
fluorescence intensity were plotted as a function of the CaMBD concentrations
and fitted with a standard dose-response curve.
, 911–923, May 9, 2012 ª2012 Elsevier Ltd All rights reserved 921

Structure
Calmodulin Structure and Its Affinity for Ca2+
Electrophysiology
Please see the Supplemental Experimental Procedures for details.
Calculation of Relative Binding Affinities of the CaM N- and C-Lobes
for Ca2+
The CaM-CaMBD2-b crystal structure was subject to 18 ns of explicit solvent
MD simulation using NAMD v2.8 (Phillips et al., 2005) and the CHARMM force
field (Mackerell et al., 2004), at 298Kand1bar toprovideanensembleof config-
urations. Configurations were sampled at 4, 8, 12, and 16 ns to provide initial
configurations for thermodynamic integration (TI) calculations (Frenkel and
Smit, 2002). TI was performed along a discrete alchemical pathway connecting
the Ca2+-bound state to a Ca2+-free state for two particular Ca2+ ions: those
that bound to EF hands in the CaM N-lobe (chain A) and those that bound to
EFhands in theCaMC-lobe (chainA). TheTI orderparameters for vanderWaals
and electrostatic interactions were varied from 1.0 (Ca2+ fully bound) to 0.0
(Ca2+ fully absent) according to a schedule that turns electrostatics off first
before completely turning off van der Waals (see Supplemental Experimental
Procedures). Numerical integration was performed using the trapezoidal rule.
Statistics
Where applicable, data are expressed as mean ± SEM. Student t tests
are used for data comparison.
ACCESSION NUMBERS
The coordinates of the CaM-CaMBD2-b complex have been deposited in the
Protein Data Bank under accession code 3SJQ. The accession number of the
SK2-b gene is JN857942.
SUPPLEMENTAL INFORMATION
Supplemental Information includes six figures, two tables, and Supplemental
Experimental Procedures and can be found with this article online at
doi:10.1016/j.str.2012.03.019.
ACKNOWLEDGMENTS
The work is supported by grants from the National Institutes of Health to J.F.Z.
(R01MH073060 and R01NS39355). We thank Drs. Horn, Aldrich, Levitan,
Covarrubias, Root, Scott, Milev, Horne, and Armen for their encouragement
and helpful discussions; Drs. Yue, Tang, and Leppla for providing plasmids
of CaM mutants and edema factor; Drs. Eto and Butler for their help with fluo-
rescence measurement; the structural facility of the Kimmel Cancer Center at
Thomas Jefferson University for access of equipment in initial protein crystal
screening, initial in-house X-ray diffraction, and ITC experiments; and the staff
at the Beamline facility (X29A) of the Brookhaven National Laboratory for assis-
tance with collection of X-ray diffraction data.
Received: September 9, 2011
Revised: February 20, 2012
Accepted: March 8, 2012
Published: May 8, 2012
REFERENCES
Andersson, A., Forsen, S., Thulin, E., and Vogel, H.J. (1983). Cadmium-113
nuclear magnetic resonance studies of proteolytic fragments of calmodulin:
assignment of strong and weak cation binding sites. Biochemistry 22, 2309–
2313.
Ataman, Z.A., Gakhar, L., Sorensen, B.R., Hell, J.W., and Shea, M.A. (2007).
The NMDA receptor NR1 C1 region bound to calmodulin: structural insights
into functional differences between homologous domains. Structure 15,
1603–1617.
Bond, C.T., Maylie, J., and Adelman, J.P. (2005). SK channels in excitability,
pacemaking and synaptic integration. Curr. Opin. Neurobiol. 15, 305–311.
Chin, D., and Means, A.R. (2000). Calmodulin: a prototypical calcium sensor.
Trends Cell Biol. 10, 322–328.
922 Structure 20, 911–923, May 9, 2012 ª2012 Elsevier Ltd All rights
Chagot, B., and Chazin, W.J. (2011). Solution NMR structure of Apo-calmod-
ulin in complex with the IQ motif of human cardiac sodium channel NaV1.5.
J. Mol. Biol. 406, 106–119.
Clapham, D.E. (2007). Calcium signaling. Cell 131, 1047–1058.
Crouch, T.H., and Klee, C.B. (1980). Positive cooperative binding of calcium to
bovine brain calmodulin. Biochemistry 19, 3692–3698.
Deisseroth, K., Heist, E.K., and Tsien, R.W. (1998). Translocation of calmodulin
to the nucleus supports CREB phosphorylation in hippocampal neurons.
Nature 392, 198–202.
Dick, I.E., Tadross, M.R., Liang, H., Tay, L.H., Yang, W., and Yue, D.T. (2008).
A modular switch for spatial Ca2+ selectivity in the calmodulin regulation of
CaV channels. Nature 451, 830–834.
Drum, C.L., Yan, S.-Z., Bard, J., Shen, Y.-Q., Lu, D., Soelaiman, S., Grabarek,
Z., Bohm, A., and Tang, W.-J. (2002). Structural basis for the activation of
anthrax adenylyl cyclase exotoxin by calmodulin. Nature 415, 396–402.
Faber, E.S.L. (2009). Functions and modulation of neuronal SK channels. Cell
Biochem. Biophys. 55, 127–139.
Fallon, J.L., and Quiocho, F.A. (2003). A closed compact structure of native
Ca(2+)-calmodulin. Structure 11, 1303–1307.
Frederick, K.K., Marlow, M.S., Valentine, K.G., and Wand, A.J. (2007).
Conformational entropy in molecular recognition by proteins. Nature 448,
325–329.
Frenkel, D., and Smit, B. (2002). Understanding molecular simulation (San
Diego, CA: Academic Press).
Gifford, J.L., Walsh, M.P., and Vogel, H.J. (2007). Structures and metal-ion-
binding properties of the Ca2+-binding helix-loop-helix EF-hand motifs.
Biochem. J. 405, 199–221.
Halling, D.B., Aracena-Parks, P., and Hamilton, S.L. (2005). Regulation of
voltage-gated Ca2+ channels by calmodulin. Sci. STKE 2005, re15.
Halling, D.B., Georgiou, D.K., Black, D.J., Yang, G., Fallon, J.L., Quiocho, F.A.,
Pedersen, S.E., and Hamilton, S.L. (2009). Determinants in CaV1 channels
that regulate the Ca2+ sensitivity of bound calmodulin. J. Biol. Chem. 284,
20041–20051.
Hoeflich, K.P., and Ikura, M. (2002). Calmodulin in action: diversity in target
recognition and activation mechanisms. Cell 108, 739–742.
Ikura, M., Clore, G.M., Gronenborn, A.M., Zhu, G., Klee, C.B., and Bax, A.
(1992). Solution structure of a calmodulin-target peptide complex by multidi-
mensional NMR. Science 256, 632–638.
Ishida, H., and Vogel, H.J. (2006). Protein-peptide interaction studies
demonstrate the versatility of calmodulin target protein binding. Protein
Pept. Lett. 13, 455–465.
Kohler, M., Hirschberg, B., Bond, C.T., Kinzie, J.M., Marrion, N.V., Maylie, J.,
and Adelman, J.P. (1996). Small-conductance, calcium-activated potassium
channels from mammalian brain. Science 273, 1709–1714.
Kranz, J.K., Lee, E.K., Nairn, A.C., and Wand, A.J. (2002). A direct test of the
reductionist approach to structural studies of calmodulin activity. J. Biol.
Chem. 277, 16351–16354.
Larsson, G., Schleucher, J., Onions, J., Hermann, S., Grundstrom, T., and
Wijmenga, S.S. (2001). A novel target recognition revealed by calmodulin in
complex with the basic helix–loop–helix transcription factor SEF2-1/E2-2.
Protein Sci. 10, 169–186.
Mackerell, A.D., Jr., Feig, M., and Brooks, C.L., 3rd. (2004). Extending
the treatment of backbone energetics in protein force fields: limitations of
gas-phase quantum mechanics in reproducing protein conformational distri-
butions in molecular dynamics simulations. J. Comput. Chem. 25, 1400–1415.
McLaughlin, S., and Murray, D. (2005). Plasma membrane phosphoinositide
organization by protein electrostatics. Nature 438, 605–611.
Meador, W.E., Means, A.R., and Quiocho, F.A. (1992). Target enzyme recog-
nition by calmodulin: 2.4 A structure of a calmodulin-peptide complex.
Science 257, 1251–1255.
Meador, W.E., Means, A.R., and Quiocho, F.A. (1993). Modulation of calmod-
ulin plasticity in molecular recognition on the basis of x-ray structures. Science
262, 1718–1721.
reserved
Structure
Calmodulin Structure and Its Affinity for Ca2+
Mori, M.X., Vander Kooi, C.W., Leahy, D.J., and Yue, D.T. (2008). Crystal struc-
ture of the CaV2 IQ domain in complex with Ca2+/calmodulin: high-resolution
mechanistic implications for channel regulation by Ca2+. Structure 16,
607–620.
Osawa, M., Tokumitsu, H., Swindells, M.B., Kurihara, H., Orita, M.,
Shibanuma, T., Furuya, T., and Ikura, M. (1999). A novel target recognition
revealed by calmodulin in complex with Ca2+-calmodulin-dependent kinase
kinase. Nat. Struct. Biol. 6, 819–824.
Peersen, O.B., Madsen, T.S., and Falke, J.J. (1997). Intermolecular tuning of
calmodulin by target peptides and proteins: differential effects on Ca2+
binding and implications for kinase activation. Protein Sci. 6, 794–807.
Phillips, J.C., Braun, R., Wang, W., Gumbart, J., Tajkhorshid, E., Villa, E.,
Chipot, C., Skeel, R.D., Kale, L., and Schulten, K. (2005). Scalable molecular
dynamics with NAMD. J. Comput. Chem. 26, 1781–1802.
Rodrıguez-Castaneda, F., Maestre-Martınez, M., Coudevylle, N., Dimova, K.,
Junge, H., Lipstein, N., Lee, D., Becker, S., Brose, N., Jahn, O., et al. (2010).
Modular architecture of Munc13/calmodulin complexes: dual regulation by
Ca2+ and possible function in short-term synaptic plasticity. EMBO J. 29,
680–691.
Schuck, P., Perugini, M.A., Gonzales, N.R., Howlett, G.J., and Schubert, D.
(2002). Size-distribution analysis of proteins by analytical ultracentrifugation:
strategies and application to model systems. Biophys. J. 82, 1096–1111.
Schumacher, M.A., Rivard, A.F., Bachinger, H.P., and Adelman, J.P. (2001).
Structure of the gating domain of a Ca2+-activated K+ channel complexed
with Ca2+/calmodulin. Nature 410, 1120–1124.
Schumacher, M.A., Crum, M., and Miller, M.C. (2004). Crystal structures of
apocalmodulin and an apocalmodulin/SK potassium channel gating domain
complex. Structure 12, 849–860.
Structure 20
Spratt, D.E., Taiakina, V., Palmer, M., and Guillemette, J.G. (2007). Differential
binding of calmodulin domains to constitutive and inducible nitric oxide
synthase enzymes. Biochemistry 46, 8288–8300.
Stocker, M. (2004). Ca(2+)-activated K+ channels: molecular determinants and
function of the SK family. Nat. Rev. Neurosci. 5, 758–770.
Swindells, M.B., and Ikura, M. (1996). Pre-formation of the semi-open con-
formation by the apo-calmodulin C-terminal domain and implications binding
IQ-motifs. Nat. Struct. Biol. 3, 501–504.
Tadross, M.R., Dick, I.E., and Yue, D.T. (2008). Mechanism of local and global
Ca2+ sensing by calmodulin in complex with a Ca2+ channel. Cell 133,
1228–1240.
Urbauer, J.L., Short, J.H., Dow, L.K., andWand, A.J. (1995). Structural analysis
of a novel interaction by calmodulin: high-affinity binding of a peptide in the
absence of calcium. Biochem 34, 8099–8109.
Van Petegem, F., Chatelain, F.C., and Minor, D.L., Jr. (2005). Insights into
voltage-gated calcium channel regulation from the structure of the CaV1.2
IQ domain-Ca2+/calmodulin complex. Nat. Struct. Mol. Biol. 12, 1108–1115.
Wayman, G.A., Lee, Y.-S., Tokumitsu, H., Silva, A.J., and Soderling, T.R.
(2008). Calmodulin-kinases: modulators of neuronal development and
plasticity. Neuron 59, 914–931.
Xia, X.M., Fakler, B., Rivard, A., Wayman, G., Johnson-Pais, T., Keen, J.E.,
Ishii, T., Hirschberg, B., Bond, C.T., Lutsenko, S., et al. (1998). Mechanism
of calcium gating in small-conductance calcium-activated potassium
channels. Nature 395, 503–507.
Zuhlke, R.D., Pitt, G.S., Deisseroth, K., Tsien, R.W., and Reuter, H. (1999).
Calmodulin supports both inactivation and facilitation of L-type calcium
channels. Nature 399, 159–162.
, 911–923, May 9, 2012 ª2012 Elsevier Ltd All rights reserved 923


![Calcium-induced calmodulin conformational change. … · 2017-04-18 · cells, compared with cells from normal tissues [2]. CaM has also been considered a crucial molecule in the](https://img.pdfslide.net/doc/110x75/5f2f1ed9b601a10c4728e49e/calcium-induced-calmodulin-conformational-change-2017-04-18-cells-compared-with.jpg)