Embed Size (px)
Citation preview
Structural basis for ligand promiscuityin cytochrome P450 3A4Marika Ekroos and Tove Sjogren*
AstraZeneca R&D Molndal, S-431 83 Molndal, Sweden
Edited by John H. Dawson, University of South Carolina, Columbia, SC, and accepted by the Editorial Board July 21, 2006 (received for review April 21, 2006).
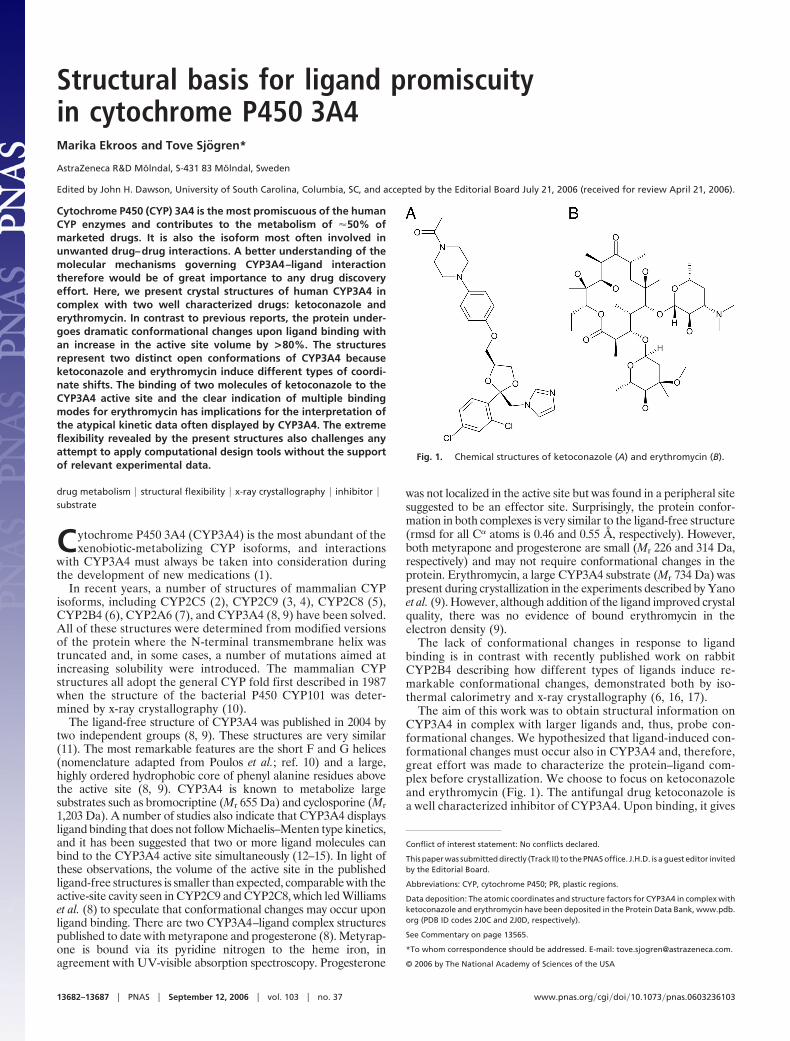
Cytochrome P450 (CYP) 3A4 is the most promiscuous of the humanCYP enzymes and contributes to the metabolism of �50% ofmarketed drugs. It is also the isoform most often involved inunwanted drug–drug interactions. A better understanding of themolecular mechanisms governing CYP3A4–ligand interactiontherefore would be of great importance to any drug discoveryeffort. Here, we present crystal structures of human CYP3A4 incomplex with two well characterized drugs: ketoconazole anderythromycin. In contrast to previous reports, the protein under-goes dramatic conformational changes upon ligand binding withan increase in the active site volume by >80%. The structuresrepresent two distinct open conformations of CYP3A4 becauseketoconazole and erythromycin induce different types of coordi-nate shifts. The binding of two molecules of ketoconazole to theCYP3A4 active site and the clear indication of multiple bindingmodes for erythromycin has implications for the interpretation ofthe atypical kinetic data often displayed by CYP3A4. The extremeflexibility revealed by the present structures also challenges anyattempt to apply computational design tools without the supportof relevant experimental data.
drug metabolism � structural flexibility � x-ray crystallography � inhibitor �substrate
Cytochrome P450 3A4 (CYP3A4) is the most abundant of thexenobiotic-metabolizing CYP isoforms, and interactions
with CYP3A4 must always be taken into consideration duringthe development of new medications (1).
In recent years, a number of structures of mammalian CYPisoforms, including CYP2C5 (2), CYP2C9 (3, 4), CYP2C8 (5),CYP2B4 (6), CYP2A6 (7), and CYP3A4 (8, 9) have been solved.All of these structures were determined from modified versionsof the protein where the N-terminal transmembrane helix wastruncated and, in some cases, a number of mutations aimed atincreasing solubility were introduced. The mammalian CYPstructures all adopt the general CYP fold first described in 1987when the structure of the bacterial P450 CYP101 was deter-mined by x-ray crystallography (10).
The ligand-free structure of CYP3A4 was published in 2004 bytwo independent groups (8, 9). These structures are very similar(11). The most remarkable features are the short F and G helices(nomenclature adapted from Poulos et al.; ref. 10) and a large,highly ordered hydrophobic core of phenyl alanine residues abovethe active site (8, 9). CYP3A4 is known to metabolize largesubstrates such as bromocriptine (Mr 655 Da) and cyclosporine (Mr1,203 Da). A number of studies also indicate that CYP3A4 displaysligand binding that does not follow Michaelis–Menten type kinetics,and it has been suggested that two or more ligand molecules canbind to the CYP3A4 active site simultaneously (12–15). In light ofthese observations, the volume of the active site in the publishedligand-free structures is smaller than expected, comparable with theactive-site cavity seen in CYP2C9 and CYP2C8, which led Williamset al. (8) to speculate that conformational changes may occur uponligand binding. There are two CYP3A4–ligand complex structurespublished to date with metyrapone and progesterone (8). Metyrap-one is bound via its pyridine nitrogen to the heme iron, inagreement with UV-visible absorption spectroscopy. Progesterone
was not localized in the active site but was found in a peripheral sitesuggested to be an effector site. Surprisingly, the protein confor-mation in both complexes is very similar to the ligand-free structure(rmsd for all C� atoms is 0.46 and 0.55 Å, respectively). However,both metyrapone and progesterone are small (Mr 226 and 314 Da,respectively) and may not require conformational changes in theprotein. Erythromycin, a large CYP3A4 substrate (Mr 734 Da) waspresent during crystallization in the experiments described by Yanoet al. (9). However, although addition of the ligand improved crystalquality, there was no evidence of bound erythromycin in theelectron density (9).
The lack of conformational changes in response to ligandbinding is in contrast with recently published work on rabbitCYP2B4 describing how different types of ligands induce re-markable conformational changes, demonstrated both by iso-thermal calorimetry and x-ray crystallography (6, 16, 17).
The aim of this work was to obtain structural information onCYP3A4 in complex with larger ligands and, thus, probe con-formational changes. We hypothesized that ligand-induced con-formational changes must occur also in CYP3A4 and, therefore,great effort was made to characterize the protein–ligand com-plex before crystallization. We choose to focus on ketoconazoleand erythromycin (Fig. 1). The antifungal drug ketoconazole isa well characterized inhibitor of CYP3A4. Upon binding, it gives
Conflict of interest statement: No conflicts declared.
This paper was submitted directly (Track II) to the PNAS office. J.H.D. is a guest editor invitedby the Editorial Board.
Abbreviations: CYP, cytochrome P450; PR, plastic regions.
Data deposition: The atomic coordinates and structure factors for CYP3A4 in complex withketoconazole and erythromycin have been deposited in the Protein Data Bank, www.pdb.org (PDB ID codes 2J0C and 2J0D, respectively).
See Commentary on page 13565.
*To whom correspondence should be addressed. E-mail: [email protected].
© 2006 by The National Academy of Sciences of the USA
Fig. 1. Chemical structures of ketoconazole (A) and erythromycin (B).
13682–13687 � PNAS � September 12, 2006 � vol. 103 � no. 37 www.pnas.org�cgi�doi�10.1073�pnas.0603236103
rise to a type II spectrum, indicative of direct heme binding, andcomplex formation thus can be followed spectrophotometricallyduring all stages in complex formation and crystallization. Themacrolide antibiotic erythromycin was chosen because its prop-erties in terms of heme coordination, size, and charge distribu-tion are very different from ketoconazole, which would improvethe probability for identification of a distinct set of interactionswith CYP3A4. The resulting CYP3A4–ligand complex struc-tures reveal a remarkable flexibility, which sheds light on thestructural basis of ligand promiscuity, and have implications for
efforts aiming to construct structure-based models for CYP3A4inhibition and metabolism.
Results and DiscussionInitial studies using dynamic light scattering showed that addi-tion of ketoconazole to purified N-terminally truncated CYP3A4maintained in a buffer designed to stabilize the ligand-freeenzyme (8, 9) caused protein aggregation (data not shown). Bymodifying the buffer composition, notably by lowering the saltconcentration and by adding a polar solvent such as acetonitrileor dioxane, ligand-induced aggregation could be avoided. Thepreformed complexes then could be crystallized.
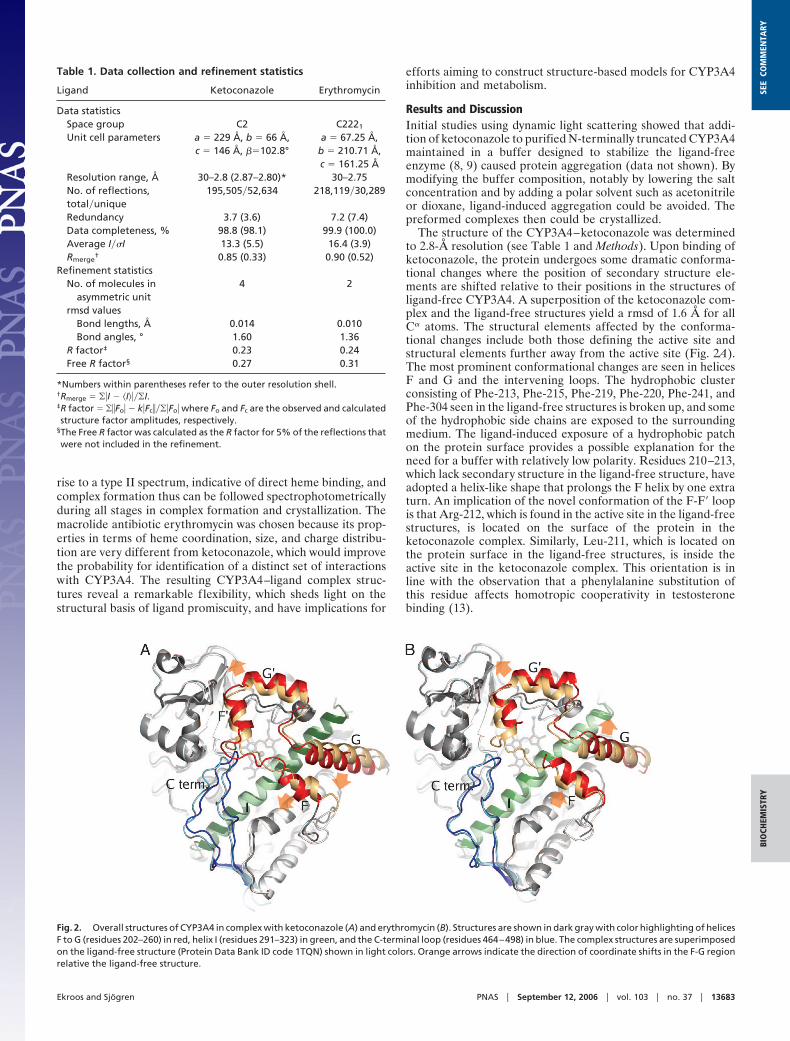
The structure of the CYP3A4–ketoconazole was determinedto 2.8-Å resolution (see Table 1 and Methods). Upon binding ofketoconazole, the protein undergoes some dramatic conforma-tional changes where the position of secondary structure ele-ments are shifted relative to their positions in the structures ofligand-free CYP3A4. A superposition of the ketoconazole com-plex and the ligand-free structures yield a rmsd of 1.6 Å for allC� atoms. The structural elements affected by the conforma-tional changes include both those defining the active site andstructural elements further away from the active site (Fig. 2A).The most prominent conformational changes are seen in helicesF and G and the intervening loops. The hydrophobic clusterconsisting of Phe-213, Phe-215, Phe-219, Phe-220, Phe-241, andPhe-304 seen in the ligand-free structures is broken up, and someof the hydrophobic side chains are exposed to the surroundingmedium. The ligand-induced exposure of a hydrophobic patchon the protein surface provides a possible explanation for theneed for a buffer with relatively low polarity. Residues 210–213,which lack secondary structure in the ligand-free structure, haveadopted a helix-like shape that prolongs the F helix by one extraturn. An implication of the novel conformation of the F-F� loopis that Arg-212, which is found in the active site in the ligand-freestructures, is located on the surface of the protein in theketoconazole complex. Similarly, Leu-211, which is located onthe protein surface in the ligand-free structures, is inside theactive site in the ketoconazole complex. This orientation is inline with the observation that a phenylalanine substitution ofthis residue affects homotropic cooperativity in testosteronebinding (13).
Table 1. Data collection and refinement statistics
Ligand Ketoconazole Erythromycin
Data statisticsSpace group C2 C2221
Unit cell parameters a � 229 Å, b � 66 Å,c � 146 Å, ��102.8°
a � 67.25 Å,b � 210.71 Å,c � 161.25 Å
Resolution range, Å 30–2.8 (2.87–2.80)* 30–2.75No. of reflections,total�unique
195,505�52,634 218,119�30,289
Redundancy 3.7 (3.6) 7.2 (7.4)Data completeness, % 98.8 (98.1) 99.9 (100.0)Average I��I 13.3 (5.5) 16.4 (3.9)Rmerge
† 0.85 (0.33) 0.90 (0.52)Refinement statistics
No. of molecules inasymmetric unit
4 2
rmsd valuesBond lengths, Å 0.014 0.010Bond angles, ° 1.60 1.36
R factor‡ 0.23 0.24Free R factor§ 0.27 0.31
*Numbers within parentheses refer to the outer resolution shell.†Rmerge � ��I � �I����I.‡R factor � ��Fo� � k�Fc����Fo� where Fo and Fc are the observed and calculatedstructure factor amplitudes, respectively.
§The Free R factor was calculated as the R factor for 5% of the reflections thatwere not included in the refinement.
Fig. 2. Overall structures of CYP3A4 in complex with ketoconazole (A) and erythromycin (B). Structures are shown in dark gray with color highlighting of helicesF to G (residues 202–260) in red, helix I (residues 291–323) in green, and the C-terminal loop (residues 464–498) in blue. The complex structures are superimposedon the ligand-free structure (Protein Data Bank ID code 1TQN) shown in light colors. Orange arrows indicate the direction of coordinate shifts in the F-G regionrelative the ligand-free structure.
Ekroos and Sjogren PNAS � September 12, 2006 � vol. 103 � no. 37 � 13683
BIO
CHEM
ISTR
YSE
ECO
MM
ENTA
RY
Other notable changes include a shift of up to 4 Å of the loopconnecting the C-terminal �-sheets and a distortion of the I helixcleft centered around residue 307 (maximum C� shift: 2 Å).Interestingly, a similar distortion also was observed in thestructure of P450eryF in complex with ketoconazole (18).
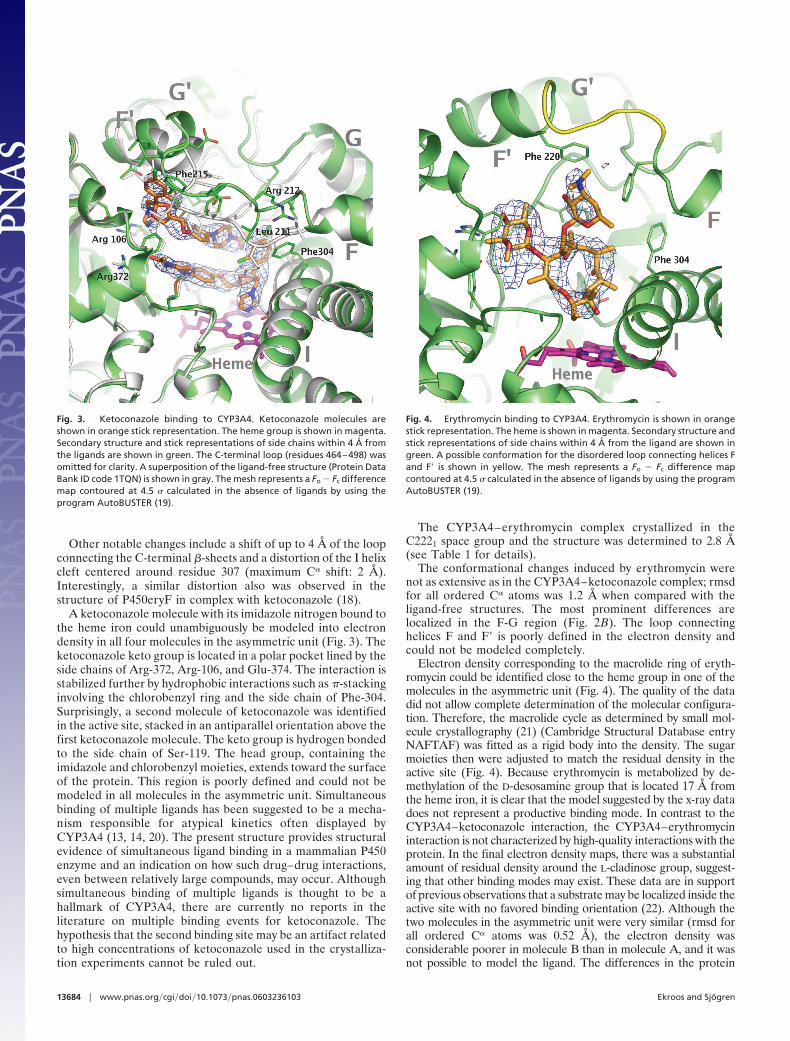
A ketoconazole molecule with its imidazole nitrogen bound tothe heme iron could unambiguously be modeled into electrondensity in all four molecules in the asymmetric unit (Fig. 3). Theketoconazole keto group is located in a polar pocket lined by theside chains of Arg-372, Arg-106, and Glu-374. The interaction isstabilized further by hydrophobic interactions such as �-stackinginvolving the chlorobenzyl ring and the side chain of Phe-304.Surprisingly, a second molecule of ketoconazole was identifiedin the active site, stacked in an antiparallel orientation above thefirst ketoconazole molecule. The keto group is hydrogen bondedto the side chain of Ser-119. The head group, containing theimidazole and chlorobenzyl moieties, extends toward the surfaceof the protein. This region is poorly defined and could not bemodeled in all molecules in the asymmetric unit. Simultaneousbinding of multiple ligands has been suggested to be a mecha-nism responsible for atypical kinetics often displayed byCYP3A4 (13, 14, 20). The present structure provides structuralevidence of simultaneous ligand binding in a mammalian P450enzyme and an indication on how such drug–drug interactions,even between relatively large compounds, may occur. Althoughsimultaneous binding of multiple ligands is thought to be ahallmark of CYP3A4, there are currently no reports in theliterature on multiple binding events for ketoconazole. Thehypothesis that the second binding site may be an artifact relatedto high concentrations of ketoconazole used in the crystalliza-tion experiments cannot be ruled out.
The CYP3A4–erythromycin complex crystallized in theC2221 space group and the structure was determined to 2.8 Å(see Table 1 for details).
The conformational changes induced by erythromycin werenot as extensive as in the CYP3A4–ketoconazole complex; rmsdfor all ordered C� atoms was 1.2 Å when compared with theligand-free structures. The most prominent differences arelocalized in the F-G region (Fig. 2B). The loop connectinghelices F and F� is poorly defined in the electron density andcould not be modeled completely.
Electron density corresponding to the macrolide ring of eryth-romycin could be identified close to the heme group in one of themolecules in the asymmetric unit (Fig. 4). The quality of the datadid not allow complete determination of the molecular configura-tion. Therefore, the macrolide cycle as determined by small mol-ecule crystallography (21) (Cambridge Structural Database entryNAFTAF) was fitted as a rigid body into the density. The sugarmoieties then were adjusted to match the residual density in theactive site (Fig. 4). Because erythromycin is metabolized by de-methylation of the D-desosamine group that is located 17 Å fromthe heme iron, it is clear that the model suggested by the x-ray datadoes not represent a productive binding mode. In contrast to theCYP3A4–ketoconazole interaction, the CYP3A4–erythromycininteraction is not characterized by high-quality interactions with theprotein. In the final electron density maps, there was a substantialamount of residual density around the L-cladinose group, suggest-ing that other binding modes may exist. These data are in supportof previous observations that a substrate may be localized inside theactive site with no favored binding orientation (22). Although thetwo molecules in the asymmetric unit were very similar (rmsd forall ordered C� atoms was 0.52 Å), the electron density wasconsiderable poorer in molecule B than in molecule A, and it wasnot possible to model the ligand. The differences in the protein
Fig. 3. Ketoconazole binding to CYP3A4. Ketoconazole molecules areshown in orange stick representation. The heme group is shown in magenta.Secondary structure and stick representations of side chains within 4 Å fromthe ligands are shown in green. The C-terminal loop (residues 464–498) wasomitted for clarity. A superposition of the ligand-free structure (Protein DataBank ID code 1TQN) is shown in gray. The mesh represents a Fo � Fc differencemap contoured at 4.5 � calculated in the absence of ligands by using theprogram AutoBUSTER (19).
Fig. 4. Erythromycin binding to CYP3A4. Erythromycin is shown in orangestick representation. The heme is shown in magenta. Secondary structure andstick representations of side chains within 4 Å from the ligand are shown ingreen. A possible conformation for the disordered loop connecting helices Fand F� is shown in yellow. The mesh represents a Fo � Fc difference mapcontoured at 4.5 � calculated in the absence of ligands by using the programAutoBUSTER (19).
13684 � www.pnas.org�cgi�doi�10.1073�pnas.0603236103 Ekroos and Sjogren
structures were focused mainly in the F�-G� helices (residues219–237), where the average differences in C� positions is �1 Å inan optimal superposition of molecules A and B. This region isinvolved in crystal packing interactions in both molecules and theobserved differences in protein–ligand interactions demonstratehow subtle variations in the external environment such as protein–protein interactions or membrane composition may modulateligand binding.
Surprisingly, the nature of the coordinate shift relative theligand-free structure in the F-G region is different in the twostructures presented here. In an optimal overlay including all C�
atoms in the structurally invariant part of the protein (see Methods),the average shift of the C� atoms included in the F-G region(residues 202–260) in the ketoconazole complex relative to theligand-free structure (Protein Data Bank code 1TQN) is 3.1 Å. Thecorresponding shift for the erythromycin complex structure is 2.8 Å.However, although helices F� and G� shifts are similar, coordinateshifts of residues in helices F and G have opposite direction (Fig. 2).The average difference between the positions of C� atoms forresidues 202–260 in the ketoconazole and erythromycin complexesis 3.4 Å. The solvent accessible volume of the active site in theligand-free structures was estimated to be �950 Å3 (calculationsperformed by using the LIGSITE algorithm; ref. 23). In theketoconazole structure, the volume is increased to 1,650 Å3. In theerythromycin complex, the shift of the F helix has resulted in a largeopen cleft, and determination of the boundaries of the active site
becomes somewhat arbitrary, but it is estimated that the volume is�2,000 Å3.
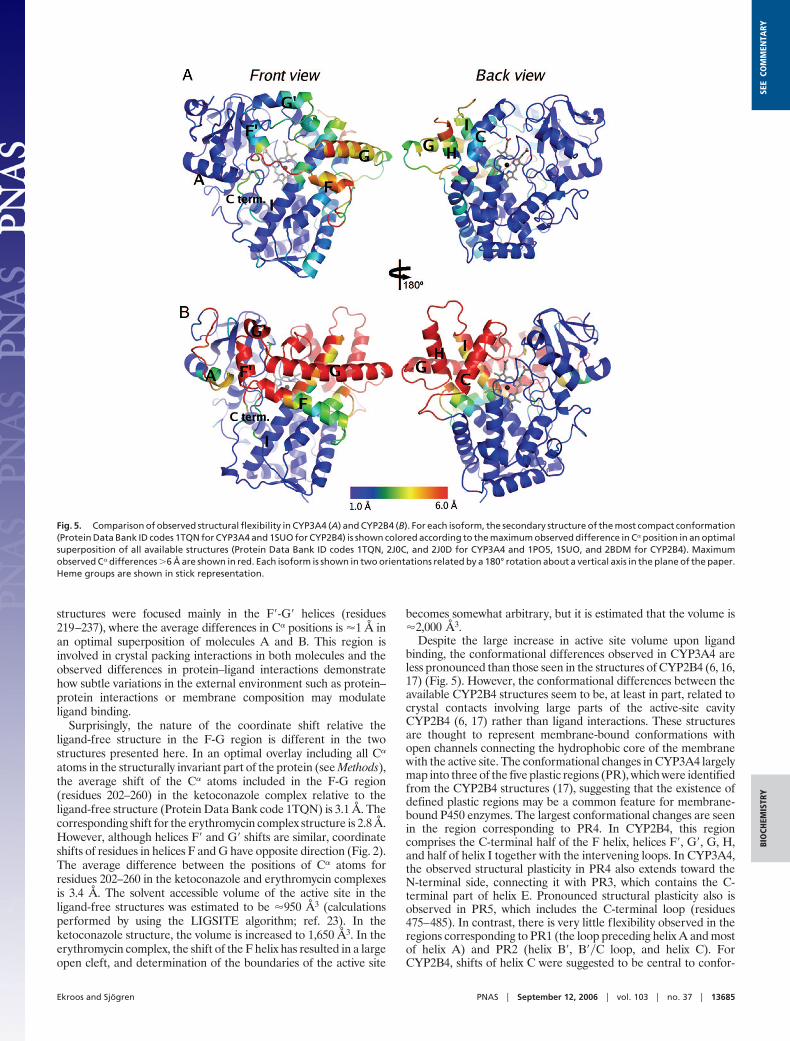
Despite the large increase in active site volume upon ligandbinding, the conformational differences observed in CYP3A4 areless pronounced than those seen in the structures of CYP2B4 (6, 16,17) (Fig. 5). However, the conformational differences between theavailable CYP2B4 structures seem to be, at least in part, related tocrystal contacts involving large parts of the active-site cavityCYP2B4 (6, 17) rather than ligand interactions. These structuresare thought to represent membrane-bound conformations withopen channels connecting the hydrophobic core of the membranewith the active site. The conformational changes in CYP3A4 largelymap into three of the five plastic regions (PR), which were identifiedfrom the CYP2B4 structures (17), suggesting that the existence ofdefined plastic regions may be a common feature for membrane-bound P450 enzymes. The largest conformational changes are seenin the region corresponding to PR4. In CYP2B4, this regioncomprises the C-terminal half of the F helix, helices F�, G�, G, H,and half of helix I together with the intervening loops. In CYP3A4,the observed structural plasticity in PR4 also extends toward theN-terminal side, connecting it with PR3, which contains the C-terminal part of helix E. Pronounced structural plasticity also isobserved in PR5, which includes the C-terminal loop (residues475–485). In contrast, there is very little flexibility observed in theregions corresponding to PR1 (the loop preceding helix A and mostof helix A) and PR2 (helix B�, B��C loop, and helix C). ForCYP2B4, shifts of helix C were suggested to be central to confor-
Fig. 5. Comparison of observed structural flexibility in CYP3A4 (A) and CYP2B4 (B). For each isoform, the secondary structure of the most compact conformation(Protein Data Bank ID codes 1TQN for CYP3A4 and 1SUO for CYP2B4) is shown colored according to the maximum observed difference in C� position in an optimalsuperposition of all available structures (Protein Data Bank ID codes 1TQN, 2J0C, and 2J0D for CYP3A4 and 1PO5, 1SUO, and 2BDM for CYP2B4). Maximumobserved C� differences �6 Å are shown in red. Each isoform is shown in two orientations related by a 180° rotation about a vertical axis in the plane of the paper.Heme groups are shown in stick representation.
Ekroos and Sjogren PNAS � September 12, 2006 � vol. 103 � no. 37 � 13685
BIO
CHEM
ISTR
YSE
ECO
MM
ENTA
RY
mational transitions of PR2, PR3, and PR4 (17), but the observa-tions of structural flexibility in CYP3A4 suggest that these transi-tions can be independent of the C helix conformation.
The ligand-induced conformational changes reported heredemonstrate the f lexibility of CYP3A4 and give some insightsinto how diverse substrates and inhibitors can be accommo-dated in the active site. The ability of the enzyme to accom-modate multiple ligands simultaneously further adds to thepromiscuity because the active site shape and charge distri-bution may be modulated by a second ligand. It is highlyunlikely that the CYP3A4 conformational space has beencovered by the present structures alone, and additionalCYP3A4–ligand complexes will be required to complete thepicture. An implication of the structural f lexibility in CYP3A4is that the development of general methods for prediction ofbinding modes and site of metabolism based on proteinstructures will be very challenging. The degree of success islikely to vary depending on the compound series of interest.Nevertheless, recent work within AstraZeneca demonstratesthat the protein conformation seen in the ketoconazole struc-ture performed well in structure-based site-of-metabolismpredictions for many CYP3A4 substrates (24).
The present structures of CYP3A4 also may have implicationsfor the interpretation of kinetic data on drug metabolism. Thereare two main hypotheses to explain non-Michaelis–Mentenkinetics and drug–drug interactions. One model involves mul-tiple ligand-binding sites and kinetic models including two oreven three sites have been described (13, 14, 20). The othermodel relies on the existence of kinetically distinct conformers(25, 26) and is supported by presteady-state kinetics (25) as wellas high-pressure spectroscopic experiments (15). Although it isnot possible to draw any conclusions regarding the existence ofmultiple conformational states in the absence of ligands, thepresent structures show that CYP3A4 can adopt multiple ligand-bound protein conformations and accommodate simultaneousligand binding even of relatively large compounds. Based on theavailable data, none of these hypotheses can be excluded and itsuggests, rather, that both mechanisms are available to theenzyme and may even be in play simultaneously. This adapt-ability is likely to be an explanation for the extreme chemicaldiversity in CYP3A4 substrates.
MethodsProtein Expression and Purification. A plasmid encoding humanCYP3A4 was obtained from the LINK scheme (University ofDundee, Dundee, U.K.) and the coding sequence, modifiedaccording to Williams et al. (8), was subcloned into the expres-sion vector pCWori. CYP3A4 was produced in Escherichia coliXL1 blue cells grown at 25°C. The cells were collected 50 h afterinduction and disrupted in a high salt lysis buffer by passage oncethrough a high-pressure homogenizer. CYP3A4 was purified byaffinity chromatography with Ni-NTA resin (Qiagen, Valencia,CA), desalted, and then applied to a cation exchange column(HiTrap CM Sepharose; Amersham Pharmacia Biotech, Upp-sala, Sweden) in the presence of 10 mM CHAPS.
Complex Formation and Crystallization. Different biochemicalmethods, e.g., dynamic light scattering and analytical ultracen-
trifugation, were used to identify a number of modifications tothe buffer previously used in crystallization of the ligand-freeCYP3A4 (8, 9) needed to avoid protein aggregation upon ligandaddition. Crystals were obtained by the hanging-drop vapordiffusion method with protein at a concentration of 20–27mg�ml in a solution containing 50 mM potassium phosphate (pH7.2), 0.2 mM potassium chloride, 20% (vol�vol) glycerol, 2 mMDTT, and 1 mM EDTA. Ketoconazole or erythromycin dis-solved in acetonitrile was added to the protein to yield a finalcompound:protein ratio of �10:1. Any undissolved compoundwas removed by centrifugation before setting up crystallizationtrials. Crystals formed over a period of 1–4 days at 20°C againsta well solution containing 0.1 M Hepes (pH 7–7.5), 0.2 M lithiumsulfate, 0.8–1.0 M lithium chloride, and 30% PEG 4000.
Data Collection and Structure Determination. Crystals were quicklypassed through a crystallization solution supplemented with20% glycerol and f lash-cooled in liquid nitrogen. Data werecollected at beamline ID14 EH4 at a wavelength of 0.9760 Å.The data were processed by using MOSFLM (27), scaled, andfurther reduced by using the CCP4 suite of programs (28). Theinitial structure of the CYP3A4–ketoconazole complex wassolved by molecular replacement using the ligand-free form ofCYP3A4 (Protein Data Bank ID code 1W0E) as a searchmodel. Four molecules were found by using the programMolrep (28). In all four molecules, portions of the model,including helices F to G, did not fit the electron density. Mapimprovement by water addition and atoms update by usingARP�wARP (29) and REFMAC5 (30) followed by fourfoldnoncrystallographic symmetry averaging resulted in clearlyinterpretable electron density maps. Model rebuilding wasperformed within O (31), and refinement was performed byusing REFMAC5. Tight noncrystallographic symmetry re-straints were used in the initial rounds of refinement but weregradually released as the model improved. The CYP3A4–erythromycin structure was solved by molecular replacementusing the ligand-free form of CYP3A4 (Protein Data Bank IDcode 1W0E) as a search model. Subsequent model buildingand refinement was done by using O and REFMAC5. Forstatistics for the final models, see Table 1.
Structure Analysis. The different conformations of CYP3A4 andCYP2B4 were analyzed by using the program ESCET (32). Thelargest identified structurally invariant region was used to generatean optimal superposition of structures. The conformationally in-variant region for CYP3A4 comprises residues 30–107, 118–131,138–145, 166–171, 224–228, 312–477, and 487–496, which corre-sponds to 65% of all ordered residues. The largest conformationallyinvariant part of CYP2B4 comprises 58% of the protein, includingresidues 28–37, 58–70, 73–99, 300–473, and 481–492.
We thank Bert Larsson for assistance with large-scale fermentation;Philip R. Mallinder for producing the DNA construct; CristianJohansson for help with crystallization of the CYP3A4–erythromycincomplex; and Philip R. Mallinder, Lovisa Afzelius, Tommy B. Anders-son, and Tomas Lundqvist for useful discussions and critical readingof the manuscript.
1. Gibbs MA, Hosea NA (2003) Clin Pharmacokinet 42:969–984.2. Williams PA, Cosme J, Sridhar V, Johnson EF, McRee DE (2000) Mol Cell
5:121–131.3. Williams PA, Cosme J, Ward A, Angove HC, Matak Vinkovic D, Jhoti H
(2003) Nature 424:464–468.4. Wester MR, Yano JK, Schoch GA, Yang C, Griffin KJ, Stout CD, Johnson EF
(2004) J Biol Chem 279:35630–35637.5. Schoch GA, Yano JK, Wester MR, Griffin KJ, Stout CD, Johnson EF (2004)
J Biol Chem 279:9497–9503.
6. Scott EE, He YA, Wester MR, White MA, Chin CC, Halpert JR, Johnson EF,Stout CD (2003) Proc Natl Acad Sci USA 100:13196–13201.
7. Yano JK, Hsu MH, Griffin KJ, Stout CD, Johnson EF (2005) Nat Struct MolBiol 12:822–823.
8. Williams PA, Cosme J, Vinkovic DM, Ward A, Angove HC, Day PJ, VonrheinC, Tickle IJ, Jhoti H (2004) Science 305:683–686.
9. Yano JK, Wester MR, Schoch GA, Griffin KJ, Stout CD, Johnson EF (2004)J Biol Chem 279:38091–38094.
10. Poulos TL, Finzel BC, Howard AJ (1987) J Mol Biol 195:687–700.
13686 � www.pnas.org�cgi�doi�10.1073�pnas.0603236103 Ekroos and Sjogren
11. Scott EE, Halpert JR (2005) Trends Biochem Sci 30:5–7.12. Atkins WM (2005) Annu Rev Pharmacol Toxicol 45:291–310.13. Harlow GR, Halpert JR (1998) Proc Natl Acad Sci USA 95:6636–
6641.14. Kenworthy KE, Clarke SE, Andrews J, Houston JB (2001) Drug Metab Dispos
29:1644–1651.15. Davydov DR, Halpert JR, Renaud JP, Hui Bon Hoa G (2003) Biochem Biophys
Res Commun 312:121–30.16. Scott EE, White MA, He YA, Johnson EF, Stout CD, Halpert JR (2004) J Biol
Chem 279:27294–27301.17. Zhao Y, White MA, Muralidhara BK, Sun L, Halpert JR, Stout CD (2006)
J Biol Chem 281:5973–5981.18. Cupp-Vickery JR, Garcia C, Hofacre A, McGee-Estrada K (2001) J Mol Biol
311:101–110.19. Blanc E, Roversi P, Vonrhein C, Flensburg C, Lea SM, Bricogne G (2004) Acta
Crystallogr D 60:2210–2221.20. He YA, Roussel F, Halpert JR (2003) Arch Biochem Biophys 409:92–101.21. Stephenson GA, Stowell JG, Toma PH, Pfeiffer RR, Byrn SR (1997) J Pharm
Sci 86:1239–1244.
22. Cameron MD, Wen B, Allen KE, Roberts AG, Schuman JT, Campbell AP,Kunze KL, Nelson SD (2005) Biochemistry 44:14143–14151.
23. Hendlich M, Rippmann F, Barnickel G (1997) J Mol Graphics 15:359–363.
24. Afzelius L, Hasselgren Arnby C, Broo A, Carlsson L, Isaksson C, Jurva U,Kjellander B, Kolmodin K, Nilsson K, Raubacher F, Weidolf L (2006) DrugMetab Rev, in press.
25. Koley AP, Buters JT, Robinson RC, Markowitz A, Friedman FK (1997) J BiolChem 272:3149–3152.
26. Atkins WM, Wang RW, Lu AY (2001) Chem Res Toxicol 14:338–347.27. Leslie AG (1999) Acta Crystallogr D 55:1696–1702.28. Collaborative Computational Project No 4 (1994) Acta Crystallogr D 50:
750–763.29. Perrakis A, Morris R, Lamzin VS (1999) Nat Struct Biol 6:458–463.30. Murshudov GN, Vagin AA, Lebedev A, Wilson KS, Dodson EJ (1999) Acta
Crystallogr D 55:247–255.31. Jones TA, Zou JY, Cowan SW & Kjeldgaard (1991) Acta Crystallogr A
47:110–119.32. Schneider TR (2002) Acta Crystallogr D 58:195–208.
Ekroos and Sjogren PNAS � September 12, 2006 � vol. 103 � no. 37 � 13687
BIO
CHEM
ISTR
YSE
ECO
MM
ENTA
RY