Embed Size (px)
Citation preview
Received: December 12, 2019. Revised: January 10, 2020. Accepted: January 15, 2020
© The Author(s) 2020. Published by Oxford University Press.This is an Open Access article distributed under the terms of the Creative Commons Attribution Non-Commercial License(http://creativecommons.org/licenses/by-nc/4.0/), which permits non-commercial re-use, distribution, and reproduction in any medium,provided the original work is properly cited. For commercial re-use, please contact [email protected]
1107
Human Molecular Genetics, 2020, Vol. 29, No. 7 1107–1120
doi: 10.1093/hmg/ddaa009Advance Access Publication Date: 21 January 2020General Article
G E N E R A L A R T I C L E
Structural basis for the dominant or recessivecharacter of GLIALCAM mutations foundin leukodystrophiesXabier Elorza-Vidal1,2, Efren Xicoy-Espaulella1, Adrià Pla-Casillanis1,Marta Alonso-Gardón1, Héctor Gaitán-Peñas1,2, Carolyn Engel-Pizcueta1,Juan Fernández-Recio3,4,5 and Raúl Estévez1,2,*1Unitat de Fisiologia, Departament de Ciències Fisiològiques, Genes Disease and Therapy ProgramIDIBELL-Institute of Neurosciences, Universitat de Barcelona, L’Hospitalet de Llobregat, Spain, 2Centro deInvestigación en red de enfermedades raras (CIBERER), ISCIII, Madrid, Spain, 3Barcelona SupercomputingCenter (BSC), Barcelona, Spain, 4Institut de Biologia Molecular de Barcelona, CSIC, Barcelona, Spain and5Instituto de Ciencias de la Vid y del Vino (ICVV), CSIC- Universidad de La Rioja- Gobierno de la Rioja,Logroño, Spain
*To whom correspondence should be addressed at: Raúl Estévez, Facultat de Medicina, Departament de Ciències Fisiològiques, Universitat deBarcelona-IDIBELL, C/Feixa Llarga s/n 08907 L’Hospitalet de Llobregat, Barcelona, Spain. Tel: (+34) 93 403 9781; Fax: (+34) 93 402 4268;Email: [email protected]
Abstract
Megalencephalic leukoencephalopathy with subcortical cysts (MLC) is a type of leukodystrophy characterized by whitematter edema, and it is caused mainly by recessive mutations in MLC1 and GLIALCAM genes. These variants are called MLC1and MLC2A with both types of patients sharing the same clinical phenotype. In addition, dominant mutations in GLIALCAMhave also been identified in a subtype of MLC patients with a remitting phenotype. This variant has been named MLC2B.GLIALCAM encodes for an adhesion protein containing two immunoglobulin (Ig) domains and it is needed for MLC1targeting to astrocyte–astrocyte junctions. Most mutations identified in GLIALCAM abolish GlialCAM targeting to junctions.However, it is unclear why some mutations behave as recessive or dominant. Here, we used a combination of biochemistrymethods with a new developed anti-GlialCAM nanobody, double-mutants and cysteine cross-links experiments, togetherwith computer docking, to create a structural model of GlialCAM homo-interactions. Using this model, we suggest thatdominant mutations affect different GlialCAM–GlialCAM interacting surfaces in the first Ig domain, which can occurbetween GlialCAM molecules present in the same cell (cis) or present in neighbouring cells (trans). Our results provide aframework that can be used to understand the molecular basis of pathogenesis of all identified GLIALCAM mutations.
IntroductionLeukodystrophies constitute a large group of genetic disordersprimarily affecting CNS white matter (1). Within these, Mega-
lencephalic leukoencephalopathy with subcortical cysts (MLC)is characterized by early-onset macrocephaly, epilepsy and cere-bral white matter edema (2). It can be caused by mutations in two

1108 Human Molecular Genetics, 2020, Vol. 29, No. 7
different genes: MLC1, which is more frequent (3), and GLIALCAM(4). Detailed characterization of MLC patients with GLIALCAMmutations revealed two different phenotypes: MLC2A, causedby two recessive mutations and which is indistinguishable frompatients containing mutations in MLC1, and MLC2B, caused byone dominant mutation and which shows a remitting, morebenign MLC phenotype (2,5).
MLC1 is a membrane protein of unknown functions (6),while GlialCAM is an adhesion molecule that belongs to theimmunoglobulin superfamily (7). GlialCAM works as an oblig-atory subunit of MLC1, being required for MLC1 endoplasmicreticulum exit and targeting to astrocyte–astrocyte junctions (8–10). In addition, GlialCAM is further characterized as an auxiliarysubunit of the ClC-2 chloride channel (11), targeting it to cell–celljunctions and modifying its functional properties (12).
Mutagenesis studies determined that the extracellulardomain of GlialCAM is required for cell junction targeting, aswell as for mediating interactions with itself or with MLC1 andClC-2 (13). Accordingly, all MLC missense mutations in GLIALCAMhave been identified in the extracellular domain (2). Withinthis domain, most missense mutations are located in the firstIg domain (IgV type) and affect GlialCAM localization at cell–cell junctions, observing the same phenotype for mutationsidentified in MLC2A or MLC2B patients (4,14,15). In contrast, theremaining mutations, which are located in the second Ig domain(IgC2 type), do not affect GlialCAM localization (14).
In order to understand what was the biochemical basis ofthe genetic character of these mutations, co-expression exper-iments in primary astrocytes were performed (4). These exper-iments revealed that the co-expression of GlialCAM wild-type(WT) with GlialCAM containing an MLC2B mutation affected thetargeting of GlialCAM WT. In contrast, no effect was observedin GlialCAM WT upon co-expression with GlialCAM containingMLC2A mutations. These effects have been recently validatedin vivo after the characterization of a knock-in Glialcam micecontaining the mutation G89S identified in MLC2B patients (9).This mutation affected the targeting of the protein to cell–celljunctions in Bergmann glia, showed vacuoles in the cerebellumin homozygous mice and the heterozygous mice for this muta-tion showed also a partially altered GlialCAM localization.
All GLIALCAM missense mutations studied to date in thefirst IgV domain reduce the ability of the mutant to interactwith GlialCAM WT in the same cell. However, the mutationp.D128N, identified in MLC2B patients, showed an equal ability tointeract with GlialCAM WT (14). Thus, a reduced interaction withGlialCAM WT does not sufficiently explain why some mutationsbehave in a dominant or in a recessive manner. Furthermore,none of the GLIALCAM MLC2A or MLC2B mutations identifiedto date show a decrease in the interaction of GlialCAM withMLC1 or ClC-2, and all GlialCAM mutants are still able to changethe functional properties of ClC-2, although its targeting to celljunctions is abolished (14).
So far, there is no evidence to suggest molecular clues thatcould be used to predict the genetic behaviour of GlialCAMmutants. One puzzling example is that some amino acids havebeen found containing recessive (the mutation p.R92Q was iden-tified in MLC2A patients) or dominant mutations (the mutationp.R92W was identified in MLC2B patients) (4). Therefore, themolecular basis explaining why a mutation in GLIALCAM isrecessive or dominant is completely unknown.
In this work, we aimed to understand the biochemical basisthat determines why some GLIALCAM mutations behave asrecessive or as dominant. Using a combination of computational
and biochemical approaches, we provide a model for GlialCAMhomo-interactions that explains the genetic behaviour ofGLIALCAM mutations.
ResultsBiochemical characterization of newly identified MLC2BGLIALCAM mutations
Previous studies (14) characterized most missense GLIALCAMmutations identified in MLC2A and MLC2B patients located inthe first IgV domain. These studies indicated that nearly allIgV mutations caused a reduction of the targeting of GlialCAMto cell–cell junctions as well as a reduced ability to interactwith GlialCAM WT (as measured by split-TEV assays). An excep-tion was the mutation p.D128N that, despite having a targetingdefect, maintained its ability to interact with WT GlialCAM (14).
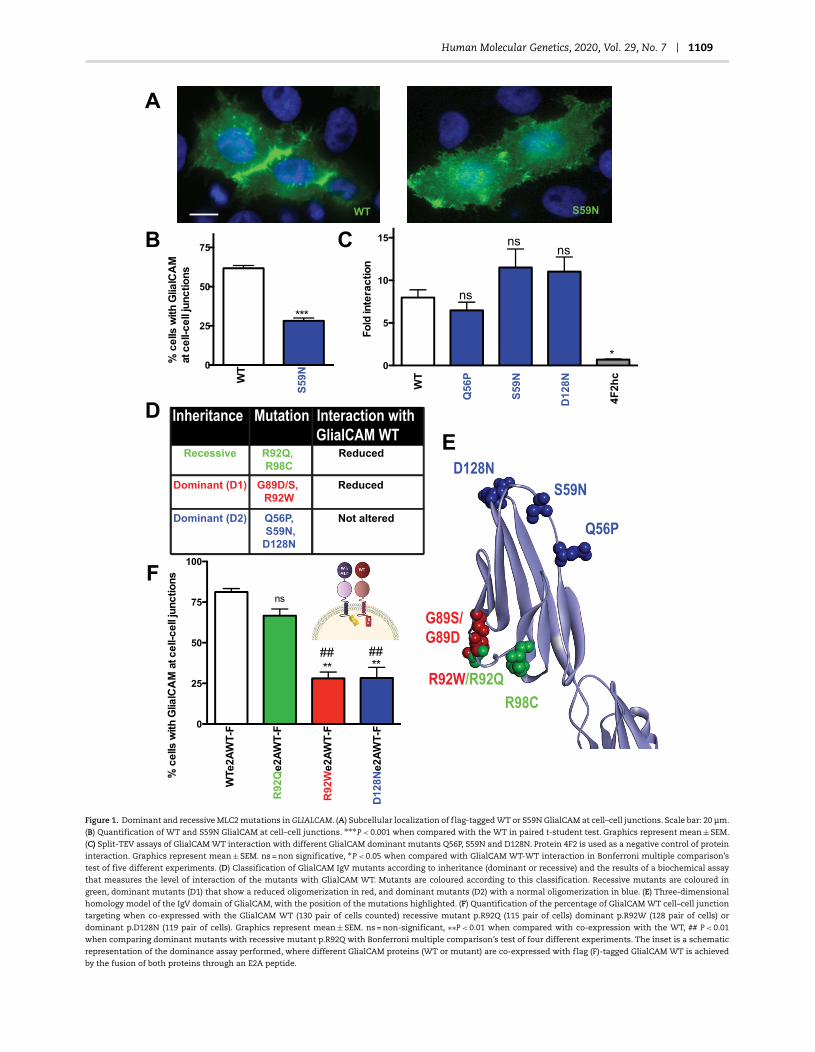
We characterized in more detail two newly identified MLC2BGLIALCAM mutations, p.S59N (2) and p.Q56P (16). Both mutationsshowed a targeting defect to cell–cell junctions (Fig. 1A and B).Then, we analyzed their ability to interact with GlialCAM WTusing split-TEV assays. The experiments showed that mutantsp.Q56P and p.S59N maintained the ability to interact with Glial-CAM WT, as the mutant p.D128N (14) (Fig. 1C).
Taking these new results into account, we classifiedmutations affecting residues into the first IgV domain ofGlialCAM into three different groups (Fig. 1D): 1) mutants foundin MLC2A patients (in green: p.R98C, p.R92Q) that show a reducedability to interact with GlialCAM WT; 2) a subset of mutants(Dominant 1, D1) found in MLC2B patients (in red: p.G89S/D, p.R92W) with a reduced ability to interact with GlialCAM WT; and3) a subset of mutants (Dominant 2, D2) found in MLC2B patients(in blue: p.Q56P, p.S59N, p.D128N) which display a normal abilityto interact with GlialCAM WT. In a homology model of GlialCAMmonomer (see Materials and Methods) (Fig. 1E), D2 mutantswere in predicted loops within the same region of the IgVdomain, very close in space, despite some of them being farin sequence.
In vitro biochemical assays of the dominant behaviourof MLC2B mutants
To systematically analyze the dominant behaviour of MLC2Bmutations, we developed a simple test to determine whether amutation was acting as dominant in terms of altered traffickingof the WT protein. To achieve this, we transfected HeLa cellswith pCDNA3 GlialCAM (WT or containing an MLC2 mutation)-E2A-flag-tagged WT GlialCAM, which allowed the stoichiometricexpression of untagged WT/mutant GlialCAM and flag-taggedWT (Fig. 1F, inset). We also co-transfected with MLC1 in orderto maximize the cells containing GlialCAM at cell–cell junc-tions, as previously described (15). We then evaluated the per-centage of cells where the flag tagged GlialCAM protein waslocated at cell–cell junctions by immunofluorescence experi-ments. These experiments indicated that GlialCAM containingan MLC2A mutation (p.R92Q) did not influence the localizationat cell–cell junctions of the flag-tagged WT GlialCAM, whereasGlialCAM containing two different types of MLC2B mutations(p.R92W and p.D128N) reduced the localization of flag-taggedGlialCAM at cell–cell junctions (Fig. 1F). Thus, this newly devel-oped assay was suitable to elucidate whether a GlialCAM mutantwas affecting in a dominant manner, the junctional traffickingof the WT protein.
Human Molecular Genetics, 2020, Vol. 29, No. 7 1109
Figure 1. Dominant and recessive MLC2 mutations in GLIALCAM. (A) Subcellular localization of flag-tagged WT or S59N GlialCAM at cell–cell junctions. Scale bar: 20 μm.
(B) Quantification of WT and S59N GlialCAM at cell–cell junctions. ∗∗∗P < 0.001 when compared with the WT in paired t-student test. Graphics represent mean ± SEM.
(C) Split-TEV assays of GlialCAM WT interaction with different GlialCAM dominant mutants Q56P, S59N and D128N. Protein 4F2 is used as a negative control of protein
interaction. Graphics represent mean ± SEM. ns = non significative, ∗P < 0.05 when compared with GlialCAM WT-WT interaction in Bonferroni multiple comparison’s
test of five different experiments. (D) Classification of GlialCAM IgV mutants according to inheritance (dominant or recessive) and the results of a biochemical assay
that measures the level of interaction of the mutants with GlialCAM WT. Mutants are coloured according to this classification. Recessive mutants are coloured in
green, dominant mutants (D1) that show a reduced oligomerization in red, and dominant mutants (D2) with a normal oligomerization in blue. (E) Three-dimensional
homology model of the IgV domain of GlialCAM, with the position of the mutations highlighted. (F) Quantification of the percentage of GlialCAM WT cell–cell junction
targeting when co-expressed with the GlialCAM WT (130 pair of cells counted) recessive mutant p.R92Q (115 pair of cells) dominant p.R92W (128 pair of cells) or
dominant p.D128N (119 pair of cells). Graphics represent mean ± SEM. ns = non-significant, ∗∗P < 0.01 when compared with co-expression with the WT, ## P < 0.01
when comparing dominant mutants with recessive mutant p.R92Q with Bonferroni multiple comparison’s test of four different experiments. The inset is a schematic
representation of the dominance assay performed, where different GlialCAM proteins (WT or mutant) are co-expressed with flag (F)-tagged GlialCAM WT is achieved
by the fusion of both proteins through an E2A peptide.
1110 Human Molecular Genetics, 2020, Vol. 29, No. 7
Characterization of a newly developed nanobody thatblocks GlialCAM targeting at cell junctions
As indicated in previous studies (9,13), GlialCAM may formhomophilic interactions in cis (within the same cell) andhomophilic interactions in trans (with the neighbouring cell)in order to localize at cell–cell junctions. With the aim of gettinginformation about the regions of the GlialCAM molecule thatmay be important in mediating trans interactions, we developednanobodies recognizing the extracellular side of GlialCAM.Interestingly, the application of one of the developed nanobodies(Nb 139G1) to cells expressing GlialCAM-VFP blocked thelocalization of GlialCAM at cell–cell junctions in a concentration-dependent manner (Fig. 2A). In contrast, the application of acontrol nanobody detecting an unrelated protein at the maximalconcentration used did not inhibit GlialCAM localization at cell–cell junctions.
To find which regions of the extracellular domain of GlialCAMwere recognized by the nanobody, we expressed GlialCAMwith deletions in the IgC2 or in the IgV domain and usedflow-cytometry to detect the expressed protein. To normalizefor expressed protein at the plasma membrane, we useda monoclonal antibody that detects extracellular GlialCAM.Previous immunofluorescence experiments indicated that bothmutant forms (lacking either IgV or IgC2 domain) are expressedat the plasma membrane (13). Deleting the IgC2 reduced partiallythe binding of the monoclonal and the nanobody (Fig. 2B). Inclear contrast, deletion of the IgV domain abolished completelythe binding of both antibodies, suggesting that both antibodiesmainly bind to the IgV domain (Fig. 2B).
We then tested whether MLC2 GlialCAM mutants affect thebinding of the nanobody using flow cytometry. We monitoredthe binding of the monoclonal antibody as a control of surfaceexpression, which was similar for all our mutants of interest(Fig. 2C for p.Q56P). Interestingly, we observed differences in thebinding of the nanobody between the different mutations. Werepresented the mutants and the effect on nanobody bindingin the model of GlialCAM monomer (Fig. 2E). Some mutants,such as p.G89D and p.R98C, decreased binding (Fig. 2D and E).On the other hand, other mutants such as p.R92Q and p.R92Wincreased binding (Fig. 2D and E). Importantly, mutant p.Q56Pwas the only that showed completely abolished binding of thenanobody (Fig. 2C–E).
Investigating D2 MLC2B mutants reveal a mechanismof dominance
From our previous results using a nanobody that blocked Glial-CAM junctional targeting possibly by inhibiting trans interac-tions, we hypothesized that the region close to residue Q56may be involved in the formation of these trans interactions.Accordingly, we reasoned that mutations p.Q56P, p.S59N andp.D128N, which are all very close in space and are all D2 dom-inant mutants, may affect specifically trans interactions. Thereplacement of a glutamine by a proline may introduce a kinkin the beta-strand. Nonetheless, how mutations p.S59N andp.D128N may affect the structure was unclear.
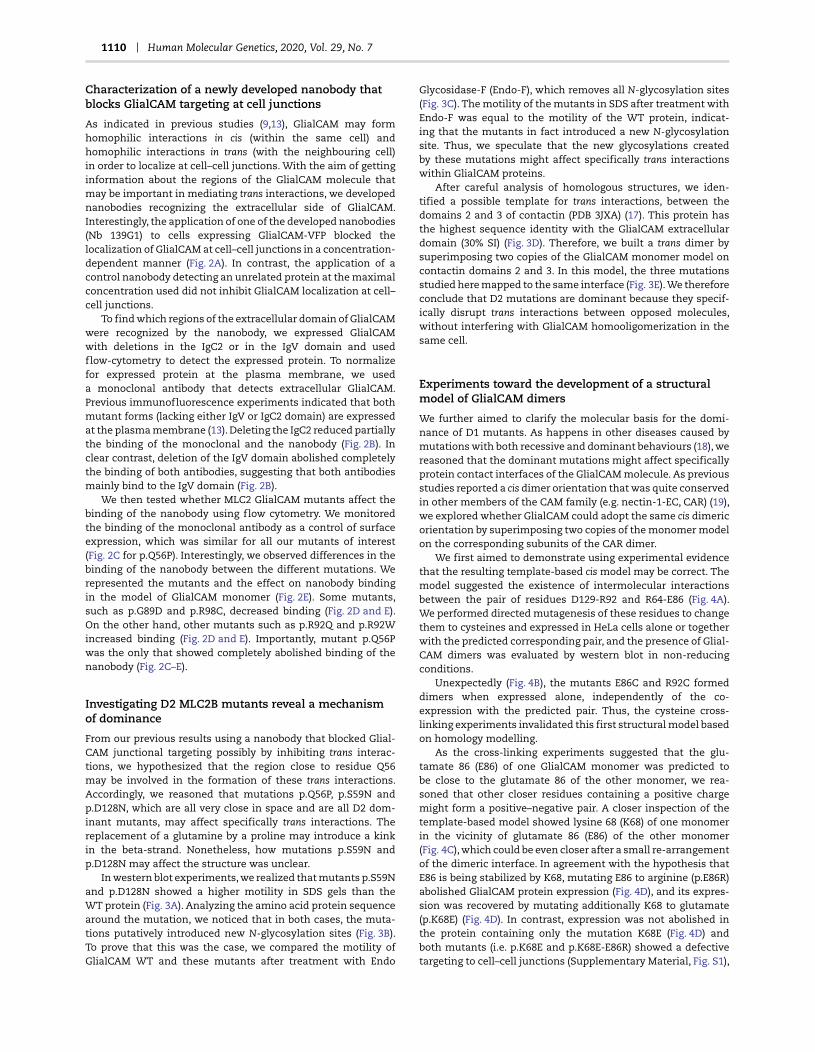
In western blot experiments, we realized that mutants p.S59Nand p.D128N showed a higher motility in SDS gels than theWT protein (Fig. 3A). Analyzing the amino acid protein sequencearound the mutation, we noticed that in both cases, the muta-tions putatively introduced new N-glycosylation sites (Fig. 3B).To prove that this was the case, we compared the motility ofGlialCAM WT and these mutants after treatment with Endo
Glycosidase-F (Endo-F), which removes all N-glycosylation sites(Fig. 3C). The motility of the mutants in SDS after treatment withEndo-F was equal to the motility of the WT protein, indicat-ing that the mutants in fact introduced a new N-glycosylationsite. Thus, we speculate that the new glycosylations createdby these mutations might affect specifically trans interactionswithin GlialCAM proteins.
After careful analysis of homologous structures, we iden-tified a possible template for trans interactions, between thedomains 2 and 3 of contactin (PDB 3JXA) (17). This protein hasthe highest sequence identity with the GlialCAM extracellulardomain (30% SI) (Fig. 3D). Therefore, we built a trans dimer bysuperimposing two copies of the GlialCAM monomer model oncontactin domains 2 and 3. In this model, the three mutationsstudied here mapped to the same interface (Fig. 3E). We thereforeconclude that D2 mutations are dominant because they specif-ically disrupt trans interactions between opposed molecules,without interfering with GlialCAM homooligomerization in thesame cell.
Experiments toward the development of a structuralmodel of GlialCAM dimers
We further aimed to clarify the molecular basis for the domi-nance of D1 mutants. As happens in other diseases caused bymutations with both recessive and dominant behaviours (18), wereasoned that the dominant mutations might affect specificallyprotein contact interfaces of the GlialCAM molecule. As previousstudies reported a cis dimer orientation that was quite conservedin other members of the CAM family (e.g. nectin-1-EC, CAR) (19),we explored whether GlialCAM could adopt the same cis dimericorientation by superimposing two copies of the monomer modelon the corresponding subunits of the CAR dimer.
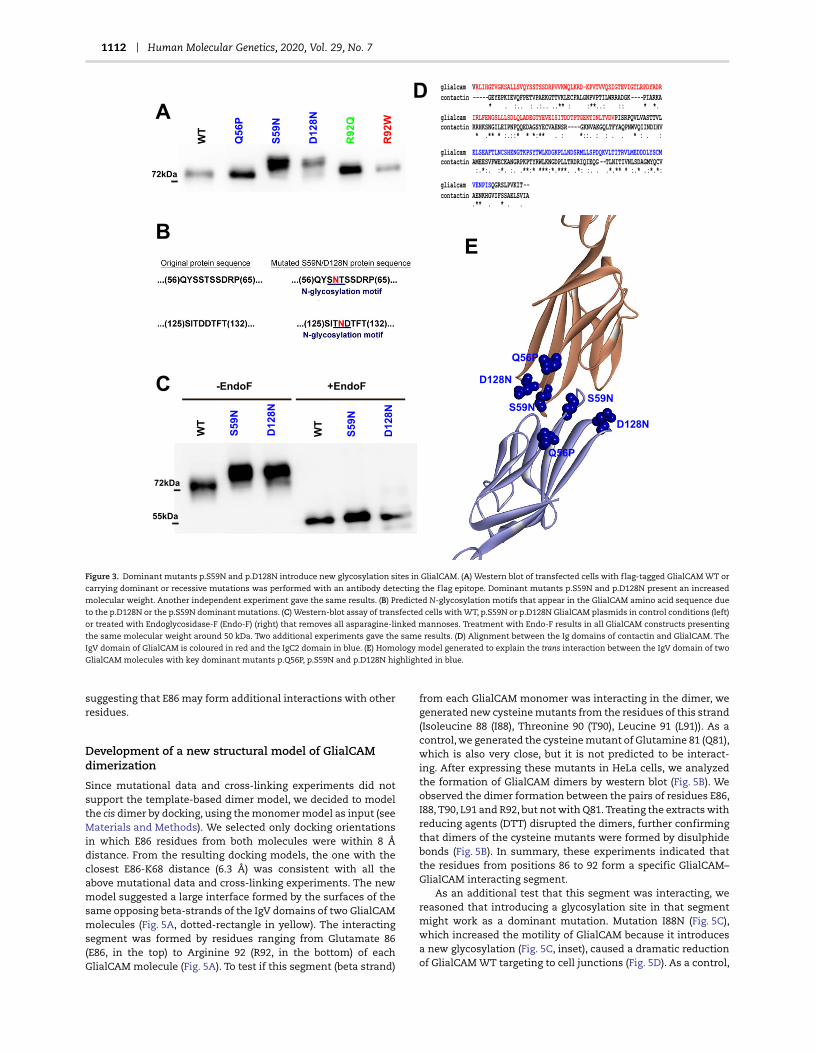
We first aimed to demonstrate using experimental evidencethat the resulting template-based cis model may be correct. Themodel suggested the existence of intermolecular interactionsbetween the pair of residues D129-R92 and R64-E86 (Fig. 4A).We performed directed mutagenesis of these residues to changethem to cysteines and expressed in HeLa cells alone or togetherwith the predicted corresponding pair, and the presence of Glial-CAM dimers was evaluated by western blot in non-reducingconditions.
Unexpectedly (Fig. 4B), the mutants E86C and R92C formeddimers when expressed alone, independently of the co-expression with the predicted pair. Thus, the cysteine cross-linking experiments invalidated this first structural model basedon homology modelling.
As the cross-linking experiments suggested that the glu-tamate 86 (E86) of one GlialCAM monomer was predicted tobe close to the glutamate 86 of the other monomer, we rea-soned that other closer residues containing a positive chargemight form a positive–negative pair. A closer inspection of thetemplate-based model showed lysine 68 (K68) of one monomerin the vicinity of glutamate 86 (E86) of the other monomer(Fig. 4C), which could be even closer after a small re-arrangementof the dimeric interface. In agreement with the hypothesis thatE86 is being stabilized by K68, mutating E86 to arginine (p.E86R)abolished GlialCAM protein expression (Fig. 4D), and its expres-sion was recovered by mutating additionally K68 to glutamate(p.K68E) (Fig. 4D). In contrast, expression was not abolished inthe protein containing only the mutation K68E (Fig. 4D) andboth mutants (i.e. p.K68E and p.K68E-E86R) showed a defectivetargeting to cell–cell junctions (Supplementary Material, Fig. S1),

Human Molecular Genetics, 2020, Vol. 29, No. 7 1111
Figure 2. Characterization of a nanobody that blocks GlialCAM localization at cell–cell junctions. (A) HeLa cells were transfected with VFP-tagged GlialCAM WT construct
and treated with different doses of 139G1 Nb (5, 25 and 50 μg); 181 Nb was used as a negative control. Quantification of the percentage of cells with GlialCAM at cell–cell
junctions without Nb was 67.1 ± 2.86% (110 cells), with 5 μg of Nb was 61.7 ± 0.84% (122 cells), 25 μg of Nb was 39.2 ± 4.4% (117 cells), 50 μg of Nb was 27.8 ± 0.5% (111
cells) and 50 μg of Nb control was 68.1 ± 3.4% (104 cells). Graphics represent mean ± SEM. ∗∗ P < 0.01 in ANOVA Bonferroni multiple comparison test against WT. Data
from two independent transfections. (B) Quantification of the percentage of antibody binding in HEK293T cells transfected with GlialCAM WT, IgC2 deletion of GlialCAM
and IgV deletion of GlialCAM using a flow cytometry assay. Deletions of IgV and IgC2 were performed by PCR resulting in the aminoacid sequence ‘..TSPVPISRPQV..’
for del(IgV) and ‘..TTVLQGRSLPV..’ for del(IgC2). Percentage of antibody binding against del (IgC2) and del (IgV) was normalized with the antibody binding against WT.
The mean percentatge of monoclonal antibody (white) against del (IgC2) was 52.8 ± 8.6% (n = 4) and against del (IgV) was 0.42 ± 0.07% (n = 4). The mean percentage of
139G1 Mb (black) against del (IgC2) was 27.46 ± 7.1% (n = 4) and against del (IgV) was 0.74 ± 0.3% (n = 4). Graphics represent mean ± SEM. ∗∗ P < 0.01 ∗∗∗∗P < 0.0001 in
ANOVA Bonferroni multiple comparison test. (C) Representative flow cytometry experiments showing the binding of the monoclonal antibody (left) and the 139G1
monobody (right) in untransfected HEK293T cells and cells transfected with WT and p.Q56P GlialCAM. (D) Quantification of 139G1 Mb binding by flow cytometry assay
in HEK293T cells transfected with different GlialCAM IgV mutants. All the signal of the nanobody for the different GlialCAM IgV mutants were divided by the signal
of the monoclonal antibody and normalized with the 139G1 Mb binding against GlialCAM WT. The mean percentage of antibody binding for each mutant was the
following: p.Q56P was 0.7 ± 0.4% (n = 5); p.S59 N was 47.5 ± 9.9% (n = 5); p.G89D was 22.9 ± 8.1% (n = 4); p.G89S was 43.1 ± 21.4% (n = 4); p.R92Q was 176.3 ± 23.9% (n = 4);
p.R92W was 189.3 ± 26.3% (n = 4); p.R98C was 17.1 ± 4.5% (n = 3) and p.D128N was 42.3 ± 13.8% (n = 5). Graphics represent mean ± SEM. ns = non-significant; ∗P < 0.05;
∗∗P < 0.01 in ANOVA Bonferroni multiple comparison test.
1112 Human Molecular Genetics, 2020, Vol. 29, No. 7
Figure 3. Dominant mutants p.S59N and p.D128N introduce new glycosylation sites in GlialCAM. (A) Western blot of transfected cells with flag-tagged GlialCAM WT or
carrying dominant or recessive mutations was performed with an antibody detecting the flag epitope. Dominant mutants p.S59N and p.D128N present an increased
molecular weight. Another independent experiment gave the same results. (B) Predicted N-glycosylation motifs that appear in the GlialCAM amino acid sequence due
to the p.D128N or the p.S59N dominant mutations. (C) Western-blot assay of transfected cells with WT, p.S59N or p.D128N GlialCAM plasmids in control conditions (left)
or treated with Endoglycosidase-F (Endo-F) (right) that removes all asparagine-linked mannoses. Treatment with Endo-F results in all GlialCAM constructs presenting
the same molecular weight around 50 kDa. Two additional experiments gave the same results. (D) Alignment between the Ig domains of contactin and GlialCAM. The
IgV domain of GlialCAM is coloured in red and the IgC2 domain in blue. (E) Homology model generated to explain the trans interaction between the IgV domain of two
GlialCAM molecules with key dominant mutants p.Q56P, p.S59N and p.D128N highlighted in blue.
suggesting that E86 may form additional interactions with otherresidues.
Development of a new structural model of GlialCAMdimerization
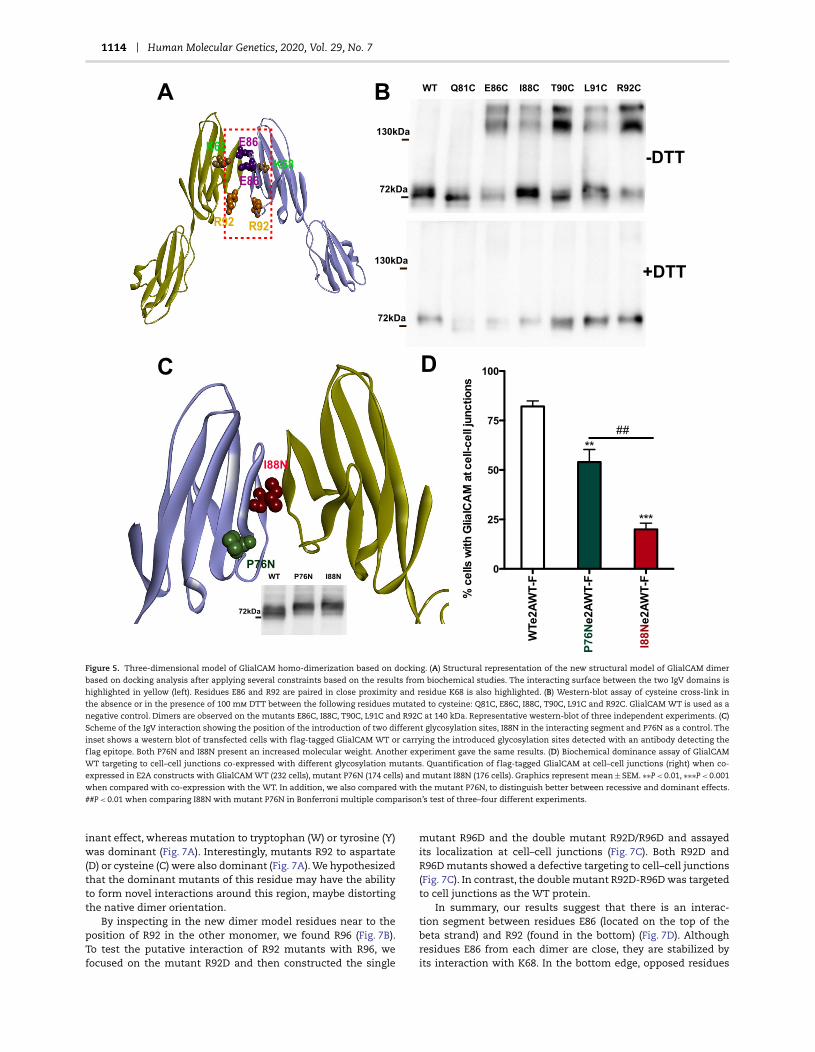
Since mutational data and cross-linking experiments did notsupport the template-based dimer model, we decided to modelthe cis dimer by docking, using the monomer model as input (seeMaterials and Methods). We selected only docking orientationsin which E86 residues from both molecules were within 8 Ådistance. From the resulting docking models, the one with theclosest E86-K68 distance (6.3 Å) was consistent with all theabove mutational data and cross-linking experiments. The newmodel suggested a large interface formed by the surfaces of thesame opposing beta-strands of the IgV domains of two GlialCAMmolecules (Fig. 5A, dotted-rectangle in yellow). The interactingsegment was formed by residues ranging from Glutamate 86(E86, in the top) to Arginine 92 (R92, in the bottom) of eachGlialCAM molecule (Fig. 5A). To test if this segment (beta strand)
from each GlialCAM monomer was interacting in the dimer, wegenerated new cysteine mutants from the residues of this strand(Isoleucine 88 (I88), Threonine 90 (T90), Leucine 91 (L91)). As acontrol, we generated the cysteine mutant of Glutamine 81 (Q81),which is also very close, but it is not predicted to be interact-ing. After expressing these mutants in HeLa cells, we analyzedthe formation of GlialCAM dimers by western blot (Fig. 5B). Weobserved the dimer formation between the pairs of residues E86,I88, T90, L91 and R92, but not with Q81. Treating the extracts withreducing agents (DTT) disrupted the dimers, further confirmingthat dimers of the cysteine mutants were formed by disulphidebonds (Fig. 5B). In summary, these experiments indicated thatthe residues from positions 86 to 92 form a specific GlialCAM–GlialCAM interacting segment.
As an additional test that this segment was interacting, wereasoned that introducing a glycosylation site in that segmentmight work as a dominant mutation. Mutation I88N (Fig. 5C),which increased the motility of GlialCAM because it introducesa new glycosylation (Fig. 5C, inset), caused a dramatic reductionof GlialCAM WT targeting to cell junctions (Fig. 5D). As a control,
Human Molecular Genetics, 2020, Vol. 29, No. 7 1113
Figure 4. Development and biochemical testing of a structural domain of GlialCAM cis-homooligomerization. (A) Three-dimensional model of GlialCAM generated
by homology modelling using another IgCAM molecule as a template. Possible pairs of interacting residues R64-E86 and R92-D129 are highlighted in orange/purple
colours. (B) Western blot of GlialCAM WT or mutants changed to Cysteine R64C, E86C, D129C and R92C expressed alone or co-transfected in pairs (R64C + E86C and
D129C + R92C) performed to observe Cysteine cross-linked dimerization between the two-paired mutants. Mutants E86C and R92C alone show dimerization, as observed
at the 140 kDa band. Representative western blot from three independent experiments. (C) Structural representation of the negatively charged residue E86 in the IgV
dimer interface. Structural analysis revealed the positively charged residue K68 in the vicinity of E86, which could be even closer after a small interface rearrangement.
(D) Western blot of transiently transfected cells with GlialCAM WT, K68E mutant, E86R mutant or GlialCAM carrying both aminoacid changes K68E and E86R. While
E86R is not expressed, double mutant E86R + K68R protein levels are recovered and similar to protein levels of GlialCAM WT. Data shown are from a representative
experiment, out of three independent ones. Actin was used as a loading control.
mutation P76N (Fig. 5C), which also introduces a glycosylationsite, reduced only slightly the targeting of GlialCAM WT to celljunctions (Fig. 5D).
Additional characterization of cysteine mutants in theinteracting segment provide new keys to differentiatedominant and recessive mutants
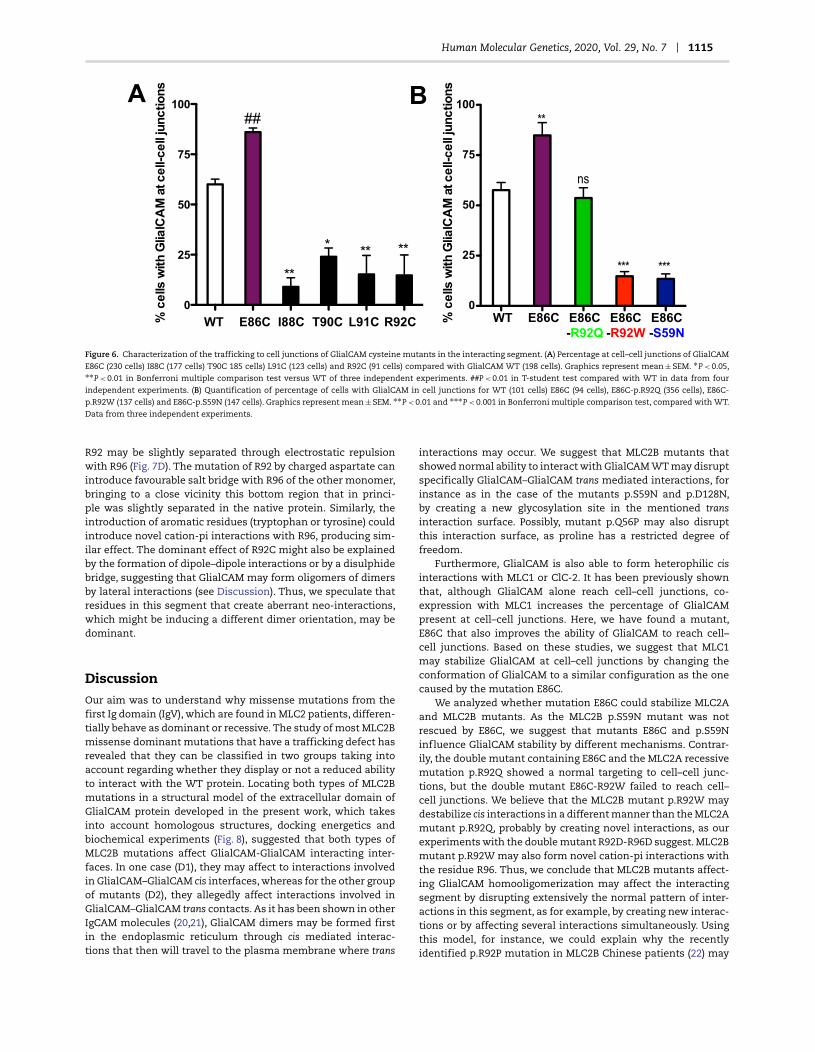
We additionally assessed if these cysteine mutants from theGlialCAM interacting segment showed a defect in the targeting tocell–cell junctions (Fig. 6A). Unexpectedly, compared with Glial-CAM WT expressed alone, mutant E86C showed an increasedtargeting to cell–cell junctions, reaching the same values of theco-expression of GlialCAM plus MLC1 (Fig. 6A) (15). In contrast, allthe other cysteine mutants (I88C, T90C, R91C and R92C) showeda defect in the targeting to cell–cell junctions.
Given these results, we reasoned that mutation E86C mightstabilize the GlialCAM dimer in a more stable conformation,which will result in an increased targeting of the mutant to cell–cell junctions. Then, we decided to explore whether the intro-duction of the mutation E86C might reverse the trafficking defect
caused by recessive or dominant mutations. It was found (Fig. 6B)that the E86C mutation rescued almost completely the traffick-ing defect caused by the recessive mutation p.R92Q, while it didnot increase the targeting of dominant mutants (D1 (p.R92W)and D2 (p.S59N)) to cell junctions (Fig. 6B).
Analyzing the structural mechanism of dominanceof some MLC2B mutations
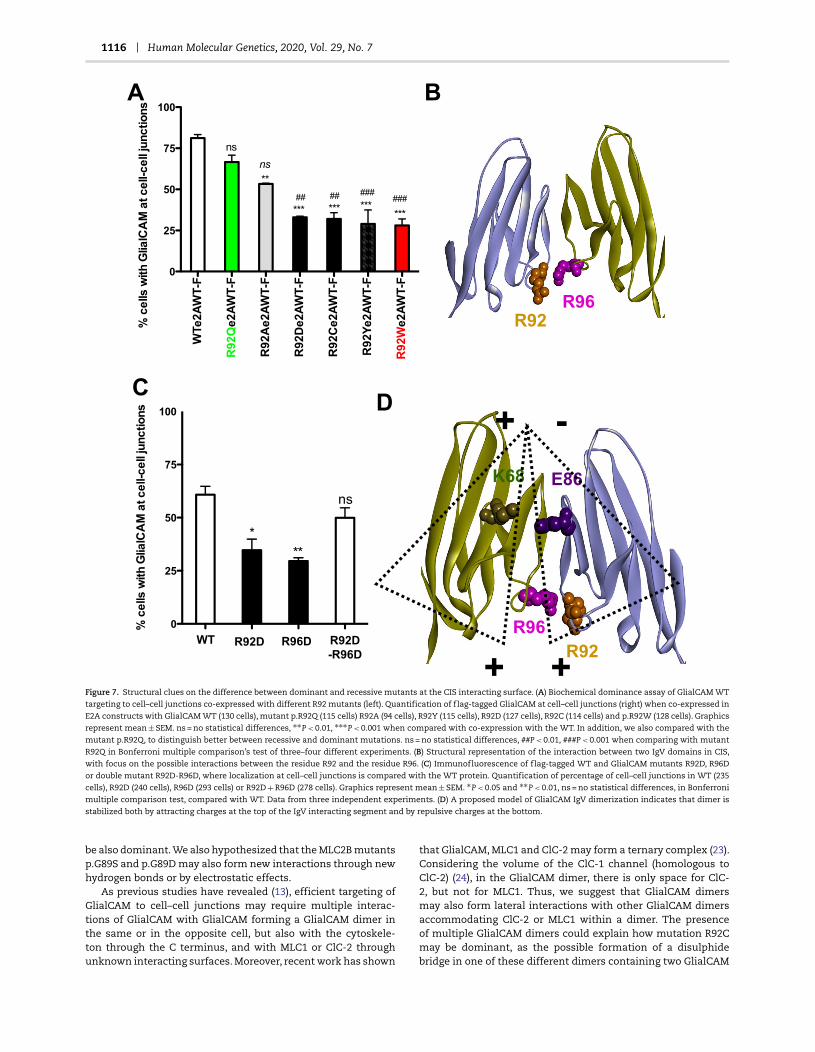
From all GLIALCAM mutations identified in MLC2B patients,those affecting their interaction with GlialCAM (i.e p.G89S/D,p.R92W) are found in the identified cis-dimerization interactingsegment. In contrast, all the MLC2A mutations except p.R92Qare found outside of this segment (p.K68M, p.R98C, p.T132N),suggesting that mutations located in this specific segment willbe dominant. To understand the behaviour of the residue R92, weconstructed several mutants of this residue to different aminoacids, co-expressed them with GlialCAM WT (Fig. 7A) and ana-lyzed whether they behave in a dominant or recessive mannerregarding the targeting of GlialCAM WT. Mutation of R92 to thesmall amino acid alanine (A) did not result in a significant dom-
1114 Human Molecular Genetics, 2020, Vol. 29, No. 7
Figure 5. Three-dimensional model of GlialCAM homo-dimerization based on docking. (A) Structural representation of the new structural model of GlialCAM dimer
based on docking analysis after applying several constraints based on the results from biochemical studies. The interacting surface between the two IgV domains is
highlighted in yellow (left). Residues E86 and R92 are paired in close proximity and residue K68 is also highlighted. (B) Western-blot assay of cysteine cross-link in
the absence or in the presence of 100 mm DTT between the following residues mutated to cysteine: Q81C, E86C, I88C, T90C, L91C and R92C. GlialCAM WT is used as a
negative control. Dimers are observed on the mutants E86C, I88C, T90C, L91C and R92C at 140 kDa. Representative western-blot of three independent experiments. (C)
Scheme of the IgV interaction showing the position of the introduction of two different glycosylation sites, I88N in the interacting segment and P76N as a control. The
inset shows a western blot of transfected cells with flag-tagged GlialCAM WT or carrying the introduced glycosylation sites detected with an antibody detecting the
flag epitope. Both P76N and I88N present an increased molecular weight. Another experiment gave the same results. (D) Biochemical dominance assay of GlialCAM
WT targeting to cell–cell junctions co-expressed with different glycosylation mutants. Quantification of flag-tagged GlialCAM at cell–cell junctions (right) when co-
expressed in E2A constructs with GlialCAM WT (232 cells), mutant P76N (174 cells) and mutant I88N (176 cells). Graphics represent mean ± SEM. ∗∗P < 0.01, ∗∗∗P < 0.001
when compared with co-expression with the WT. In addition, we also compared with the mutant P76N, to distinguish better between recessive and dominant effects.
##P < 0.01 when comparing I88N with mutant P76N in Bonferroni multiple comparison’s test of three–four different experiments.
inant effect, whereas mutation to tryptophan (W) or tyrosine (Y)was dominant (Fig. 7A). Interestingly, mutants R92 to aspartate(D) or cysteine (C) were also dominant (Fig. 7A). We hypothesizedthat the dominant mutants of this residue may have the abilityto form novel interactions around this region, maybe distortingthe native dimer orientation.
By inspecting in the new dimer model residues near to theposition of R92 in the other monomer, we found R96 (Fig. 7B).To test the putative interaction of R92 mutants with R96, wefocused on the mutant R92D and then constructed the single
mutant R96D and the double mutant R92D/R96D and assayedits localization at cell–cell junctions (Fig. 7C). Both R92D andR96D mutants showed a defective targeting to cell–cell junctions(Fig. 7C). In contrast, the double mutant R92D-R96D was targetedto cell junctions as the WT protein.
In summary, our results suggest that there is an interac-tion segment between residues E86 (located on the top of thebeta strand) and R92 (found in the bottom) (Fig. 7D). Althoughresidues E86 from each dimer are close, they are stabilized byits interaction with K68. In the bottom edge, opposed residues
Human Molecular Genetics, 2020, Vol. 29, No. 7 1115
Figure 6. Characterization of the trafficking to cell junctions of GlialCAM cysteine mutants in the interacting segment. (A) Percentage at cell–cell junctions of GlialCAM
E86C (230 cells) I88C (177 cells) T90C 185 cells) L91C (123 cells) and R92C (91 cells) compared with GlialCAM WT (198 cells). Graphics represent mean ± SEM. ∗P < 0.05,∗∗P < 0.01 in Bonferroni multiple comparison test versus WT of three independent experiments. ##P < 0.01 in T-student test compared with WT in data from four
independent experiments. (B) Quantification of percentage of cells with GlialCAM in cell junctions for WT (101 cells) E86C (94 cells), E86C-p.R92Q (356 cells), E86C-
p.R92W (137 cells) and E86C-p.S59N (147 cells). Graphics represent mean ± SEM. ∗∗P < 0.01 and ∗∗∗P < 0.001 in Bonferroni multiple comparison test, compared with WT.
Data from three independent experiments.
R92 may be slightly separated through electrostatic repulsionwith R96 (Fig. 7D). The mutation of R92 by charged aspartate canintroduce favourable salt bridge with R96 of the other monomer,bringing to a close vicinity this bottom region that in princi-ple was slightly separated in the native protein. Similarly, theintroduction of aromatic residues (tryptophan or tyrosine) couldintroduce novel cation-pi interactions with R96, producing sim-ilar effect. The dominant effect of R92C might also be explainedby the formation of dipole–dipole interactions or by a disulphidebridge, suggesting that GlialCAM may form oligomers of dimersby lateral interactions (see Discussion). Thus, we speculate thatresidues in this segment that create aberrant neo-interactions,which might be inducing a different dimer orientation, may bedominant.
DiscussionOur aim was to understand why missense mutations from thefirst Ig domain (IgV), which are found in MLC2 patients, differen-tially behave as dominant or recessive. The study of most MLC2Bmissense dominant mutations that have a trafficking defect hasrevealed that they can be classified in two groups taking intoaccount regarding whether they display or not a reduced abilityto interact with the WT protein. Locating both types of MLC2Bmutations in a structural model of the extracellular domain ofGlialCAM protein developed in the present work, which takesinto account homologous structures, docking energetics andbiochemical experiments (Fig. 8), suggested that both types ofMLC2B mutations affect GlialCAM-GlialCAM interacting inter-faces. In one case (D1), they may affect to interactions involvedin GlialCAM–GlialCAM cis interfaces, whereas for the other groupof mutants (D2), they allegedly affect interactions involved inGlialCAM–GlialCAM trans contacts. As it has been shown in otherIgCAM molecules (20,21), GlialCAM dimers may be formed firstin the endoplasmic reticulum through cis mediated interac-tions that then will travel to the plasma membrane where trans
interactions may occur. We suggest that MLC2B mutants thatshowed normal ability to interact with GlialCAM WT may disruptspecifically GlialCAM–GlialCAM trans mediated interactions, forinstance as in the case of the mutants p.S59N and p.D128N,by creating a new glycosylation site in the mentioned transinteraction surface. Possibly, mutant p.Q56P may also disruptthis interaction surface, as proline has a restricted degree offreedom.
Furthermore, GlialCAM is also able to form heterophilic cisinteractions with MLC1 or ClC-2. It has been previously shownthat, although GlialCAM alone reach cell–cell junctions, co-expression with MLC1 increases the percentage of GlialCAMpresent at cell–cell junctions. Here, we have found a mutant,E86C that also improves the ability of GlialCAM to reach cell–cell junctions. Based on these studies, we suggest that MLC1may stabilize GlialCAM at cell–cell junctions by changing theconformation of GlialCAM to a similar configuration as the onecaused by the mutation E86C.
We analyzed whether mutation E86C could stabilize MLC2Aand MLC2B mutants. As the MLC2B p.S59N mutant was notrescued by E86C, we suggest that mutants E86C and p.S59Ninfluence GlialCAM stability by different mechanisms. Contrar-ily, the double mutant containing E86C and the MLC2A recessivemutation p.R92Q showed a normal targeting to cell–cell junc-tions, but the double mutant E86C-R92W failed to reach cell–cell junctions. We believe that the MLC2B mutant p.R92W maydestabilize cis interactions in a different manner than the MLC2Amutant p.R92Q, probably by creating novel interactions, as ourexperiments with the double mutant R92D-R96D suggest. MLC2Bmutant p.R92W may also form novel cation-pi interactions withthe residue R96. Thus, we conclude that MLC2B mutants affect-ing GlialCAM homooligomerization may affect the interactingsegment by disrupting extensively the normal pattern of inter-actions in this segment, as for example, by creating new interac-tions or by affecting several interactions simultaneously. Usingthis model, for instance, we could explain why the recentlyidentified p.R92P mutation in MLC2B Chinese patients (22) may
1116 Human Molecular Genetics, 2020, Vol. 29, No. 7
Figure 7. Structural clues on the difference between dominant and recessive mutants at the CIS interacting surface. (A) Biochemical dominance assay of GlialCAM WT
targeting to cell–cell junctions co-expressed with different R92 mutants (left). Quantification of flag-tagged GlialCAM at cell–cell junctions (right) when co-expressed in
E2A constructs with GlialCAM WT (130 cells), mutant p.R92Q (115 cells) R92A (94 cells), R92Y (115 cells), R92D (127 cells), R92C (114 cells) and p.R92W (128 cells). Graphics
represent mean ± SEM. ns = no statistical differences, ∗∗P < 0.01, ∗∗∗P < 0.001 when compared with co-expression with the WT. In addition, we also compared with the
mutant p.R92Q, to distinguish better between recessive and dominant mutations. ns = no statistical differences, ##P < 0.01, ###P < 0.001 when comparing with mutant
R92Q in Bonferroni multiple comparison’s test of three–four different experiments. (B) Structural representation of the interaction between two IgV domains in CIS,
with focus on the possible interactions between the residue R92 and the residue R96. (C) Immunofluorescence of flag-tagged WT and GlialCAM mutants R92D, R96D
or double mutant R92D-R96D, where localization at cell–cell junctions is compared with the WT protein. Quantification of percentage of cell–cell junctions in WT (235
cells), R92D (240 cells), R96D (293 cells) or R92D + R96D (278 cells). Graphics represent mean ± SEM. ∗P < 0.05 and ∗∗P < 0.01, ns = no statistical differences, in Bonferroni
multiple comparison test, compared with WT. Data from three independent experiments. (D) A proposed model of GlialCAM IgV dimerization indicates that dimer is
stabilized both by attracting charges at the top of the IgV interacting segment and by repulsive charges at the bottom.
be also dominant. We also hypothesized that the MLC2B mutantsp.G89S and p.G89D may also form new interactions through newhydrogen bonds or by electrostatic effects.
As previous studies have revealed (13), efficient targeting ofGlialCAM to cell–cell junctions may require multiple interac-tions of GlialCAM with GlialCAM forming a GlialCAM dimer inthe same or in the opposite cell, but also with the cytoskele-ton through the C terminus, and with MLC1 or ClC-2 throughunknown interacting surfaces. Moreover, recent work has shown
that GlialCAM, MLC1 and ClC-2 may form a ternary complex (23).Considering the volume of the ClC-1 channel (homologous toClC-2) (24), in the GlialCAM dimer, there is only space for ClC-2, but not for MLC1. Thus, we suggest that GlialCAM dimersmay also form lateral interactions with other GlialCAM dimersaccommodating ClC-2 or MLC1 within a dimer. The presenceof multiple GlialCAM dimers could explain how mutation R92Cmay be dominant, as the possible formation of a disulphidebridge in one of these different dimers containing two GlialCAM

Human Molecular Genetics, 2020, Vol. 29, No. 7 1117
Figure 8. Summary of the structural model proposed for GlialCAM homodimers forming cis and trans interaction through different surfaces of its IgV domain. Cis
dimerization is achieved by interactions between two opposing beta-strands of the IgV domain and trans interactions occurr between salient loops of both IgV domains.
Residues mutated in MLC2A patients (recessive) are shown in green, D1 residues mutated in MLC2B patients are shown in red and D2 residues mutated in MLC2B patients
are shown in blue. The classification of D1 and D2 mutants has been explained previously.
molecules with R92 mutated to cysteine may destabilize theoverall oligomeric organization at the cell junction. It has beenshown that other IgCAM molecules similar to GlialCAM have theability to form lateral interactions that are also important forclustering through IgC2 domains (20). Therefore, maybe somemutations found in MLC2 patients in the IgC2 domain may affectGlialCAM–GlialCAM lateral interactions.
To conclude, our structural model (Fig. 8) of GlialCAM–GlialCAM dimers mediating cis and trans interactions couldbe used to predict the behaviour of new MLC2 mutants (22).For instance, the recently identified MLC2A mutation p.T132Nis not found in an interacting surface of GlialCAM, so it maybe recessive. The other new mutant identified, p.K68M, maydestabilize GlialCAM–GlialCAM interaction by affecting its
1118 Human Molecular Genetics, 2020, Vol. 29, No. 7
electrostatic interaction with E86. Since it is not creating a newinteraction, we propose it may also be recessive. In summary,this work provides new insights into the molecular basis ofGLIALCAM mutations. We believe that this knowledge will beimportant to help developing therapeutic strategies for MLCpatients with GLIALCAM mutations.
Materials and MethodsMolecular biology
Plasmids were constructed using standard molecular biologytechniques employing recombinant PCR and the Multisite Gate-way System (Invitrogen, Carlsbad, CA, USA). For localizationstudies, all GlialCAM constructs were flag tagged at their C-terminus (three flag copies) and cloned into the pCDNA3 vector.Flag tagged WT GlialCAM was co-expressed with different Glial-CAM mutants by generating constructs where both cDNAs werelinked to the self-cleavable 2A peptide (E2A). The sequence ofthe E2A peptide was: Gly-Ser-Gly-Glu-Gly-Arg-Gly-Ser-Leu-Leu-Thr-Cys-Gly-Asp-Val-Glu-Glu-Asn-Pro-Gly. The integrity of all clonedconstructs was confirmed by sequencing. All cDNAs are fromhuman origin. In the results section, mutations found in patientsare mentioned using the genetic nomenclature (for instancep.R92W), whereas other mutants simply describe the mutation(for instance E86C).
Cell transfection
HeLa cells were grown in Dublecco’s modified Eagle’s mediumcontaining (v/v) 10% foetal bovine serum (FBS, Sigma, StLouis, MO, USA) 1% glutamine and 1% penicillin/streptomycinat 37◦C in a humidity controlled incubator with 5% CO2.Cells were transiently transfected with Transfectin LipidReagent (Bio-Rad, Madrid, Spain) following the manufacturer’sinstructions (https://www.bio-rad.com/webroot/web/pdf/lsr/literature/4106254A.pdf). Experiments were performed 48–72 hafter cell transfection. To assay whether a mutant was actingin a dominant manner, cells were co-transfected with GlialCAMWT (or mutant)-E2A- GlialCAM WT-flag tagged plus MLC1. Thiswas done to maximize the percentage of GlialCAM in cell–celljunctions, as it was previously described that MLC1 improvesthe percentage of GlialCAM in cell–cell junctions (15). In thiscase, we always detect MLC1 and flag-tagged GlialCAM byimmunofluorescence and performed our quantitative analyseson GlialCAM only on cells that express MLC1. To study the effectof mutations on GlialCAM trafficking, GlialCAM WT or mutantflag-tagged were transfected independently.
Immunofluorescence of transfected cells
Twenty four hour transfected HeLa cells were split and trans-ferred onto glass coverslips in Petri dishes, and grown for further24–48 h. Later, cells were fixed with phosphate-buffered saline(PBS) containing 3% paraformaldehyde (PFA) for 20 min, blockedand permeabilized with 10% FBS and 0.1% Triton X-100 in PBS for2 h at room temperature (RT). Primary antibodies were diluted inthe same solution and incubated 1 h at RT. The antibodies usedwere mouse anti-flag (1:500) (Sigma) and polyclonal rabbit anti-MLC1 (1:100) (25). Cells were washed and incubated with sec-ondary antibodies for 2 h at RT. Coverslips were mounted in Vec-tashield medium (Vector Laboratories, Burlingam, CA, USA), with1.5 μg/mL 4′,6-diamidino-2-phenylindole (DAPI, Sigma) and visu-alized using a DSU spinning disk confocal microscope (Olympus,Tokyo, Japan). Pairs of immunostained cells were analyzed man-
ually to determine whether or not the staining was present injunctions, as described previously (13).
Split-TEV method
The Split-TEV assay was performed exactly as described pre-viously (Lopez-Hernandez et al. 2011b; Capdevila- Nortes et al.2012; Jeworutzki et al. 2012). Briefly, TEV protease was dividedinto two fragments: the TEV-N (residues 1–118) and the TEV-C(residues 119–242). TEV-N fragment, the TEV protease recogni-tion site and the chimeric transcription factor GV were fusedto the C-terminus of GlialCAM WT in a pCDNA3 vector con-taining a cytomegalovirus promoter. In addition, we fused theTEV-C fragment to the C-terminus of WT or different GlialCAMmutants. All proteins with the TEV-C fragments were cloned ina pCDNA6.2/V5-pL Dest, containing the herpes simplex virusthymidine kinase promoter, to obtain low to moderate levelsof expression. The non-interacting protein 4F2hc was used as anegative control.
Cysteine crosslinking assays, western-blot andglycosylation analysis
For western blot studies, lysates were prepared by cell homog-enization in PBS containing 1% Triton X-100 and proteaseinhibitors: 1 mm pepstatin and leupeptin, 1 mm aprotinin and1 mm PMSF, incubated for 1 h at 4◦C and centrifuged. Proteins insupernatants were quantified using the BCA Kit (Pierce, ThermoScientific, Rockford, IL, USA) and mixed with SDS loading samplebuffer (LSB4X). When processing samples of proteins that mayestablish disulphide bonds, samples were prepared with LSB4Xwithout reducing agents and boiled for 3 min at 50◦C. In orderto confirm the disulphide-bound nature of dimeric proteins,protein extracts were treated with 100 mm DTT in SDS loadingsample buffer and boiled at 95◦C for 5 min.
Western blot analysis was performed as previously described(26). Membranes were incubated with primary antibodies: anti-Flag (1:500) and anti-beta actin (1:5000, Sigma) and secondaryantibodies: HRP-conjugated anti-mouse (1:5000; Jackson).
Evaluation of glycosylation status of GlialCAM protein wasachieved through denaturing glycosylation assays with PNGaseF (New Englan BioLabs, Ipswich, UK). Protein extracts were dena-tured by heating at 100◦C for 10 min with glycoprotein denatur-ing buffer and treated with PNGase F enzyme for 1 h at 37◦C.Finally, treated samples were prepared with LSB4X and analyzedby western blot.
Obtention of nanobodies and minibodies againstGlialCAM
The sequence of 139G1 Nb was cloned into the vector pHEN2that included a hexa-histidine tag at the C-terminus. 139G1 Nbwas produced by Hybrigenic Services SAS, Paris, France. Threerounds of phage display selection were carried out using cellsexpressing GlialCAM. Hybrigenics’ synthetic hsd2Ab VHH libraryof 3.109 clones was expressed at the surface of M13 phage.Hybrigenics’ phage display allowed selecting VHHs recognizingthe non-adsorbed antigen in a native form. Selected VHHs werevalidated in non-adsorbed Phage ELISA and were then tested inFACS assay. The 139G1 nanobody plasmid was amplified in theE. coli WK6 strain (SBRC, Instruct Integrating Biology, Brussel),as described previously (27). In brief, 3–4 individual coloniesof the 139G1 Nb were randomly picked, and those were pro-duced as soluble His- and Capture Select C-tagged proteins (MW
Human Molecular Genetics, 2020, Vol. 29, No. 7 1119
12–15 kDa) in the periplasm of E. coli. Inducible periplasmicexpression of Nb in E. coli WK6 strain produced milligrammeamounts of > 95% pure Nb using immobilized Ni/NTA Agaroseresin (Qiagen, Hilden, Germany) from the periplasmic extract ofa 1-l culture. Purified Nb (2–10 mg ml−1) in 20 mm Tris-Base, NaCl150 mm, pH 7.4 were frozen in liquid nitrogen and stored at −80◦Cbefore use.
The VHH 139G1 coding sequence was inserted in pFuse plas-mid (Hybrigenic Services), which included an Fc fragment ofrabbit IgG2. The production of 139G1 Minibody (Mb) VHH 139G1fused at their C-terminus to the Fc fragment of rabbit IgG2 wascarried out in HEK 293 T cells. These cells were grown at 37◦Cin an atmosphere of 5% CO2 in DMEM (Sigma-Aldrich, St Louis,MO, USA) supplemented with 1 mm sodium pyruvate, 2 mm L-glutamine, 100 U/ml streptomycin, 100 mg/ml penicillin and5% (v/v) fetal bovine serum. The cells were seeded on 10 cmculture dishes and transiently transfected with 10 μg of 139G1Mb using Trasfectin reagent (Bio-Rad, Hercules, CA, USA). At 24 hafter the transient transfection, the media was exchanged for aserum-free media, and the cell supernatant was collected 1 daylater. The presence of the Mb in this supernatant was confirmedby western blot using an HRP-conjugated anti-rabbit antibody(1:5000; Jackson).
Flow cytometry
For flow cytometry, cells were processed as previously described(26). Cells were transfected with the different GlialCAM IgVmutants into six-well plates. Forty-eight hours after transfec-tion, cells were detached using Trypsin-EDTA 1X (BiologicalIndustries, Kibbutz Beit-Hanemek, Israel) and resuspended in500 μL of DMEM (Sigma-Aldrich, St Louis, MO, USA) supple-mented with 1 mm sodium pyruvate, 2 mm L-glutamine, 100 U/mlstreptomycin, 100 mg/ml penicillin and 5% (v/v) fetal bovineserum. The following antibodies were used: monoclonal anti-HepaCAM 0.5 mg/ml (1:50; R&D Systems) and the Mb developedin this work 139G1 Mb 0.015 mg/ml (1:1; Hybrigenic Services).These antibodies were added separately to each condition andincubated for 30 min at 4◦C. Cells were washed once in 1 mLof 0.2% FBS in PBS and resuspended again in 100 mL of cellculture medium. The secondary antibodies used were: Alexafluor 488 anti-mouse and Alexa fluor 488 anti-rabbit (1:20;Molecular Probes, Inc., Eugene, OR, USA). Secondary antibodieswere added and further incubated for 30 min at 4◦C. Cells wererinsed once more and resuspended in 1 mL of 0.2% FBS inPBS. To assess viability, propidium iodide was added to a finalconcentration of 1 mg/ml immediately before FACS analysis,performed with a Cytometre FACS Canto using the followingfilter sets: 550 bandpass (GFP) and 620/22 (PI). Untransfectedcells and unstained transfected cells were used to set thecompensation parameters. Data analysis was performed usingDIBA software.
Incubation of cells with the 139G1 nanobody
HeLa cells transiently transfected with VFP-tagged GlialCAMWT construct were seeded on coverslips (100.000 cells) andtreated with different doses of 139G1 Nb (5, 25 and 50 μg)for 24 h. Cells were then fixed with PBS containing 4% PFAfor 20 min and blocked with 10% FBS in PBS for 2 h at RT.Cells were washed three times and coverslips were mountedin Vectashield medium (Vector Laboratories) with 1.5 μg/mlDAPI (Sigma). For the image acquisition, we worked with anOlympus DSU spinning disk confocal microscope. Experiments
were analyzed using ImageJ. Cells incubated with 50 μg with thecontrol nanobody 181Nb (28) were used as a negative control.
Modelling of GlialCAM monomer
A model of extracellular GlialCAM (containing the IgV and IgC2domains) was built with HHPred (29) based on CAR structure(PDB 3JZ7; 24% SI). There are other available templates for theGlialCAM extracellular domains with 24–30% SI (e.g. 2V5T 24%,1F97 28%, 3LAF 29%, 3JXA 30%), but none of them yielded bet-ter models. Modelling of the IgV alone (with templates 4GOS,2PKD, 1NEU, 4K55, 3R0N), or using other modelling software (e.g.PSIPRED, genThreader, pDomThreader, pGenThreader, T-coffee),did not improve the models.
Modelling of GlialCAM cis dimer
Previous studies reported a cis dimer orientation that was quiteconserved in other members of the CAM family (e.g. nectin-1-EC,CAR) (19). We initially explored whether GlialCAM could adoptthe same cis dimeric orientation by superimposing two copies ofthe monomer model on the corresponding subunits of the CARdimer (PDB 3JZ7).
However, mutational data and cross-linking experiments didnot support the template-based dimer model, so we also mod-elled the cis dimer by docking, using the monomer model asinput. We applied the standard pyDock protocol (30,31). We ranFTDock for exhaustive scanning of protein–protein orientationsand then evaluated the energy of the 10 000 resulting dockingposes with pyDock scoring function. We finally checked all dock-ing models in search for those that satisfied mutational data.
Modelling of GlialCAM trans dimer
During our analysis of homologous structures, we identified apossible template for interactions, between the domains 2 and3 of contactin (PDB 3JXA) (17). This protein has the highestsequence identity with GlialCAM extracellular domain (30% SI).Therefore, we built trans dimer by superimposing two copies ofGlialCAM monomer model on contactin domains 2 and 3.
Supplementary MaterialSupplementary Material is available at HMG online.
FundingThis work was supported in part by the Spanish Ministerio deCiencia e Innovación (MICINN) (RTI2018-093493-B-I00 to RE) andBIO2016-79930-R to JFR. RE is a recipient of an ICREA Academiaprize.
Conflict of Interest: None declared.
References1. van der Knaap, M.S., Schiffmann, R., Mochel, F. et al. (2019)
Diagnosis, prognosis, and treatment of leukodystrophies.Lancet Neurol., 18, 962–972.
2. van der Knaap, M.S.S., Boor, I., Estevez, R. et al. (2012) Mega-lencephalic leukoencephalopathy with subcortical cysts:chronic white matter oedema due to a defect in brain ionand water homoeostasis. Lancet Neurol., 11, 973–985.
1120 Human Molecular Genetics, 2020, Vol. 29, No. 7
3. Leegwater, P.A., Yuan, B.Q., van der Steen, J. et al. (2001) Muta-tions of MLC1 (KIAA0027), encoding a putative membraneprotein, cause megalencephalic leukoencephalopathy withsubcortical cysts. Am. J. Hum. Genet., 68, 831–838.
4. López-Hernández, T., Ridder, M.C., Montolio, M. et al.(2011) Mutant GlialCAM causes megalencephalic leukoen-cephalopathy with subcortical cysts, benign familial macro-cephaly, and macrocephaly with retardation and autism.Am. J. Hum. Genet., 88, 422–432.
5. Hamilton, E.M.C., Cialdella, F., Rappard, V., Di, F. et al.(2018) Megalencephalic leukoencephalopathy with subcorti-cal cysts: characterization of disease variants. Neurology, 90,E1395–E1403.
6. Estévez, R., Elorza-Vidal, X., Gaitán-Peñas, H. et al. (2018)Megalencephalic leukoencephalopathy with subcorticalcysts: a personal biochemical retrospective. Eur. J. Med.Genet., 61, 50–60.
7. Barrallo-Gimeno, A., Gradogna, A., Zanardi, I. et al. (2015)Regulatory-auxiliary subunits of CLC chloride channel-transport proteins. Austral. J. Phys., 593, 4111–4127.
8. Bugiani, M., Dubey, M., Breur, M. et al. (2017) Megalencephalicleukoencephalopathy with cysts: the Glialcam -null mousemodel. Ann. Clin. Transl. Neurol., 4, 450–465.
9. Hoegg-Beiler, M.B., Sirisi, S., Orozco, I.J. et al. (2014) DisruptingMLC1 and GlialCAM and ClC-2 interactions in leukodystro-phy entails glial chloride channel dysfunction. Nat. Commun.,5, 3475.
10. Capdevila-Nortes, X., López-Hernández, T., Apaja, P.M. etal. (2013) Insights into MLC pathogenesis: GlialCAM is anMLC1 chaperone required for proper activation of volume-regulated anion currents. Hum. Mol. Genet., 22, 4405–4416.
11. Jeworutzki, E., López-Hernández, T., Capdevila-Nortes, X. etal. (2012) GlialCAM, a protein defective in a Leukodystrophy,serves as a ClC-2 cl - channel auxiliary subunit. Neuron, 73,951–961.
12. Jeworutzki, E., Lagostena, L., Elorza-Vidal, X. et al. (2014)GlialCAM, a CLC-2 cl(−) channel subunit, activates the slowgate of CLC chloride channels. Biophys. J., 107, 1105–1116.
13. Capdevila-Nortes, X., Jeworutzki, E., Elorza-Vidal, X. et al.(2015) Structural determinants of interaction, trafficking andfunction in the ClC-2/MLC1 subunit GlialCAM involved inleukodystrophy. Austral. J. Phys., 593, 4165–4180.
14. Arnedo, T., López-Hernández, T., Jeworutzki, E. et al. (2014)Functional analyses of mutations in HEPACAM causingmegalencephalic leukoencephalopathy. Hum. Mutat., 35,1175–1178.
15. López-Hernández, T., Sirisi, S., Capdevila-Nortes, X. et al.(2011) Molecular mechanisms of MLC1 and GLIALCAM muta-tions in megalencephalic leukoencephalopathy with subcor-tical cysts. Hum. Mol. Genet., 20, 3266–3277.
16. Arnedo, T., Aiello, C., Jeworutzki, E. et al. (2014) Expanding thespectrum of megalencephalic leukoencephalopathy withsubcortical cysts in two patients with GLIALCAM mutations.Neurogenetics, 15, 41–48.
17. Bouyain, S. and Watkins, D.J. (2010) The protein tyrosinephosphatases PTPRZ and PTPRG bind to distinct membersof the contactin family of neural recognition molecules. Proc.Nat. Acad. Sci. U.S.A., 107, 2443–2448.
18. Estévez, R. and Jentsch, T.J. (2002) CLC chloride channels:correlating structure with function. Curr. Opin. Struct. Biol., 12,531–539.
19. Narita, H., Yamamoto, Y., Suzuki, M. et al. (2011) Crystalstructure of the cis-dimer of Nectin-1. J. Biol. Chem., 286,12659–12669.
20. Kamiguchi, H. and Lemmon, V. (2000) IgCAMs: bidirectionalsignals underlying neurite growth. Curr. Opin. Cell Biol., 12,598–605.
21. Matthäus, C., Langhorst, H., Schütz, L. et al. (2017) Cell-cell communication mediated by the CAR subgroup ofimmunoglobulin cell adhesion molecules in health and dis-ease. Mol. Cell. Neurosci., 81, 32–40.
22. Shi, Z., Yan, H.-F., Cao, B.-B. et al. (2019) Identification inChinese patients with GLIALCAM mutations of megalen-cephalic leukoencephalopathy with subcortical cysts andbrain pathological study on Glialcam knock-in mouse mod-els. World J. Pediatr., 15, 454–464.
23. Sirisi, S., Elorza-Vidal, X., Arnedo, T. et al. (2017) Depolariza-tion causes the formation of a ternary complex betweenGlialCAM, MLC1 and ClC-2 in astrocytes: implications inmegalencephalic leukoencephalopathy. Hum. Mol. Genet., 26,2436–2450.
24. Wang, K., Preisler, S.S., Zhang, L. et al. (2019) Structure ofthe human ClC-1 chloride channel. PLOS Biol., e3000218,17.
25. Teijido, O., Casaroli-Marano, R., Kharkovets, T. et al. (2007)Expression patterns of MLC1 protein in the central andperipheral nervous systems. Neurobiol. Dis., 26, 532–545.
26. Teijido, O., Martínez, A., Pusch, M. et al. (2004) Localiza-tion and functional analyses of the MLC1 protein involvedin megalencephalic leukoencephalopathy with subcorticalcysts. Hum. Mol. Genet., 13, 2581–2594.
27. Pardon, E., Laeremans, T., Triest, S. et al. (2014) A generalprotocol for the generation of Nanobodies for structuralbiology. Nat. Protoc., 9, 674–693.
28. Errasti-Murugarren, E., Fort, J., Bartoccioni, P. et al. (2019) Lamino acid transporter structure and molecular bases forthe asymmetry of substrate interaction. Nat. Commun., 10,1807.
29. Soding, J., Biegert, A. and Lupas, A.N. (2005) The HHpredinteractive server for protein homology detection and struc-ture prediction. Nucleic Acids Res., 33, W244–W248.
30. Cheng, T.M.-K., Blundell, T.L. and Fernandez-Recio, J. (2007)pyDock: electrostatics and desolvation for effective scoringof rigid-body protein-protein docking. Proteins, 68, 503–515.
31. Jiménez-García, B., Pons, C. and Fernández-Recio, J. (2013)pyDockWEB: a web server for rigid-body protein–proteindocking using electrostatics and desolvation scoring. Bioin-formatics, 29, 1698–1699.