Embed Size (px)
Citation preview

IAEA-TECDOC-1454
Structural behaviour of fuel assemblies for
water cooled reactorsProceedings of a technical meeting
held in Cadarache, France, 22–26 November 2004
July 2005

IAEA-TECDOC-1454
Structural behaviour of fuel assemblies for
water cooled reactorsProceedings of a technical meeting
held in Cadarache, France, 22–26 November 2004
July 2005

The originating Section of this publication in the IAEA was:
Nuclear Fuel Cycle and Materials Section International Atomic Energy Agency
Wagramer Strasse 5 P.O. Box 100
A-1400 Vienna, Austria
STRUCTURAL BEHAVIOUR OF FUEL ASSEMBLIES FOR WATER COOLED REACTORS IAEA, VIENNA, 2005 IAEA-TECDOC-1454 ISBN 92–0–105105–0
ISSN 1011–4289 © IAEA, 2005
Printed by the IAEA in Austria July 2005

FOREWORD
At the invitation of the Government of France and in response to a proposal of the IAEA Technical Working Group on Water Reactor Fuel Performance and Technology (TWGFPT), the IAEA convened a Technical Meeting on Fuel Assembly Structural Behaviour in Cadarache, France, from 22 to 26 November 2004. The meeting was hosted by the CEA-Cadarache Centre, AREVA Framatome-ANP and Electrité de France. The meeting aimed to provide in depth technical exchanges on PWR and WWER operational experience in the field of fuel assembly mechanical behaviour and the potential impact of future high burnup fuel management on fuel reliability. It addressed in-service experience and remedial solutions, loop testing experience, qualification and damage assessment methods (analytic or experimental ones), mechanical behaviour of the fuel assembly including dynamic and fluid structure interaction aspects, modelling and numerical analysis methods, and impact of the in-service evolution of the structural materials. Sixty-seven participants from 17 countries presented 30 papers in the course of four sessions. The topics covered included the impact of hydraulic loadings on fuel assembly (FA) performance, FA bow and control rod (CR) drop kinetics, vibrations and rod-to-grid wear and fretting, and, finally, evaluation and modelling of accident conditions, mainly from seismic causes. FA bow, CR drop kinetics and hydraulics are of great importance under conditions of higher fuel duties including burnup increase, thermal uprates and longer fuel cycles. Vibrations and rod-to-grid wear and fretting have been identified as a key cause of fuel failure at PWRs during the past several years. The meeting demonstrated that full-scale hydraulic tests and modelling provide sufficient information to develop remedies to increase FA skeleton resistance to hydraulic loads, including seismic ones, vibrations and wear. This publication includes a CD-ROM which contains the papers presented at the meeting and an appendix, with original slides that contain much additional information. The IAEA wishes to thank all the participants for their contributions, especially the meeting chairman, J.-C. Bouchter, of CEA, members of the technical coordination committee, J. Vallory of the CEA-Cadarache Centre, A. Billerey of EDF and B. Ladouceur of Framatome-ANP, and the meeting administrator, T. d’Aletto of the CEA-Cadarache Centre.
The IAEA officer responsible for the organization of the meeting and the compilation of this publication was V. Onufriev of the Division of Nuclear Fuel Cycle and Waste Technology.

EDITORIAL NOTE
The papers in these proceedings are reproduced as submitted by the authors and have not undergone rigorous editorial review by the IAEA.
The views expressed do not necessarily reflect those of the IAEA, the governments of the nominating Member States or the nominating organizations.
The use of particular designations of countries or territories does not imply any judgement by the publisher, the IAEA, as to the legal status of such countries or territories, of their authorities and institutions or of the delimitation of their boundaries.
The mention of names of specific companies or products (whether or not indicated as registered) does not imply any intention to infringe proprietary rights, nor should it be construed as an endorsement or recommendation on the part of the IAEA.
The authors are responsible for having obtained the necessary permission for the IAEA to reproduce, translate or use material from sources already protected by copyrights.
CONTENTS Summary ...................................................................................................................................1 HYDRAULIC LOADINGS (Session 1) Evaluation of the forces generated by cross-flow on PWR fuel assembly.......................................................................................................... .................13
J. Peybernes A full scale PWR hydraulic test facility at KAERI................................................................. 23 D.S. Oh, C.H. Shin, W.K. In, T.H. Chun, J.Y. Yung CARA fuel assembly development .........................................................................................33 D.O. Brasnarof, J.E. Bergallo, A.C. Marino, P.C. Florido, M. Markiewicz, H. Daverio,
H. Gonzalez, M. Giorgis, A. Martin Ghiselli, L.E. Juanico, H.E. Troiani The use of a low pressure test facility for the CAREM reactor fuel element design verification ....................................................................................51 A.F. Martin Ghiselli, M.A. Sacchi, R.O. Zampach, A.J. Pastorini,
R.M. Kulichevsky, J.M. Fiori Determination of turbulent excitation spectra superposition’s rules in various cases of 2D mixed flow redistribution in PWR fuel assemblies....................................69 G. Gobillot, J. Vallory Influence of water chemistry transients on fuel assemblies reliability....................................75 V.G. Kritsky, I.G. Berezina,Yu. Rodionov, P.S. Stjazkin Load withstand ability of PHWR fuel bundle end plate..........................................................87 P.N. Prasad, R. Soni Irradiation facility.................................................................................................................... 93 O. Beuter, S. Halpert, A. Marajofsky, L. Vázquez FUEL ASSEMBLY BOW AND CONTROL ROD DROP KINETICS — MEASUREMENTS, MODELING, REMEDIES (Session 2) Evolution of fuel rod support under irradiation — Impact on the mechanical behaviour of fuel assemblies..............................................101 A. Billerey, Numerical and analytical investigation of WWER-1000 fuel assembly and reactor core thermal mechanics.............................................................................113 V.M. Troyanov, Y.I. Likhachev, V.I. Folomeev, A.A. Demishonkov, N.M. Troyanova, Al.A. Tutnov, An.A. Tutnov, A.S. Kiselev, Al.S. Kiselev, E.E. Alekseev, O.I. Ivanova, A.I. Ulyanov A decade of assembly bow management at Ringhals............................................................129 T. Andersson, J. Almberger, L. Bjornkvist The results of TVSA development and operation experience...............................................137 V.L. Molchanov, A.B. Dolgov, O.B. Samoylov, V.B. Kaydalov, V.S. Kuul, I.V. Petrov,
A.V. Ivanov, G.A. Simakov, V.I. Aksenov, A.N. Lupishko European Fuel Group experience on control rod insertion and grid to rod fretting ..............147 M. Aullo, W.D. Rabenstein Kozloduy NPP nuclear fuel cycle experience .......................................................................165 D. Bekriev, A. Nikolov Design measures for providing geometrical stability of WWER reactor cores.....................169 I.N. Vasilchenko, A.A. Enin, V.M. Troyanov, V.L. Molchanov

Review and prospect for 300 MWe fuel assembly design improvement in China ...............179 Yu Chen, Yi Jing Insertion and drop of control rod in assembly simulations and parametric analysis.............189 D. Bosselut, H. Andriambololona, E. Longatte, J. Pauthenet Neutron irradiation effects on hydrogen solubility in irradiated Zircaloy-4 structural components ................................................................................195 P. Vizcaíno, A.D. Banchik, J.P. Abriata VIBRATIONS AND ROD-TO-GRID FRETTING (Session 3) Grid to rod fretting wear in EDF PWR from operating problems to new designs qualification method............................................................................209 N. Baillon Methodology of PWR fuel rod vibration and fretting evaluation in HERMES facilities ..................................................................................................221 J. Vallory Non-linear vibrations of fuel rods under turbulent excitation...............................................231 B. D’Uston Mechanical/structural performance test on the KAERI devised spacer grids for the PWR .............................................................................................239 K.-N. Song, K.-H. Yoon, H.-S. Kang, K.-H. Lee Flow-induced grid-to-rod fretting wear in PWR fuel assemblies. ........................................247 Kyu-Tae Kim, Young-Ki Jang Development of a fretting-wear and flow-induced vibration model for the fuel rods.................................................................................................257 P.R. Rubiolo, D.V. Paramonov, M.Y. Young ACCIDENT CONDITIONS EVALUATION AND MODELING (SESSION 4) Fuel assembly damping for accident studies: An analytical approach ..................................271 B. Ladouceur, J. Woillez, M. Fontaine Flow induced damping of a PWR fuel assembly ..................................................................279 B. Collard Results of crush tests performed on irradiated PWR Zircaloy-4 spacer grids.......................289 P. Yvon, R. Schill, P. Coffre, X. Averty, J. Rigaudeau, B. D’Uston, A. Billerey Fluid damping on fuel assemblies under axial flow..............................................................297 F. Witters Seismic behaviour of PWR reactor cores whole cores: Coupling between assemblies. .......305 D. Broc, J.C. Queval, P. Sollogoub List of Participants.................................................................................................................315
SUMMARY
1. INTRODUCTION
To improve the fuel cycle economics, advanced operational strategies, e.g. extended burnup, higher thermal rate, longer fuel cycles, etc, have been introduced by fuel utilities. This places additional requirements on mechanical characteristics of fuel assemblies (FAs) and their components (FA skeleton as a whole, rods, spacer grids, hold down springs, guide tubes, etc). They should withstand to irradiation, high temperatures, mechanical loads and corrosion environment with minimal changes in stiffness characteristics and geometry. Deficiency either in the FA stiffness or in mechanical properties of structural materials (under normal and accident) operating conditions sometimes resulted in very undesirable effects, e.g. FA bow or grid-to-rod fretting.
First observations of FA bow and respectively control rod insertion (IRI) and sticking problems were reported for 17x17 PWR FAs, with few exceptions in long cores with 14 ft active length and for non-jacketed WWER-1000 FAs in early 90s. Investigations showed that low stiffness of the FA skeleton was a major contributing factor into this phenomenon. Remedies including design changes improving FA stiffness and structural materials with improved mechanical properties were recommended and introduced. Situation with FA bow is not so critical now as it was several years ago, but utilities continue to perform FA shape measurement’s programmes, both in core and in a storage pool. These issues first were considered in detail at series of the IAEA Consultants Meetings on Control Rod Insertion Reliability for WWER-1000 NPPs in 1995, at the OECD/NEA Specialist Meeting on Nuclear Fuel and Control Rods: Operating Experience, Design Evolution and Safety Aspects, Madrid, Spain, 5–7 November 1996, then at the Workshop on PWR and WWER Fuel Assembly Bow, organized by R. von Jan and Hans G. Weidinger, Rez, Czech Republic, 17–19 February 1998. Amongst other topics, PWR/WWER-1000 FA Bow phenomenon was discussed at the International Topical Meetings on LWR Fuel Performance in 1997 and 2000, Top Fuel Meetings in 1997, 1999, 2001 and 2003, and at the International Seminars on “WWER Reactor Fuel Performance, Modelling and Experimental Support” in 1997, 1999, 2001 and 2003.
Grid-to-rod fretting issues appear from time to time in different PWR and WWER plants. Causes are different and very plant specific. Spacer spring breakage, baffle jetting for FAs at core periphery, rod vibration and some others were recognized as damage causes. These cases were presented at the above-mentioned conferences and discussed in detail at the IAEA Technical Meeting on Fuel Failure in Water Reactors: Causes and Mitigation” held in Bratislava, Slovakia, in 2002. Additionally to FA stiffness aspects, thermal hydraulics was considered important issue in the analysis of grid-to-rod fretting failures.
Having in mind the need to discuss in depth the structural behaviour of PWR/WWER FAs at high burnup, this Technical Meeting was proposed to the IAEA by the Technical Working Group on Water Reactor Fuel Performance and Technology (TWGFPT) at its meeting, in May 2001. TWGFPT emphasized the importance of detailed consideration of these phenomena for normal, transient and accident conditions. This meeting aimed to provide technical exchanges about PWR and WWER operational experience in the field of the fuel assembly mechanical behaviour and the potential impact of the future high burnup fuel managements on the fuel reliability. The issues to be addressed dealt with the in-service experience and remedial solutions, loop testing experience, qualification and damage assessment methods (analytic or experimental ones), mechanical behaviour of the fuel assembly including dynamic and fluid structure interaction aspects, modelling and numerical analysis methods, impact of the in-service evolution of the structural materials. Normal and accidental conditions have been considered.
1
The papers were invited on all aspects of fuel assembly mechanical behaviour at high duty operation, e.g. high burnup, increased thermal loads and extended fuel cycles, at normal, transient and accident conditions. Data and reviews on plant experience, experimental and modelling activities relative to the understanding and improvement of fuel assembly mechanical behaviour were welcome. In the conclusions of the above-mentioned earlier and related meetings and the recommendations of the TWGFPT, the following topics were identified as being of particular interest:
· Fuel Assembly Bowing;
· Control Rod Drop (including IRI and kinetics);
· Fuel Assembly Handling and pool storage experience;
· Hydraulic Loadings (pressure drops, lift off and transverse forces...);
· Vibrations and rod grid wear (response to flow turbulence, instabilities, baffle jetting..);
· Accidental Conditions Evaluation and modelling
2. SESSION 1: HYDRAULIC LOADINGS
Chairs: A. Billerey and M.J. Riverola Gurruchaga
Nine papers presented at the first session covered different aspects of thermal hydraulic loadings of FAs. Argentina’s papers by Mr. Brasnarof and Mr. Ghiselli, both of CNEA, presented results of vibration and hydraulic tests, using conventional low pressure and low temperature loop, and respective calculation models as a part of new fuel qualification programme (CARA and CAREM FAs, respectively). Mr. Dong Seok Oh introduced activities in the Republic of Korea on design and characteristics of the full scale hydraulic test facility that is in the course of restoration in KAERI to provide vibration data on the fuel assembly, fuel rod, housing and vessel as well as hydraulic data of the pressure loss coefficients and the lift-off flow rates. Ms. Halpert reported on design and characteristics of high temperature and high pressure loop with test rig mounted in the core of RA-3 research reactor to test in-pile characteristics of irradiated rodlets under CANDU flow and irradiation parameters (under construction at CNEA’s Ezeiza Nuclear Research Centre). Comprehensive test facilities and respective models to evaluate impact of coolant cross-flow on forces generated in PWR FAs and pressure drop (test section EOLE of the hydraulic loop) and to evaluate vibration response of PWR fuel rods subjected to turbulent flow excitation (GRILLON froid test facility) were presented respectively by Messrs. Pebernes and Gobillot of the Core Hydromechanics Lab of CEA Cadarache, France. The test section in Plexiglas called EOLE permits an optical access of the flow to laser velocity measurements through the rod bundle. This study enables to improve the qualification field of calculations concerning local cross flow in a fuel rod bundle and the evaluation of hydrodynamic forces on FAs in the reactor. The GRILLON froid test facility can accommodate two fuel mock-ups made of 5*5 fuel rods and three levels of structural grids. The hydraulic loop operates up to 70°C and axial and transverse flow can be simulated on the second span of the fuel assembly mock-up. The fuel rod vibrations were measured simultaneously at four heights using a laser technique to evaluate the modal response of the rods submitted to axial, transverse and mixed flow. This
2

work will help to evaluate the fluid turbulent excitation spectra in mixed, pure axial, pure transverse configuration using an inverse method. Mr. Fournier of EDF, France, presented1 the results of calculations carried out with CODE_SATURNE. His investigations were aimed at improving the understanding of fluid flow in the core with a final objective of a better knowledge of the stresses on the fuel rods leading to fretting failure. Three levels of detail were examined: firstly, a whole core model, where the flow resistance of the core plate holes and assemblies are represented as head loss terms; secondly, a quarter core model is used where the lower core components are better represented, with only the assembly as a head loss term. Finally, two half assemblies are modelled in detail, including representation of grids, nozzles and thimble tubes. The calculations are used to investigate the effect of a heterogeneous or mixed core, where different assemblies have different pressure drop characteristics. The work showed significant differences in the fluid velocities and cross-flows in such configurations compared to a homogeneous core, and non-uniform flow is observed within the bottom spans of an assembly. Future work is looking at more detailed modelling of mixing grids and experimental verification of the calculational routes.
Mr. Kritsky of VNIPIET, Russia, reported about the impact of water chemistry and steam generator decontamination regimes on pressure drop increase and rod fretting wear observed in FAs of some WWER-440 reactors. Correlation between number of failed FAs and pressure drop increase was established and empirical model based on transport of corrosion products as function of pHT was developed. The paper by Mr. Prasad of NPCIL, India, presented results of calculations of loads applied to the end plates of fresh MOX fuel bundles in PHWRs. Ability of MOX bundle’s end plates to withstand to the loads was confirmed.
Major conclusions: Session demonstrated that there is a need for hydraulics loadings evaluation in real operating conditions for both static (FA distortion) and dynamic behavior (fretting wear resistance, accidental distortion, etc.) of FAs. Benefit of the utilisation of updated and powerful software and media to observe and understand very complex flow patterns at some critical regions of the vessel was proved. After validation, this method can be a useful tool to extrapolate and verify the impact of design modifications and heterogeneous core into mechanical actions as cross flow effects on the fuel assembly. There is a special concern for the lower part of the core where transverse flow is higher due to redistributions. In order to compensate the lack of information on realistic values for important parameters such as pressure loss coefficient (effect of the deposits of cruds on FA surfaces), theoretical work is complemented with experimental verification. Advances in this research are major steps in a better knowledge of lateral loads in heterogeneous cores.
Recommendation for future work: • Perform updated calculation of flows (benefit of updated and powerful software and
media to observe flows in the vessel and in the core); • Improve interaction between flow calculations and mechanical FAs model.
1 Paper by Mr. Fournier on “Evaluation of fluid flow in the lower core of a PWR and fuel assembly nozzle area with Code_Saturne” is presented only in ppt format on a CD-ROM attached.
3
3. SESSION 2: FUEL ASSEMBLY BOW AND CONTROL ROD DROP KINETICS – MEASUREMENTS, MODELING, REMEDIES Chairs: H. Pettersson and V.M. Troyanov In this session, 10 papers are presented. Eight of them (from Bulgaria, France, Russia, Spain, Sweden and USA) have direct relation to the analysis of FA skeleton stiffness and respective issues and, in particular, to the title of the session. One paper describes FA design improvements in China in more general manner and another one-neutron irradiation effects on hydrogen solubility in irradiated Zry-4 structural components (presented by Mr. Vizcaino of CAE-CNEA, Argentina).
The papers presented by Mr. Billerey and by Mr. Bosselut, both from EDF, France, give details on modeling of FA mechanical behaviour during irradiation. The emphasis of paper by Mr. Billerey is to model the development of the interaction between springs and dimples in the spacer grids and the fuel rod during the residence time of the fuel in the reactor. Paper presented by Mr. Bosselut describes another modeling effort which uses detailed finite element models to describe which parameters can slow down the motion of a falling RCCA (Rod Cluster Control Assembly). FA bow can result in an increased drop time due to friction between control rod fingers and bowed guide tubes. This is in agreement with results from more simple modeling and empirical results from PWR reactors.
The papers presented by Mr. Petersson of Vattenall Fuel, Sweden and Mr. Aullo of ENUSA, Spain, describe experience with FA bow in PWR reactors, the consequence of this, and corrective actions to reduce or get rid of operating restrictions caused by FA bow. Mr. Aullo also describes an experience of grid-to-rod fretting issues in PWR reactors. In both cases, the results from operating fuel with design improvements are described. In the cases referenced, design changes have resulted in marked improvements in FA bow behaviour.
Three papers presented by Russian experts (Mr. Troyanov and Mr. Dolgov of Corporation “TVEL” and Mr. Vasilchenko of SDB “Hydropress”) and paper presented by Mr. Bekriev of Kozloduy NPP, Bulgaria, deal mainly with mechanical design and performance of fuel for WWER-1000 reactors. Paper presented by Mr. Troyanov specifically describes simulations of WWER spacer grid mechanical behaviour, expanded first to modeling fuel assembly behaviour, then once more expanded to model the behaviour of the whole core. Normal operation as well as LOCA (mechanical aspect) and seismic impact is modelled. Finally, the models are applied to PWR geometry. Paper presented by Mr. Dolgov describes a new fuel design (TVSA - by OKBM Nizni Novgorod) for WWER-1000 reactor that is aimed to reinforcing the structure to reduce bow in operation. Details were given of design verifications as well as operational verification. The improvement compared to the old design is quantified. Paper by SDB “Hydropress” describes an alternative fuel design (TVS-2) for WWER-1000 fuel. The paper by Mr. Bekriev gives the experience from an operator´s view from general fuel performance aspect and special emphasis is also placed on bow behaviour in Kozloduy NPP with two WWER-1000 units in operation. The problems associated with fuel assembly bow are described and the implementation of design improvements is also included. New fuel using the improved design has been operated and the remedies have proven to give good results. The paper presented by Mr. Chen Yu of SNERDI, China, is more general and contains a description of the initial design of the FA for the Chinese 300 MWe reactor, which was done in China and design improvement planned for the near future.
4
Major conclusions: Most of the focus of this session was on FA deformation under irradiation and the effects of this deformation that may be incomplete control rod insertion (IRI), longer drop time for control rods and, in some cases, larger water gaps than intended between fuel assemblies in the core. These larger gaps have sometimes led to a reduction in reactor power for some plants for a limited time. Now, new improved fuel designs for both PWR and WWER-1000 reactors have been introduced. The main lines of improvement are common:
• Increased stiffness of the fuel assembly by changes in design and material; • Reduced hold down forces; • In some cases, increased weight of control rod assemblies.
These design improvements were described in some detail and results from operating fuel were also given. As expected, restrictions, which had been implemented during the initial phase when the fuel assembly bow issue surfaced in the 1990ies, have been largely reduced or taken away. The problems resulting from FA bow have been reduced or even to some extent mastered in the commercial LWR reactors today. Recommendation for future work:
• Taking into account future increases in power density and burnup levels it can be said that the threat is still there that this issue may resurface. The changes in duty will most likely put a larger demand on the fuel design;
• It is therefore important to improve the understanding of the phenomena involved and to continue to have a focus on the issues of fuel assembly mechanical stability also in the future.
4. SESSION 3: VIBRATIONS AND ROD-TO-GRID FRETTING Chairs: J. Vallory and Kyu-Tae Kim Six papers were presented in this session dealing with rod-to-grid fretting evaluation from design to operating feedback. In PWR, rod-to-grid fretting is evaluated to be the root cause for 70–80% of fuel rod failure in the core (KNFC & W-ENUSA presentations). For WWER, the main issues seem to be coupling between fuel assemblies and wear of structures such as baffles and barrels. The mechanisms responsible for recent fretting wear observed in analysing PWR operation feedback have been extensively described: fretting wear obtained at the lowest grid position due to in-core redistributions (papers presented by Mr. Kim of KNFC, Korea, by Mr. Baillon of EDF, France, and Mr. D’uston of Framatome-ANP, France), grid with unbalanced mixing vanes leading to fuel assembly self excitation and fuel rod wear (presented by Mr. Aullo of ENUSA, Spain, and by Messrs. Kim and Baillon), vibrations of grid strap generating high frequency resonance and identified as fretting wear cause (presented by Messrs. Aullo and Kim). Mr. Chen in a paper presented at the Session 2 also mentioned grid outer strap vanes improvement in order to minimize the potential for grid tearing during refuelling.
5

Major conclusions: 1. The fuel rod support design (spring optimisation, increase in robustness, improvement of mixing devices, etc) and its evaluation is sustained by a modelling approach (paper presented by Mr. Song of KAERI, by Mr. Rubiolo of WEC, USA, Messrs D’uston, Kim, Baillon, Chen and Vasilchenko). The modelling improvements presented are based on a non-linear analysis to take into account for EOL (End of Life) restraining conditions (paper by Mr. Billerey from the Session 2). The characterization of external loadings have been described by Mr. Baillon and also in some papers from the Session 1 (by Messrs Fournier, Gobillot). For wear modelling, the mechanical description using Archard / Frick law is presented and questioned. 2. Experimental approach on analytical set-ups such as AECL wear machines, Grillon chaud fretting wear tester is used to experimentally evaluate new fuel rod support design and also to comprehend wear mechanisms (paper presented by Ms. Vallory of CEA, Cadarache, and also in papers presented by Messrs. Kim and Rubiolo). 3. Integral out-of-pile testing is extensively performed on FA new designs (papers presented by Ms. Vallory and Messrs Aullo, Rubiolo, Baillon, Song, Ghiselli (see Session 1) and Dolgov (see Session 2)). These test facilities are improving with the objective to simulate in core loadings better. They require the development of instrumentation at high temperature, high pressure, flowing water conditions to characterize pressure drop coefficient and vibrations of tested FAs. 4. The use of operating feedback analysis is to compare out-of-pile test results and in core feedback in order to validate and/or improve out-of-pile test results and test methodology (papers presented by Mr. Baillon and Ms. Vallory). Recommendations for future work:
• Some improvements in the models could be suggested such as friction coefficient experimental evaluation, wear coefficient and Archard law analysis and external forces evaluation. Some code benchmarking could be proposed;
• Improvements of out-of-pile facilities (to better simulate in-core conditions and influent parameters) are to be continued along with increasingly need for instrumentation at ‘extreme’ operating conditions (from 150°C up to 300°C in flowing water conditions and integrated in full scale components). Fruitful technical exchanges among teams on methodology and facilities performances (non design dependent) should go on;
• Analytical tests and designing new test facilities is to be continued as it helps in the understanding of wear mechanisms and individually analyse input parameters of integral test.
5. SESSION 4: ACCIDENT CONDITIONS EVALUATION AND MODELING Chairs: B. Ladouceur and V. Mori Five French papers were presented in this session which dealt with accident conditions evaluation (experiments simulating mainly impact of seismic or LOCA loads on mechanical
6
structure of FAs) and modelling. Also, seismic impact on FA/core behaviour was also a subject for the paper presented by Mr. Troyanov at the 2nd session. In the AREVA Framatome-ANP paper presented by Mr. Ladouceur, interaction between fluid and FA structure for seismic – typical frequencies (0-10 Hz) and previously published French loop experimental data was calculated using Turb’Flow CFD solver in terms of a damping and a coupling mass (additional mass or stiffness). This study may help understanding the test results and to be able to extrapolate to reactor conditions. Because of the predominance of pressure forces, extrapolation of the loop test damping values to hot conditions might be done through the ratio of the fluid densities. The strong effect of axial flow and also the significant difference in behaviour between still water and flowing water were shown. The nearly stable damping coefficient for flowing water allows considering that the reduced damping is inversely proportional to the frequency. This study will be pursued to further understand in particular the effect of grids, the effect of assembly distortion and also of the axial and side gaps which influence the velocities in the fuel rod bundle. The results of full-scale FA tests under axial flow and horizontal excitation load via hydraulic jack (simulation of seismic load) in HERMES T facility are presented in the CEA/Cadarache paper presented by Mr. B. Collard. Co-located displacement and force applied on the assembly by the excitation system, are measured by a load cell. Assemblies tested had different relaxation of springs and dimples typical for fresh (BOL - Beginning-of-Life) and significantly irradiated (EOL - End-of-Life) spacer grids. 2D mechanical models were applied to calculate damping ratio and modal response of an FA for different flow and excitation parameters. For both computed and measured results, an increase under flow of damping ratio for the EOL and degraded FA with low relative stiffness. Addition of hydrodynamic coupling between FAs to the conventional calculation routine of impact forces during seismic load was done in CEA/Cadarache paper presented by Mr. Witters. Modelling showed that even if FA displacements are mainly governed by the excitation of the core, impacts break this uniform movement. Calculated forces with coupling effects seem to be slightly greater. In order to validate this coupling effect, the Couplage test facility was designed. Nine reduced FAs each composing of 16 rods are excited by an actuator. Load cells measure the force applied on FAs or resulting from hydrodynamic effects. Tests will be performed in 2005. A model to analyze seismic behaviour of PWR whole cores with taking into account coupling between FAs was presented by Mr. D. Broc of CEA/Saclay. It is based on a simple 2 DOF assembly model representing the first predominant modes, but uses a complete hydrodynamic coupling model, with inertial and dissipative effects. For both effects, the fluid structure interaction models are based on simple physical considerations about the structural and fluid motion. The modal analysis permits, with relatively few degrees of freedom, (314 in our case) to perform the simulations in reasonable computer time (few minutes for a seismic solicitation).
This model can be used for the interpretation of tests in stagnant water or with axial coolant flow, and to evaluate the seismic behaviour of the whole core. The simulations performed on the whole core show the strong dependency on the seismic input of the impact forces at the grids. This is a classical, well-identified phenomenon. It seems, from the cases considered in this study, that the “with coupling” results are not very different of the “without coupling” ones. This point could be studied more precisely, as it depends on the way to describe the impact between two grids in the numerical simulations. The analysis of the energy repartition
7
between the different modes shows that the “coupling modes” are solicited when impact occur. Even if the influence on the impact forces is not very sensitive, coupling between assemblies by the fluid take place under seismic input. Mr. P. Yvon of CEA/Saclay reported on results of hot crush tests by lateral compressing performed on fresh and irradiated (after 1 and 4 cycles) PWR Zry-4 spacer grids with displacement rate of 40 mm/s. All grids contained residual guide tubes and dummy rodlets were inserted before testing. The first conclusion of these results is that after the test, the grids remain sound with very few defects at strap intersections. This is also the case for the maximal applied displacement of 15 mm (more than one cell pitch). This means that the grids keep sufficient ductility to resist to large distortions. Additionally, it is observed that the crush limit for irradiated grids is somewhat smaller than that of fresh grids: about – 25% for 1-cycle grids and 40% for 4-cycle grids. For irradiated grids, the uppermost grid has a higher resistance than that of lower grids. This higher resistance is associated with higher spring forces (lower relaxation because of lower flux for these grids).
Major conclusions and recommendations: 1. It was showed that the hypothesis used until now for grids justification in case of an earthquake had probably to be reconsidered. Indeed, it was demonstrated that irradiated grids buckling load is lower than those of non-irradiated ones. That is at the opposite of what was supposed in the previous state of the art.
2. Taking the above-mentioned into account and to gain margins and so to help the justification, it has been experimentally demonstrated that a higher damping coefficient, than the one used actually could be taken into account, due to the flow effect on fuel assemblies. This will reduce the impact forces between FAs.
3. This statement was reinforced by explaining the phenomena, with analytical calculations, allowing the experimental results extrapolation to normal operating conditions of 320°C and 15 MPa.
4. Finally, another phenomena that had been neglected until now, and which is the coupling effect between FA, was pointed out. This could change the way of calculating the impact forces and may affect the accident analysis results.
5. It was noticed that, except the Russian presentation by Mr. Troyanov in the Session 2, the other papers concerning this session have been done by French experts. It would be interesting to know how this topic is taken into account in other parts of the world and more particularly in regions, which are reputed to be more seismic areas than France or Russia. 6. PANEL SESSION: FINAL REMARKS/CONCLUSIONS Chairs: J. Vallory and V.M. Troyanov
• For hydraulic loadings, the recommendation is that performing calculations for in core evaluation of flow should take advantage of powerful software and computers to extend computations (effect of bowing on core redistribution,…). Those computations should rely on adequate test facilities for validation;
• For fuel assembly bowing and incomplete rod insertion, the recommendation would be to keep a R&D effort constant on the subject although the problem is now under control but because the mechanisms implied are sensitive to burn up increase and cycle lengthening. Also, there is a concern to take the bowing situation into account
8

for in core misdistributions and accidental conditions. Too widen the field of bowing analysis, coupling between mechanical and thermo hydraulics codes could be recommended;
• For rod-to-grid fretting wear evaluation, the recommendation would be to bear in mind the complementary between out of pile and in pile testing. Out of pile tests are worth for process/design discrimination whereas in pile test is important for irradiation effect and post irradiation evaluation;
• For accidental conditions, the conclusion would be that only French papers were dedicated to the subject, although the seismic risk is lower than in some other countries;
• Finally, a large amount of data and information has been exchanged during the meeting. Abundant ideas and results were reported regarding fuel assembly structural behaviour.
9

HYDRAULIC LOADINGS (Session 1)
Chairpersons
A. BILLEREY France
M.J. RIVEROLA GURRUCHAGA
Spain

EVALUATION OF THE FORCES GENERATED BY CROSS-FLOW ON PWR FUEL ASSEMBLY J. PEYBERNÈS French Atomic Energy Commission/Nuclear Energy Directorate, Saint Paul lez Durance, France Abstract
Heterogeneities in the coolant flow map in PWR cores are one of the mechanisms involved in fuel assembly deformation detected after core unloading. Cross flows between fuel assemblies in the core generate lateral hydraulic forces. Studies are performed to evaluate hydromechanic forces generated by cross flows. The pressure drop of the rod bundle generates hydromechanic forces. The pressure drop coefficient depends on the mass flow rate and on the slope angle between the flow and the fuel bundle. Empirical correlations from literature allow us to estimate this parameter. Unfortunately, these correlations have been established from rather old experimental tests, which have not been validated on a geometry similar to those of PWR fuel rod bundle. This paper describes the experimental program undertaken to evaluate the pressure drop coefficient according to the Reynolds number and the slope angle between the flow and the rod bundle. A fuel assembly mock-up with a variable slope angle in comparison to a mono-directional flow has been performed. The test section in Plexiglas called EOLE permits an optical access of the flow to laser velocity measurements through the rod bundle. This study enables us to improve the qualification field of calculations concerning local cross flow in a fuel rod bundle and the evaluation of hydrodynamic forces on fuel assemblies in the reactor.
1. INTRODUCTION Heterogeneities in the coolant flow map in the PWR cores are one of the mechanisms involved in fuel assembly deformation detected after core unloading. Cross flows between fuel assemblies in the core generate hydraulic forces. Studies are performed to evaluate hydromechanic forces generated by cross flows. The pressure drop of the rod bundle generates hydromechanic forces. The pressure drop coefficient depends on the mass flow rate and on the slope angle between the flow and the fuel bundle. Empirical correlations from literature allow us to estimate this parameter. Very little data is available concerning pressure drop measurements in a rod bundle when submitted to cross flow. Idel’cik1 proposed a model developed by Mocan and Revsina (1959) to evaluate the pressure drop coefficient for pure cross flow in a rod bundle. Kazakevic (1952) suggested applying a correction factor to assess the pressure drop coefficient for a variable slope angle between the flow and the rod bundle. Nevertheless, these correlations have been established from rather old experimental tests, which have not been validated on a geometry similar to those of PWR fuel rod bundle (pitch rods, external rod diameter). The objective of the present work is the experimental determination of pressure drop coefficients according to the flow Reynolds number and the incidence angle of the flow on the fuel rod bundle. These experimental results are necessary in order to develop and validate thermal-hydraulic codes. Therefore, this study allows us to improve the qualification field of calculations concerning local cross flow in a fuel rod bundle and the evaluation of hydrodynamic forces acting on fuel assemblies in the reactor.
1 I.E. Idel’cik, « Mémento des pertes de charge », coefficient de pertes de charge singulières et de pertes de charge par frottement, Edition Eyrolles, 1986
13
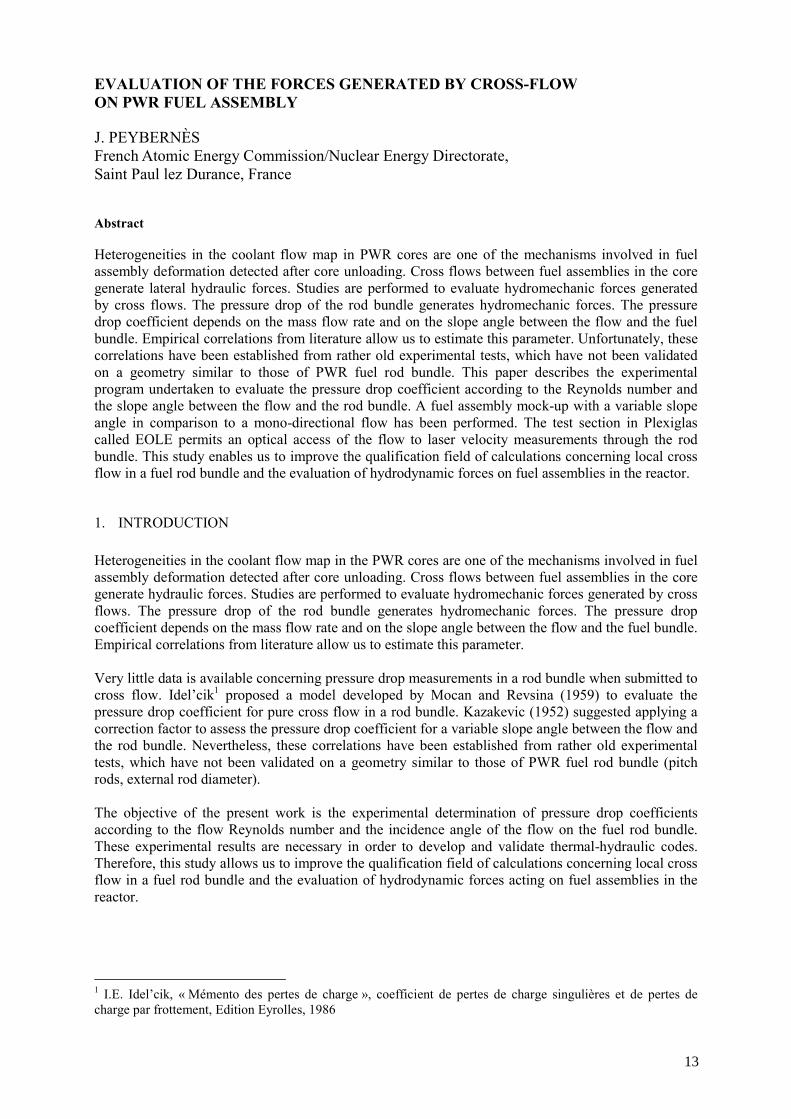
2. EXPERIMENTAL FACILITY: EOLE TEST SECTION A specific experimental device has been designed and built to characterize the cross flow through a rod bundle. The cross flow is simulated by a slope of a fuel assembly mock-up in a horizontal channel. The test section in Plexiglas, called EOLE, allows for an optical access to flow by laser Doppler anemometer measurements through the rod bundle. The horizontal square section (106.7 106.7 mm²) can contain a rod bundle of 8 8 rods at an angle with the horizontal channel of 90°, 67.5°, 45° and 30°. The assembly mock-up is similar to the PWR fuel assembly geometry with rods arranged in a square array, with the same pitch (12.6 mm) and external rod diameter (9.5 mm). The rods are made of stainless steel (roughness below 8 10–6 m). The test section can accommodate a variable number of rod rows (1 to 8 rows can be mounted in the test section). Two pressure taps are set upstream and downstream from the assembly mock-up in a steady state flow area, enabling measurement of the pressure drop due to the rod bundle in the channel for different inlet flow rates. Figure 1 shows the EOLE test section with assembly mock-up at an angle of 30°.
FIG. 1. Test section EOLE with assembly mock-up at an angle of 30°.
2.1. Operating conditions The experiments were performed using a closed hydraulic loop, and water flow rates up to 35 m3/h under ambient conditions (pressure and temperature). The experimental method consisted in measuring the pressure drop for 5 to 35 m3/h (5 m3/h per step), which corresponds to a mean velocity upstream of the mock-up in the range of 0.1 to 1 m/s. The pressure drop measurements were performed with 8 and 4 rows (8 rods for each row). The difference between the pressure drop measurements for these two configurations allows us to remove the effect of the hydraulic discontinuities at the inlet and outlet of the mock-up. The uncertainty on the pressure drop measurement is below 1 hPa. Measurements of the velocity fields were made by a laser Doppler anemometer in order to verify the uniformity of the velocity field in the mock-up upstream cross section. Velocity measurements were also performed in the narrow gap between the rods at the inlet of the mock-up.
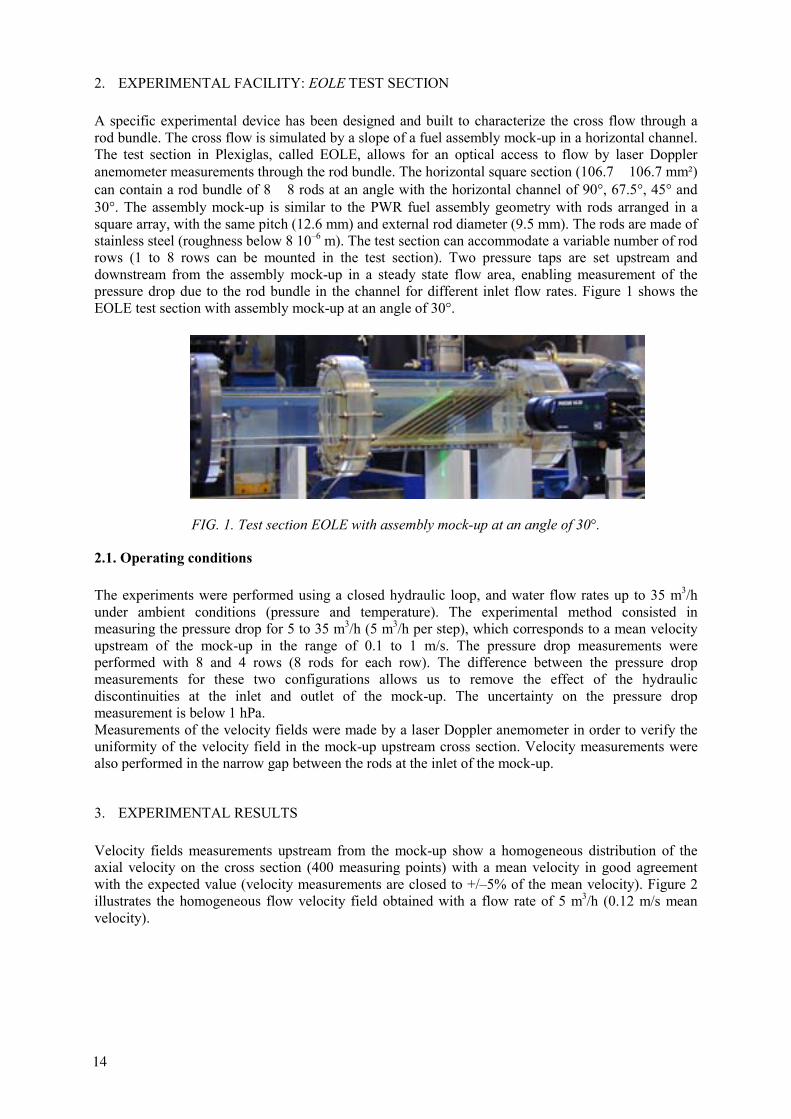
3. EXPERIMENTAL RESULTS Velocity fields measurements upstream from the mock-up show a homogeneous distribution of the axial velocity on the cross section (400 measuring points) with a mean velocity in good agreement with the expected value (velocity measurements are closed to +/–5% of the mean velocity). Figure 2 illustrates the homogeneous flow velocity field obtained with a flow rate of 5 m3/h (0.12 m/s mean velocity).
14
5
15 25 35 45 55 65 75 85 95
-99,75
-79,8
-59,85
-39,9
-19,95
0
0,02
0,04
0,06
0,08
0,1
0,12
0,14
velocity (m/s)
Z (Tous)
Moyenne U Moy
X
Y
mean velocity : 0.12 m/s
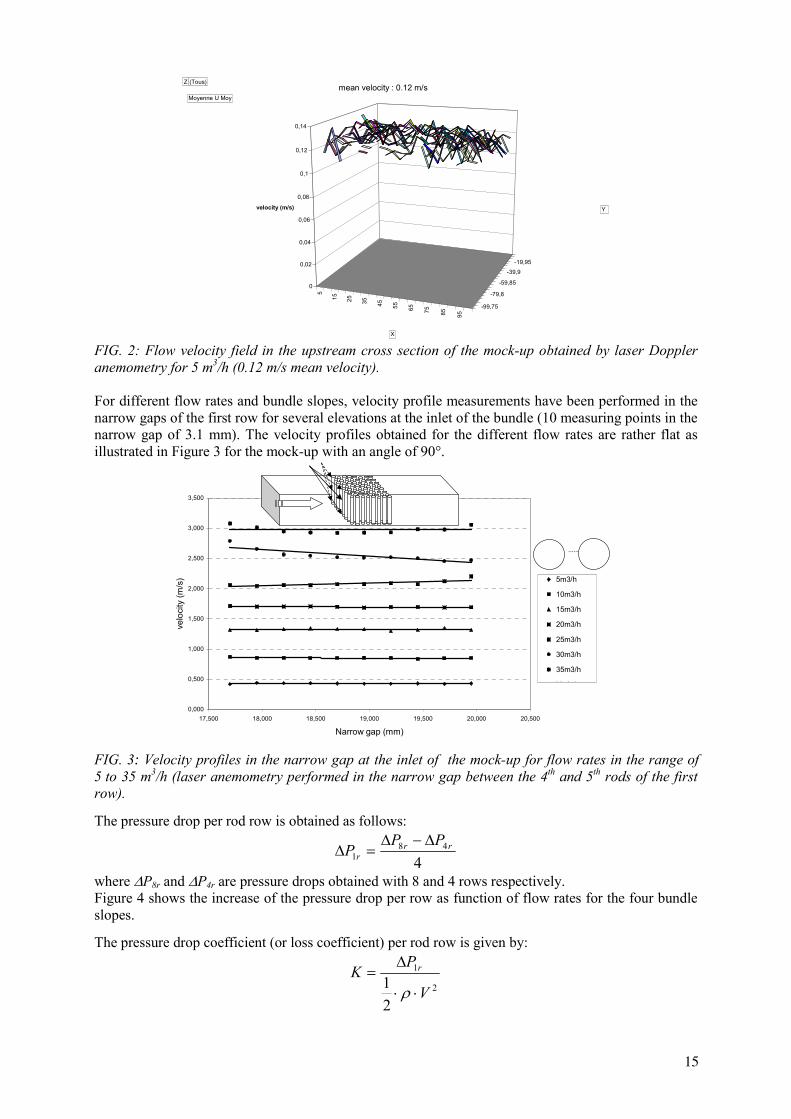
FIG. 2: Flow velocity field in the upstream cross section of the mock-up obtained by laser Doppler anemometry for 5 m3/h (0.12 m/s mean velocity). For different flow rates and bundle slopes, velocity profile measurements have been performed in the narrow gaps of the first row for several elevations at the inlet of the bundle (10 measuring points in the narrow gap of 3.1 mm). The velocity profiles obtained for the different flow rates are rather flat as illustrated in Figure 3 for the mock-up with an angle of 90°.
0,000
0,500
1,000
1,500
2,000
2,500
3,000
3,500
17,500 18,000 18,500 19,000 19,500 20,000 20,500
Narrow gap (mm)
velo
city
(m/s
) 5m3/h
10m3/h
15m3/h
20m3/h
25m3/h
30m3/h
35m3/h
Li é i
FIG. 3: Velocity profiles in the narrow gap at the inlet of the mock-up for flow rates in the range of 5 to 35 m3/h (laser anemometry performed in the narrow gap between the 4th and 5th rods of the first row).
The pressure drop per rod row is obtained as follows:
448
1rr
rPP
P∆−∆
=∆
where ∆P8r and ∆P4r are pressure drops obtained with 8 and 4 rows respectively. Figure 4 shows the increase of the pressure drop per row as function of flow rates for the four bundle slopes.
The pressure drop coefficient (or loss coefficient) per rod row is given by:
2
1
21 V
PK r
⋅⋅
∆=
ρ
15
0
2
4
6
8
10
12
0 10 20 30 40
flow rate (m3/h)
Pre
ssur
e dr
op p
er ro
w (h
Pa)
90°67,5°
45°
30°
FIG. 4: Pressure drop per row as a function of flow rates for 90°, 67.5°, 45° and 30°.
Where ρ is the fluid density and V is the inlet velocity in the narrow gap between the rods. The pressure drop coefficient can be correlated in the form:
baK Re⋅= Where Re is the Reynolds number and a, b are experimental coefficients. In the case of crossflow in
the rod bundle, the Reynolds number is usually given by: ν
rodDV ⋅=Re
where Drod is the rod diameter and ν the flow viscosity.
Velocity measurements in the narrow gap have shown a good agreement with the expected values. Consequently, the velocity V is calculated as function of the flow rate and the flow area in the narrow gap between the rods at the inlet of the bundle.
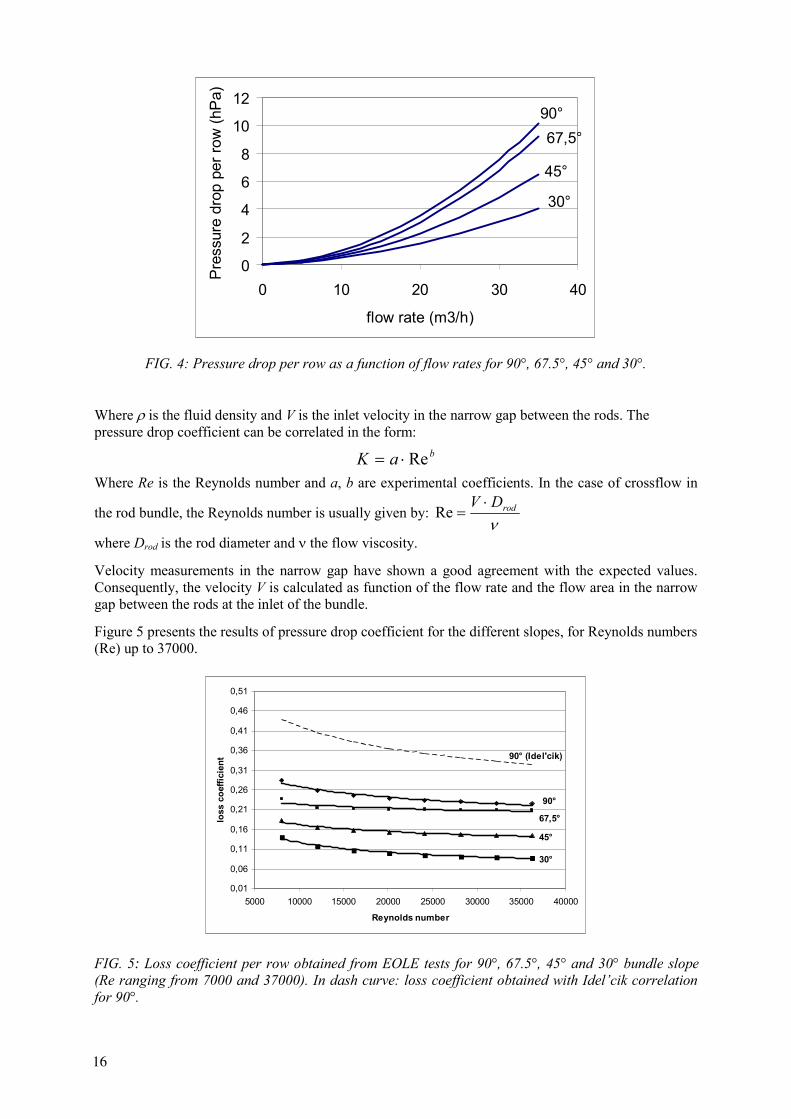
Figure 5 presents the results of pressure drop coefficient for the different slopes, for Reynolds numbers (Re) up to 37000.
0,01
0,06
0,11
0,16
0,21
0,26
0,31
0,36
0,41
0,46
0,51
5000 10000 15000 20000 25000 30000 35000 40000
Reynolds number
loss
coe
ffici
ent
90°
67,5°
45°
30°
90° (Idel'cik)
FIG. 5: Loss coefficient per row obtained from EOLE tests for 90°, 67.5°, 45° and 30° bundle slope (Re ranging from 7000 and 37000). In dash curve: loss coefficient obtained with Idel’cik correlation for 90°.
16

As illustrated in Figure 5, for a pure cross flow (angle 90°), the experimental correlation leads to a lower loss coefficient compared to the pressure drop coefficient calculated from the Idel’cik correlation which is usually used in thermal-hydraulic codes. This deviation, about 30%, may be due to the methodology applied in this work involving the subtraction of the pressure drop for a different number of rows (measurements performed with 8 and 4 rows) and which allows us to remove the hydraulic effects at the inlet and outlet of the rod bundle (hydraulic discontinuities). These results enable us to establish an empirical correlation relating the pressure drop coefficient per rod row as a function of the slope angle to the pressure drop coefficient in a pure cross flow:
Kθ = ξ(θ)x Tf (1)
With Tf = a x Reb : pressure drop coefficient in pure crossflow (θ = 90°); a = 1.85, b = –0.2
ξ(θ) = (sin(θ)/cos((90-θ)/2))1.7 (2) (ξ(θ) = 1 for θ = 90° and 0 for θ = 0°)
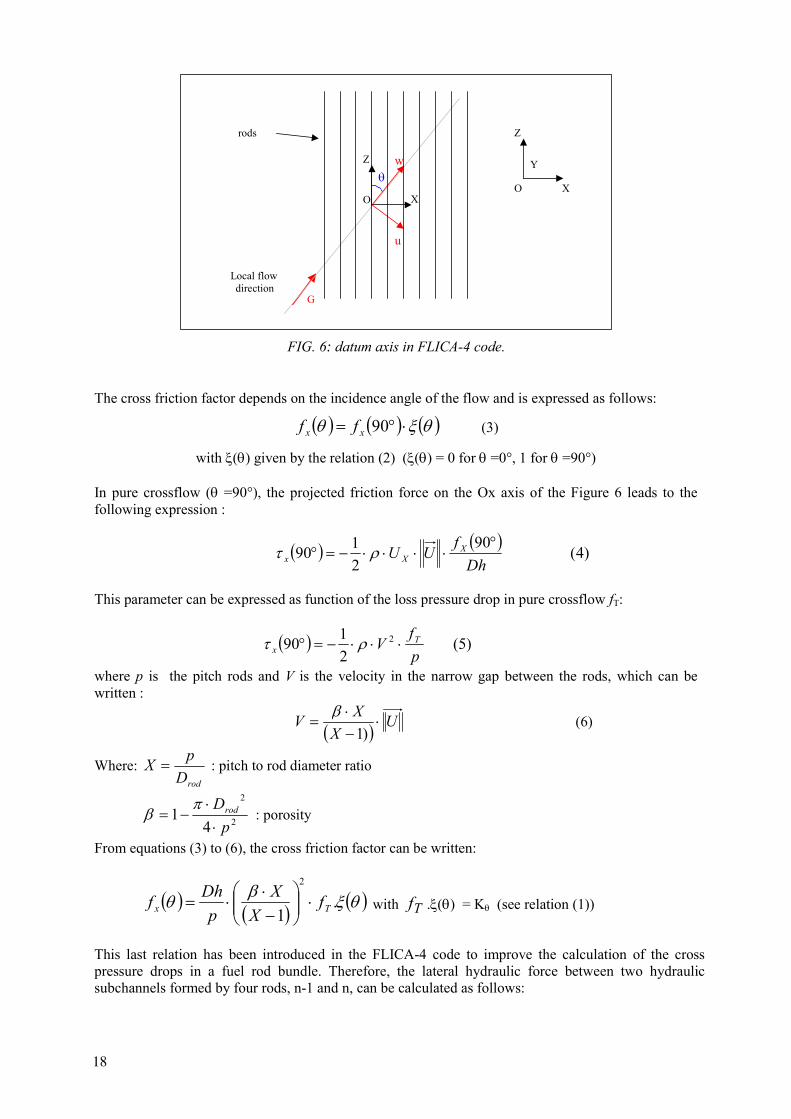
4. MODELING APPROACH The new empirical correlation (1) obtained from the EOLE experiments has been introduced into the CEA thermal-hydraulic code FLICA-4 in order to assess the pressure drop due to cross flow and the resulting lateral hydraulic force on a fuel assembly. The cross flow effects on pressure drop are taken into account through the friction forces which are expressed by the following relation :
UUDh wW ⋅⋅Λ⋅⋅−= ρτ
21
with • wτ friction force
• Dh : hydraulic diameter : rodrod
DDpDh −
⋅⋅
=π
24
(De : rod diameter, p : pitch rods)
• U : mean flow velocity • ρ : flow density
• WΛ : frictions tensor
=Λ
y
x
z
W
ff
f
000000
fx et fy are the cross friction factor. fz is the axial friction factor expressed by the correlation of Colburn : fZ = 0,192.Rez
-0,2 with
υDhU
Z⋅
=Re .
17
O
Y
X
Z
θ
O
Local flow direction
G
w
X
Z
u
rods
FIG. 6: datum axis in FLICA-4 code.
The cross friction factor depends on the incidence angle of the flow and is expressed as follows:
( ) ( ) ( )θξθ ⋅°= 90xx ff (3)
with ξ(θ) given by the relation (2) (ξ(θ) = 0 for θ =0°, 1 for θ =90°)
In pure crossflow (θ =90°), the projected friction force on the Ox axis of the Figure 6 leads to the following expression :
This parameter can be expressed as function of the loss pressure drop in pure crossflow fT:
where p is the pitch rods and V is the velocity in the narrow gap between the rods, which can be written :
( ) UX
XV ⋅−⋅
=)1
β (6)
Where: rodDpX = : pitch to rod diameter ratio
2
2
41
pDrod
⋅⋅
−=π
β : porosity
From equations (3) to (6), the cross friction factor can be written:
( ) ( ) ( )θξβθ .1
2
Tx fX
Xp
Dhf ⋅
−⋅
⋅= with Tf .ξ(θ) = Kθ (see relation (1))
This last relation has been introduced in the FLICA-4 code to improve the calculation of the cross pressure drops in a fuel rod bundle. Therefore, the lateral hydraulic force between two hydraulic subchannels formed by four rods, n-1 and n, can be calculated as follows:
( ) ( ))4(
902190
Dhf
UU XXx
°⋅⋅⋅⋅−=° ρτ
( ) )5(2190 2
pf
V Tx ⋅⋅⋅−=° ρτ
18

with Pn, Pn-1: local pressure in the cells n and n-1 fn : lateral hydraulic force hn : height of the mesh Drod : rod diameter (Drod. hn : solid cross section)
The total lateral hydraulic force in a rod bundle is obtained by adding the local lateral hydraulic forces between two consecutive meshes: F = Σ fn.
5. CALCULATIONS/MEASUREMENTS COMPARISON
The MISTRAL test section has been designed in order to study hydromechanic loads induced by the crossflows on fuel assemblies. The test section can accommodate a fuel assembly mock-up being 1.9 m in total height, with 8x8 rod array and 4 structural PWR grids simulating 3 PWR fuel assembly spans. A load sensor is set on the top and on the bottom nozzle of the assembly mock-up in order to measure the lateral hydraulic forces on the rod bundle (the bottom nozzle is put on slide drive limiting friction). The test section, connected to the hydraulic loop THESEE, allows us to inject and to extract a mass flow on the full length and width of the central span. Two feed-water pumps and a set of valves enable us to apply varying axial and cross flows, at ambient temperature. A diagram of the facility is shown in Figure 7. This facility allows us to simulate lateral hydraulic forces on the fuel assembly mock-up under both axial and cross flow conditions.
.
FIG. 7: Diagram of the test section MISTRAL. Front side of the test section equipped with viewport allowing laser anemometer measurements.
( ) nrodnnn hDPPf ⋅⋅−= −1
Injection Extraction
Crossflow Pump
Axial Pump
Pool
MISTRALTest section
Pn-1 Pn
hn
19
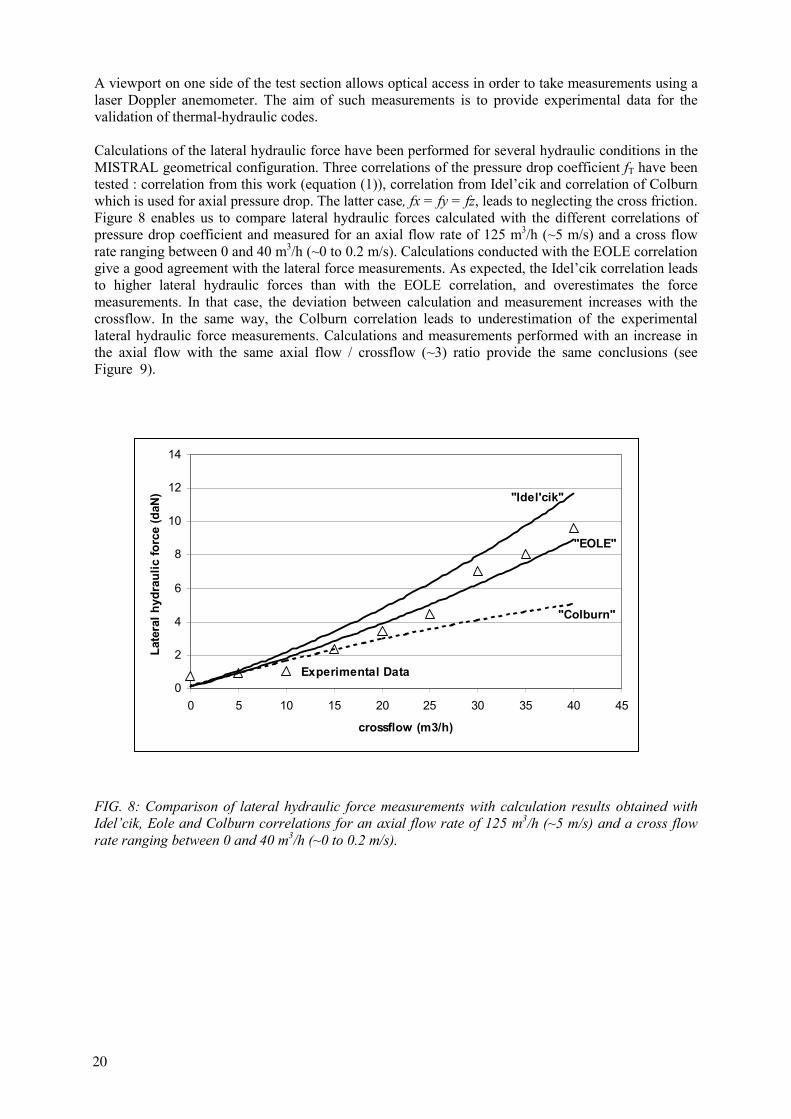
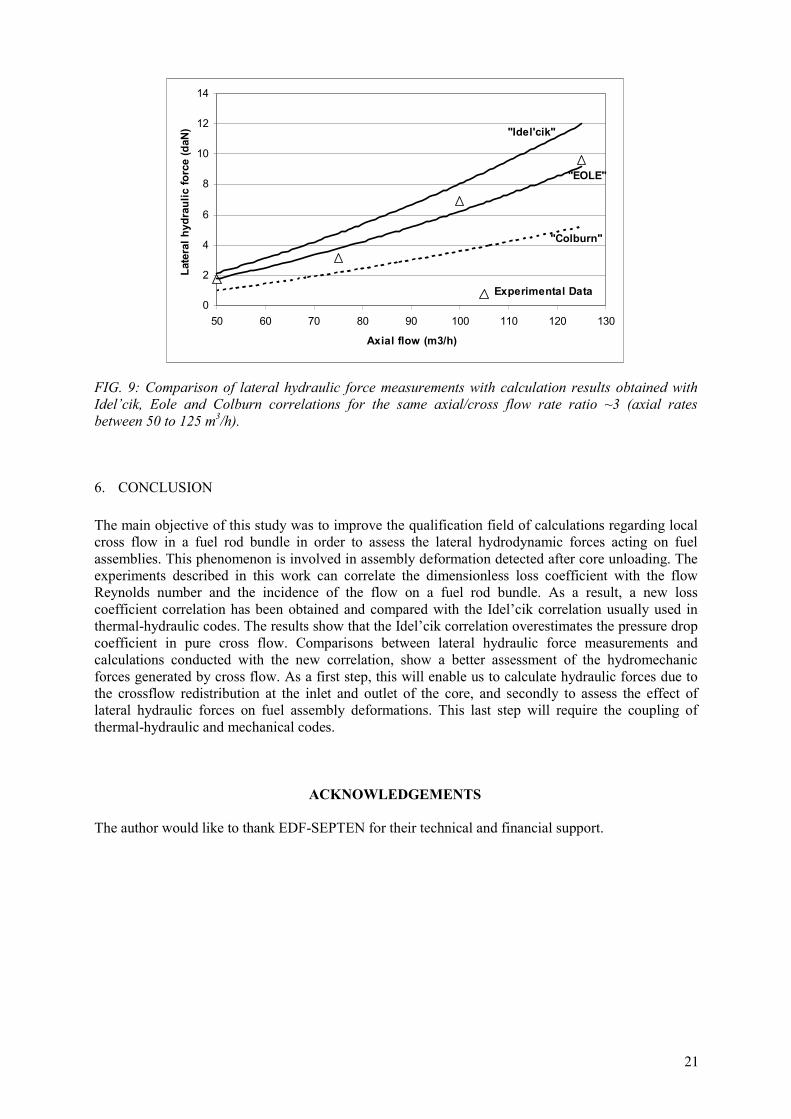
A viewport on one side of the test section allows optical access in order to take measurements using a laser Doppler anemometer. The aim of such measurements is to provide experimental data for the validation of thermal-hydraulic codes. Calculations of the lateral hydraulic force have been performed for several hydraulic conditions in the MISTRAL geometrical configuration. Three correlations of the pressure drop coefficient fT have been tested : correlation from this work (equation (1)), correlation from Idel’cik and correlation of Colburn which is used for axial pressure drop. The latter case, fx = fy = fz, leads to neglecting the cross friction. Figure 8 enables us to compare lateral hydraulic forces calculated with the different correlations of pressure drop coefficient and measured for an axial flow rate of 125 m3/h (~5 m/s) and a cross flow rate ranging between 0 and 40 m3/h (~0 to 0.2 m/s). Calculations conducted with the EOLE correlation give a good agreement with the lateral force measurements. As expected, the Idel’cik correlation leads to higher lateral hydraulic forces than with the EOLE correlation, and overestimates the force measurements. In that case, the deviation between calculation and measurement increases with the crossflow. In the same way, the Colburn correlation leads to underestimation of the experimental lateral hydraulic force measurements. Calculations and measurements performed with an increase in the axial flow with the same axial flow / crossflow (~3) ratio provide the same conclusions (see Figure 9). FIG. 8: Comparison of lateral hydraulic force measurements with calculation results obtained with Idel’cik, Eole and Colburn correlations for an axial flow rate of 125 m3/h (~5 m/s) and a cross flow rate ranging between 0 and 40 m3/h (~0 to 0.2 m/s).
0
2
4
6
8
10
12
14
0 5 10 15 20 25 30 35 40 45
crossflow (m3/h)
Late
ral h
ydra
ulic
forc
e (d
aN) "Idel'cik"
"Colburn"
"EOLE"
Experimental Data
20
0
2
4
6
8
10
12
14
50 60 70 80 90 100 110 120 130
Axial flow (m3/h)
Late
ral h
ydra
ulic
forc
e (d
aN) "Idel'cik"
"Colburn"
"EOLE"
Experimental Data
FIG. 9: Comparison of lateral hydraulic force measurements with calculation results obtained with Idel’cik, Eole and Colburn correlations for the same axial/cross flow rate ratio ~3 (axial rates between 50 to 125 m3/h).
6. CONCLUSION The main objective of this study was to improve the qualification field of calculations regarding local cross flow in a fuel rod bundle in order to assess the lateral hydrodynamic forces acting on fuel assemblies. This phenomenon is involved in assembly deformation detected after core unloading. The experiments described in this work can correlate the dimensionless loss coefficient with the flow Reynolds number and the incidence of the flow on a fuel rod bundle. As a result, a new loss coefficient correlation has been obtained and compared with the Idel’cik correlation usually used in thermal-hydraulic codes. The results show that the Idel’cik correlation overestimates the pressure drop coefficient in pure cross flow. Comparisons between lateral hydraulic force measurements and calculations conducted with the new correlation, show a better assessment of the hydromechanic forces generated by cross flow. As a first step, this will enable us to calculate hydraulic forces due to the crossflow redistribution at the inlet and outlet of the core, and secondly to assess the effect of lateral hydraulic forces on fuel assembly deformations. This last step will require the coupling of thermal-hydraulic and mechanical codes.
ACKNOWLEDGEMENTS
The author would like to thank EDF-SEPTEN for their technical and financial support.
21

A FULL SCALE PWR HYDRAULIC TEST FACILITY AT KAERI*
D.S. OH, C.H. SHIN, W.K. IN, T.H. CHUN, Y.H. JUNG Korea Atomic Energy Research Institute, Yusung, Daejeon, Republic of Korea
Abstract Under the framework of a MOST project in the Republic of Korea, A full scale hydraulic test facility with the operation range of 150 ºC, 30 Bar, and 500 m3/hr is under construction. The facility will provide vibration data on the fuel assembly, fuel rod, housing and vessel as well as hydraulic data of the pressure loss coefficients and the lift-off flow rates. In this paper, we introduce the test facility, test methodology, instrumentation, and data acquisition system. 1. INTRODUCTION In the fuel assembly region of a reactor core of a PWR plant, some rod failure due to a FIV (Flow Induced Vibration) has been founded so far. When the fuel rod grid interactions occur, depending on the condition of the excitations, this could be lead to fretting wear. Therefore, it is very important to verify the reliability of a fuel assembly from the view of the flow induced vibration in order to improve the safety of the PWR plant. KAERI (Korea Atomic Energy Research Institute) recently initiated a new test program sponsored by MOST (Ministry of Science and Technology) in order to obtain the measuring technique in full scale hydraulic test facility for design qualification of the PWR fuel assembly from the aspect of the hydraulics and FIV. Several thermal hydraulic tests have already performed, which was able to measure the pressure loss of the fuel assembly components [1, 2]. Figure 1 shows one of the test results, which is performed on the full scale fuel assembly with a debris resistance bottom end piece. The pressure loss coefficient comparison between the standard bottom end piece (SBEP) and debris resistance bottom end piece (DRBEP) is shown in Fig. 1. The figure shows that the pressure loss coefficient is exponentially decreased as the Reynolds number’s increased. The pressure loss coefficient of DRBEP is 3% higher than that of the SBEP. The results show a relatively reasonable trend. The PWR hydraulic test facility, which can simulate the core condition of a PWR plant, was originally designed to measure the pressure loss parameters for fuel assembly components. Now the PWR hydraulic test facility is being renovated not only to accommodate the new test requirements of the flow induced vibration test but also to replace aged equipments and measuring systems. The power supply system, control system, and data acquisition system have to be replaced with new ones, and a test section also needs to be manufacture to accommodate the test assembly sense pressure drop and vibration of the fuel assembly, fuel rod and housing. In this paper we would like to introduce the renewed facility and test methodology for the hydraulic test, including the pressure loss test and lift-off test, as well as the vibration test, including the fuel rod, fuel assembly, housing, and vessel vibration test. 2. TEST LOOP The PWR hydraulic test loop is being reconstructed for the fuel assembly hydraulic and vibration tests with a full scale single fuel assembly. The test loop consists of a recirculating, pressurized water loop *Work performed within the framework of the Ministry of Science and Technology’s Program in Republic of Korea.
23
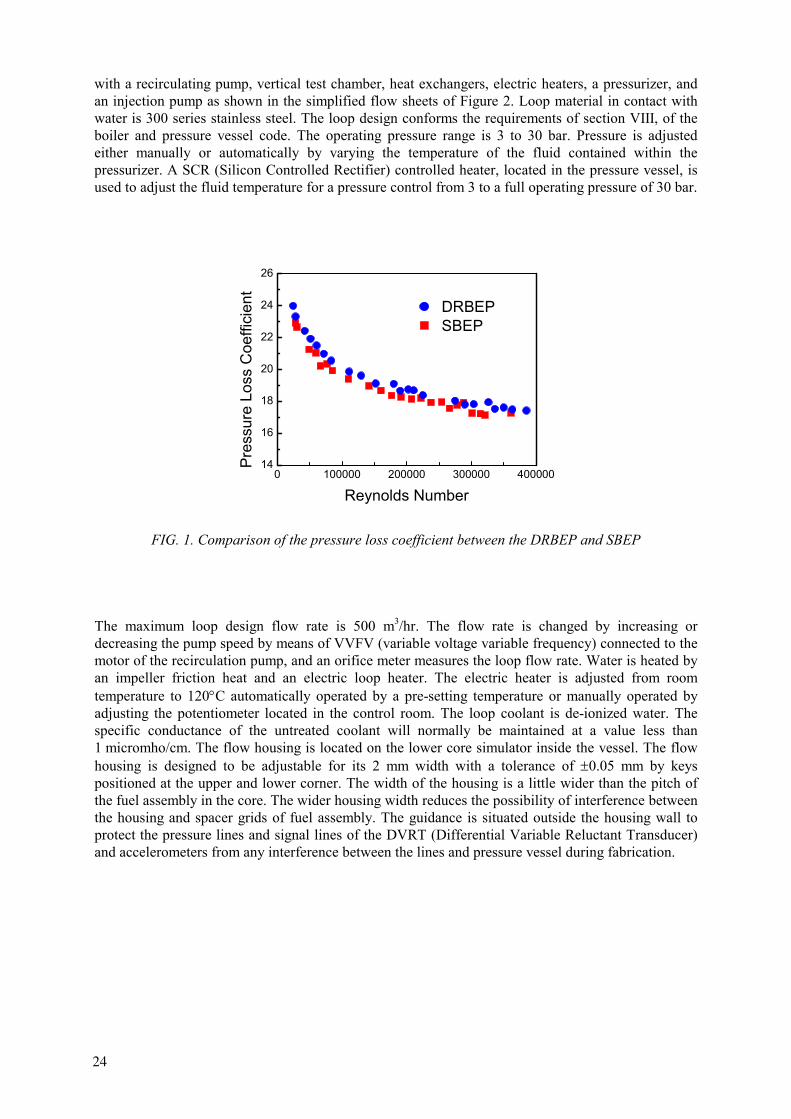
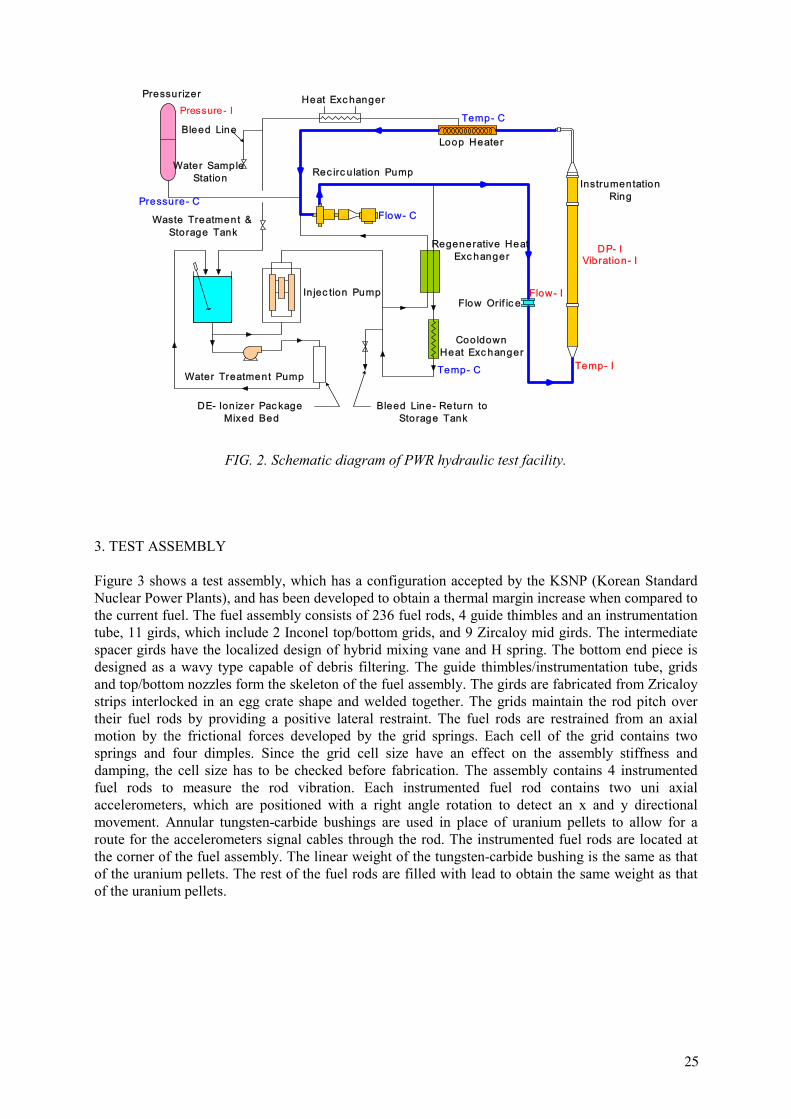
with a recirculating pump, vertical test chamber, heat exchangers, electric heaters, a pressurizer, and an injection pump as shown in the simplified flow sheets of Figure 2. Loop material in contact with water is 300 series stainless steel. The loop design conforms the requirements of section VIII, of the boiler and pressure vessel code. The operating pressure range is 3 to 30 bar. Pressure is adjusted either manually or automatically by varying the temperature of the fluid contained within the pressurizer. A SCR (Silicon Controlled Rectifier) controlled heater, located in the pressure vessel, is used to adjust the fluid temperature for a pressure control from 3 to a full operating pressure of 30 bar.
0 100000 200000 300000 40000014
16
18
20
22
24
26
Pre
ssur
e Lo
ss C
oeffi
cien
t
Reynolds Number
DRBEPSBEP
FIG. 1. Comparison of the pressure loss coefficient between the DRBEP and SBEP The maximum loop design flow rate is 500 m3/hr. The flow rate is changed by increasing or decreasing the pump speed by means of VVFV (variable voltage variable frequency) connected to the motor of the recirculation pump, and an orifice meter measures the loop flow rate. Water is heated by an impeller friction heat and an electric loop heater. The electric heater is adjusted from room temperature to 120°C automatically operated by a pre-setting temperature or manually operated by adjusting the potentiometer located in the control room. The loop coolant is de-ionized water. The specific conductance of the untreated coolant will normally be maintained at a value less than 1 micromho/cm. The flow housing is located on the lower core simulator inside the vessel. The flow housing is designed to be adjustable for its 2 mm width with a tolerance of ±0.05 mm by keys positioned at the upper and lower corner. The width of the housing is a little wider than the pitch of the fuel assembly in the core. The wider housing width reduces the possibility of interference between the housing and spacer grids of fuel assembly. The guidance is situated outside the housing wall to protect the pressure lines and signal lines of the DVRT (Differential Variable Reluctant Transducer) and accelerometers from any interference between the lines and pressure vessel during fabrication.
24
Heat Exc hanger
Regenerative Heat Exc hanger
Flow Orif ic e
CooldownHeat Exc hanger
Water Treatment Pump
DE- Ion izer Pac kage Mixed Bed
Bleed Line- Return to Storage Tank
In jec tion Pump
Waste Treatment & Storage Tank
Bleed Line
Water Sample Station Rec irc u lation Pump
Pressurizer
Loop Heater
Flow- C
Flow- I
Pressure- I
Pressure- C
Temp- C
Temp- I
DP- IVibration- I
Temp- C
InstrumentationRing
FIG. 2. Schematic diagram of PWR hydraulic test facility. 3. TEST ASSEMBLY Figure 3 shows a test assembly, which has a configuration accepted by the KSNP (Korean Standard Nuclear Power Plants), and has been developed to obtain a thermal margin increase when compared to the current fuel. The fuel assembly consists of 236 fuel rods, 4 guide thimbles and an instrumentation tube, 11 girds, which include 2 Inconel top/bottom grids, and 9 Zircaloy mid girds. The intermediate spacer girds have the localized design of hybrid mixing vane and H spring. The bottom end piece is designed as a wavy type capable of debris filtering. The guide thimbles/instrumentation tube, grids and top/bottom nozzles form the skeleton of the fuel assembly. The girds are fabricated from Zricaloy strips interlocked in an egg crate shape and welded together. The grids maintain the rod pitch over their fuel rods by providing a positive lateral restraint. The fuel rods are restrained from an axial motion by the frictional forces developed by the grid springs. Each cell of the grid contains two springs and four dimples. Since the grid cell size have an effect on the assembly stiffness and damping, the cell size has to be checked before fabrication. The assembly contains 4 instrumented fuel rods to measure the rod vibration. Each instrumented fuel rod contains two uni axial accelerometers, which are positioned with a right angle rotation to detect an x and y directional movement. Annular tungsten-carbide bushings are used in place of uranium pellets to allow for a route for the accelerometers signal cables through the rod. The instrumented fuel rods are located at the corner of the fuel assembly. The linear weight of the tungsten-carbide bushing is the same as that of the uranium pellets. The rest of the fuel rods are filled with lead to obtain the same weight as that of the uranium pellets.
25

`
FIG. 3. Schematic diagram of test assembly.
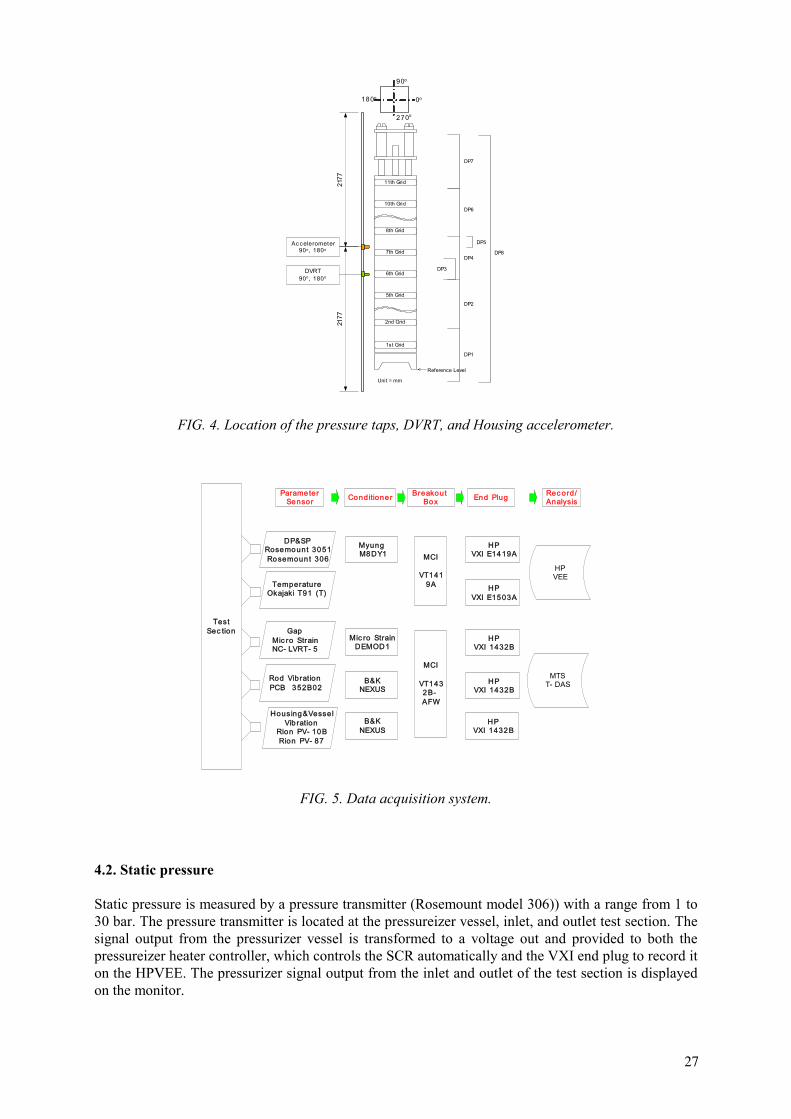
4. INSTRUMENTATIONS Test loop instrumentations include those that are necessary to monitor, record and control the loop operating parameters and also those required for an accurate determination of the pressure loss, lift-off flow rate, and the vibration for the fuel rods, assembly, housing and vessel. 4.1. Differential pressure Differential pressure from the loop flow rate orifice, from the storage tank level, and from the test section measured differential pressure tap locations are all measured by a pressure transducer (Rosemount model 3051). Figure 4 shows the locations of the differential pressure taps in the test section. All the 1/8” diameter stainless steel pressure transmission lines attached to the pressure taps on the flow housing wall penetrate the pressure vessel through an instrumentation ring located above the test chamber. The pressure tap is located downstream of the spacer which minimizes turbulence effects generated from the mixing vane. The resulting 4-20 mmA current output signal from the transmitter can be transformed to a 0-5V voltage signal by a transformer (Myung Model M8DY1) and then through end plug (HPVXI E1419A) the signal is monitored and recorded by the HP VEE [3] as shown in Fig. 5.
26
11th Grid
10th Grid
8th Grid
7th Grid
6th Grid
5th Grid
1st Grid
2nd Grid
Reference Level
DP6
DP4
DP7
DP5
DP2
DP1
DP8
Unit = mm
DP3
2177
2177
Ac celerometer90o, 180o
DVRT90o, 180o
0o
270o
90o
180o
FIG. 4. Location of the pressure taps, DVRT, and Housing accelerometer.
TestSec tion
DP&SPRosemount 3051Rosemount 306
TemperatureOkajaki T91 (T)
Myung M8DY1
HPVXI E1419A
HPVXI E1503A
MCI
VT1419A
Rec ord/AnalysisEnd PlugConditionerParameter
Sensor
Housing&VesselVib ration
Rion PV- 10BRion PV- 87
B&KNEXUS
HPVXI 1432B
Rod VibrationPCB 352B02
MCI
VT1432B-AFW
Mic ro StrainDEMOD1
HPVXI 1432B
GapMic ro StrainNC- LVRT- 5
B&KNEXUS
HPVXI 1432B
HPVEE
MTST- DAS
Breakout Box
FIG. 5. Data acquisition system.
4.2. Static pressure Static pressure is measured by a pressure transmitter (Rosemount model 306)) with a range from 1 to 30 bar. The pressure transmitter is located at the pressureizer vessel, inlet, and outlet test section. The signal output from the pressurizer vessel is transformed to a voltage out and provided to both the pressureizer heater controller, which controls the SCR automatically and the VXI end plug to record it on the HPVEE. The pressurizer signal output from the inlet and outlet of the test section is displayed on the monitor.
27
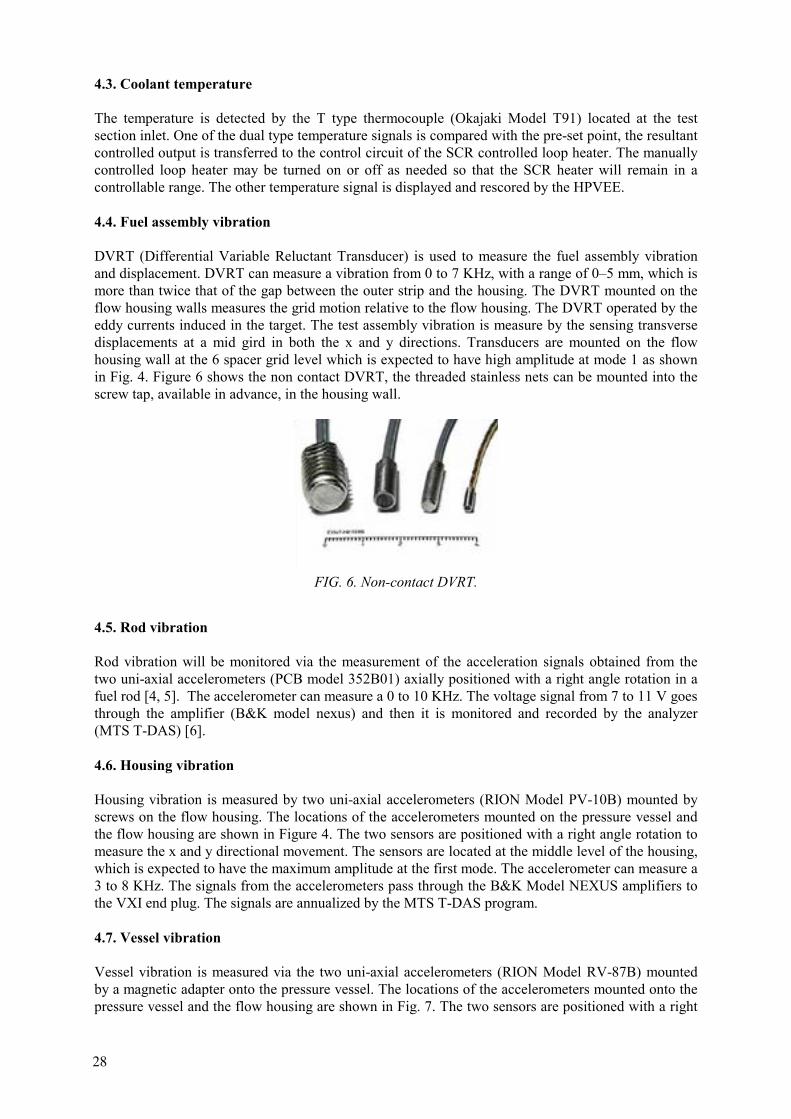
4.3. Coolant temperature The temperature is detected by the T type thermocouple (Okajaki Model T91) located at the test section inlet. One of the dual type temperature signals is compared with the pre-set point, the resultant controlled output is transferred to the control circuit of the SCR controlled loop heater. The manually controlled loop heater may be turned on or off as needed so that the SCR heater will remain in a controllable range. The other temperature signal is displayed and rescored by the HPVEE. 4.4. Fuel assembly vibration DVRT (Differential Variable Reluctant Transducer) is used to measure the fuel assembly vibration and displacement. DVRT can measure a vibration from 0 to 7 KHz, with a range of 0–5 mm, which is more than twice that of the gap between the outer strip and the housing. The DVRT mounted on the flow housing walls measures the grid motion relative to the flow housing. The DVRT operated by the eddy currents induced in the target. The test assembly vibration is measure by the sensing transverse displacements at a mid gird in both the x and y directions. Transducers are mounted on the flow housing wall at the 6 spacer grid level which is expected to have high amplitude at mode 1 as shown in Fig. 4. Figure 6 shows the non contact DVRT, the threaded stainless nets can be mounted into the screw tap, available in advance, in the housing wall.
FIG. 6. Non-contact DVRT.
4.5. Rod vibration Rod vibration will be monitored via the measurement of the acceleration signals obtained from the two uni-axial accelerometers (PCB model 352B01) axially positioned with a right angle rotation in a fuel rod [4, 5]. The accelerometer can measure a 0 to 10 KHz. The voltage signal from 7 to 11 V goes through the amplifier (B&K model nexus) and then it is monitored and recorded by the analyzer (MTS T-DAS) [6]. 4.6. Housing vibration Housing vibration is measured by two uni-axial accelerometers (RION Model PV-10B) mounted by screws on the flow housing. The locations of the accelerometers mounted on the pressure vessel and the flow housing are shown in Figure 4. The two sensors are positioned with a right angle rotation to measure the x and y directional movement. The sensors are located at the middle level of the housing, which is expected to have the maximum amplitude at the first mode. The accelerometer can measure a 3 to 8 KHz. The signals from the accelerometers pass through the B&K Model NEXUS amplifiers to the VXI end plug. The signals are annualized by the MTS T-DAS program. 4.7. Vessel vibration Vessel vibration is measured via the two uni-axial accelerometers (RION Model RV-87B) mounted by a magnetic adapter onto the pressure vessel. The locations of the accelerometers mounted onto the pressure vessel and the flow housing are shown in Fig. 7. The two sensors are positioned with a right
28
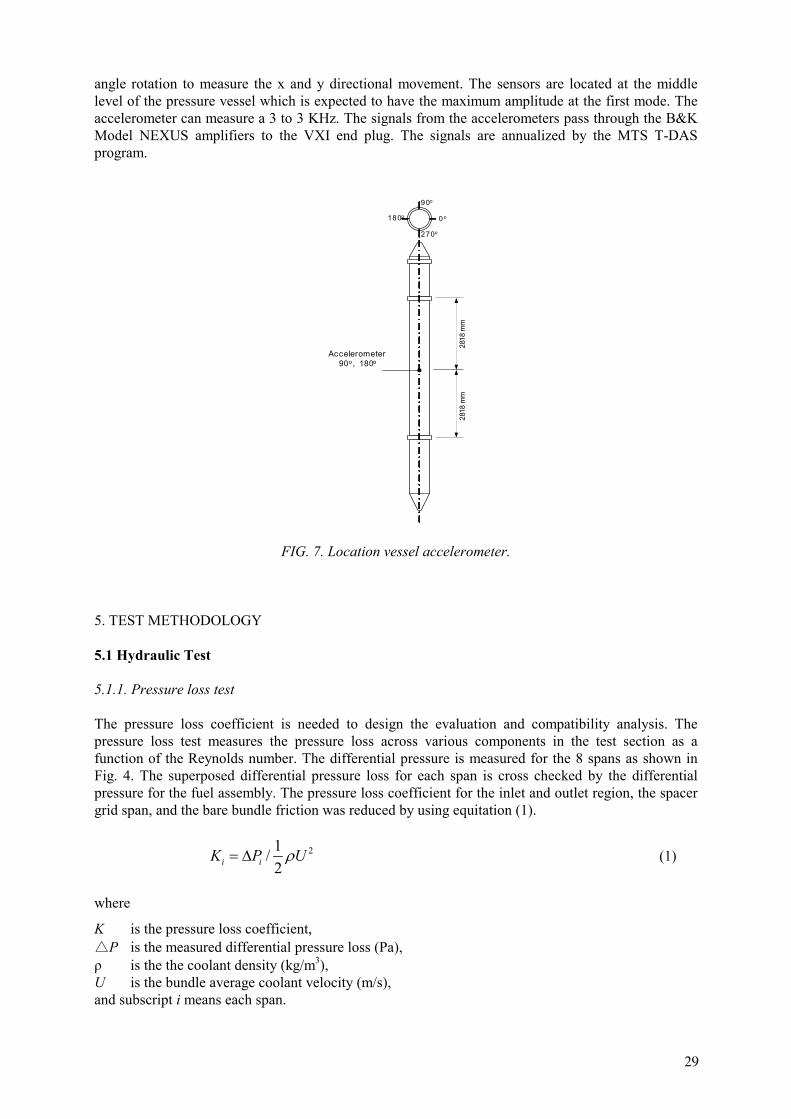
angle rotation to measure the x and y directional movement. The sensors are located at the middle level of the pressure vessel which is expected to have the maximum amplitude at the first mode. The accelerometer can measure a 3 to 3 KHz. The signals from the accelerometers pass through the B&K Model NEXUS amplifiers to the VXI end plug. The signals are annualized by the MTS T-DAS program.
0 o
270o
90o
180o
2818
mm
2818
mm
Accelerometer90o, 180o
FIG. 7. Location vessel accelerometer.
5. TEST METHODOLOGY 5.1 Hydraulic Test 5.1.1. Pressure loss test The pressure loss coefficient is needed to design the evaluation and compatibility analysis. The pressure loss test measures the pressure loss across various components in the test section as a function of the Reynolds number. The differential pressure is measured for the 8 spans as shown in Fig. 4. The superposed differential pressure loss for each span is cross checked by the differential pressure for the fuel assembly. The pressure loss coefficient for the inlet and outlet region, the spacer grid span, and the bare bundle friction was reduced by using equitation (1).
21/2i iK P Uρ= ∆ (1)
where
K is the pressure loss coefficient, △P is the measured differential pressure loss (Pa), ρ is the the coolant density (kg/m3), U is the bundle average coolant velocity (m/s), and subscript i means each span.
29
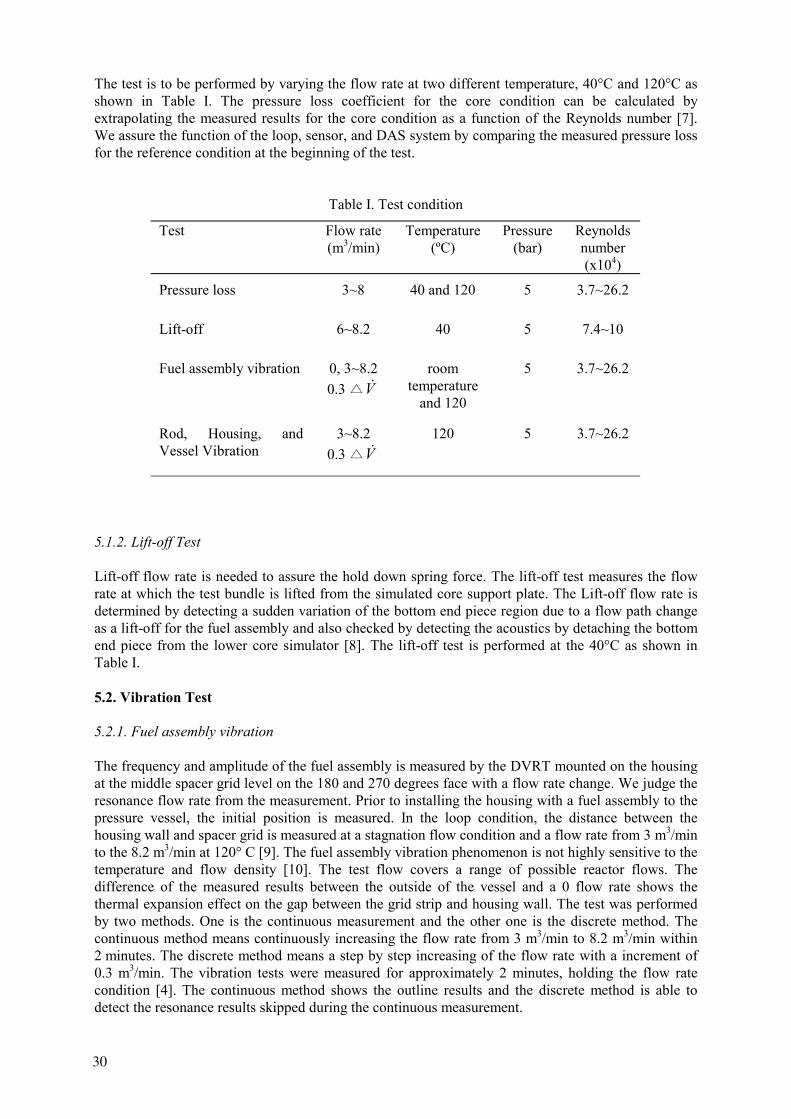
The test is to be performed by varying the flow rate at two different temperature, 40°C and 120°C as shown in Table I. The pressure loss coefficient for the core condition can be calculated by extrapolating the measured results for the core condition as a function of the Reynolds number [7]. We assure the function of the loop, sensor, and DAS system by comparing the measured pressure loss for the reference condition at the beginning of the test.
Table I. Test condition
Test Flow rate (m3/min)
Temperature (ºC)
Pressure (bar)
Reynolds number (x104)
Pressure loss 3~8 40 and 120 5 3.7~26.2
Lift-off 6~8.2 40 5 7.4~10
Fuel assembly vibration 0, 3~8.2 0.3 △V
room temperature
and 120
5 3.7~26.2
Rod, Housing, and Vessel Vibration
3~8.2 0.3 △V
120 5 3.7~26.2
5.1.2. Lift-off Test Lift-off flow rate is needed to assure the hold down spring force. The lift-off test measures the flow rate at which the test bundle is lifted from the simulated core support plate. The Lift-off flow rate is determined by detecting a sudden variation of the bottom end piece region due to a flow path change as a lift-off for the fuel assembly and also checked by detecting the acoustics by detaching the bottom end piece from the lower core simulator [8]. The lift-off test is performed at the 40°C as shown in Table I. 5.2. Vibration Test 5.2.1. Fuel assembly vibration The frequency and amplitude of the fuel assembly is measured by the DVRT mounted on the housing at the middle spacer grid level on the 180 and 270 degrees face with a flow rate change. We judge the resonance flow rate from the measurement. Prior to installing the housing with a fuel assembly to the pressure vessel, the initial position is measured. In the loop condition, the distance between the housing wall and spacer grid is measured at a stagnation flow condition and a flow rate from 3 m3/min to the 8.2 m3/min at 120° C [9]. The fuel assembly vibration phenomenon is not highly sensitive to the temperature and flow density [10]. The test flow covers a range of possible reactor flows. The difference of the measured results between the outside of the vessel and a 0 flow rate shows the thermal expansion effect on the gap between the grid strip and housing wall. The test was performed by two methods. One is the continuous measurement and the other one is the discrete method. The continuous method means continuously increasing the flow rate from 3 m3/min to 8.2 m3/min within 2 minutes. The discrete method means a step by step increasing of the flow rate with a increment of 0.3 m3/min. The vibration tests were measured for approximately 2 minutes, holding the flow rate condition [4]. The continuous method shows the outline results and the discrete method is able to detect the resonance results skipped during the continuous measurement.
30
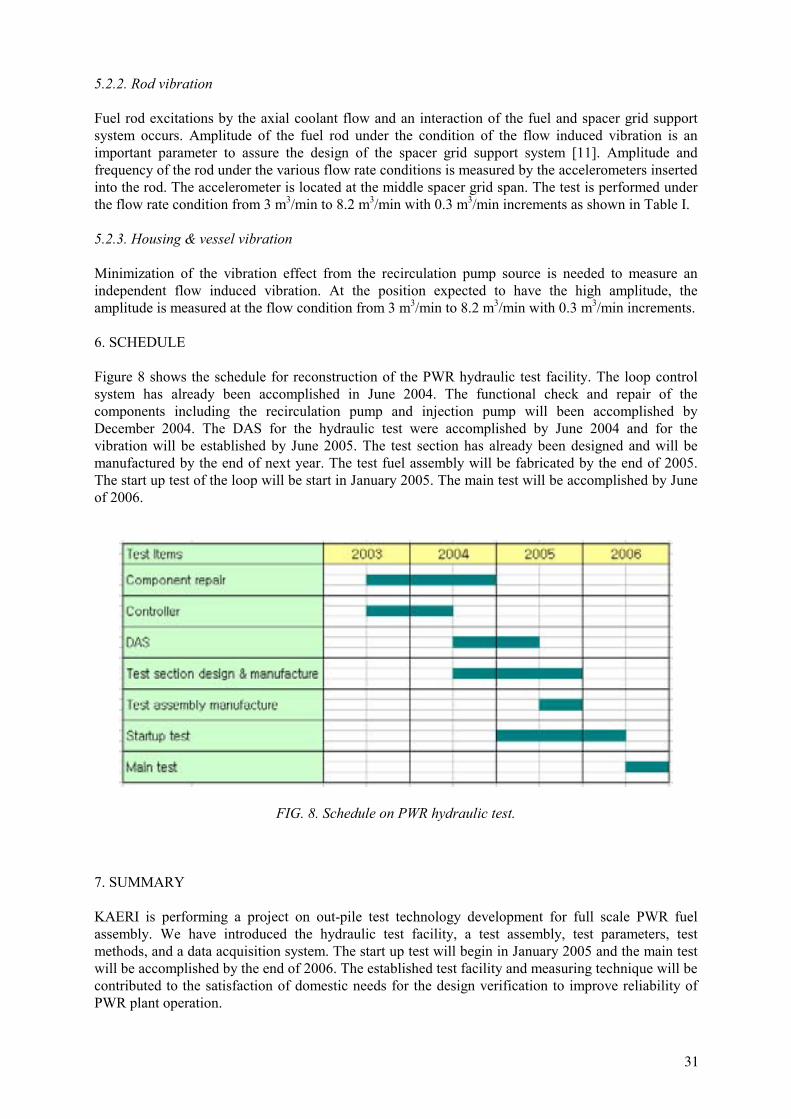
5.2.2. Rod vibration Fuel rod excitations by the axial coolant flow and an interaction of the fuel and spacer grid support system occurs. Amplitude of the fuel rod under the condition of the flow induced vibration is an important parameter to assure the design of the spacer grid support system [11]. Amplitude and frequency of the rod under the various flow rate conditions is measured by the accelerometers inserted into the rod. The accelerometer is located at the middle spacer grid span. The test is performed under the flow rate condition from 3 m3/min to 8.2 m3/min with 0.3 m3/min increments as shown in Table I. 5.2.3. Housing & vessel vibration Minimization of the vibration effect from the recirculation pump source is needed to measure an independent flow induced vibration. At the position expected to have the high amplitude, the amplitude is measured at the flow condition from 3 m3/min to 8.2 m3/min with 0.3 m3/min increments. 6. SCHEDULE Figure 8 shows the schedule for reconstruction of the PWR hydraulic test facility. The loop control system has already been accomplished in June 2004. The functional check and repair of the components including the recirculation pump and injection pump will been accomplished by December 2004. The DAS for the hydraulic test were accomplished by June 2004 and for the vibration will be established by June 2005. The test section has already been designed and will be manufactured by the end of next year. The test fuel assembly will be fabricated by the end of 2005. The start up test of the loop will be start in January 2005. The main test will be accomplished by June of 2006.
FIG. 8. Schedule on PWR hydraulic test. 7. SUMMARY KAERI is performing a project on out-pile test technology development for full scale PWR fuel assembly. We have introduced the hydraulic test facility, a test assembly, test parameters, test methods, and a data acquisition system. The start up test will begin in January 2005 and the main test will be accomplished by the end of 2006. The established test facility and measuring technique will be contributed to the satisfaction of domestic needs for the design verification to improve reliability of PWR plant operation.
31
ACKNOWLEDGEMENTS This work has been carried out under the Nuclear R&D Program supported by Ministry of Science and Technology in Korea.
REFERENCES
[1] J.H. CHA, S.K. YANG, J.H. JUNG, S.Y. CHUN, C.H. SONG, and H. J. SUNG, Development
of Flow Test Technology of for PWR Fuel Assembly, KAERI/RR-907/90, KAERI (1990). [2] S.Y. CHUN, S. K. CHANG, S.Y. WON, Y.R. CHO, and B.T. KIM, Pressure Loss Tests for
DR-BEP of full size 17X17 PWR Fuel Assembly, KAERI/TR-400/93, KAERI (1993). [3] HEWLETT PACKARD, User’s Manual of HPVEE 5.0 (1999). [4] S. TAKAHSHI and H. TAMAKO, Evaluation of Flow-induced Vibration for Fixed Type Guide
Rods of Shroud Head and Steam Dryer in ABWR, ICONE10-22549, Proceedings of ICONE10 10th International Conference on Nuclear Engineering, Arlington (2002).
[5] Y. TSUKUDA, A. TANABE, Y. NISHINO, K. KAMIMURA, N. SAITO, T. HATTORI, and M. WARASHINA, BWR 9X9 Fuel Assembly Thermal-Hydraulic Tests (2), ICONE10-22557, Proceedings of ICONE10 10th International Conference on Nuclear Engineering, Arlington (2002).
[6] MTS SYSTEM CORPORATION, User’s Manual, IDEAS Master Series 7.0 (2000). [7] I.K. MADNI, L.G. STEPHENS, and D.M. TURNER, Development of Correlations for Pressure
Loss/Drop Coefficients Obtained from Flow Testing of Fuel Assemblies in FRAMATOME ANP’s PHTF, ICONE10-22428, Proceedings of ICONE10 10th International Conference on Nuclear Engineering, Arlington (2002).
[8] COMBUSTION ENGINEERING, Fuel Assembly Mechanical Test Report (1990) [9] Y.K. JANG, K.T. KIM, and J.W. KIM, An Experimental Study on the PLUS7 Fuel Assembly
Vibration, Proc. KNS Fall Mtg, Youngpyung, Korea (2002). [10] R.Y. LU, K.D. BROACH, and J.J. McEVOY, Fuel Assembly Self-excited Vibration and Test
Methodology, Proceeding of ICAPP’04 Pittsburgh (2004). [11] S.J. KING, M.Y. YOUNG, D.D. SEEL, and D.V. PARAMONOV, Flow Induced Vibration and
Fretting Wear in PWR Fuel, ICONE10-22399, Proceedings of ICONE10 10th International Conference on Nuclear Engineering, Arlington (2002).
32
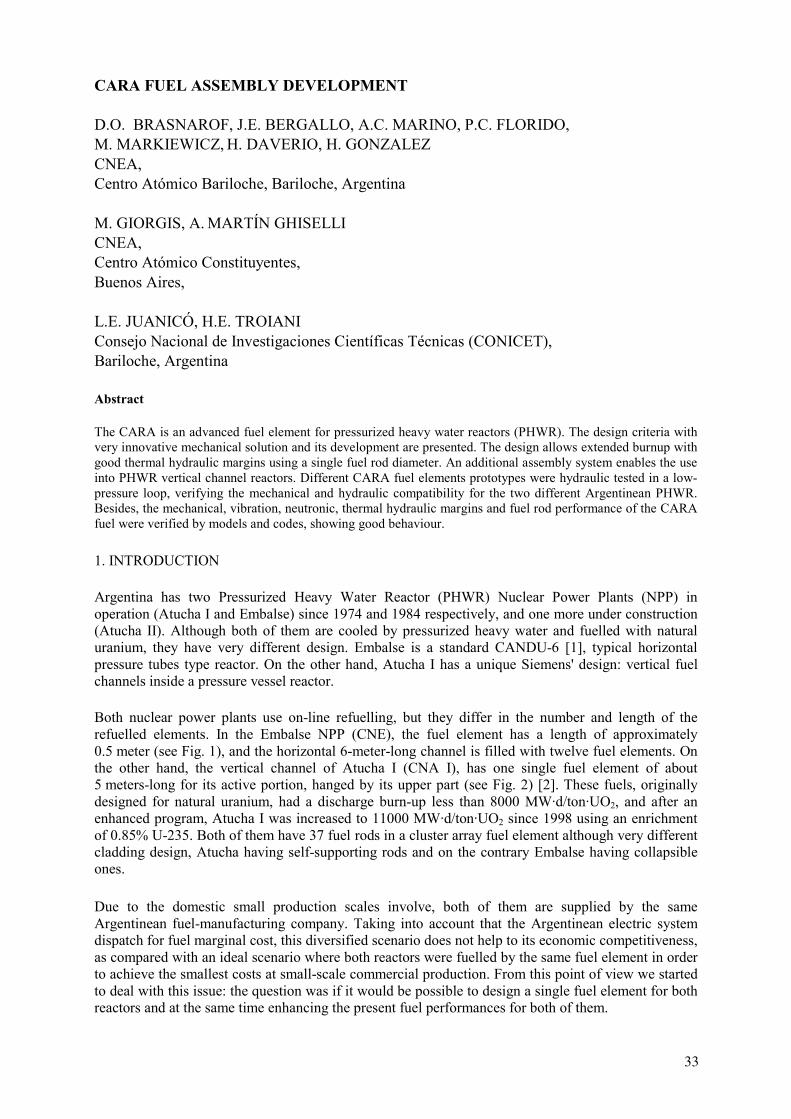
CARA FUEL ASSEMBLY DEVELOPMENT
D.O. BRASNAROF, J.E. BERGALLO, A.C. MARINO, P.C. FLORIDO, M. MARKIEWICZ, H. DAVERIO, H. GONZALEZ
CNEA, Centro Atómico Bariloche, Bariloche, Argentina M. GIORGIS, A. MARTÍN GHISELLI CNEA, Centro Atómico Constituyentes, Buenos Aires, L.E. JUANICÓ, H.E. TROIANI Consejo Nacional de Investigaciones Científicas Técnicas (CONICET), Bariloche, Argentina Abstract The CARA is an advanced fuel element for pressurized heavy water reactors (PHWR). The design criteria with very innovative mechanical solution and its development are presented. The design allows extended burnup with good thermal hydraulic margins using a single fuel rod diameter. An additional assembly system enables the use into PHWR vertical channel reactors. Different CARA fuel elements prototypes were hydraulic tested in a low-pressure loop, verifying the mechanical and hydraulic compatibility for the two different Argentinean PHWR. Besides, the mechanical, vibration, neutronic, thermal hydraulic margins and fuel rod performance of the CARA fuel were verified by models and codes, showing good behaviour.
1. INTRODUCTION Argentina has two Pressurized Heavy Water Reactor (PHWR) Nuclear Power Plants (NPP) in operation (Atucha I and Embalse) since 1974 and 1984 respectively, and one more under construction (Atucha II). Although both of them are cooled by pressurized heavy water and fuelled with natural uranium, they have very different design. Embalse is a standard CANDU-6 [1], typical horizontal pressure tubes type reactor. On the other hand, Atucha I has a unique Siemens' design: vertical fuel channels inside a pressure vessel reactor. Both nuclear power plants use on-line refuelling, but they differ in the number and length of the refuelled elements. In the Embalse NPP (CNE), the fuel element has a length of approximately 0.5 meter (see Fig. 1), and the horizontal 6-meter-long channel is filled with twelve fuel elements. On the other hand, the vertical channel of Atucha I (CNA I), has one single fuel element of about 5 meters-long for its active portion, hanged by its upper part (see Fig. 2) [2]. These fuels, originally designed for natural uranium, had a discharge burn-up less than 8000 MW·d/ton·UO2, and after an enhanced program, Atucha I was increased to 11000 MW·d/ton·UO2 since 1998 using an enrichment of 0.85% U-235. Both of them have 37 fuel rods in a cluster array fuel element although very different cladding design, Atucha having self-supporting rods and on the contrary Embalse having collapsible ones. Due to the domestic small production scales involve, both of them are supplied by the same Argentinean fuel-manufacturing company. Taking into account that the Argentinean electric system dispatch for fuel marginal cost, this diversified scenario does not help to its economic competitiveness, as compared with an ideal scenario where both reactors were fuelled by the same fuel element in order to achieve the smallest costs at small-scale commercial production. From this point of view we started to deal with this issue: the question was if it would be possible to design a single fuel element for both reactors and at the same time enhancing the present fuel performances for both of them.
33
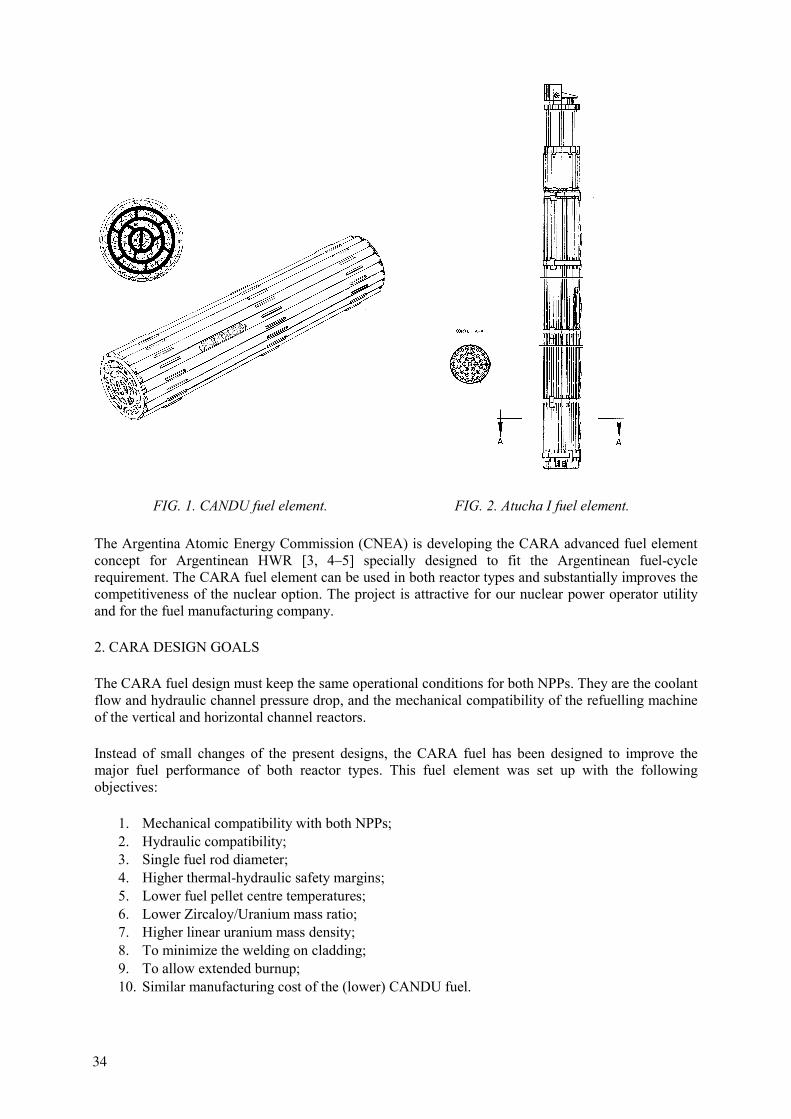
FIG. 1. CANDU fuel element.
FIG. 2. Atucha I fuel element. The Argentina Atomic Energy Commission (CNEA) is developing the CARA advanced fuel element concept for Argentinean HWR [3, 4–5] specially designed to fit the Argentinean fuel-cycle requirement. The CARA fuel element can be used in both reactor types and substantially improves the competitiveness of the nuclear option. The project is attractive for our nuclear power operator utility and for the fuel manufacturing company. 2. CARA DESIGN GOALS The CARA fuel design must keep the same operational conditions for both NPPs. They are the coolant flow and hydraulic channel pressure drop, and the mechanical compatibility of the refuelling machine of the vertical and horizontal channel reactors. Instead of small changes of the present designs, the CARA fuel has been designed to improve the major fuel performance of both reactor types. This fuel element was set up with the following objectives:
1. Mechanical compatibility with both NPPs; 2. Hydraulic compatibility; 3. Single fuel rod diameter; 4. Higher thermal-hydraulic safety margins; 5. Lower fuel pellet centre temperatures; 6. Lower Zircaloy/Uranium mass ratio; 7. Higher linear uranium mass density; 8. To minimize the welding on cladding; 9. To allow extended burnup; 10. Similar manufacturing cost of the (lower) CANDU fuel.
34
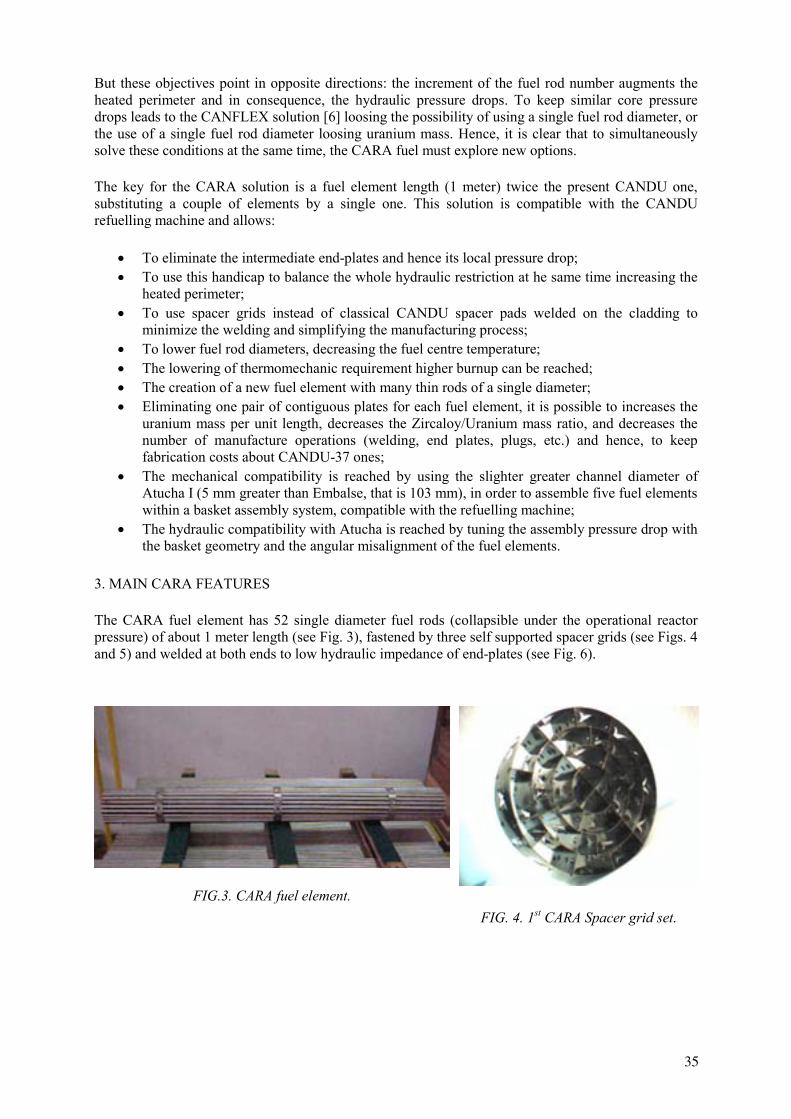
But these objectives point in opposite directions: the increment of the fuel rod number augments the heated perimeter and in consequence, the hydraulic pressure drops. To keep similar core pressure drops leads to the CANFLEX solution [6] loosing the possibility of using a single fuel rod diameter, or the use of a single fuel rod diameter loosing uranium mass. Hence, it is clear that to simultaneously solve these conditions at the same time, the CARA fuel must explore new options. The key for the CARA solution is a fuel element length (1 meter) twice the present CANDU one, substituting a couple of elements by a single one. This solution is compatible with the CANDU refuelling machine and allows:
• To eliminate the intermediate end-plates and hence its local pressure drop; • To use this handicap to balance the whole hydraulic restriction at he same time increasing the
heated perimeter; • To use spacer grids instead of classical CANDU spacer pads welded on the cladding to
minimize the welding and simplifying the manufacturing process; • To lower fuel rod diameters, decreasing the fuel centre temperature; • The lowering of thermomechanic requirement higher burnup can be reached; • The creation of a new fuel element with many thin rods of a single diameter; • Eliminating one pair of contiguous plates for each fuel element, it is possible to increases the
uranium mass per unit length, decreases the Zircaloy/Uranium mass ratio, and decreases the number of manufacture operations (welding, end plates, plugs, etc.) and hence, to keep fabrication costs about CANDU-37 ones;
• The mechanical compatibility is reached by using the slighter greater channel diameter of Atucha I (5 mm greater than Embalse, that is 103 mm), in order to assemble five fuel elements within a basket assembly system, compatible with the refuelling machine;
• The hydraulic compatibility with Atucha is reached by tuning the assembly pressure drop with the basket geometry and the angular misalignment of the fuel elements.
3. MAIN CARA FEATURES The CARA fuel element has 52 single diameter fuel rods (collapsible under the operational reactor pressure) of about 1 meter length (see Fig. 3), fastened by three self supported spacer grids (see Figs. 4 and 5) and welded at both ends to low hydraulic impedance of end-plates (see Fig. 6).
FIG.3. CARA fuel element. FIG. 4. 1st CARA Spacer grid set.
35
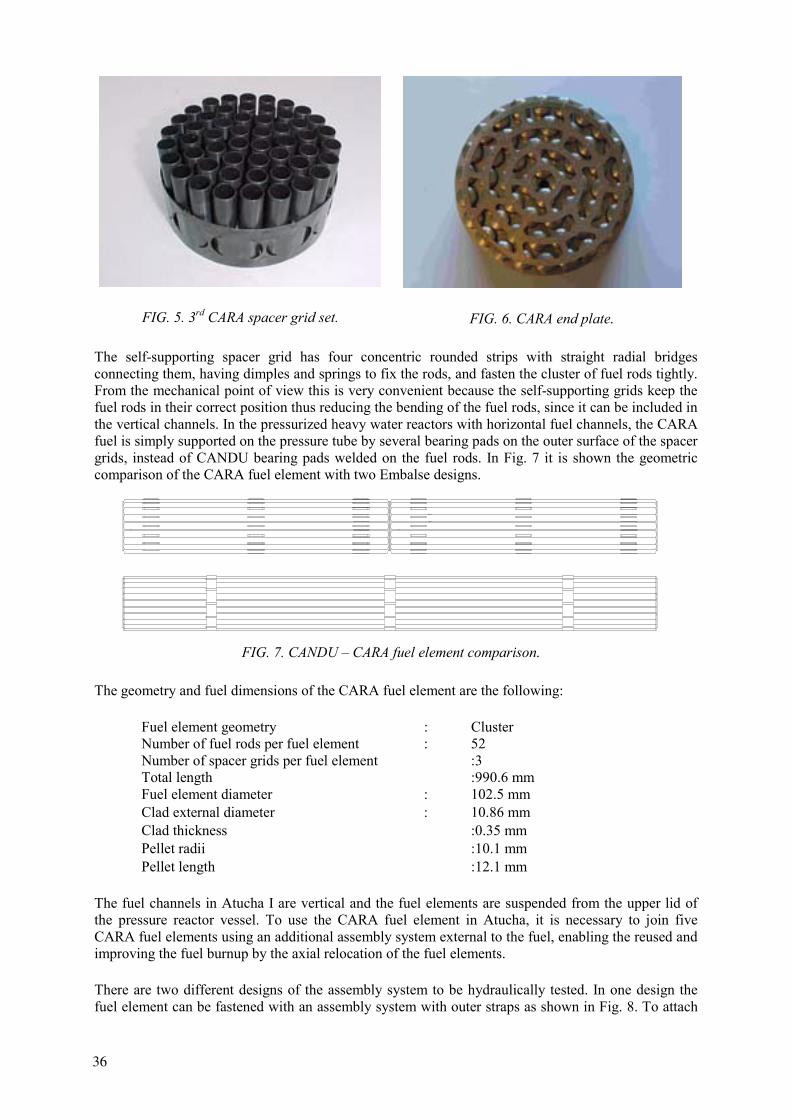
FIG. 5. 3rd CARA spacer grid set.
FIG. 6. CARA end plate. The self-supporting spacer grid has four concentric rounded strips with straight radial bridges connecting them, having dimples and springs to fix the rods, and fasten the cluster of fuel rods tightly. From the mechanical point of view this is very convenient because the self-supporting grids keep the fuel rods in their correct position thus reducing the bending of the fuel rods, since it can be included in the vertical channels. In the pressurized heavy water reactors with horizontal fuel channels, the CARA fuel is simply supported on the pressure tube by several bearing pads on the outer surface of the spacer grids, instead of CANDU bearing pads welded on the fuel rods. In Fig. 7 it is shown the geometric comparison of the CARA fuel element with two Embalse designs.
FIG. 7. CANDU – CARA fuel element comparison.
The geometry and fuel dimensions of the CARA fuel element are the following:
Fuel element geometry : Cluster Number of fuel rods per fuel element : 52 Number of spacer grids per fuel element :3 Total length :990.6 mm Fuel element diameter : 102.5 mm Clad external diameter : 10.86 mm Clad thickness :0.35 mm Pellet radii :10.1 mm Pellet length :12.1 mm
The fuel channels in Atucha I are vertical and the fuel elements are suspended from the upper lid of the pressure reactor vessel. To use the CARA fuel element in Atucha, it is necessary to join five CARA fuel elements using an additional assembly system external to the fuel, enabling the reused and improving the fuel burnup by the axial relocation of the fuel elements. There are two different designs of the assembly system to be hydraulically tested. In one design the fuel element can be fastened with an assembly system with outer straps as shown in Fig. 8. To attach
36

the fuel elements together, a low-pressure drop stopper (Fig. 9) is placed at its lower end. In the other end there is an intermediate coupling system containing a spring, which joins the fuel elements together. There is also a coupling body which copy the Atucha fuel upper end, to ensure its adaptability with the Atucha I design, which is also incorporated in the upper part of the channel (see Fig. 10).
FIG. 8. Assembly system body.
FIG. 9. Assembly system bottom.
FIG. 10. Complete CARA assembly system for Atucha I.
The other design of the assembly system is an outer supporting tube with windows or openings. It has been designed to support all the fuel elements together and it enables the coolant to circulate lightly through the fuel elements and the channel. The use of spacer grids, which fix the fuel rods transversally, provides a greater mechanical strength, suitable to withstand the mechanical requirements due to the vertical position. The fuel element is radial supported by the spacer grid bearing pads, which lean at a ring of the assembly systems, and the fuel element is fixed with flexible pads. The assembly system is fixed to the channel by 16 axial supporting planes along its length, each plane having 2 fixed pads and 1 flexible sliding shoe.
4. MECHANICAL DESIGN Based on the current experience of the fuel rod for Embalse and in order to reduce the Zircaloy quantity and to increase the burnup, the CARA fuel rod was designed considering a collapsible mechanical behaviour response under the operational reactor pressure. This thickness is compatible with the mechanical stress and integrity under normal operation conditions and spent fuel management. Due to the lower inner diameter of the Embalse fuel channel, the external diameter of the CARA fuel element was fixed by this constrain, and the maximum length was fixed taking into account the refuelling machine compatibility. The higher axial loading of the fuel rods is developed during the refuelling operation in the Embalse reactor. The side stops of the refuelling machine hold the fuel string and 10 external pins are in contact. The design condition for this operation is a maximum compressive load of 7300 N. A maximum spacer grid distance of 410 mm is obtained as a limit for mechanical buckling stability. This
37
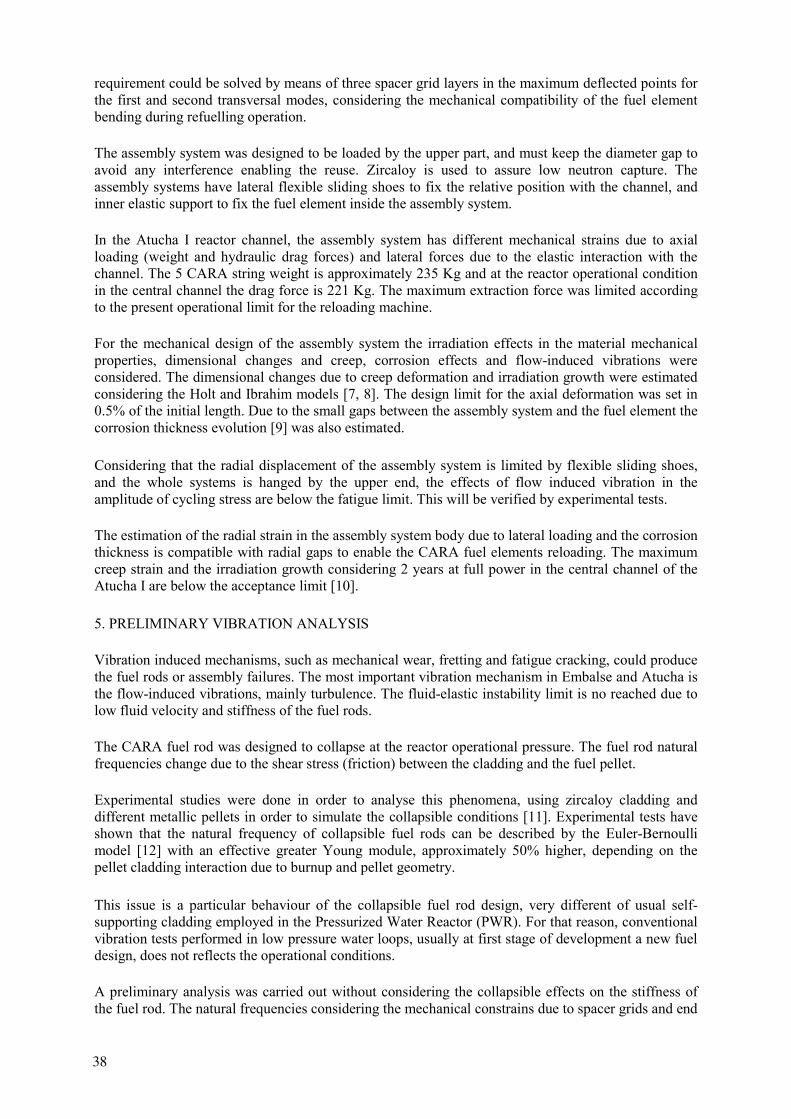
requirement could be solved by means of three spacer grid layers in the maximum deflected points for the first and second transversal modes, considering the mechanical compatibility of the fuel element bending during refuelling operation. The assembly system was designed to be loaded by the upper part, and must keep the diameter gap to avoid any interference enabling the reuse. Zircaloy is used to assure low neutron capture. The assembly systems have lateral flexible sliding shoes to fix the relative position with the channel, and inner elastic support to fix the fuel element inside the assembly system. In the Atucha I reactor channel, the assembly system has different mechanical strains due to axial loading (weight and hydraulic drag forces) and lateral forces due to the elastic interaction with the channel. The 5 CARA string weight is approximately 235 Kg and at the reactor operational condition in the central channel the drag force is 221 Kg. The maximum extraction force was limited according to the present operational limit for the reloading machine. For the mechanical design of the assembly system the irradiation effects in the material mechanical properties, dimensional changes and creep, corrosion effects and flow-induced vibrations were considered. The dimensional changes due to creep deformation and irradiation growth were estimated considering the Holt and Ibrahim models [7, 8]. The design limit for the axial deformation was set in 0.5% of the initial length. Due to the small gaps between the assembly system and the fuel element the corrosion thickness evolution [9] was also estimated. Considering that the radial displacement of the assembly system is limited by flexible sliding shoes, and the whole systems is hanged by the upper end, the effects of flow induced vibration in the amplitude of cycling stress are below the fatigue limit. This will be verified by experimental tests. The estimation of the radial strain in the assembly system body due to lateral loading and the corrosion thickness is compatible with radial gaps to enable the CARA fuel elements reloading. The maximum creep strain and the irradiation growth considering 2 years at full power in the central channel of the Atucha I are below the acceptance limit [10]. 5. PRELIMINARY VIBRATION ANALYSIS
Vibration induced mechanisms, such as mechanical wear, fretting and fatigue cracking, could produce the fuel rods or assembly failures. The most important vibration mechanism in Embalse and Atucha is the flow-induced vibrations, mainly turbulence. The fluid-elastic instability limit is no reached due to low fluid velocity and stiffness of the fuel rods. The CARA fuel rod was designed to collapse at the reactor operational pressure. The fuel rod natural frequencies change due to the shear stress (friction) between the cladding and the fuel pellet. Experimental studies were done in order to analyse this phenomena, using zircaloy cladding and different metallic pellets in order to simulate the collapsible conditions [11]. Experimental tests have shown that the natural frequency of collapsible fuel rods can be described by the Euler-Bernoulli model [12] with an effective greater Young module, approximately 50% higher, depending on the pellet cladding interaction due to burnup and pellet geometry. This issue is a particular behaviour of the collapsible fuel rod design, very different of usual self-supporting cladding employed in the Pressurized Water Reactor (PWR). For that reason, conventional vibration tests performed in low pressure water loops, usually at first stage of development a new fuel design, does not reflects the operational conditions. A preliminary analysis was carried out without considering the collapsible effects on the stiffness of the fuel rod. The natural frequencies considering the mechanical constrains due to spacer grids and end
38
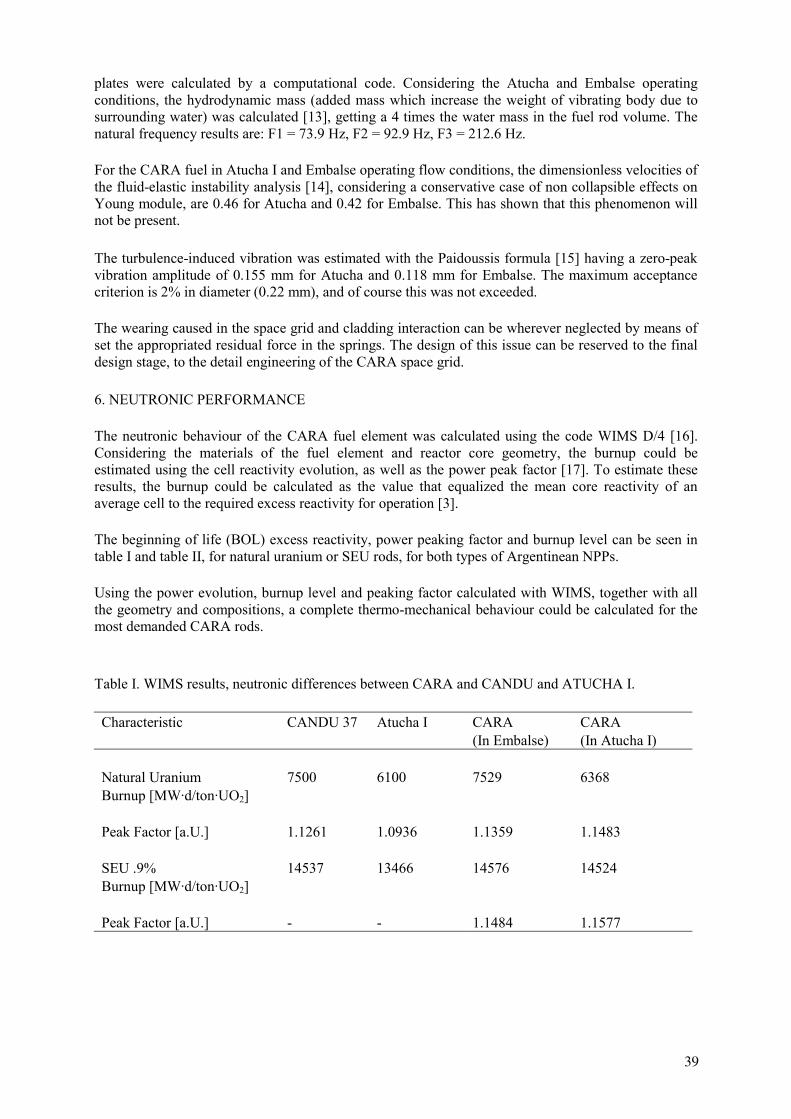
plates were calculated by a computational code. Considering the Atucha and Embalse operating conditions, the hydrodynamic mass (added mass which increase the weight of vibrating body due to surrounding water) was calculated [13], getting a 4 times the water mass in the fuel rod volume. The natural frequency results are: F1 = 73.9 Hz, F2 = 92.9 Hz, F3 = 212.6 Hz. For the CARA fuel in Atucha I and Embalse operating flow conditions, the dimensionless velocities of the fluid-elastic instability analysis [14], considering a conservative case of non collapsible effects on Young module, are 0.46 for Atucha and 0.42 for Embalse. This has shown that this phenomenon will not be present. The turbulence-induced vibration was estimated with the Paidoussis formula [15] having a zero-peak vibration amplitude of 0.155 mm for Atucha and 0.118 mm for Embalse. The maximum acceptance criterion is 2% in diameter (0.22 mm), and of course this was not exceeded. The wearing caused in the space grid and cladding interaction can be wherever neglected by means of set the appropriated residual force in the springs. The design of this issue can be reserved to the final design stage, to the detail engineering of the CARA space grid.
6. NEUTRONIC PERFORMANCE The neutronic behaviour of the CARA fuel element was calculated using the code WIMS D/4 [16]. Considering the materials of the fuel element and reactor core geometry, the burnup could be estimated using the cell reactivity evolution, as well as the power peak factor [17]. To estimate these results, the burnup could be calculated as the value that equalized the mean core reactivity of an average cell to the required excess reactivity for operation [3]. The beginning of life (BOL) excess reactivity, power peaking factor and burnup level can be seen in table I and table II, for natural uranium or SEU rods, for both types of Argentinean NPPs. Using the power evolution, burnup level and peaking factor calculated with WIMS, together with all the geometry and compositions, a complete thermo-mechanical behaviour could be calculated for the most demanded CARA rods. Table I. WIMS results, neutronic differences between CARA and CANDU and ATUCHA I. Characteristic CANDU 37 Atucha I CARA
(In Embalse) CARA (In Atucha I)
Natural Uranium
7500
6100
7529
6368
Burnup [MW·d/ton·UO2] Peak Factor [a.U.]
1.1261
1.0936
1.1359
1.1483
SEU .9%
14537
13466
14576
14524
Burnup [MW·d/ton·UO2] Peak Factor [a.U.]
-
-
1.1484
1.1577
39
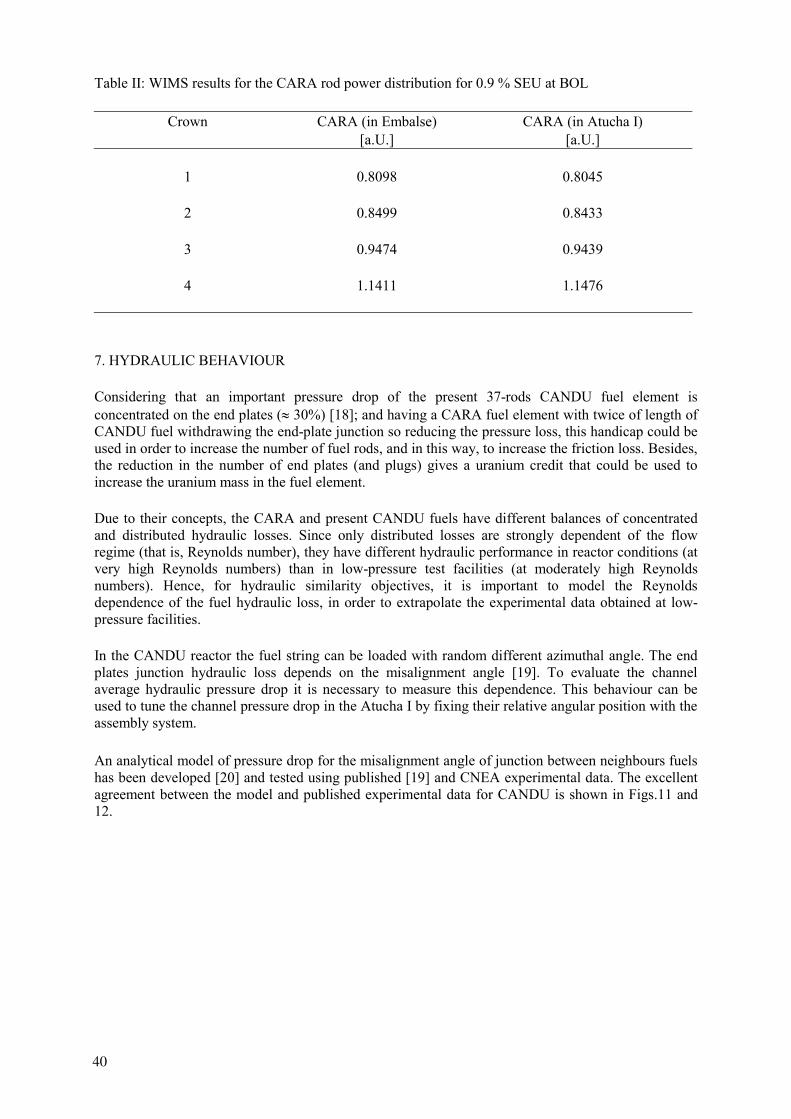
Table II: WIMS results for the CARA rod power distribution for 0.9 % SEU at BOL
Crown
CARA (in Embalse) [a.U.]
CARA (in Atucha I) [a.U.]
1
0.8098
0.8045
2
0.8499 0.8433
3
0.9474 0.9439
4
1.1411 1.1476
7. HYDRAULIC BEHAVIOUR Considering that an important pressure drop of the present 37-rods CANDU fuel element is concentrated on the end plates (≈ 30%) [18]; and having a CARA fuel element with twice of length of CANDU fuel withdrawing the end-plate junction so reducing the pressure loss, this handicap could be used in order to increase the number of fuel rods, and in this way, to increase the friction loss. Besides, the reduction in the number of end plates (and plugs) gives a uranium credit that could be used to increase the uranium mass in the fuel element. Due to their concepts, the CARA and present CANDU fuels have different balances of concentrated and distributed hydraulic losses. Since only distributed losses are strongly dependent of the flow regime (that is, Reynolds number), they have different hydraulic performance in reactor conditions (at very high Reynolds numbers) than in low-pressure test facilities (at moderately high Reynolds numbers). Hence, for hydraulic similarity objectives, it is important to model the Reynolds dependence of the fuel hydraulic loss, in order to extrapolate the experimental data obtained at low-pressure facilities. In the CANDU reactor the fuel string can be loaded with random different azimuthal angle. The end plates junction hydraulic loss depends on the misalignment angle [19]. To evaluate the channel average hydraulic pressure drop it is necessary to measure this dependence. This behaviour can be used to tune the channel pressure drop in the Atucha I by fixing their relative angular position with the assembly system. An analytical model of pressure drop for the misalignment angle of junction between neighbours fuels has been developed [20] and tested using published [19] and CNEA experimental data. The excellent agreement between the model and published experimental data for CANDU is shown in Figs.11 and 12.
40
0 30 60 90 1200.0
0.1
0.2
0.3
0.4
0.5
0.6
0.7
0.8
0.9
1.0
Experimental data Model
Junc
tion
pres
sure
dro
p fa
ctor
Misalignment angle (degrees)
240 270 300 3 30 3600.0
0.1
0.2
0.3
0.4
0.5
0.6
0.7
0.8
0.9
1.0
Experimental Data Model
Junc
tion
pres
sure
dro
p fa
ctor
Misalignment angle (degree)
FIG. 11. CANDU junction pressure drop
coefficient [19]. FIG. 12. CANFLEX junction pressure drop
coefficient [19].
The particular cluster geometry of the CARA fuel element was evaluated by experimental tests. Experiments were carried out with two prototypes in a low-pressure loop. For the hydraulic characterization the CANDU fuel channel was used. The spacer grid hydraulic performance was studied using two CARA prototypes with detachable end plates. In these ones, the fuel rods can be easily dismounted from the end plate using specially designed screw (see Fig. 13).
FIG. 13. Hydraulic test detachable end plate CARA fuel element. The hydraulic tests were done between 70% and 130% of nominal CANDU coolant flow. The distributed friction loss along the fuel rods was extracted from experimental data of the channel pressure profile. Thus it can be used for extracting different concentrated friction losses (spacer grids and end-plates junction). In Fig. 14 the distributed friction factor from experimental data is compared with the classical well-known Moody correlation [21] for pipes, and the specific developed correlation for fuel rod PWR arrays [22], showing good agreement within 10% deviation. A new specific cluster correlation using the experimental data was done with less square fitting. In Fig. 15 the total spacer grid loss coefficient was adjusted from the experimental data showing good agreement [23].
41
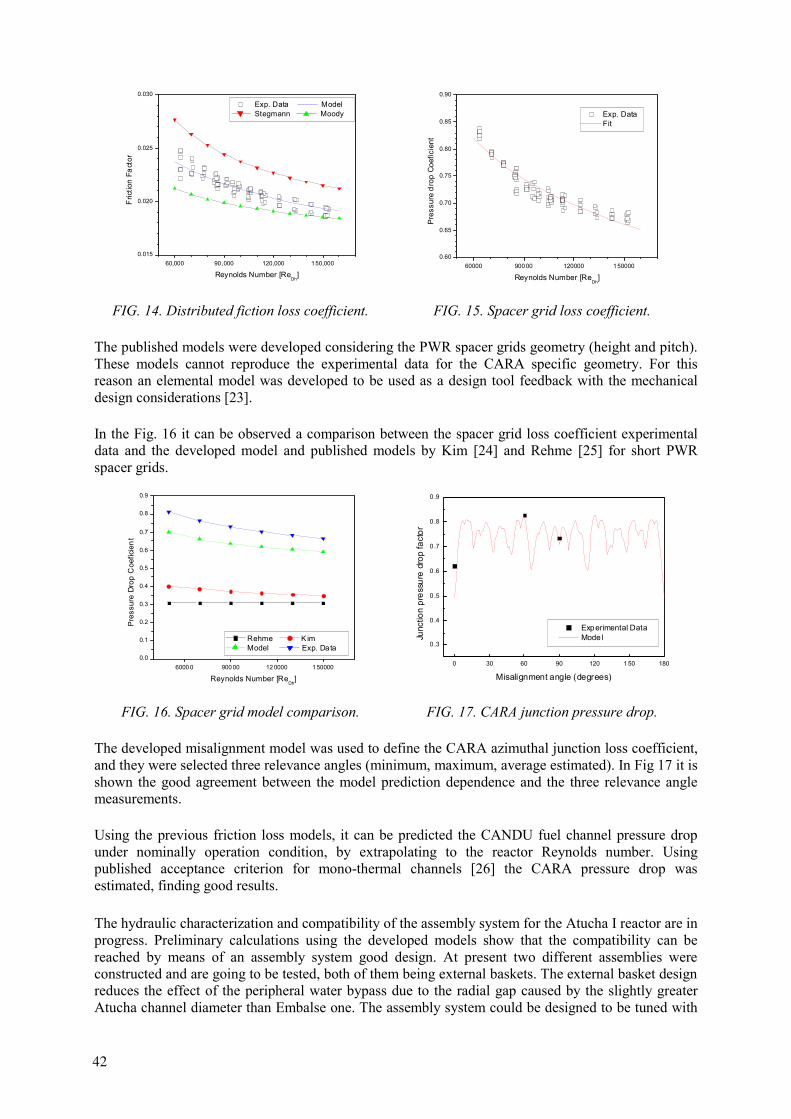
60,000 90 ,000 120,000 150,0000.015
0.020
0.025
0.030
Fric
tion
Fact
or
Reynolds Number [ReDh
]
Exp. Data Model Stegmann Moody
60000 900 00 120000 1500000.60
0.65
0.70
0.75
0.80
0.85
0.90
Pre
ssur
e d
rop
Coe
ficie
nt
Reynolds Number [ReDh
]
Exp. Data Fit
FIG. 14. Distributed fiction loss coefficient. FIG. 15. Spacer grid loss coefficient.
The published models were developed considering the PWR spacer grids geometry (height and pitch). These models cannot reproduce the experimental data for the CARA specific geometry. For this reason an elemental model was developed to be used as a design tool feedback with the mechanical design considerations [23]. In the Fig. 16 it can be observed a comparison between the spacer grid loss coefficient experimental data and the developed model and published models by Kim [24] and Rehme [25] for short PWR spacer grids.
6000 0 900 00 12 0000 1 500000.0
0.1
0.2
0.3
0.4
0.5
0.6
0.7
0.8
0.9
Pre
ssur
e D
rop
Coe
ficie
nt
Reynolds Number [ReDh
]
Rehme K im Model Exp. Data
0 30 60 90 120 1 50 180
0 .3
0 .4
0 .5
0 .6
0 .7
0 .8
0 .9
Experimental Data ModelJu
nctio
n pr
essu
re d
rop
fact
or
Misalignment angle (degrees)
FIG. 16. Spacer grid model comparison. FIG. 17. CARA junction pressure drop. The developed misalignment model was used to define the CARA azimuthal junction loss coefficient, and they were selected three relevance angles (minimum, maximum, average estimated). In Fig 17 it is shown the good agreement between the model prediction dependence and the three relevance angle measurements. Using the previous friction loss models, it can be predicted the CANDU fuel channel pressure drop under nominally operation condition, by extrapolating to the reactor Reynolds number. Using published acceptance criterion for mono-thermal channels [26] the CARA pressure drop was estimated, finding good results. The hydraulic characterization and compatibility of the assembly system for the Atucha I reactor are in progress. Preliminary calculations using the developed models show that the compatibility can be reached by means of an assembly system good design. At present two different assemblies were constructed and are going to be tested, both of them being external baskets. The external basket design reduces the effect of the peripheral water bypass due to the radial gap caused by the slightly greater Atucha channel diameter than Embalse one. The assembly system could be designed to be tuned with
42
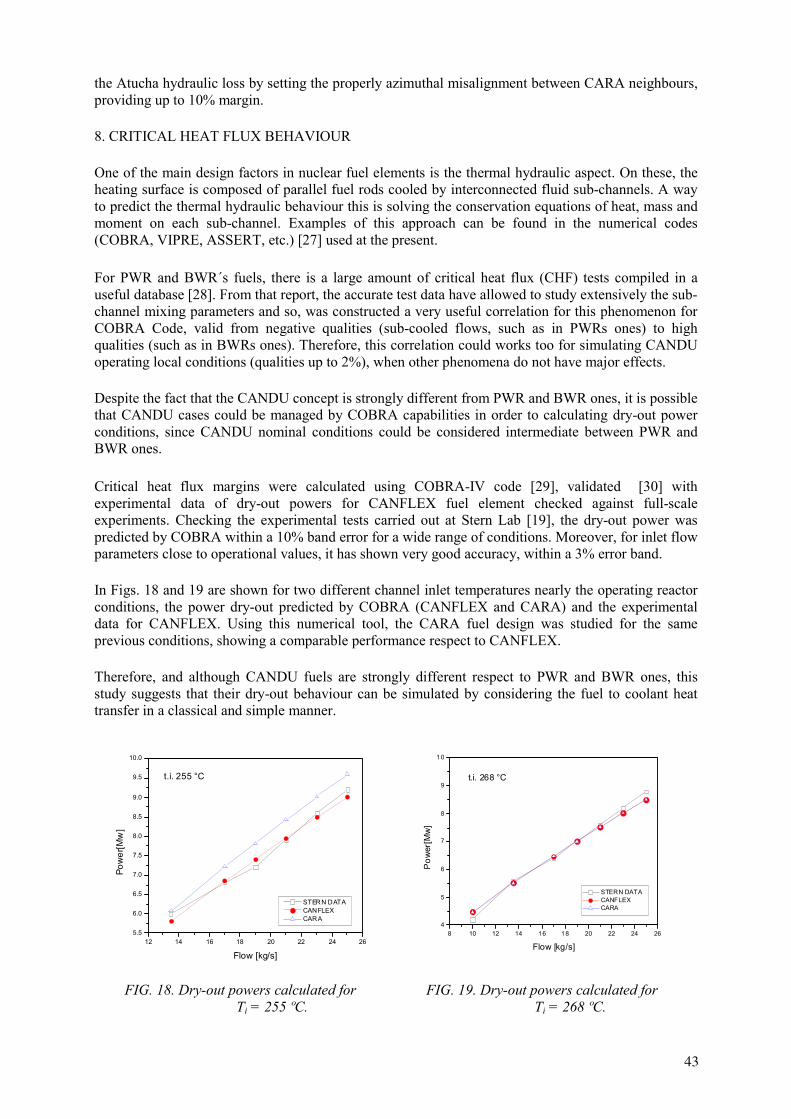
the Atucha hydraulic loss by setting the properly azimuthal misalignment between CARA neighbours, providing up to 10% margin. 8. CRITICAL HEAT FLUX BEHAVIOUR One of the main design factors in nuclear fuel elements is the thermal hydraulic aspect. On these, the heating surface is composed of parallel fuel rods cooled by interconnected fluid sub-channels. A way to predict the thermal hydraulic behaviour this is solving the conservation equations of heat, mass and moment on each sub-channel. Examples of this approach can be found in the numerical codes (COBRA, VIPRE, ASSERT, etc.) [27] used at the present. For PWR and BWR´s fuels, there is a large amount of critical heat flux (CHF) tests compiled in a useful database [28]. From that report, the accurate test data have allowed to study extensively the sub-channel mixing parameters and so, was constructed a very useful correlation for this phenomenon for COBRA Code, valid from negative qualities (sub-cooled flows, such as in PWRs ones) to high qualities (such as in BWRs ones). Therefore, this correlation could works too for simulating CANDU operating local conditions (qualities up to 2%), when other phenomena do not have major effects. Despite the fact that the CANDU concept is strongly different from PWR and BWR ones, it is possible that CANDU cases could be managed by COBRA capabilities in order to calculating dry-out power conditions, since CANDU nominal conditions could be considered intermediate between PWR and BWR ones.
Critical heat flux margins were calculated using COBRA-IV code [29], validated [30] with experimental data of dry-out powers for CANFLEX fuel element checked against full-scale experiments. Checking the experimental tests carried out at Stern Lab [19], the dry-out power was predicted by COBRA within a 10% band error for a wide range of conditions. Moreover, for inlet flow parameters close to operational values, it has shown very good accuracy, within a 3% error band. In Figs. 18 and 19 are shown for two different channel inlet temperatures nearly the operating reactor conditions, the power dry-out predicted by COBRA (CANFLEX and CARA) and the experimental data for CANFLEX. Using this numerical tool, the CARA fuel design was studied for the same previous conditions, showing a comparable performance respect to CANFLEX. Therefore, and although CANDU fuels are strongly different respect to PWR and BWR ones, this study suggests that their dry-out behaviour can be simulated by considering the fuel to coolant heat transfer in a classical and simple manner.
12 14 16 18 20 22 24 265.5
6.0
6.5
7.0
7.5
8.0
8.5
9.0
9.5
10.0
t.i. 255 °C
Pow
er[M
w]
Flow [kg/s]
STERN DATA CANFLEX CARA
8 10 12 14 16 18 20 22 24 264
5
6
7
8
9
1 0
t.i. 268 °C
Pow
er[M
w]
Flow [kg/s]
STERN DATA CANFLEX CARA
FIG. 18. Dry-out powers calculated for
Ti = 255 ºC. FIG. 19. Dry-out powers calculated for
Ti = 268 ºC.
43
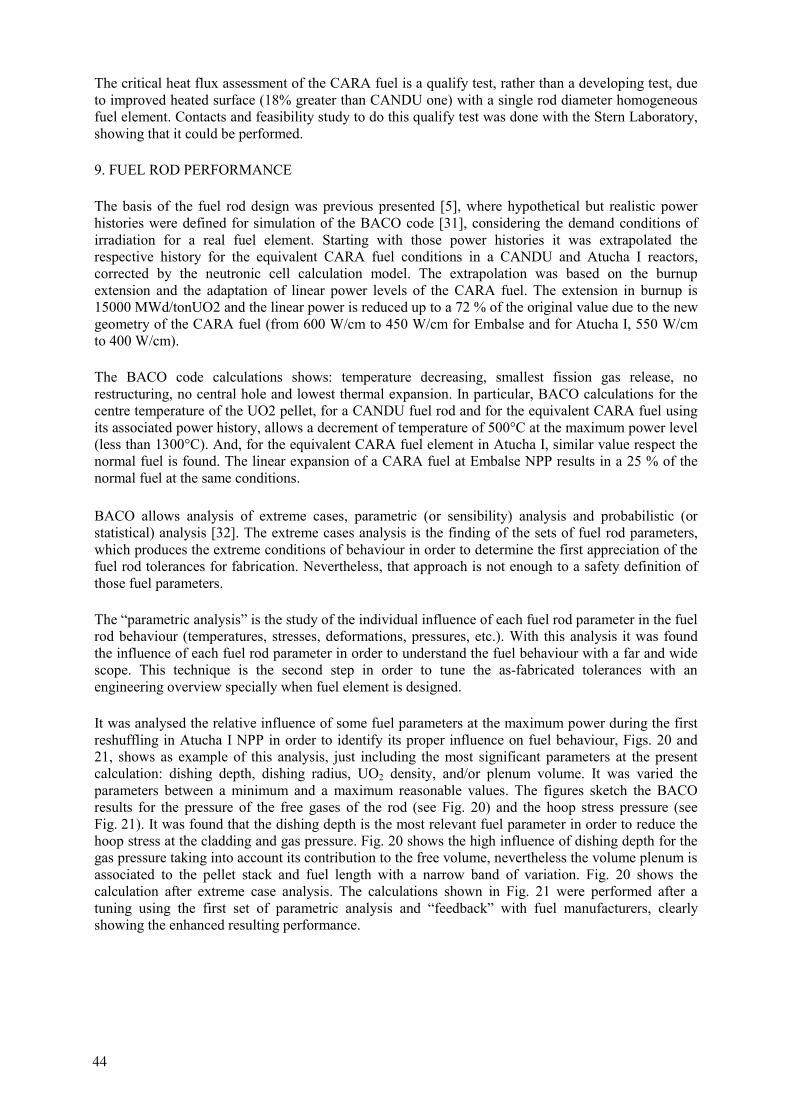
The critical heat flux assessment of the CARA fuel is a qualify test, rather than a developing test, due to improved heated surface (18% greater than CANDU one) with a single rod diameter homogeneous fuel element. Contacts and feasibility study to do this qualify test was done with the Stern Laboratory, showing that it could be performed. 9. FUEL ROD PERFORMANCE The basis of the fuel rod design was previous presented [5], where hypothetical but realistic power histories were defined for simulation of the BACO code [31], considering the demand conditions of irradiation for a real fuel element. Starting with those power histories it was extrapolated the respective history for the equivalent CARA fuel conditions in a CANDU and Atucha I reactors, corrected by the neutronic cell calculation model. The extrapolation was based on the burnup extension and the adaptation of linear power levels of the CARA fuel. The extension in burnup is 15000 MWd/tonUO2 and the linear power is reduced up to a 72 % of the original value due to the new geometry of the CARA fuel (from 600 W/cm to 450 W/cm for Embalse and for Atucha I, 550 W/cm to 400 W/cm). The BACO code calculations shows: temperature decreasing, smallest fission gas release, no restructuring, no central hole and lowest thermal expansion. In particular, BACO calculations for the centre temperature of the UO2 pellet, for a CANDU fuel rod and for the equivalent CARA fuel using its associated power history, allows a decrement of temperature of 500°C at the maximum power level (less than 1300°C). And, for the equivalent CARA fuel element in Atucha I, similar value respect the normal fuel is found. The linear expansion of a CARA fuel at Embalse NPP results in a 25 % of the normal fuel at the same conditions. BACO allows analysis of extreme cases, parametric (or sensibility) analysis and probabilistic (or statistical) analysis [32]. The extreme cases analysis is the finding of the sets of fuel rod parameters, which produces the extreme conditions of behaviour in order to determine the first appreciation of the fuel rod tolerances for fabrication. Nevertheless, that approach is not enough to a safety definition of those fuel parameters. The “parametric analysis” is the study of the individual influence of each fuel rod parameter in the fuel rod behaviour (temperatures, stresses, deformations, pressures, etc.). With this analysis it was found the influence of each fuel rod parameter in order to understand the fuel behaviour with a far and wide scope. This technique is the second step in order to tune the as-fabricated tolerances with an engineering overview specially when fuel element is designed. It was analysed the relative influence of some fuel parameters at the maximum power during the first reshuffling in Atucha I NPP in order to identify its proper influence on fuel behaviour, Figs. 20 and 21, shows as example of this analysis, just including the most significant parameters at the present calculation: dishing depth, dishing radius, UO2 density, and/or plenum volume. It was varied the parameters between a minimum and a maximum reasonable values. The figures sketch the BACO results for the pressure of the free gases of the rod (see Fig. 20) and the hoop stress pressure (see Fig. 21). It was found that the dishing depth is the most relevant fuel parameter in order to reduce the hoop stress at the cladding and gas pressure. Fig. 20 shows the high influence of dishing depth for the gas pressure taking into account its contribution to the free volume, nevertheless the volume plenum is associated to the pellet stack and fuel length with a narrow band of variation. Fig. 20 shows the calculation after extreme case analysis. The calculations shown in Fig. 21 were performed after a tuning using the first set of parametric analysis and “feedback” with fuel manufacturers, clearly showing the enhanced resulting performance.
44
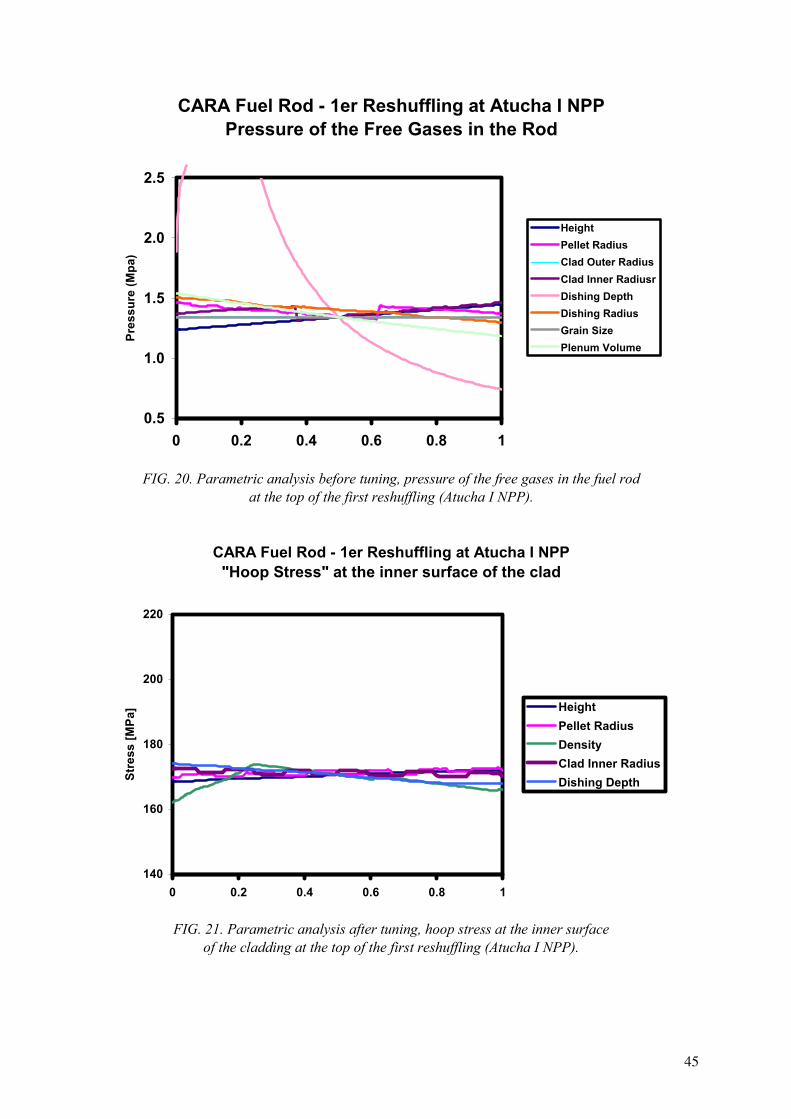
CARA Fuel Rod - 1er Reshuffling at Atucha I NPPPressure of the Free Gases in the Rod
0.5
1.0
1.5
2.0
2.5
0 0.2 0.4 0.6 0.8 1
Pres
sure
(Mpa
)
HeightPellet RadiusClad Outer RadiusClad Inner RadiusrDishing DepthDishing RadiusGrain SizePlenum Volume
FIG. 20. Parametric analysis before tuning, pressure of the free gases in the fuel rod
at the top of the first reshuffling (Atucha I NPP).
CARA Fuel Rod - 1er Reshuffling at Atucha I NPP"Hoop Stress" at the inner surface of the clad
140
160
180
200
220
0 0.2 0.4 0.6 0.8 1
Stre
ss [M
Pa] Height
Pellet RadiusDensityClad Inner RadiusDishing Depth
FIG. 21. Parametric analysis after tuning, hoop stress at the inner surface
of the cladding at the top of the first reshuffling (Atucha I NPP).
45

The “probabilistic analysis” is a Monte-Carlo (M-C) technique, which combine several fuel random parameters (input data) with its statistical distribution. Each probable input data could be a real fuel rod, and the series of M-C calculation have a significant impact on the calculated results. It was used this capacity in order to improve the estimation of those tolerance. Fig. 22 shows a probabilistic analysis, before tuning, of the pressure of the free gases during a strong (and realistic) power history at Atucha I NPP. It was found a strong dispersion of that parameter dependent on burnup increment. After that, it was tuned the parameter in order to design a fuel which reduce that dispersion up to normal values. Fig. 23 shows the probabilistic analysis, after tuning, of the hoop stress at the inner surface of the cladding during the same power history. Here it was shown that fuel parameters were tuned in order to keep the hoop stress just under the threshold for induce a failure by pellet cladding interaction-stress corrosion cracking.
FIG. 22. Probabilistic analysis before tuning, pressure of the free gases during a strong (and
realistic) power history (Atucha I NPP).
FIG. 23. Probabilistic analysis after tuning, hoop stress at the inner surface of the cladding during a
strong (and realistic) power history (Atucha I NPP).
46
Finally, it was found the best tolerances of the CARA’s dimensional parameters which allow to best and realistic manufacturing tolerances with an improvement in the dishing and shoulder of the pellet, and small plenum, among other parameters. BACO code validity is sustained with the participation in international code benchmarking of the IAEA, the Atucha and CANDU experience, irradiation provided by international literature and own experimental irradiation. 10. CARA FUEL PROJECT The strong economics advantages of the new fuel, together with the excellent experience for the close to commercial SEU Atucha program, put incentives for the fuel development up to commercial level. The project has been divided in phases, each one involving growing complexity and cost with decreasing technology risk. The following projects milestones have been achieved:
• Conceptual and basic design of fuel element; • First demonstration element; • First CARA element prototype; • Low-pressure loop fuel element tests with two detachable end plates; • Three spacer grids prototypes; • Design verification (BACO code for thermo mechanic behaviour, COBRA for CHF, Pressure
drop models verified with experimental data); • Detailed design of fuel element; • Design of fuel rod irradiation test experiments to simulate extreme irradiation conditions
(different pellets geometry and filling gases for simulating extreme behaviour conditions); • Two prototypes of the assembly system for Atucha I.
Nowadays the second phase is carrying out with the feedback from the first phase results. Seven CARA fuel prototypes are under fabrication with new spacer grid designs and enhanced welding between end plates and fuel rods. The Atucha I CARA assembly system will be hydraulic characterized and vibration tested. The future steps in the project consider fuel element vibration and endurance test, critical heat flux test and finalization of the irradiation test. 11. CONCLUSIONS The development of the CARA advanced fuel element for PHWR was presented, showing the design criteria and the way to reach them. The mechanical solution proposal by the CARA is very innovative (doubling length, few welding on sheaths, spacer grids) respecting the evolutionary solution proposal by CANFLEX for PHWR, allowing extended burnup by the use of SEU, with good thermal hydraulic margins using a single fuel rod diameter. Different CARA fuel elements prototypes were hydraulic tested in a low-pressure loop. The experimental validated models shows the CARA hydraulic similarity respecting CANDU in the Embalse NPP. Additional assembly system enables the use into PHWR vertical channel reactors. The mechanical feasibility for Atucha I and Embalse, and hydraulic compatibility was checked, verifying that the CARA fuel can fit the unique Argentinean challenge: a single fuel element for two different Heavy Water Reactors. Besides, the mechanical, vibration, neutronic, thermal hydraulic margins and fuel rod performance of the CARA fuel were verified by models and codes, showing good behaviour. The CARA fuel rod
47

design was analysed using BACO parametric and statistical analysis and extreme cases calculations, to know the correct incidence on the manufacturing QA procedure and defining the fabrication uncertainties tolerance limit. All CARA structural components had been built, and proximately full tested. The current results allow us to assure that the CARA fuel can comply with all the design requirements, and with its implementation, SEU fuel element can be used in the Argentinean NPPs at competitive values, essential task for economic production in Argentina.
REFERENCES [1] STATION DATA MANUAL Central Nuclear Embalse, Córdoba. Compiled by F.T. Clayton.
L6K 1B2. [2] FUEL REVIEW 2004. Nuclear Engineering International, September 2003, p 33. [3] FLORIDO, P., CIRIMELLO, R., BERGALLO, J. MARINO, A., DELMASTRO, D.,
BRASNAROF, D., GONZÁLEZ H., CARA, new concept of advanced fuel element for HWR, IAEA Technical Committee Meeting on “Fuel Cycle Options for Light Water Reactors and Heavy Waters Reactors”, Victoria, Canada, 28 April to 1st may, 1998. IAEA TECDOC 1122 Vienna Nov 1999, pp 129–140.
[4] FLORIDO, P.C., CIRIMELLO, R.O., BERGALLO, J.E., MARINO, A.C., DELMASTRO, D.F., BRASNAROF, D.O., GONZALEZ, J.H., JUANICÓ, L.E., CARA fuel bundle: A new concept for HWR present situation, 6th International Conference on CANDU Fuel Ontario, Canada Sept 26th – 30th, 1999, pp 258–267.
[5] FLORIDO, P.C., CIRIMELLO, R.O., BERGALLO, J.E., MARINO, A.C., DELMASTRO, D.F., BRASNAROF, D.O., GONZALEZ, J.H., JUANICÓ, L.E., CARA Design Criteria for HWR Fuel Burnup Extension, IAEA Technical Committee Meeting on Technical and Economic Limits to Fuel Burnup Extension, 15–19 Nov. 1999, Bariloche, Argentina, pp 129–140.
[6] LANE, A.D., GRIFFITHS J. AND HASTINGS I.J., The Role of the New CANFLEX Fuel Bundle in Advanced Fuel Cycles for CANDU Reactors. CNS 10th Annual Conference, 1989, pp. 1.16–1.22.
[7] HOLT, R., and IBRAHIM, E., Factors affecting the anisotropy of irradiation creep and growth of zirconium alloy. Acta Metallurgica, Vol. 27, pp 1319–1328.
[8] HOLT, R., Effect of microstructure on irradiation creep and growth of zircaloy pressure tubes in power reactors, Journal of Nuclear Materials 82, 1979, pp 419–429.
[9] NUREG/CR-0497, TREG-1280, R3, A handbook of material properties for use in the analysis of light water fuel rod behaviour.
[10] MARKIEWICZ, M., CNEA CARA project Internal report, 1999 (in Spanish). [11] SCHEBLE, M., and STRIZZOLO C, CARA Project Internal Report, 1999 (in Spanish). [12] TIMOSHENKO, S., YOUNG, D., WEAVER Jr. W., Vibration problems in engineering,
pp. 420–426, Wiley, NY, USA, 1974. [13] CHEN, S.S., Flow-induced vibration of circular structures, Hemisphere Pub. Co., NY, 1987. [14] PETTIGREW, M.J., and TAYLOR, C.E., Two-phase flow-induced vibration: an overview,
Journal of Pressure Vessel Technology, Vol. 116, August 1994. [15] PAISOUSSIS, M.P., An experimental study of vibration of flexible cylinders induced by
nominally axial flow, Nuclear Science and Engineering, 35, 1969. [16] ASKEW J.R., FAYERS, F.J. and KEMSHELL, P.B., J. Brit. Nucl. Energy Soc. 4, 564 (1966). [17] FLORIDO, P.C., and BERGALLO, J.E., El uso de venenos quemables en los reactores de
potencia de nuestro país (The use of burnable poisons in Argentinean power reactors) Argentina Nuclear, Vol. 35, p. 20 (1993) (in Spanish).
[18] MACDONALD, I.P.L., Enhancement of Critical Heat Flux in CANDU 37 Element Bundles, CNS 8th Annual Conference, 1987, pp. 13.16–13.23.
48
[19] DIMMMICK, G.R., INCH, W.W., JUN J.S., SUK, H.C., HADALLER, G.I., FORTMAN, R.A. and HAYES, R.C., Full scale water CHF testing of the CANFLEX bundle, 6th CANDU fuel meeting, Niagara Falls, Canada, September 1999, pp. 103–113
[20] BRASNAROF, D., and DELMASTRO, D., Pérdida de carga entre grillas desalineadas para combustibles CANDU y CANFLEX (Misalignment junction hydraulic pressure loss for CANDU and CANFLEX), Informe técnico CNEA – CAB – 62/17/98 (1998), (Spanish).
[21] WHITE. F., Fluid Mechanics (3rd Ed.), McGraw-Hill, New York, 1994. [22] STEGMANN, D., Diseño de centrales nucleares (Nuclear power plants design), Centro Atómico
Bariloche, Febrero-Marzo 1982 (in Spanish). [23] BRASNAROF, D., JUANICÓ, L., GIORGIS, M., MARTIN GHISELLI, A., ZAMPACH, R.,
FIORI, J.M., and YEDROS, P., Desarrollo hidráulico del combustible CARA, XXXI Reunión Anual de la Asociación Argentina de Tecnología Nuclear 2004, 23–25 Nov. 2004,Buenos Aires, Argentina, (in Spanish).
[24] KIM, N.H., LEE, S.K., and MOON, K.S., Elementary model to predict the pressure loss across a spacer grid without a mixing vane. Nuc. Technology, Vol. 98, pp. 349–353, 1992.
[25] REHME, K., Pressure drop correlations for fuel element spacers, Nuclear Technology, Vol.17, 15–23, 1973.
[26] CHUNG, C.H., CHAN S.K., SUK, H.C., ALAVI, P., OLDAKER, I.E., Performance of the CANFLEX fuel bundle under mechanical flow testing, 6th international conference on CANDU fuel, Sep 21–25, 1999, Toronto Canada, pp. 60–69.
[27] TONG, L.S., and WEISMAN, J., Thermal analysis of pressurized water reactors (3rd Ed.), American Nuclear Society, La Grange park, Illinois USA. 1996
[28] REDDY, D.G., and FIGHETTI, C.F., Parametric study of CHF data, Vol. 2: A generalized sub-channel correlation for PWR and BWR fuel assemblies, Heat Transfer Research Facility, Dep. Of Chemical Engineering, Columbia University, 1983.
[29] STEWART, C.W., MCMONAGLE, C.A., THURGOOD, M.J., GEORGE, T.L., TRENT, D.S., CUTA, J.M., and SEYBOLD, G.D., COBRA IV development and applications, Battelle, Pacific Northwest Laboratories, January 1977.
[30] DAVERIO, H., JUANICÓ L., and DELMASTRO, D., COBRA Code assessment for dry out of advanced CANDU fuels, 12th International Conference on Nuclear Engineering ICONE 12, April 25–29, 2004, Arlington, Virginia, USA.
[31] MARINO, A.C., SAVINO, E. J., and HARRIAGUE, S., BACO (BArra COmbustible) Code Version 2.20: a thermo-mechanical description of a nuclear fuel rod, Journal of Nuclear Materials, Vol. 229, April II, 1996, pp. 155–168.
[32] MARINO, A.C., Probabilistic Safety Criteria on High Burnup HWR Fuels, IAEA Technical Committee Meeting on Technical and Economic Limits to Fuel Burnup Extension, November 15–19, 1999, Bariloche, Argentina, IAEA-TECDOC-1299.
49

THE USE OF A LOW PRESSURE TEST FACILITY FOR THE CAREM REACTOR FUEL ELEMENT DESIGN VERIFICATION A.F. MARTÍN GHISELLI, M.A. SACCHI R.O. ZAMPACH, A.J. PASTORINI R.M. KULICHEVSKY, J.M. FIORI Comisión Nacional de Energía Atómica, San Martín, Buenos Aires, Argentina Abstract The CAREM is a 25 MWe natural convection cooled prototype pressurized water reactor type (PWR) under development in Argentina. The CAREM has an integral reactor with the whole high energy primary system contained inside a single pressure vessel. A complete test program for the CAREM fuel element design verification is being developed at present. This paper present the experience obtained in the use of the Low Pressure and Low Temperature Hydrodynamic Loop (LPTHL) test facility for this program. A brief description of the CAREM fuel element and the test facility is included.
1. INTRODUCTION 1.1. Fuel Element Design Verification Tests Component reliability is crucial to the successful operation of nuclear power plants. Component failures are very undesirable in terms of safety and lost production. Mechanical damage due to excessive vibration may limit the life of fuel elements. Fuel elements bundles are often subjected to high flow velocities of cooling water to increase heat transfer performance, also it is sometimes desirable to minimize structural support of the bundle to reduce pressure drop characteristics or improve the neutron economy. The combination of high flow velocity and reduced structural support could lead to excessive flow-induced vibrations. Typical problems related to excessive vibration are damage by fatigue, impact or fretting wear at the points where the fuel rods take contact with their supports at the spacers. If the fuel element design includes spacers with elastics supports for the fuel rods, changes in the dynamical response of the rods are expected during the time that the fuel element is into the reactor core because of changes in the support forces produced by these elastic supports. These changes in the support forces have their origin in thermal relaxation and radiation effects. In these cases it is also necessary to evaluate the dynamical response of the fuel rods in different support conditions known as begin of life (BOL) and end of life (EOL). During the design steps of a fuel bundle for a nuclear reactor, some tests are usually necessary to verify the prototype hydraulic characteristics, their dynamic response to the flow of cooling water and the structural integrity.
1.2. Test Facilities
To perform these design verification tests, the known Hydrodynamic Loop facilities are used to simulate different flow conditions that may appear in the reactor. These facilities are used to perform hydraulic test to evaluate the pressure drops values of the whole fuel bundle and of their components. Dynamic characterization tests of the fuel bundle are performed to obtain natural frequencies of vibration, modes shapes, damping coefficients and hydrodynamic mass coefficients. The hydrodynamic tests performed at these facilities include the evaluation of the
51
dynamic response of the bundle, the fuel rods and the control rods, to the forces generated by the coolant flow. Generally, the test section is a geometric and hydraulic reproduction of the conditions that the fuel bundle will find inside the reactor core. The parameter reproduced in the test to perform an hydraulic characterization and obtain pressure drops values is the Reynolds Number [Reference 1] defined as:
νHDU
eR =
where U is the mean flow velocity in the test section, DH is the Hydraulic diameter of the test section and ν is the cinematic viscosity. For the hydrodynamic tests, to simulate the forces that the fluid will generate over the fuel bundle in the reactor, the parameter used is the dynamic pressure q [Reference 1], defined as:
2
21 Uq ρ= ; where ρ is the flow density.
Test facilities operating at pressures and temperatures of nuclear power reactors don’t require specific mathematical models to apply the results of the test to reactor conditions. These models will be necessary for tests performed at low pressure and temperature, but the facilities operating in these conditions are easy to operate, and allows the installation of many and diverse instrumentation on the fuel element prototype.
2. THE CAREM FUEL ELEMENT The CAREM is a 25 MWe natural convection cooled prototype pressurized water reactor type (PWR) under development in Argentina. The CAREM has an integral reactor with the whole high energy primary system contained inside a single pressure vessel. The CAREM fuel element forms a hexagonal cross section bundle with 1860 mm length. The primary structure is composed by the bottom grid nozzle and the upper grid box, both stainless steel made, joined by 18 zircalloy tubes with an external diameter of 11,9 mm and internal diameter of 10,8 mm used as guides for the control rods, and one additional tube used for instrumentation purposes. Over this array of tubes, 4 zircalloy conformed sheets spacers with cells and elastic supports for the fuel rods are distributed. The bundle includes 108 fuel rods with and external diameter of 9 mm and 1630 mm length filled with low enrichment uranium pellets. The fuel element has supporting points at the bottom, to bottom reactor grid, and at the upper extreme by means of three pins fixed to the upper grid of the reactor core. Figures 1 to 4 show the CAREM fuel element prototype on the assembling bench and details of some components of the prototype. The requirements imposed by natural convection cooling of the fuel element in the reactor core forced a design that keeps pressure drops to a minimum. Control elements are used for reactivity control during normal operation and to produce interruption of the nuclear chain reaction in case of accident as a fast shutdown system. Control elements consist of a cluster of rods made up of a neutron absorbing material. The whole cluster, named as “the spider”, moves as a single unit. When the absorbing element is introduced into the core, control rods fit into the fuel element’s guide tubes. The control rods has an external diameter of 8,6 mm and 1670 mm length filled with Ag-In-Cd pellets. The flow of coolant water inside the guide tubes assures the control rods cooling. Some orifices located at the bottom of the guide tube’s wall, below the end of the fuel rods, allow the water flow.
52
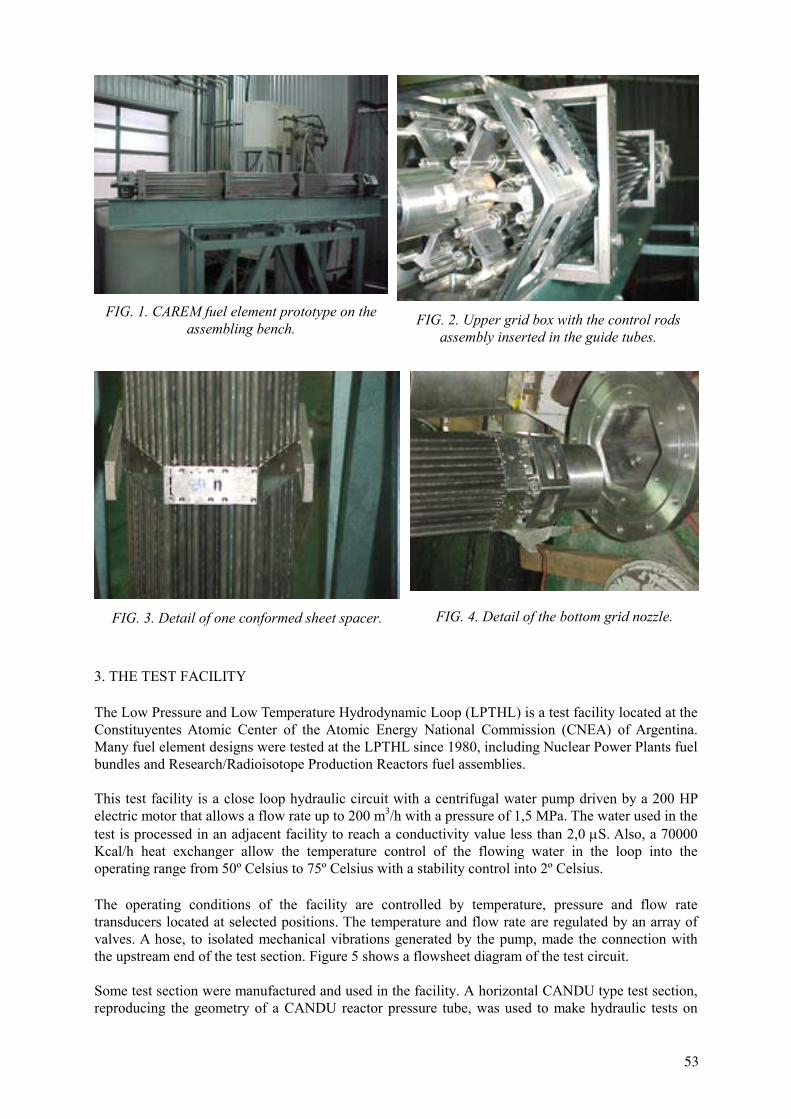
FIG. 1. CAREM fuel element prototype on the assembling bench. FIG. 2. Upper grid box with the control rods
assembly inserted in the guide tubes.
FIG. 3. Detail of one conformed sheet spacer. FIG. 4. Detail of the bottom grid nozzle.
3. THE TEST FACILITY The Low Pressure and Low Temperature Hydrodynamic Loop (LPTHL) is a test facility located at the Constituyentes Atomic Center of the Atomic Energy National Commission (CNEA) of Argentina. Many fuel element designs were tested at the LPTHL since 1980, including Nuclear Power Plants fuel bundles and Research/Radioisotope Production Reactors fuel assemblies. This test facility is a close loop hydraulic circuit with a centrifugal water pump driven by a 200 HP electric motor that allows a flow rate up to 200 m3/h with a pressure of 1,5 MPa. The water used in the test is processed in an adjacent facility to reach a conductivity value less than 2,0 µS. Also, a 70000 Kcal/h heat exchanger allow the temperature control of the flowing water in the loop into the operating range from 50º Celsius to 75º Celsius with a stability control into 2º Celsius. The operating conditions of the facility are controlled by temperature, pressure and flow rate transducers located at selected positions. The temperature and flow rate are regulated by an array of valves. A hose, to isolated mechanical vibrations generated by the pump, made the connection with the upstream end of the test section. Figure 5 shows a flowsheet diagram of the test circuit. Some test section were manufactured and used in the facility. A horizontal CANDU type test section, reproducing the geometry of a CANDU reactor pressure tube, was used to make hydraulic tests on
53
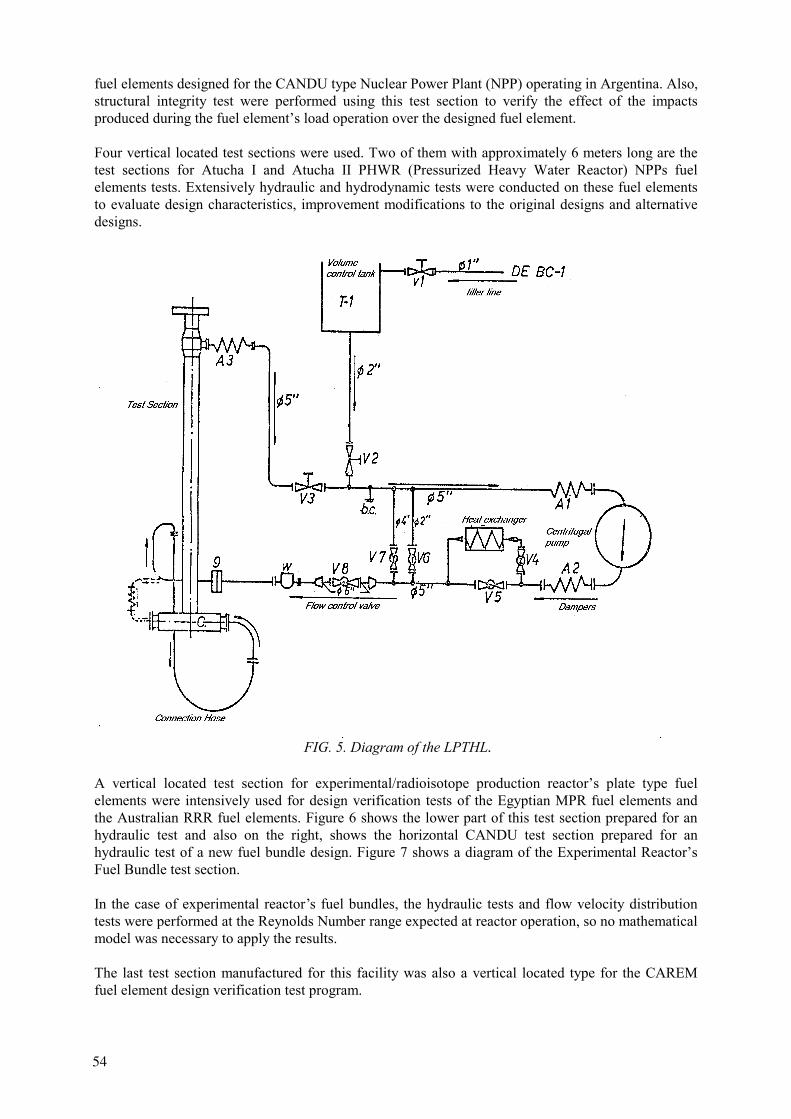
fuel elements designed for the CANDU type Nuclear Power Plant (NPP) operating in Argentina. Also, structural integrity test were performed using this test section to verify the effect of the impacts produced during the fuel element’s load operation over the designed fuel element. Four vertical located test sections were used. Two of them with approximately 6 meters long are the test sections for Atucha I and Atucha II PHWR (Pressurized Heavy Water Reactor) NPPs fuel elements tests. Extensively hydraulic and hydrodynamic tests were conducted on these fuel elements to evaluate design characteristics, improvement modifications to the original designs and alternative designs.
FIG. 5. Diagram of the LPTHL.
A vertical located test section for experimental/radioisotope production reactor’s plate type fuel elements were intensively used for design verification tests of the Egyptian MPR fuel elements and the Australian RRR fuel elements. Figure 6 shows the lower part of this test section prepared for an hydraulic test and also on the right, shows the horizontal CANDU test section prepared for an hydraulic test of a new fuel bundle design. Figure 7 shows a diagram of the Experimental Reactor’s Fuel Bundle test section. In the case of experimental reactor’s fuel bundles, the hydraulic tests and flow velocity distribution tests were performed at the Reynolds Number range expected at reactor operation, so no mathematical model was necessary to apply the results. The last test section manufactured for this facility was also a vertical located type for the CAREM fuel element design verification test program.
54
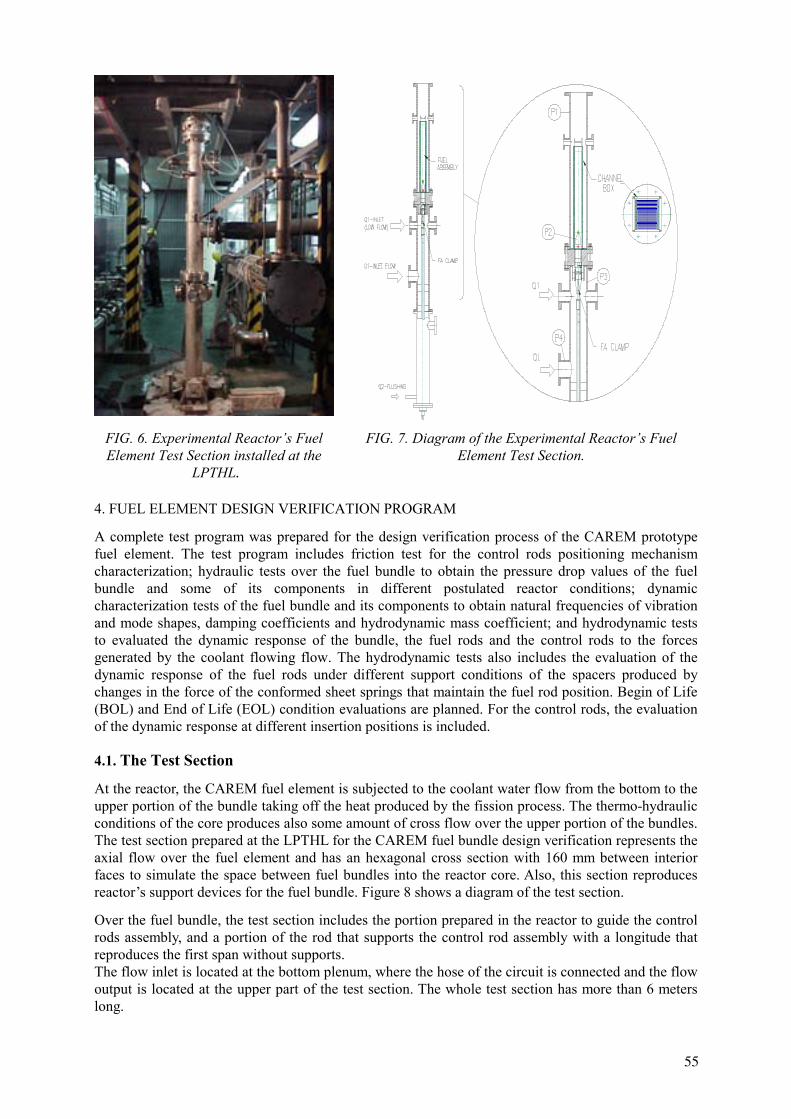
FIG. 6. Experimental Reactor’s Fuel Element Test Section installed at the
LPTHL.
FIG. 7. Diagram of the Experimental Reactor’s Fuel Element Test Section.
4. FUEL ELEMENT DESIGN VERIFICATION PROGRAM
A complete test program was prepared for the design verification process of the CAREM prototype fuel element. The test program includes friction test for the control rods positioning mechanism characterization; hydraulic tests over the fuel bundle to obtain the pressure drop values of the fuel bundle and some of its components in different postulated reactor conditions; dynamic characterization tests of the fuel bundle and its components to obtain natural frequencies of vibration and mode shapes, damping coefficients and hydrodynamic mass coefficient; and hydrodynamic tests to evaluated the dynamic response of the bundle, the fuel rods and the control rods to the forces generated by the coolant flowing flow. The hydrodynamic tests also includes the evaluation of the dynamic response of the fuel rods under different support conditions of the spacers produced by changes in the force of the conformed sheet springs that maintain the fuel rod position. Begin of Life (BOL) and End of Life (EOL) condition evaluations are planned. For the control rods, the evaluation of the dynamic response at different insertion positions is included.
4.1. The Test Section
At the reactor, the CAREM fuel element is subjected to the coolant water flow from the bottom to the upper portion of the bundle taking off the heat produced by the fission process. The thermo-hydraulic conditions of the core produces also some amount of cross flow over the upper portion of the bundles. The test section prepared at the LPTHL for the CAREM fuel bundle design verification represents the axial flow over the fuel element and has an hexagonal cross section with 160 mm between interior faces to simulate the space between fuel bundles into the reactor core. Also, this section reproduces reactor’s support devices for the fuel bundle. Figure 8 shows a diagram of the test section.
Over the fuel bundle, the test section includes the portion prepared in the reactor to guide the control rods assembly, and a portion of the rod that supports the control rod assembly with a longitude that reproduces the first span without supports. The flow inlet is located at the bottom plenum, where the hose of the circuit is connected and the flow output is located at the upper part of the test section. The whole test section has more than 6 meters long.
55
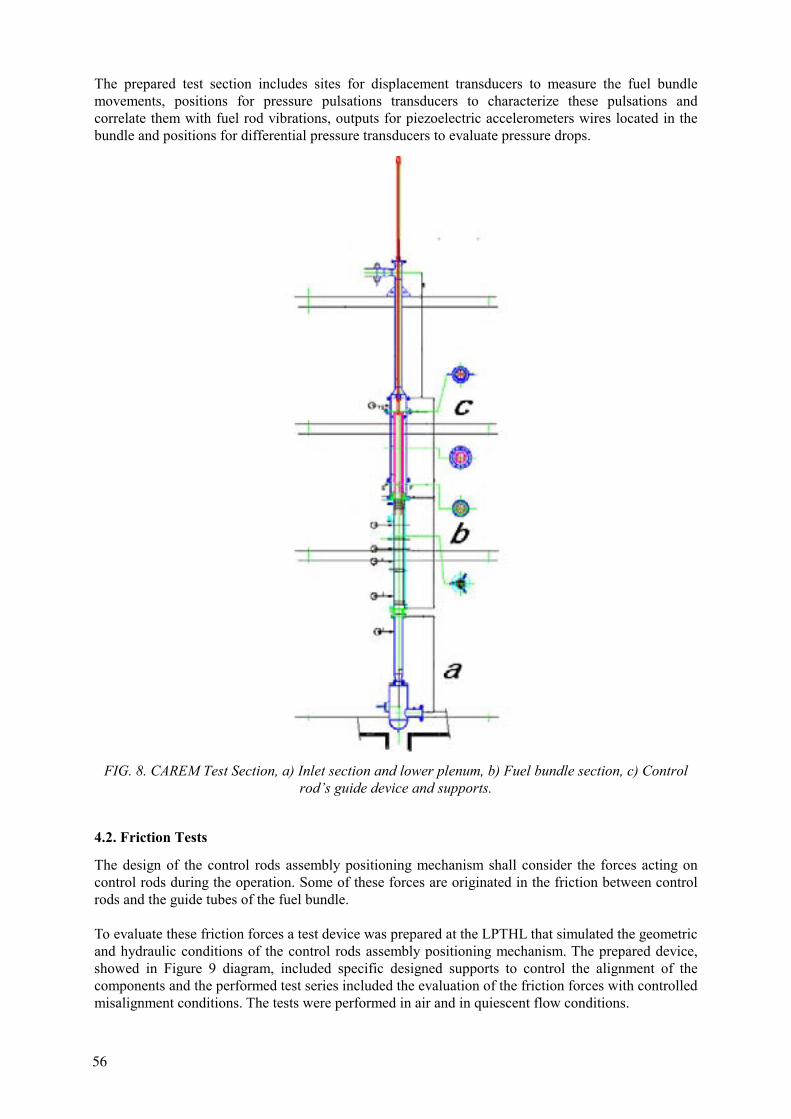
The prepared test section includes sites for displacement transducers to measure the fuel bundle movements, positions for pressure pulsations transducers to characterize these pulsations and correlate them with fuel rod vibrations, outputs for piezoelectric accelerometers wires located in the bundle and positions for differential pressure transducers to evaluate pressure drops.
FIG. 8. CAREM Test Section, a) Inlet section and lower plenum, b) Fuel bundle section, c) Control
rod’s guide device and supports.
4.2. Friction Tests
The design of the control rods assembly positioning mechanism shall consider the forces acting on control rods during the operation. Some of these forces are originated in the friction between control rods and the guide tubes of the fuel bundle. To evaluate these friction forces a test device was prepared at the LPTHL that simulated the geometric and hydraulic conditions of the control rods assembly positioning mechanism. The prepared device, showed in Figure 9 diagram, included specific designed supports to control the alignment of the components and the performed test series included the evaluation of the friction forces with controlled misalignment conditions. The tests were performed in air and in quiescent flow conditions.
56
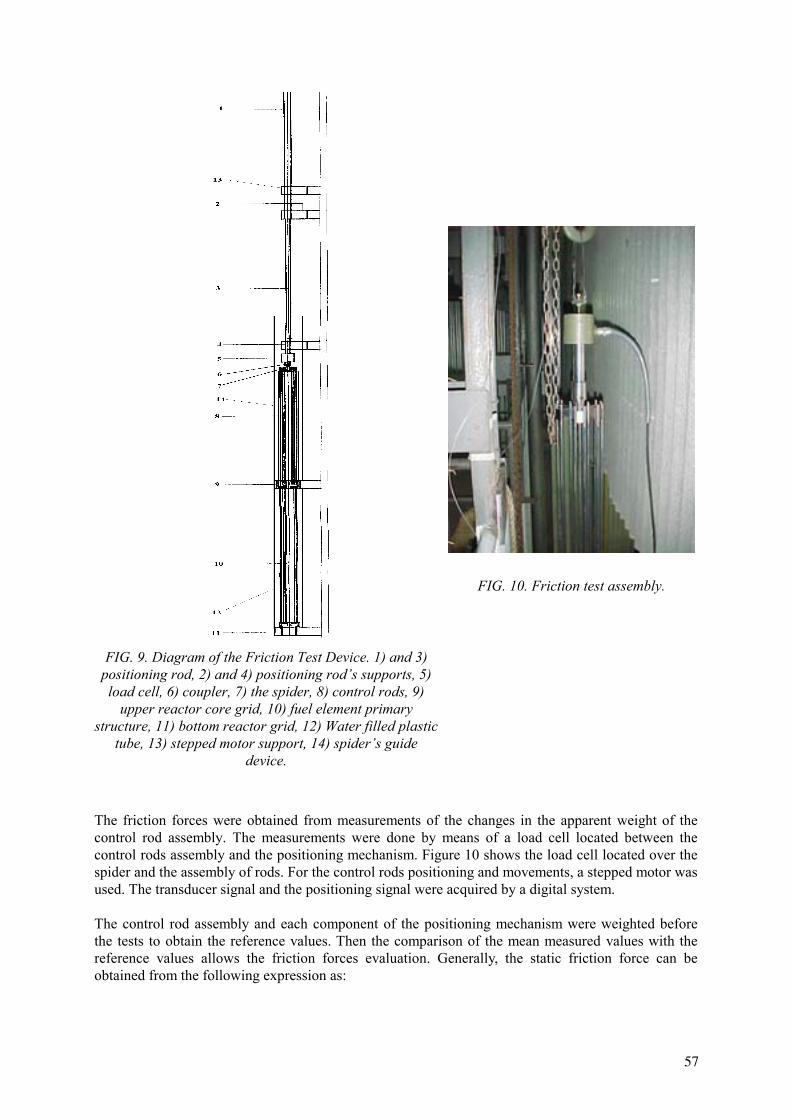
FIG. 9. Diagram of the Friction Test Device. 1) and 3) positioning rod, 2) and 4) positioning rod’s supports, 5) load cell, 6) coupler, 7) the spider, 8) control rods, 9)
upper reactor core grid, 10) fuel element primary structure, 11) bottom reactor grid, 12) Water filled plastic
tube, 13) stepped motor support, 14) spider’s guide device.
FIG. 10. Friction test assembly.
The friction forces were obtained from measurements of the changes in the apparent weight of the control rod assembly. The measurements were done by means of a load cell located between the control rods assembly and the positioning mechanism. Figure 10 shows the load cell located over the spider and the assembly of rods. For the control rods positioning and movements, a stepped motor was used. The transducer signal and the positioning signal were acquired by a digital system. The control rod assembly and each component of the positioning mechanism were weighted before the tests to obtain the reference values. Then the comparison of the mean measured values with the reference values allows the friction forces evaluation. Generally, the static friction force can be obtained from the following expression as:
57
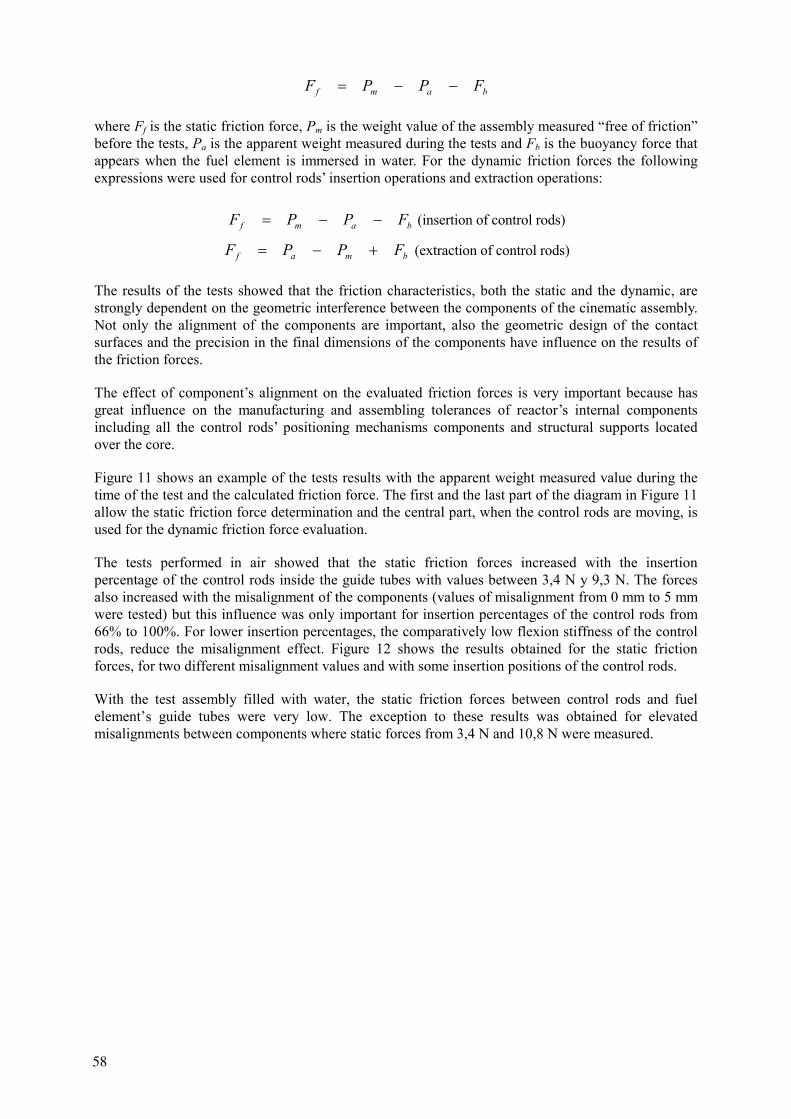
bamf FPPF −−=
where Ff is the static friction force, Pm is the weight value of the assembly measured “free of friction” before the tests, Pa is the apparent weight measured during the tests and Fb is the buoyancy force that appears when the fuel element is immersed in water. For the dynamic friction forces the following expressions were used for control rods’ insertion operations and extraction operations:
bamf FPPF −−= (insertion of control rods)
bmaf FPPF +−= (extraction of control rods) The results of the tests showed that the friction characteristics, both the static and the dynamic, are strongly dependent on the geometric interference between the components of the cinematic assembly. Not only the alignment of the components are important, also the geometric design of the contact surfaces and the precision in the final dimensions of the components have influence on the results of the friction forces.
The effect of component’s alignment on the evaluated friction forces is very important because has great influence on the manufacturing and assembling tolerances of reactor’s internal components including all the control rods’ positioning mechanisms components and structural supports located over the core.
Figure 11 shows an example of the tests results with the apparent weight measured value during the time of the test and the calculated friction force. The first and the last part of the diagram in Figure 11 allow the static friction force determination and the central part, when the control rods are moving, is used for the dynamic friction force evaluation.
The tests performed in air showed that the static friction forces increased with the insertion percentage of the control rods inside the guide tubes with values between 3,4 N y 9,3 N. The forces also increased with the misalignment of the components (values of misalignment from 0 mm to 5 mm were tested) but this influence was only important for insertion percentages of the control rods from 66% to 100%. For lower insertion percentages, the comparatively low flexion stiffness of the control rods, reduce the misalignment effect. Figure 12 shows the results obtained for the static friction forces, for two different misalignment values and with some insertion positions of the control rods.
With the test assembly filled with water, the static friction forces between control rods and fuel element’s guide tubes were very low. The exception to these results was obtained for elevated misalignments between components where static forces from 3,4 N and 10,8 N were measured.
58
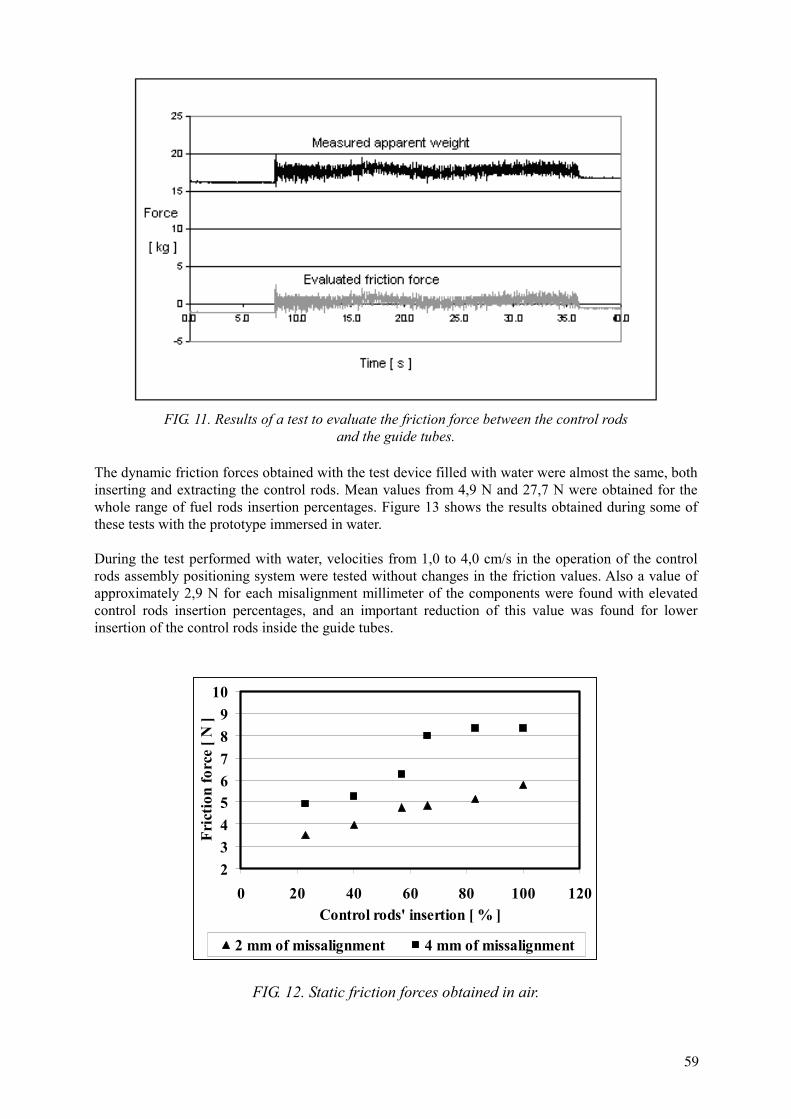
FIG. 11. Results of a test to evaluate the friction force between the control rods
and the guide tubes.
The dynamic friction forces obtained with the test device filled with water were almost the same, both inserting and extracting the control rods. Mean values from 4,9 N and 27,7 N were obtained for the whole range of fuel rods insertion percentages. Figure 13 shows the results obtained during some of these tests with the prototype immersed in water. During the test performed with water, velocities from 1,0 to 4,0 cm/s in the operation of the control rods assembly positioning system were tested without changes in the friction values. Also a value of approximately 2,9 N for each misalignment millimeter of the components were found with elevated control rods insertion percentages, and an important reduction of this value was found for lower insertion of the control rods inside the guide tubes.
23456789
10
0 20 40 60 80 100 120Control rods' insertion [ % ]
Fric
tion
forc
e [ N
]
2 mm of missalignment 4 mm of missalignment
FIG. 12. Static friction forces obtained in air.
59
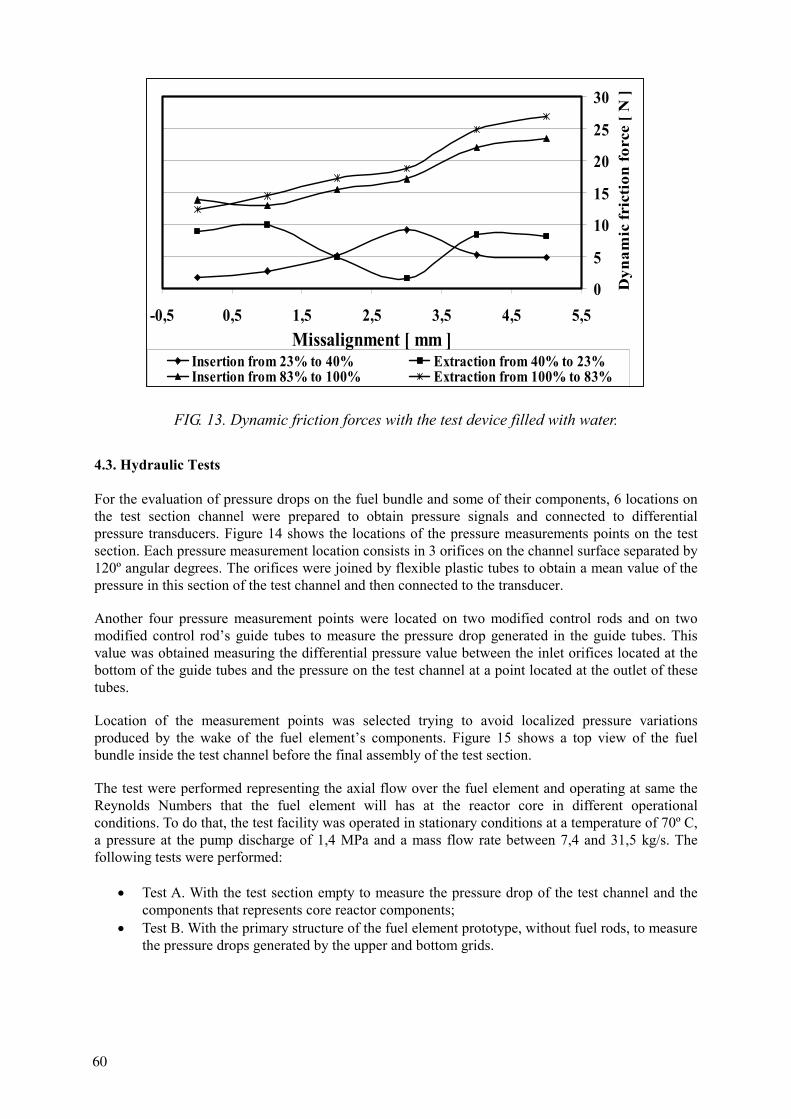
0
5
10
15
20
25
30
-0,5 0,5 1,5 2,5 3,5 4,5 5,5Missalignment [ mm ]
Dyn
amic
fric
tion
forc
e [ N
]
Insertion from 23% to 40% Extraction from 40% to 23%Insertion from 83% to 100% Extraction from 100% to 83%
FIG. 13. Dynamic friction forces with the test device filled with water. 4.3. Hydraulic Tests For the evaluation of pressure drops on the fuel bundle and some of their components, 6 locations on the test section channel were prepared to obtain pressure signals and connected to differential pressure transducers. Figure 14 shows the locations of the pressure measurements points on the test section. Each pressure measurement location consists in 3 orifices on the channel surface separated by 120º angular degrees. The orifices were joined by flexible plastic tubes to obtain a mean value of the pressure in this section of the test channel and then connected to the transducer.
Another four pressure measurement points were located on two modified control rods and on two modified control rod’s guide tubes to measure the pressure drop generated in the guide tubes. This value was obtained measuring the differential pressure value between the inlet orifices located at the bottom of the guide tubes and the pressure on the test channel at a point located at the outlet of these tubes.
Location of the measurement points was selected trying to avoid localized pressure variations produced by the wake of the fuel element’s components. Figure 15 shows a top view of the fuel bundle inside the test channel before the final assembly of the test section.
The test were performed representing the axial flow over the fuel element and operating at same the Reynolds Numbers that the fuel element will has at the reactor core in different operational conditions. To do that, the test facility was operated in stationary conditions at a temperature of 70º C, a pressure at the pump discharge of 1,4 MPa and a mass flow rate between 7,4 and 31,5 kg/s. The following tests were performed:
• Test A. With the test section empty to measure the pressure drop of the test channel and the
components that represents core reactor components; • Test B. With the primary structure of the fuel element prototype, without fuel rods, to measure
the pressure drops generated by the upper and bottom grids.
60

FIG. 14. Location of differential pressure points of measure, (1) inlet plenum, upstream fuel bundle, (2) fuel
rods, downstream bottom grid nozzle, (3) and (4) fuel rods, between spacers, (5) fuel rods, upstream upper
gird box, (6) downstream fuel element.
FIG. 15. Top view of the CAREM Fuel Element inside the test section.
• Test E. The same results of Test C, but with the control rod assembly in different insertion
positions; • Test F. With the complete fuel element and two control rods modified to measure pressure
values at the bottom of the guide tubes; • Test G. With the complete fuel element but without control rods and two guide tubes modified
to measure pressure values at the bottom of them. The measurements were performed using inductive type differential pressure transducers with analogous type amplifier and signal conditioning equipment and a digital data acquisition system installed in a personal computer with dedicated software to take 600 instantaneous measures on each channel during 1 minute time and evaluate the mean value and the typical deviation of the measurements. All the installed transducers were simultaneously measured using this system to correlate the values between them. Differential transducers with full range up to 0,01 bar, 0,1 bar and 1,0 bar and dynamic range from 0 Hz to 1000 Hz were used during the performed tests.
From the measured values, the pressure drops for each component of the fuel element, the distributed friction coefficient, and the concentrated pressure drop coefficient were evaluated from the following simplified expression [Reference 2] for the fuel element pressure drop, ∆PEC:
2
2UK
Dl
fPi
iH
REC
ρ
+=∆ ∑
61
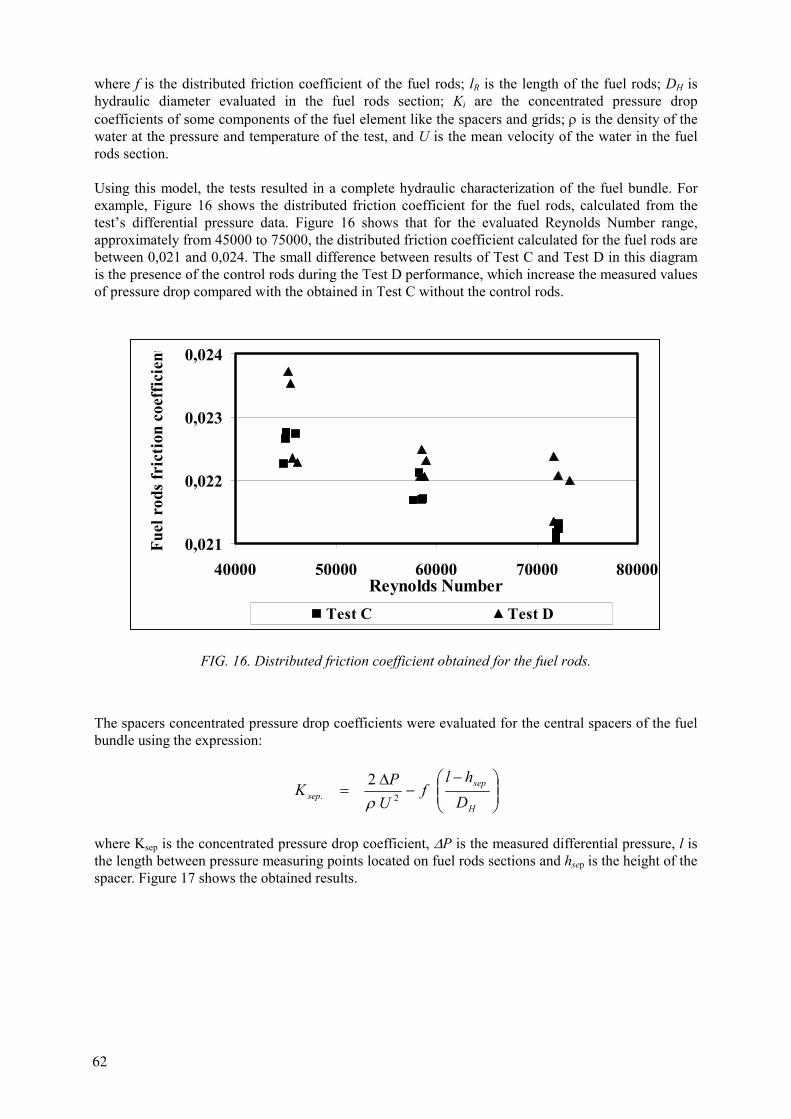
where f is the distributed friction coefficient of the fuel rods; lR is the length of the fuel rods; DH is hydraulic diameter evaluated in the fuel rods section; Ki are the concentrated pressure drop coefficients of some components of the fuel element like the spacers and grids; ρ is the density of the water at the pressure and temperature of the test, and U is the mean velocity of the water in the fuel rods section. Using this model, the tests resulted in a complete hydraulic characterization of the fuel bundle. For example, Figure 16 shows the distributed friction coefficient for the fuel rods, calculated from the test’s differential pressure data. Figure 16 shows that for the evaluated Reynolds Number range, approximately from 45000 to 75000, the distributed friction coefficient calculated for the fuel rods are between 0,021 and 0,024. The small difference between results of Test C and Test D in this diagram is the presence of the control rods during the Test D performance, which increase the measured values of pressure drop compared with the obtained in Test C without the control rods.
0,021
0,022
0,023
0,024
40000 50000 60000 70000 80000Reynolds Number
Fuel
rod
s fri
ctio
n co
effic
ient
Test C Test D
FIG. 16. Distributed friction coefficient obtained for the fuel rods.
The spacers concentrated pressure drop coefficients were evaluated for the central spacers of the fuel bundle using the expression:
−−
∆=
H
sepsep D
hlf
UP
K 2.2ρ
where Ksep is the concentrated pressure drop coefficient, ∆P is the measured differential pressure, l is the length between pressure measuring points located on fuel rods sections and hsep is the height of the spacer. Figure 17 shows the obtained results.
62
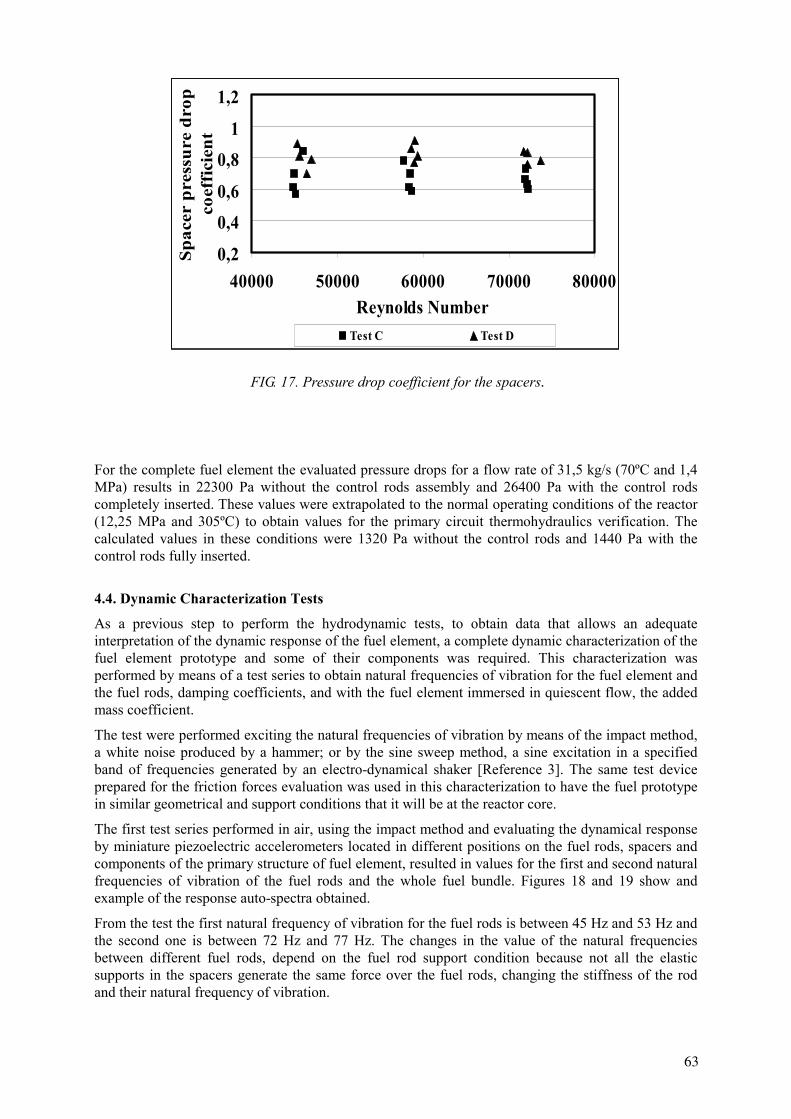
0,2
0,4
0,6
0,8
1
1,2
40000 50000 60000 70000 80000Reynolds Number
Spac
er p
ress
ure
drop
co
effi
cien
t
Test C Test D
FIG. 17. Pressure drop coefficient for the spacers.
For the complete fuel element the evaluated pressure drops for a flow rate of 31,5 kg/s (70ºC and 1,4 MPa) results in 22300 Pa without the control rods assembly and 26400 Pa with the control rods completely inserted. These values were extrapolated to the normal operating conditions of the reactor (12,25 MPa and 305ºC) to obtain values for the primary circuit thermohydraulics verification. The calculated values in these conditions were 1320 Pa without the control rods and 1440 Pa with the control rods fully inserted.
4.4. Dynamic Characterization Tests
As a previous step to perform the hydrodynamic tests, to obtain data that allows an adequate interpretation of the dynamic response of the fuel element, a complete dynamic characterization of the fuel element prototype and some of their components was required. This characterization was performed by means of a test series to obtain natural frequencies of vibration for the fuel element and the fuel rods, damping coefficients, and with the fuel element immersed in quiescent flow, the added mass coefficient.
The test were performed exciting the natural frequencies of vibration by means of the impact method, a white noise produced by a hammer; or by the sine sweep method, a sine excitation in a specified band of frequencies generated by an electro-dynamical shaker [Reference 3]. The same test device prepared for the friction forces evaluation was used in this characterization to have the fuel prototype in similar geometrical and support conditions that it will be at the reactor core.
The first test series performed in air, using the impact method and evaluating the dynamical response by miniature piezoelectric accelerometers located in different positions on the fuel rods, spacers and components of the primary structure of fuel element, resulted in values for the first and second natural frequencies of vibration of the fuel rods and the whole fuel bundle. Figures 18 and 19 show and example of the response auto-spectra obtained.
From the test the first natural frequency of vibration for the fuel rods is between 45 Hz and 53 Hz and the second one is between 72 Hz and 77 Hz. The changes in the value of the natural frequencies between different fuel rods, depend on the fuel rod support condition because not all the elastic supports in the spacers generate the same force over the fuel rods, changing the stiffness of the rod and their natural frequency of vibration.
63
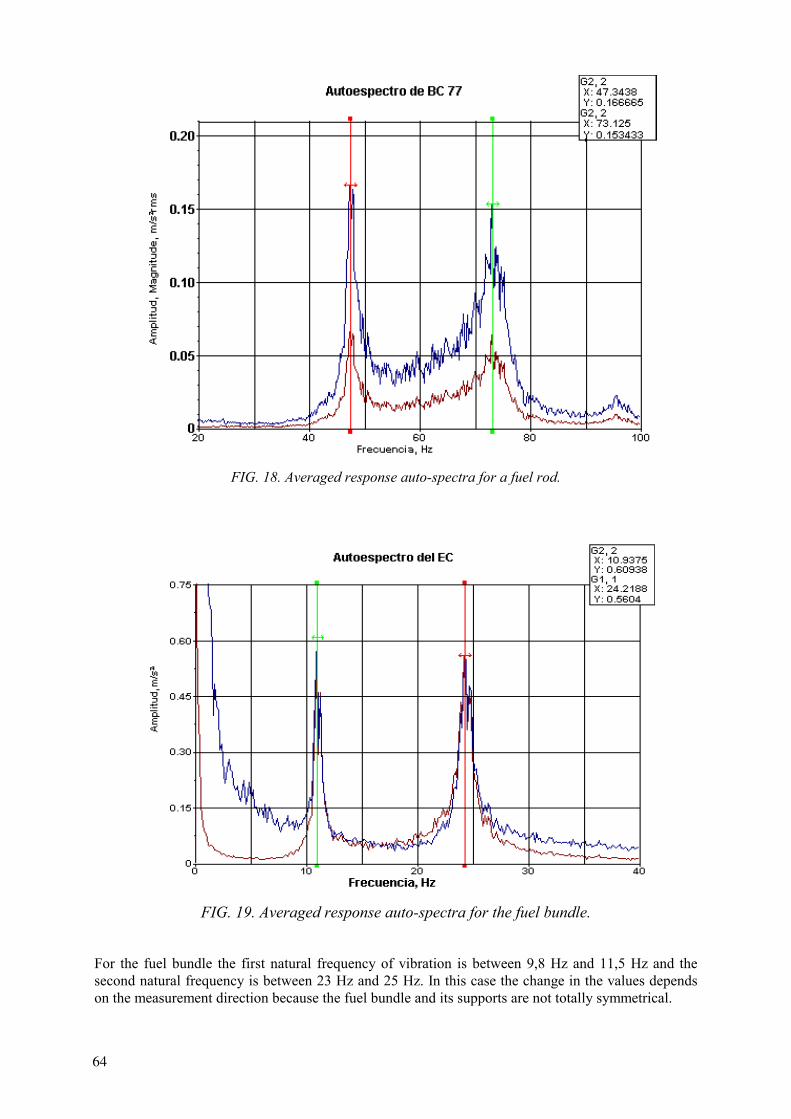
FIG. 18. Averaged response auto-spectra for a fuel rod.
FIG. 19. Averaged response auto-spectra for the fuel bundle.
For the fuel bundle the first natural frequency of vibration is between 9,8 Hz and 11,5 Hz and the second natural frequency is between 23 Hz and 25 Hz. In this case the change in the values depends on the measurement direction because the fuel bundle and its supports are not totally symmetrical.
64
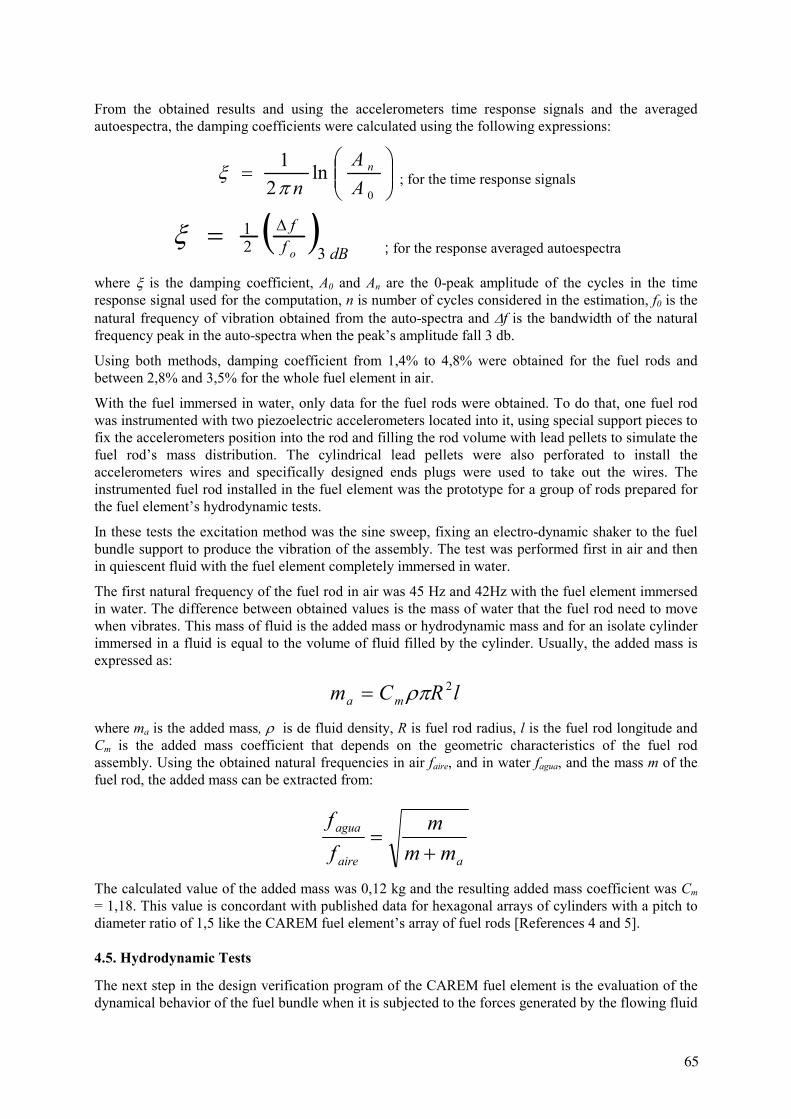
From the obtained results and using the accelerometers time response signals and the averaged autoespectra, the damping coefficients were calculated using the following expressions:
=
0
ln2
1AA
nn
πξ ; for the time response signals
( )dBf
fo 32
1 ∆=ξ ; for the response averaged autoespectra
where ξ is the damping coefficient, A0 and An are the 0-peak amplitude of the cycles in the time response signal used for the computation, n is number of cycles considered in the estimation, f0 is the natural frequency of vibration obtained from the auto-spectra and ∆f is the bandwidth of the natural frequency peak in the auto-spectra when the peak’s amplitude fall 3 db.
Using both methods, damping coefficient from 1,4% to 4,8% were obtained for the fuel rods and between 2,8% and 3,5% for the whole fuel element in air.
With the fuel immersed in water, only data for the fuel rods were obtained. To do that, one fuel rod was instrumented with two piezoelectric accelerometers located into it, using special support pieces to fix the accelerometers position into the rod and filling the rod volume with lead pellets to simulate the fuel rod’s mass distribution. The cylindrical lead pellets were also perforated to install the accelerometers wires and specifically designed ends plugs were used to take out the wires. The instrumented fuel rod installed in the fuel element was the prototype for a group of rods prepared for the fuel element’s hydrodynamic tests.
In these tests the excitation method was the sine sweep, fixing an electro-dynamic shaker to the fuel bundle support to produce the vibration of the assembly. The test was performed first in air and then in quiescent fluid with the fuel element completely immersed in water.
The first natural frequency of the fuel rod in air was 45 Hz and 42Hz with the fuel element immersed in water. The difference between obtained values is the mass of water that the fuel rod need to move when vibrates. This mass of fluid is the added mass or hydrodynamic mass and for an isolate cylinder immersed in a fluid is equal to the volume of fluid filled by the cylinder. Usually, the added mass is expressed as:
lRCm ma2ρπ=
where ma is the added mass, ρ is de fluid density, R is fuel rod radius, l is the fuel rod longitude and Cm is the added mass coefficient that depends on the geometric characteristics of the fuel rod assembly. Using the obtained natural frequencies in air faire, and in water fagua, and the mass m of the fuel rod, the added mass can be extracted from:
aaire
agua
mmm
ff
+=
The calculated value of the added mass was 0,12 kg and the resulting added mass coefficient was Cm = 1,18. This value is concordant with published data for hexagonal arrays of cylinders with a pitch to diameter ratio of 1,5 like the CAREM fuel element’s array of fuel rods [References 4 and 5]. 4.5. Hydrodynamic Tests
The next step in the design verification program of the CAREM fuel element is the evaluation of the dynamical behavior of the fuel bundle when it is subjected to the forces generated by the flowing fluid
65

of coolant. To perform these test series, the test section prepared for the CAREM fuel element at the LPTHL and used during the hydraulic characterization test, will be used. At present, the test section and the required instrumentation are being mounted in the facility. The main objectives of the planned tests are:
• Evaluate the dynamical response of the fuel rods. The main flow induced vibration mechanism to be considered is the response to the turbulence. Excessive vibrations of the fuel rods would produce fretting at the supports point of them in the cells of the elastic spacers. The importance of the wear process will depend on the amplitude of these flow induced vibrations and the contact force between the rod and the elastic supports. The design verifications tests include changes in the condition of the fuel rod’s support forces using the known as BOL and EOL forces in elastic spacers;
• Evaluate the dynamical response of the control rods. The stiffness of the control rods is relative low because they are only fixed at the upper end and guided inside the guide tubes but with diametrical clearances near 2 mm. The flow inside the guide tubes would produce vibration of the control rods and impacts against the guide tubes. The hydrodynamic tests include changes in the insertion percentage of the control rods inside the guide tubes;
• Evaluate the dynamical response of the whole fuel element. The proximity between fuel elements inside the reactor core requires a complete knowing about their dynamical behavior to avoid unwanted contacts and geometrical interferences during the life of the fuel element in the reactor.
The hydrodynamic tests will be performed with flow rates between 8,2 kg/s and 13,7 kg/s to reproduce the expected dynamic pressure conditions and at a temperature of 70ºC with a static pressure of 1,4 MPa.
Besides the process instrumentation of the LPTHL to control the flow rate, pressure and temperature of the fluid, differential pressure transducers will be used to measure the pressure drop over the whole test section and the fuel bundle. Pressure pulsation transducers will be installed also to correlate these pulsations with the dynamical response measured on the fuel element’s components. The last measurement is important because the reactor is a natural convection cooled type, without pumps.
Displacement transducers will be mounted on the test section to measure the relative movements between the whole fuel element and the test section. The transducers will be mounted to measure vibrations on the upper grid box and one of the spacers of the fuel bundle. At each position 2 transducers will be used installed on two faces of the hexagon with 120º between them. The measures will be composed to obtain the orbit movement of the fuel bundle.
Two piezoelectric accelerometers will be installed inside the instrumentation tube of the fuel bundle to measure vibrations in orthogonal directions and located at the middle portion of the tube. For these measurements the instrumentation tube will be modified to locate the accelerometers with specially designed top and bottom plugs to avoid water input and let the wires out.
For the fuel rods’ and control rods’ vibration measurements some rods of both types were instrumented with miniature piezoelectric accelerometers in the same way that the fuel rod used in the dynamical characterization tests. The wires of the control rods will be taking out of the test section at the top of it using the rod that holds the “spider” and the control rods assembly. For the fuel rods’ wires, outputs points were prepared on a test section component located over the fuel element section.
Two control rods were instrumented with two accelerometers each to measure at orthogonal directions and located at the middle portion of the rods. The instrumented control rods will be installed, one in inner part of the assembly and one in the outer part.
Six fuel rods were instrumented with two accelerometers. Three of them with the transducers located at the middle portion to measure in orthogonal directions, like the instrumented control rods, and three rods with the accelerometers located to measure in the same direction but positioned near both ends of
66
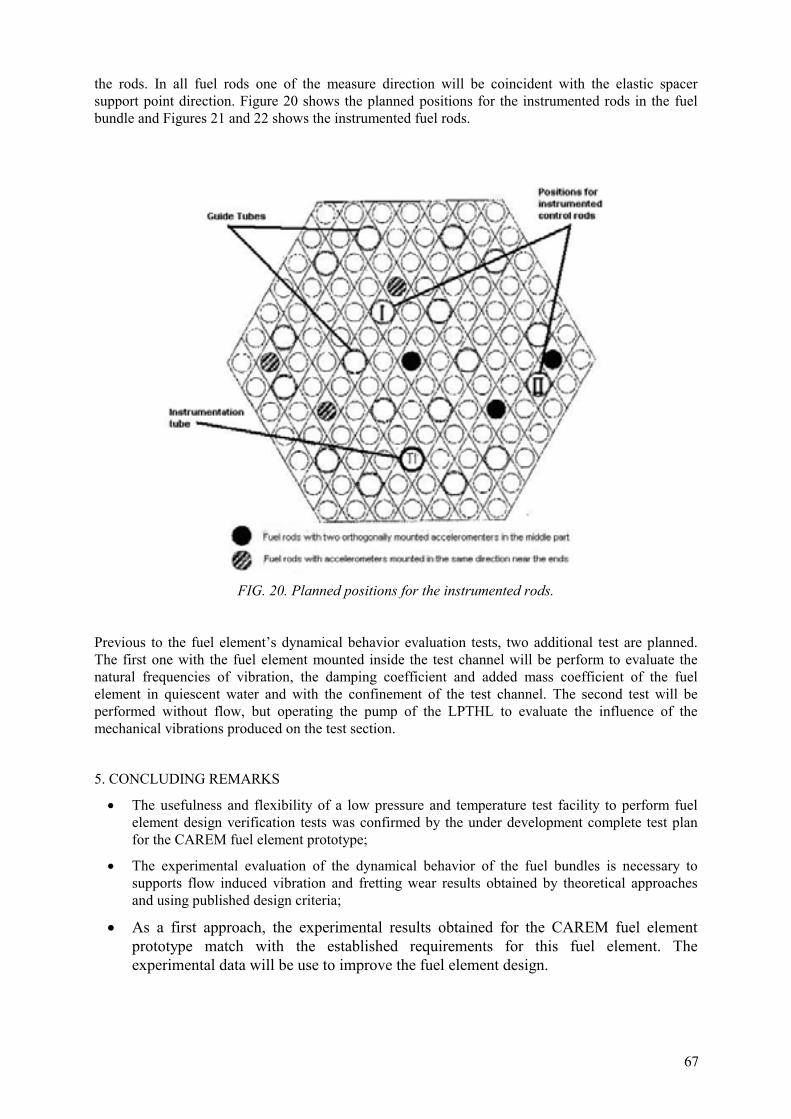
the rods. In all fuel rods one of the measure direction will be coincident with the elastic spacer support point direction. Figure 20 shows the planned positions for the instrumented rods in the fuel bundle and Figures 21 and 22 shows the instrumented fuel rods.
FIG. 20. Planned positions for the instrumented rods.
Previous to the fuel element’s dynamical behavior evaluation tests, two additional test are planned. The first one with the fuel element mounted inside the test channel will be perform to evaluate the natural frequencies of vibration, the damping coefficient and added mass coefficient of the fuel element in quiescent water and with the confinement of the test channel. The second test will be performed without flow, but operating the pump of the LPTHL to evaluate the influence of the mechanical vibrations produced on the test section.
5. CONCLUDING REMARKS
• The usefulness and flexibility of a low pressure and temperature test facility to perform fuel element design verification tests was confirmed by the under development complete test plan for the CAREM fuel element prototype;
• The experimental evaluation of the dynamical behavior of the fuel bundles is necessary to supports flow induced vibration and fretting wear results obtained by theoretical approaches and using published design criteria;
• As a first approach, the experimental results obtained for the CAREM fuel element prototype match with the established requirements for this fuel element. The experimental data will be use to improve the fuel element design.
67
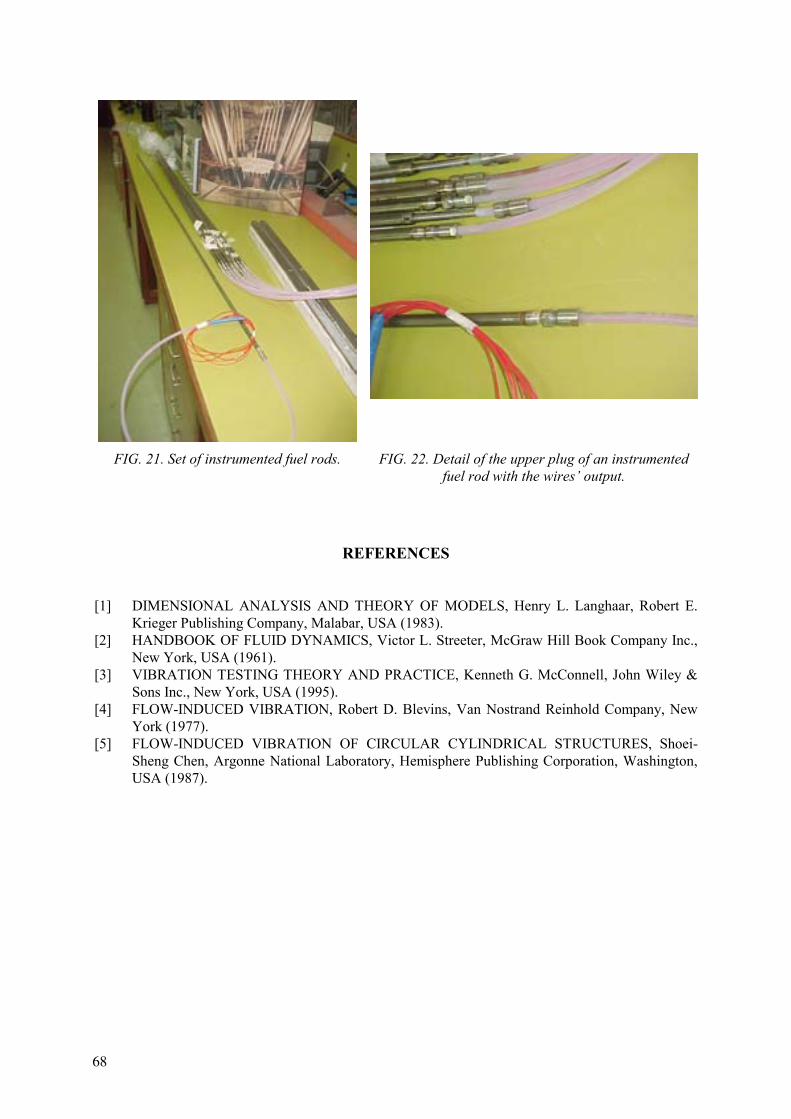
FIG. 21. Set of instrumented fuel rods. FIG. 22. Detail of the upper plug of an instrumented fuel rod with the wires’ output.
REFERENCES
[1] DIMENSIONAL ANALYSIS AND THEORY OF MODELS, Henry L. Langhaar, Robert E.
Krieger Publishing Company, Malabar, USA (1983). [2] HANDBOOK OF FLUID DYNAMICS, Victor L. Streeter, McGraw Hill Book Company Inc.,
New York, USA (1961). [3] VIBRATION TESTING THEORY AND PRACTICE, Kenneth G. McConnell, John Wiley &
Sons Inc., New York, USA (1995). [4] FLOW-INDUCED VIBRATION, Robert D. Blevins, Van Nostrand Reinhold Company, New
York (1977). [5] FLOW-INDUCED VIBRATION OF CIRCULAR CYLINDRICAL STRUCTURES, Shoei-
Sheng Chen, Argonne National Laboratory, Hemisphere Publishing Corporation, Washington, USA (1987).
68
DETERMINATION OF TURBULENT EXCITATION SPECTRA SUPERPOSITION'S RULES IN VARIOUS CASES OF 2D MIXED FLOW REDISTRIBUTION IN PWR FUEL ASSEMBLIES G. GOBILLOT, J. VALLORY French Atomic Energy Commission/Nuclear Energy Directorate, Saint Paul lez Durance, France. Abstract The Pressurized Water Reactor fuel assemblies are composed of a skeleton and fuel rods. The fuel rods contain the uranium pellets and are arranged in a 17 × 17 array. The fuel rods are subjected to vibrations induced by the main axial flow of the reactor coolant and the in-reactor redistribution cross flows. The FIV of fuel rods are studied experimentally in out-of-pile test facilities and were modeled by the CEA at the beginning of the 90’s.In order to model the vibration response of fuel rod submitted to the turbulent excitation of the flow, some computer codes have been developed. The RMS value of modal response to the flow excitation is proportional to structure modal characteristics, fluid-related and turbulent excitation spectra.In previous work, the excitation spectra were determined in an analytical rod bundle span submitted to axial or transverse flow. The computer codes developed with the excitation spectrum evaluated on the analytical structure (fuel bundle) have been used to compute the response of fuel assembly mock-ups or full scale. The comparison with in-loop measured RMS displacements and calculated values showed that turbulent excitation spectra levels previously determined have to be corrected for application to fuel assemblies. In order to improve the knowledge of the excitation spectra (especially on the level), an R&D program has been defined to evaluate excitation spectrum on realistic PWR fuel mock-ups. The experimental part of the program is conducted on the GRILLON froid test facility that can accommodate two fuel mock-ups made of 5 × 5 fuel rods and three levels of structural grids. The hydraulic loop operates up to 70°C and axial and transverse flow can be simulated on the second span of the fuel assembly mock-up. The fuel rod vibrations were measured simultaneously at four heights using a laser technique to evaluate the modal response of the rods submitted to axial, transverse and mixed flow. Using the IMENE signal processing method, the modal parameters (frequencies, damping ratios and mode shapes) of the structure under the turbulent axial/transverse/mixed flow excitation for different flow velocities have been determined. The IMENE multi degree of freedom software handles modal identifications on dynamic systems in time domain discarding the fact that the external excitation acting on the system is known. Once the modal parameters are evaluated, the software MEIDEE based on an inverse method enables us to determine the excitation spectra for different flow configurations. The influence of the structure mechanical properties on the excitation spectrum will be studied in future prospects. This work will help us to define the rules of fuel response overlapping by comparing axial, transverse and mixed configurations. The methodology and illustrative results will be presented in the paper. 1. INTRODUCTION
The fuel rods are subjected to vibrations induced by the main axial flow of the reactor coolant and the in-reactor redistribution cross flows (figure 1). The FIV of fuel rods are studied experimentally in out-of-pile test facilities and the modeling began at the CEA at the beginning of the 90’s. Modeling of the fuel rod response to the turbulent excitation of the flow has to be developed to evaluate a new design performances, improve the out-of-pile test methodology and valorize the obtained experimental results.
69

FIG. 1. Computed in-core transverse flow field. In order to model the vibration response of fuel rods submitted to the turbulent excitation of the flow some computer codes have been developed. They are based on numerical empirics relationships [1] and studies conducted in steam generators at CEA-Saclay validated on analytical fuel bundles [2, 3]. According to [2], the rms value of modal response to the flow excitation can be written as follows:
( ) ( )[ ]afffM
V rRrfeRrrrr
rr
xDx 2
2/1
2/122/3
2
8
)(
21 φξπ
φσ ρ=
(1)
Where ( )f Rrfeφ
is the equivalent turbulent excitation spectra. The other parameters are structure modal characteristics and fluid related. In previous work [3], the excitation spectra was determined in an analytical rod bundle span submitted to axial/transverse flow. Using the reciprocal form of equation (1), the spectrum functions were obtained (figure 2). The form of these functions is:
ff RRrfe
5.01
−
=
αφ
for 2,0≤f a
R
ff RRrfe
5.32
−
=
αφ
for 2,0≥f a
R
where (α1 , α2) for axial flow is 1/100 of (α1 , α2) for transverse flow.
FIG. 2. Spectrum value as a function of the reduced frequency (fD/U, where f is the frequency, D is the diameter of the fuel rod and U the transverse fluid velocity) in transverse flow.
70
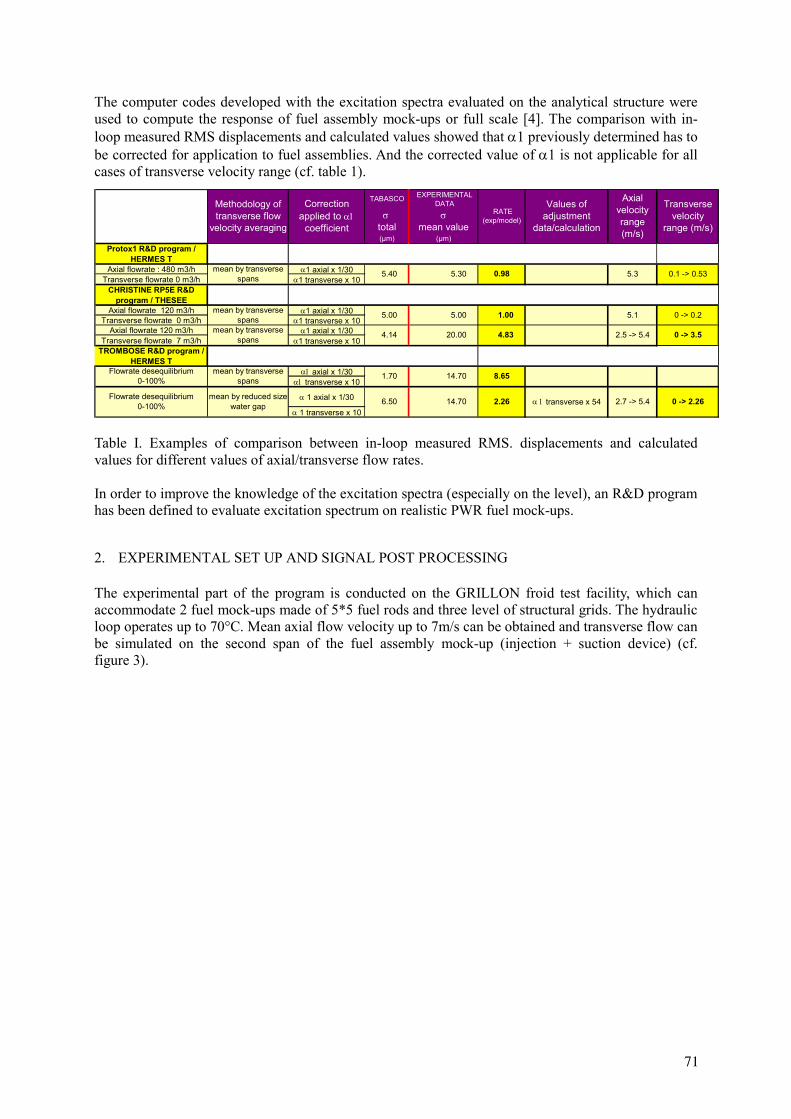
The computer codes developed with the excitation spectra evaluated on the analytical structure were used to compute the response of fuel assembly mock-ups or full scale [4]. The comparison with in-loop measured RMS displacements and calculated values showed that α1 previously determined has to be corrected for application to fuel assemblies. And the corrected value of α1 is not applicable for all cases of transverse velocity range (cf. table 1).
Table I. Examples of comparison between in-loop measured RMS. displacements and calculated values for different values of axial/transverse flow rates. In order to improve the knowledge of the excitation spectra (especially on the level), an R&D program has been defined to evaluate excitation spectrum on realistic PWR fuel mock-ups. 2. EXPERIMENTAL SET UP AND SIGNAL POST PROCESSING The experimental part of the program is conducted on the GRILLON froid test facility, which can accommodate 2 fuel mock-ups made of 5*5 fuel rods and three level of structural grids. The hydraulic loop operates up to 70°C. Mean axial flow velocity up to 7m/s can be obtained and transverse flow can be simulated on the second span of the fuel assembly mock-up (injection + suction device) (cf. figure 3).
EXPERIMENTAL DATA
σ σtotal mean value(µm) (µm)
Protox1 R&D program / HERMES T
Axial flowrate : 480 m3/h α1 axial x 1/30Transverse flowrate 0 m3/h α1 transverse x 10
CHRISTINE RP5E R&D program / THESEE
Axial flowrate 120 m3/h α1 axial x 1/30Transverse flowrate 0 m3/h α1 transverse x 10
Axial flowrate 120 m3/h α1 axial x 1/30Transverse flowrate 7 m3/h α1 transverse x 10
TROMBOSE R&D program / HERMES T
α1 axial x 1/30α1 transverse x 10
α 1 axial x 1/30
α 1 transverse x 10
mean by transverse spans
mean by reduced size water gap
Flowrate desequilibrium 0-100%
Flowrate desequilibrium0-100%
Methodology of transverse flow
velocity averaging
mean by transverse spans
mean by transverse spans
1.70
6.50
14.70
14.70
Values of adjustment
data/calculation
α 1 transverse x 54
8.65
2.26 2.7 -> 5.4 0 -> 2.26
RATE (exp/model)
Axial velocity range (m/s)
Transverse velocity
range (m/s)
5.1 0 -> 0.21.00
2.5 -> 5.4 0 -> 3.5
5.3 0.1 -> 0.535.40 5.30
Correction applied to α1
coefficient
mean by transverse spans
0.98
20.00
5.00 5.00
4.14 4.83
TABASCO
71
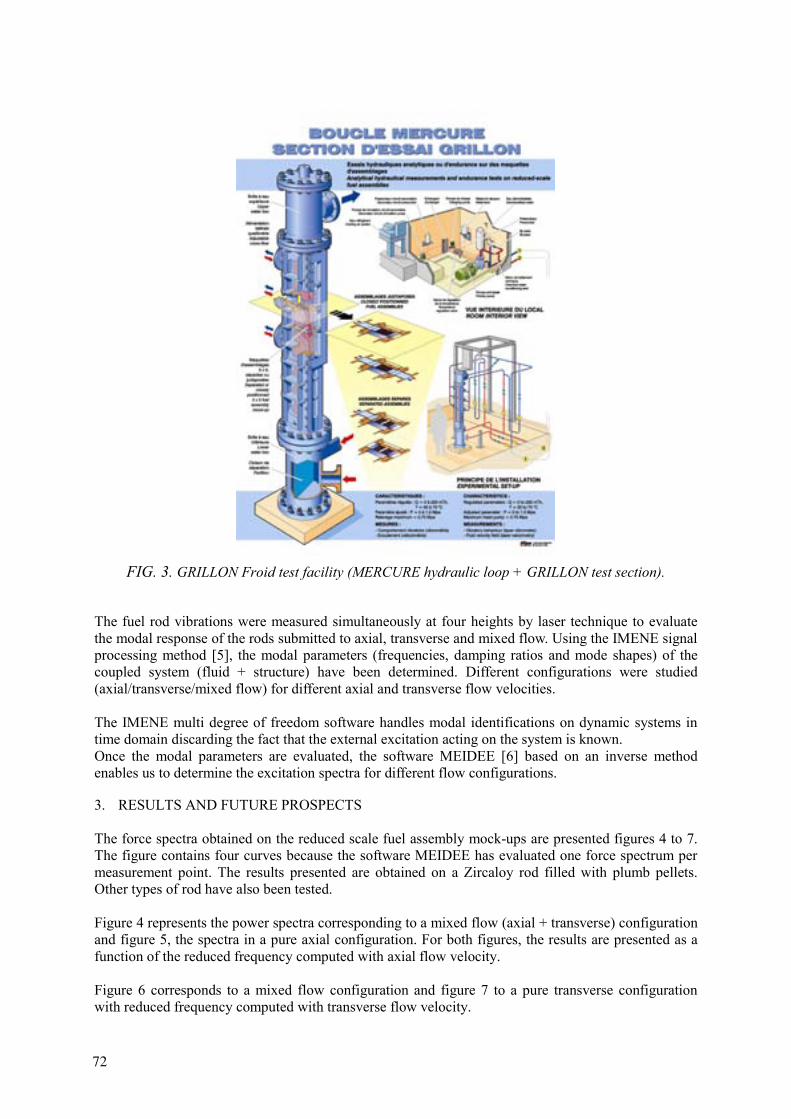
FIG. 3. GRILLON Froid test facility (MERCURE hydraulic loop + GRILLON test section).
The fuel rod vibrations were measured simultaneously at four heights by laser technique to evaluate the modal response of the rods submitted to axial, transverse and mixed flow. Using the IMENE signal processing method [5], the modal parameters (frequencies, damping ratios and mode shapes) of the coupled system (fluid + structure) have been determined. Different configurations were studied (axial/transverse/mixed flow) for different axial and transverse flow velocities. The IMENE multi degree of freedom software handles modal identifications on dynamic systems in time domain discarding the fact that the external excitation acting on the system is known. Once the modal parameters are evaluated, the software MEIDEE [6] based on an inverse method enables us to determine the excitation spectra for different flow configurations. 3. RESULTS AND FUTURE PROSPECTS The force spectra obtained on the reduced scale fuel assembly mock-ups are presented figures 4 to 7. The figure contains four curves because the software MEIDEE has evaluated one force spectrum per measurement point. The results presented are obtained on a Zircaloy rod filled with plumb pellets. Other types of rod have also been tested. Figure 4 represents the power spectra corresponding to a mixed flow (axial + transverse) configuration and figure 5, the spectra in a pure axial configuration. For both figures, the results are presented as a function of the reduced frequency computed with axial flow velocity. Figure 6 corresponds to a mixed flow configuration and figure 7 to a pure transverse configuration with reduced frequency computed with transverse flow velocity.
72
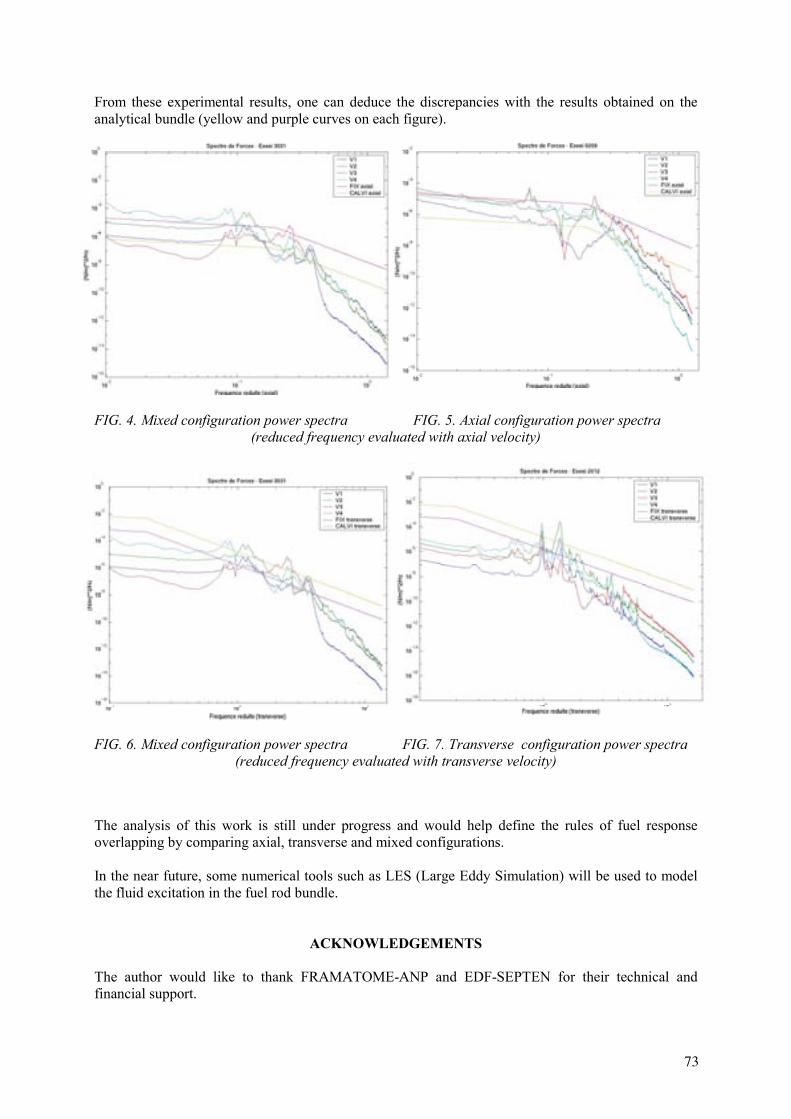
From these experimental results, one can deduce the discrepancies with the results obtained on the analytical bundle (yellow and purple curves on each figure). CONCLUSIONS AND FUTURE PROSPECTS FIG. 4. Mixed configuration power spectra FIG. 5. Axial configuration power spectra
(reduced frequency evaluated with axial velocity) The influence of the structure mechanical properties on the excitation spectrum will be studied as a first step. FIG. 6. Mixed configuration power spectra FIG. 7. Transverse configuration power spectra
(reduced frequency evaluated with transverse velocity) The analysis of this work is still under progress and would help define the rules of fuel response overlapping by comparing axial, transverse and mixed configurations. In the near future, some numerical tools such as LES (Large Eddy Simulation) will be used to model the fluid excitation in the fuel rod bundle.
ACKNOWLEDGEMENTS The author would like to thank FRAMATOME-ANP and EDF-SEPTEN for their technical and financial support.
73
REFERENCES
[1] S.S. CHEN, “Flow induced vibration of circular cylindrical structures”, Springer Verlag, Berlin, 1987.
[2] J. ANTUNES, “Tabasco version 4, Aspects théoriques”. Technical Report DMT/SEMT/DYN 94.322, 1994
[3] E. DE LANGRE), “Excitation vibratoire d’un crayon combustible par la turbulence de l’écoulement : synthèse des essais et recommandations“ . Technical Report DMT/SEMT/LEV 93.363, 1993.
[4] J. RIGAUDEAU, E. MOREL, “Flow induced vibration analysis of PWR fuel rods validated from a variety of in-loop tests”, Proceedings of PVP – Flow induced vibration – ASME 2001, Volume 420-2 : Axial flow, piping systems: other topics.
[5] G. GOBILLOT, R. NHILI, J. VALLORY, “Modal parameters’ evaluation of a full scale PWR fuel assembly submitted to non evaluated excitation”, Proceedings of ICONE 8 April 2–6, 2000 Baltimore USA.
[6] S. GRANGER, “A new signal processing method for investigating fluid-elastic phenomena”, Journal of Fluids and Structures, 4, 73–97.
74
INFLUENCE OF WATER CHEMISTRY TRANSIENTS ON FUEL ASSEMBLIES RELIABILITY V.G. KRITSKY, I.G. BEREZINA, YU. RODIONOV, P.S. STJAZKIN All Russian Design & Research Institute, of Complex Power Technology (VNIPIET), St-Petersburg, Russian Federation
Abstract
At the NPPs with WWER-440 reactors an abnormal rise of temperature at the fuel assembly (FA) outlet observed periodically after decontamination of steam generator (SG). The reason of this phenomenon was the reduction of coolant flow through a part of FAs due to the increase of hydraulic resistance in the core that caused the decrease of power or shutdown of the reactor before leakage of fuel rods. The influence of pHT on formation of pressure drop in the WWER-440 reactor was studied. The optimal range of pHT values for these parameters is 6.95–7.05 and these values are within the range of water chemistry standards. They are connected with the mechanism of distribution of corrosion product deposits between the core and the rest of the cicuit. The correlation between the changes of pressure drop and the number of decontaminated SGs is established. This correlation shows that the pressure drop at the reactor grows with the increase of SG decontamination during one preventive maintenance. 1. CORE DEPOSITS AND PRESSURE DROP
The deposits of crud is known to be proportional to the amount of corrosion products circulating in the circuit, therefore all models of mass transfer in the circuit include the change of corrosion products concentration and the corrosion rate in time, removing these products by filters and deposition. During decontamination of the circuit segments and equipment replacement local change of corrosion rate occurs which results in the increase of corrosion products concentration in the circuit and the increase of deposits on surfaces. If due to incorrect water chemistry conditions for corrosion products deposition in the core are created not only the activity of the coolant increases but the hydraulic resistance of the reactor also grows which results in the increase of the pressure drop at the reactor (Fig.1). When the pressure drop at the reactor exceeds 3.25 bar emergency shutdown is envisaged [1]. Safety criteria or operational limits on crud deposition are not defined. However, crud deposition on the fuel is normally taken into account for fuel design purposes. The amount of crud deposited, sometimes as a function of burnup, but at least at the end of the fuel cycle, is a conservatively assumed value, which is verified against data from measurements (e.g. crud scrape). Larger crud deposits could also cause axial offset anomalies.
75
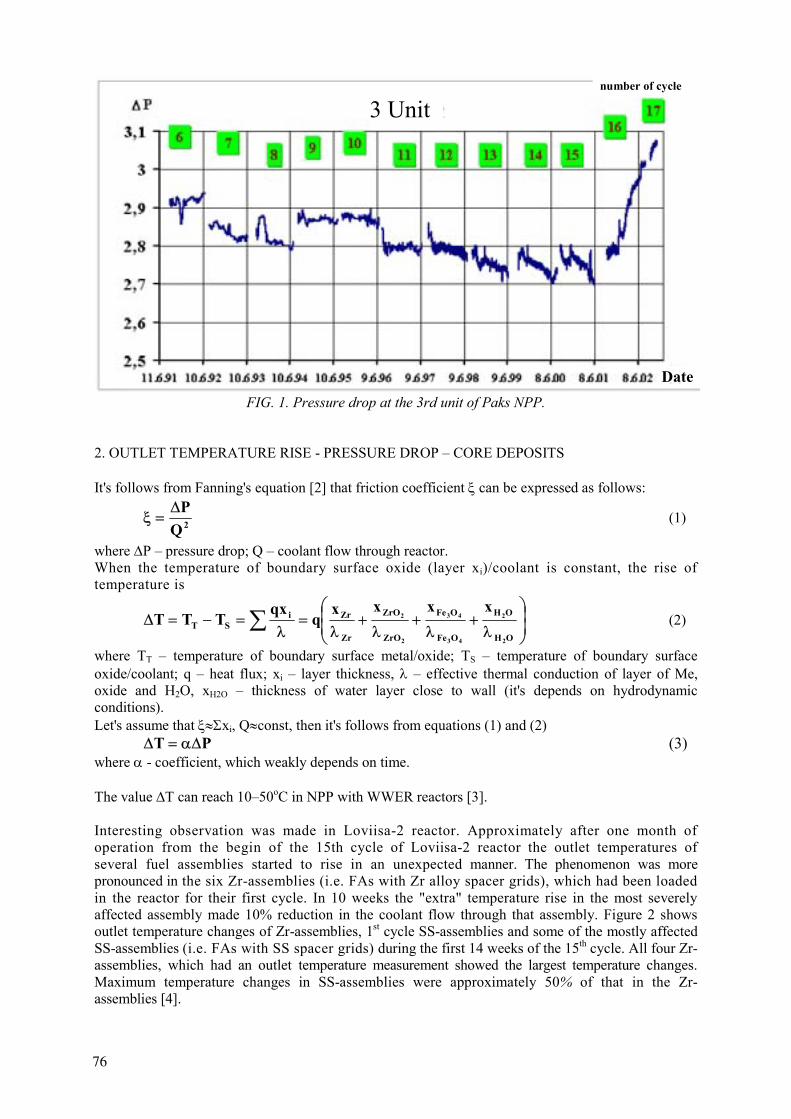
3 Unit
Date
number of lifetime
3 Unit
Date
3 Unit
Date
number of cycle
FIG. 1. Pressure drop at the 3rd unit of Paks NPP.
2. OUTLET TEMPERATURE RISE - PRESSURE DROP – CORE DEPOSITS
It's follows from Fanning's equation [2] that friction coefficient ξ can be expressed as follows:
2QP∆
=ξ (1)
where ∆P – pressure drop; Q – coolant flow through reactor. When the temperature of boundary surface oxide (layer xi)/coolant is constant, the rise of temperature is
∑
λ+
λ+
λ+
λ=
λ=−=∆
OH
OH
OFe
OFe
ZrO
ZrO
Zr
ZriST
2
2
43
43
2
2xxxx
qqx
TTT (2)
where ТТ – temperature of boundary surface metal/oxide; ТS – temperature of boundary surface oxide/coolant; q – heat flux; хi – layer thickness, λ – effective thermal conduction of layer of Me, oxide and H2O, хН2О – thickness of water layer close to wall (it's depends on hydrodynamic conditions). Let's assume that ξ≈Σxi, Q≈const, then it's follows from equations (1) and (2)
PT ∆α=∆ (3) where α - coefficient, which weakly depends on time. The value ∆T can reach 10–50oC in NPP with WWER reactors [3]. Interesting observation was made in Loviisa-2 reactor. Approximately after one month of operation from the begin of the 15th cycle of Loviisa-2 reactor the outlet temperatures of several fuel assemblies started to rise in an unexpected manner. The phenomenon was more pronounced in the six Zr-assemblies (i.e. FAs with Zr alloy spacer grids), which had been loaded in the reactor for their first cycle. In 10 weeks the "extra" temperature rise in the most severely affected assembly made 10% reduction in the coolant flow through that assembly. Figure 2 shows outlet temperature changes of Zr-assemblies, 1st cycle SS-assemblies and some of the mostly affected SS-assemblies (i.e. FAs with SS spacer grids) during the first 14 weeks of the 15th cycle. All four Zr-assemblies, which had an outlet temperature measurement showed the largest temperature changes. Maximum temperature changes in SS-assemblies were approximately 50% of that in the Zr-assemblies [4].
76
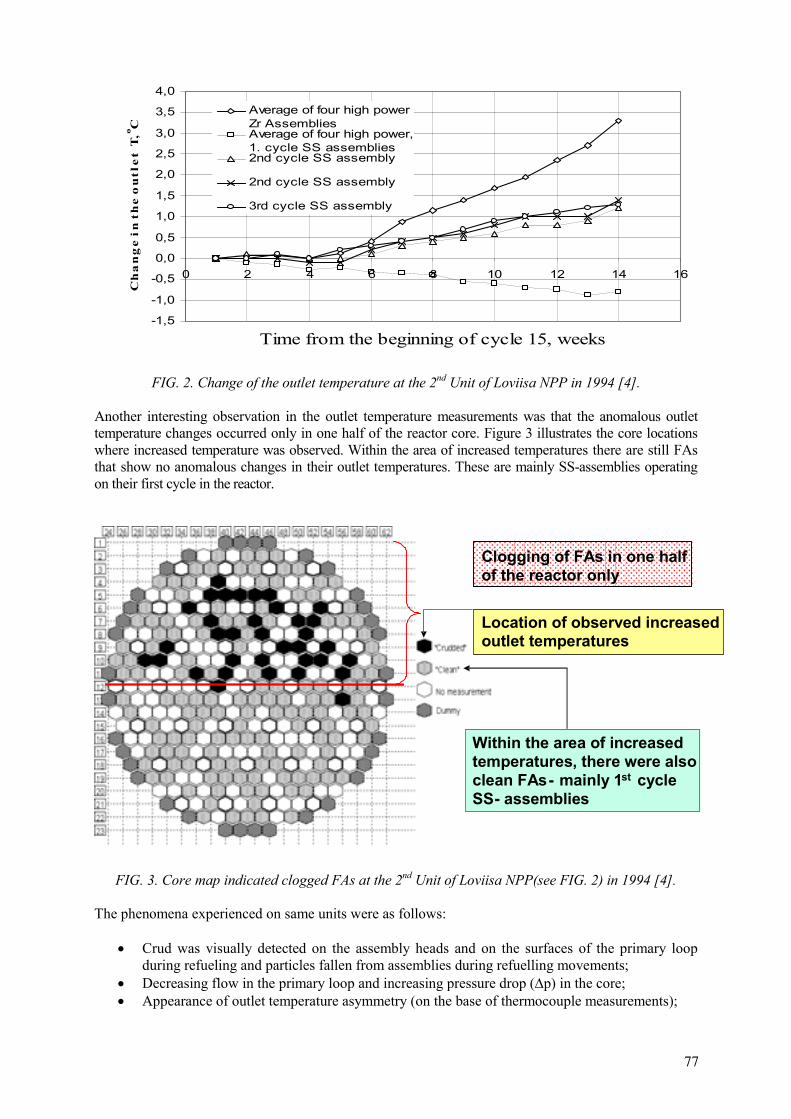
-1,5
-1,0
-0,5
0,0
0,5
1,0
1,5
2,0
2,5
3,0
3,5
4,0
0 2 4 6 8 10 12 14 16
Time from the beginning of cycle 15, weeks
C h
a n
g e
i n
t h
e o
u t
l e t
T, o C
Average of four high powerZr AssembliesAverage of four high power,1. cycle SS assemblies2nd cycle SS assembly
2nd cycle SS assembly
3rd cycle SS assembly
FIG. 2. Change of the outlet temperature at the 2nd Unit of Loviisa NPP in 1994 [4].
Another interesting observation in the outlet temperature measurements was that the anomalous outlet temperature changes occurred only in one half of the reactor core. Figure 3 illustrates the core locations where increased temperature was observed. Within the area of increased temperatures there are still FAs that show no anomalous changes in their outlet temperatures. These are mainly SS-assemblies operating on their first cycle in the reactor.
Location of observed increased outlet temperatures
Clogging of FAs in one half of the reactor only
Within the area of increased temperatures, there were also clean FAs - mainly 1 st cycle SS - assemblies
FIG. 3. Core map indicated clogged FAs at the 2nd Unit of Loviisa NPP(see FIG. 2) in 1994 [4].
The phenomena experienced on same units were as follows:
• Crud was visually detected on the assembly heads and on the surfaces of the primary loop during refueling and particles fallen from assemblies during refuelling movements;
• Decreasing flow in the primary loop and increasing pressure drop (∆p) in the core; • Appearance of outlet temperature asymmetry (on the base of thermocouple measurements);
77
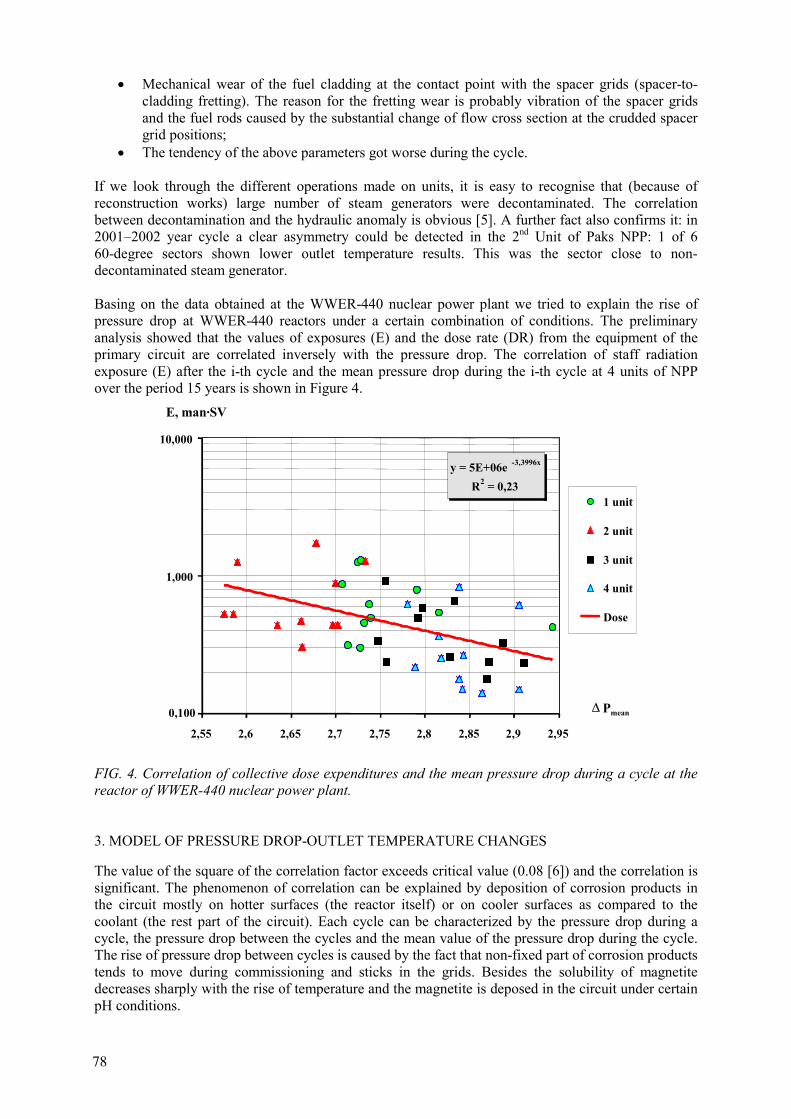
• Mechanical wear of the fuel cladding at the contact point with the spacer grids (spacer-to-cladding fretting). The reason for the fretting wear is probably vibration of the spacer grids and the fuel rods caused by the substantial change of flow cross section at the crudded spacer grid positions;
• The tendency of the above parameters got worse during the cycle. If we look through the different operations made on units, it is easy to recognise that (because of reconstruction works) large number of steam generators were decontaminated. The correlation between decontamination and the hydraulic anomaly is obvious [5]. A further fact also confirms it: in 2001–2002 year cycle a clear asymmetry could be detected in the 2nd Unit of Paks NPP: 1 of 6 60-degree sectors shown lower outlet temperature results. This was the sector close to non-decontaminated steam generator. Basing on the data obtained at the WWER-440 nuclear power plant we tried to explain the rise of pressure drop at WWER-440 reactors under a certain combination of conditions. The preliminary analysis showed that the values of exposures (E) and the dose rate (DR) from the equipment of the primary circuit are correlated inversely with the pressure drop. The correlation of staff radiation exposure (E) after the i-th cycle and the mean pressure drop during the i-th cycle at 4 units of NPP over the period 15 years is shown in Figure 4.
y = 5E+06e -3,3996x
R2 = 0,23
100
1000
10000
2,55 2,6 2,65 2,7 2,75 2,8 2,85 2,9 2,95
∆ Pmean
E, h·Zv
1 unit
2 unit
3 unit
4 unit
Dose
y = 5E+06ey = 5E+06e -3,3996x
R2 = 0,23
0,100
1,000
10,000
2,55 2,6 2,65 2,7 2,75 2,8 2,85 2,9 2,95
∆ Pmean
E, man·SV·
1 unit
2 unit
3 unit
4 unit
Dose
y = 5E+06ey = 5E+06e -3,3996x
R2 = 0,23
100
1000
10000
2,55 2,6 2,65 2,7 2,75 2,8 2,85 2,9 2,95
∆ Pmean
E, h·Zv
1 unit
2 unit
3 unit
4 unit
Dose
y = 5E+06ey = 5E+06e -3,3996x
R2 = 0,23
0,100
1,000
10,000
2,55 2,6 2,65 2,7 2,75 2,8 2,85 2,9 2,95
∆ Pmean
E, man·SV·
1 unit
2 unit
3 unit
4 unit
Dose
FIG. 4. Correlation of collective dose expenditures and the mean pressure drop during a cycle at the reactor of WWER-440 nuclear power plant. 3. MODEL OF PRESSURE DROP-OUTLET TEMPERATURE CHANGES
The value of the square of the correlation factor exceeds critical value (0.08 [6]) and the correlation is significant. The phenomenon of correlation can be explained by deposition of corrosion products in the circuit mostly on hotter surfaces (the reactor itself) or on cooler surfaces as compared to the coolant (the rest part of the circuit). Each cycle can be characterized by the pressure drop during a cycle, the pressure drop between the cycles and the mean value of the pressure drop during the cycle. The rise of pressure drop between cycles is caused by the fact that non-fixed part of corrosion products tends to move during commissioning and sticks in the grids. Besides the solubility of magnetite decreases sharply with the rise of temperature and the magnetite is deposed in the circuit under certain pH conditions.
78
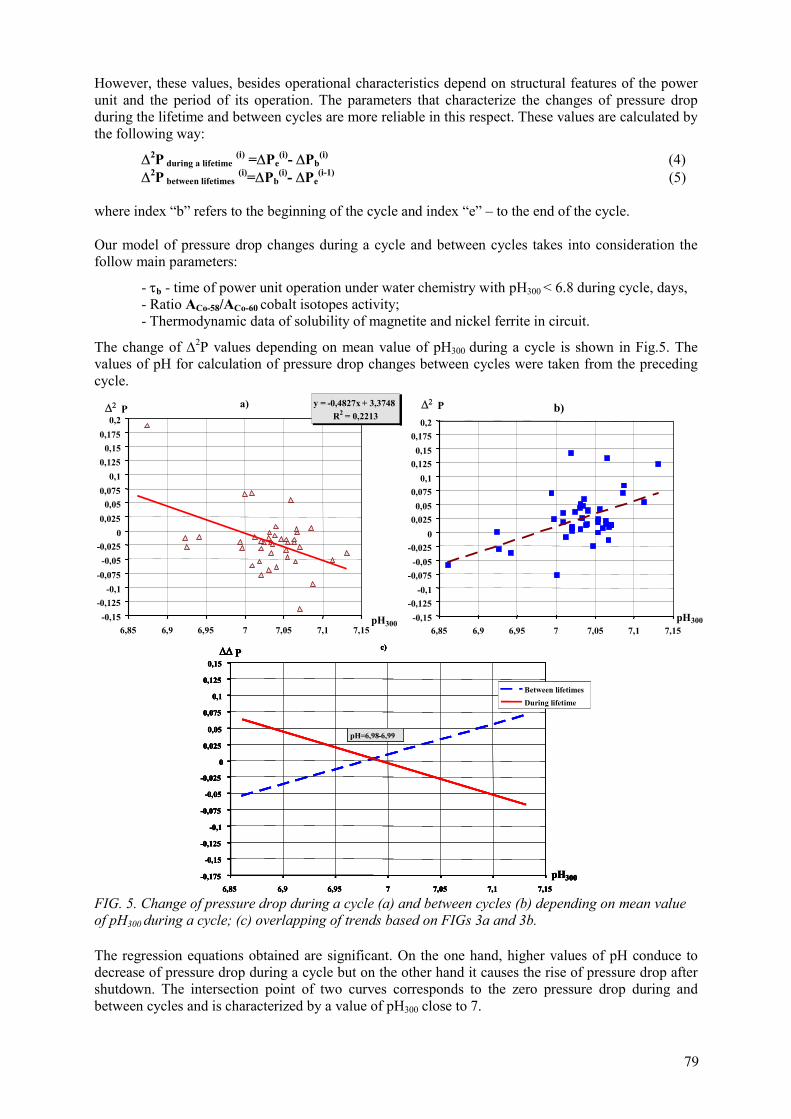
However, these values, besides operational characteristics depend on structural features of the power unit and the period of its operation. The parameters that characterize the changes of pressure drop during the lifetime and between cycles are more reliable in this respect. These values are calculated by the following way:
∆2P during а lifetime (i) =∆Pe(i)- ∆Pb
(i) (4)
∆2P between lifetimes (i)=∆Pb(i)- ∆Pe
(i-1) (5)
where index “b” refers to the beginning of the cycle and index “e” – to the end of the cycle. Our model of pressure drop changes during a cycle and between cycles takes into consideration the follow main parameters:
- τb - time of power unit operation under water chemistry with рН300 < 6.8 during cycle, days, - Ratio АСо-58/АСо-60 cobalt isotopes activity; - Thermodynamic data of solubility of magnetite and nickel ferrite in circuit.
The change of ∆2P values depending on mean value of рН300 during a cycle is shown in Fig.5. The values of pH for calculation of pressure drop changes between cycles were taken from the preceding cycle.
a) y = -0,4827x + 3,3748R2 = 0,2213
-0,15-0,125
-0,1-0,075
-0,05-0,025
00,025
0,050,075
0,10,125
0,150,175
0,2
6,85 6,9 6,95 7 7,05 7,1 7,15рН300
∆∆ P b)
-0,15-0,125
-0,1-0,075
-0,05-0,025
00,0250,05
0,0750,1
0,1250,15
0,1750,2
6,85 6,9 6,95 7 7,05 7,1 7,15рН300
∆∆ Pa) y = -0,4827x + 3,3748R2 = 0,2213
-0,15-0,125
-0,1-0,075
-0,05-0,025
00,025
0,050,075
0,10,125
0,150,175
0,2
6,85 6,9 6,95 7 7,05 7,1 7,15рН300
∆∆ P a) y = -0,4827x + 3,3748R2 = 0,2213
-0,15-0,125
-0,1-0,075
-0,05-0,025
00,025
0,050,075
0,10,125
0,150,175
0,2
6,85 6,9 6,95 7 7,05 7,1 7,15рН300
∆2 P b)
-0,15-0,125
-0,1-0,075
-0,05-0,025
00,0250,05
0,0750,1
0,1250,15
0,1750,2
6,85 6,9 6,95 7 7,05 7,1 7,15рН300
∆2 Pa) y = -0,4827x + 3,3748R2 = 0,2213
-0,15-0,125
-0,1-0,075
-0,05-0,025
00,025
0,050,075
0,10,125
0,150,175
0,2
6,85 6,9 6,95 7 7,05 7,1 7,15рН300
∆∆ P a) y = -0,4827x + 3,3748R2 = 0,2213
-0,15-0,125
-0,1-0,075
-0,05-0,025
00,025
0,050,075
0,10,125
0,150,175
0,2
6,85 6,9 6,95 7 7,05 7,1 7,15рН300
∆2 P b)
-0,15-0,125
-0,1-0,075
-0,05-0,025
00,0250,05
0,0750,1
0,1250,15
0,1750,2
6,85 6,9 6,95 7 7,05 7,1 7,15рН300
∆2 P
-0,175
-0,15
-0,125
-0,1
-0,075
-0,05
-0,025
0
0,025
0,05
0,075
0,1
0,125
0,15
6,85 6,9 6,95 7 7,05 7,1 7,15
рН300
∆∆ P
Between lifetimesDuring lifetime
рН=6,98-6,99
c)
-0,175
-0,15
-0,125
-0,1
-0,075
-0,05
-0,025
0
0,025
0,05
0,075
0,1
0,125
0,15
6,85 6,9 6,95 7 7,05 7,1 7,15
рН300
∆∆ P
Between lifetimesDuring lifetime
рН=6,98-6,99
c)
-0,175
-0,15
-0,125
-0,1
-0,075
-0,05
-0,025
0
0,025
0,05
0,075
0,1
0,125
0,15
6,85 6,9 6,95 7 7,05 7,1 7,15
рН300
∆∆ P
Between lifetimesDuring lifetime
рН=6,98-6,99
c)
-0,175
-0,15
-0,125
-0,1
-0,075
-0,05
-0,025
0
0,025
0,05
0,075
0,1
0,125
0,15
6,85 6,9 6,95 7 7,05 7,1 7,15
рН300
∆∆ P
Between lifetimesDuring lifetime
рН=6,98-6,99
c)
FIG. 5. Change of pressure drop during a cycle (a) and between cycles (b) depending on mean value of рН300 during a cycle; (c) overlapping of trends based on FIGs 3a and 3b.
The regression equations obtained are significant. On the one hand, higher values of рН conduce to decrease of pressure drop during a cycle but on the other hand it causes the rise of pressure drop after shutdown. The intersection point of two curves corresponds to the zero pressure drop during and between cycles and is characterized by a value of рН300 close to 7.
79
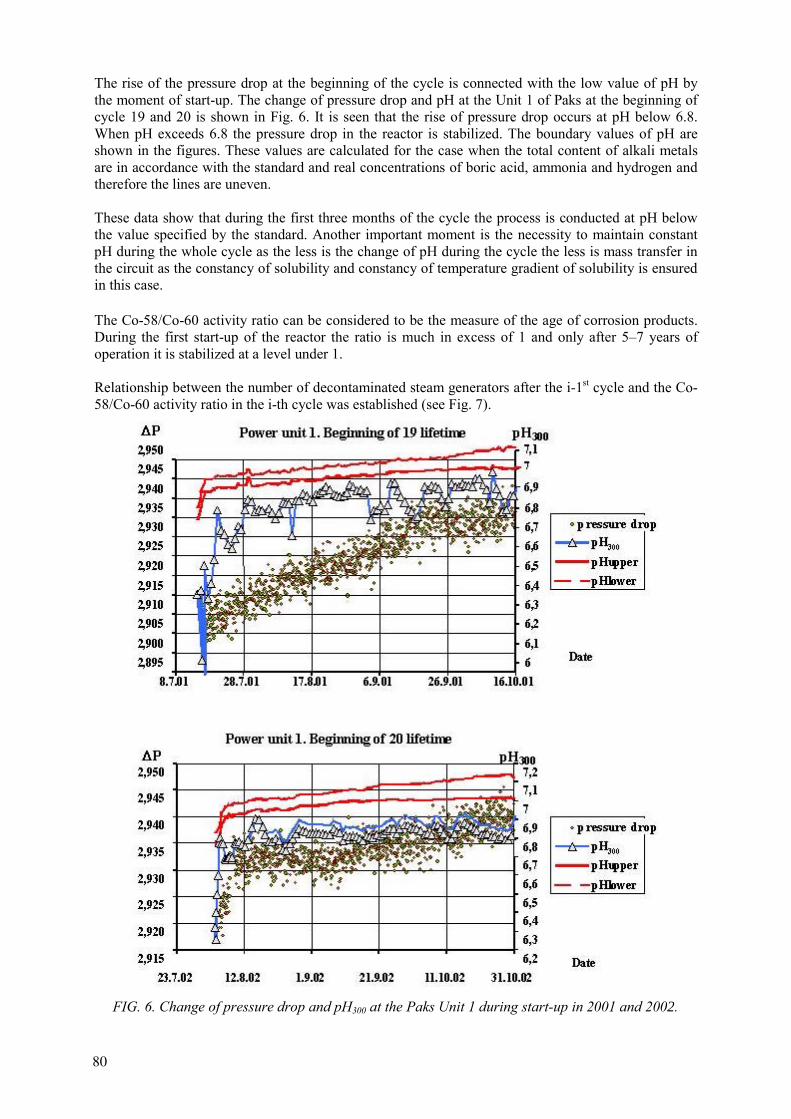
The rise of the pressure drop at the beginning of the cycle is connected with the low value of pН by the moment of start-up. The change of pressure drop and pH at the Unit 1 of Paks at the beginning of cycle 19 and 20 is shown in Fig. 6. It is seen that the rise of pressure drop occurs at рН below 6.8. When рН exceeds 6.8 the pressure drop in the reactor is stabilized. The boundary values of рН are shown in the figures. These values are calculated for the case when the total content of alkali metals are in accordance with the standard and real concentrations of boric acid, ammonia and hydrogen and therefore the lines are uneven. These data show that during the first three months of the cycle the process is conducted at рН below the value specified by the standard. Another important moment is the necessity to maintain constant рН during the whole cycle as the less is the change of pH during the cycle the less is mass transfer in the circuit as the constancy of solubility and constancy of temperature gradient of solubility is ensured in this case. The Со-58/Со-60 activity ratio can be considered to be the measure of the age of corrosion products. During the first start-up of the reactor the ratio is much in excess of 1 and only after 5–7 years of operation it is stabilized at a level under 1. Relationship between the number of decontaminated steam generators after the i-1st cycle and the Со-58/Со-60 activity ratio in the i-th cycle was established (see Fig. 7).
FIG. 6. Change of pressure drop and рН300 at the Paks Unit 1 during start-up in 2001 and 2002.
80
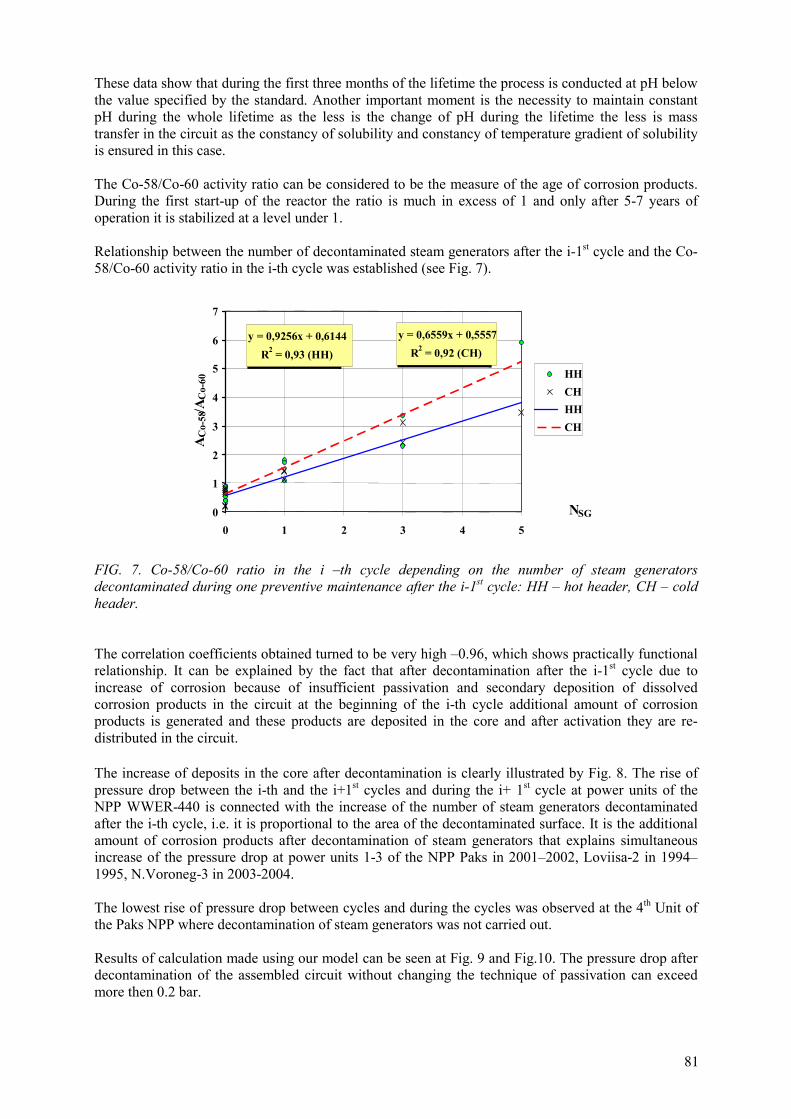
These data show that during the first three months of the lifetime the process is conducted at рН below the value specified by the standard. Another important moment is the necessity to maintain constant рН during the whole lifetime as the less is the change of pH during the lifetime the less is mass transfer in the circuit as the constancy of solubility and constancy of temperature gradient of solubility is ensured in this case. The Со-58/Со-60 activity ratio can be considered to be the measure of the age of corrosion products. During the first start-up of the reactor the ratio is much in excess of 1 and only after 5-7 years of operation it is stabilized at a level under 1. Relationship between the number of decontaminated steam generators after the i-1st cycle and the Со-58/Со-60 activity ratio in the i-th cycle was established (see Fig. 7).
y = 0,6559x + 0,5557R2 = 0,92 (CH)
y = 0,9256x + 0,6144R2 = 0,93 (HH)
0
1
2
3
4
5
6
7
0 1 2 3 4 5
NSG
АСо-
58/А
Со-
60 HHCHHHCH
y = 0,6559x + 0,5557R2 = 0,92 (CH)
y = 0,9256x + 0,6144R2 = 0,93 (HH)
0
1
2
3
4
5
6
7
0 1 2 3 4 5
NSG
АСо-
58/А
Со-
60 HHCHHHCH
FIG. 7. Со-58/Со-60 ratio in the i –th cycle depending on the number of steam generators decontaminated during one preventive maintenance after the i-1st cycle: HH – hot header, CH – cold header. The correlation coefficients obtained turned to be very high –0.96, which shows practically functional relationship. It can be explained by the fact that after decontamination after the i-1st cycle due to increase of corrosion because of insufficient passivation and secondary deposition of dissolved corrosion products in the circuit at the beginning of the i-th cycle additional amount of corrosion products is generated and these products are deposited in the core and after activation they are re-distributed in the circuit. The increase of deposits in the core after decontamination is clearly illustrated by Fig. 8. The rise of pressure drop between the i-th and the i+1st cycles and during the i+ 1st cycle at power units of the NPP WWER-440 is connected with the increase of the number of steam generators decontaminated after the i-th cycle, i.e. it is proportional to the area of the decontaminated surface. It is the additional amount of corrosion products after decontamination of steam generators that explains simultaneous increase of the pressure drop at power units 1-3 of the NPP Paks in 2001–2002, Loviisa-2 in 1994–1995, N.Voroneg-3 in 2003-2004. The lowest rise of pressure drop between cycles and during the cycles was observed at the 4th Unit of the Paks NPP where decontamination of steam generators was not carried out. Results of calculation made using our model can be seen at Fig. 9 and Fig.10. The pressure drop after decontamination of the assembled circuit without changing the technique of passivation can exceed more then 0.2 bar.
81
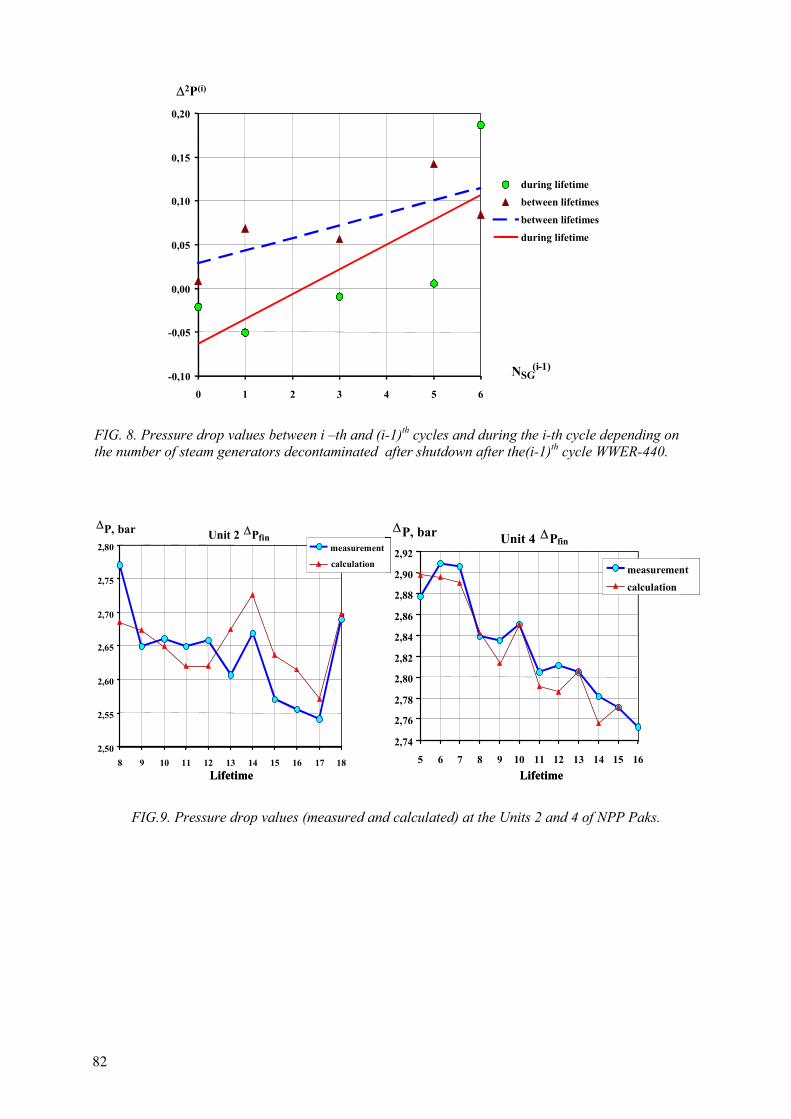
-0,10
-0,05
0,00
0,05
0,10
0,15
0,20
0 1 2 3 4 5 6
NSG(i-1)
∆∆ P(i)
during lifetime
between lifetimes
between lifetimes
during lifetime
-0,10
-0,05
0,00
0,05
0,10
0,15
0,20
0 1 2 3 4 5 6
NSG(i-1)
∆2P(i)
during lifetime
between lifetimes
between lifetimes
during lifetime
-0,10
-0,05
0,00
0,05
0,10
0,15
0,20
0 1 2 3 4 5 6
NSG(i-1)
∆∆ P(i)
during lifetime
between lifetimes
between lifetimes
during lifetime
-0,10
-0,05
0,00
0,05
0,10
0,15
0,20
0 1 2 3 4 5 6
NSG(i-1)
∆2P(i)
during lifetime
between lifetimes
between lifetimes
during lifetime
FIG. 8. Pressure drop values between i –th and (i-1)th cycles and during the i-th cycle depending on the number of steam generators decontaminated after shutdown after the(i-1)th cycle WWER-440.
4 блок ∆Pfin
2,74
2,76
2,78
2,80
2,82
2,84
2,86
2,88
2,90
2,92
5 6 7 8 9 10 11 12 13 14 15 16
Cycle
∆P, bar
measurementcalculation
2 блок ∆Pfin
2,50
2,55
2,60
2,65
2,70
2,75
2,80
8 9 10 11 12 13 14 15 16 17 18Cycle
∆P, barmeasurement
calculation
Unit 4 ∆Pfin
2,74
2,76
2,78
2,80
2,82
2,84
2,86
2,88
2,90
2,92
5 6 7 8 9 10 11 12 13 14 15 16
Cycle
∆P, bar
measurementcalculation
Unit 2 ∆Pfin
2,50
2,55
2,60
2,65
2,70
2,75
2,80
8 9 10 11 12 13 14 15 16 17 18Cycle
∆P, barmeasurement
calculation
4 блок ∆Pfin
2,74
2,76
2,78
2,80
2,82
2,84
2,86
2,88
2,90
2,92
5 6 7 8 9 10 11 12 13 14 15 16
Cycle
∆P, bar
measurementcalculation
2 блок ∆Pfin
2,50
2,55
2,60
2,65
2,70
2,75
2,80
8 9 10 11 12 13 14 15 16 17 18Cycle
∆P, barmeasurement
calculation
Unit 4 ∆Pfin
2,74
2,76
2,78
2,80
2,82
2,84
2,86
2,88
2,90
2,92
5 6 7 8 9 10 11 12 13 14 15 16
∆P, bar
measurementcalculation
Unit 2 ∆Pfin
2,50
2,55
2,60
2,65
2,70
2,75
2,80
8 9 10 11 12 13 14 15 16 17 18Lifetime
∆P, barmeasurement
calculation
Lifetime
4 блок ∆Pfin
2,74
2,76
2,78
2,80
2,82
2,84
2,86
2,88
2,90
2,92
5 6 7 8 9 10 11 12 13 14 15 16
Cycle
∆P, bar
measurementcalculation
2 блок ∆Pfin
2,50
2,55
2,60
2,65
2,70
2,75
2,80
8 9 10 11 12 13 14 15 16 17 18Cycle
∆P, barmeasurement
calculation
Unit 4 ∆Pfin
2,74
2,76
2,78
2,80
2,82
2,84
2,86
2,88
2,90
2,92
5 6 7 8 9 10 11 12 13 14 15 16
Cycle
∆P, bar
measurementcalculation
Unit 2 ∆Pfin
2,50
2,55
2,60
2,65
2,70
2,75
2,80
8 9 10 11 12 13 14 15 16 17 18Cycle
∆P, barmeasurement
calculation
4 блок ∆Pfin
2,74
2,76
2,78
2,80
2,82
2,84
2,86
2,88
2,90
2,92
5 6 7 8 9 10 11 12 13 14 15 16
Cycle
∆P, bar
measurementcalculation
2 блок ∆Pfin
2,50
2,55
2,60
2,65
2,70
2,75
2,80
8 9 10 11 12 13 14 15 16 17 18Cycle
∆P, barmeasurement
calculation
Unit 4 ∆Pfin
2,74
2,76
2,78
2,80
2,82
2,84
2,86
2,88
2,90
2,92
5 6 7 8 9 10 11 12 13 14 15 16
∆P, bar
measurementcalculation
Unit 2 ∆Pfin
2,50
2,55
2,60
2,65
2,70
2,75
2,80
8 9 10 11 12 13 14 15 16 17 18Lifetime
∆P, barmeasurement
calculation
Lifetime
FIG.9. Pressure drop values (measured and calculated) at the Units 2 and 4 of NPP Paks.
82
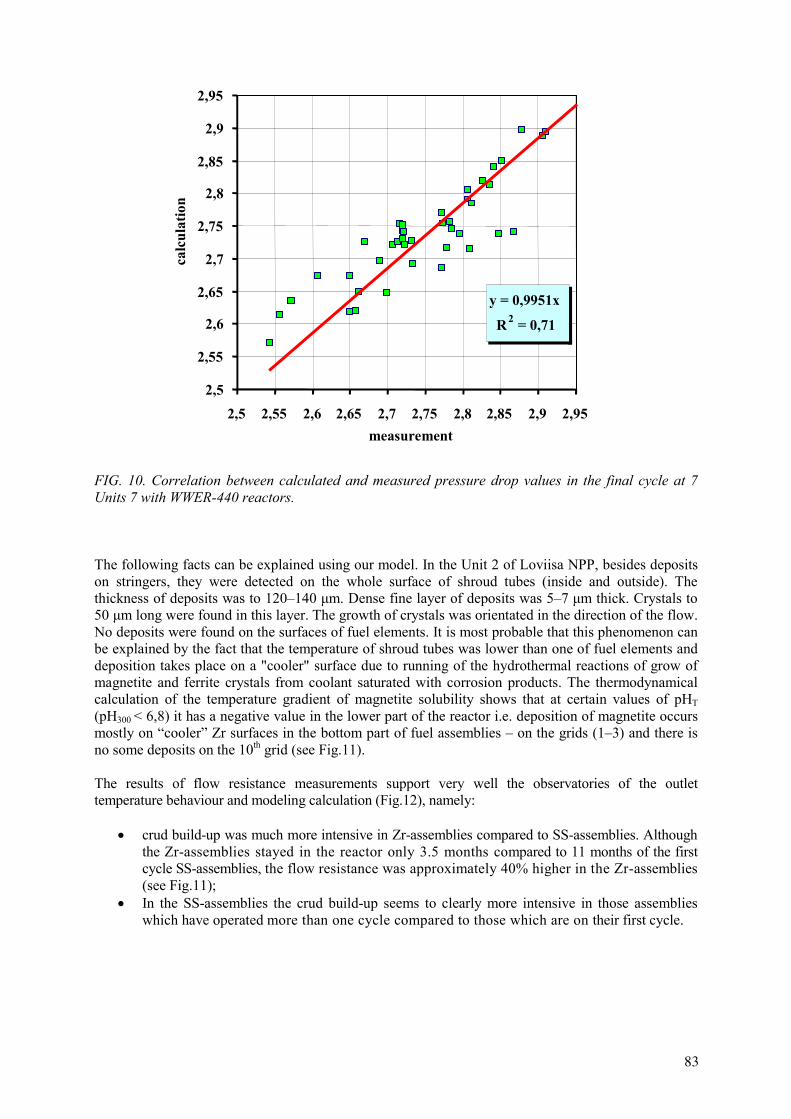
y = 0,9951x
R2 = 0,71
2,5
2,55
2,6
2,65
2,7
2,75
2,8
2,85
2,9
2,95
2,5 2,55 2,6 2,65 2,7 2,75 2,8 2,85 2,9 2,95measurement
calc
ulat
ion
FIG. 10. Correlation between calculated and measured pressure drop values in the final cycle at 7 Units 7 with WWER-440 reactors.
The following facts can be explained using our model. In the Unit 2 of Loviisa NPP, besides deposits on stringers, they were detected on the whole surface of shroud tubes (inside and outside). The thickness of deposits was to 120–140 µm. Dense fine layer of deposits was 5–7 µm thick. Crystals to 50 µm long were found in this layer. The growth of crystals was orientated in the direction of the flow. No deposits were found on the surfaces of fuel elements. It is most probable that this phenomenon can be explained by the fact that the temperature of shroud tubes was lower than one of fuel elements and deposition takes place on a "cooler" surface due to running of the hydrothermal reactions of grow of magnetite and ferrite crystals from coolant saturated with corrosion products. The thermodynamical calculation of the temperature gradient of magnetite solubility shows that at certain values of рНТ (рН300 < 6,8) it has a negative value in the lower part of the reactor i.e. deposition of magnetite occurs mostly on “cooler” Zr surfaces in the bottom part of fuel assemblies – on the grids (1–3) and there is no some deposits on the 10th grid (see Fig.11). The results of flow resistance measurements support very well the observatories of the outlet temperature behaviour and modeling calculation (Fig.12), namely:
• crud build-up was much more intensive in Zr-assemblies compared to SS-assemblies. Although the Zr-assemblies stayed in the reactor only 3.5 months compared to 11 months of the first cycle SS-assemblies, the flow resistance was approximately 40% higher in the Zr-assemblies (see Fig.11);
• In the SS-assemblies the crud build-up seems to clearly more intensive in those assemblies which have operated more than one cycle compared to those which are on their first cycle.
83
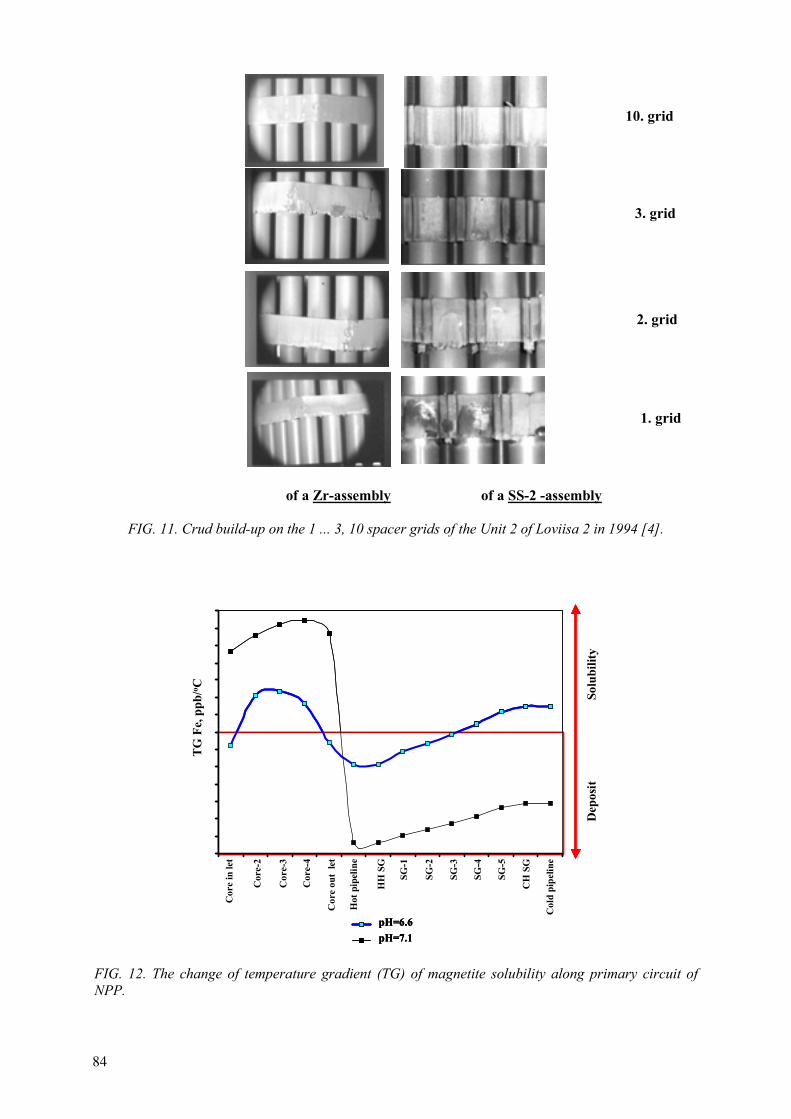
of a Zr-assembly of a SS-2 -assembly
FIG. 11. Crud build-up on the 1 ... 3, 10 spacer grids of the Unit 2 of Loviisa 2 in 1994 [4].
TG
Fe,
ppb
/o C
Dep
osit
Sol
ubili
ty
pH=6.6pH=7.1
Cor
e in
let
Cor
e-2
Cor
e-3
Cor
e-4
Cor
e ou
t le
t
Hot
pip
elin
e
HH
SG
SG-1
SG-2
SG-3
SG-4
SG-5
CH
SG
Col
d pi
pelin
e
TG
Fe,
ppb
/o C
Dep
osit
Sol
ubili
ty
pH=6.6pH=7.1pH=6.6pH=7.1
Cor
e in
let
Cor
e-2
Cor
e-3
Cor
e-4
Cor
e ou
t le
t
Hot
pip
elin
e
HH
SG
SG-1
SG-2
SG-3
SG-4
SG-5
CH
SG
Col
d pi
pelin
e
Cor
e in
let
Cor
e-2
Cor
e-3
Cor
e-4
Cor
e ou
t le
t
Hot
pip
elin
e
HH
SG
SG-1
SG-2
SG-3
SG-4
SG-5
CH
SG
Col
d pi
pelin
e
FIG. 12. The change of temperature gradient (TG) of magnetite solubility along primary circuit of NPP.
2. grid
10. grid
3. grid
1. grid
84

Corrosion products coming into the reactor core undergo random distribution, which process results in non-uniform corrosion products deposition over different core areas. The non-uniform corrosion products distribution along the fuel assembles length is caused by fluctuations in the thermal physical and chemical properties of the cooling environment, surface and corrosion products. Zr grids had temperature close to coolant temperature. SS – 1 assembly had temperature much higher than coolant temperature due to radiation heating. SS – 2 assembly had deposits and temperature of boundary surface oxide/water was lower in comparison with SS-1 (see Fig.2). 4. CORRELATION BETWEEN FUEL FAILURE RATE AND PRESSURE DROP-TIME As fuel failure rate depends on ∆T [7], the correlation between number of failure fuel assemblies (in % from number of fuel assemblies of certain mode) and product ∆2P⋅τ (where τ - time, ∆2P – pressure drop) was detected (Fig.13). It follows, to achieve the value n%≈0 in the course of 3 days it's necessary to keep up the pressure drop on the level ∆2P<0.03 Bar (pH300≈6.95÷7.05) (see Fig.5).
0
20
40
60
80
100
120
0 100 200 300 400 500 600
∆2P*τ, bar*day
n%
FIG. 13. Correlation between number (%) of failed FAs and parameter ∆2P⋅τ.
5. CONCLUSIONS
1. The phenomenon of "pressure drop" which takes place in NPP with WWER reactors was
considered. 2. A model was developed to explain pressure drop rise in-core and deposits redistribution in the core
and in the primary circuit of NPP with WWER-440. The physical-chemical basis of the model is the transport corrosion products dependence on temperature and pHT of coolant.
3. A model was verified by operation data of 7 units of NPP with WWER-440 reactors. A model can be used for water chemistry control during lifetimes and under planning of decontamination measures.
85
REFERENCES
[1] TUTNOV, A., ALEXEEV, E., “Analysis of different models of clad-to-coolant transfer coefficient influence on results of WWER fuel element thermo-mechanic behaviour”, Proc. Fifth International Conference "WWER Fuel Performance, Modelling and Experimental Support". 29 September–3 October 2003, Albena, Bulgaria. ISBN 954-9820-09-2. 2004, p.408–416. [2] BENEDEK P., LASZLO A. Grundlagen des chemieingenieurwesens. Veb Deutscher Verlag Fǜr Grundstoffindustie, Leipzig, 1967. [3] OVCHINNIKOV, F.Y., GOLUBEV, L.I., DOBRYNIN, V.D., KLOCHKOV V.I., SEMENOV, V.V., V.M.TSYBENKO, Operational regimes of water-cooled nuclear power plants, Moscow, “Atomizdat” publishing house, 1977, p. 280. [4] ROSENBERG, R.J., TERÄSVIRTA, R., HALIN, M., SUKSI, S., Investigation of iron deposits on fuel assemblies of the Loviisa 2 WWER-440 reactor, «Water chemistry of nuclear reactor systems 7» Proceedings of the conference organized by the British Nuclear Energy Society and held in Bournemouth on 13–17 October 1996 British Nuclear Energy Society, London. p.27–33. [5] KERESZTÚRI, A., BOGATYR, S., MIKÓ, S., NEMES, I., Analyses for licensing of new fuel types at NPP Paks, FIFTH INTERNATIONAL CONFERENCE ON WWER FUEL PERFORMANCE, MODELLING AND EXPERIMENTAL SUPPORT. 29 September– 3 October 2003, Congress Center Albena, Bulgaria, ISBN 954-9820-09-2. 2004, p.243–252. [6] KOMAROV, L.B., Statistical methods of processing experimental data, Lensovet Leningrad Technological Institute, Leningrad, 1972, p. 207. [7] KRITSKY, V.G., Influence of water chemistry regimes on fuel cladding failure in LWRs. Fuel failure in normal operation of water reactors: experience, mechanisms and management. Proceedings of a Technical Committee Meeting held in Dimitrovgrad, Russian Federation. 26–29 May, 1992. IAEA-TECDOC-709 June, 1993, Vienna, p.282–286.
86
LOAD WITHSTAND ABILITY OF PHWR FUEL BUNDLE END PLATE
P.N. PRASAD, R. SONI Nuclear Power Corporation of India Limited, Nabhikiya Urja Bhavan, Anushaktinagar, Mumbai, India Abstract
The Indian 220 MWe PHWRs use Natural Uranium short length Fuel Bundles. The fuel bundle consists of 19 fuel elements, arranged and assembled together to form a fuel bundle assembly, with end plates welded at both ends. The fuel bundles experience variety of loads during its stay in the coolant channel namely external coolant pressure, loads due to fuelling machine operation and differential axial thermal expansion of elements etc. The fuel bundle components such as cladding and endplate have been designed with minimum Zircaloy content, with the result the components go in to the plastic range of the stress-strain curve. These components have been designed for fatigue. Differential fissile content in different rings of fuel bundle will affect the thermal flux profile across the bundle. This leads to different heat generations in different ring elements and different axial expansions. Consequently, the end plate gets stressed and the number of fatigue cycles the end plate and the fuel bundle can take will vary. This paper discusses the loads acting on fuel bundle under different scenarios and end plate stress analysis and fatigue cycle estimation for natural uranium bundle and bundle with different fissile content in different rings.
1. INTRODUCTION Presently, twelve Pressurized Heavy Water Reactors (PHWRs) and two Boiling Water Reactors (BWRs) are in operation in India with a total installed capacity of 2720 MWe. Construction of the two PHWR 500 MWe units at Tarapur, four additional PHWR 220 units at Kaiga (Kaiga 3, 4) and RAPP 5&6, Two VVER-1000 reactors at Kudankulam (KK-1&2), in collaboration with Russian Federation, are in progress. PHWRs use 'Natural' uranium in dioxide form as fuel. The fuel is in the form of small cylindrical pellets. These pellets are loaded in Zircaloy-4 (Zirconium-Tin-Fe-Cr alloy) cladding and hermetically sealed at both ends by welding with two end plugs. Each element is provided with bearing pads/spacer pads to provide inter-element spacing. The elements are assembled in the form of a bundle by welding them to two end plates. The fuel bundle is made up of elements arranged in two/three concentric rings around a central element. These bundles are half meter in length. The fuel bundle structural components namely, fuel cladding, end plugs, bearing pads, spacer pads and end plates are all made of zircaloy material. Typical fuel bundle is shown in Figure-1.
87
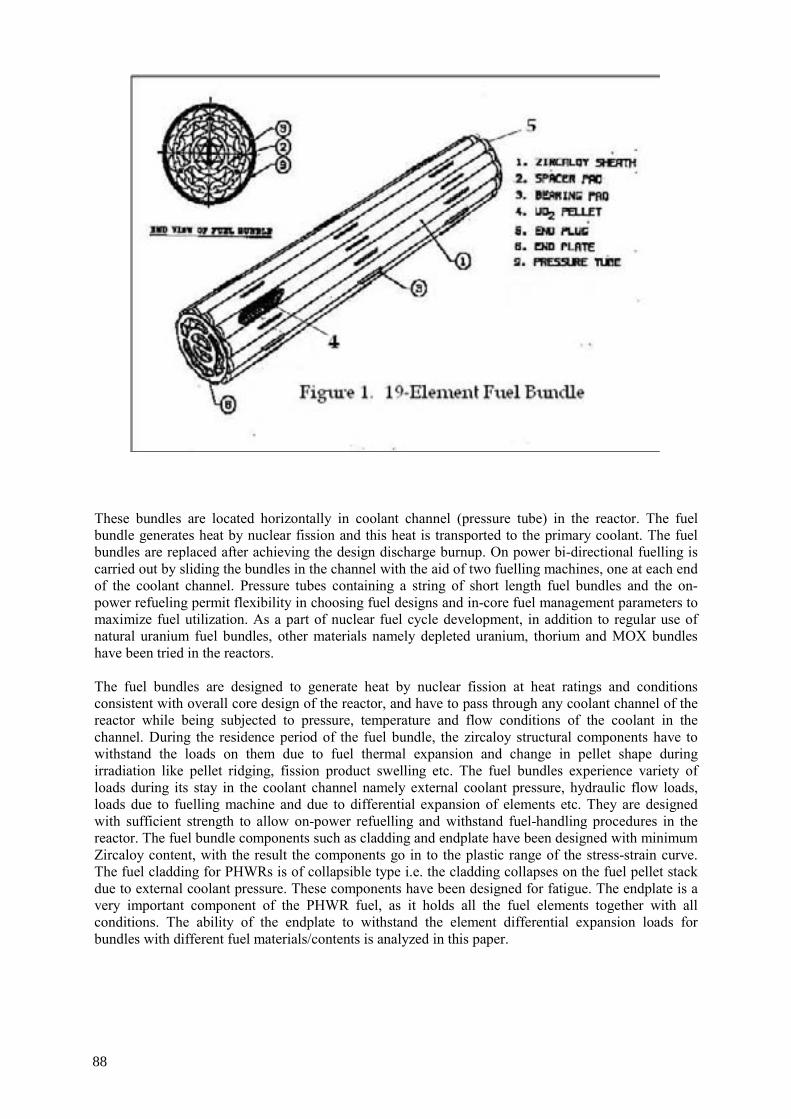
These bundles are located horizontally in coolant channel (pressure tube) in the reactor. The fuel bundle generates heat by nuclear fission and this heat is transported to the primary coolant. The fuel bundles are replaced after achieving the design discharge burnup. On power bi-directional fuelling is carried out by sliding the bundles in the channel with the aid of two fuelling machines, one at each end of the coolant channel. Pressure tubes containing a string of short length fuel bundles and the on-power refueling permit flexibility in choosing fuel designs and in-core fuel management parameters to maximize fuel utilization. As a part of nuclear fuel cycle development, in addition to regular use of natural uranium fuel bundles, other materials namely depleted uranium, thorium and MOX bundles have been tried in the reactors.
The fuel bundles are designed to generate heat by nuclear fission at heat ratings and conditions consistent with overall core design of the reactor, and have to pass through any coolant channel of the reactor while being subjected to pressure, temperature and flow conditions of the coolant in the channel. During the residence period of the fuel bundle, the zircaloy structural components have to withstand the loads on them due to fuel thermal expansion and change in pellet shape during irradiation like pellet ridging, fission product swelling etc. The fuel bundles experience variety of loads during its stay in the coolant channel namely external coolant pressure, hydraulic flow loads, loads due to fuelling machine and due to differential expansion of elements etc. They are designed with sufficient strength to allow on-power refuelling and withstand fuel-handling procedures in the reactor. The fuel bundle components such as cladding and endplate have been designed with minimum Zircaloy content, with the result the components go in to the plastic range of the stress-strain curve. The fuel cladding for PHWRs is of collapsible type i.e. the cladding collapses on the fuel pellet stack due to external coolant pressure. These components have been designed for fatigue. The endplate is a very important component of the PHWR fuel, as it holds all the fuel elements together with all conditions. The ability of the endplate to withstand the element differential expansion loads for bundles with different fuel materials/contents is analyzed in this paper.
88
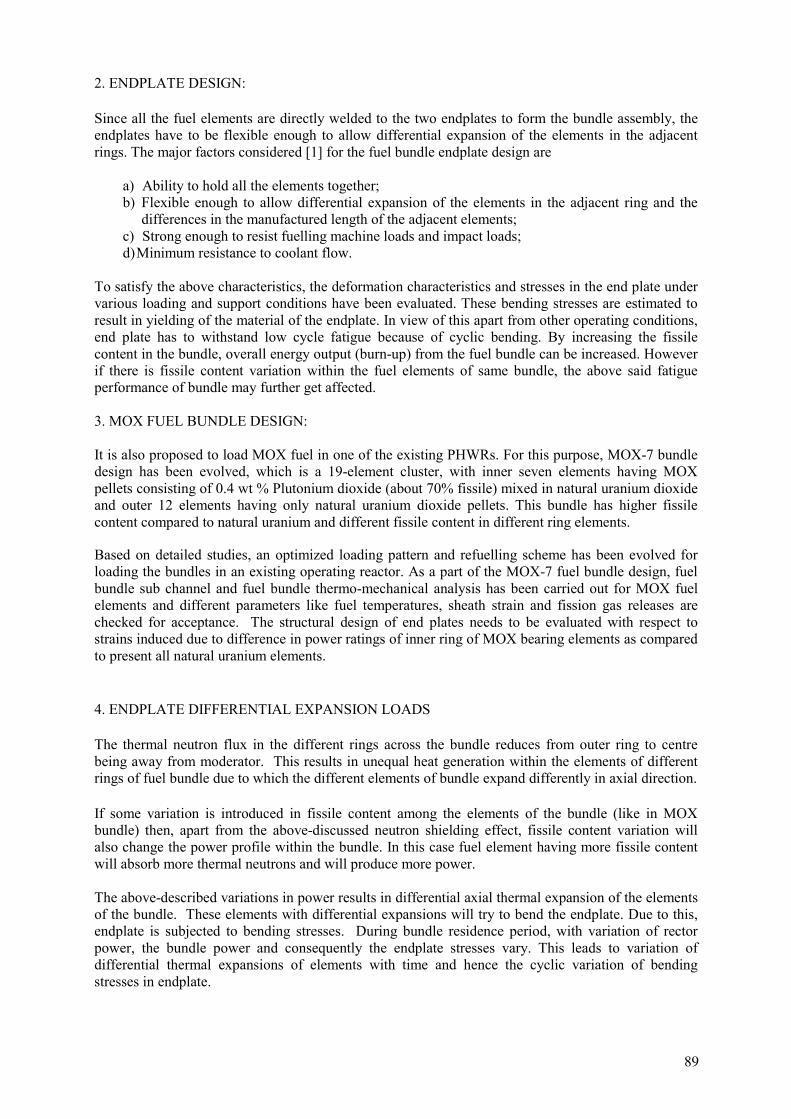
2. ENDPLATE DESIGN:
Since all the fuel elements are directly welded to the two endplates to form the bundle assembly, the endplates have to be flexible enough to allow differential expansion of the elements in the adjacent rings. The major factors considered [1] for the fuel bundle endplate design are
a) Ability to hold all the elements together; b) Flexible enough to allow differential expansion of the elements in the adjacent ring and the
differences in the manufactured length of the adjacent elements; c) Strong enough to resist fuelling machine loads and impact loads; d) Minimum resistance to coolant flow.
To satisfy the above characteristics, the deformation characteristics and stresses in the end plate under various loading and support conditions have been evaluated. These bending stresses are estimated to result in yielding of the material of the endplate. In view of this apart from other operating conditions, end plate has to withstand low cycle fatigue because of cyclic bending. By increasing the fissile content in the bundle, overall energy output (burn-up) from the fuel bundle can be increased. However if there is fissile content variation within the fuel elements of same bundle, the above said fatigue performance of bundle may further get affected.
3. MOX FUEL BUNDLE DESIGN:
It is also proposed to load MOX fuel in one of the existing PHWRs. For this purpose, MOX-7 bundle design has been evolved, which is a 19-element cluster, with inner seven elements having MOX pellets consisting of 0.4 wt % Plutonium dioxide (about 70% fissile) mixed in natural uranium dioxide and outer 12 elements having only natural uranium dioxide pellets. This bundle has higher fissile content compared to natural uranium and different fissile content in different ring elements.
Based on detailed studies, an optimized loading pattern and refuelling scheme has been evolved for loading the bundles in an existing operating reactor. As a part of the MOX-7 fuel bundle design, fuel bundle sub channel and fuel bundle thermo-mechanical analysis has been carried out for MOX fuel elements and different parameters like fuel temperatures, sheath strain and fission gas releases are checked for acceptance. The structural design of end plates needs to be evaluated with respect to strains induced due to difference in power ratings of inner ring of MOX bearing elements as compared to present all natural uranium elements.
4. ENDPLATE DIFFERENTIAL EXPANSION LOADS The thermal neutron flux in the different rings across the bundle reduces from outer ring to centre being away from moderator. This results in unequal heat generation within the elements of different rings of fuel bundle due to which the different elements of bundle expand differently in axial direction. If some variation is introduced in fissile content among the elements of the bundle (like in MOX bundle) then, apart from the above-discussed neutron shielding effect, fissile content variation will also change the power profile within the bundle. In this case fuel element having more fissile content will absorb more thermal neutrons and will produce more power. The above-described variations in power results in differential axial thermal expansion of the elements of the bundle. These elements with differential expansions will try to bend the endplate. Due to this, endplate is subjected to bending stresses. During bundle residence period, with variation of rector power, the bundle power and consequently the endplate stresses vary. This leads to variation of differential thermal expansions of elements with time and hence the cyclic variation of bending stresses in endplate.
89
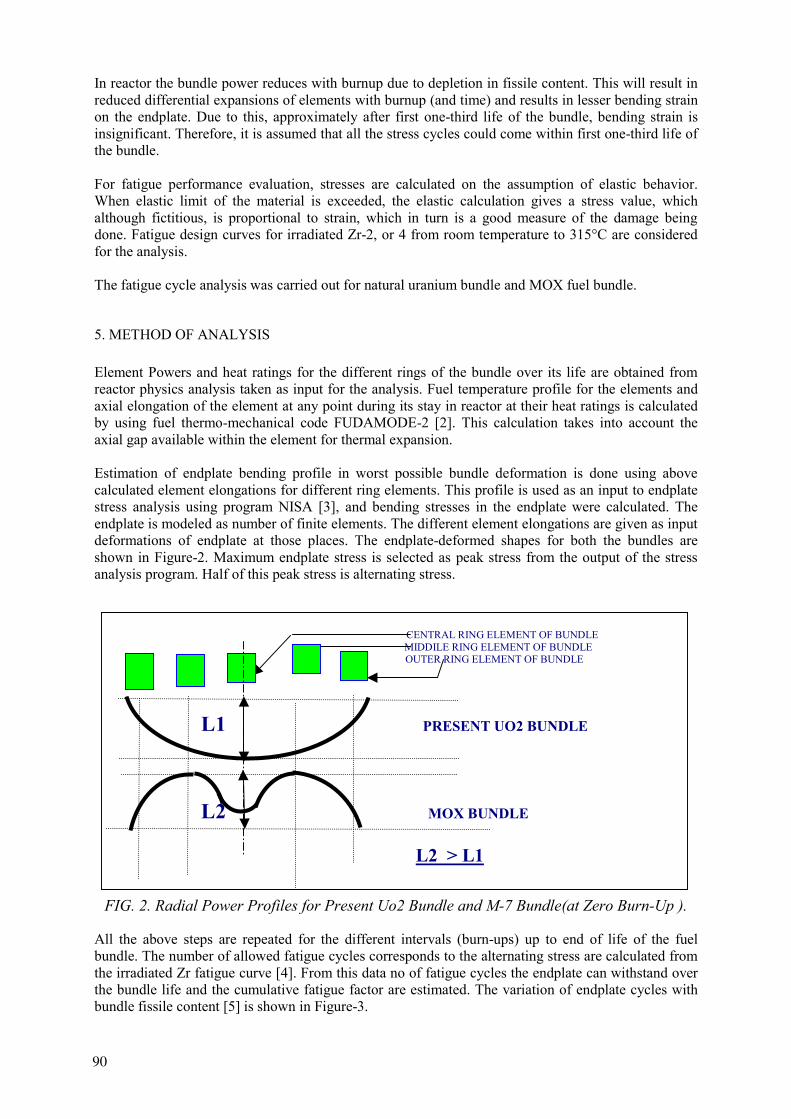
In reactor the bundle power reduces with burnup due to depletion in fissile content. This will result in reduced differential expansions of elements with burnup (and time) and results in lesser bending strain on the endplate. Due to this, approximately after first one-third life of the bundle, bending strain is insignificant. Therefore, it is assumed that all the stress cycles could come within first one-third life of the bundle. For fatigue performance evaluation, stresses are calculated on the assumption of elastic behavior. When elastic limit of the material is exceeded, the elastic calculation gives a stress value, which although fictitious, is proportional to strain, which in turn is a good measure of the damage being done. Fatigue design curves for irradiated Zr-2, or 4 from room temperature to 315°C are considered for the analysis. The fatigue cycle analysis was carried out for natural uranium bundle and MOX fuel bundle.
5. METHOD OF ANALYSIS
Element Powers and heat ratings for the different rings of the bundle over its life are obtained from reactor physics analysis taken as input for the analysis. Fuel temperature profile for the elements and axial elongation of the element at any point during its stay in reactor at their heat ratings is calculated by using fuel thermo-mechanical code FUDAMODE-2 [2]. This calculation takes into account the axial gap available within the element for thermal expansion.
Estimation of endplate bending profile in worst possible bundle deformation is done using above
calculated element elongations for different ring elements. This profile is used as an input to endplate stress analysis using program NISA [3], and bending stresses in the endplate were calculated. The endplate is modeled as number of finite elements. The different element elongations are given as input deformations of endplate at those places. The endplate-deformed shapes for both the bundles are shown in Figure-2. Maximum endplate stress is selected as peak stress from the output of the stress analysis program. Half of this peak stress is alternating stress.
CENTRAL RING ELEMENT OF BUNDLE
MIDDILE RING ELEMENT OF BUNDLE OUTER RING ELEMENT OF BUNDLE
L1 PRESENT UO2 BUNDLE
L2 MOX BUNDLE
L2 > L1
FIG. 2. Radial Power Profiles for Present Uo2 Bundle and M-7 Bundle(at Zero Burn-Up ).
All the above steps are repeated for the different intervals (burn-ups) up to end of life of the fuel bundle. The number of allowed fatigue cycles corresponds to the alternating stress are calculated from the irradiated Zr fatigue curve [4]. From this data no of fatigue cycles the endplate can withstand over the bundle life and the cumulative fatigue factor are estimated. The variation of endplate cycles with bundle fissile content [5] is shown in Figure-3.
90
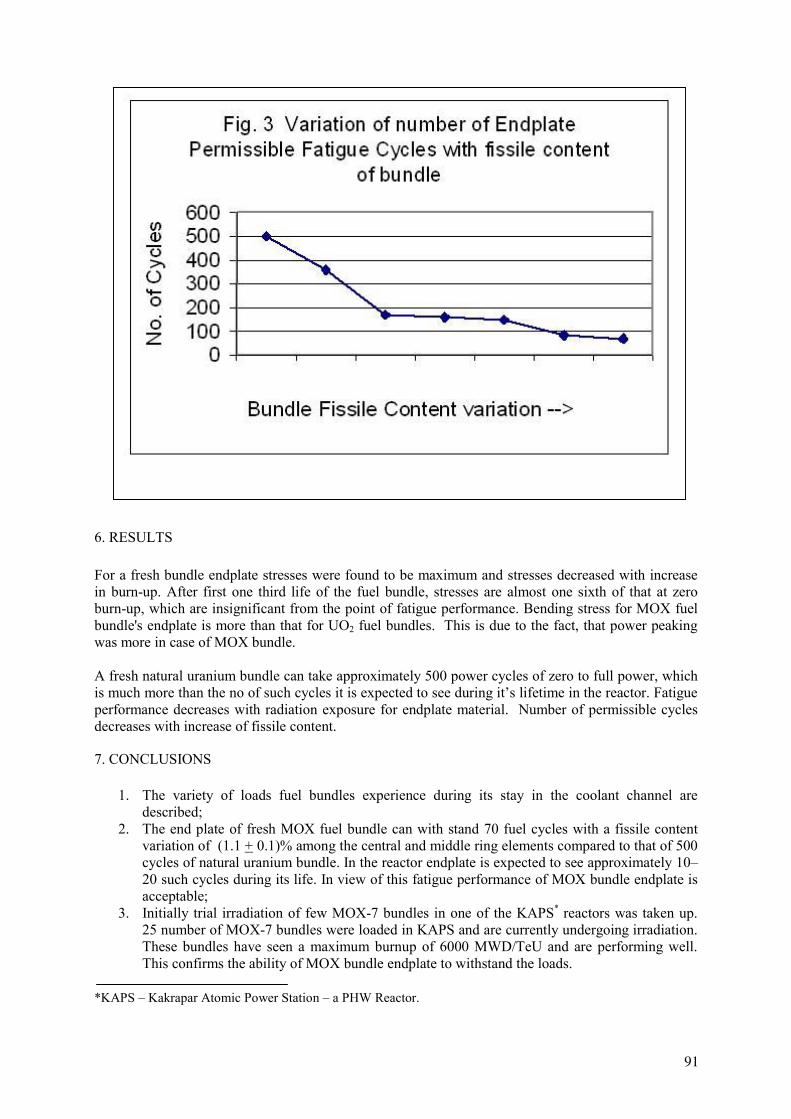
6. RESULTS For a fresh bundle endplate stresses were found to be maximum and stresses decreased with increase in burn-up. After first one third life of the fuel bundle, stresses are almost one sixth of that at zero burn-up, which are insignificant from the point of fatigue performance. Bending stress for MOX fuel bundle's endplate is more than that for UO2 fuel bundles. This is due to the fact, that power peaking was more in case of MOX bundle. A fresh natural uranium bundle can take approximately 500 power cycles of zero to full power, which is much more than the no of such cycles it is expected to see during it’s lifetime in the reactor. Fatigue performance decreases with radiation exposure for endplate material. Number of permissible cycles decreases with increase of fissile content.
7. CONCLUSIONS
1. The variety of loads fuel bundles experience during its stay in the coolant channel are described;
2. The end plate of fresh MOX fuel bundle can with stand 70 fuel cycles with a fissile content variation of (1.1 + 0.1)% among the central and middle ring elements compared to that of 500 cycles of natural uranium bundle. In the reactor endplate is expected to see approximately 10–20 such cycles during its life. In view of this fatigue performance of MOX bundle endplate is acceptable;
3. Initially trial irradiation of few MOX-7 bundles in one of the KAPS* reactors was taken up. 25 number of MOX-7 bundles were loaded in KAPS and are currently undergoing irradiation. These bundles have seen a maximum burnup of 6000 MWD/TeU and are performing well. This confirms the ability of MOX bundle endplate to withstand the loads.
*KAPS – Kakrapar Atomic Power Station – a PHW Reactor.
91
ACKNOWLEDGEMENTS The authors acknowledge Shri S. Vijay Kumar and Shri K.P. Dwivedi of Reactor Components group for reviewing the paper, providing useful suggestions and encouragement. Our acknowledgements are also due to Shri K.B.Dixit, Executive Director (Engineering) and Shri S.A.Bhardwaj, Senior Executive Director (Engineering) for the encouragement provided and for permitting to present the paper in the IAEA Technical Meeting.
REFERENCES [1] NUCLEAR POWER CORPORATION OF INDIA LIMITED, Fuel Bundle Design Manual,
RAPP 3&4, 1995, NPCIL [2] NUCLEAR POWER CORPORATION OF INDIA LIMITED, Fuel Design Analysis Code,
FUDAMOD2, June-91, NPCIL [3] EMRC, FEM stress analysis software NISA 2, version-6, Dec-1995. [4] W.J. O'DONNELL and LANGER "Fatigue design Basis for Zircaloy Components". Nuclear
Science and engineering: 20, 1-12(1964) [5] R. SONI, et al., “Fatigue Analysis of Fuel Bundle End Plate”, Symposium on Zirconium – 2002,
BARC, Mumbai, India, Sep 2002. [6] TERI-NUREG-1005, "MATPRO, version - 11", USNRC (1976)
92
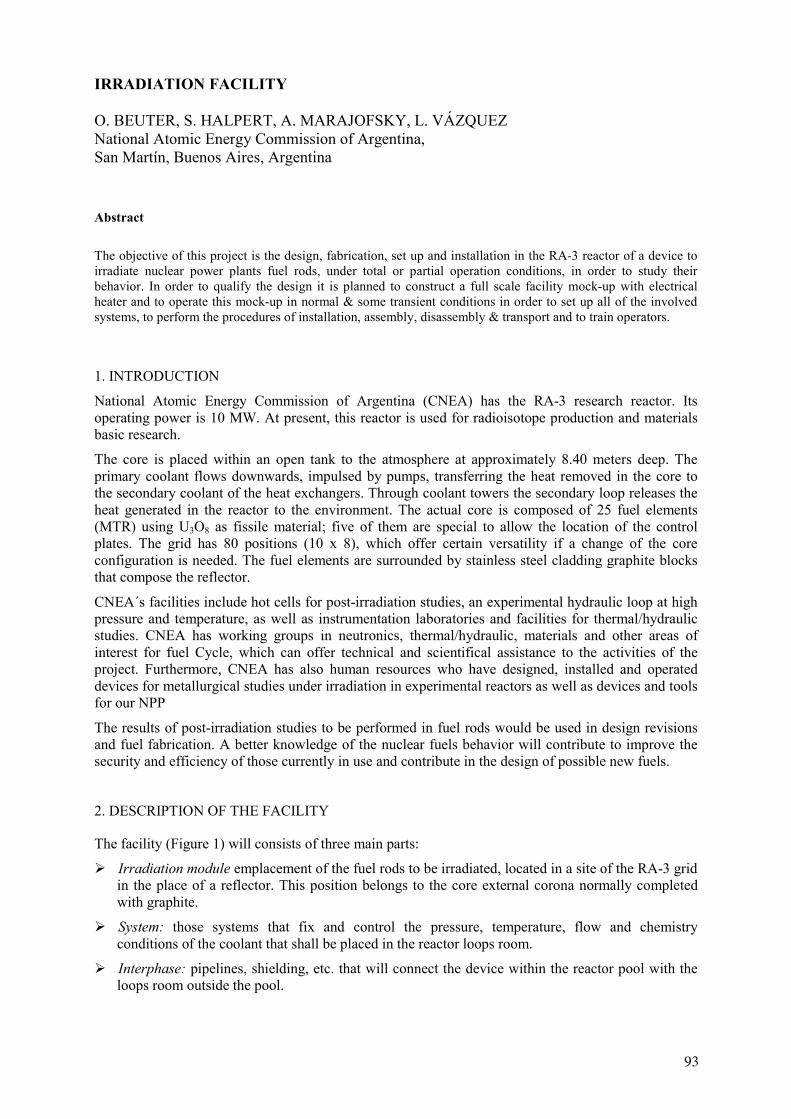
IRRADIATION FACILITY O. BEUTER, S. HALPERT, A. MARAJOFSKY, L. VÁZQUEZ National Atomic Energy Commission of Argentina, San Martín, Buenos Aires, Argentina
Abstract The objective of this project is the design, fabrication, set up and installation in the RA-3 reactor of a device to irradiate nuclear power plants fuel rods, under total or partial operation conditions, in order to study their behavior. In order to qualify the design it is planned to construct a full scale facility mock-up with electrical heater and to operate this mock-up in normal & some transient conditions in order to set up all of the involved systems, to perform the procedures of installation, assembly, disassembly & transport and to train operators. 1. INTRODUCTION
National Atomic Energy Commission of Argentina (CNEA) has the RA-3 research reactor. Its operating power is 10 MW. At present, this reactor is used for radioisotope production and materials basic research.
The core is placed within an open tank to the atmosphere at approximately 8.40 meters deep. The primary coolant flows downwards, impulsed by pumps, transferring the heat removed in the core to the secondary coolant of the heat exchangers. Through coolant towers the secondary loop releases the heat generated in the reactor to the environment. The actual core is composed of 25 fuel elements (MTR) using U3O8 as fissile material; five of them are special to allow the location of the control plates. The grid has 80 positions (10 x 8), which offer certain versatility if a change of the core configuration is needed. The fuel elements are surrounded by stainless steel cladding graphite blocks that compose the reflector.
CNEA´s facilities include hot cells for post-irradiation studies, an experimental hydraulic loop at high pressure and temperature, as well as instrumentation laboratories and facilities for thermal/hydraulic studies. CNEA has working groups in neutronics, thermal/hydraulic, materials and other areas of interest for fuel Cycle, which can offer technical and scientifical assistance to the activities of the project. Furthermore, CNEA has also human resources who have designed, installed and operated devices for metallurgical studies under irradiation in experimental reactors as well as devices and tools for our NPP
The results of post-irradiation studies to be performed in fuel rods would be used in design revisions and fuel fabrication. A better knowledge of the nuclear fuels behavior will contribute to improve the security and efficiency of those currently in use and contribute in the design of possible new fuels.
2. DESCRIPTION OF THE FACILITY
The facility (Figure 1) will consists of three main parts:
Irradiation module emplacement of the fuel rods to be irradiated, located in a site of the RA-3 grid in the place of a reflector. This position belongs to the core external corona normally completed with graphite.
System: those systems that fix and control the pressure, temperature, flow and chemistry conditions of the coolant that shall be placed in the reactor loops room.
Interphase: pipelines, shielding, etc. that will connect the device within the reactor pool with the loops room outside the pool.
93
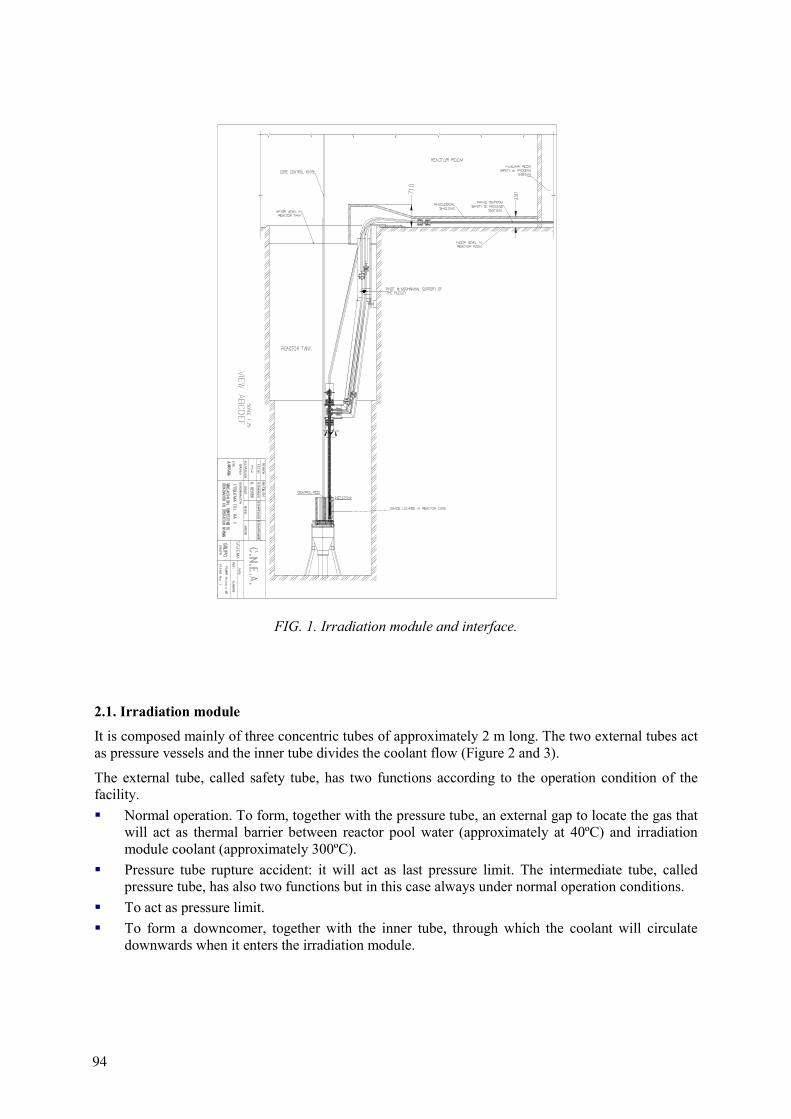
FIG. 1. Irradiation module and interface.
2.1. Irradiation module
It is composed mainly of three concentric tubes of approximately 2 m long. The two external tubes act as pressure vessels and the inner tube divides the coolant flow (Figure 2 and 3).
The external tube, called safety tube, has two functions according to the operation condition of the facility. Normal operation. To form, together with the pressure tube, an external gap to locate the gas that
will act as thermal barrier between reactor pool water (approximately at 40ºC) and irradiation module coolant (approximately 300ºC).
Pressure tube rupture accident: it will act as last pressure limit. The intermediate tube, called pressure tube, has also two functions but in this case always under normal operation conditions.
To act as pressure limit. To form a downcomer, together with the inner tube, through which the coolant will circulate
downwards when it enters the irradiation module.
94
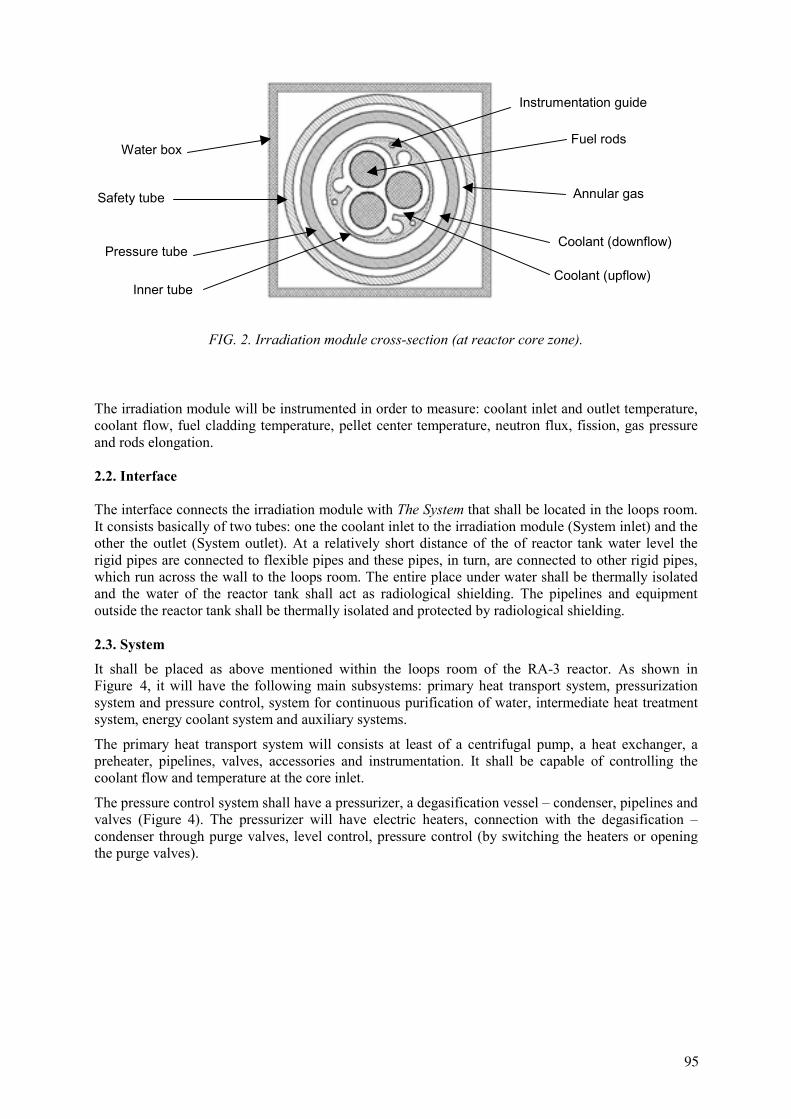
FIG. 2. Irradiation module cross-section (at reactor core zone).
The irradiation module will be instrumented in order to measure: coolant inlet and outlet temperature, coolant flow, fuel cladding temperature, pellet center temperature, neutron flux, fission, gas pressure and rods elongation. 2.2. Interface The interface connects the irradiation module with The System that shall be located in the loops room. It consists basically of two tubes: one the coolant inlet to the irradiation module (System inlet) and the other the outlet (System outlet). At a relatively short distance of the of reactor tank water level the rigid pipes are connected to flexible pipes and these pipes, in turn, are connected to other rigid pipes, which run across the wall to the loops room. The entire place under water shall be thermally isolated and the water of the reactor tank shall act as radiological shielding. The pipelines and equipment outside the reactor tank shall be thermally isolated and protected by radiological shielding. 2.3. System
It shall be placed as above mentioned within the loops room of the RA-3 reactor. As shown in Figure 4, it will have the following main subsystems: primary heat transport system, pressurization system and pressure control, system for continuous purification of water, intermediate heat treatment system, energy coolant system and auxiliary systems.
The primary heat transport system will consists at least of a centrifugal pump, a heat exchanger, a preheater, pipelines, valves, accessories and instrumentation. It shall be capable of controlling the coolant flow and temperature at the core inlet.
The pressure control system shall have a pressurizer, a degasification vessel – condenser, pipelines and valves (Figure 4). The pressurizer will have electric heaters, connection with the degasification – condenser through purge valves, level control, pressure control (by switching the heaters or opening the purge valves).
Water box
Safety tube
Pressure tube
Inner tube
Instrumentation guide
Annular gas
Coolant (downflow)
Coolant (upflow)
Fuel rods
95
Coolant inlet/outlet
FIG. 3. Irradiation module.
3. DEVICE CHARACTERISTICS
The basic thermo-hydraulic characteristics of the device are summarized in the table 1.
Pressure tube
Safety tube
Water box
Pressure tube
Safety tube
Water box
Annular gas
96
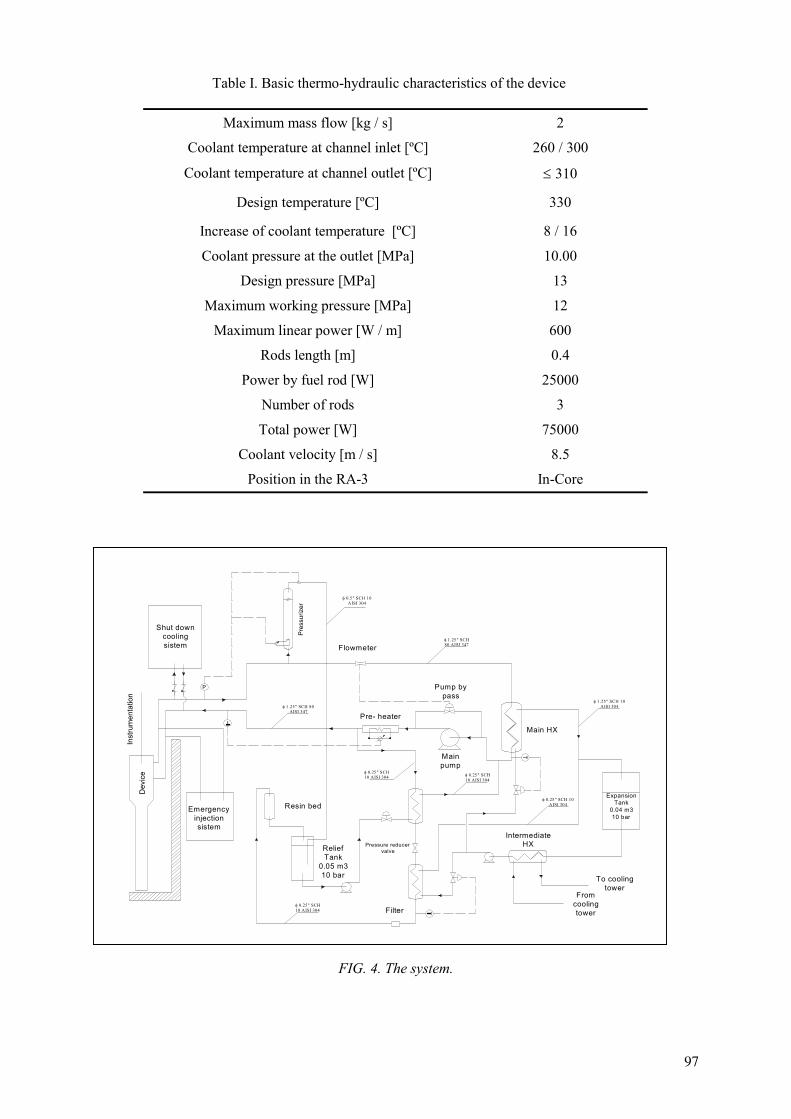
Table I. Basic thermo-hydraulic characteristics of the device
Maximum mass flow [kg / s] 2
Coolant temperature at channel inlet [ºC] 260 / 300
Coolant temperature at channel outlet [ºC] ≤ 310
Design temperature [ºC] 330
Increase of coolant temperature [ºC] 8 / 16
Coolant pressure at the outlet [MPa] 10.00
Design pressure [MPa] 13
Maximum working pressure [MPa] 12
Maximum linear power [W / m] 600
Rods length [m] 0.4
Power by fuel rod [W] 25000
Number of rods 3
Total power [W] 75000
Coolant velocity [m / s] 8.5
Position in the RA-3 In-Core
FIG. 4. The system.
Dev
ice
Inst
rum
enta
tion
Emergency injection sistem
Pre- heater
Main HX
Filter
Resin bed
Pressure reducer valveRelief
Tank0.05 m310 bar
Main pump
Intermediate HX
From cooling tower
To cooling tower
Shut down cooling sistem
Pump by pass
Flowmeter
P
Expansion Tank
0.04 m310 bar
φ 1.25" SCH 80 AISI 347
φ 1.25" SCH 80 AISI 347
φ 0.5" SCH 10 AISI 304
φ 1.25" SCH 10 AISI 304
φ 0.25" SCH 10 AISI 304
φ 0.25" SCH 10 AISI 304
φ 0.25" SCH 10 AISI 304
φ 0.25" SCH 10 AISI 304
Pre
ssur
izer
97

4. OUT-OF-PILE TASK AND TRAINNING
In order to qualify the design it is planned:
To construct a full-scale facility mock-up with electrical heater. The majority of its components will be the same that will be used in the in-pile facility;
To operate this mock-up in normal & some transient conditions in order to set up all of the involved systems: Instrumentation & Control, SDCS, Emergency;
To construct a structure simulating part of the reactor pool in order to perform the procedures of installation, assembly, disassembly & transport;
To train operators in operation, assembly, disassembly & transport steps.
98
FUEL ASSEMBLY BOW AND CONTROL ROD DROP KINETICS – MEASUREMENTS, MODELING, REMEDIES
(Session 2)
Chairpersons
H. PETTERSSON Sweden
V.M. TROYANOV Russian Federation

EVOLUTION OF FUEL ROD SUPPORT UNDER IRRADIATION — IMPACT ON THE MECHANICAL BEHAVIOUR OF FUEL ASSEMBLIES A. BILLEREY EDF SEPTEN, Villeurbanne, France Abstract New fuel management targets imply to increase fuel assembly discharge burnup. Therefore, the prediction of the mechanical behaviour of the irradiated fuel assembly is essential such as excessive fuel assembly distortion induce incomplete Rod Cluster Control Assembly insertion problems (safety issue) or fuel rod vibration induced wear leading to leaking rods (plant operation problems). Within this framework, one of the most important parameter is the knowledge of the fuel rod support in the grid cell because it directly governs the mechanical behaviour of the fuel assembly and consequently allows to predict the behaviour of irradiated structures in terms of (i) axial and lateral deformation (global behaviour of the assembly) and (ii) rod vibration induced wear (local behaviour of the rod). Generally, fuel rod support is provided by a spring-dimple system fixed to the grid. During irradiation, the spring force decreases and a gap between the rod and the spring may occur. This phenomenon is due to (i) stress relieving in the spring and in the dimples, (ii) grid growth and (iii) reduction of the rod diameter. Two models have been developed to predict the behaviour of the rod in the cell. The first model is dedicated to the evaluation of the spring force relaxation during irradiation. The second one can assess the rotation characteristic of the fuel rod in the cell, function of the spring force. The main input parameters are (i) the creep laws of the grid materials, (ii) the growth law of the grid, (iii) the evolution of rod diameter and (iv) the design of the fuel rod support. The aim of this paper is to: (i) evaluate the consequences of grid support design modifications on the rod vibration sensitivity in terms of predicted rod to grid maximum gap during irradiation and time in operation with an open rod to grid gap; (ii) evaluate, using a linear or non-linear Finite Element assembly model, the impact of the evolution of grid support under irradiation on the overall mechanical behaviour of the fuel assembly in terms of axial and lateral stiffnesses and eigenmodes.
1. INTRODUCTION
Knowledge of fuel rod support in grid cell is an important parameter for comprehension of global behaviour of fuel assembly (deformations in core) and local behaviour of rod (fretting wear). Generally, rods are supported by a spring-dimples system (see FIG. 1). Under irradiation, grid spring force is decreasing and rod to grid gap opening may appear, impacting:
- vibration of rods, - fuel assembly axial and lateral stiffnesses and eigenmodes.
Two models have been developed to predict the behaviour of rods in cells. The first model evaluates spring force relaxation during irradiation. The second one provides the rotation characteristic of fuel rods in cells as a function of spring force. Given fuel rod support evolution, a final element fuel assembly model has also been developed to predict the evolution of fuel assembly mechanical behaviour.
2. EVOLUTION OF GRID SPRING FORCE UNDER IRRADIATION
The aim of this model is to calculate the evolution of grid spring force under irradiation and the eventual rod to grid gap opening. In this paper the model is applied to:
- Inconel 718 grid (bottom grid and top grid), - Zy-4 grids (mid grids).
101
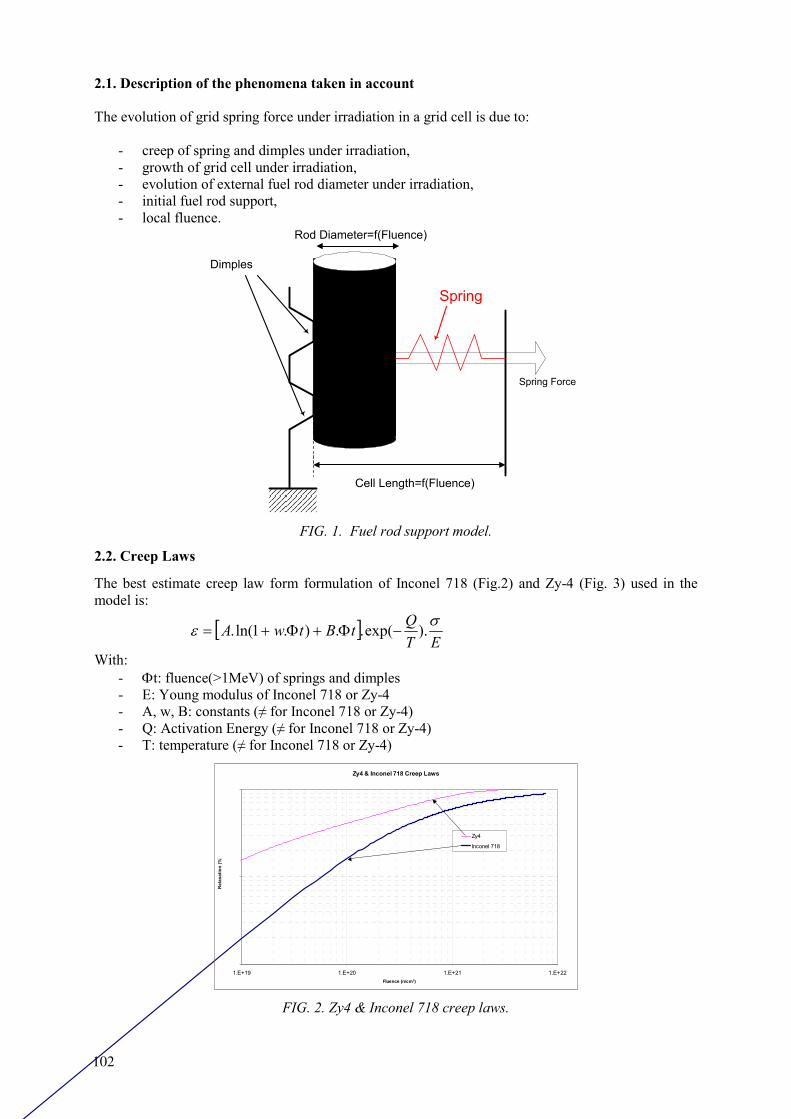
2.1. Description of the phenomena taken in account The evolution of grid spring force under irradiation in a grid cell is due to:
- creep of spring and dimples under irradiation, - growth of grid cell under irradiation, - evolution of external fuel rod diameter under irradiation, - initial fuel rod support, - local fluence.
Spring
Rod Diameter=f(Fluence)
Cell Length=f(Fluence)
Spring Force
Dimples
FIG. 1. Fuel rod support model.
2.2. Creep Laws
The best estimate creep law form formulation of Inconel 718 (Fig.2) and Zy-4 (Fig. 3) used in the model is:
[ ]ET
QtBtwA σε ).exp(..).1ln(. −Φ+Φ+=
With: - Φt: fluence(>1MeV) of springs and dimples - E: Young modulus of Inconel 718 or Zy-4 - A, w, B: constants (≠ for Inconel 718 or Zy-4) - Q: Activation Energy (≠ for Inconel 718 or Zy-4) - T: temperature (≠ for Inconel 718 or Zy-4)
Zy4 & Inconel 718 Creep Laws
1
10
100
1.E+19 1.E+20 1.E+21 1.E+22Fluence (n/cm²)
Rel
axat
ion
(%)
Zy4
Inconel 718
FIG. 2. Zy4 & Inconel 718 creep laws.
102
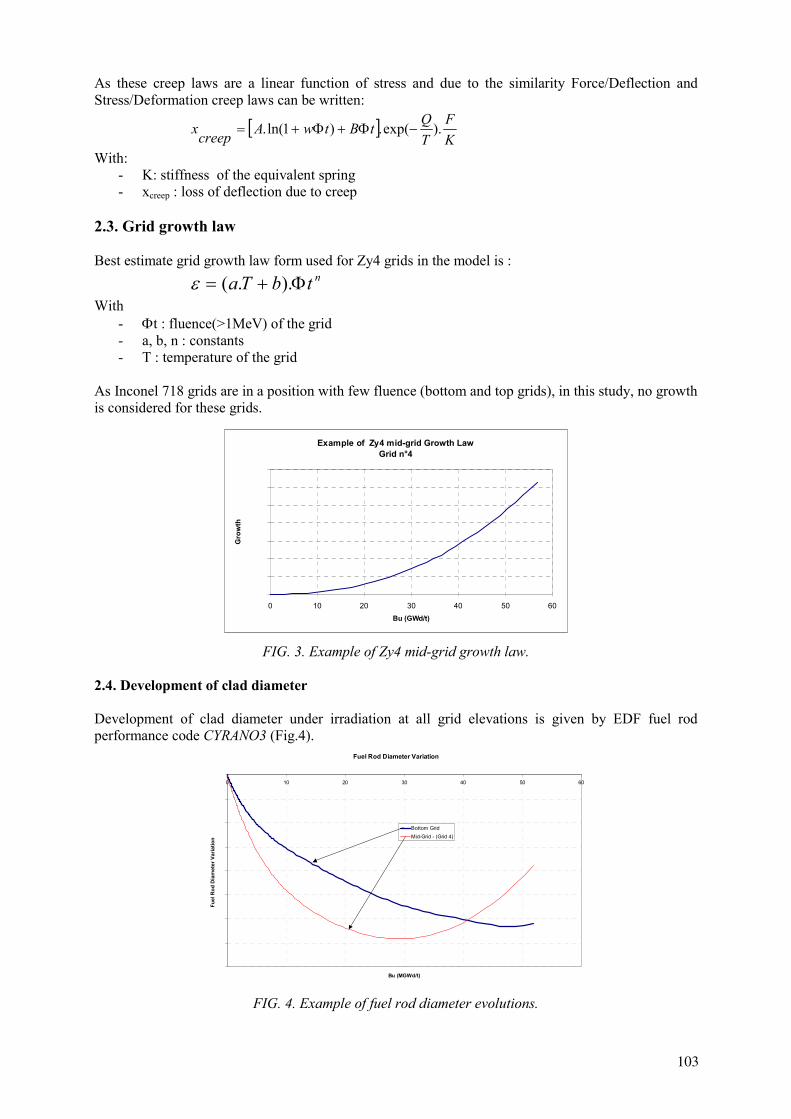
As these creep laws are a linear function of stress and due to the similarity Force/Deflection and Stress/Deformation creep laws can be written:
[ ]KF
TQtBtwAcreepx ).exp(.)1ln(. −Φ+Φ+=
With: - K: stiffness of the equivalent spring - xcreep : loss of deflection due to creep
2.3. Grid growth law Best estimate grid growth law form used for Zy4 grids in the model is :
ntbTa Φ+= )..(ε With
- Φt : fluence(>1MeV) of the grid - a, b, n : constants - T : temperature of the grid
As Inconel 718 grids are in a position with few fluence (bottom and top grids), in this study, no growth is considered for these grids.
Example of Zy4 mid-grid Growth LawGrid n°4
0.0%
0.1%
0.1%
0.2%
0.2%
0.3%
0.3%
0.4%
0 10 20 30 40 50 60Bu (GWd/t)
Gro
wth
FIG. 3. Example of Zy4 mid-grid growth law.
2.4. Development of clad diameter Development of clad diameter under irradiation at all grid elevations is given by EDF fuel rod performance code CYRANO3 (Fig.4).
Fuel Rod Diameter Variation
-0.08
-0.07
-0.06
-0.05
-0.04
-0.03
-0.02
-0.01
0.000 10 20 30 40 50 60
Bu (MGWd/t)
Fuel
Rod
Dia
met
er V
aria
tion
Bottom GridMid-Grid - (Grid 4)
FIG. 4. Example of fuel rod diameter evolutions.
103
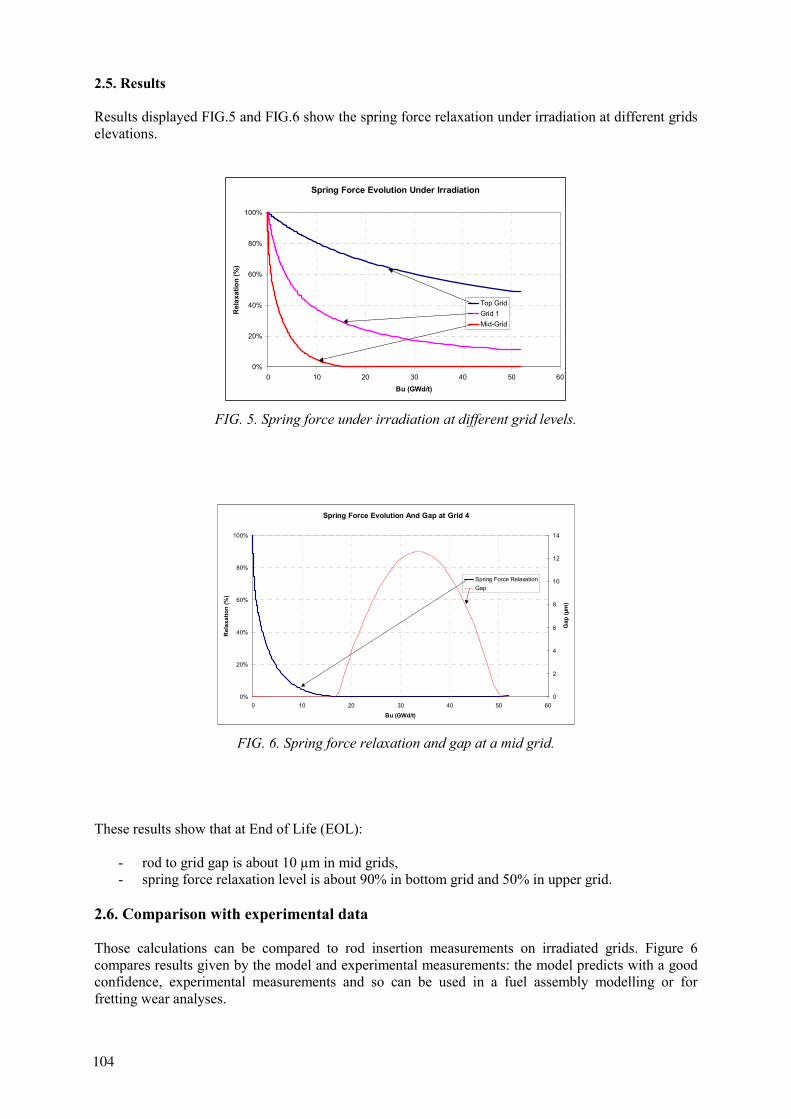
2.5. Results Results displayed FIG.5 and FIG.6 show the spring force relaxation under irradiation at different grids elevations.
Spring Force Evolution Under Irradiation
0%
20%
40%
60%
80%
100%
0 10 20 30 40 50 60
Bu (GWd/t)
Rel
axat
ion
(%)
Top GridGrid 1Mid-Grid
FIG. 5. Spring force under irradiation at different grid levels.
Spring Force Evolution And Gap at Grid 4
0%
20%
40%
60%
80%
100%
0 10 20 30 40 50 60
Bu (GWd/t)
Rel
axat
ion
(%)
0
2
4
6
8
10
12
14
Gap
(µm
)
Spring Force RelaxationGap
FIG. 6. Spring force relaxation and gap at a mid grid.
These results show that at End of Life (EOL):
- rod to grid gap is about 10 µm in mid grids, - spring force relaxation level is about 90% in bottom grid and 50% in upper grid.
2.6. Comparison with experimental data Those calculations can be compared to rod insertion measurements on irradiated grids. Figure 6 compares results given by the model and experimental measurements: the model predicts with a good confidence, experimental measurements and so can be used in a fuel assembly modelling or for fretting wear analyses.
104
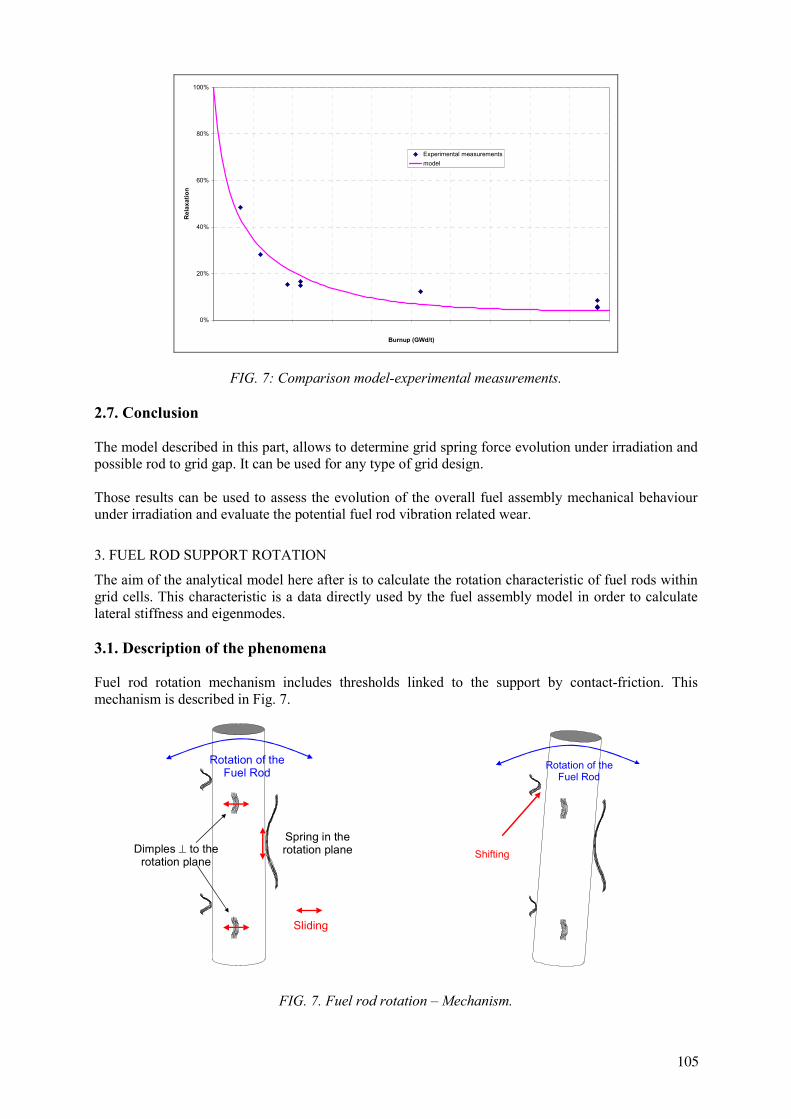
0%
20%
40%
60%
80%
100%
0 10 20 30 40 50 60 70 80 90 100
Burnup (GWd/t)
Rel
axat
ion
Experimental measurementsmodel
FIG. 7: Comparison model-experimental measurements. 2.7. Conclusion The model described in this part, allows to determine grid spring force evolution under irradiation and possible rod to grid gap. It can be used for any type of grid design. Those results can be used to assess the evolution of the overall fuel assembly mechanical behaviour under irradiation and evaluate the potential fuel rod vibration related wear.
3. FUEL ROD SUPPORT ROTATION
The aim of the analytical model here after is to calculate the rotation characteristic of fuel rods within grid cells. This characteristic is a data directly used by the fuel assembly model in order to calculate lateral stiffness and eigenmodes. 3.1. Description of the phenomena Fuel rod rotation mechanism includes thresholds linked to the support by contact-friction. This mechanism is described in Fig. 7.
Rotation of theFuel Rod
Dimples ⊥ to therotation plane
Sliding
Spring in therotation plane
Rotation of theFuel Rod
Shifting
FIG. 7. Fuel rod rotation – Mechanism.
105
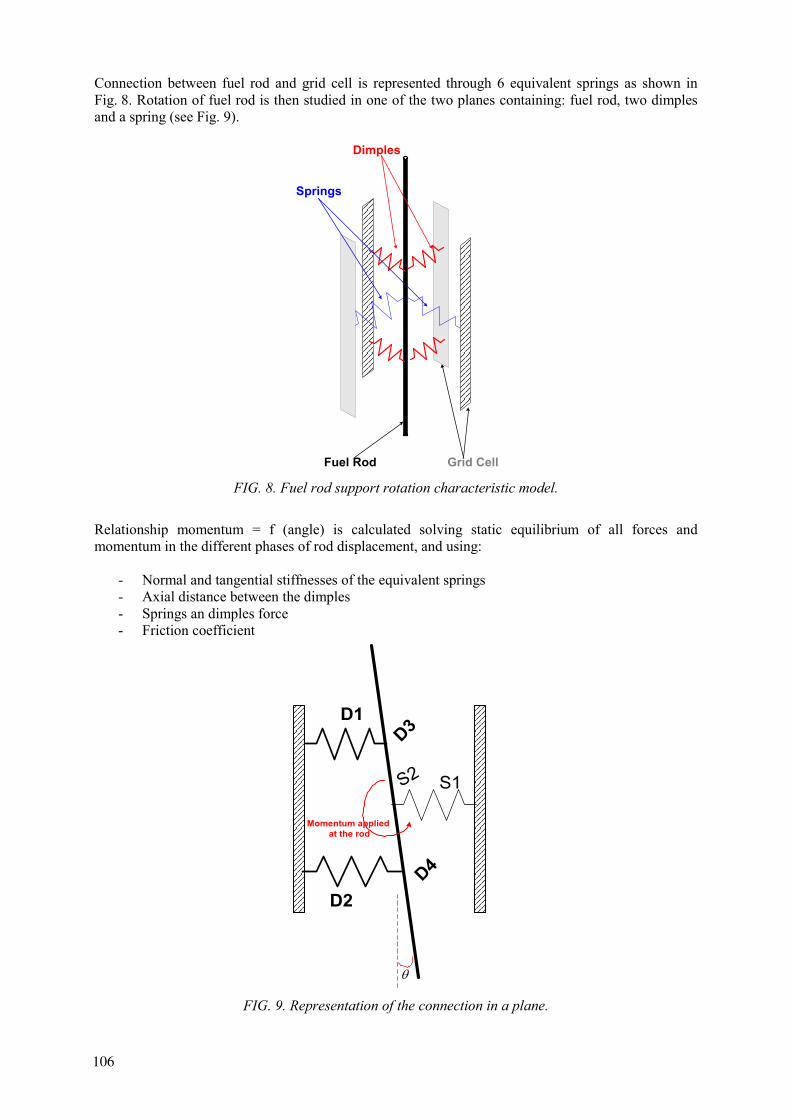
Connection between fuel rod and grid cell is represented through 6 equivalent springs as shown in Fig. 8. Rotation of fuel rod is then studied in one of the two planes containing: fuel rod, two dimples and a spring (see Fig. 9).
Springs
Dimples
Fuel Rod Grid Cell FIG. 8. Fuel rod support rotation characteristic model.
Relationship momentum = f (angle) is calculated solving static equilibrium of all forces and momentum in the different phases of rod displacement, and using:
- Normal and tangential stiffnesses of the equivalent springs - Axial distance between the dimples - Springs an dimples force - Friction coefficient
D1
D2
S1
D3
D4
Momentum applied at the rod
θ
S2
FIG. 9. Representation of the connection in a plane.
106
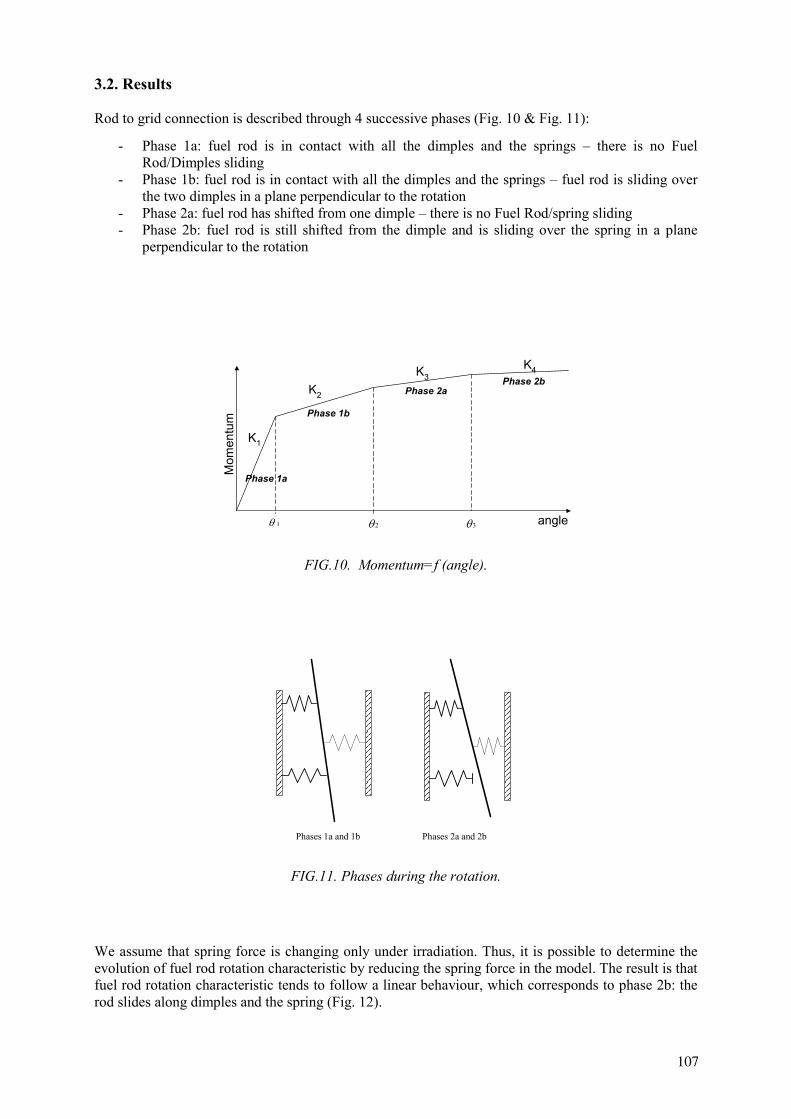
3.2. Results Rod to grid connection is described through 4 successive phases (Fig. 10 & Fig. 11):
- Phase 1a: fuel rod is in contact with all the dimples and the springs – there is no Fuel Rod/Dimples sliding
- Phase 1b: fuel rod is in contact with all the dimples and the springs – fuel rod is sliding over the two dimples in a plane perpendicular to the rotation
- Phase 2a: fuel rod has shifted from one dimple – there is no Fuel Rod/spring sliding - Phase 2b: fuel rod is still shifted from the dimple and is sliding over the spring in a plane
perpendicular to the rotation
K1
1θ
Mom
entu
m
2θ
K2
K3
3θ
K4
angle
Phase 1a
Phase 1b
Phase 2aPhase 2b
FIG.10. Momentum=f (angle).
Phases 1a et 1b Phase 2a et 2bPhases 1a and 1b Phases 2a and 2b
FIG.11. Phases during the rotation.
We assume that spring force is changing only under irradiation. Thus, it is possible to determine the evolution of fuel rod rotation characteristic by reducing the spring force in the model. The result is that fuel rod rotation characteristic tends to follow a linear behaviour, which corresponds to phase 2b: the rod slides along dimples and the spring (Fig. 12).
107

Angle
Mom
entu
m
Beginning Of Life (BOL)
Middle Of Life
End Of Life (EOL)
FIG. 12. Evolution of the characteristic under irradiation.
4. EVOLUTION OF FUEL ASSEMBLY MECHANICAL BEHAVIOUR UNDER IRRADIATION
As it was shown before, given initial characteristic of fuel rod support its evolution under irradiation can be evaluate. By using a finite element fuel assembly model including local rod to grid connection model previously described, it is possible to predict the evolution of fuel assembly mechanical behaviour under irradiation. Figure 13 shows the finite element fuel assembly model used for calculations.
FIG. 13. Fuel assembly finite element model.
The results presented below show an example of the BOL and EOL characteristics of a fuel assembly irradiated up to 50 GWd/t predicted with this model.
108
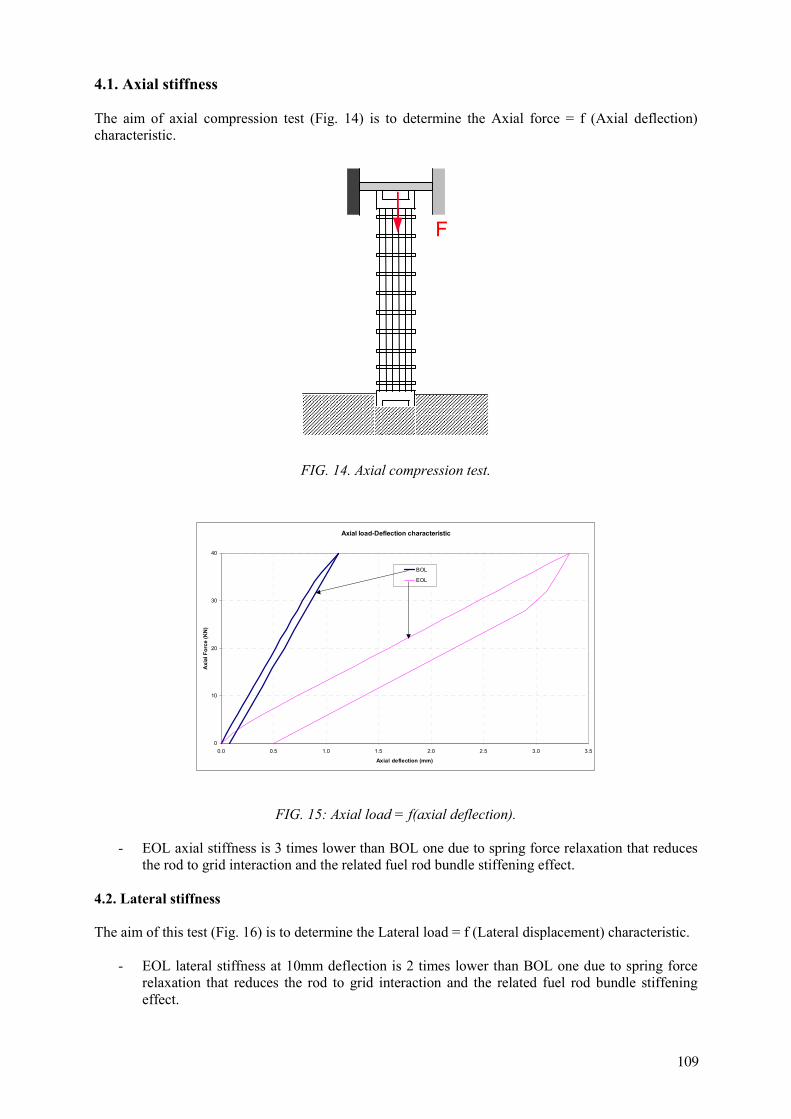
4.1. Axial stiffness The aim of axial compression test (Fig. 14) is to determine the Axial force = f (Axial deflection) characteristic.
F
FIG. 14. Axial compression test.
Axial load-Deflection characteristic
0
10
20
30
40
0.0 0.5 1.0 1.5 2.0 2.5 3.0 3.5
Axial deflection (mm)
Axi
al F
orce
(KN
)
BOL
EOL
FIG. 15: Axial load = f(axial deflection).
- EOL axial stiffness is 3 times lower than BOL one due to spring force relaxation that reduces the rod to grid interaction and the related fuel rod bundle stiffening effect.
4.2. Lateral stiffness The aim of this test (Fig. 16) is to determine the Lateral load = f (Lateral displacement) characteristic.
- EOL lateral stiffness at 10mm deflection is 2 times lower than BOL one due to spring force relaxation that reduces the rod to grid interaction and the related fuel rod bundle stiffening effect.
109
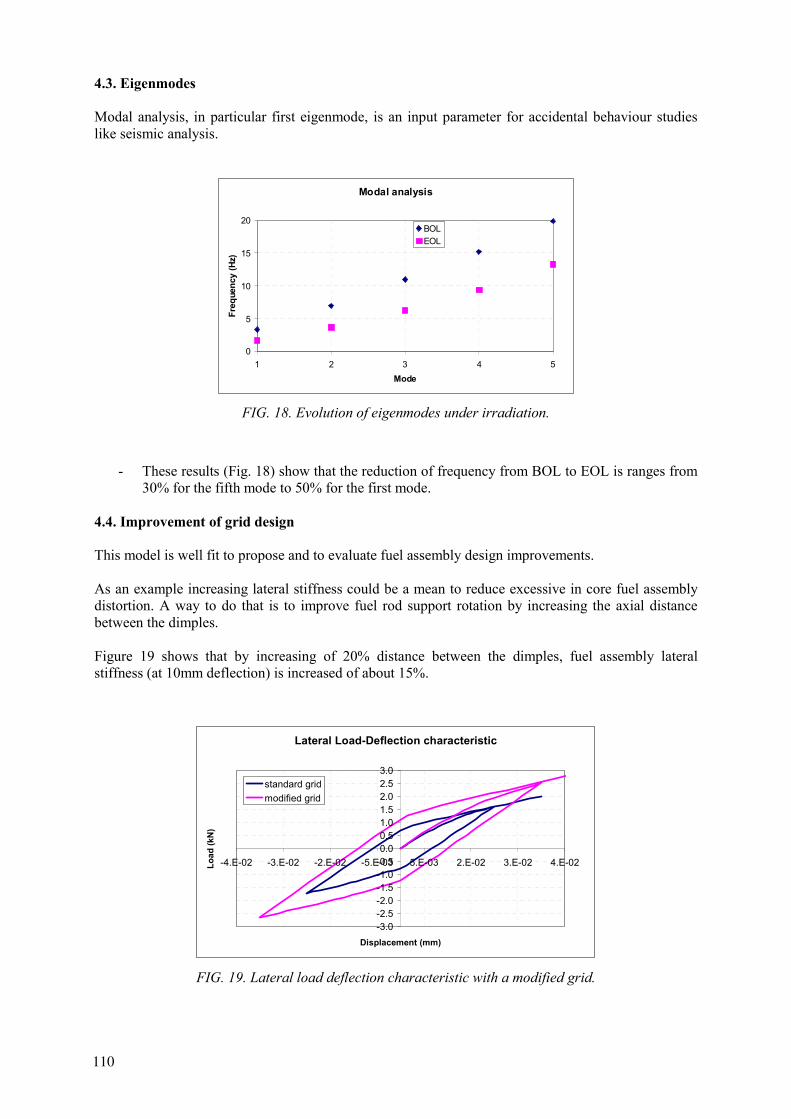
4.3. Eigenmodes Modal analysis, in particular first eigenmode, is an input parameter for accidental behaviour studies like seismic analysis.
Modal analysis
0
5
10
15
20
1 2 3 4 5Mode
Freq
uenc
y (H
z)BOLEOL
FIG. 18. Evolution of eigenmodes under irradiation.
- These results (Fig. 18) show that the reduction of frequency from BOL to EOL is ranges from 30% for the fifth mode to 50% for the first mode.
4.4. Improvement of grid design This model is well fit to propose and to evaluate fuel assembly design improvements. As an example increasing lateral stiffness could be a mean to reduce excessive in core fuel assembly distortion. A way to do that is to improve fuel rod support rotation by increasing the axial distance between the dimples. Figure 19 shows that by increasing of 20% distance between the dimples, fuel assembly lateral stiffness (at 10mm deflection) is increased of about 15%.
Lateral Load-Deflection characteristic
-3.0-2.5-2.0-1.5-1.0-0.50.00.51.01.52.02.53.0
-4.E-02 -3.E-02 -2.E-02 -5.E-03 5.E-03 2.E-02 3.E-02 4.E-02
Displacement (mm)
Load
(kN
)
standard gridmodified grid
FIG. 19. Lateral load deflection characteristic with a modified grid.
110
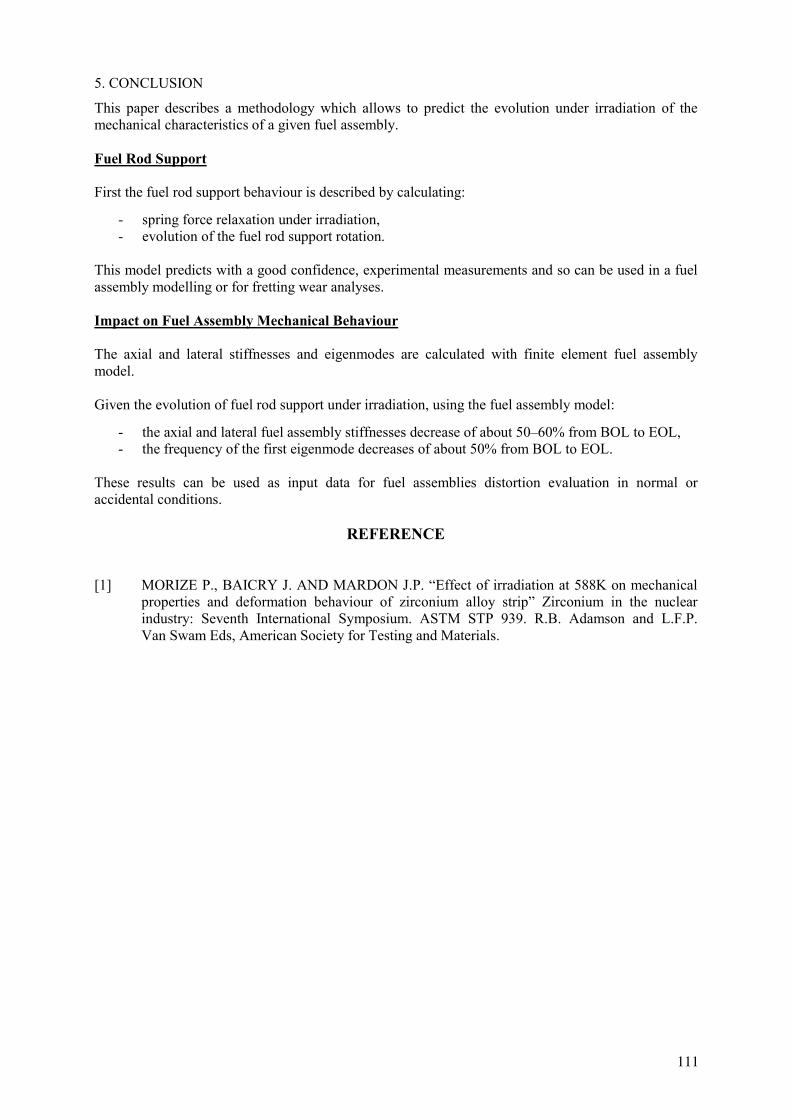
5. CONCLUSION
This paper describes a methodology which allows to predict the evolution under irradiation of the mechanical characteristics of a given fuel assembly. Fuel Rod Support First the fuel rod support behaviour is described by calculating:
- spring force relaxation under irradiation, - evolution of the fuel rod support rotation.
This model predicts with a good confidence, experimental measurements and so can be used in a fuel assembly modelling or for fretting wear analyses. Impact on Fuel Assembly Mechanical Behaviour The axial and lateral stiffnesses and eigenmodes are calculated with finite element fuel assembly model. Given the evolution of fuel rod support under irradiation, using the fuel assembly model:
- the axial and lateral fuel assembly stiffnesses decrease of about 50–60% from BOL to EOL, - the frequency of the first eigenmode decreases of about 50% from BOL to EOL.
These results can be used as input data for fuel assemblies distortion evaluation in normal or accidental conditions.
REFERENCE
[1] MORIZE P., BAICRY J. AND MARDON J.P. “Effect of irradiation at 588K on mechanical properties and deformation behaviour of zirconium alloy strip” Zirconium in the nuclear industry: Seventh International Symposium. ASTM STP 939. R.B. Adamson and L.F.P. Van Swam Eds, American Society for Testing and Materials.
111

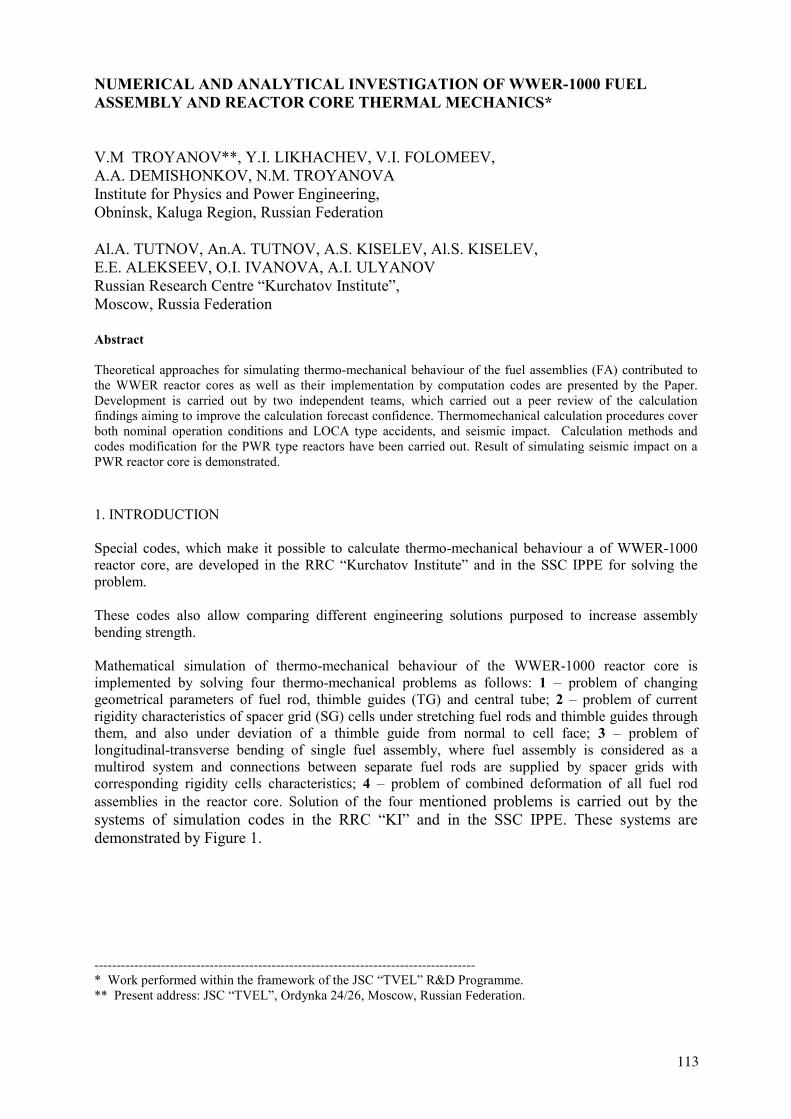
NUMERICAL AND ANALYTICAL INVESTIGATION OF WWER-1000 FUEL ASSEMBLY AND REACTOR CORE THERMAL MECHANICS* V.M TROYANOV**, Y.I. LIKHACHEV, V.I. FOLOMEEV, A.A. DEMISHONKOV, N.M. TROYANOVA Institute for Physics and Power Engineering, Obninsk, Kaluga Region, Russian Federation Al.A. TUTNOV, An.A. TUTNOV, A.S. KISELEV, Al.S. KISELEV, E.E. ALEKSEEV, O.I. IVANOVA, A.I. ULYANOV Russian Research Centre “Kurchatov Institute”, Moscow, Russia Federation Abstract Theoretical approaches for simulating thermo-mechanical behaviour of the fuel assemblies (FA) contributed to the WWER reactor cores as well as their implementation by computation codes are presented by the Paper. Development is carried out by two independent teams, which carried out a peer review of the calculation findings aiming to improve the calculation forecast confidence. Thermomechanical calculation procedures cover both nominal operation conditions and LOCA type accidents, and seismic impact. Calculation methods and codes modification for the PWR type reactors have been carried out. Result of simulating seismic impact on a PWR reactor core is demonstrated. 1. INTRODUCTION Special codes, which make it possible to calculate thermo-mechanical behaviour a of WWER-1000 reactor core, are developed in the RRC “Kurchatov Institute” and in the SSC IPPE for solving the problem. These codes also allow comparing different engineering solutions purposed to increase assembly bending strength. Mathematical simulation of thermo-mechanical behaviour of the WWER-1000 reactor core is implemented by solving four thermo-mechanical problems as follows: 1 – problem of changing geometrical parameters of fuel rod, thimble guides (TG) and central tube; 2 – problem of current rigidity characteristics of spacer grid (SG) cells under stretching fuel rods and thimble guides through them, and also under deviation of a thimble guide from normal to cell face; 3 – problem of longitudinal-transverse bending of single fuel assembly, where fuel assembly is considered as a multirod system and connections between separate fuel rods are supplied by spacer grids with corresponding rigidity cells characteristics; 4 – problem of combined deformation of all fuel rod assemblies in the reactor core. Solution of the four mentioned problems is carried out by the systems of simulation codes in the RRC “KI” and in the SSC IPPE. These systems are demonstrated by Figure 1.
-------------------------------------------------------------------------------------- * Work performed within the framework of the JSC “TVEL” R&D Programme. ** Present address: JSC “TVEL”, Ordynka 24/26, Moscow, Russian Federation.
113
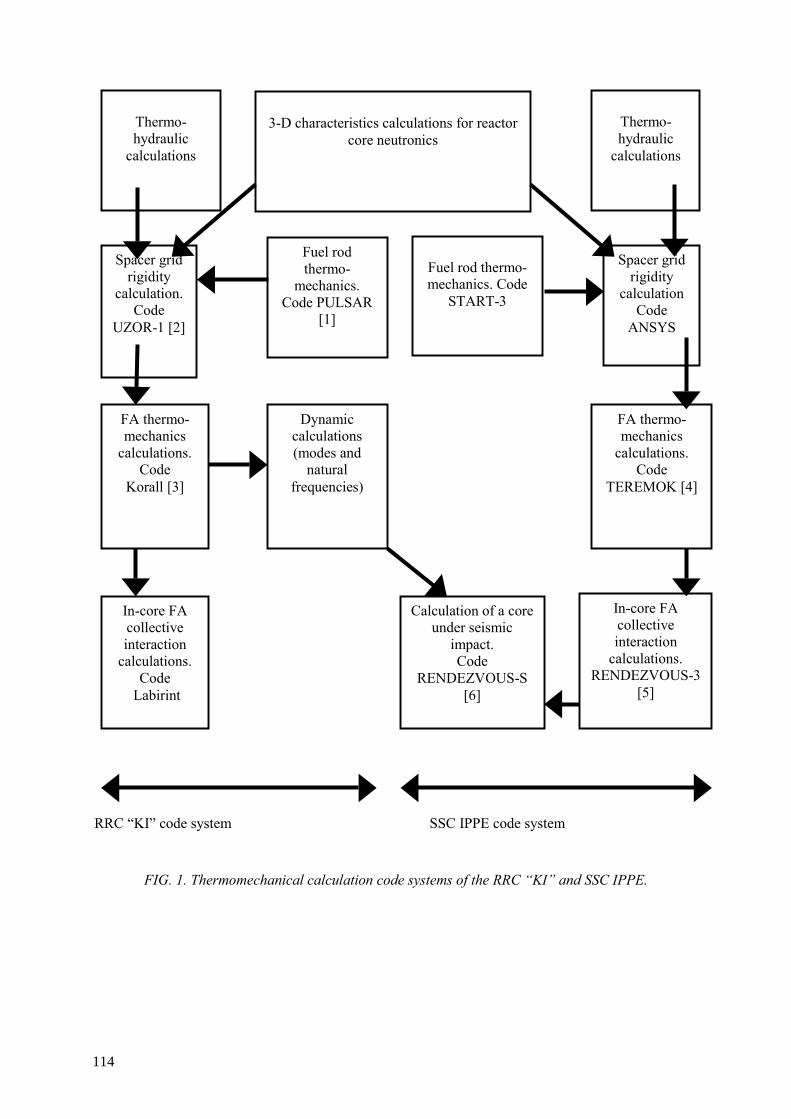
RRC “KI” code system SSC IPPE code system
FIG. 1. Thermomechanical calculation code systems of the RRC “KI” and SSC IPPE.
Thermo-hydraulic
calculations
Thermo-hydraulic
calculations
3-D characteristics calculations for reactor
core neutronics
Spacer grid rigidity
calculation.Code
UZOR-1 [2]
Fuel rod thermo-
mechanics. Code PULSAR
[1]
Spacer grid rigidity
calculationCode
ANSYS
Fuel rod thermo-mechanics. Code
START-3
FA thermo-mechanics
calculations. Code
Korall [3]
Dynamic calculations (modes and
natural frequencies)
FA thermo-mechanics
calculations. Code
TEREMOK [4]
In-core FA collective interaction
calculations. RENDEZVOUS-3
[5]
In-core FA collective interaction
calculations. Code
Labirint
Calculation of a core under seismic
impact. Code
RENDEZVOUS-S [6]
114
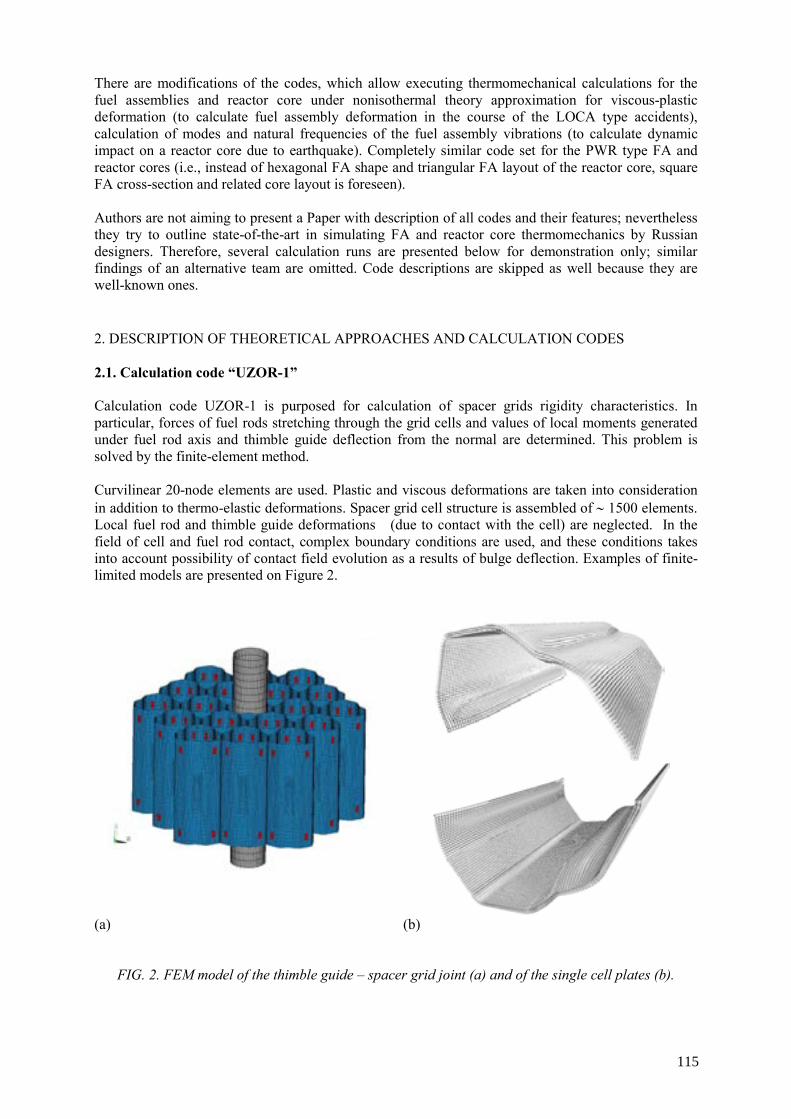
There are modifications of the codes, which allow executing thermomechanical calculations for the fuel assemblies and reactor core under nonisothermal theory approximation for viscous-plastic deformation (to calculate fuel assembly deformation in the course of the LOCA type accidents), calculation of modes and natural frequencies of the fuel assembly vibrations (to calculate dynamic impact on a reactor core due to earthquake). Completely similar code set for the PWR type FA and reactor cores (i.e., instead of hexagonal FA shape and triangular FA layout of the reactor core, square FA cross-section and related core layout is foreseen). Authors are not aiming to present a Paper with description of all codes and their features; nevertheless they try to outline state-of-the-art in simulating FA and reactor core thermomechanics by Russian designers. Therefore, several calculation runs are presented below for demonstration only; similar findings of an alternative team are omitted. Code descriptions are skipped as well because they are well-known ones. 2. DESCRIPTION OF THEORETICAL APPROACHES AND CALCULATION CODES 2.1. Calculation code “UZOR-1” Calculation code UZOR-1 is purposed for calculation of spacer grids rigidity characteristics. In particular, forces of fuel rods stretching through the grid cells and values of local moments generated under fuel rod axis and thimble guide deflection from the normal are determined. This problem is solved by the finite-element method. Curvilinear 20-node elements are used. Plastic and viscous deformations are taken into consideration in addition to thermo-elastic deformations. Spacer grid cell structure is assembled of ∼ 1500 elements. Local fuel rod and thimble guide deformations (due to contact with the cell) are neglected. In the field of cell and fuel rod contact, complex boundary conditions are used, and these conditions takes into account possibility of contact field evolution as a results of bulge deflection. Examples of finite-limited models are presented on Figure 2.
(a) (b)
FIG. 2. FEM model of the thimble guide – spacer grid joint (a) and of the single cell plates (b).
115
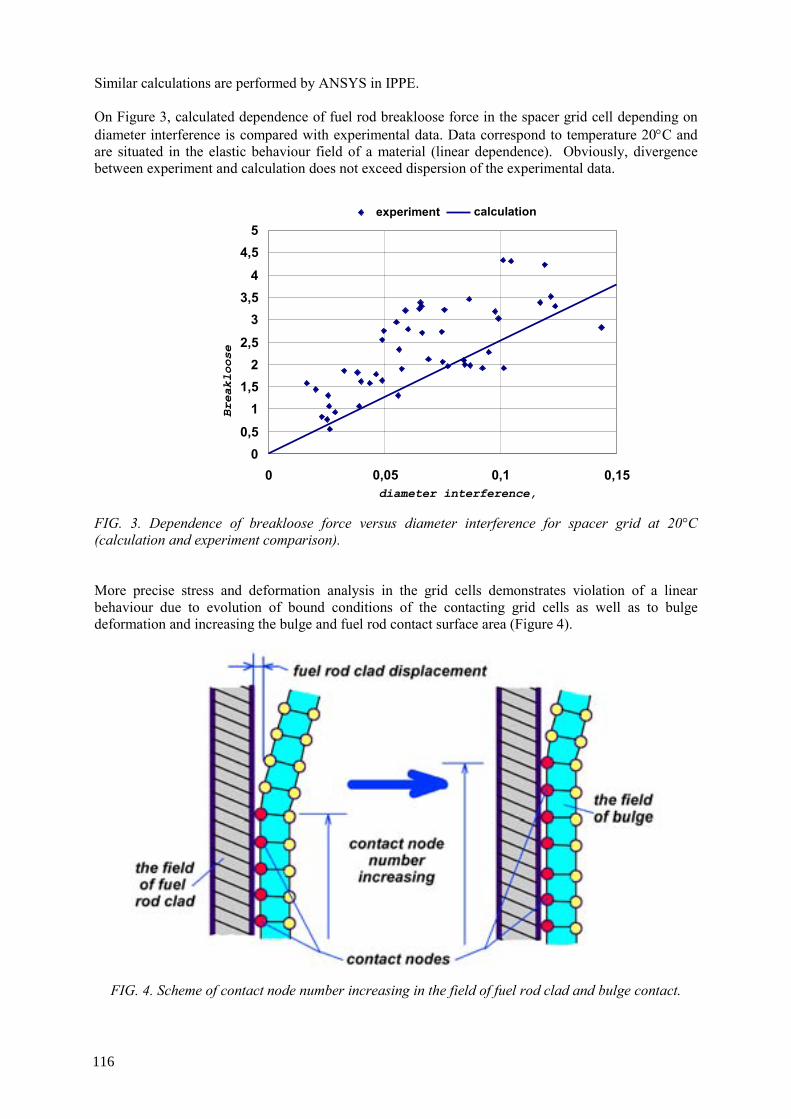
Similar calculations are performed by ANSYS in IPPE. On Figure 3, calculated dependence of fuel rod breakloose force in the spacer grid cell depending on diameter interference is compared with experimental data. Data correspond to temperature 20°C and are situated in the elastic behaviour field of a material (linear dependence). Obviously, divergence between experiment and calculation does not exceed dispersion of the experimental data.
FIG. 3. Dependence of breakloose force versus diameter interference for spacer grid at 20°C (calculation and experiment comparison). More precise stress and deformation analysis in the grid cells demonstrates violation of a linear behaviour due to evolution of bound conditions of the contacting grid cells as well as to bulge deformation and increasing the bulge and fuel rod contact surface area (Figure 4).
FIG. 4. Scheme of contact node number increasing in the field of fuel rod clad and bulge contact.
0
0,5
1
1,5
2
2,5
3
3,5
4
4,5
5
0 0,05 0,1 0,15 diameter interference,
Breakloose
fk
experiment calculation
116
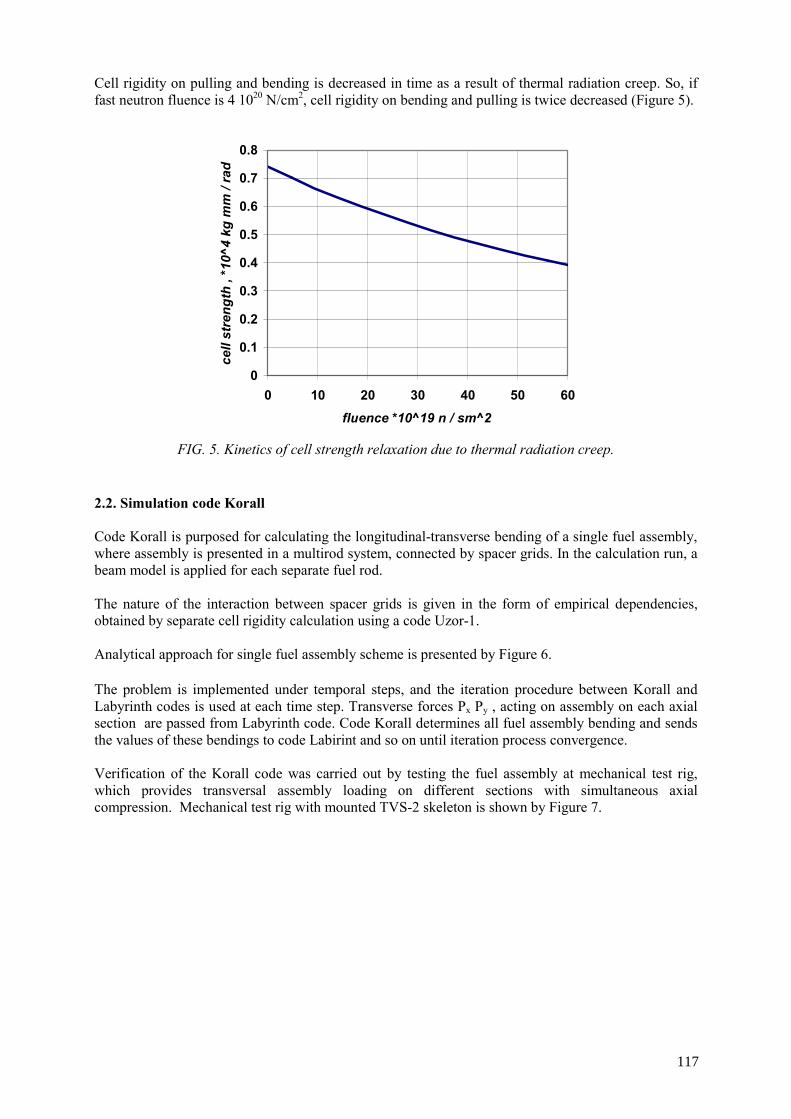
Cell rigidity on pulling and bending is decreased in time as a result of thermal radiation creep. So, if fast neutron fluence is 4 1020 N/cm2, cell rigidity on bending and pulling is twice decreased (Figure 5).
0
0.1
0.2
0.3
0.4
0.5
0.6
0.7
0.8
0 10 20 30 40 50 60fluence *10^19 n / sm^2
cell
stre
ngth
, *1
0^4
kg m
m /
rad
FIG. 5. Kinetics of cell strength relaxation due to thermal radiation creep.
2.2. Simulation code Korall Code Korall is purposed for calculating the longitudinal-transverse bending of a single fuel assembly, where assembly is presented in a multirod system, connected by spacer grids. In the calculation run, a beam model is applied for each separate fuel rod. The nature of the interaction between spacer grids is given in the form of empirical dependencies, obtained by separate cell rigidity calculation using a code Uzor-1. Analytical approach for single fuel assembly scheme is presented by Figure 6. The problem is implemented under temporal steps, and the iteration procedure between Korall and Labyrinth codes is used at each time step. Transverse forces Px Py , acting on assembly on each axial section are passed from Labyrinth code. Code Korall determines all fuel assembly bending and sends the values of these bendings to code Labirint and so on until iteration process convergence. Verification of the Korall code was carried out by testing the fuel assembly at mechanical test rig, which provides transversal assembly loading on different sections with simultaneous axial compression. Mechanical test rig with mounted TVS-2 skeleton is shown by Figure 7.
117
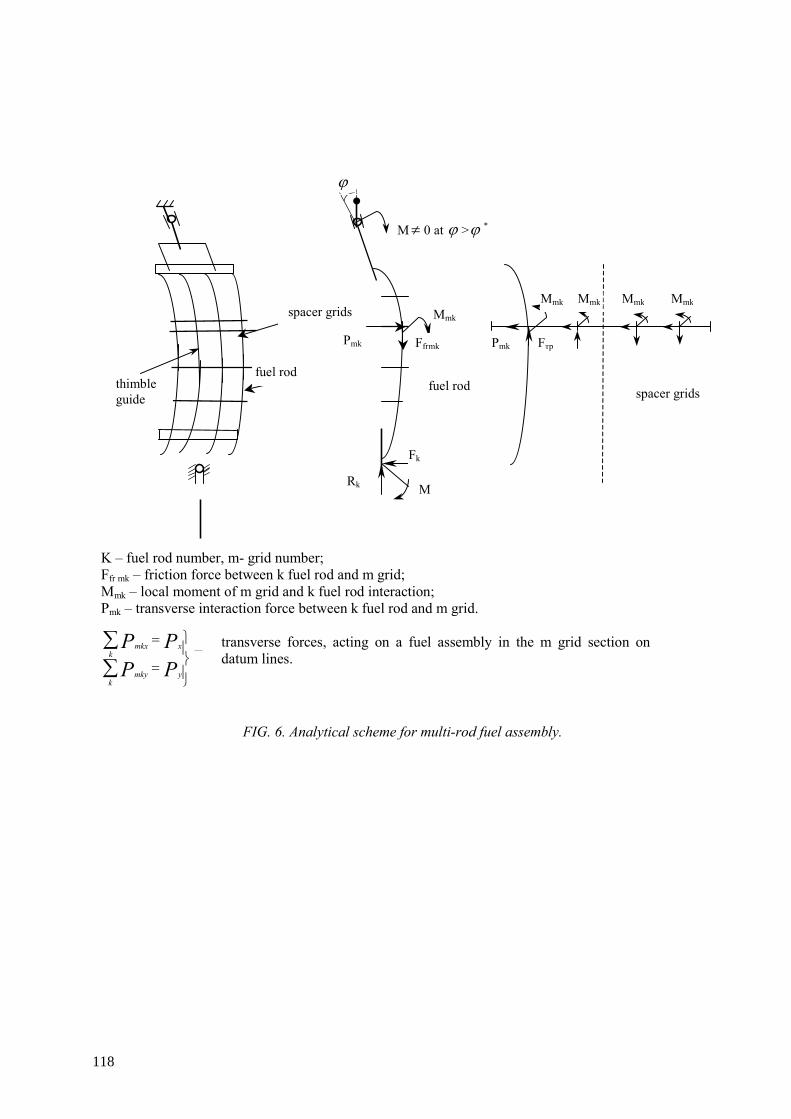
K – fuel rod number, m- grid number; Ffr mk – friction force between k fuel rod and m grid; Mmk – local moment of m grid and k fuel rod interaction; Pmk – transverse interaction force between k fuel rod and m grid.
=
=
∑∑
kуmkу
kxmkx
PPPP
transverse forces, acting on a fuel assembly in the m grid section on datum lines.
FIG. 6. Analytical scheme for multi-rod fuel assembly.
spacer grids
fuel rod spacer grids fuel rod
Mmk
Mmk Mmk Mmk Mmk
Rk
Fk
Pmk Ffrmk Pmk Fтр
thimble guide
ϕ
M≠ 0 at ϕ >ϕ *
M
118
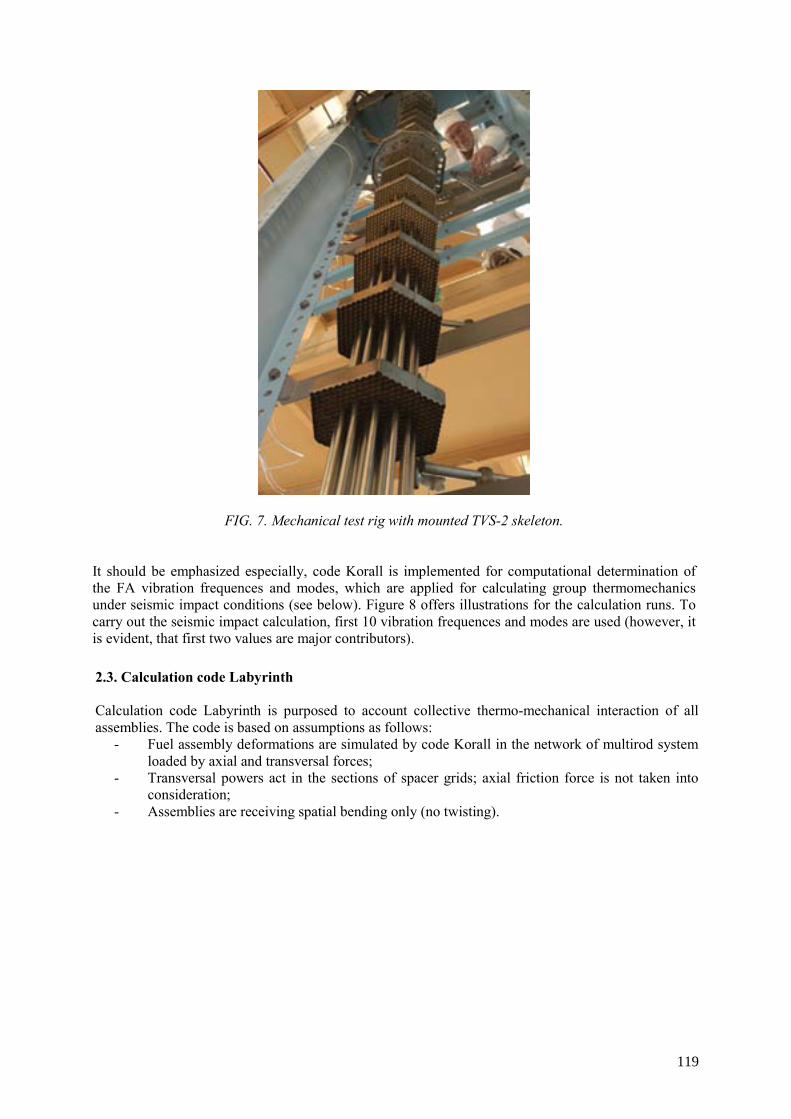
FIG. 7. Mechanical test rig with mounted TVS-2 skeleton. It should be emphasized especially, code Korall is implemented for computational determination of the FA vibration frequences and modes, which are applied for calculating group thermomechanics under seismic impact conditions (see below). Figure 8 offers illustrations for the calculation runs. To carry out the seismic impact calculation, first 10 vibration frequences and modes are used (however, it is evident, that first two values are major contributors). 2.3. Calculation code Labyrinth Calculation code Labyrinth is purposed to account collective thermo-mechanical interaction of all assemblies. The code is based on assumptions as follows:
- Fuel assembly deformations are simulated by code Korall in the network of multirod system loaded by axial and transversal forces;
- Transversal powers act in the sections of spacer grids; axial friction force is not taken into consideration;
- Assemblies are receiving spatial bending only (no twisting).
119
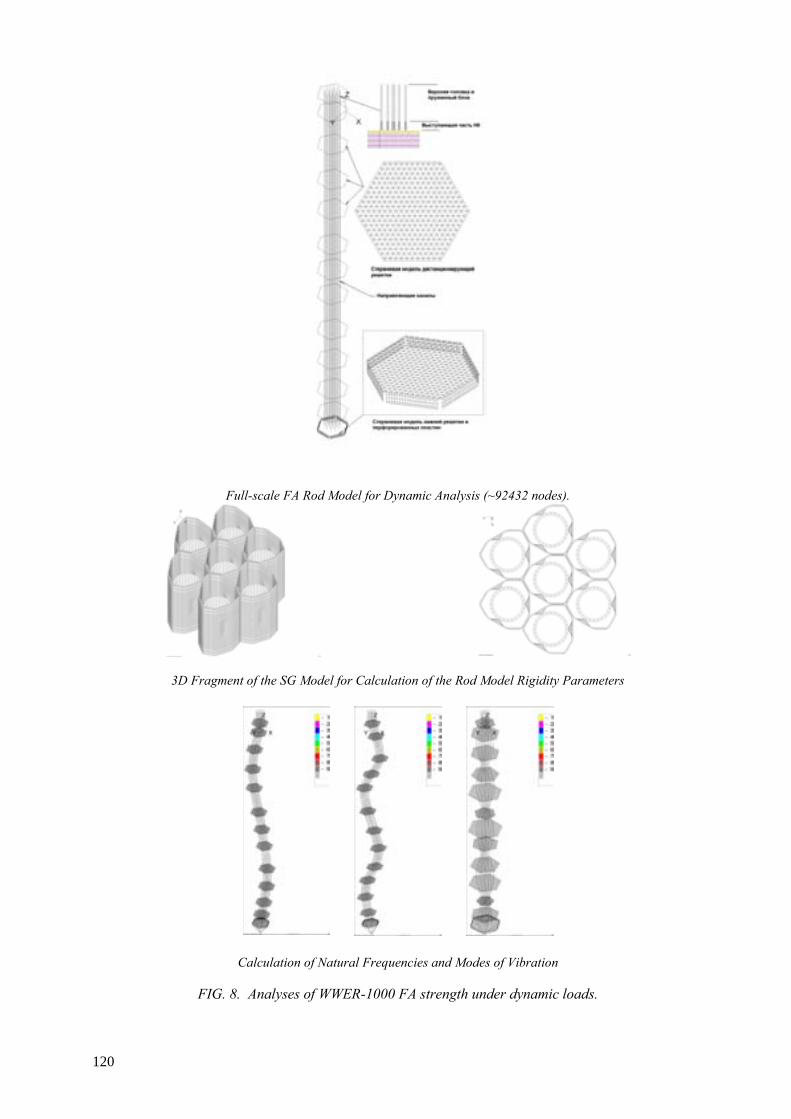
Full-scale FA Rod Model for Dynamic Analysis (~92432 nodes).
3D Fragment of the SG Model for Calculation of the Rod Model Rigidity Parameters
Calculation of Natural Frequencies and Modes of Vibration
FIG. 8. Analyses of WWER-1000 FA strength under dynamic loads.
120
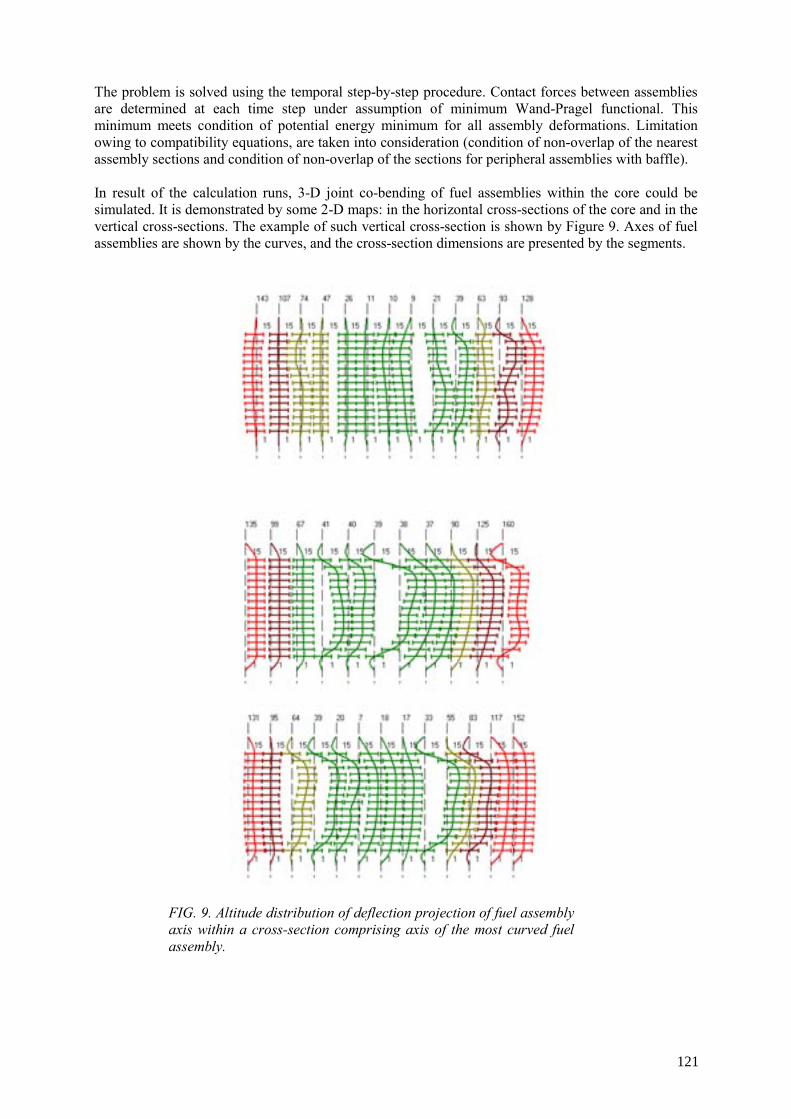
The problem is solved using the temporal step-by-step procedure. Contact forces between assemblies are determined at each time step under assumption of minimum Wand-Pragel functional. This minimum meets condition of potential energy minimum for all assembly deformations. Limitation owing to compatibility equations, are taken into consideration (condition of non-overlap of the nearest assembly sections and condition of non-overlap of the sections for peripheral assemblies with baffle). In result of the calculation runs, 3-D joint co-bending of fuel assemblies within the core could be simulated. It is demonstrated by some 2-D maps: in the horizontal cross-sections of the core and in the vertical cross-sections. The example of such vertical cross-section is shown by Figure 9. Axes of fuel assemblies are shown by the curves, and the cross-section dimensions are presented by the segments.
FIG. 9. Altitude distribution of deflection projection of fuel assembly axis within a cross-section comprising axis of the most curved fuel assembly.
121
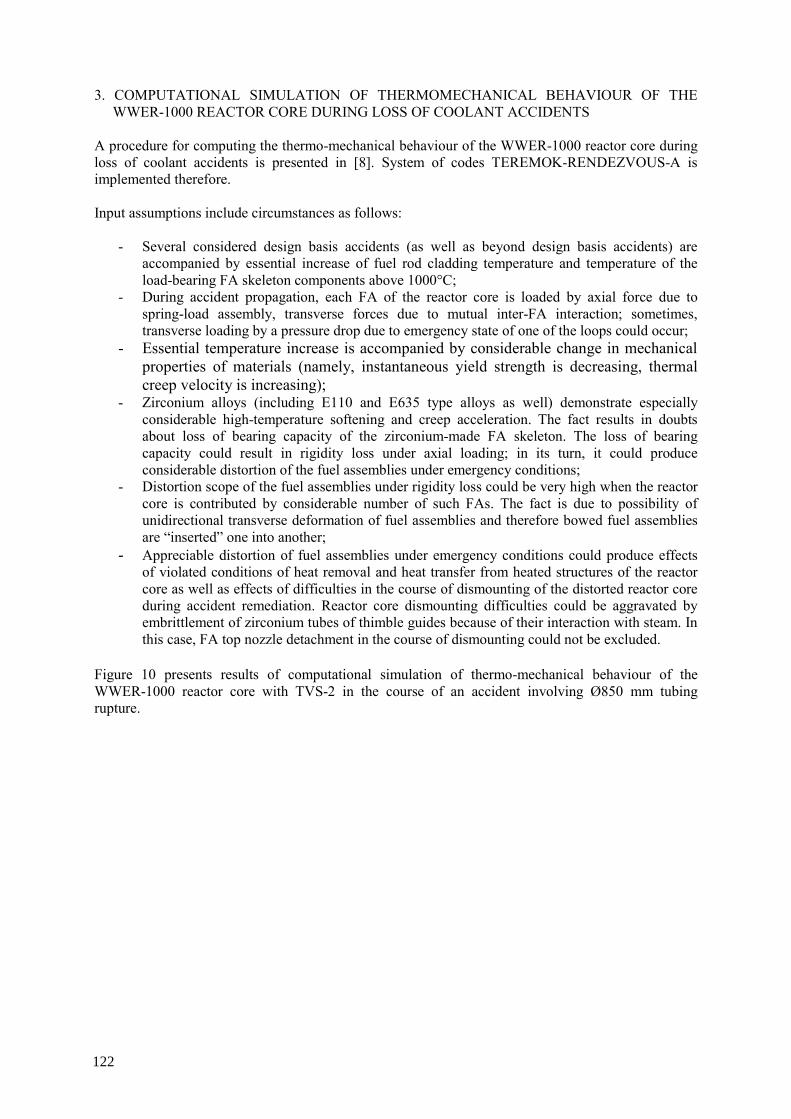
3. COMPUTATIONAL SIMULATION OF THERMOMECHANICAL BEHAVIOUR OF THE WWER-1000 REACTOR CORE DURING LOSS OF COOLANT ACCIDENTS A procedure for computing the thermo-mechanical behaviour of the WWER-1000 reactor core during loss of coolant accidents is presented in [8]. System of codes TEREMOK-RENDEZVOUS-A is implemented therefore. Input assumptions include circumstances as follows:
- Several considered design basis accidents (as well as beyond design basis accidents) are accompanied by essential increase of fuel rod cladding temperature and temperature of the load-bearing FA skeleton components above 1000°C;
- During accident propagation, each FA of the reactor core is loaded by axial force due to spring-load assembly, transverse forces due to mutual inter-FA interaction; sometimes, transverse loading by a pressure drop due to emergency state of one of the loops could occur;
- Essential temperature increase is accompanied by considerable change in mechanical properties of materials (namely, instantaneous yield strength is decreasing, thermal creep velocity is increasing);
- Zirconium alloys (including E110 and E635 type alloys as well) demonstrate especially considerable high-temperature softening and creep acceleration. The fact results in doubts about loss of bearing capacity of the zirconium-made FA skeleton. The loss of bearing capacity could result in rigidity loss under axial loading; in its turn, it could produce considerable distortion of the fuel assemblies under emergency conditions;
- Distortion scope of the fuel assemblies under rigidity loss could be very high when the reactor core is contributed by considerable number of such FAs. The fact is due to possibility of unidirectional transverse deformation of fuel assemblies and therefore bowed fuel assemblies are “inserted” one into another;
- Appreciable distortion of fuel assemblies under emergency conditions could produce effects of violated conditions of heat removal and heat transfer from heated structures of the reactor core as well as effects of difficulties in the course of dismounting of the distorted reactor core during accident remediation. Reactor core dismounting difficulties could be aggravated by embrittlement of zirconium tubes of thimble guides because of their interaction with steam. In this case, FA top nozzle detachment in the course of dismounting could not be excluded.
Figure 10 presents results of computational simulation of thermo-mechanical behaviour of the WWER-1000 reactor core with TVS-2 in the course of an accident involving Ø850 mm tubing rupture.
122
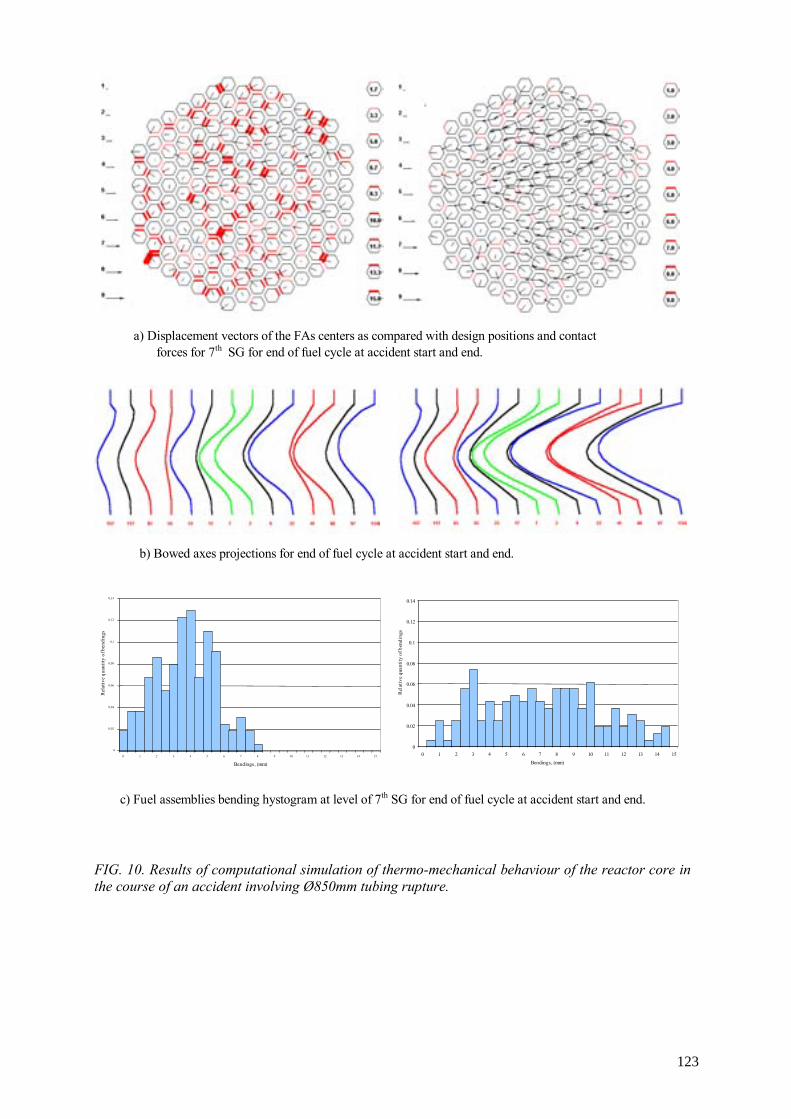
a) Displacement vectors of the FAs centers as compared with design positions and contact forces for 7th SG for end of fuel cycle at accident start and end.
b) Bowed axes projections for end of fuel cycle at accident start and end.
0 0,02 0,04 0,06 0,08
0,1 0,12 0,14
0 1 2 3 4 5 6 7 8 9 10 11 12 13 14 15
Bendings, (mm)
Rel
ativ
e qu
antit
y of
ben
ding
s
c) Fuel assemblies bending hystogram at level of 7th SG for end of fuel cycle at accident start and end.
0
0.02
0.04
0.06
0.08
0.1
0.12
0.14
0 1 2 3 4 5 6 7 8 9 10 11 12 13 14 15Bendings, (mm)
Rel
ativ
e qu
antit
y of
ben
ding
s
FIG. 10. Results of computational simulation of thermo-mechanical behaviour of the reactor core in the course of an accident involving Ø850mm tubing rupture.
123
4. CALCULATION OF HORIZONTAL SEISMIC IMPACT ON THE WWER-1000 REACTOR CORE: METHODS AND RESULTS Horizontal direction of ramp loading is most danger for a reactor core during seismic impact on an NPP. Horizontal seismic impact on the reactor core results in co-deformation of an FA ensemble within limits of gaps between SGs of individual FAs and between SGs of peripheral FAs and core compartment enclosure. FAs are bending by seismic load in specific direction and are agglomerated near the compartment enclosure; therefore, outermost FA becomes most loaded one. FA-compressing forces could generate overtolerance deformation of spacer grids, fuel rods or thimble guides. Therefore, it is mandatory issue to determine possible forces compressing FAs under different seismic impacts on the reactor core. To estimate horizontal seismic impact on the WWER-1000 reactor core contributed by TVS-2 with rigid skeleton of TGs and SGs, effects of an earthquake during end of cycle for a 4-year steady-state fuel cycle have been calculated [7]. System of codes TEREMOK-RENDEZVOUS-S is implemented therefore. Deformation of an ensemble of FAs (contributing to the reactor core) by seismic loading has been computed after a version of RENDEZVOUS-S code with account of initial state of the reactor core. Fuel assembly bowing, inter-FA interaction forces, state of the FAs at pre-earthquake moment have been accounted. Seismic deformation of the reactor core fuel assemblies has been considered for two shock directions:
- For OX axis if seismic loads are effecting along a corner-corner line of the fuel assembly; - For OY axis if seismic loads are effecting along a line, which is perpendicular to fuel
assembly faces. Calculation runs have been carried out for deformation of the WWER-1000 reactor fuel assembly
ensemble by seismic loads of different intensity for several values of effective acceleration ••
ϕ from 0.25g to 2.0g. Figures 11 - 12 presents calculation run findings for effective acceleration under seismic
impact ••
ϕ = 1.0g. The calculation runs demonstrated that TVS-2 strength ensures fuel assembly
integrity and reactor safety for effective acceleration ••
ϕ less then 1.75g.
124
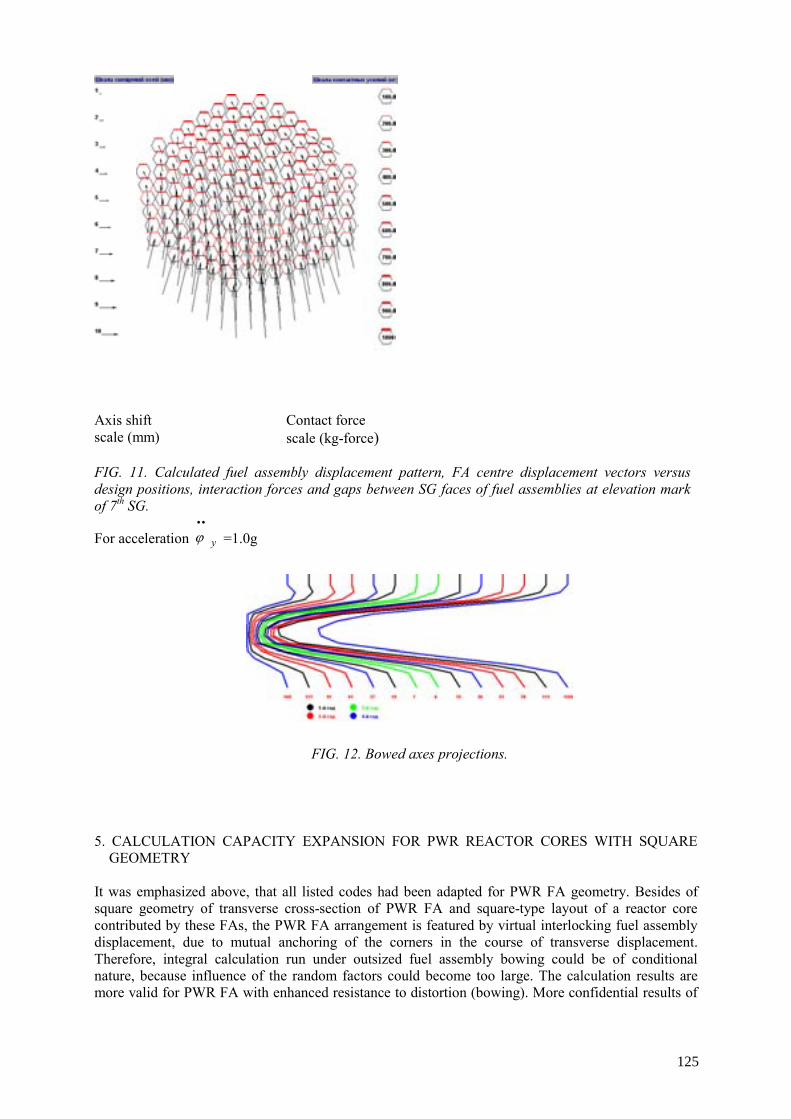
Axis shift scale (mm)
Contact force scale (kg-force)
FIG. 11. Calculated fuel assembly displacement pattern, FA centre displacement vectors versus design positions, interaction forces and gaps between SG faces of fuel assemblies at elevation mark of 7th SG.
For acceleration y
••
ϕ =1.0g
FIG. 12. Bowed axes projections.
5. CALCULATION CAPACITY EXPANSION FOR PWR REACTOR CORES WITH SQUARE GEOMETRY It was emphasized above, that all listed codes had been adapted for PWR FA geometry. Besides of square geometry of transverse cross-section of PWR FA and square-type layout of a reactor core contributed by these FAs, the PWR FA arrangement is featured by virtual interlocking fuel assembly displacement, due to mutual anchoring of the corners in the course of transverse displacement. Therefore, integral calculation run under outsized fuel assembly bowing could be of conditional nature, because influence of the random factors could become too large. The calculation results are more valid for PWR FA with enhanced resistance to distortion (bowing). More confidential results of
125
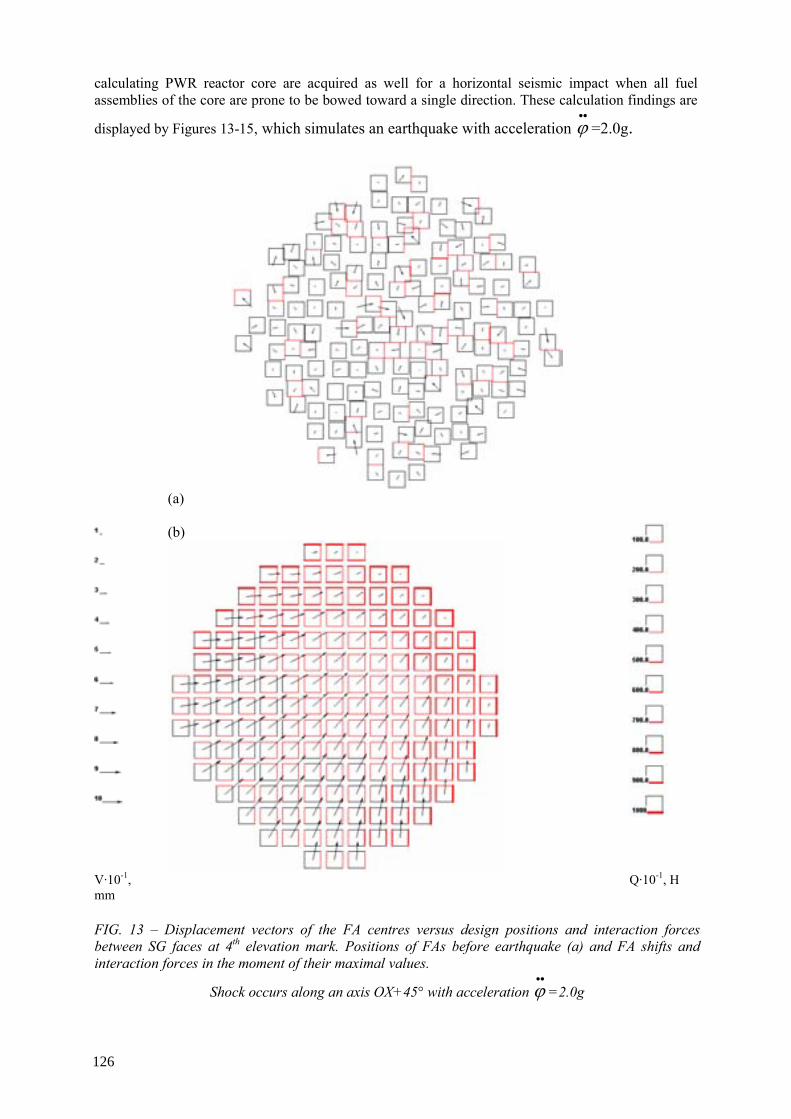
calculating PWR reactor core are acquired as well for a horizontal seismic impact when all fuel assemblies of the core are prone to be bowed toward a single direction. These calculation findings are
displayed by Figures 13-15, which simulates an earthquake with acceleration ••
ϕ =2.0g.
(a)
(b)
V·10-1, mm
Q·10-1, Н
FIG. 13 – Displacement vectors of the FA centres versus design positions and interaction forces between SG faces at 4th elevation mark. Positions of FAs before earthquake (a) and FA shifts and interaction forces in the moment of their maximal values.
Shock occurs along an axis OX+45° with acceleration ••
ϕ =2.0g
126
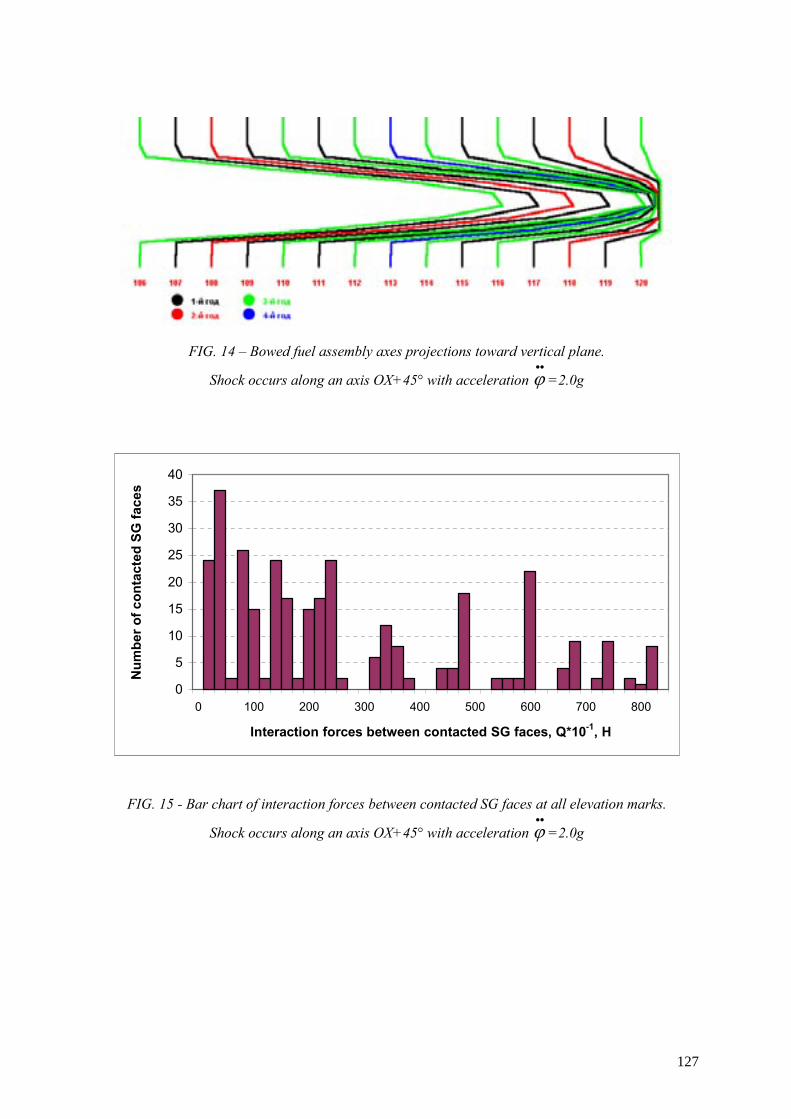
FIG. 14 – Bowed fuel assembly axes projections toward vertical plane.
Shock occurs along an axis OX+45° with acceleration ••
ϕ =2.0g
0
5
10
15
20
25
30
35
40
0 100 200 300 400 500 600 700 800
Interaction forces between contacted SG faces, Q*10-1, Н
Num
ber o
f con
tact
ed S
G fa
ces
FIG. 15 - Bar chart of interaction forces between contacted SG faces at all elevation marks.
Shock occurs along an axis OX+45° with acceleration ••
ϕ =2.0g
127
REFERENCES [1] An. TUTNOV, Al. TUTNOV, E. ALEXEEV. Probability analysis of WWER-1000 fuel
elements behaviour under short-time heat power jumps in the end of 4th year operation. Proceedings of the 3rd International Seminar: WWER Fuel Performance, Modelling and Experimental Support (1999) Bulgaria, pp.189–193.
[2] A. TUTNOV, E. ALEXEEV. Probability Analysis of WWER-1000 Fuel Elements Behaviour under Steady-State, Transient and Accident Conditions of Reactor Operation. Proceedings of the 4-th Int. Conf. WWER Fuel Performance, Modelling and Experimental Support (2001) pp. 229–235.
[3] An.A. Tutnov, A.A. Tutnov, A.I. Ulyanov, “PULSAR-2: Mathematical Simulation of Thermal-Physical and Thermal-Mechanical Processes in Fuel Elements of Reactors”; Atomnaya Energiya (1994) v. 76, issue 5, p. 411–417.
[4] V.TROYANOV, YU. LIKHACHEV, V. FOLOMEEV The Procedure of Computing Thermo-mechanical Behaviour of the WWER-1000 Reactor’s Canless FA. Izvestiya Vuzov. Yadernaya Energetika, 2, p. 44–53 (2002).
[5] V. TROYANOV, Yu. LIKHACHEV, V. FOLOMEEV, “Structure Mechanics of WWER Fuel Assemblies: Geometrical Stability and Behaviour under Irradiation”, Proc. of the International Symposium “Fontevraud 5” September 23-27, 2002, Vol. 1, p.579–589, France (2002).
[6] V. TROYANOV, Yu. LIKHACHEV, V. FOLOMEEV. “ A Procedure for Calculating Seismic Impact on a WWER-1000 Reactor Core”, Izvestiya Vuzov. Yadernaya Energetika, 3, pp.26–33 (2002).
[7] V. TROYANOV, Yu. LIKHACHEV, V. FOLOMEEV “Computer-Aided Simulation of Thermo-mechanical Behaviour of the WWER-1000 Reactor Core during Loss of Coolant Accidents”, Izvestiya Vuzov. Yadernaya Energetika, 3, pp.19–25 (2002).
128
A DECADE OF ASSEMBLY BOW MANAGEMENT AT RINGHALS T. ANDERSSON Ringhals AB, Väröbacka, Sweden
J. ALMBERGER, L. BJÖRNKVIST Vattenfall Bränsle AB, Stockholm, Sweden Abstract Since Incomplete Rod Insertion (IRI) was first observed at Ringhals 4 in 1994 and the associated collective assembly bow, a large number of fuel assembly modifications have been introduced to counteract the bow. The paper describes the long-term effectiveness of these countermeasures and the way assembly bow is accounted for in the safety analyses. As a result of the design modifications, the core average and maximum assembly bow have been reduced considerably. Extensive evaluations of the bow’s impact on the safety analyses have shown that measured bows up to 17 mm are acceptable for Ringhals 2 and up to 13 mm for Ringhals 3 and 4.
1. INTRODUCTION At Ringhals Vattenfall operates three Westinghouse 3-loop PWRs. The thermal ratings of the Ringhals PWR plants are the following:
- Ringhals 2: 15×15 lattice, 2652 MWth, - Ringhals 3: 17×17 lattice, 2775 MWth, - Ringhals 4: 17×17 lattice, 2775 MWth.
All of the Ringhals PWRs have been affected by collective assembly bow. The problem was first discovered in 1994 at Ringhals 4 when one of the control rods didn’t fully insert during a reactor trip. Root cause investigation showed that the incomplete rod insertion (IRI) was caused by increased friction between the control rod and the assembly’s guide thimbles. During the fuel inspection it was found that the fuel assembly of occurrence had an S-shaped bow measuring 20 mm. It was also revealed that the whole core was affected by assembly bow. Global or collective assembly bow is hence defined as a bow pattern affecting all the fuel assemblies of the core.
In 2000, collective assembly bow was observed for the first time at Ringhals 2. No signs of excessive assembly bow were found on previous fuel inspections. A large quadrant power tilt indicated the emergence of collective assembly bow as shown in fig. 1. Quadrant power tilt is the ratio of the power in the quadrant with highest power to the average quadrant power. The relationship between assembly bow and power tilt was also evident on Ringhals 3 and 4.
129

0,99
0,995
1
1,005
1,01
1,015
1,02
1,025
1,03
1,035
0 5 10 15Cycle burnup, MWd/kgU
Qua
dran
t Pow
er T
ilt
Cycle 22 - before collective bow
Cycle 23 - onset of collective bow
Cycle 25 - fully developed collective bow
Cycle 24 - fully developed collective bow
FIG. 1. Ringhals 2 – Quadrant power tilt as a function of burnup.
The average/nominal gap between the assemblies in the core is 2 mm. As a result of the collective bow, a gap size distribution is formed with gap sizes ranging from zero to a size much larger than the nominal gap. Since the lattice is under-moderated, local power will increase where gaps are large and hence collective bow causes a redistribution of power.
The large quadrant power tilts at Ringhals 2 has led to load follow restrictions to avoid violations of the technical specification’s tilt requirements.
2. FUEL INSPECTION AND ANALYSIS Fuel suppliers and fuel types since the detection of collective bow are shown in table 1.
Ringhals 2 Ringhals ¾ Period Supplier Fuel type Supplier Fuel type 92-94 Siemens Focus Fregema AFA 95-98 Westinghouse Performance
+ Fragema AFA-2G
99-02 Westinghouse Performance+
Fragema AFA-3G
03-06 FANP AFA-3G FANP HTP
Table 1: Fuel suppliers and fuel types of the Ringhals PWRs
Typically 20 fuel assemblies are bow-measured during each refueling outage on all units. The direction and shape of the bow differs between the plants as shown in fig. 2, 3 and 4. S-shaped bow dominates at Ringhals 4 while C-shaped bow is in domination at Ringhals 2 and 3. The two types of bow are often combined. For a given bow amplitude, S-shaped bow has a smaller bending radius and hence represents a larger risk for IRI in comparison with C-bow.
130

-10 -5 0 5 10Assembly Bow (mm)
x-direction
y-direction
FIG. 3. Ringhals 4 – Example of S-shaped assembly bow.
-10 -5 0 5 10
Assembly Bow (mm)
Ass
embl
y he
ight
FIG. 4. Ringhals 3 - Example of C-shaped assembly bow.
With a mechanistic model the measured bow distribution is extended to a full core water gap distribution taking into account the mechanical interaction between all fuel assemblies. To calculate the power perturbations caused by the water gaps, the water gap distribution is input to the In-Core Fuel Management code package. Comparisons with nominal conditions show that the largest impact of the gaps occurs at the beginning of cycle at the interface between fresh fuel assemblies (straight) and older assemblies (bowed). The fixed orientation of the assemblies during refueling prevents the formation of gaps by adjacent assemblies with opposite direction of bow. The assembly bow pattern at the end of cycle is relatively stable. Despite the reshuffling of the fuel assemblies during refueling and the insertion of replacement fuel, the magnitude and direction of bow for a given core position, as seen in fig. 2, has remained fairly constant at end of cycle.
131
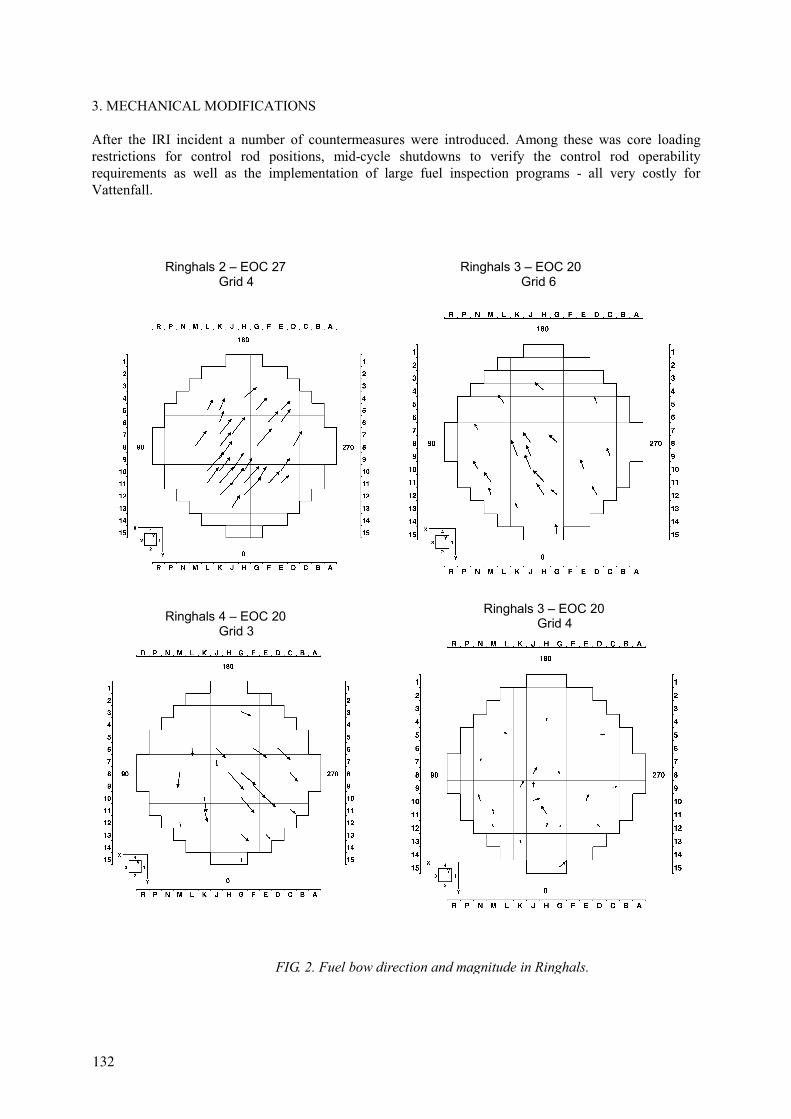
3. MECHANICAL MODIFICATIONS After the IRI incident a number of countermeasures were introduced. Among these was core loading restrictions for control rod positions, mid-cycle shutdowns to verify the control rod operability requirements as well as the implementation of large fuel inspection programs - all very costly for Vattenfall.
Ringhals 2 – EOC 27 Grid 4
Ringhals 3 – EOC 20 Grid 6
Ringhals 4 – EOC 20 Grid 3
Ringhals 3 – EOC 20 Grid 4
FIG. 2. Fuel bow direction and magnitude in Ringhals.
132
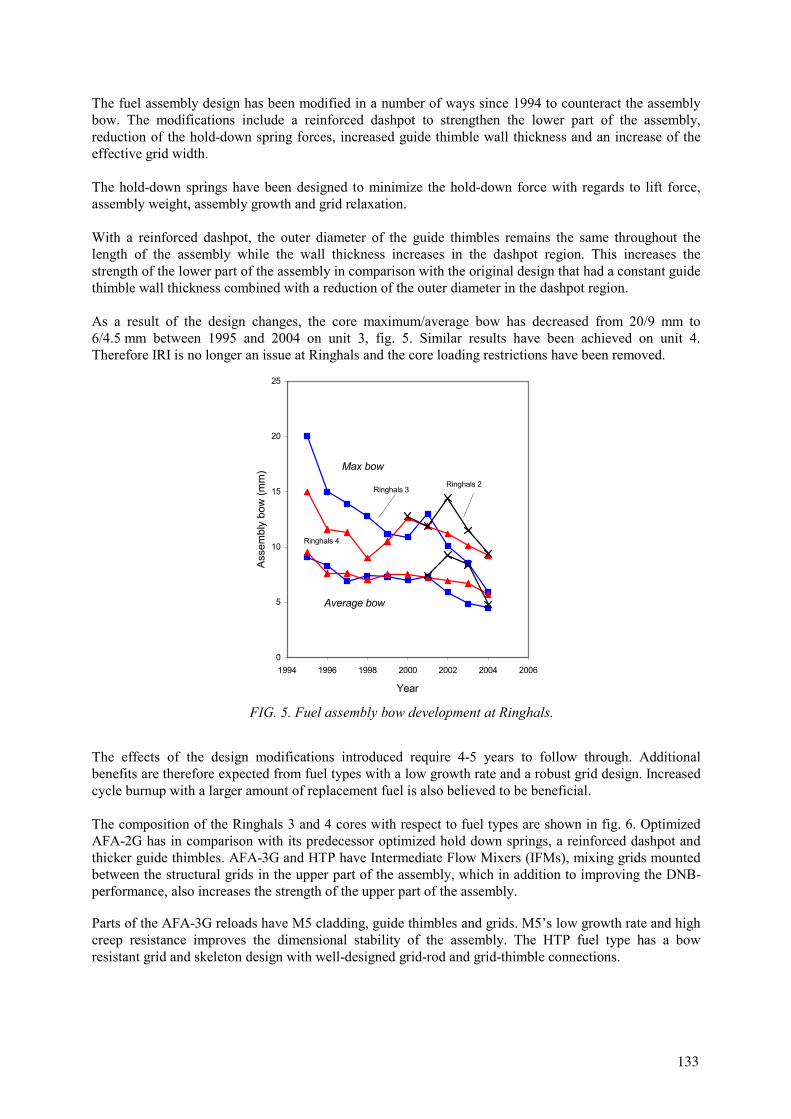
The fuel assembly design has been modified in a number of ways since 1994 to counteract the assembly bow. The modifications include a reinforced dashpot to strengthen the lower part of the assembly, reduction of the hold-down spring forces, increased guide thimble wall thickness and an increase of the effective grid width. The hold-down springs have been designed to minimize the hold-down force with regards to lift force, assembly weight, assembly growth and grid relaxation. With a reinforced dashpot, the outer diameter of the guide thimbles remains the same throughout the length of the assembly while the wall thickness increases in the dashpot region. This increases the strength of the lower part of the assembly in comparison with the original design that had a constant guide thimble wall thickness combined with a reduction of the outer diameter in the dashpot region. As a result of the design changes, the core maximum/average bow has decreased from 20/9 mm to 6/4.5 mm between 1995 and 2004 on unit 3, fig. 5. Similar results have been achieved on unit 4. Therefore IRI is no longer an issue at Ringhals and the core loading restrictions have been removed.
0
5
10
15
20
25
1994 1996 1998 2000 2002 2004 2006
Year
Ass
embl
y bo
w (m
m)
Ringhals 3
Ringhals 4
Max bow
Average bow
Ringhals 2
FIG. 5. Fuel assembly bow development at Ringhals.
The effects of the design modifications introduced require 4-5 years to follow through. Additional benefits are therefore expected from fuel types with a low growth rate and a robust grid design. Increased cycle burnup with a larger amount of replacement fuel is also believed to be beneficial.
The composition of the Ringhals 3 and 4 cores with respect to fuel types are shown in fig. 6. Optimized AFA-2G has in comparison with its predecessor optimized hold down springs, a reinforced dashpot and thicker guide thimbles. AFA-3G and HTP have Intermediate Flow Mixers (IFMs), mixing grids mounted between the structural grids in the upper part of the assembly, which in addition to improving the DNB-performance, also increases the strength of the upper part of the assembly.
133
Parts of the AFA-3G reloads have M5 cladding, guide thimbles and grids. M5’s low growth rate and high creep resistance improves the dimensional stability of the assembly. The HTP fuel type has a bow resistant grid and skeleton design with well-designed grid-rod and grid-thimble connections.
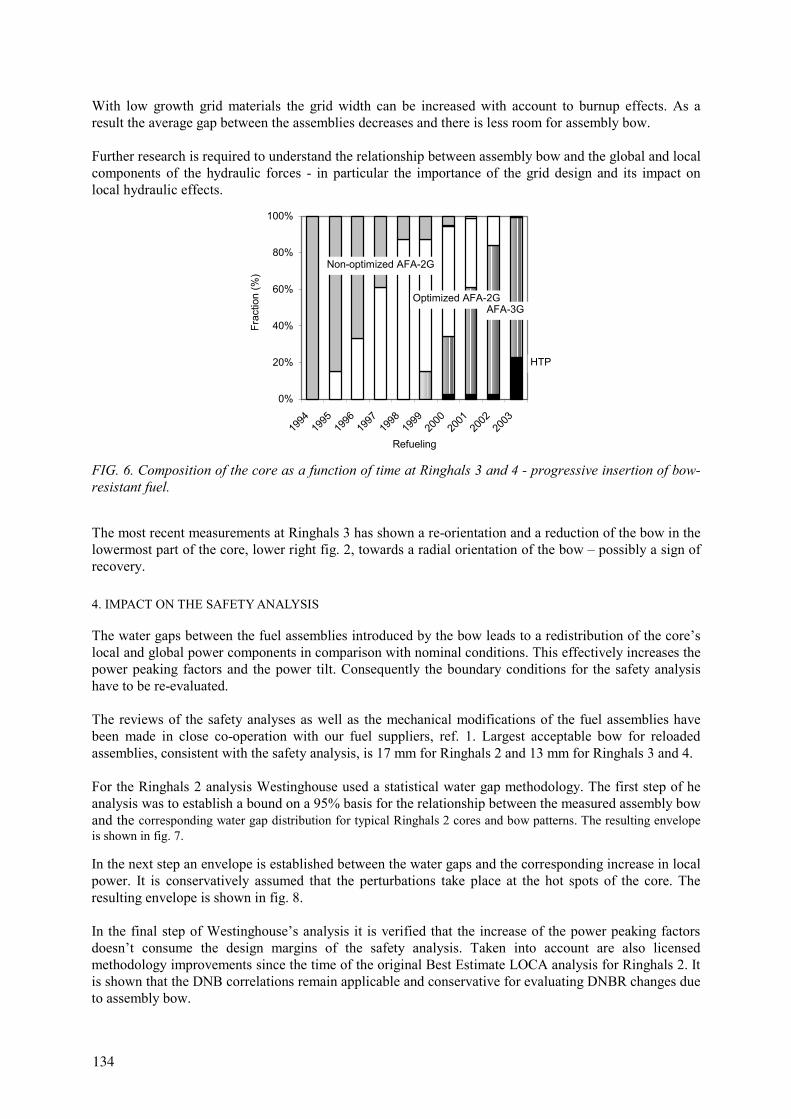
With low growth grid materials the grid width can be increased with account to burnup effects. As a result the average gap between the assemblies decreases and there is less room for assembly bow.
Further research is required to understand the relationship between assembly bow and the global and local components of the hydraulic forces - in particular the importance of the grid design and its impact on local hydraulic effects.
0%
20%
40%
60%
80%
100%
1994
1995
1996
1997
1998
1999
2000
2001
2002
2003
Refueling
Frac
tion
(%)
Non-optimized AFA-2G
Optimized AFA-2GAFA-3G
HTP
FIG. 6. Composition of the core as a function of time at Ringhals 3 and 4 - progressive insertion of bow-resistant fuel.
The most recent measurements at Ringhals 3 has shown a re-orientation and a reduction of the bow in the lowermost part of the core, lower right fig. 2, towards a radial orientation of the bow – possibly a sign of recovery. 4. IMPACT ON THE SAFETY ANALYSIS
The water gaps between the fuel assemblies introduced by the bow leads to a redistribution of the core’s local and global power components in comparison with nominal conditions. This effectively increases the power peaking factors and the power tilt. Consequently the boundary conditions for the safety analysis have to be re-evaluated. The reviews of the safety analyses as well as the mechanical modifications of the fuel assemblies have been made in close co-operation with our fuel suppliers, ref. 1. Largest acceptable bow for reloaded assemblies, consistent with the safety analysis, is 17 mm for Ringhals 2 and 13 mm for Ringhals 3 and 4. For the Ringhals 2 analysis Westinghouse used a statistical water gap methodology. The first step of he analysis was to establish a bound on a 95% basis for the relationship between the measured assembly bow and the corresponding water gap distribution for typical Ringhals 2 cores and bow patterns. The resulting envelope is shown in fig. 7.
134
In the next step an envelope is established between the water gaps and the corresponding increase in local power. It is conservatively assumed that the perturbations take place at the hot spots of the core. The resulting envelope is shown in fig. 8. In the final step of Westinghouse’s analysis it is verified that the increase of the power peaking factors doesn’t consume the design margins of the safety analysis. Taken into account are also licensed methodology improvements since the time of the original Best Estimate LOCA analysis for Ringhals 2. It is shown that the DNB correlations remain applicable and conservative for evaluating DNBR changes due to assembly bow.
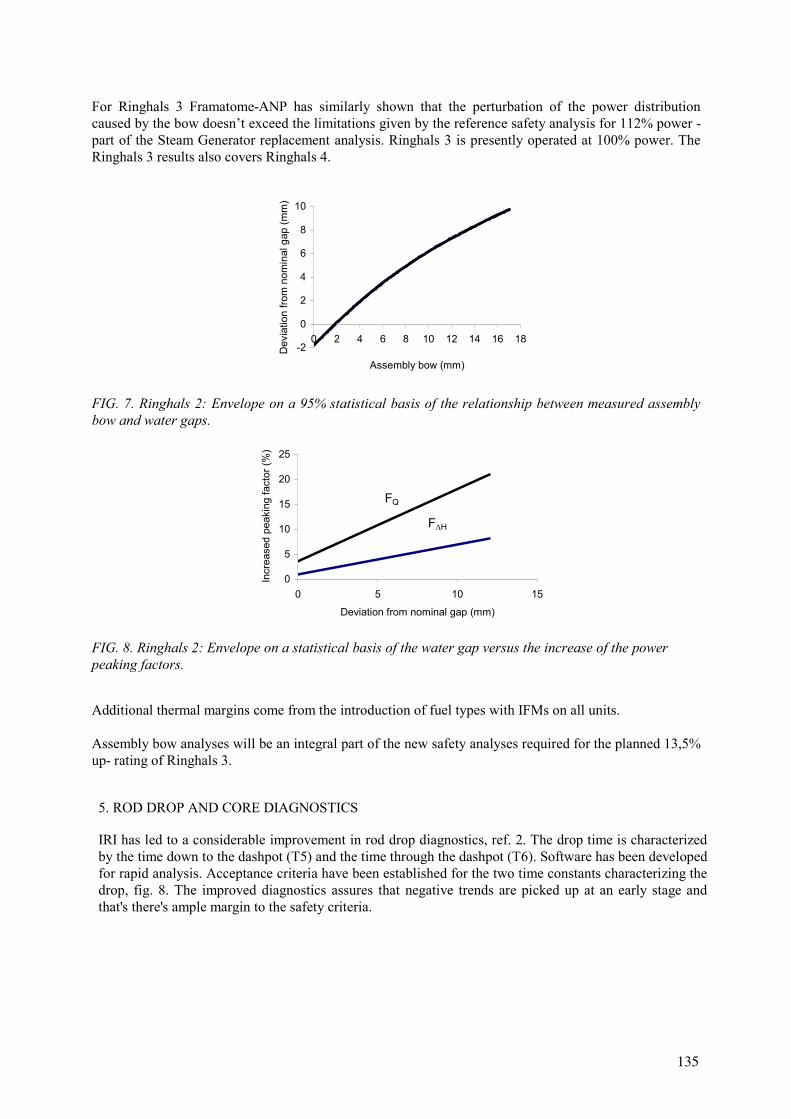
For Ringhals 3 Framatome-ANP has similarly shown that the perturbation of the power distribution caused by the bow doesn’t exceed the limitations given by the reference safety analysis for 112% power - part of the Steam Generator replacement analysis. Ringhals 3 is presently operated at 100% power. The Ringhals 3 results also covers Ringhals 4.
-2
0
2
4
6
8
10
0 2 4 6 8 10 12 14 16 18
Assembly bow (mm)
Dev
iatio
n fro
m n
omin
al g
ap (m
m)
FIG. 7. Ringhals 2: Envelope on a 95% statistical basis of the relationship between measured assembly bow and water gaps.
0
5
10
15
20
25
0 5 10 15
Deviation from nominal gap (mm)
Incr
ease
d pe
akin
g fa
ctor
(%)
FQ
F∆H
FIG. 8. Ringhals 2: Envelope on a statistical basis of the water gap versus the increase of the power peaking factors.
Additional thermal margins come from the introduction of fuel types with IFMs on all units.
Assembly bow analyses will be an integral part of the new safety analyses required for the planned 13,5% up- rating of Ringhals 3.
135
5. ROD DROP AND CORE DIAGNOSTICS IRI has led to a considerable improvement in rod drop diagnostics, ref. 2. The drop time is characterized by the time down to the dashpot (T5) and the time through the dashpot (T6). Software has been developed for rapid analysis. Acceptance criteria have been established for the two time constants characterizing the drop, fig. 8. The improved diagnostics assures that negative trends are picked up at an early stage and that's there's ample margin to the safety criteria.
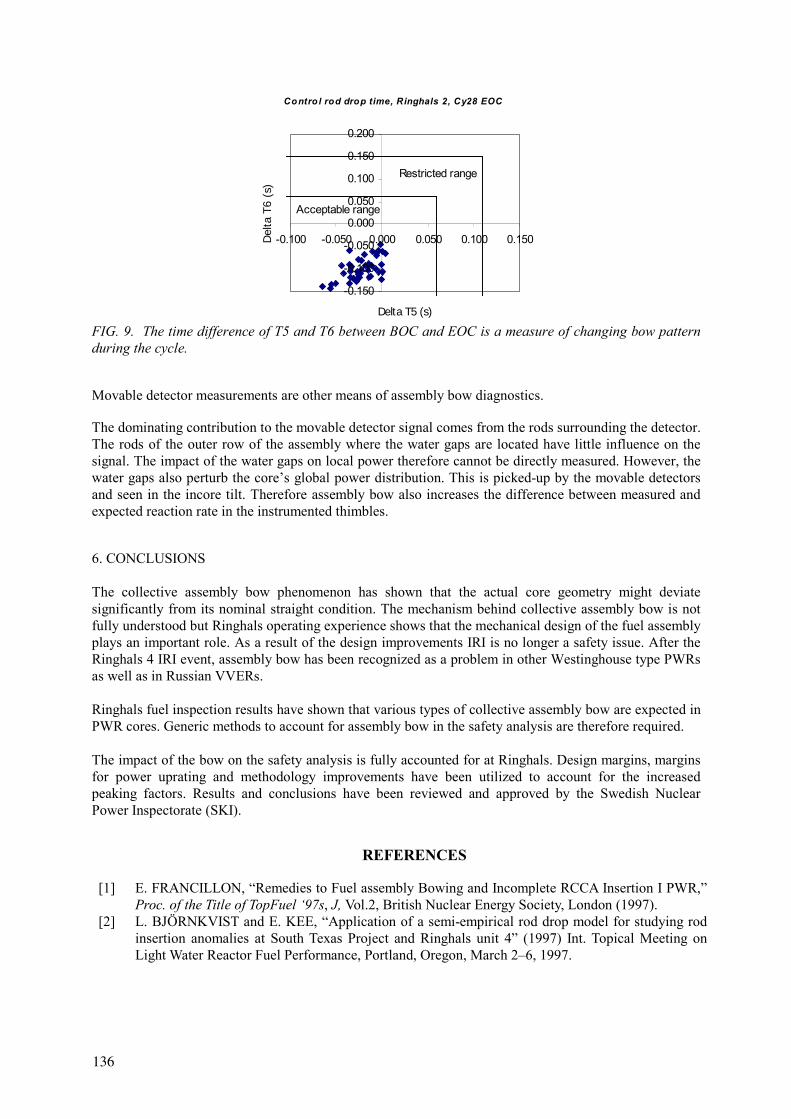
Contro l rod drop time, Ringhals 2, Cy28 EOC
-0.150
-0.100
-0.050
0.000
0.050
0.100
0.150
0.200
-0.100 -0.050 0.000 0.050 0.100 0.150
Delta T5 (s)
Del
ta T
6 (s
)
Acceptable range
Restricted range
FIG. 9. The time difference of T5 and T6 between BOC and EOC is a measure of changing bow pattern during the cycle.
Movable detector measurements are other means of assembly bow diagnostics.
The dominating contribution to the movable detector signal comes from the rods surrounding the detector. The rods of the outer row of the assembly where the water gaps are located have little influence on the signal. The impact of the water gaps on local power therefore cannot be directly measured. However, the water gaps also perturb the core’s global power distribution. This is picked-up by the movable detectors and seen in the incore tilt. Therefore assembly bow also increases the difference between measured and expected reaction rate in the instrumented thimbles. 6. CONCLUSIONS
The collective assembly bow phenomenon has shown that the actual core geometry might deviate significantly from its nominal straight condition. The mechanism behind collective assembly bow is not fully understood but Ringhals operating experience shows that the mechanical design of the fuel assembly plays an important role. As a result of the design improvements IRI is no longer a safety issue. After the Ringhals 4 IRI event, assembly bow has been recognized as a problem in other Westinghouse type PWRs as well as in Russian VVERs.
Ringhals fuel inspection results have shown that various types of collective assembly bow are expected in PWR cores. Generic methods to account for assembly bow in the safety analysis are therefore required. The impact of the bow on the safety analysis is fully accounted for at Ringhals. Design margins, margins for power uprating and methodology improvements have been utilized to account for the increased peaking factors. Results and conclusions have been reviewed and approved by the Swedish Nuclear Power Inspectorate (SKI).
136
REFERENCES
[1] E. FRANCILLON, “Remedies to Fuel assembly Bowing and Incomplete RCCA Insertion I PWR,” Proc. of the Title of TopFuel ‘97s, J, Vol.2, British Nuclear Energy Society, London (1997).
[2] L. BJÖRNKVIST and E. KEE, “Application of a semi-empirical rod drop model for studying rod insertion anomalies at South Texas Project and Ringhals unit 4” (1997) Int. Topical Meeting on Light Water Reactor Fuel Performance, Portland, Oregon, March 2–6, 1997.
THE RESULTS OF TVSA DEVELOPMENT AND OPERATION EXPERIENCE V.L. MOLCHANOV, А.B. DOLGOV OJSC “TVEL”, Moscow О.B. SAMOYLOV, V.B. KAYDALOV, V.S. KUUL ОKBМ, N. Novgorod I.V. PETROV, А.V. IVANOV, G.А. SIMAKOV OJSC MSZ, Electrostal V.I. AKSENOV, А.N. LUPISHKO Kalinin NPP Russian Federation
Abstract One of the main problems, which were solved at the designing of AFA (TVSA) for VVER cores is the development of fuel assembly structure stable to deformation because of its operation under severe radiation and thermo-mechanical conditions. The analysis of Russian and foreign VVER FA designing and operation experience has shown that numerous factors of structural, process and operation nature influence upon the mechanism of fuel assemblies deformation in the core. TVSA was developed taking these factors into account and its embodiment meets the adjusted requirements. To substantiate made engineering solutions and to confirm reliable serviceability of TVSA a complex program of calculation and experimental activities and before-reactor tests was performed under reactor conditions. The results of the performed investigations have shown that the requirements on static and dynamic strength, vibration strength at operation, including transportation and emergency modes of TVSA are provided. Besides TVSA geometric stability under radiation and thermo-mechanical conditions and the assigned life time characteristics were confirmed. At the operation of the first unit of Kalininskaya NPP during 14–19 fuel life cycles the core was being loaded by TVSAs and beginning from the 18-th fuel life cycle the core completely consisted of them. The range of operation damaging factors together with additional influence of standard bent FAs determined more severe conditions of reactor tests in comparison with before-reactor ones. Fuel assemblies curvature was measured during operation at the refuellings. The results of the measurements have shown that as the number of TVSAs increased in the core it intensively straightened up and before the beginning of the 18-th fuel life cycle the bending decreased more than 4 times and was 5.0 mm versus 21.0 mm at the end of the 14-th fuel life cycle, thereby the inter-cassette gap was not more than 4 mm and did not practically differ from the measurements of the 17-th life cycle, it means that the process was stabilized. So operation results have shown that TVSAs have high vibration strength and deformation stability under the conditions of VVER core so they provide geometric stability of the core and may be used in fuel cycles with approximately 70 MW·day/kgU burnup. 1. INTRODUCTION Since 1988 Russia has tested and has been operating fuel developed on the basis of alternative fuel assemblies (TVSA) in VVER-1000 reactors. This report characterizes the results of investigations carried out to validate TVSA design characteristics at the stage of designing during reactor and post-reactor tests. It also reviews the results of TVSA operation in VVER-1000 reactor cores in terms of mechanical behavior, as well as the achieved operating parameters. The report contains a discussion of further TVSA upgrading.
137
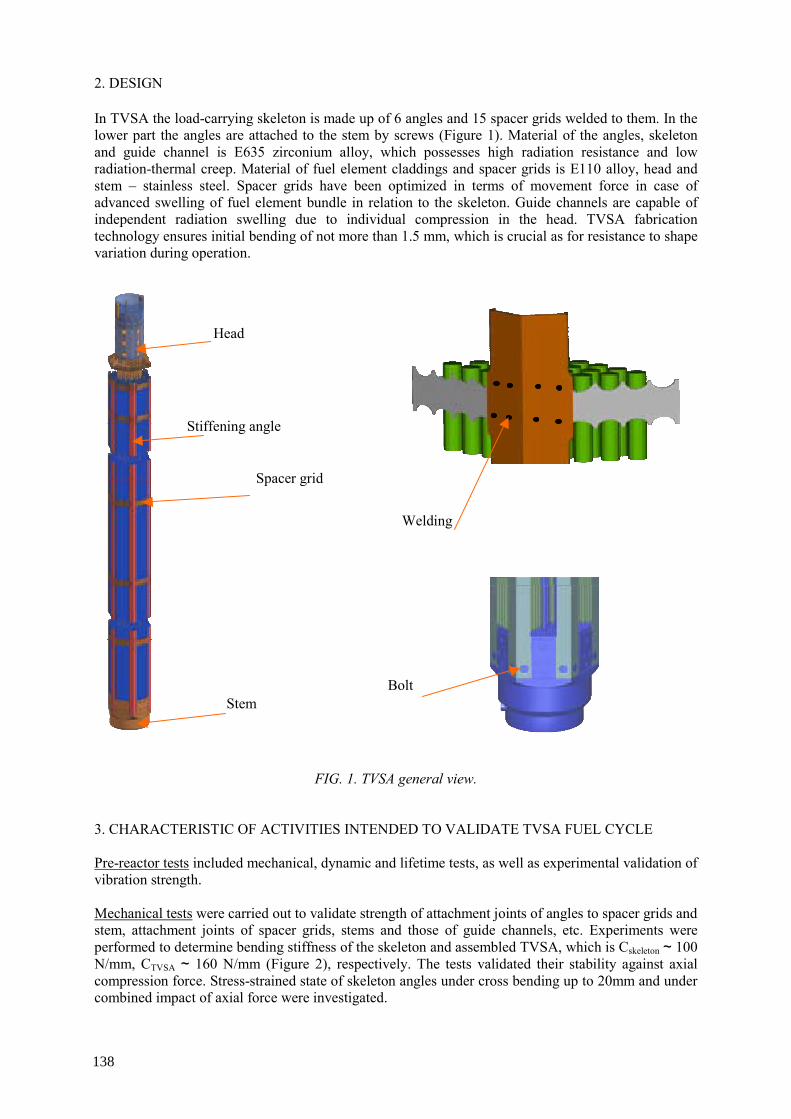
2. DESIGN In TVSA the load-carrying skeleton is made up of 6 angles and 15 spacer grids welded to them. In the lower part the angles are attached to the stem by screws (Figure 1). Material of the angles, skeleton and guide channel is E635 zirconium alloy, which possesses high radiation resistance and low radiation-thermal creep. Material of fuel element claddings and spacer grids is E110 alloy, head and stem – stainless steel. Spacer grids have been optimized in terms of movement force in case of advanced swelling of fuel element bundle in relation to the skeleton. Guide channels are capable of independent radiation swelling due to individual compression in the head. TVSA fabrication technology ensures initial bending of not more than 1.5 mm, which is crucial as for resistance to shape variation during operation.
FIG. 1. TVSA general view.
3. CHARACTERISTIC OF ACTIVITIES INTENDED TO VALIDATE TVSA FUEL CYCLE
Pre-reactor tests included mechanical, dynamic and lifetime tests, as well as experimental validation of vibration strength. Mechanical tests were carried out to validate strength of attachment joints of angles to spacer grids and stem, attachment joints of spacer grids, stems and those of guide channels, etc. Experiments were performed to determine bending stiffness of the skeleton and assembled TVSA, which is Сskeleton ~ 100 N/mm, СTVSA ~ 160 N/mm (Figure 2), respectively. The tests validated their stability against axial compression force. Stress-strained state of skeleton angles under cross bending up to 20mm and under combined impact of axial force were investigated.
Head
Stiffening angle
Spacer grid
Stem
Welding
Bolt
138
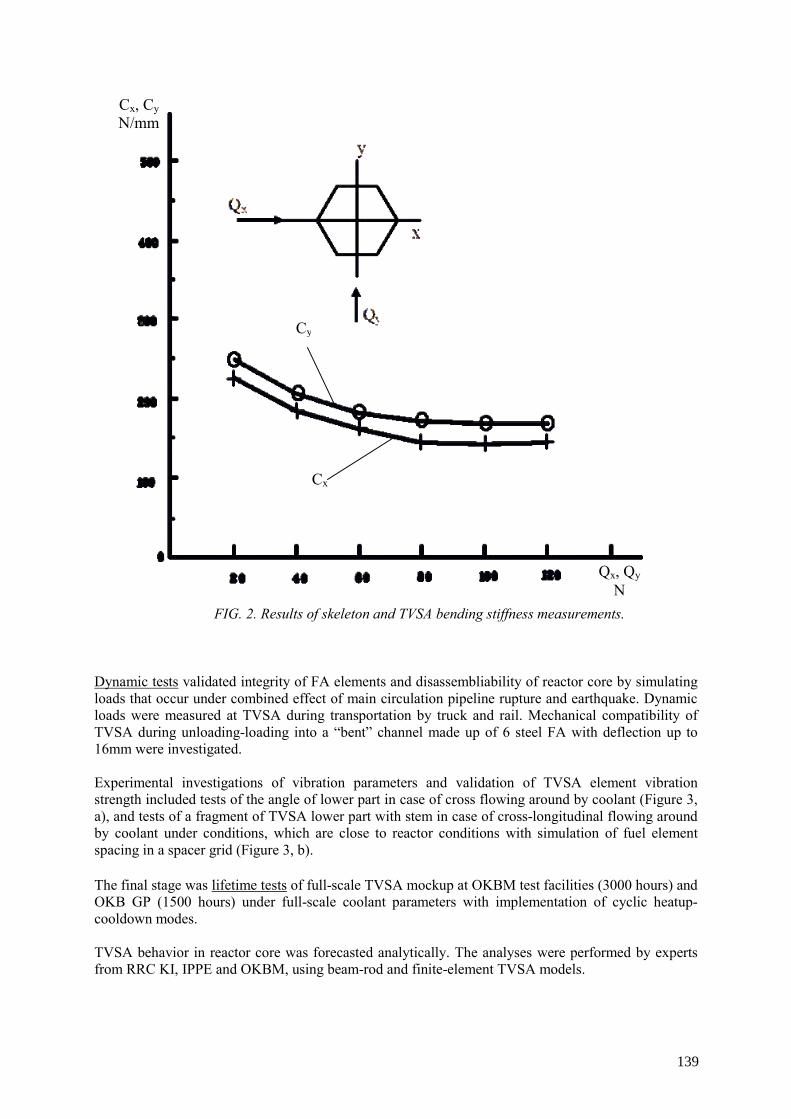
FIG. 2. Results of skeleton and TVSA bending stiffness measurements.
Dynamic tests validated integrity of FA elements and disassembliability of reactor core by simulating loads that occur under combined effect of main circulation pipeline rupture and earthquake. Dynamic loads were measured at TVSA during transportation by truck and rail. Mechanical compatibility of TVSA during unloading-loading into a “bent” channel made up of 6 steel FA with deflection up to 16mm were investigated.
Experimental investigations of vibration parameters and validation of TVSA element vibration strength included tests of the angle of lower part in case of cross flowing around by coolant (Figure 3, а), and tests of a fragment of TVSA lower part with stem in case of cross-longitudinal flowing around by coolant under conditions, which are close to reactor conditions with simulation of fuel element spacing in a spacer grid (Figure 3, b). The final stage was lifetime tests of full-scale TVSA mockup at OKBM test facilities (3000 hours) and OKB GP (1500 hours) under full-scale coolant parameters with implementation of cyclic heatup-cooldown modes. TVSA behavior in reactor core was forecasted analytically. The analyses were performed by experts from RRC KI, IPPE and OKBM, using beam-rod and finite-element TVSA models.
Сх, Сy N/mm
Qх, Qy N
Сх
Сy
139
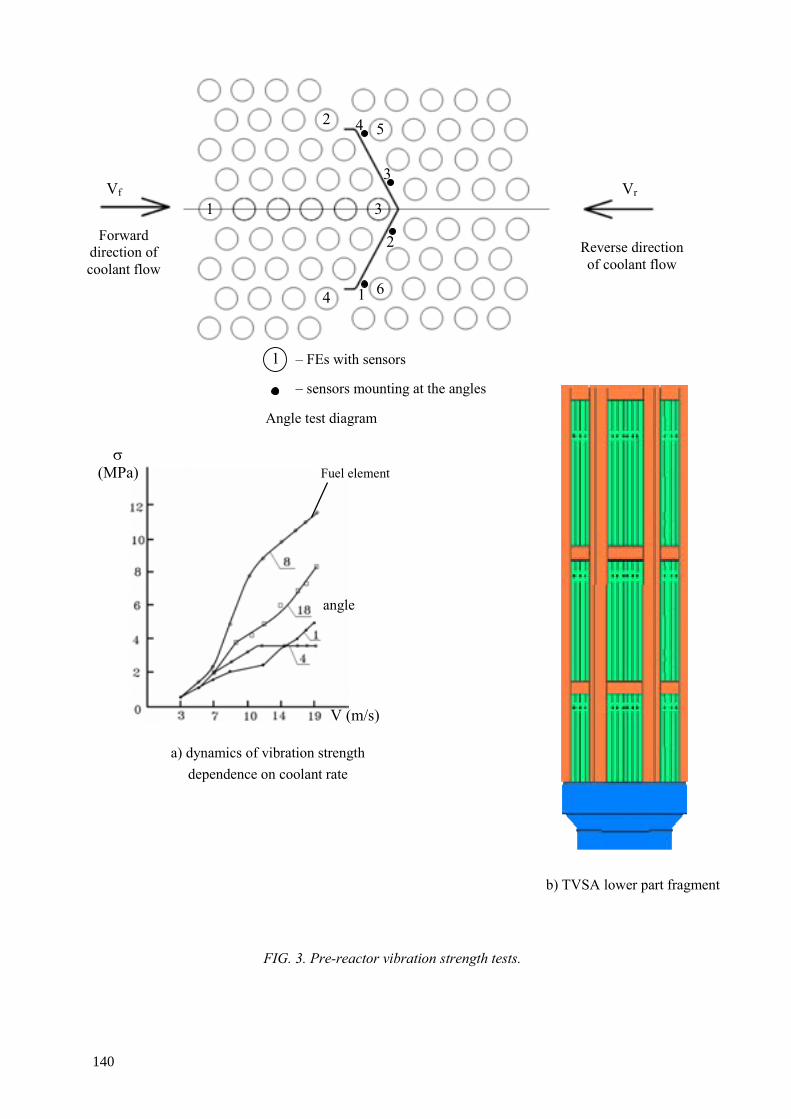
Fuel element σ
(MPа)
angle
V (m/s)
Angle test diagram
а) dynamics of vibration strength dependence on coolant rate
b) TVSA lower part fragment
FIG. 3. Pre-reactor vibration strength tests.
Vf
Forward direction of coolant flow
Vr
Reverse direction of coolant flow
2 5
3
4 6
1
4
3
2
1
1 – FEs with sensors
– sensors mounting at the angles
140

Thermal-mechanical tests were performed to test analytical models and obtain the necessary input data. The tests include: – Simulation of axial swelling of fuel element bundle in spacer grid and TVSA fragment; – Simulation of non-uniform swelling of fuel element bundle in the fragment; – Simulation of non-uniform swelling of angles at the fragment; – Accumulation of statistical data on the forces of fuel element movement in spacer grids at the
Manufacturer. Determination of average statistical diametrical tension in “fuel element-spacer grid” system;
– Measurement of initial bending of TVSA at the Manufacturer (f < 1.5 mm). According to the program, reactor tests of TVSA at Kalinin NPP-1 were followed by measurements of geometrical dimensions and bending of TVSA, relaxation of compression springs. First loading of TVSA (12 pieces) was performed at reactor core periphery to check skeleton strength under maximum variations of fluence and temperatures (Figure 4, a). Subsequent loadings were carried out with large amounts (Figure 4, b). Effectiveness of selected design solutions and reactor core “straightening” was validated.
а) 14th fuel life
b) 15th fuel life
FIG. 4. Cartogram of first TVSA loadings.
– “steel” TVSA of 2nd-4th operation cycles – fresh “steel” TVSA – fresh TVSA, 36 pcs. – TVSA of 2nd operation cycle, 12 pcs.
141
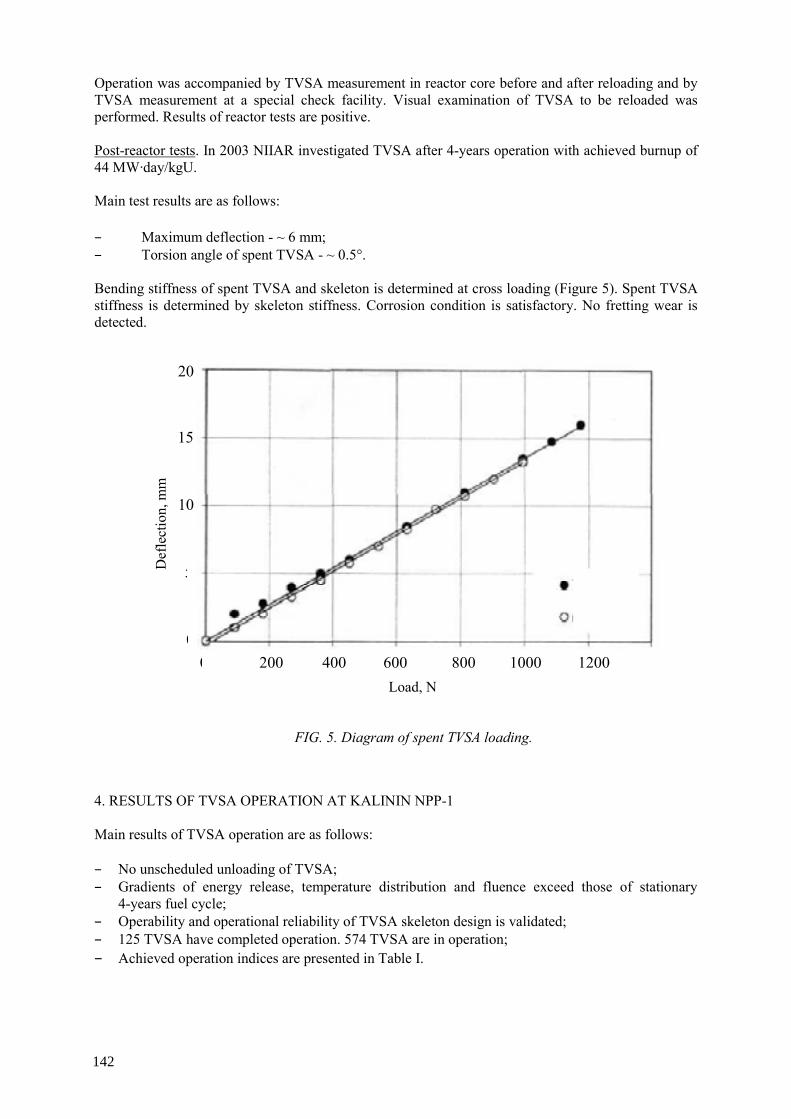
Operation was accompanied by TVSA measurement in reactor core before and after reloading and by TVSA measurement at a special check facility. Visual examination of TVSA to be reloaded was performed. Results of reactor tests are positive. Post-reactor tests. In 2003 NIIAR investigated TVSA after 4-years operation with achieved burnup of 44 MW·day/kgU. Main test results are as follows: – Maximum deflection - ~ 6 mm; – Torsion angle of spent TVSA - ~ 0.5°. Bending stiffness of spent TVSA and skeleton is determined at cross loading (Figure 5). Spent TVSA stiffness is determined by skeleton stiffness. Corrosion condition is satisfactory. No fretting wear is detected.
4. RESULTS OF TVSA OPERATION AT KALININ NPP-1
Main results of TVSA operation are as follows: – No unscheduled unloading of TVSA; – Gradients of energy release, temperature distribution and fluence exceed those of stationary
4-years fuel cycle; – Operability and operational reliability of TVSA skeleton design is validated; – 125 TVSA have completed operation. 574 TVSA are in operation; – Achieved operation indices are presented in Table I.
0 200 400 600 800 1000 1200
5
10
15
20
0
Load, N
Def
lect
ion,
mm
TVSA
skeleton
142
FIG. 5. Diagram of spent TVSA loading.
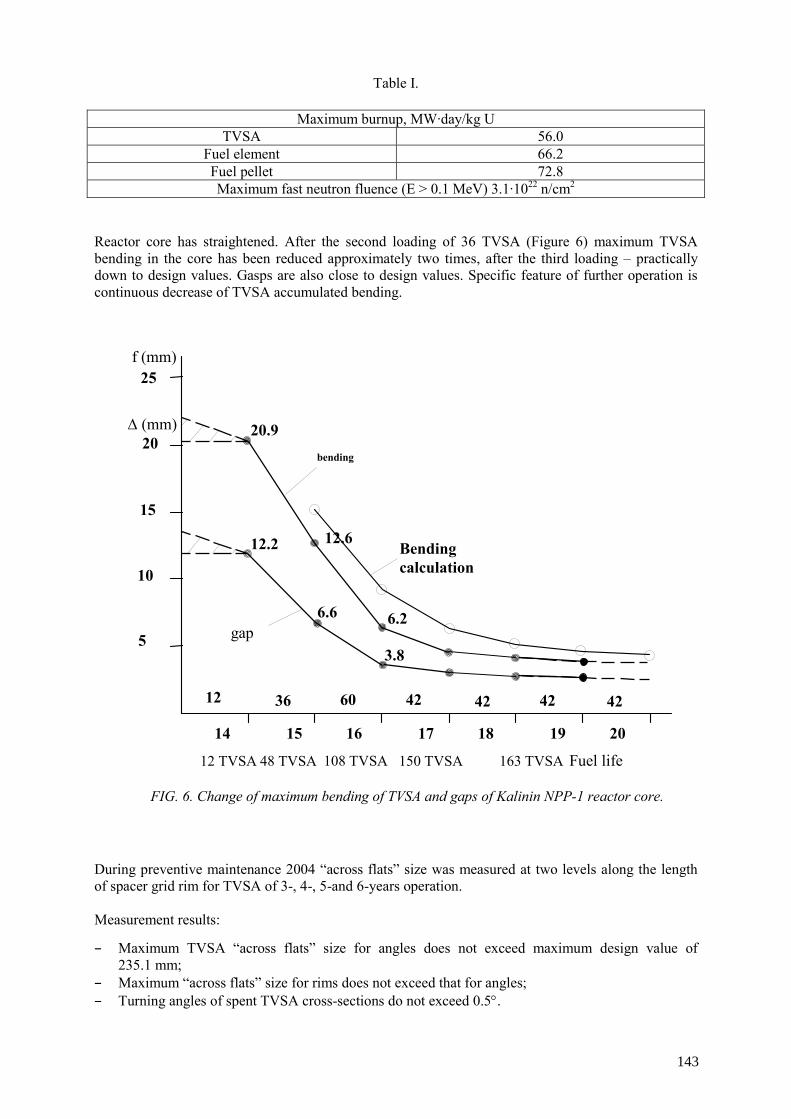
Table I.
Maximum burnup, MW·day/kg U TVSA 56.0
Fuel element 66.2 Fuel pellet 72.8 Maximum fast neutron fluence (E > 0.1 MeV) 3.1·1022 n/сm2
Reactor core has straightened. After the second loading of 36 TVSA (Figure 6) maximum TVSA bending in the core has been reduced approximately two times, after the third loading – practically down to design values. Gasps are also close to design values. Specific feature of further operation is continuous decrease of TVSA accumulated bending.
FIG. 6. Change of maximum bending of TVSA and gaps of Kalinin NPP-1 reactor core.
During preventive maintenance 2004 “across flats” size was measured at two levels along the length of spacer grid rim for TVSA of 3-, 4-, 5-and 6-years operation. Measurement results:
– Maximum TVSA “across flats” size for angles does not exceed maximum design value of 235.1 mm;
– Maximum “across flats” size for rims does not exceed that for angles; – Turning angles of spent TVSA cross-sections do not exceed 0.5°.
5
10
15
20
25
12 36 60 42 42 42 42
12.2
6.6
3.8
20.9
12.6
6.2
bending
Bending calculation
gap
f (mm)
∆ (mm)
Fuel life
14 15 16 17 18 19 20
12 TVSA 48 TVSA 108 TVSA 150 TVSA 163 TVSA
143
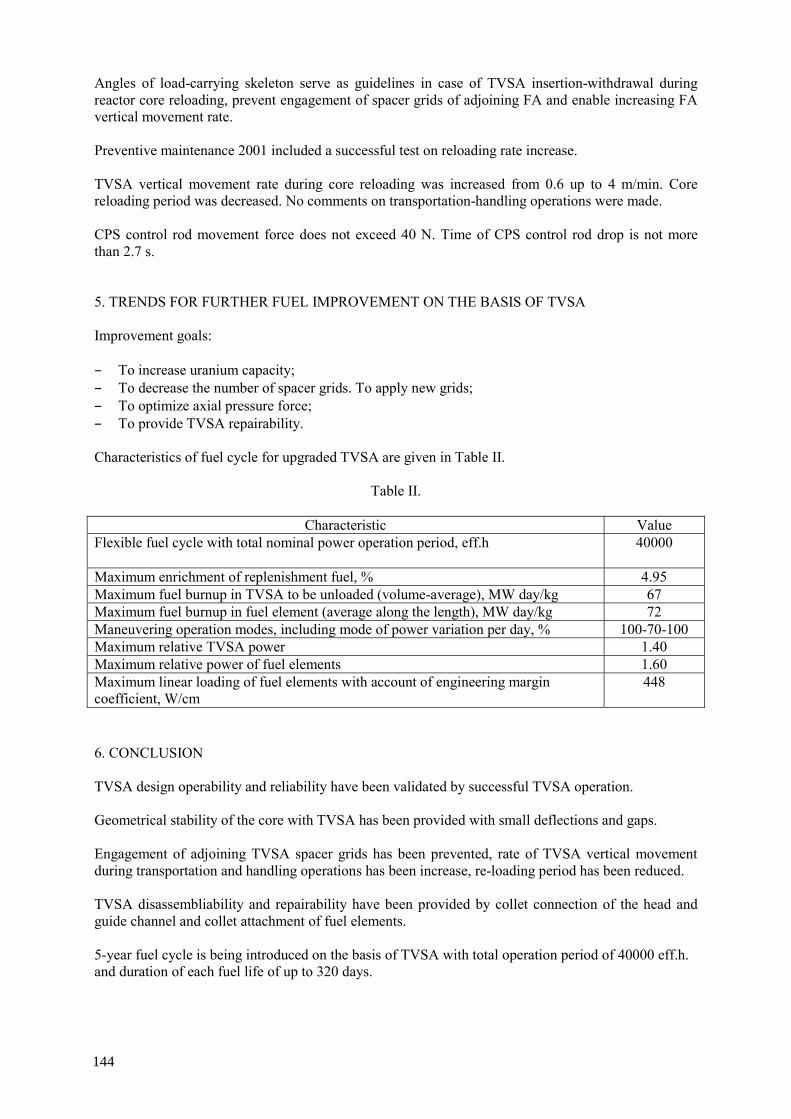
Angles of load-carrying skeleton serve as guidelines in case of TVSA insertion-withdrawal during reactor core reloading, prevent engagement of spacer grids of adjoining FA and enable increasing FA vertical movement rate. Preventive maintenance 2001 included a successful test on reloading rate increase. TVSA vertical movement rate during core reloading was increased from 0.6 up to 4 m/min. Core reloading period was decreased. No comments on transportation-handling operations were made. CPS control rod movement force does not exceed 40 N. Time of CPS control rod drop is not more than 2.7 s. 5. TRENDS FOR FURTHER FUEL IMPROVEMENT ON THE BASIS OF TVSA
Improvement goals: – To increase uranium capacity; – To decrease the number of spacer grids. To apply new grids; – To optimize axial pressure force; – To provide TVSA repairability.
Characteristics of fuel cycle for upgraded TVSA are given in Table II.
Table II.
Characteristic Value Flexible fuel cycle with total nominal power operation period, eff.h 40000
Maximum enrichment of replenishment fuel, % 4.95 Maximum fuel burnup in TVSA to be unloaded (volume-average), MW day/kg 67 Maximum fuel burnup in fuel element (average along the length), MW day/kg 72 Maneuvering operation modes, including mode of power variation per day, % 100-70-100 Maximum relative TVSA power 1.40 Maximum relative power of fuel elements 1.60 Maximum linear loading of fuel elements with account of engineering margin coefficient, W/сm
448
6. CONCLUSION
TVSA design operability and reliability have been validated by successful TVSA operation. Geometrical stability of the core with TVSA has been provided with small deflections and gaps. Engagement of adjoining TVSA spacer grids has been prevented, rate of TVSA vertical movement during transportation and handling operations has been increase, re-loading period has been reduced. TVSA disassembliability and repairability have been provided by collet connection of the head and guide channel and collet attachment of fuel elements. 5-year fuel cycle is being introduced on the basis of TVSA with total operation period of 40000 eff.h. and duration of each fuel life of up to 320 days.
144

REFERENCES
[1] Patent of Russia Nº 2093906 dated April 12, 1995, published October 20,1997. [2] SAMOYLOV, O.B., KAYDALOV, V.B., KUUL, V.S., LEVANOV, L.V., MOLCHANOV, V.L.,
DOLGOV, A.B., The Results of TVSA Operation at Kalinin NPP and the Trends of Further Perfection of the Fuel Based on AFA. Fifth International Conference on VVER Fuel Performance, Modeling and Experimental Support, September 29–October 3, 2003, Albena, Bulgaria, Bulgarian Academy of Sciences, Institute for Nuclear Research and Nuclear Energy, 2004, p. 182.
[3] SAMOYLOV, O.B., KAYDALOV, V.B., MOLCHANOV, V.L., DOLGOV, A.B., Vibration Strength of Alternative FA Elements under the Conditions of Interaction with Coolant Flow in VVER-1000 Cores. Fifth International Conference on VVER Fuel Performance, Modeling and Experimental Support, September 29 - October 3, 2003, Albena, Bulgaria, Bulgarian Academy of Sciences, Institute for Nuclear Research and Nuclear Energy, 2004, p. 195.
145

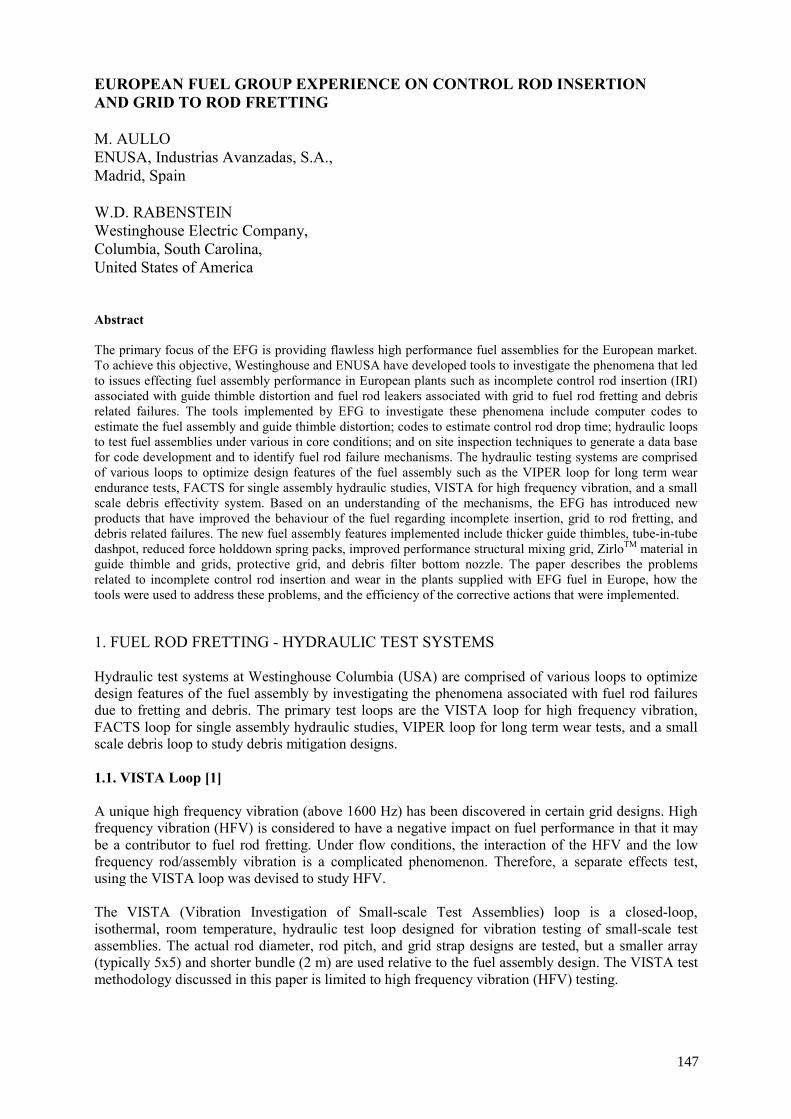
EUROPEAN FUEL GROUP EXPERIENCE ON CONTROL ROD INSERTION AND GRID TO ROD FRETTING M. AULLO ENUSA, Industrias Avanzadas, S.A., Madrid, Spain W.D. RABENSTEIN Westinghouse Electric Company, Columbia, South Carolina, United States of America Abstract The primary focus of the EFG is providing flawless high performance fuel assemblies for the European market. To achieve this objective, Westinghouse and ENUSA have developed tools to investigate the phenomena that led to issues effecting fuel assembly performance in European plants such as incomplete control rod insertion (IRI) associated with guide thimble distortion and fuel rod leakers associated with grid to fuel rod fretting and debris related failures. The tools implemented by EFG to investigate these phenomena include computer codes to estimate the fuel assembly and guide thimble distortion; codes to estimate control rod drop time; hydraulic loops to test fuel assemblies under various in core conditions; and on site inspection techniques to generate a data base for code development and to identify fuel rod failure mechanisms. The hydraulic testing systems are comprised of various loops to optimize design features of the fuel assembly such as the VIPER loop for long term wear endurance tests, FACTS for single assembly hydraulic studies, VISTA for high frequency vibration, and a small scale debris effectivity system. Based on an understanding of the mechanisms, the EFG has introduced new products that have improved the behaviour of the fuel regarding incomplete insertion, grid to rod fretting, and debris related failures. The new fuel assembly features implemented include thicker guide thimbles, tube-in-tube dashpot, reduced force holddown spring packs, improved performance structural mixing grid, ZirloTM material in guide thimble and grids, protective grid, and debris filter bottom nozzle. The paper describes the problems related to incomplete control rod insertion and wear in the plants supplied with EFG fuel in Europe, how the tools were used to address these problems, and the efficiency of the corrective actions that were implemented. 1. FUEL ROD FRETTING - HYDRAULIC TEST SYSTEMS Hydraulic test systems at Westinghouse Columbia (USA) are comprised of various loops to optimize design features of the fuel assembly by investigating the phenomena associated with fuel rod failures due to fretting and debris. The primary test loops are the VISTA loop for high frequency vibration, FACTS loop for single assembly hydraulic studies, VIPER loop for long term wear tests, and a small scale debris loop to study debris mitigation designs. 1.1. VISTA Loop [1] A unique high frequency vibration (above 1600 Hz) has been discovered in certain grid designs. High frequency vibration (HFV) is considered to have a negative impact on fuel performance in that it may be a contributor to fuel rod fretting. Under flow conditions, the interaction of the HFV and the low frequency rod/assembly vibration is a complicated phenomenon. Therefore, a separate effects test, using the VISTA loop was devised to study HFV. The VISTA (Vibration Investigation of Small-scale Test Assemblies) loop is a closed-loop, isothermal, room temperature, hydraulic test loop designed for vibration testing of small-scale test assemblies. The actual rod diameter, rod pitch, and grid strap designs are tested, but a smaller array (typically 5x5) and shorter bundle (2 m) are used relative to the fuel assembly design. The VISTA test methodology discussed in this paper is limited to high frequency vibration (HFV) testing.
147
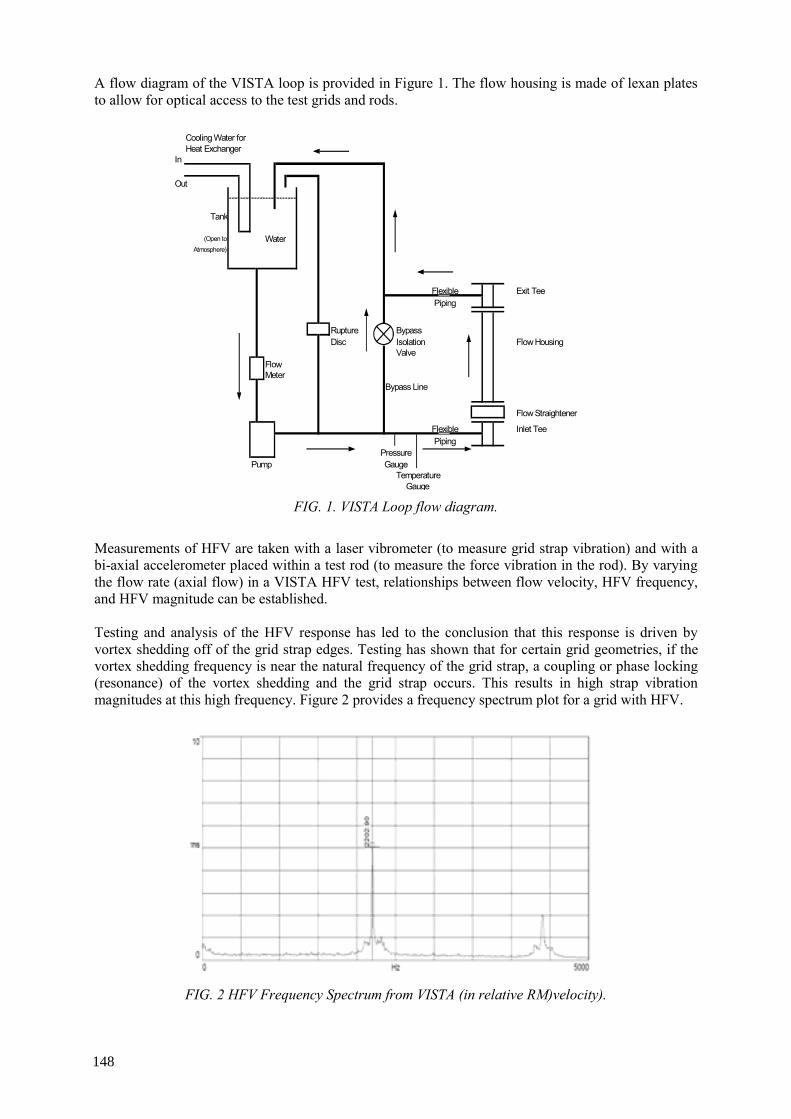
A flow diagram of the VISTA loop is provided in Figure 1. The flow housing is made of lexan plates to allow for optical access to the test grids and rods.
FIG. 1. VISTA Loop flow diagram.
Measurements of HFV are taken with a laser vibrometer (to measure grid strap vibration) and with a bi-axial accelerometer placed within a test rod (to measure the force vibration in the rod). By varying the flow rate (axial flow) in a VISTA HFV test, relationships between flow velocity, HFV frequency, and HFV magnitude can be established. Testing and analysis of the HFV response has led to the conclusion that this response is driven by vortex shedding off of the grid strap edges. Testing has shown that for certain grid geometries, if the vortex shedding frequency is near the natural frequency of the grid strap, a coupling or phase locking (resonance) of the vortex shedding and the grid strap occurs. This results in high strap vibration magnitudes at this high frequency. Figure 2 provides a frequency spectrum plot for a grid with HFV.
FIG. 2 HFV Frequency Spectrum from VISTA (in relative RM)velocity).
Cooling Water forHeat Exchanger
In
Out
Tank
(Open to WaterAtmosphere)
Flexible Exit TeePiping
Rupture BypassDisc Isolation Flow Housing
ValveFlowMeter
Bypass Line
Flow Straightener
Flexible Inlet TeePiping
PressurePump Gauge
TemperatureGauge
148
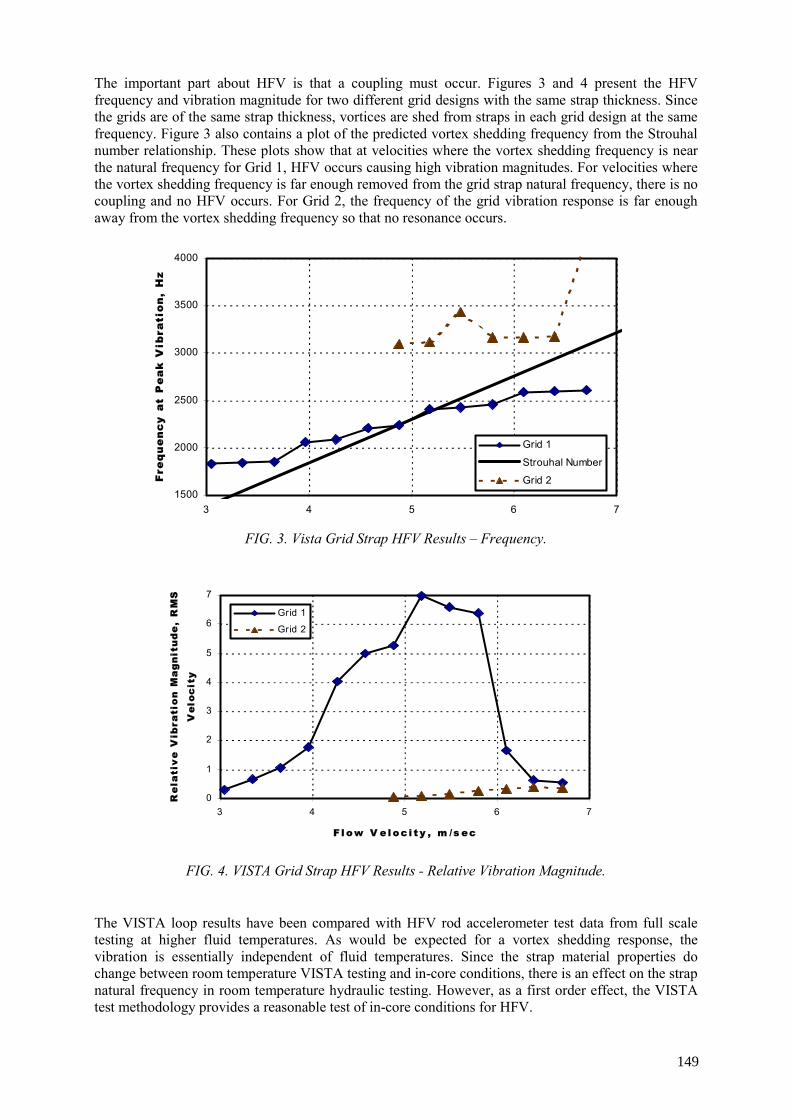
The important part about HFV is that a coupling must occur. Figures 3 and 4 present the HFV frequency and vibration magnitude for two different grid designs with the same strap thickness. Since the grids are of the same strap thickness, vortices are shed from straps in each grid design at the same frequency. Figure 3 also contains a plot of the predicted vortex shedding frequency from the Strouhal number relationship. These plots show that at velocities where the vortex shedding frequency is near the natural frequency for Grid 1, HFV occurs causing high vibration magnitudes. For velocities where the vortex shedding frequency is far enough removed from the grid strap natural frequency, there is no coupling and no HFV occurs. For Grid 2, the frequency of the grid vibration response is far enough away from the vortex shedding frequency so that no resonance occurs.
1500
2000
2500
3000
3500
4000
3 4 5 6 7
Fre
qu
en
cy
at
Pe
ak
Vib
rati
on
, H
z
Grid 1
Strouhal Number
Grid 2
FIG. 3. Vista Grid Strap HFV Results – Frequency.
0
1
2
3
4
5
6
7
3 4 5 6 7
F l ow V e l oc i t y , m /s ec
Re
lati
ve
Vib
rati
on
Ma
gn
itu
de
, R
MS
Ve
loc
ity
Grid 1
Grid 2
FIG. 4. VISTA Grid Strap HFV Results - Relative Vibration Magnitude.
The VISTA loop results have been compared with HFV rod accelerometer test data from full scale testing at higher fluid temperatures. As would be expected for a vortex shedding response, the vibration is essentially independent of fluid temperatures. Since the strap material properties do change between room temperature VISTA testing and in-core conditions, there is an effect on the strap natural frequency in room temperature hydraulic testing. However, as a first order effect, the VISTA test methodology provides a reasonable test of in-core conditions for HFV.
149
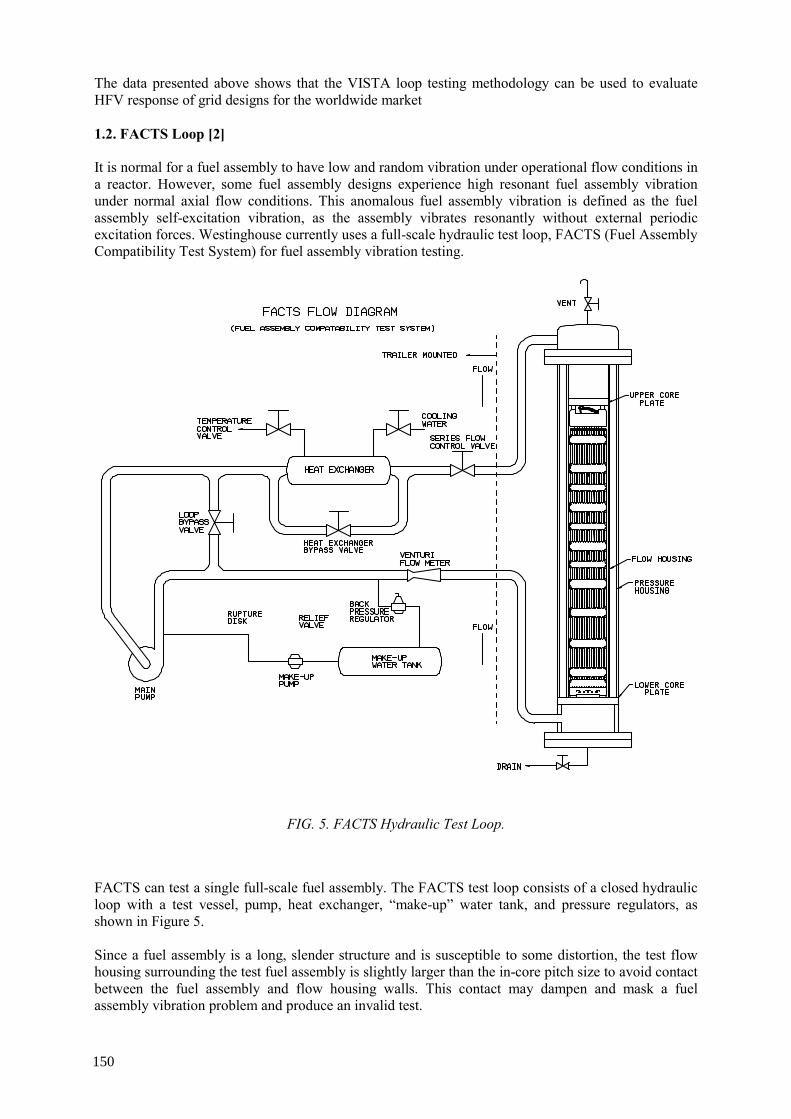
The data presented above shows that the VISTA loop testing methodology can be used to evaluate HFV response of grid designs for the worldwide market 1.2. FACTS Loop [2] It is normal for a fuel assembly to have low and random vibration under operational flow conditions in a reactor. However, some fuel assembly designs experience high resonant fuel assembly vibration under normal axial flow conditions. This anomalous fuel assembly vibration is defined as the fuel assembly self-excitation vibration, as the assembly vibrates resonantly without external periodic excitation forces. Westinghouse currently uses a full-scale hydraulic test loop, FACTS (Fuel Assembly Compatibility Test System) for fuel assembly vibration testing.
FIG. 5. FACTS Hydraulic Test Loop.
FACTS can test a single full-scale fuel assembly. The FACTS test loop consists of a closed hydraulic loop with a test vessel, pump, heat exchanger, “make-up” water tank, and pressure regulators, as shown in Figure 5. Since a fuel assembly is a long, slender structure and is susceptible to some distortion, the test flow housing surrounding the test fuel assembly is slightly larger than the in-core pitch size to avoid contact between the fuel assembly and flow housing walls. This contact may dampen and mask a fuel assembly vibration problem and produce an invalid test.
150
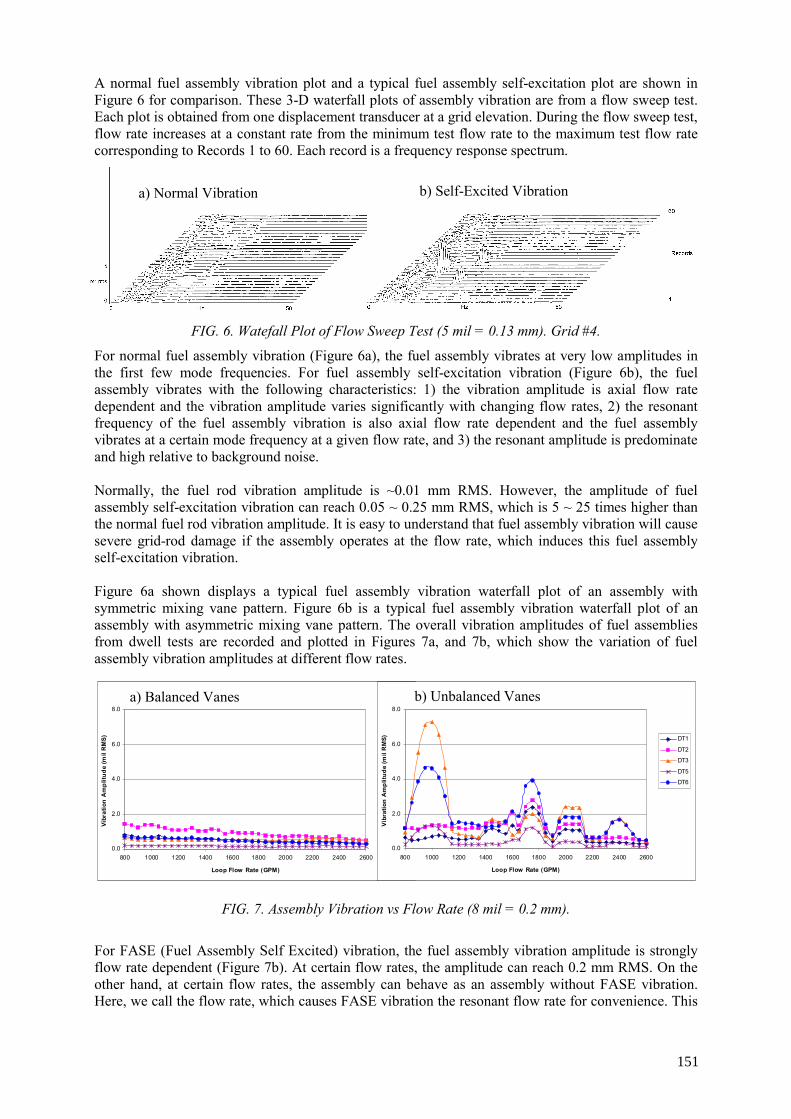
A normal fuel assembly vibration plot and a typical fuel assembly self-excitation plot are shown in Figure 6 for comparison. These 3-D waterfall plots of assembly vibration are from a flow sweep test. Each plot is obtained from one displacement transducer at a grid elevation. During the flow sweep test, flow rate increases at a constant rate from the minimum test flow rate to the maximum test flow rate corresponding to Records 1 to 60. Each record is a frequency response spectrum.
FIG. 6. Watefall Plot of Flow Sweep Test (5 mil = 0.13 mm). Grid #4.
For normal fuel assembly vibration (Figure 6a), the fuel assembly vibrates at very low amplitudes in the first few mode frequencies. For fuel assembly self-excitation vibration (Figure 6b), the fuel assembly vibrates with the following characteristics: 1) the vibration amplitude is axial flow rate dependent and the vibration amplitude varies significantly with changing flow rates, 2) the resonant frequency of the fuel assembly vibration is also axial flow rate dependent and the fuel assembly vibrates at a certain mode frequency at a given flow rate, and 3) the resonant amplitude is predominate and high relative to background noise. Normally, the fuel rod vibration amplitude is ~0.01 mm RMS. However, the amplitude of fuel assembly self-excitation vibration can reach 0.05 ~ 0.25 mm RMS, which is 5 ~ 25 times higher than the normal fuel rod vibration amplitude. It is easy to understand that fuel assembly vibration will cause severe grid-rod damage if the assembly operates at the flow rate, which induces this fuel assembly self-excitation vibration. Figure 6a shown displays a typical fuel assembly vibration waterfall plot of an assembly with symmetric mixing vane pattern. Figure 6b is a typical fuel assembly vibration waterfall plot of an assembly with asymmetric mixing vane pattern. The overall vibration amplitudes of fuel assemblies from dwell tests are recorded and plotted in Figures 7a, and 7b, which show the variation of fuel assembly vibration amplitudes at different flow rates.
FIG. 7. Assembly Vibration vs Flow Rate (8 mil = 0.2 mm).
For FASE (Fuel Assembly Self Excited) vibration, the fuel assembly vibration amplitude is strongly flow rate dependent (Figure 7b). At certain flow rates, the amplitude can reach 0.2 mm RMS. On the other hand, at certain flow rates, the assembly can behave as an assembly without FASE vibration. Here, we call the flow rate, which causes FASE vibration the resonant flow rate for convenience. This
a) Normal Vibration b) Self-Excited Vibration
Assembly #3 Vibration FACTS Test (250 F)with Balanced Vane
0.0
2.0
4.0
6.0
8.0
800 1000 1200 1400 1600 1800 2000 2200 2400 2600
Loop Flow Rate (GPM)
Vibr
atio
n A
mpl
itude
(mil
RM
S) DT1
DT2
DT3
DT5
DT6
Assembly #1 Vibration FACTS Test (250 F)with Unbalanced Vane
0.0
2.0
4.0
6.0
8.0
800 1000 1200 1400 1600 1800 2000 2200 2400 2600
Loop Flow Rate (GPM)
Vibr
atio
n A
mpl
itude
(mil
RM
S) DT1
DT2
DT3
DT5
DT6
a) Balanced Vanes b) Unbalanced Vanes
151
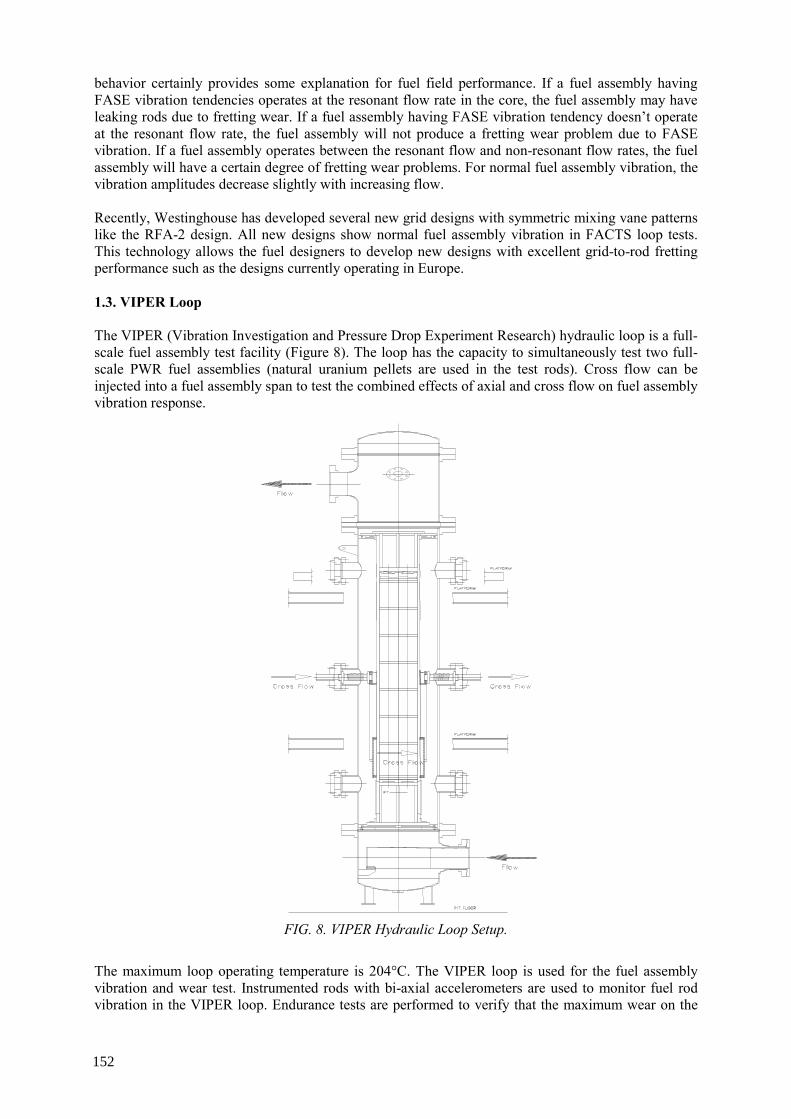
behavior certainly provides some explanation for fuel field performance. If a fuel assembly having FASE vibration tendencies operates at the resonant flow rate in the core, the fuel assembly may have leaking rods due to fretting wear. If a fuel assembly having FASE vibration tendency doesn’t operate at the resonant flow rate, the fuel assembly will not produce a fretting wear problem due to FASE vibration. If a fuel assembly operates between the resonant flow and non-resonant flow rates, the fuel assembly will have a certain degree of fretting wear problems. For normal fuel assembly vibration, the vibration amplitudes decrease slightly with increasing flow. Recently, Westinghouse has developed several new grid designs with symmetric mixing vane patterns like the RFA-2 design. All new designs show normal fuel assembly vibration in FACTS loop tests. This technology allows the fuel designers to develop new designs with excellent grid-to-rod fretting performance such as the designs currently operating in Europe. 1.3. VIPER Loop The VIPER (Vibration Investigation and Pressure Drop Experiment Research) hydraulic loop is a full-scale fuel assembly test facility (Figure 8). The loop has the capacity to simultaneously test two full-scale PWR fuel assemblies (natural uranium pellets are used in the test rods). Cross flow can be injected into a fuel assembly span to test the combined effects of axial and cross flow on fuel assembly vibration response.
FIG. 8. VIPER Hydraulic Loop Setup.
The maximum loop operating temperature is 204°C. The VIPER loop is used for the fuel assembly vibration and wear test. Instrumented rods with bi-axial accelerometers are used to monitor fuel rod vibration in the VIPER loop. Endurance tests are performed to verify that the maximum wear on the
152

fuel rods from the 1000 hour test is low enough to demonstrate that fretting wear will be less than 10% of the cladding thickness during the expected operating lifetime of the assembly.
For endurance test assemblies, all Zirconium alloy mid-grids (or spacers) are thermally pre-sized and oxidized to simulate grid support relaxation and rod creepdown at the end of life before a test fuel assembly skeleton is built. Pre-sizing results in gaps between the mid-grid supports and fuel rods that are consistent with gaps found at end of life under reactor conditions. Note that some grid cells are also sized to beginning of life conditions with the thermal relaxation. The top and bottom Inconel grids are mechanically pre-sized to their in-reactor end life condition. This does not result in gaps between the Inconel grid support and fuel rods. Each test assembly contain instrumented fuel rods to measure fuel rod and assembly vibration. Each instrumented fuel rod contains a bi-axial accelerometer at a certain grid elevation or span location. Annular tungsten-carbide bushings are used in place of uranium pellets to allow routing of the accelerometer leads through the rod. The linear weight of the tungsten-carbide bushings is the same as that of the uranium pellets.
The test fuel assemblies included both pre-oxidized rods and non-oxidized rods. The pre-oxidized rods are placed into the end of life grid cell locations and the non-oxidized rods are placed into the beginning of life grid cell locations. The oxide thickness on the fuel rods is conservatively selected to simulate the initial condition of the fuel rod cladding when gaps are projected to form.
All of the fuel rods are examined after the endurance test. Typically, no fretting wear is observed on any non-oxidized rod in either assembly, which are in beginning of life cells with some pre-load. There is the possibility that light fret scars may be observed on the oxidized rods in the gapped cells. Projections are made on the light fret scars to ensure that the scars meet the test acceptance criteria for the lifetime of the assembly. Testing in the VIPER loop has demonstrated the acceptability of the fuel design for the worldwide market. 1.4. DEBRIS Loop Debris induced fretting has been identified as a sources of fuel failures. Metallic debris including turnings, shavings, and wires has been observed in reactor plants. Within the reactor primary loop system, the smallest flow passages occur in the fuel assembly where the fuel rod passes through the grids. A debris trapping bottom nozzle/grid system was developed and the DEBRIS Loop was utilized to optimize the design concept. A flow diagram of the DEBRIS loop is shown in Figure 9.
FlowMeter
Debris Inserted Here
Clear Execelon
ReducingTee Reducer
Union
FlowHousing
Flow
ReducerCatch Filter
Pump
TankBypass Leg
FIG.9. DEBRIS Loop.
153
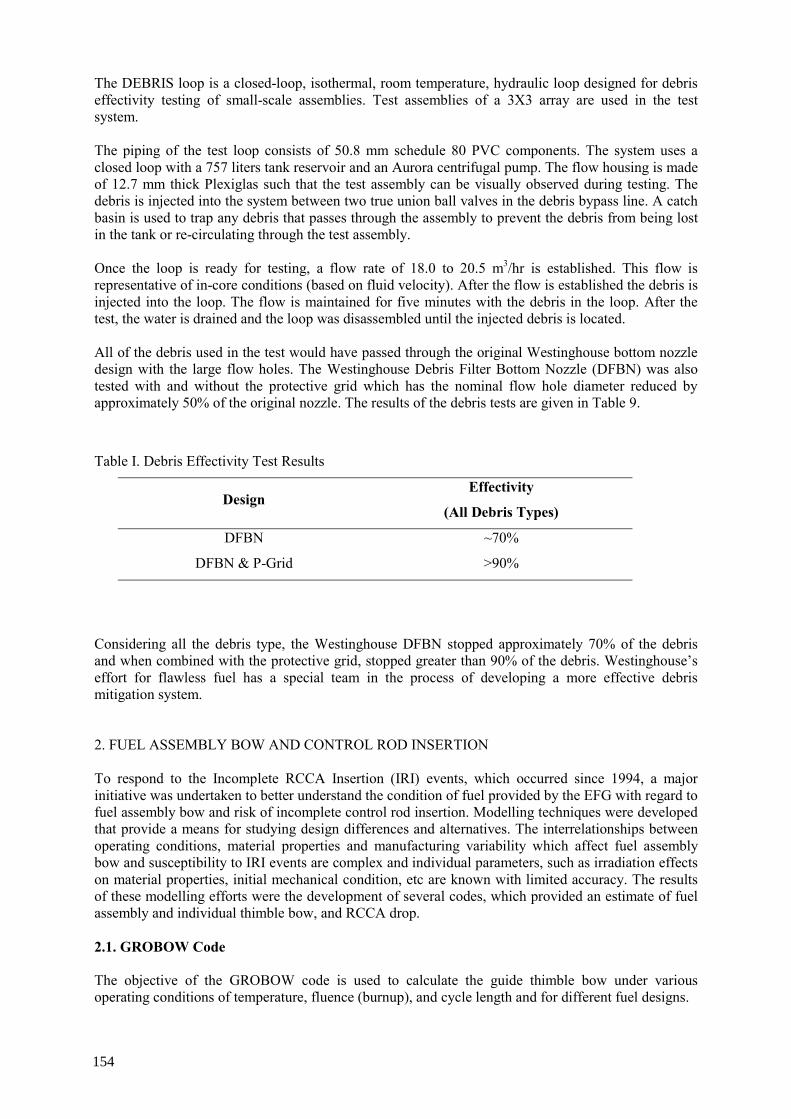
The DEBRIS loop is a closed-loop, isothermal, room temperature, hydraulic loop designed for debris effectivity testing of small-scale assemblies. Test assemblies of a 3X3 array are used in the test system. The piping of the test loop consists of 50.8 mm schedule 80 PVC components. The system uses a closed loop with a 757 liters tank reservoir and an Aurora centrifugal pump. The flow housing is made of 12.7 mm thick Plexiglas such that the test assembly can be visually observed during testing. The debris is injected into the system between two true union ball valves in the debris bypass line. A catch basin is used to trap any debris that passes through the assembly to prevent the debris from being lost in the tank or re-circulating through the test assembly. Once the loop is ready for testing, a flow rate of 18.0 to 20.5 m3/hr is established. This flow is representative of in-core conditions (based on fluid velocity). After the flow is established the debris is injected into the loop. The flow is maintained for five minutes with the debris in the loop. After the test, the water is drained and the loop was disassembled until the injected debris is located. All of the debris used in the test would have passed through the original Westinghouse bottom nozzle design with the large flow holes. The Westinghouse Debris Filter Bottom Nozzle (DFBN) was also tested with and without the protective grid which has the nominal flow hole diameter reduced by approximately 50% of the original nozzle. The results of the debris tests are given in Table 9.
Table I. Debris Effectivity Test Results
Design Effectivity
(All Debris Types)
DFBN ~70%
DFBN & P-Grid >90%
Considering all the debris type, the Westinghouse DFBN stopped approximately 70% of the debris and when combined with the protective grid, stopped greater than 90% of the debris. Westinghouse’s effort for flawless fuel has a special team in the process of developing a more effective debris mitigation system. 2. FUEL ASSEMBLY BOW AND CONTROL ROD INSERTION To respond to the Incomplete RCCA Insertion (IRI) events, which occurred since 1994, a major initiative was undertaken to better understand the condition of fuel provided by the EFG with regard to fuel assembly bow and risk of incomplete control rod insertion. Modelling techniques were developed that provide a means for studying design differences and alternatives. The interrelationships between operating conditions, material properties and manufacturing variability which affect fuel assembly bow and susceptibility to IRI events are complex and individual parameters, such as irradiation effects on material properties, initial mechanical condition, etc are known with limited accuracy. The results of these modelling efforts were the development of several codes, which provided an estimate of fuel assembly and individual thimble bow, and RCCA drop. 2.1. GROBOW Code The objective of the GROBOW code is used to calculate the guide thimble bow under various operating conditions of temperature, fluence (burnup), and cycle length and for different fuel designs.
154
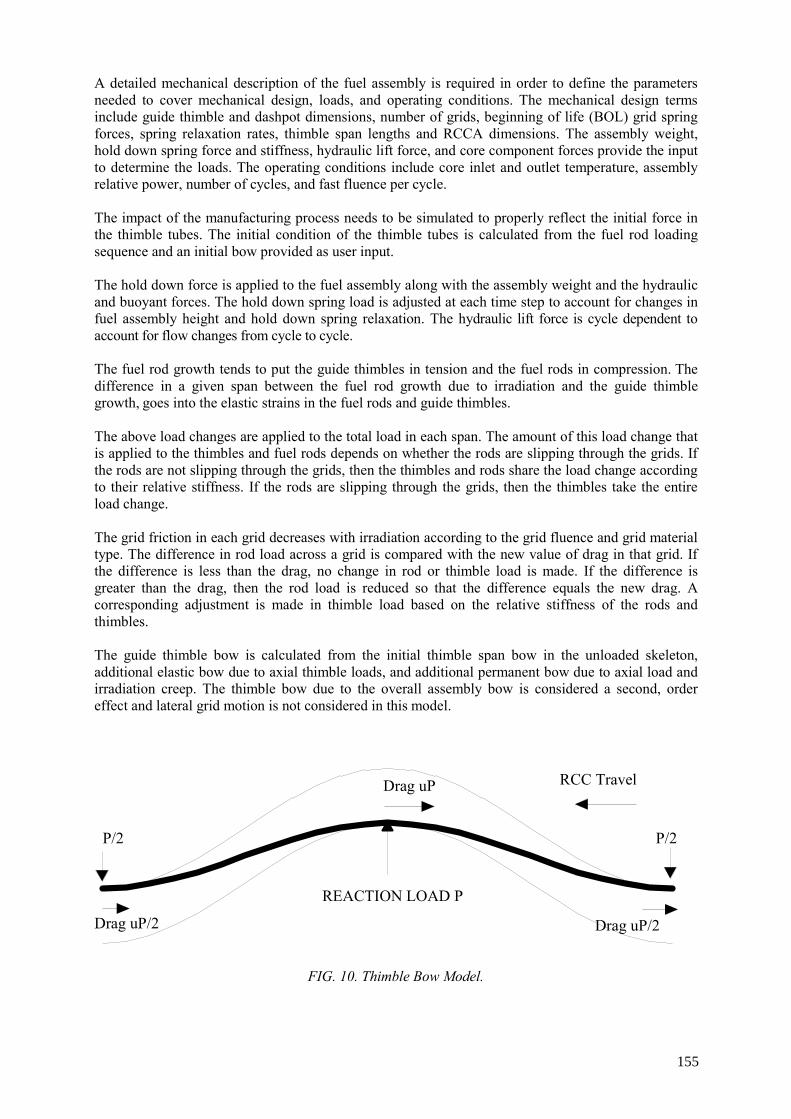
A detailed mechanical description of the fuel assembly is required in order to define the parameters needed to cover mechanical design, loads, and operating conditions. The mechanical design terms include guide thimble and dashpot dimensions, number of grids, beginning of life (BOL) grid spring forces, spring relaxation rates, thimble span lengths and RCCA dimensions. The assembly weight, hold down spring force and stiffness, hydraulic lift force, and core component forces provide the input to determine the loads. The operating conditions include core inlet and outlet temperature, assembly relative power, number of cycles, and fast fluence per cycle. The impact of the manufacturing process needs to be simulated to properly reflect the initial force in the thimble tubes. The initial condition of the thimble tubes is calculated from the fuel rod loading sequence and an initial bow provided as user input. The hold down force is applied to the fuel assembly along with the assembly weight and the hydraulic and buoyant forces. The hold down spring load is adjusted at each time step to account for changes in fuel assembly height and hold down spring relaxation. The hydraulic lift force is cycle dependent to account for flow changes from cycle to cycle. The fuel rod growth tends to put the guide thimbles in tension and the fuel rods in compression. The difference in a given span between the fuel rod growth due to irradiation and the guide thimble growth, goes into the elastic strains in the fuel rods and guide thimbles. The above load changes are applied to the total load in each span. The amount of this load change that is applied to the thimbles and fuel rods depends on whether the rods are slipping through the grids. If the rods are not slipping through the grids, then the thimbles and rods share the load change according to their relative stiffness. If the rods are slipping through the grids, then the thimbles take the entire load change. The grid friction in each grid decreases with irradiation according to the grid fluence and grid material type. The difference in rod load across a grid is compared with the new value of drag in that grid. If the difference is less than the drag, no change in rod or thimble load is made. If the difference is greater than the drag, then the rod load is reduced so that the difference equals the new drag. A corresponding adjustment is made in thimble load based on the relative stiffness of the rods and thimbles. The guide thimble bow is calculated from the initial thimble span bow in the unloaded skeleton, additional elastic bow due to axial thimble loads, and additional permanent bow due to axial load and irradiation creep. The thimble bow due to the overall assembly bow is considered a second, order effect and lateral grid motion is not considered in this model.
REACTION LOAD P
P/2 P/2
RCC Travel
Drag uP/2 Drag uP/2
Drag uP
FIG. 10. Thimble Bow Model.
155
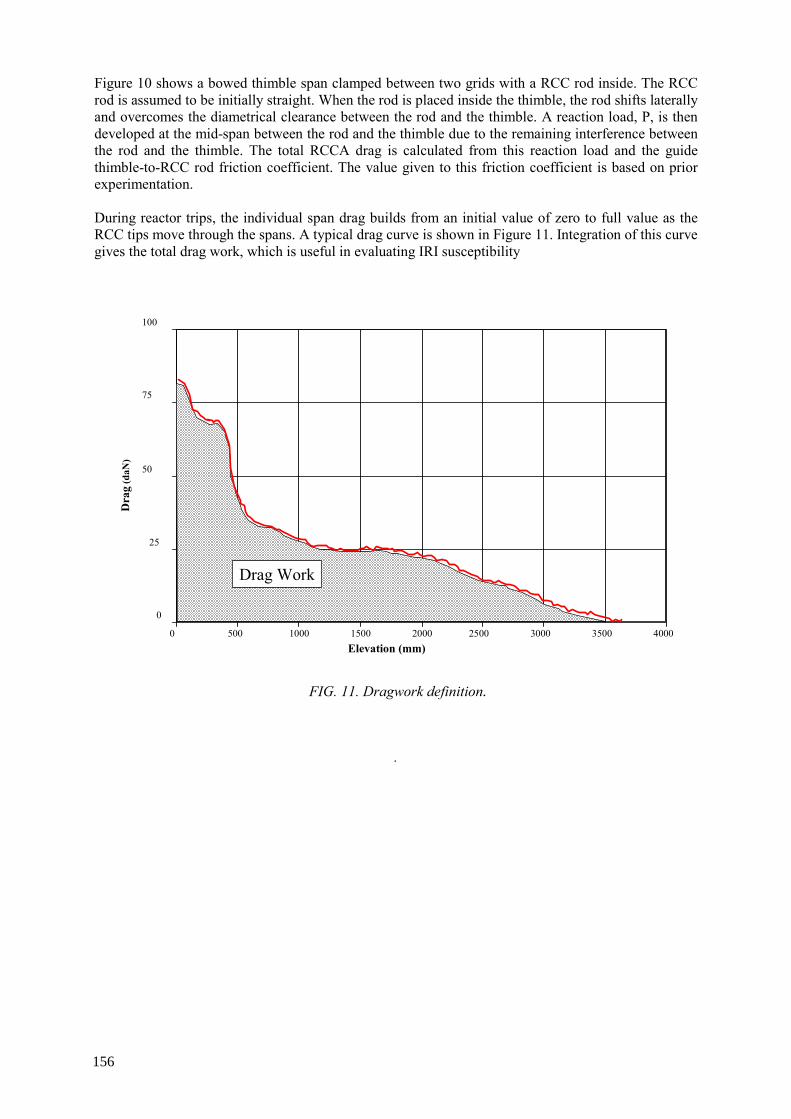
Figure 10 shows a bowed thimble span clamped between two grids with a RCC rod inside. The RCC rod is assumed to be initially straight. When the rod is placed inside the thimble, the rod shifts laterally and overcomes the diametrical clearance between the rod and the thimble. A reaction load, P, is then developed at the mid-span between the rod and the thimble due to the remaining interference between the rod and the thimble. The total RCCA drag is calculated from this reaction load and the guide thimble-to-RCC rod friction coefficient. The value given to this friction coefficient is based on prior experimentation. During reactor trips, the individual span drag builds from an initial value of zero to full value as the RCC tips move through the spans. A typical drag curve is shown in Figure 11. Integration of this curve gives the total drag work, which is useful in evaluating IRI susceptibility
FIG. 11. Dragwork definition.
.
Elevation (mm)
0
25
50
75
100
0 500 1000 1500 2000 2500 3000 3500 4000
Dra
g (d
aN)
Drag Work
156
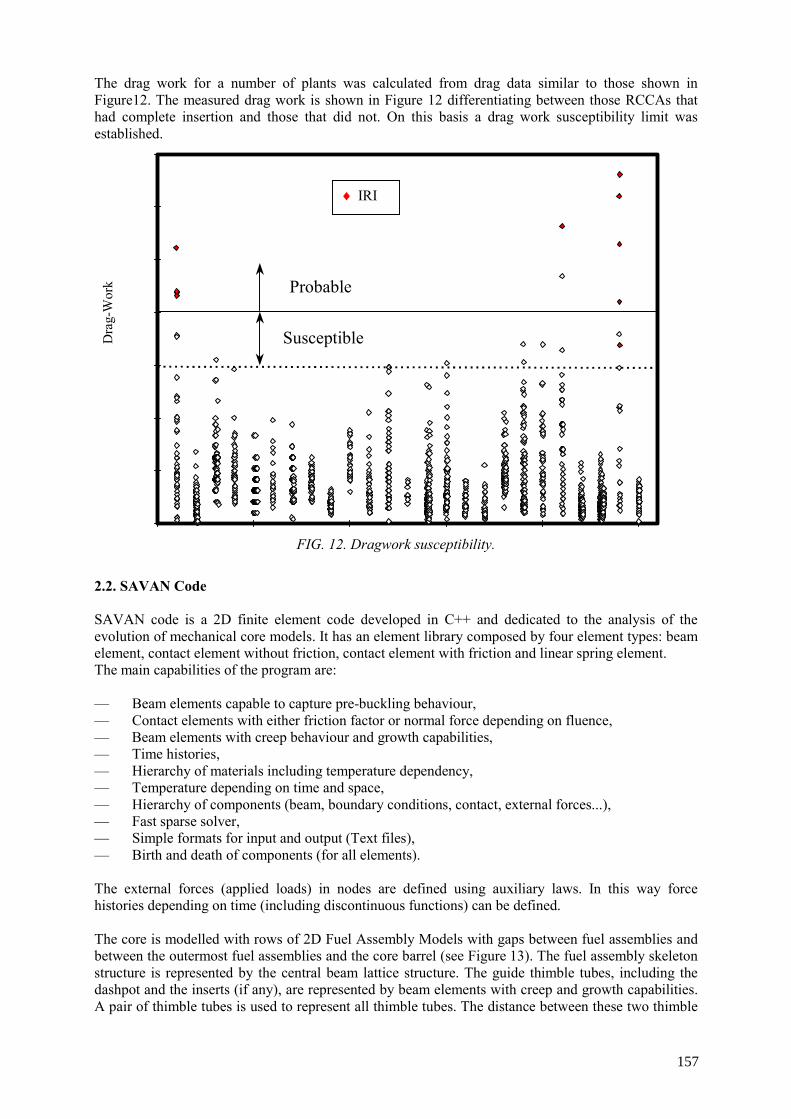
The drag work for a number of plants was calculated from drag data similar to those shown in Figure12. The measured drag work is shown in Figure 12 differentiating between those RCCAs that had complete insertion and those that did not. On this basis a drag work susceptibility limit was established.
FIG. 12. Dragwork susceptibility.
2.2. SAVAN Code SAVAN code is a 2D finite element code developed in C++ and dedicated to the analysis of the evolution of mechanical core models. It has an element library composed by four element types: beam element, contact element without friction, contact element with friction and linear spring element. The main capabilities of the program are: — Beam elements capable to capture pre-buckling behaviour, — Contact elements with either friction factor or normal force depending on fluence, — Beam elements with creep behaviour and growth capabilities, — Time histories, — Hierarchy of materials including temperature dependency, — Temperature depending on time and space, — Hierarchy of components (beam, boundary conditions, contact, external forces...), — Fast sparse solver, — Simple formats for input and output (Text files), — Birth and death of components (for all elements). The external forces (applied loads) in nodes are defined using auxiliary laws. In this way force histories depending on time (including discontinuous functions) can be defined. The core is modelled with rows of 2D Fuel Assembly Models with gaps between fuel assemblies and between the outermost fuel assemblies and the core barrel (see Figure 13). The fuel assembly skeleton structure is represented by the central beam lattice structure. The guide thimble tubes, including the dashpot and the inserts (if any), are represented by beam elements with creep and growth capabilities. A pair of thimble tubes is used to represent all thimble tubes. The distance between these two thimble
Dra
g-W
ork
Susceptible
Probable
♦ IRI
157
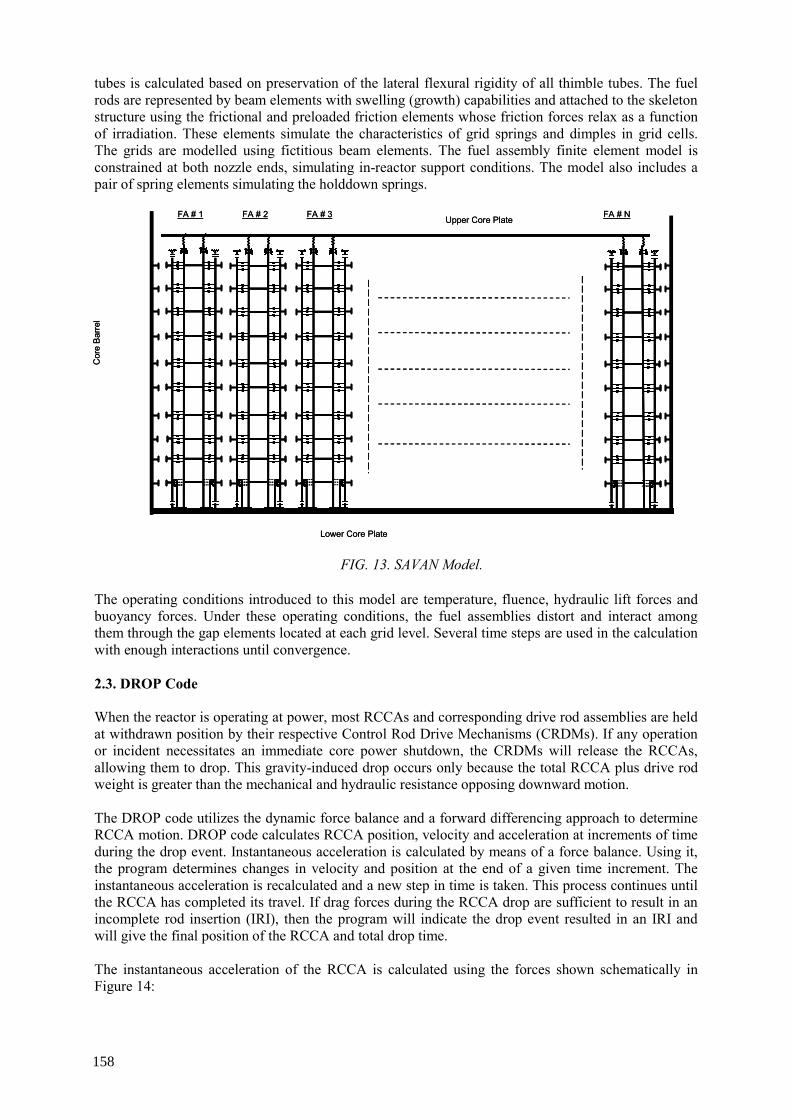
tubes is calculated based on preservation of the lateral flexural rigidity of all thimble tubes. The fuel rods are represented by beam elements with swelling (growth) capabilities and attached to the skeleton structure using the frictional and preloaded friction elements whose friction forces relax as a function of irradiation. These elements simulate the characteristics of grid springs and dimples in grid cells. The grids are modelled using fictitious beam elements. The fuel assembly finite element model is constrained at both nozzle ends, simulating in-reactor support conditions. The model also includes a pair of spring elements simulating the holddown springs.
The operating conditions introduced to this model are temperature, fluence, hydraulic lift forces and buoyancy forces. Under these operating conditions, the fuel assemblies distort and interact among them through the gap elements located at each grid level. Several time steps are used in the calculation with enough interactions until convergence. 2.3. DROP Code When the reactor is operating at power, most RCCAs and corresponding drive rod assemblies are held at withdrawn position by their respective Control Rod Drive Mechanisms (CRDMs). If any operation or incident necessitates an immediate core power shutdown, the CRDMs will release the RCCAs, allowing them to drop. This gravity-induced drop occurs only because the total RCCA plus drive rod weight is greater than the mechanical and hydraulic resistance opposing downward motion. The DROP code utilizes the dynamic force balance and a forward differencing approach to determine RCCA motion. DROP code calculates RCCA position, velocity and acceleration at increments of time during the drop event. Instantaneous acceleration is calculated by means of a force balance. Using it, the program determines changes in velocity and position at the end of a given time increment. The instantaneous acceleration is recalculated and a new step in time is taken. This process continues until the RCCA has completed its travel. If drag forces during the RCCA drop are sufficient to result in an incomplete rod insertion (IRI), then the program will indicate the drop event resulted in an IRI and will give the final position of the RCCA and total drop time. The instantaneous acceleration of the RCCA is calculated using the forces shown schematically in Figure 14:
Cor
e B
arre
l
Lower Core Plate
Upper Core PlateFA # 2 FA # 3 FA # NFA # 1
Cor
e B
arre
l
Lower Core Plate
Upper Core PlateFA # 2 FA # 3 FA # NFA # 1
FIG. 13. SAVAN Model.
158
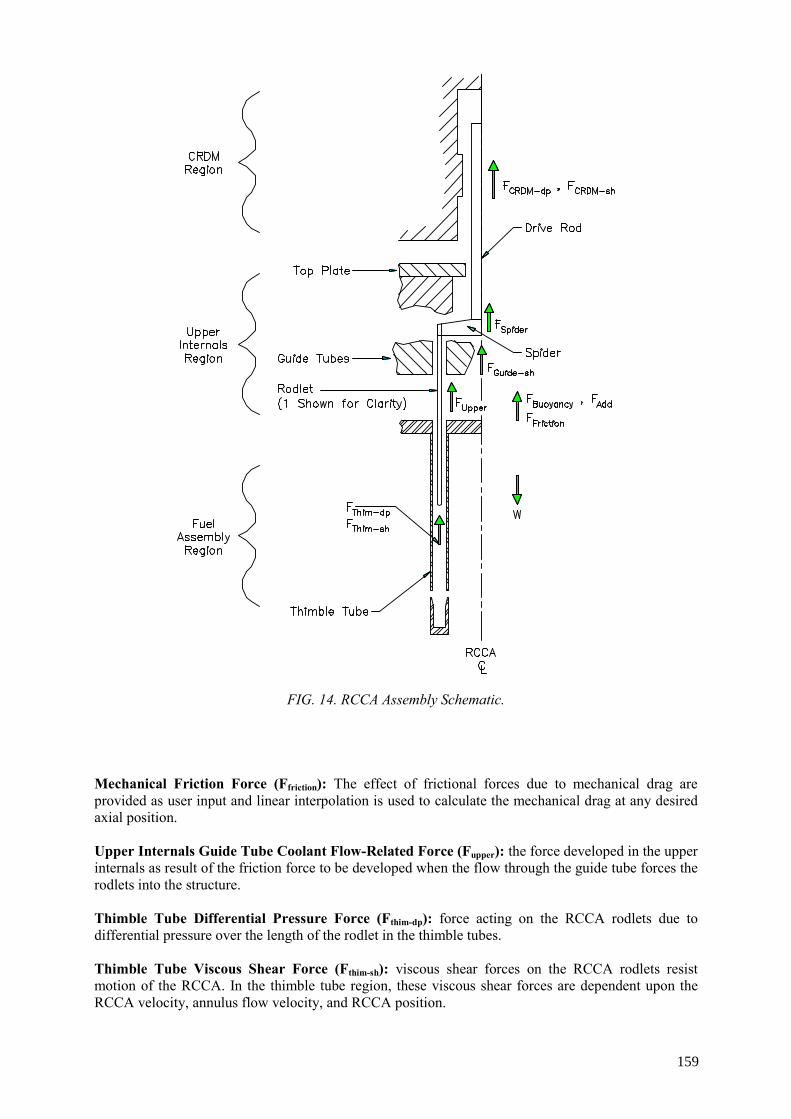
FIG. 14. RCCA Assembly Schematic.
Mechanical Friction Force (Ffriction): The effect of frictional forces due to mechanical drag are provided as user input and linear interpolation is used to calculate the mechanical drag at any desired axial position. Upper Internals Guide Tube Coolant Flow-Related Force (Fupper): the force developed in the upper internals as result of the friction force to be developed when the flow through the guide tube forces the rodlets into the structure. Thimble Tube Differential Pressure Force (Fthim-dp): force acting on the RCCA rodlets due to differential pressure over the length of the rodlet in the thimble tubes. Thimble Tube Viscous Shear Force (Fthim-sh): viscous shear forces on the RCCA rodlets resist motion of the RCCA. In the thimble tube region, these viscous shear forces are dependent upon the RCCA velocity, annulus flow velocity, and RCCA position.
159
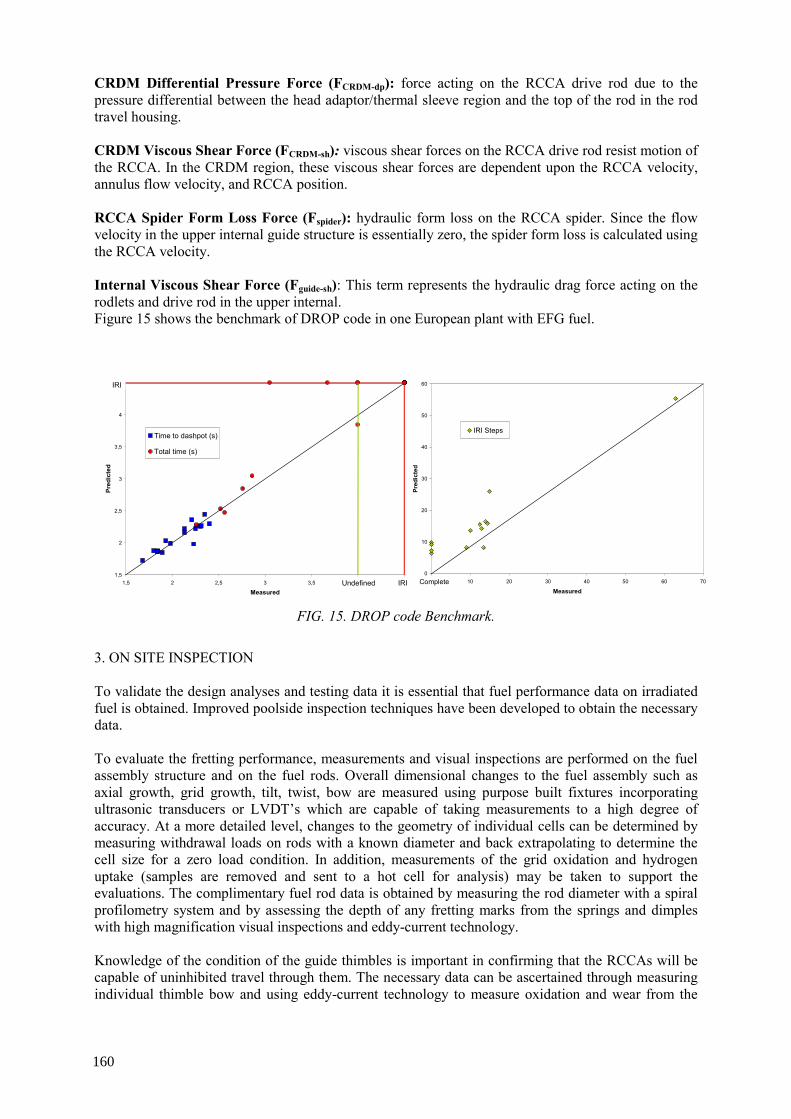
CRDM Differential Pressure Force (FCRDM-dp): force acting on the RCCA drive rod due to the pressure differential between the head adaptor/thermal sleeve region and the top of the rod in the rod travel housing. CRDM Viscous Shear Force (FCRDM-sh): viscous shear forces on the RCCA drive rod resist motion of the RCCA. In the CRDM region, these viscous shear forces are dependent upon the RCCA velocity, annulus flow velocity, and RCCA position. RCCA Spider Form Loss Force (Fspider): hydraulic form loss on the RCCA spider. Since the flow velocity in the upper internal guide structure is essentially zero, the spider form loss is calculated using the RCCA velocity. Internal Viscous Shear Force (Fguide-sh): This term represents the hydraulic drag force acting on the rodlets and drive rod in the upper internal. Figure 15 shows the benchmark of DROP code in one European plant with EFG fuel.
FIG. 15. DROP code Benchmark.
3. ON SITE INSPECTION To validate the design analyses and testing data it is essential that fuel performance data on irradiated fuel is obtained. Improved poolside inspection techniques have been developed to obtain the necessary data. To evaluate the fretting performance, measurements and visual inspections are performed on the fuel assembly structure and on the fuel rods. Overall dimensional changes to the fuel assembly such as axial growth, grid growth, tilt, twist, bow are measured using purpose built fixtures incorporating ultrasonic transducers or LVDT’s which are capable of taking measurements to a high degree of accuracy. At a more detailed level, changes to the geometry of individual cells can be determined by measuring withdrawal loads on rods with a known diameter and back extrapolating to determine the cell size for a zero load condition. In addition, measurements of the grid oxidation and hydrogen uptake (samples are removed and sent to a hot cell for analysis) may be taken to support the evaluations. The complimentary fuel rod data is obtained by measuring the rod diameter with a spiral profilometry system and by assessing the depth of any fretting marks from the springs and dimples with high magnification visual inspections and eddy-current technology. Knowledge of the condition of the guide thimbles is important in confirming that the RCCAs will be capable of uninhibited travel through them. The necessary data can be ascertained through measuring individual thimble bow and using eddy-current technology to measure oxidation and wear from the
1,5
2
2,5
3
3,5
4
4,5
1,5 2 2,5 3 3,5 4 4,5
Measured
Pred
icte
d
Time to dashpot (s)
Total time (s)
IRI
IRIUndefined0
10
20
30
40
50
60
0 10 20 30 40 50 60 70
Measured
Pred
icte
d
IRI Steps
Complete
160
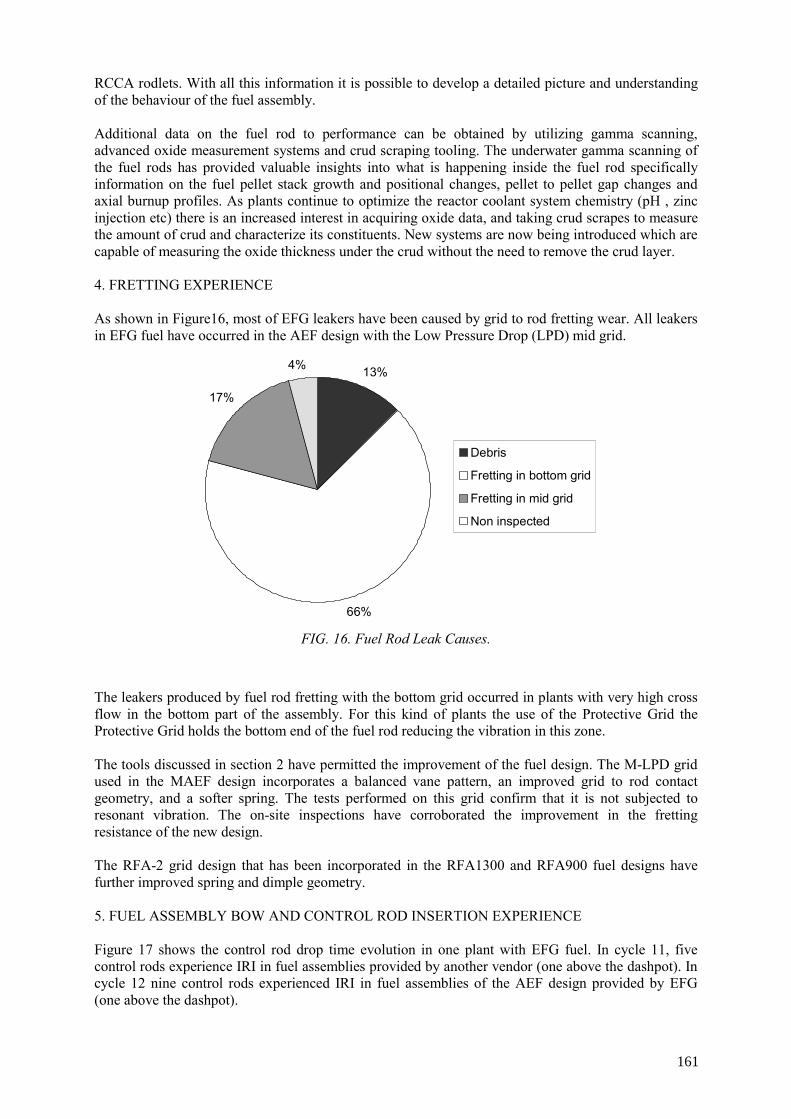
RCCA rodlets. With all this information it is possible to develop a detailed picture and understanding of the behaviour of the fuel assembly. Additional data on the fuel rod to performance can be obtained by utilizing gamma scanning, advanced oxide measurement systems and crud scraping tooling. The underwater gamma scanning of the fuel rods has provided valuable insights into what is happening inside the fuel rod specifically information on the fuel pellet stack growth and positional changes, pellet to pellet gap changes and axial burnup profiles. As plants continue to optimize the reactor coolant system chemistry (pH , zinc injection etc) there is an increased interest in acquiring oxide data, and taking crud scrapes to measure the amount of crud and characterize its constituents. New systems are now being introduced which are capable of measuring the oxide thickness under the crud without the need to remove the crud layer. 4. FRETTING EXPERIENCE As shown in Figure16, most of EFG leakers have been caused by grid to rod fretting wear. All leakers in EFG fuel have occurred in the AEF design with the Low Pressure Drop (LPD) mid grid.
FIG. 16. Fuel Rod Leak Causes.
The leakers produced by fuel rod fretting with the bottom grid occurred in plants with very high cross flow in the bottom part of the assembly. For this kind of plants the use of the Protective Grid the Protective Grid holds the bottom end of the fuel rod reducing the vibration in this zone. The tools discussed in section 2 have permitted the improvement of the fuel design. The M-LPD grid used in the MAEF design incorporates a balanced vane pattern, an improved grid to rod contact geometry, and a softer spring. The tests performed on this grid confirm that it is not subjected to resonant vibration. The on-site inspections have corroborated the improvement in the fretting resistance of the new design. The RFA-2 grid design that has been incorporated in the RFA1300 and RFA900 fuel designs have further improved spring and dimple geometry. 5. FUEL ASSEMBLY BOW AND CONTROL ROD INSERTION EXPERIENCE Figure 17 shows the control rod drop time evolution in one plant with EFG fuel. In cycle 11, five control rods experience IRI in fuel assemblies provided by another vendor (one above the dashpot). In cycle 12 nine control rods experienced IRI in fuel assemblies of the AEF design provided by EFG (one above the dashpot).
13%
66%
17%
4%
Debris
Fretting in bottom grid
Fretting in mid grid
Non inspected
161
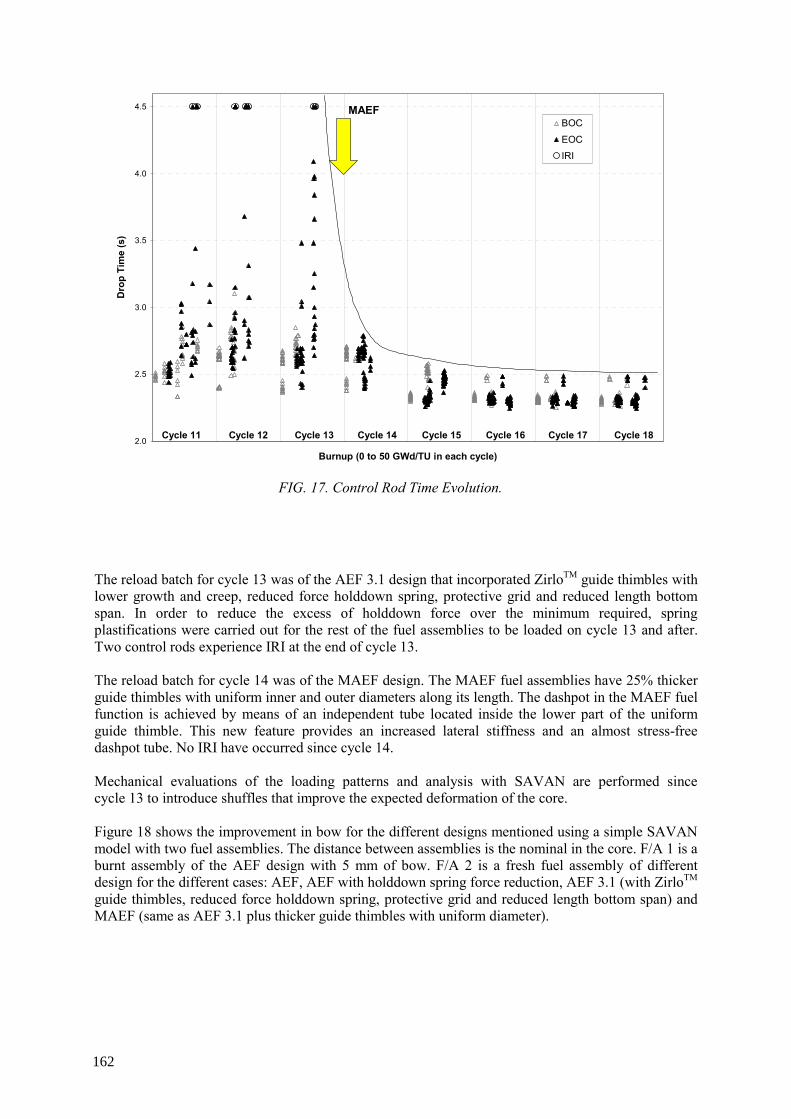
FIG. 17. Control Rod Time Evolution.
The reload batch for cycle 13 was of the AEF 3.1 design that incorporated ZirloTM guide thimbles with lower growth and creep, reduced force holddown spring, protective grid and reduced length bottom span. In order to reduce the excess of holddown force over the minimum required, spring plastifications were carried out for the rest of the fuel assemblies to be loaded on cycle 13 and after. Two control rods experience IRI at the end of cycle 13. The reload batch for cycle 14 was of the MAEF design. The MAEF fuel assemblies have 25% thicker guide thimbles with uniform inner and outer diameters along its length. The dashpot in the MAEF fuel function is achieved by means of an independent tube located inside the lower part of the uniform guide thimble. This new feature provides an increased lateral stiffness and an almost stress-free dashpot tube. No IRI have occurred since cycle 14. Mechanical evaluations of the loading patterns and analysis with SAVAN are performed since cycle 13 to introduce shuffles that improve the expected deformation of the core. Figure 18 shows the improvement in bow for the different designs mentioned using a simple SAVAN model with two fuel assemblies. The distance between assemblies is the nominal in the core. F/A 1 is a burnt assembly of the AEF design with 5 mm of bow. F/A 2 is a fresh fuel assembly of different design for the different cases: AEF, AEF with holddown spring force reduction, AEF 3.1 (with ZirloTM guide thimbles, reduced force holddown spring, protective grid and reduced length bottom span) and MAEF (same as AEF 3.1 plus thicker guide thimbles with uniform diameter).
2.0
2.5
3.0
3.5
4.0
4.5
Burnup (0 to 50 GWd/TU in each cycle)
Dro
p Ti
me
(s)
BOC
EOC
IRI
Cycle 11 Cycle 12 Cycle 13 Cycle 14 Cycle 15 Cycle 16 Cycle 17 Cycle 18
MAEF
162
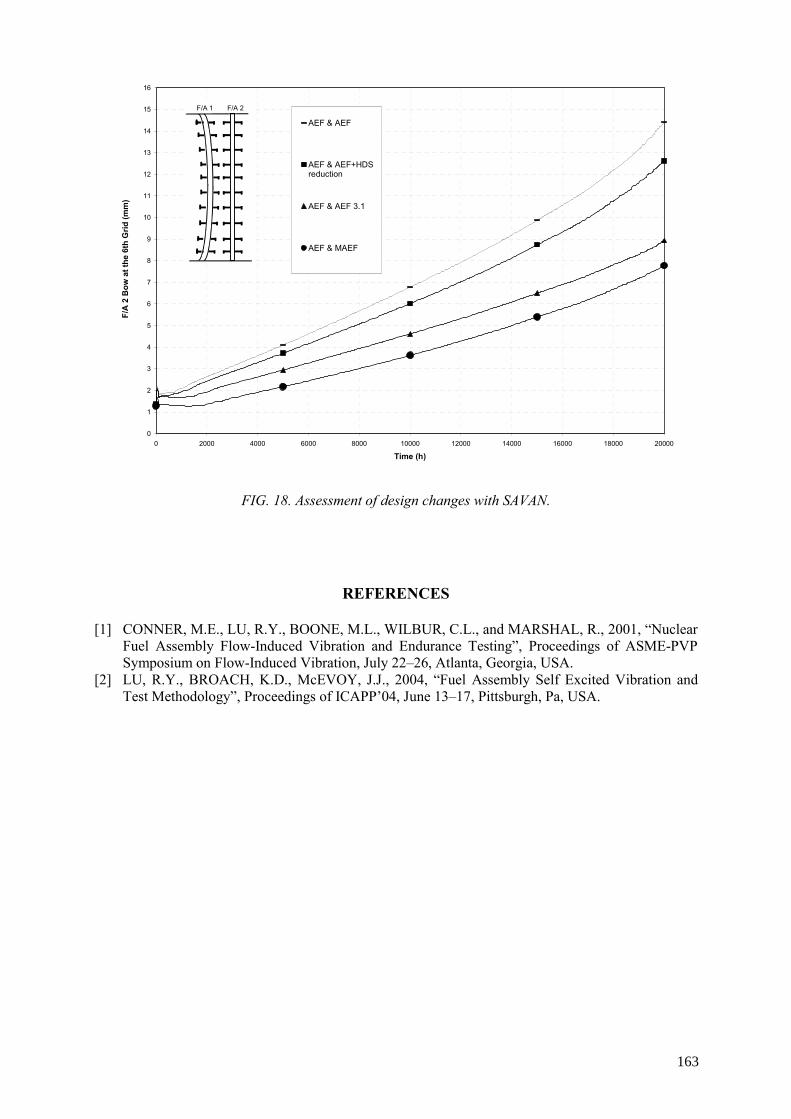
0
1
2
3
4
5
6
7
8
9
10
11
12
13
14
15
16
0 2000 4000 6000 8000 10000 12000 14000 16000 18000 20000
Time (h)
F/A
2 B
ow a
t the
6th
Grid
(mm
) AEF & AEF
AEF & AEF+HDSreduction
AEF & AEF 3.1
AEF & MAEF
F/A 1 F/A 2
FIG. 18. Assessment of design changes with SAVAN.
REFERENCES
[1] CONNER, M.E., LU, R.Y., BOONE, M.L., WILBUR, C.L., and MARSHAL, R., 2001, “Nuclear Fuel Assembly Flow-Induced Vibration and Endurance Testing”, Proceedings of ASME-PVP Symposium on Flow-Induced Vibration, July 22–26, Atlanta, Georgia, USA.
[2] LU, R.Y., BROACH, K.D., McEVOY, J.J., 2004, “Fuel Assembly Self Excited Vibration and Test Methodology”, Proceedings of ICAPP’04, June 13–17, Pittsburgh, Pa, USA.
163

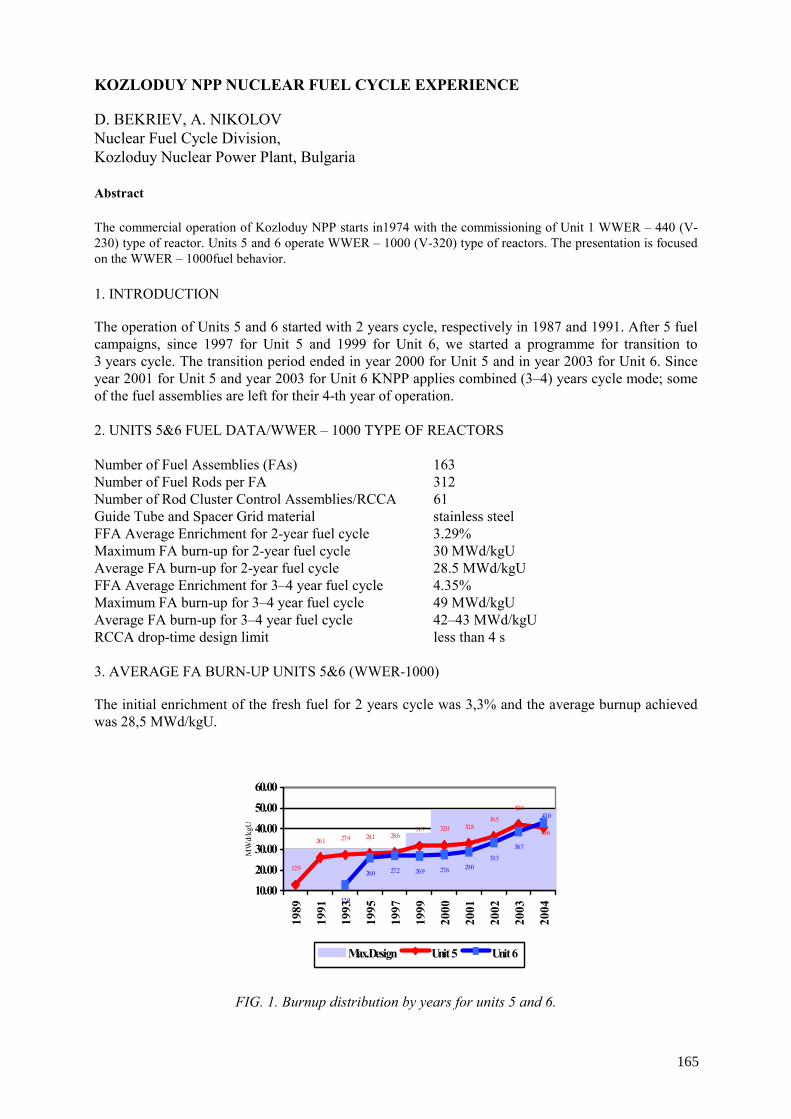
KOZLODUY NPP NUCLEAR FUEL CYCLE EXPERIENCE
D. BEKRIEV, A. NIKOLOV Nuclear Fuel Cycle Division, Kozloduy Nuclear Power Plant, Bulgaria Abstract The commercial operation of Kozloduy NPP starts in1974 with the commissioning of Unit 1 WWER – 440 (V-230) type of reactor. Units 5 and 6 operate WWER – 1000 (V-320) type of reactors. The presentation is focused on the WWER – 1000fuel behavior. 1. INTRODUCTION The operation of Units 5 and 6 started with 2 years cycle, respectively in 1987 and 1991. After 5 fuel campaigns, since 1997 for Unit 5 and 1999 for Unit 6, we started a programme for transition to 3 years cycle. The transition period ended in year 2000 for Unit 5 and in year 2003 for Unit 6. Since year 2001 for Unit 5 and year 2003 for Unit 6 KNPP applies combined (3–4) years cycle mode; some of the fuel assemblies are left for their 4-th year of operation. 2. UNITS 5&6 FUEL DATA/WWER – 1000 TYPE OF REACTORS Number of Fuel Assemblies (FAs) 163 Number of Fuel Rods per FA 312 Number of Rod Cluster Control Assemblies/RCCA 61 Guide Tube and Spacer Grid material stainless steel FFA Average Enrichment for 2-year fuel cycle 3.29% Maximum FA burn-up for 2-year fuel cycle 30 MWd/kgU Average FA burn-up for 2-year fuel cycle 28.5 MWd/kgU FFA Average Enrichment for 3–4 year fuel cycle 4.35% Maximum FA burn-up for 3–4 year fuel cycle 49 MWd/kgU Average FA burn-up for 3–4 year fuel cycle 42–43 MWd/kgU RCCA drop-time design limit less than 4 s 3. AVERAGE FA BURN-UP UNITS 5&6 (WWER-1000) The initial enrichment of the fresh fuel for 2 years cycle was 3,3% and the average burnup achieved was 28,5 MWd/kgU.
FIG. 1. Burnup distribution by years for units 5 and 6.
12.9
26.1 27.4 28.1 28.631.7 32.0 32.8
36.5
42.0
12.9
26.0 27.2 26.9 27.6 29.033.3
38.7
40.6
43.0
10.00
20.00
30.00
40.00
50.00
60.00
1989
1991
1993
1995
1997
1999
2000
2001
2002
2003
2004
MW
d/kg
U
Max.Design Unit 5 Unit 6
165
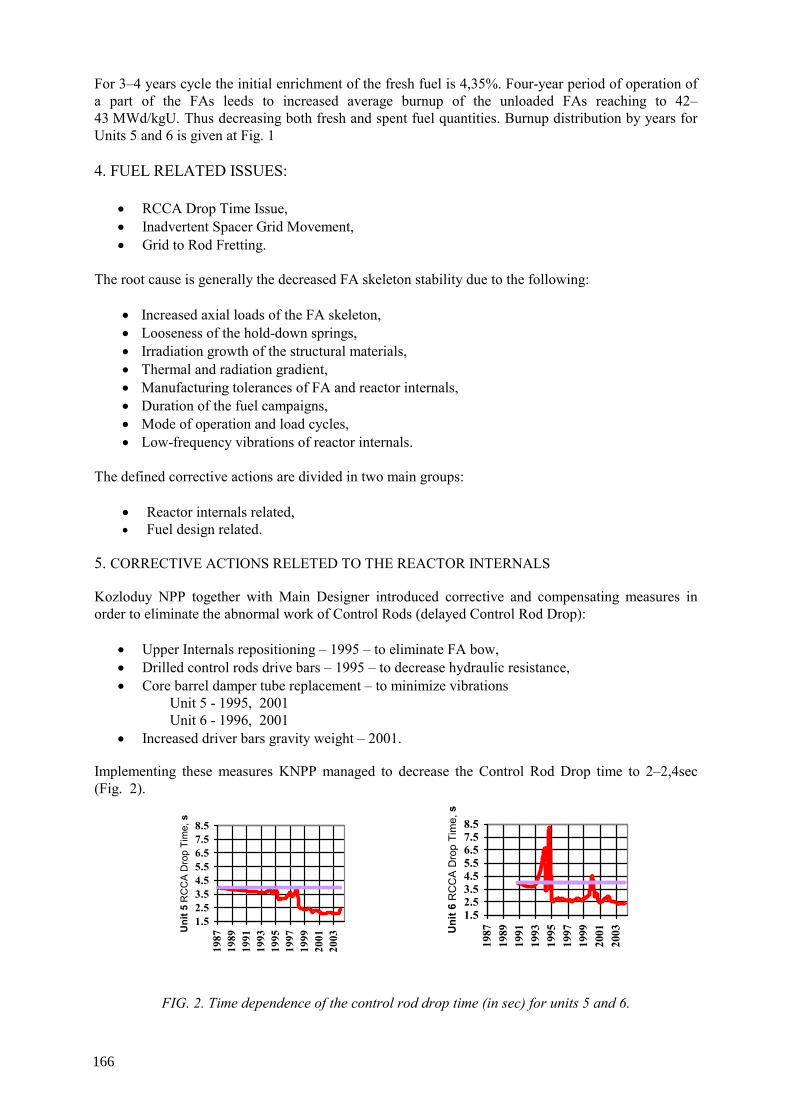
For 3–4 years cycle the initial enrichment of the fresh fuel is 4,35%. Four-year period of operation of a part of the FAs leeds to increased average burnup of the unloaded FAs reaching to 42–43 MWd/kgU. Thus decreasing both fresh and spent fuel quantities. Burnup distribution by years for Units 5 and 6 is given at Fig. 1 4. FUEL RELATED ISSUES:
• RCCA Drop Time Issue, • Inadvertent Spacer Grid Movement, • Grid to Rod Fretting.
The root cause is generally the decreased FA skeleton stability due to the following:
• Increased axial loads of the FA skeleton, • Looseness of the hold-down springs, • Irradiation growth of the structural materials, • Thermal and radiation gradient, • Manufacturing tolerances of FA and reactor internals, • Duration of the fuel campaigns, • Mode of operation and load cycles, • Low-frequency vibrations of reactor internals.
The defined corrective actions are divided in two main groups:
• Reactor internals related, • Fuel design related.
5. CORRECTIVE ACTIONS RELETED TO THE REACTOR INTERNALS Kozloduy NPP together with Main Designer introduced corrective and compensating measures in order to eliminate the abnormal work of Control Rods (delayed Control Rod Drop):
• Upper Internals repositioning – 1995 – to eliminate FA bow, • Drilled control rods drive bars – 1995 – to decrease hydraulic resistance, • Core barrel damper tube replacement – to minimize vibrations
Unit 5 - 1995, 2001 Unit 6 - 1996, 2001
• Increased driver bars gravity weight – 2001.
Implementing these measures KNPP managed to decrease the Control Rod Drop time to 2–2,4sec (Fig. 2).
FIG. 2. Time dependence of the control rod drop time (in sec) for units 5 and 6.
1.52.53.54.55.56.57.58.5
1987
1989
1991
1993
1995
1997
1999
2001
2003
Uni
t 5 R
CC
A D
rop
Tim
e, s
1.52.53.54.55.56.57.58.5
1987
1989
1991
1993
1995
1997
1999
2001
2003U
nit 6
RC
CA
Dro
p Ti
me,
s
166
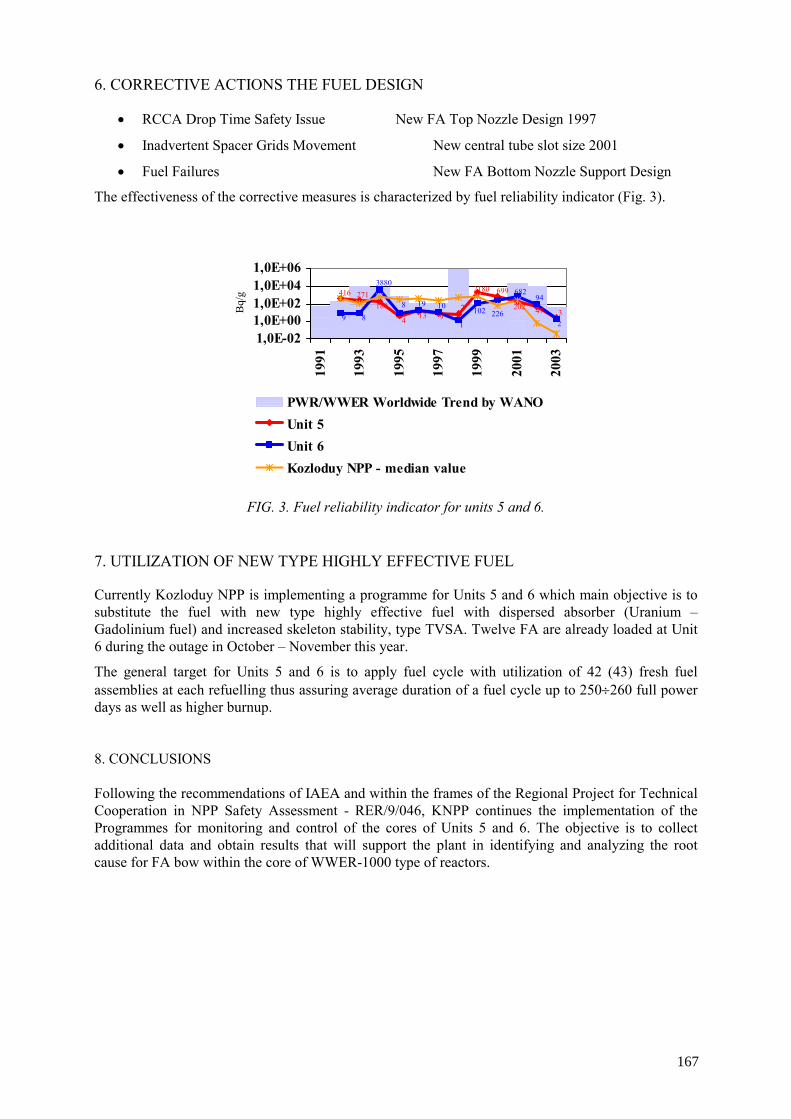
6. CORRECTIVE ACTIONS THE FUEL DESIGN
• RCCA Drop Time Safety Issue New FA Top Nozzle Design 1997
• Inadvertent Spacer Grids Movement New central tube slot size 2001
• Fuel Failures New FA Bottom Nozzle Support Design
The effectiveness of the corrective measures is characterized by fuel reliability indicator (Fig. 3).
FIG. 3. Fuel reliability indicator for units 5 and 6. 7. UTILIZATION OF NEW TYPE HIGHLY EFFECTIVE FUEL Currently Kozloduy NPP is implementing a programme for Units 5 and 6 which main objective is to substitute the fuel with new type highly effective fuel with dispersed absorber (Uranium – Gadolinium fuel) and increased skeleton stability, type TVSA. Twelve FA are already loaded at Unit 6 during the outage in October – November this year.
The general target for Units 5 and 6 is to apply fuel cycle with utilization of 42 (43) fresh fuel assemblies at each refuelling thus assuring average duration of a fuel cycle up to 250÷260 full power days as well as higher burnup. 8. CONCLUSIONS Following the recommendations of IAEA and within the frames of the Regional Project for Technical Cooperation in NPP Safety Assessment - RER/9/046, KNPP continues the implementation of the Programmes for monitoring and control of the cores of Units 5 and 6. The objective is to collect additional data and obtain results that will support the plant in identifying and analyzing the root cause for FA bow within the core of WWER-1000 type of reactors.
226 3
416 271
97 47202
2180 699
134
188
29 8
1
1094
682
102198
3880
1,0E-021,0E+001,0E+021,0E+041,0E+06
1991
1993
1995
1997
1999
2001
2003
Bq/
g
PWR/WWER Worldwide Trend by WANOUnit 5Unit 6Kozloduy NPP - median value
167

DESIGN MEASURES FOR PROVIDING GEOMETRICAL STABILITY OF WWER REACTOR CORES I.N. VASILCHENKO OKB “Gidropress” Podolsk A.A. ENIN JSC NZKhK Novosibirsk V.M. TROYANOV, V.L. MOLCHANOV JSC “TVEL” Moscow Russian Federation Abstract The problem of assemblies bowing in WWER-1000 reactor cores arose in the middle of the nineties. At present this problem has been solved by a set of design measures. The main of them are: decrease in hold-down force more compact FA placing in the core, increase in rigidity of assemblies as well as modification of fitting surfaces in the reactor internals. In this case utilization of welded skeletons in FAs became a radical way of increasing FA rigidity. Traditional jacket-free design has been implemented in a new design of fuel assembly TVS-2. The report contains information on the structure of new assembly TVS-2 current results of AFA and TVS-2 operation, scope for further designing of structure of WWER reactor cores to provide meeting the Customer’s request. 1. INTRODUCTION The core design of modern WWER makes use of a principle of cluster control based on PWR experience. However there is difference consisting in the fact that the weight of RCCA in WWER is less than that in PWR. It is worse from the viewpoint of overcoming the friction forces but better for diagnosing the core status. Therefore, a problem of WWER core bowing has manifested itself to the greater extent as a delay in reactor scram (more than 4 seconds as established in the project).
The first measure to overcome this problem is transition in 1986 for RCCA position indicator having no kinematic link with the extension shaft. However, at transition for 3-year lifetime, since 1992 the delay in reactor scram has manifested itself again. From that time, the systematic efforts have been made to reveal and eliminate the causes and to implement the compensating measures. The detailed information on this has been already discussed at IAEA workshops. However, a problem of geometrical stability of the reactor cores is multi-factorial one, and although this problem has been overcome there appears a new information to be of significance at reaching the high burnup. Solution of question on geometrical stability of the WWER-1000 cores has resulted in development of two modified assemblies with rigid skeleton such as TVS-A (angular version) and TVS-2. This paper deals with the jacket-free, non-angular assemblies including the TVS-2. 2. BASIC OPERATIONAL FACTORS THAT INFLUENCE ASSEMBLY DISTORTION
During operation the core fuel assemblies undergo influence of the numerous operational factors affecting not only the structural state of materials but also the FA form as a whole.
169
• As a result of fuel cycle improvement the FA are in the core for a long time (~5 years) under the large hold-down force ensuring their non-lifting;
• The fuel rod claddings counteract the high external pressure (160 kg/cm2) and temperature (350°С). It leads to reduction of the fuel rod diameter and significant decrease of fuel rod friction in the spacing grid cells;
• Intensive irradiation results in radiation creeping. With this, mechanical loads make contribution of uncertainty into evaluation of radiation creeping rate;
• During FA shuffling the latter appear to be in areas of large neutron gradients and temperatures, which can result in distortion;
• Power variation leads to temperature change, which despite of insignificant value, results in micro-displacement of the fuel rod in axial direction;
• At last, inevitable heterogeneity of materials (zirconium, stainless steel) results in increase of interassembly spaces and reduction of FA interaction.
3. CAUSES FOR FA GEOMETRICAL INSTABILITY AND MEASURE FOR THEIR ELIMINATION
The basic reason for FA geometrical instability was formulated earlier as bowing caused by increased hold-down force and thermomechanical processes in FA. Parametrical calculations and experiments give the comparative evaluation of impact of the separate factors. Certainly, the most important factor is the hold-down force. Its choice is caused by relatively large hydrodynamic force in WWER and by relaxation of spring material. In addition, provision for FA non-lifting requires the conservative approach on geometrical uncertainties of the reactor internals. Several important measures have been realized to decrease this force in WWER-1000.
• Reactor heating-up to temperature 200°С is performed with the decreased number of pumps
(3 pieces) in operation. Thus, maximum axial pressure differential to be realized with the cold water is excluded;
• Reactor internals structure has complicated axial dimensions and the large tolerances between the assembly fitting dimensions can be realized despite of control assembling. With this purpose the real position of FA caps as regards the reactor main joint were measured at all Units and the position of protective tube units through which the FA compression is provided was adjusted;
• Essential reconstruction of FA caps was performed. The spring material was replaced and the spring motion was twice increased that resulted in the stable reduced forces of FA compression.
During startup of new Unit at Rostov NPP a special attention was paid to geometry of fitting surfaces of the reactor internals because the pre-calculations showed large dependence of FA bowing upon accuracy of these surfaces. It was revealed that the significant number of supporting thimbles does not provide free vertical position of the FA. In this connection, evaluation and modification of supporting thimbles was introduced into practice of further activities for the new Units. The important factor is more compact FA placing in the core. Obviously, the more compact is the core the more significant is FA mutual support. The nature of zirconium alloys is such that during heatup the FA gaps are increasing. To compensate for this increase the initial “width across flats” dimension of FA is increased on the average by 1 mm.
The following factor is increase in the FA individual rigidity. For initial design of zirconium AF (of AFA type), all reserves have been implemented by the dimensions of guiding channels. For more significant increase in rigidity it was required to redesign the FA. The new FA was named as TVS-2.
170

A set of measures undertaken allows one to ensure AFA reliable operation at new Units. To provide reliable operation of FA at operable Units with WWER-1000 a new design of TVS-2 has been designed and is under implementation.
4. CORRECTIVE MEASURES FOR SAFETY ASSURANCE
Except for the above measures being realized at the Units and in the FA structures the additional measures have been implemented to enhance reliability of emergency protection and to assure heat-engineering reliability.
• To improve EP reliability the RCCA weight has been increased. It is ensured due to
application of dysprosium titanate in the lower ends of rods that at the same time gave a large effect on service life extension;
• Hydrodynamic braking of RCCA due to decrease in coolant flow rate through the guiding channels has been reduced;
• Analytical estimations of available margins on safety assurance during off-design EP actuation have been made. The results of these calculations were considered at IAEA workshop. Calculations of the governing accidents have shown presence of significant margins;
• In-pile measurements of FA bowing at all Units were made to provide heat-engineering reliability. Technology, scope and results of these measurements were considered at IAEA workshop in Řeš. As a result of these measurements the model of core behavior was created and the so-called generalized procedure of calculation analysis was developed. This procedure is based on consideration of the increased interassembly spaces and establishment of the corresponding restrictions for fuel rod at a stage of fuel-load formation and in-service inspection.
5. STAGES OF MEASURE IMPLEMENTATION 2001 Implementation of RCCA position indicators without kinematical connection; 2002 Reconstruction of fuel assemblies and RCCA; 2003 Termination of other measures for the reactor as a whole. Startup of the Unit at Rostov
NPP; 2004 Beginning of operation of the new jacket-free assemblies TVS-2.
6. INFLUENCE OF FUEL CYCLES ON FUEL ASSEMBLY DISTORTION
Two types of fuel cycles are realized at WWER-1000. The first fuel cycle is the maximum number of refuelings with duration between refueling ≈300 EFPD. The second fuel cycle - with maximum duration between refuelings whose number in this case, respectively, is less. In the first type, uranium will be used most effectively. In the second type - maximum amount of electrical energy will be generated; however, efficiency of fuel utilization will be inevitably reduced due to decrease in average burnup. For maximum initial enrichment in 5% U235 the maximum permissible average burnup amounts to 70 MW.d/kgU. Restriction of the number of refuelings reduces this index. For example, during 5-year fuel cycle it amounts to about 60 MW.d /kgU. Evolution of fuel cycles for WWER-1000 is shown in Fig. 1. On the basis of operation experience after burnup ∼ 27–30 MW*d/kg U the friction of fuel rod in spacing grid cells is significantly decreasing.
171
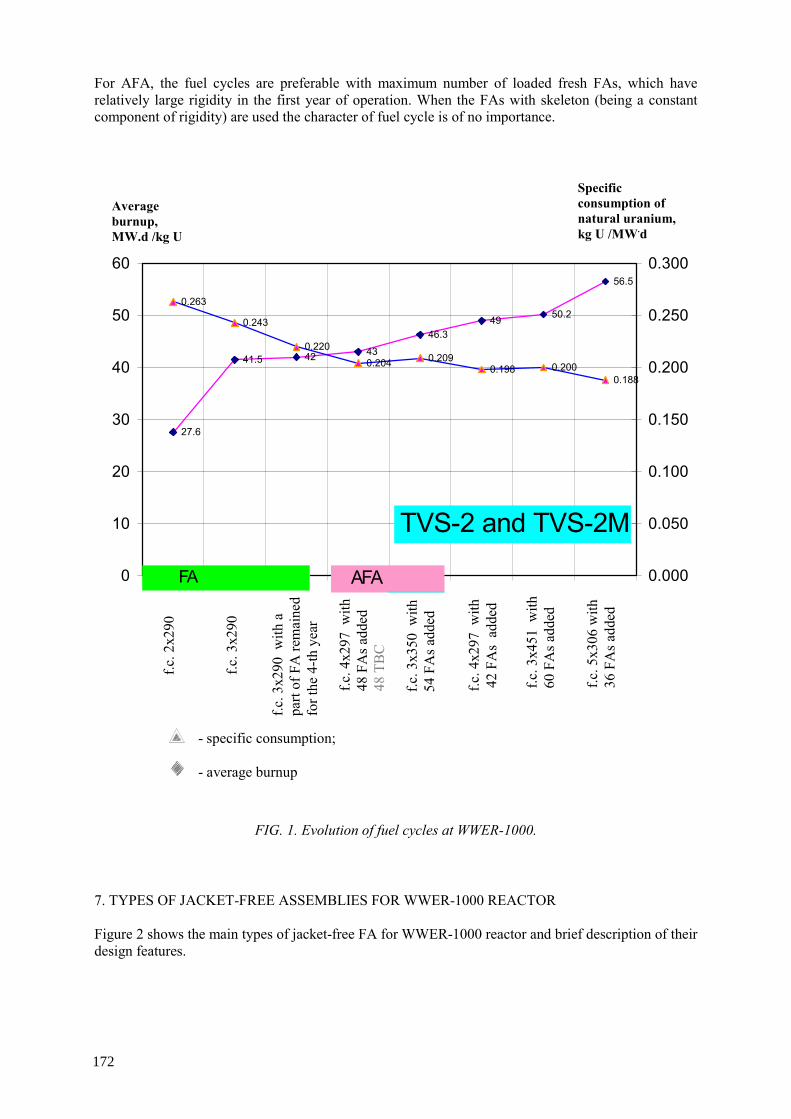
For AFA, the fuel cycles are preferable with maximum number of loaded fresh FAs, which have relatively large rigidity in the first year of operation. When the FAs with skeleton (being a constant component of rigidity) are used the character of fuel cycle is of no importance.
27.6
41.5 42 43
46.349 50.2
56.5
0.263
0.243
0.2200.204 0.209
0.1880.2000.198
0
10
20
30
40
50
60
0.000
0.050
0.100
0.150
0.200
0.250
0.300
FIG. 1. Evolution of fuel cycles at WWER-1000.
7. TYPES OF JACKET-FREE ASSEMBLIES FOR WWER-1000 REACTOR Figure 2 shows the main types of jacket-free FA for WWER-1000 reactor and brief description of their design features.
f.c. 2х2
90
f.c. 3х2
90
f.c. 3х2
90 w
ith a
pa
rt of
FA
rem
aine
d fo
r the
4-th
yea
r
f.c. 4х2
97 w
ith
48 F
As a
dded
48
ТВС
f.c. 3х3
50 w
ith
54 F
As a
dded
f.c. 4х2
97 w
ith
42
FAs
adde
d
f.c.
3х4
51 w
ith
60
FAs a
dded
f.c. 5х3
06 w
ith
36 F
As a
dded
Average burnup, MW.d /kg U
Specific consumption of natural uranium, kg U /MW.d
- specific consumption; - average burnup
FA
TVS-2 and TVS-2M
AFA
172
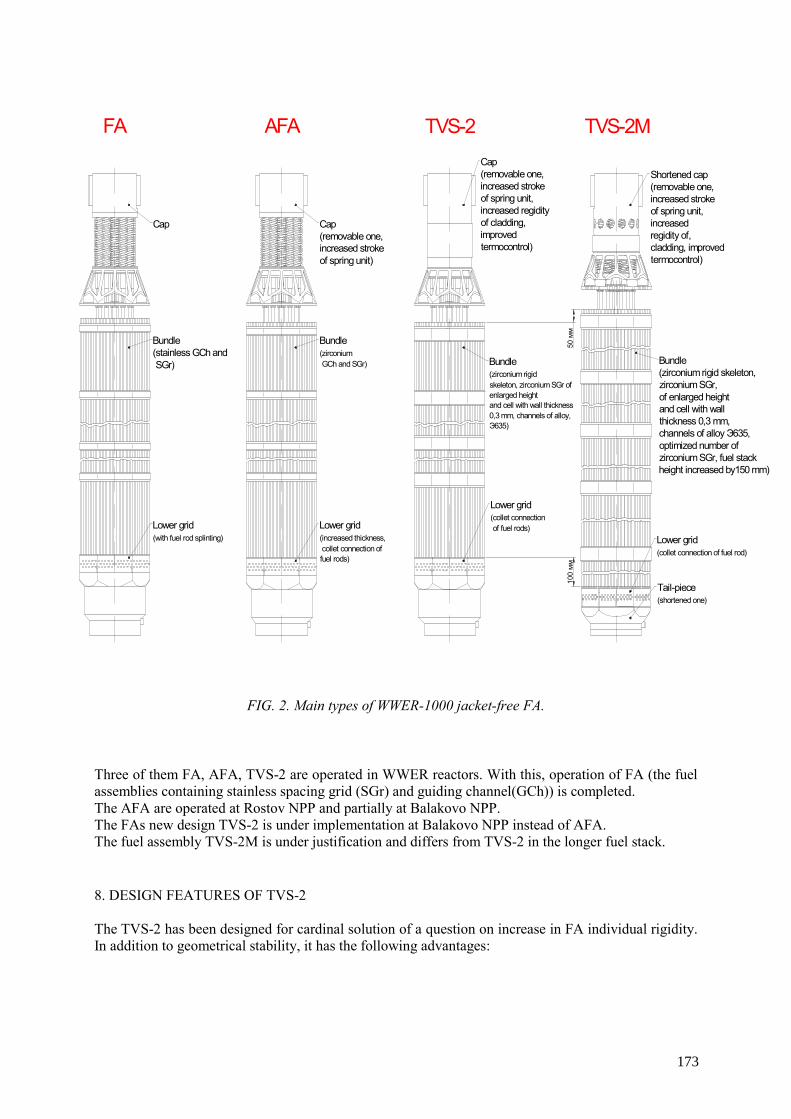
FIG. 2. Main types of WWER-1000 jacket-free FA.
Three of them FA, AFA, TVS-2 are operated in WWER reactors. With this, operation of FA (the fuel assemblies containing stainless spacing grid (SGr) and guiding channel(GCh)) is completed. The AFA are operated at Rostov NPP and partially at Balakovo NPP. The FAs new design TVS-2 is under implementation at Balakovo NPP instead of AFA. The fuel assembly TVS-2M is under justification and differs from TVS-2 in the longer fuel stack. 8. DESIGN FEATURES OF TVS-2
The TVS-2 has been designed for cardinal solution of a question on increase in FA individual rigidity. In addition to geometrical stability, it has the following advantages:
Cap
Lower grid(with fuel rod splinting)
Bundle(stainless GCh and SGr)
FA
AFA
Cap(removable one,increased strokeof spring unit)
Bundle(zirconium GCh and SGr)
TVS-2Cap(removable one,increased strokeof spring unit,increased regidityof cladding,improvedtermocontrol)
Lower grid(collet connection of fuel rods)Lower grid
(increased thickness, collet connection offuel rods)
Bundle(zirconium rigidskeleton, zirconium SGr ofenlarged heightand cell with wall thickness0,3 mm, channels of alloy,Э635)
Shortened cap(removable one,increased strokeof spring unit,increasedregidity of,cladding, improved termocontrol)
TVS-2М
Tail-piece(shortened one)
Bundle (zirconium rigid skeleton,zirconium SGr,of enlarged heightand cell with wallthickness 0,3 mm,channels of alloy Э635,optimized number ofzirconium SGr, fuel stackheight increased by150 mm)
50 мм
100 мм
Lower grid(collet connection of fuel rod)
173
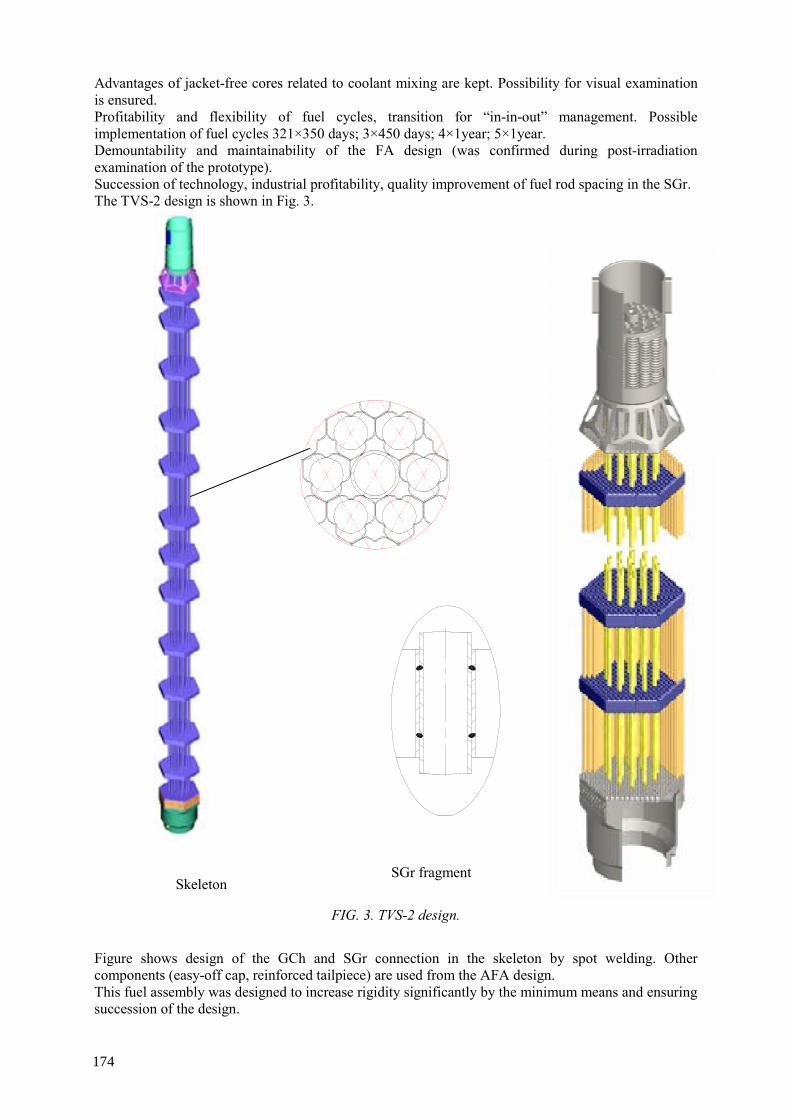
Advantages of jacket-free cores related to coolant mixing are kept. Possibility for visual examination is ensured. Profitability and flexibility of fuel cycles, transition for “in-in-out” management. Possible implementation of fuel cycles 321×350 days; 3×450 days; 4×1year; 5×1year. Demountability and maintainability of the FA design (was confirmed during post-irradiation examination of the prototype). Succession of technology, industrial profitability, quality improvement of fuel rod spacing in the SGr. The TVS-2 design is shown in Fig. 3.
FIG. 3. TVS-2 design. Figure shows design of the GCh and SGr connection in the skeleton by spot welding. Other components (easy-off cap, reinforced tailpiece) are used from the AFA design. This fuel assembly was designed to increase rigidity significantly by the minimum means and ensuring succession of the design.
SGr fragment Skeleton
174
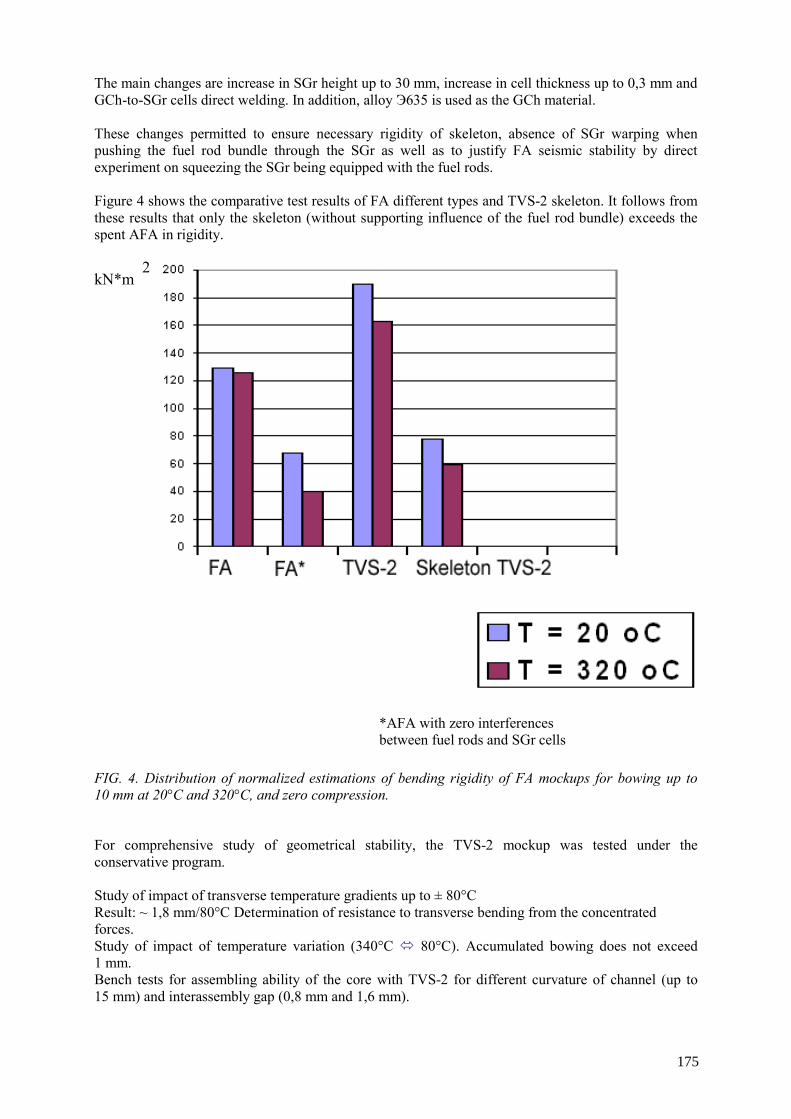
The main changes are increase in SGr height up to 30 mm, increase in cell thickness up to 0,3 mm and GCh-to-SGr cells direct welding. In addition, alloy Э635 is used as the GCh material. These changes permitted to ensure necessary rigidity of skeleton, absence of SGr warping when pushing the fuel rod bundle through the SGr as well as to justify FA seismic stability by direct experiment on squeezing the SGr being equipped with the fuel rods. Figure 4 shows the comparative test results of FA different types and TVS-2 skeleton. It follows from these results that only the skeleton (without supporting influence of the fuel rod bundle) exceeds the spent AFA in rigidity.
FIG. 4. Distribution of normalized estimations of bending rigidity of FA mockups for bowing up to 10 mm at 20°С and 320°С, and zero compression.
For comprehensive study of geometrical stability, the TVS-2 mockup was tested under the conservative program. Study of impact of transverse temperature gradients up to ± 80°С Result: ~ 1,8 mm/80°С Determination of resistance to transverse bending from the concentrated forces. Study of impact of temperature variation (340°C 80°C). Accumulated bowing does not exceed 1 mm. Bench tests for assembling ability of the core with TVS-2 for different curvature of channel (up to 15 mm) and interassembly gap (0,8 mm and 1,6 mm).
*AFA with zero interferences between fuel rods and SGr cells
kN*m 2
175
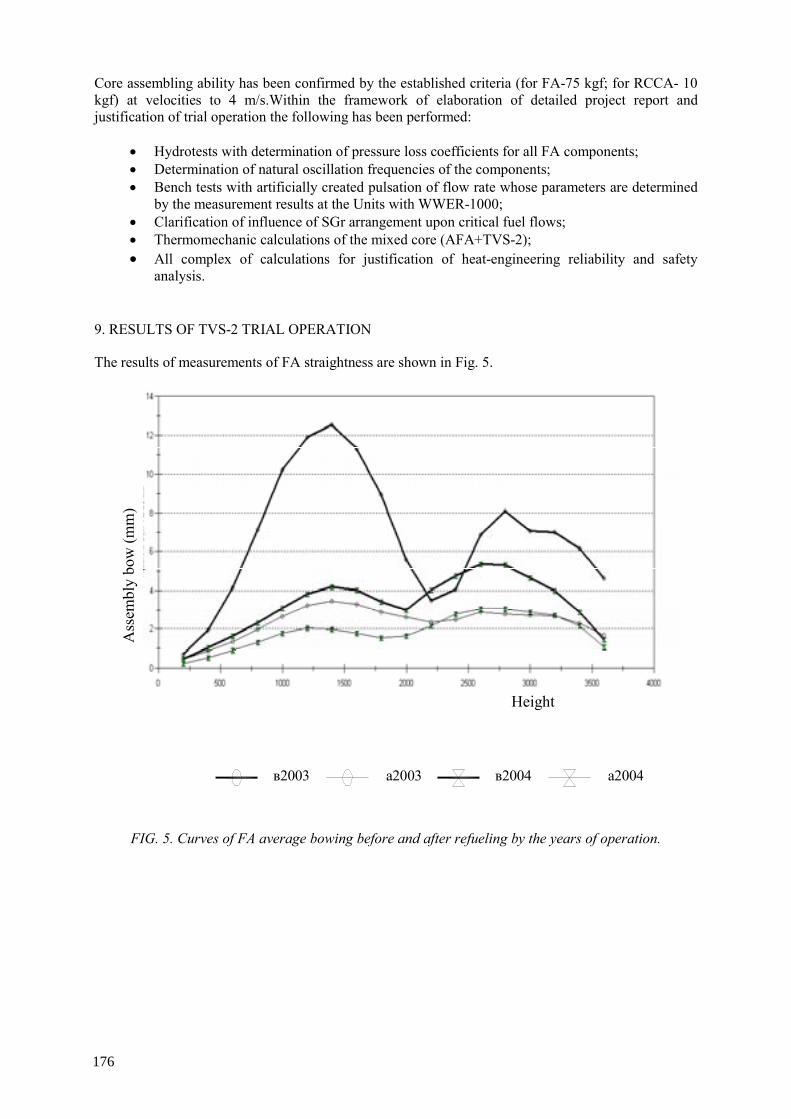
Core assembling ability has been confirmed by the established criteria (for FA-75 kgf; for RCCA- 10 kgf) at velocities to 4 m/s.Within the framework of elaboration of detailed project report and justification of trial operation the following has been performed:
• Hydrotests with determination of pressure loss coefficients for all FA components; • Determination of natural oscillation frequencies of the components; • Bench tests with artificially created pulsation of flow rate whose parameters are determined
by the measurement results at the Units with WWER-1000; • Clarification of influence of SGr arrangement upon critical fuel flows; • Thermomechanic calculations of the mixed core (AFA+TVS-2); • All complex of calculations for justification of heat-engineering reliability and safety
analysis. 9. RESULTS OF TVS-2 TRIAL OPERATION
The results of measurements of FA straightness are shown in Fig. 5.
в2003 а2003 в2004 а2004
FIG. 5. Curves of FA average bowing before and after refueling by the years of operation.
Ass
embl
y bo
w (m
m)
Height
176
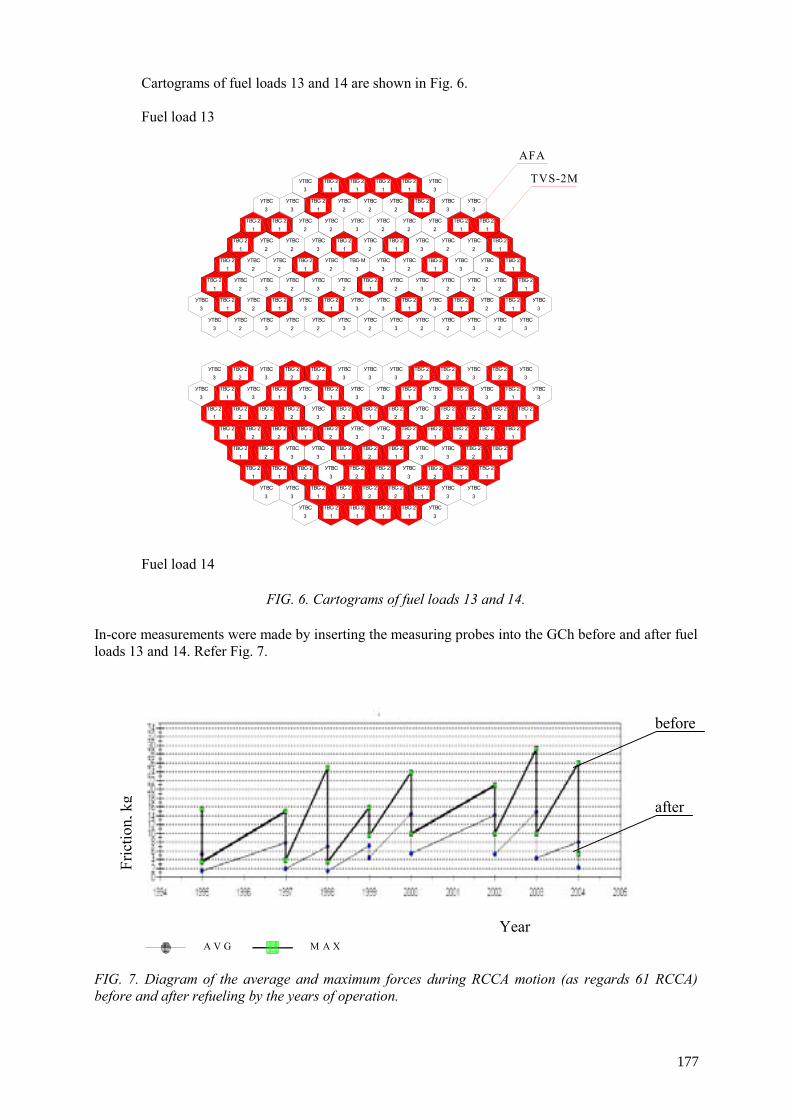
Cartograms of fuel loads 13 and 14 are shown in Fig. 6. Fuel load 13
ТВС- 22
ТВС- 22
AFA
TVS-2M
УТВС3
УТВС3
УТВС2
ТВС- 21
УТВС2
ТВС- 21
УТВС2
УТВС3
УТВС2
УТВС2
УТВС3
УТВС3
УТВС3
УТВС3
ТВС- 21
УТВС3
УТВС2
ТВС- 21
ТВС- 21
УТВС2
УТВС2
УТВС3
ТВС-М3
УТВС2
УТВС2
УТВС3
УТВС2
УТВС3
УТВС2
ТВС- 21
УТВС2
УТВС3
ТВС- 21
УТВС3
УТВС2
ТВС- 21
УТВС3
УТВС2
ТВС- 21
УТВС3
ТВС- 21
УТВС2
УТВС2
УТВС3
ТВС- 21
ТВС- 21
УТВС2
УТВС3
ТВС- 21
УТВС2
УТВС2
УТВС2
ТВС- 21
ТВС- 21
УТВС2
ТВС- 21
УТВС2
УТВС2
ТВС- 21
УТВС3
УТВС3
УТВС2
УТВС2
УТВС3
ТВС- 21
УТВС3
УТВС2
УТВС2
УТВС2
УТВС2
ТВС- 21
УТВС2
ТВС- 21
УТВС3
УТВС2
УТВС3
УТВС3
ТВС- 21
УТВС2
УТВС2
ТВС- 21
ТВС- 21
УТВС3
ТВС- 21
ТВС- 21
ТВС- 21
ТВС- 21
УТВС3
УТВС3
УТВС3
УТВС3
УТВС3
УТВС3
УТВС3
УТВС3
УТВС3
УТВС3
УТВС3
УТВС3
УТВС3
УТВС3
УТВС3
УТВС3
УТВС3
УТВС3
УТВС3
УТВС3
УТВС3
УТВС3
УТВС3
УТВС3
УТВС3
УТВС3
УТВС3
УТВС3
УТВС3
УТВС3
УТВС3
УТВС3
ТВС- 22
ТВС- 21
ТВС- 21
ТВС- 21
ТВС- 21
ТВС- 21
ТВС- 21
ТВС- 21
ТВС- 21
ТВС- 21
ТВС- 21
ТВС- 21
ТВС- 21
ТВС- 21
ТВС- 21
ТВС- 21
ТВС- 21
ТВС- 21
ТВС- 21
ТВС- 21
ТВС- 21
ТВС- 21
ТВС- 21
ТВС- 21
ТВС- 21
ТВС- 21
ТВС- 21
ТВС- 22
ТВС- 22
ТВС- 22
ТВС- 22
ТВС- 22
ТВС- 22
ТВС- 22
ТВС- 22
ТВС- 22
ТВС- 22
ТВС- 22
ТВС- 22
ТВС- 22
ТВС- 22
ТВС- 22
ТВС- 22
ТВС- 22
ТВС- 21
ТВС- 22
ТВС- 22
ТВС- 22
ТВС- 22
ТВС- 22
ТВС- 22
ТВС- 22
ТВС- 22
ТВС- 22
ТВС- 22
Fuel load 14
FIG. 6. Cartograms of fuel loads 13 and 14.
In-core measurements were made by inserting the measuring probes into the GCh before and after fuel loads 13 and 14. Refer Fig. 7.
A V G M A X
FIG. 7. Diagram of the average and maximum forces during RCCA motion (as regards 61 RCCA) before and after refueling by the years of operation.
Year
Fric
tion,
kg
before
after
177
From figure it is seen that implementation of rigid TVS-2 has resulted in essential alignment of fuel assemblies in the core. It is testified by the measurement results of RCCA displacement force in the fuel assemblies being decreased in 3–4 times. 10. DEVELOPMENT OF TVS-2 DESIGN According to the program of increase in the availability factor at Balakovo NPP the TVS-2 design is under modification and has designation TVS-2M. The main purpose of this modification is increase in UO2 loading, mainly, due to core lengthening by 150 mm. In TVS-2M it is planned to increase loading by 32 kg that will increase lifetime duration by 19 days. The calculations performed show that lengthening of the core and of the fuel rod bundle practically will not influence the FA geometry during burnup. 11. CONCLUSION
• Reliability of design EP actuation and necessary geometrical stability of the cores are ensured
in WWER-1000 reactors; • Skeleton-free AFA is reliably operated in the 3, 4-year fuel cycle at Rostov NPP due to
modification of the FA design as well as the reactor internals; • Design with rigid skeleton (TVS-2) has been developed and is implementing to realize fuel
cycles 3x350 days and 4x1 year; • TVS-2M with increased uranium loading is under development for further increase in burnup
or availability factor.
178
REVIEW AND PROSPECT FOR ASSEMBLY DESIGN IMPROVEMENT IN CHINA
CHEN YU, JING YI Shanghai Nuclear Engineering Research and Design Institute, Shanghai, China
Abstract This report summarizes the development of 300MWe fuel assembly, introduces the features of 300MWe fuel assembly from type FA300-1 to FA300-4, and reviews the continuous design improvement for enhancing the performance of 300MWe fuel assembly since QNPC first core fuel design. This report also gives the substances and goals for 300MWe fuel assembly design improvement in the future. 1. GENERAL The research, design, tests and fabrication of 300MWe fuel assembly in China was performed by self-reliance since 1970’s. The slightly enriched uranium dioxide pellet, Zr-4 cladding, stainless steel guide thimble with four reduced diameter parts, nickel base alloy spacer grid, and box-like structure of stainless steel top and bottom nozzles are in the 300MWe fuel assembly design.
Since 1990’s, the safety, reliability and economics of fuel assembly was more enhanced in the world. At same time, Shanghai Nuclear Engineering Research and Design Institute (SNERDI) performed a series of continuous design improvement to 300MWe fuel assembly after first core fuel design of Qinshan Nuclear Power Company (QNPC). Those design improvement enhanced the performance of 300MWe fuel assembly, special in the lower failure rate and high burnup for meeting the utility requirements. Through first to eighth reload fuel design for QNPC and first core to third reload fuel design for Chashma Nuclear Power Plant (CHASNUPP), development of three types for 300MWe fuel assembly were completed. The estimate completion time of fourth type is in 2006. Some information of four types of 300MWe fuel assembly is listed in table I.
2. DESCRIPTION OF 300MWE FUEL ASSEMBLY The fuel assembly consists of a 15×15 square array of fuel rods, spacer grids, guide thimbles, instrumentation tube, top and bottom nozzles (see Figure 1). The guide thimbles and the instrumentation tube in conjunction with the 8 spacer grids and the nozzles form the fuel assembly skeleton. Within this skeleton, the fuel rods are contained and supported and the rod-to-rod centerline spacing is maintained along the entire length of the assembly. Of the total possible 225 rod locations per assembly, 20 are occupied by guide-thimbles, one by instrumentation tube and the remaining 204 by fuel rods.
The main technical characteristics of all parts of the fuel assembly and the reason of improvement are detailed separately hereunder [1].
179
300 MWe FUEL
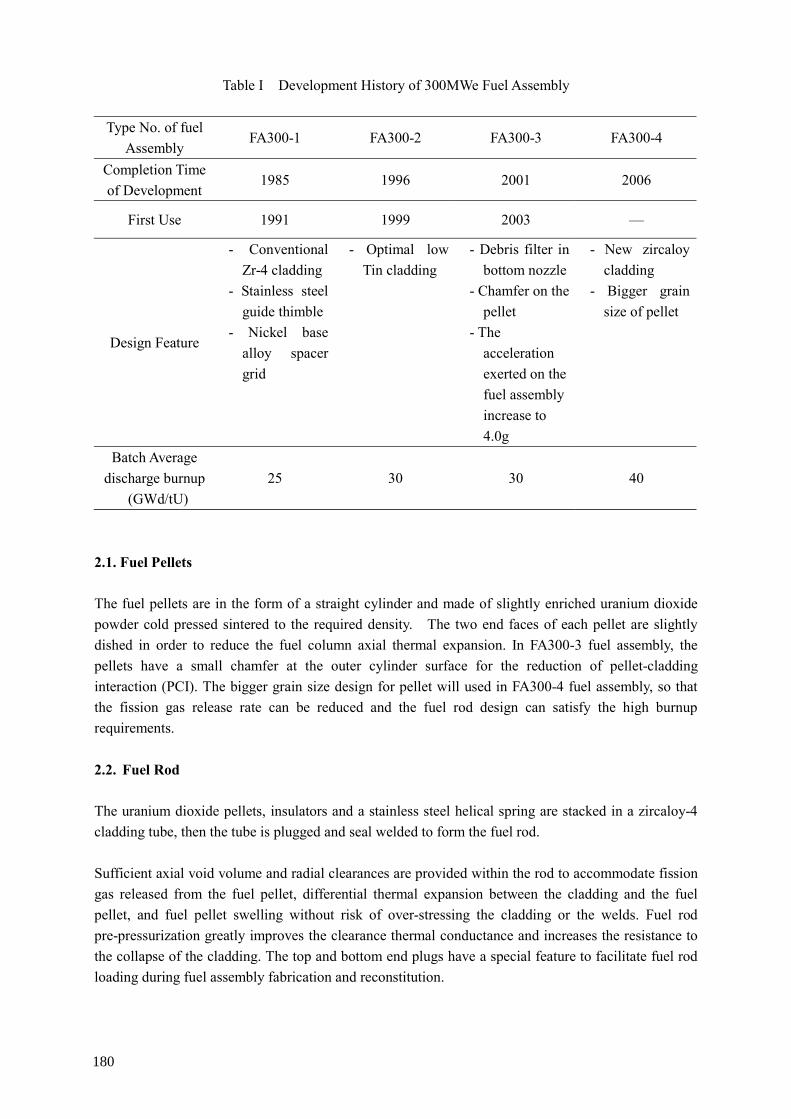
Table I Development History of 300MWe Fuel Assembly
Type No. of fuel Assembly
FA300-1 FA300-2 FA300-3 FA300-4
Completion Time of Development
1985 1996 2001 2006
First Use 1991 1999 2003 —
Design Feature
- Conventional Zr-4 cladding
- Stainless steel guide thimble
- Nickel base alloy spacer grid
- Optimal low Tin cladding
- Debris filter in bottom nozzle
- Chamfer on the pellet
- The acceleration exerted on the fuel assembly increase to 4.0g
- New zircaloy cladding
- Bigger grain size of pellet
Batch Average discharge burnup
(GWd/tU) 25 30 30 40
2.1. Fuel Pellets
The fuel pellets are in the form of a straight cylinder and made of slightly enriched uranium dioxide powder cold pressed sintered to the required density. The two end faces of each pellet are slightly dished in order to reduce the fuel column axial thermal expansion. In FA300-3 fuel assembly, the pellets have a small chamfer at the outer cylinder surface for the reduction of pellet-cladding interaction (PCI). The bigger grain size design for pellet will used in FA300-4 fuel assembly, so that the fission gas release rate can be reduced and the fuel rod design can satisfy the high burnup requirements. 2.2. Fuel Rod
The uranium dioxide pellets, insulators and a stainless steel helical spring are stacked in a zircaloy-4 cladding tube, then the tube is plugged and seal welded to form the fuel rod. Sufficient axial void volume and radial clearances are provided within the rod to accommodate fission gas released from the fuel pellet, differential thermal expansion between the cladding and the fuel pellet, and fuel pellet swelling without risk of over-stressing the cladding or the welds. Fuel rod pre-pressurization greatly improves the clearance thermal conductance and increases the resistance to the collapse of the cladding. The top and bottom end plugs have a special feature to facilitate fuel rod loading during fuel assembly fabrication and reconstitution.
180
Shifting of the fuel pellets within the cladding during handling or shipping prior to core loading is prevented by means of a stainless helical hold down spring standing on the top of the fuel pellets column. In FA300-3 fuel assembly, the acceleration exerted on the fuel assembly increase from 2.0g to 4.0g, so that the safety of fuel assembly handling and shipping can be enhanced.
The Optimal low Tin cladding was used in FA300-2 fuel assembly. The new zircaloy cladding will be used in FA300-3 fuel assembly, so that the corrosion, creep and growth performance of cladding can be improved. 2.3. Bottom Nozzle
The bottom nozzle of the fuel assembly is a square box-like structure, which controls the coolant flow distribution to the fuel assembly and serves as the bottom structural element. The nozzle with square cross section consists of four support legs and a square perforated plate. These parts are made of 0Cr18Ni10Ti (AISI 321). The support legs are welded to this plate to form a plenum for the inlet coolant.
Coolant flow is directed from the plenum upward to the interior of the fuel assembly through the perforated plate. The holes on the plate are located between the fuel rods and are sized so that the fuel rods cannot pass through the perforated plate.
Correct positioning of the fuel assembly in the core is assured by mating two holes in two opposite legs with two locating pins on the lower core plate.
The guide thimbles are connected with the bottom nozzle by bolting. After connecting a thin skirt on the screw can be flattened to prevent rotation of the screw.
In FA300-3 fuel assembly, the anti-debris filter is used in the fuel assembly to reduce the possibility of fuel rod damage due to debris-induced fretting. 2.4. Top Nozzle
The top nozzle is a box-like structure, which consists of an adopter plate, enclosure top plate and eight holddown springs. All parts with the exception of the springs, are made of 0Cr18Ni10Ti (AISI 321). Four holes at four corners of the top plate provide a means of positioning and aligning the top of the fuel assembly. As with the bottom nozzle, alignment pins in the upper core plate mate with two holes on two opposite corners of the top plate.
Eight spiral holddown springs in the top nozzle permit the exertion of sufficient holddown forces of the reactor internals to oppose the hydraulic thrust of the coolant. A rod and a nut are used for holddown of each spring.
The top end of the guide thimble is connected to the perforated plate by argon arc welding.
181

2.5. Guide Thimble and Instrumentation Tube
20 guide thimbles and one instrumentation tube are provided in the fuel assembly. They are all made of 0Cr18Ni10Ti (AISI 321).
The Guide thimbles provide guiding channels for the control rods during insertion and withdrawal of the RCCA. Four reduced diameter sections with different inner diameter are furnished at the lower part of each guide thimble to produce a dashpot action when the control rods are near the end of travel in the guide thimbles during reactor trip. The transition zones at the dashpot sections are conical in shape to avoid rapid change of the tube diameter.
Flow holes are provided just above the dashpot to allow the entrance of cooling water to the control rods during normal operation and to partially accommodate the outflow of water from the tube during reactor trip.
The instrumentation tube with the same size as the guide thimble and without the dashpot section at the lower part is designed to allow free insertion and withdrawal of the self-power neutron detector. 2.6. Spacer Grid
The fuel rods are supported along their length within the skeleton by 8 spacer grids and the lateral spacing between the rods are maintained through out the design life of the assembly.
Two spring support points and four fixed support points (dimples) are provided in each cell of the spacer grid. By these six support points the rod-to-rod centerline spacing is maintained and the fuel rods are supported to prevent the axial movement of the fuel rods caused by hydraulic thrust and to allow the axial expansion of the fuel rods. The magnitude of the support forces provided by the spacer grids should be suitable to minimize possible fretting, and permit differential expansion between the cladding and the guide thimble without overstressing the cladding.
The spacer grids are connected to the guide thimbles by tabs formed on the straps. These tabs are directly welded to the tubes by spot welding.
3. DESIGN AND IMPROVEMENT OF 300MWE FUEL ASSEMBLY 3.1. Fuel Design for QNPC First Core
The fuel design (FA300-1) for QNPC first core began from 1974 and implemented in 1985. The following main tests were performed during the FA300-1 fuel assembly design [1]:
(1) High temperature creep and collapse test of Zr-4 cladding, (2) Stress corrosion test of Zr-4 cladding, (3) Stress test of top and bottom nozzle, (4) Flow-induced vibration test of fuel assembly,
182

(5) Hydraulic characteristic test of fuel assembly, (6) Strength test of fuel assembly, (7) DNBR test, (8) Scour test of 1:1 fuel assembly and control rod drive line under high pressure and high
temperature, (9) Control rod dropping test under deflection of control rod drive line, (10) Critical heat flux test of fuel assembly, (11) In-pile irradiation test of 3×3 small fuel assembly.
The following main calculations and analysis were performed during the FA300-1 fuel assembly design [1]:
(1) Calculations and analysis of fuel rod design:
- Calculation for critical pressure of cladding elastic collapse, - Calculation for natural frequencies and modes of the fuel rod vibration, - Calculation of fuel creep bowing;
(2) Calculations and analysis of spacer grid design: - Calculation for friction force of fuel rod caused by spacer grid, - Calculation for minimum hold-down force of spacer grid spring, - Calculation for deformation and stress of spacer grid spring;
(3) Calculations and analysis of fuel assembly design: - Guide thimble design (including calculation of guide thimble dashpot design, calculation for
by-pass flow of guide thimbles in fuel assembly, calculation for the stress of guide thimble impacted by control rod dropping),
- Fuel assembly mechanical design (including calculation for the spot weld joints strength of guide thimble, calculation for the hydraulic load of fuel assembly, calculation for the deformation and stress of perforated plate in bottom nozzle.
The following tests, calculations and analysis were carried out between 1988 and 1998 to satisfy with the requirements of safety analysis [2] [3] [4] [5] [6]:
(1) Static stiffness test for spacer grid; (2) Dynamic stiffness and crush load limit test; (3) Fuel assembly axial impact test; (4) Fuel assembly lateral impact test; (5) Seismic response test of fuel assembly; (6) Calculation for the fuel assembly structure response under the SSE and LOCA condition; (7) Calculation for the fuel rod performance under the steady and transient state; (8) Calculation for the PCI of fuel rod; (9) Calculation for the fatigue of fuel rod.
3.2. Reload fuel assembly design for the QNPC Reload fuel assembly design and improvement for the QNPC since 1992.
183

The FA300-2 fuel assembly was used firstly in the fourth reload fuel. The irradiation performance of the cladding in FA300-2 is enhanced due to using of the optimal low Tin cladding. The batch discharged burnup of FA300-2 reaches 30GWd/tU.
The research and design of debris filter in fuel assembly were carried out from 1997. The hydraulic and mechanical tests and calculations were performed in the research and design of debris filter [7]. The FA300-2 fuel assembly with debris filter was used firstly in the seventh reload fuel.
The other two features of FA300-3 fuel assembly, chamfer on the pellet and the acceleration exerted on the fuel assembly increase to 4.0g, will be used in the eighth reload fuel.
In the design of first to eighth reload fuel, some requirements of raw materials and fabrication was changed for the performance enhancement and cutting down the fabrication cost of fuel assembly. 3.3. First core and reload fuel assembly design for the CHASNUPP The FA300-2 fuel assembly was used in the first core design for CHASNUPP. The chamfer design of pellet was inputted in the third reload fuel design, and the design of acceleration exerted on the fuel assembly increase to 4.0g was inputted in the fourth reload design. Right now, the design of FA300-3 fuel assembly was used in CHASNUPP reload fuel, accept the design of debris filter. 3.4. Research of 300MWe fuel assembly
During the design and improvement of 300MWe Fuel Assembly, SNERDI carried out the following research development:
(1) Development of zircaloy guide thimble and Bi-metal spacer grid, (2) Development of removable top nozzle and integral fuel burnable absorber.
4. OPERATING EXPERIENCE OF 300MWE FUEL ASSEMBLY
Seven reload designs have done to QNPC. Right now, the discharge burnup of 47 fuel assemblies are more than 30GWd/tU, the maximum discharge burnup of 47 fuel assemblies is 36.6GWd/tU (after 4 cycles operating) or 34.4GWd/tU (after 3 cycles operating) [8] [9] [10], details are in the table II. The batch discharge burnup is 31.5GWd/tU. Because the burnup of the irradiation test only reached 25GWd/tU t in the research reactor, the central fuel assembly in QNPC became an irradiation test fuel assembly from the fifth cycle after approved by National Nuclear Safety Administration (NNSA).
184
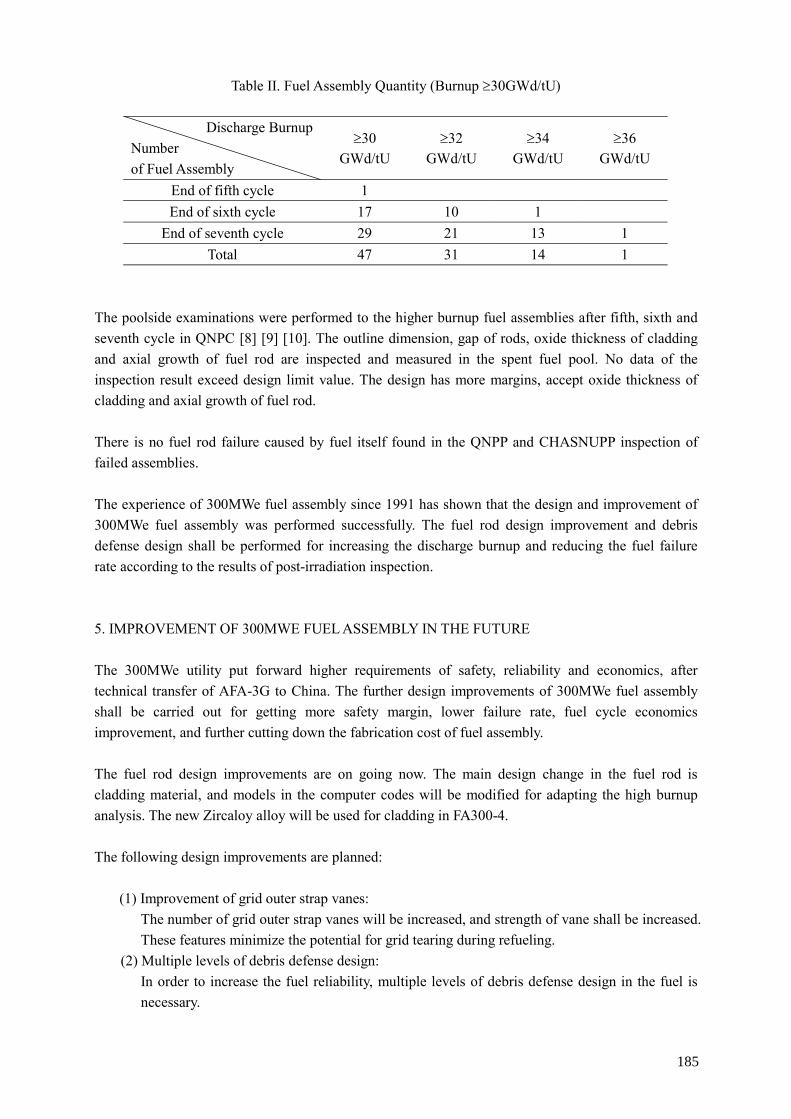
Table II. Fuel Assembly Quantity (Burnup ≥30GWd/tU)
Discharge Burnup Number of Fuel Assembly
≥30 GWd/tU
≥32 GWd/tU
≥34 GWd/tU
≥36 GWd/tU
End of fifth cycle 1 End of sixth cycle 17 10 1
End of seventh cycle 29 21 13 1 Total 47 31 14 1
The poolside examinations were performed to the higher burnup fuel assemblies after fifth, sixth and seventh cycle in QNPC [8] [9] [10]. The outline dimension, gap of rods, oxide thickness of cladding and axial growth of fuel rod are inspected and measured in the spent fuel pool. No data of the inspection result exceed design limit value. The design has more margins, accept oxide thickness of cladding and axial growth of fuel rod.
There is no fuel rod failure caused by fuel itself found in the QNPP and CHASNUPP inspection of failed assemblies.
The experience of 300MWe fuel assembly since 1991 has shown that the design and improvement of 300MWe fuel assembly was performed successfully. The fuel rod design improvement and debris defense design shall be performed for increasing the discharge burnup and reducing the fuel failure rate according to the results of post-irradiation inspection. 5. IMPROVEMENT OF 300MWE FUEL ASSEMBLY IN THE FUTURE
The 300MWe utility put forward higher requirements of safety, reliability and economics, after technical transfer of AFA-3G to China. The further design improvements of 300MWe fuel assembly shall be carried out for getting more safety margin, lower failure rate, fuel cycle economics improvement, and further cutting down the fabrication cost of fuel assembly.
The fuel rod design improvements are on going now. The main design change in the fuel rod is cladding material, and models in the computer codes will be modified for adapting the high burnup analysis. The new Zircaloy alloy will be used for cladding in FA300-4.
The following design improvements are planned:
(1) Improvement of grid outer strap vanes:
The number of grid outer strap vanes will be increased, and strength of vane shall be increased. These features minimize the potential for grid tearing during refueling.
(2) Multiple levels of debris defense design: In order to increase the fuel reliability, multiple levels of debris defense design in the fuel is necessary.
185
A hardened coating of zirconium dioxide shields the bottom of the fuel rod. This coating is harder than the most common types of debris. Should debris pass though the bottom nozzle, this coating provides an add measure of protection. The solid bottom fuel rod end plug is elongated. The length of the end plug ensures that the top of the plug is above the lower dimple of the grid throughout life. Debris, which may be trapped at this grid location wears against a solid end plug, not cladding.
(3) Zircaloy skeleton design and application: Research and development of Zircaloy skeleton design and application will be performed base on the zircaloy guide thimble, bi-metal spacer grid and removable top nozzle design, for increasing the fuel assembly discharge burnup and economics of nuclear power plant.
(4) Integral fuel burnable absorber rod design and application: Research and development of integral Fuel Burnable Absorber Rod Design and application will be performed base on the Integral Fuel Burnable Absorber Design, for meeting the requirements of core design under high burnup condition.
6. CONCLUSION
(1) Enhancing the performance of fuel safety, reliability and economics is the base goal of
300MWe fuel assembly development from FA300-1 to FA300-4. (2) The design improvements of 300MWe are base on the reliable tests and accurate analysis,
fully combining the operating experience of 300MWe fuel assembly. (3) Irradiation test of leading fuel assembly is an effective method for verification of fuel safety
and reliability. (4) The research, design, tests and fabrication of 300MWe fuel assembly by self-reliance and
operating experience of 300MWe fuel assembly in QNPC and CHASNUPP indicated that SNERDI has grasped the design technology of PWR fuel assembly, and has the ability to further research, develop and improve the design of 300MWe fuel assembly or other PWR fuel assembly.
REFERENCES
[1] ZHANG Yulin, et al., Fuel Assembly Design Report, SNERDI (Oct. 1994). [2] YAO Weida, et al., Testing and analysis of 300MWe fuel assembly structure response under the
SSE and LOCA condition, SNERDI (July 2000). [3] CHEN Yu, et al., Fuel rod performance analysis under steady state condition for Qinshan Phase I,
SNERDI (Dec. 1988). [4] CHEN Yu, et al., Fuel rod performance analysis under small break LOCA condition for Qinshan
Phase I, SNERDI (June 1988). [5] CHEN Peng, et al., QNPC fuel rod cladding fatigue analysis, CIAE. [6] CHEN Peng, et al., QNPC fuel rod cladding PCI analysis, CIAE (Nov. 1998). [7] ZHANG Yulin, et al., Design, testing and safety analysis of debris filter design in 300MWe fuel
assembly, SNERDI (April 2001). [8] XUE Xincai, et al., Fifty outage fuel inspection report, QNPC (Dec. 2000). [9] XUE Xincai, et al., Sixty outage fuel inspection report, QNPC (May 2002). [10] XUE Xincai, et al., Seventy outage fuel inspection report, QNPC (Nov. 2003).
186
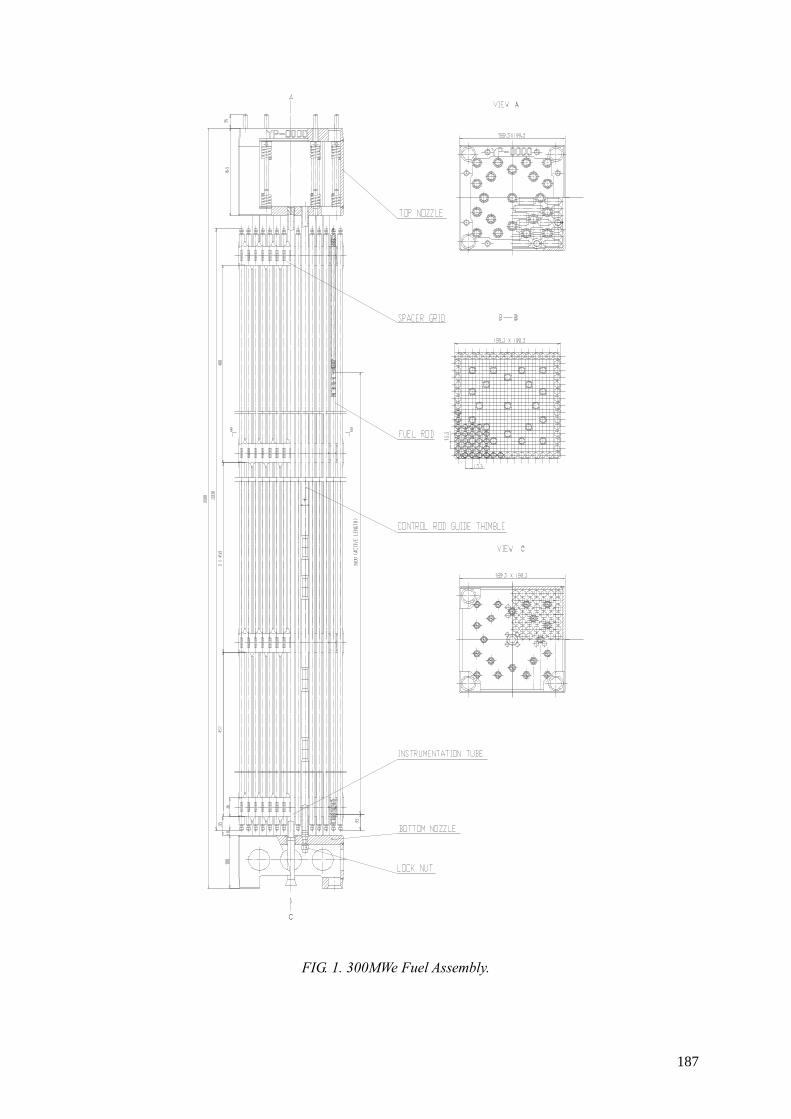
FIG. 1. 300MWe Fuel Assembly.
187

INSERTION AND DROP OF CONTROL ROD IN ASSEMBLY SIMULATIONS AND PARAMETRIC ANALYSIS D. BOSSELUT, H. ANDRIAMBOLOLONA EDF R & D France, Département Analyses Mécaniques et Acoustique, Clamart E. LONGATTE EDF R & D France, Département Mécanique des Fluides et Transfert Thermique, Chatou J. PAUTHENET EDF Septen France, Division Combustible Nucléaire, Lyon, France Abstract
We present in this paper some results obtained with a numerical model of control rod behaviour. Drop time and insertion force are studied by means of a large parametric analysis. Fuel assembly deflection is the main parameter of this study. Several loads are taken into account in control rod displacement calculation: fluid load, gravity and friction force against the guide. Simulations are compared to measurements carried out in a full-scale prototype. The analysis of drop calculation shows that the friction cannot be neglected when fuel assembly is bowed. The main result for insertion force calculation is the important sensitivity to data entry. Determining exact deflection all along assembly with precision is needed. Otherwise, approximated friction force is obtained. 1. INTRODUCTION
In a nuclear pressurized water reactor, control rod clusters are used to control the neutronic activity of the core. Two kinds of experimental tests are used to estimate their behaviour : the drop time measurement test and the insertion strength measurement. Occasionally, longer drop time may be noticed. Reactor start up may be prevented if drop time exceeds a limit value, which is assessed by safety requirements. The measurement of the insertion strength is an indication of the effectiveness of the control rod cluster/guide tube component. It allows to choose the optimal component and can justify the interest of a technical evolution.
In order to simulate both of these experimental tests, a numerical approach is developed. A model of a control rod cluster/guide tube was carried out with Code_Aster (a finite element code). This numerical model is qualified on measurement tests carried out in a full-scale prototype [1]. We present in this paper a methodology including simulations and a parametric analysis (kinetics of drop according to the geometrical, mechanical and fluid characteristics) that can provide general trends. The analysis of those experimental measurements allows to diagnose defective components. 2. NUMERICAL MODEL DESCRIPTION
Control rod is a slim component (13 m high for 0.2 m large). One can observe three principal parts: drive rod, spider and cluster. Control rod is loosed supported in guide tube to permit the drop. Outer
189
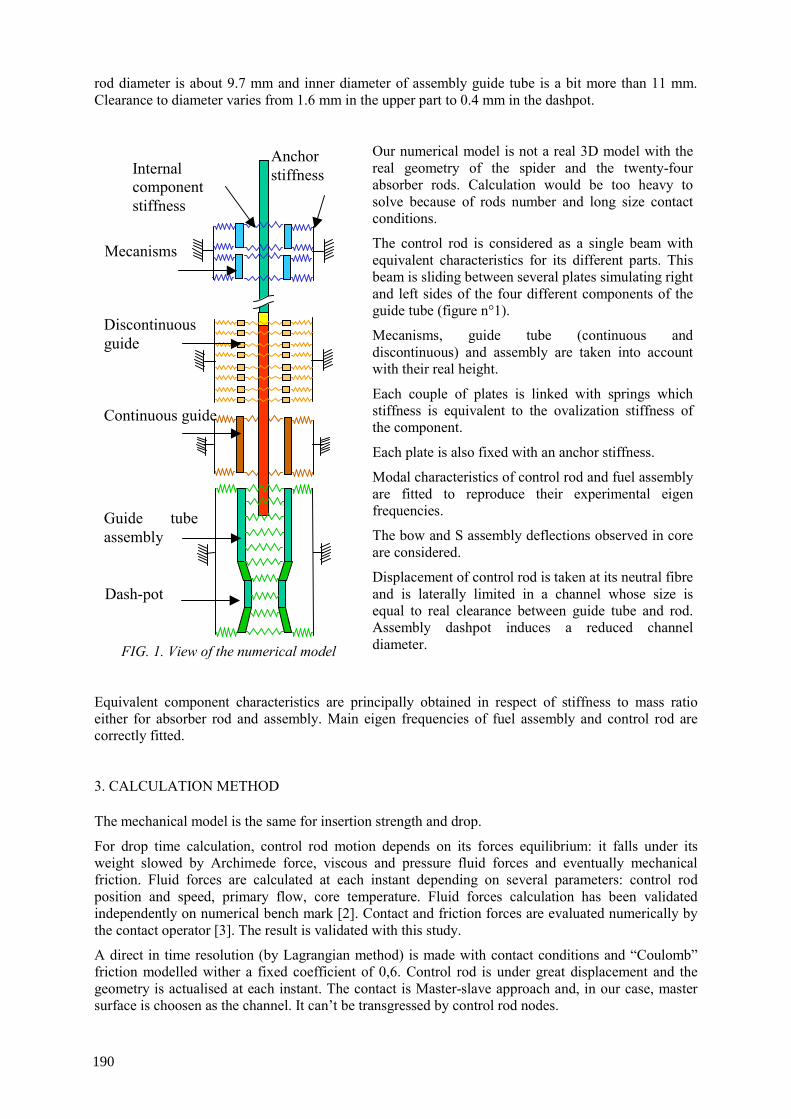
rod diameter is about 9.7 mm and inner diameter of assembly guide tube is a bit more than 11 mm. Clearance to diameter varies from 1.6 mm in the upper part to 0.4 mm in the dashpot.
FIG. 1. View of the numerical model
Our numerical model is not a real 3D model with the real geometry of the spider and the twenty-four absorber rods. Calculation would be too heavy to solve because of rods number and long size contact conditions.
The control rod is considered as a single beam with equivalent characteristics for its different parts. This beam is sliding between several plates simulating right and left sides of the four different components of the guide tube (figure n°1).
Mecanisms, guide tube (continuous and discontinuous) and assembly are taken into account with their real height.
Each couple of plates is linked with springs which stiffness is equivalent to the ovalization stiffness of the component.
Each plate is also fixed with an anchor stiffness.
Modal characteristics of control rod and fuel assembly are fitted to reproduce their experimental eigen frequencies.
The bow and S assembly deflections observed in core are considered.
Displacement of control rod is taken at its neutral fibre and is laterally limited in a channel whose size is equal to real clearance between guide tube and rod. Assembly dashpot induces a reduced channel diameter.
Equivalent component characteristics are principally obtained in respect of stiffness to mass ratio either for absorber rod and assembly. Main eigen frequencies of fuel assembly and control rod are correctly fitted. 3. CALCULATION METHOD The mechanical model is the same for insertion strength and drop.
For drop time calculation, control rod motion depends on its forces equilibrium: it falls under its weight slowed by Archimede force, viscous and pressure fluid forces and eventually mechanical friction. Fluid forces are calculated at each instant depending on several parameters: control rod position and speed, primary flow, core temperature. Fluid forces calculation has been validated independently on numerical bench mark [2]. Contact and friction forces are evaluated numerically by the contact operator [3]. The result is validated with this study.
A direct in time resolution (by Lagrangian method) is made with contact conditions and “Coulomb” friction modelled wither a fixed coefficient of 0,6. Control rod is under great displacement and the geometry is actualised at each instant. The contact is Master-slave approach and, in our case, master surface is choosen as the channel. It can’t be transgressed by control rod nodes.
Anchor stiffness
Dash-pot
Guide tubeassembly
Discontinuous guide
Mecanisms
Continuous guide
Internal component stiffness
190
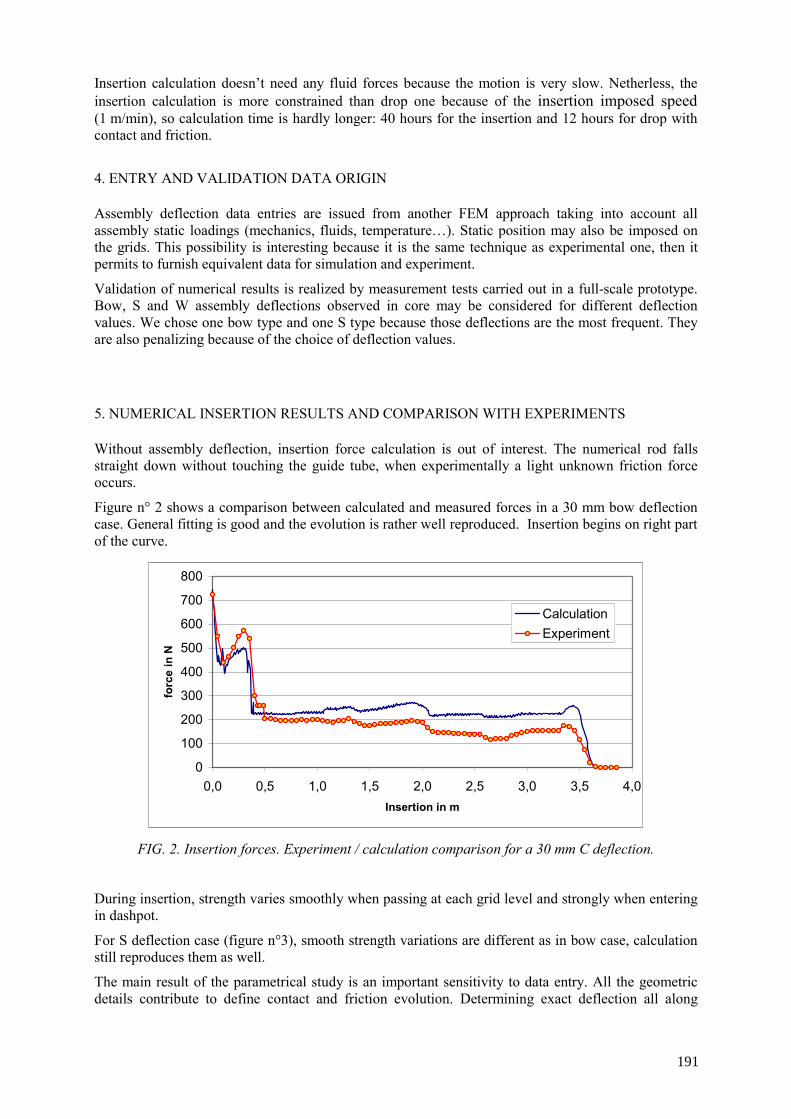
Insertion calculation doesn’t need any fluid forces because the motion is very slow. Netherless, the insertion calculation is more constrained than drop one because of the insertion imposed speed (1 m/min), so calculation time is hardly longer: 40 hours for the insertion and 12 hours for drop with contact and friction. 4. ENTRY AND VALIDATION DATA ORIGIN Assembly deflection data entries are issued from another FEM approach taking into account all assembly static loadings (mechanics, fluids, temperature…). Static position may also be imposed on the grids. This possibility is interesting because it is the same technique as experimental one, then it permits to furnish equivalent data for simulation and experiment.
Validation of numerical results is realized by measurement tests carried out in a full-scale prototype. Bow, S and W assembly deflections observed in core may be considered for different deflection values. We chose one bow type and one S type because those deflections are the most frequent. They are also penalizing because of the choice of deflection values.
5. NUMERICAL INSERTION RESULTS AND COMPARISON WITH EXPERIMENTS Without assembly deflection, insertion force calculation is out of interest. The numerical rod falls straight down without touching the guide tube, when experimentally a light unknown friction force occurs.
Figure n° 2 shows a comparison between calculated and measured forces in a 30 mm bow deflection case. General fitting is good and the evolution is rather well reproduced. Insertion begins on right part of the curve.
0
100
200
300
400
500
600
700
800
0,0 0,5 1,0 1,5 2,0 2,5 3,0 3,5 4,0Insertion in m
forc
e in
N
CalculationExperiment
FIG. 2. Insertion forces. Experiment / calculation comparison for a 30 mm C deflection.
During insertion, strength varies smoothly when passing at each grid level and strongly when entering in dashpot.
For S deflection case (figure n°3), smooth strength variations are different as in bow case, calculation still reproduces them as well.
The main result of the parametrical study is an important sensitivity to data entry. All the geometric details contribute to define contact and friction evolution. Determining exact deflection all along
191
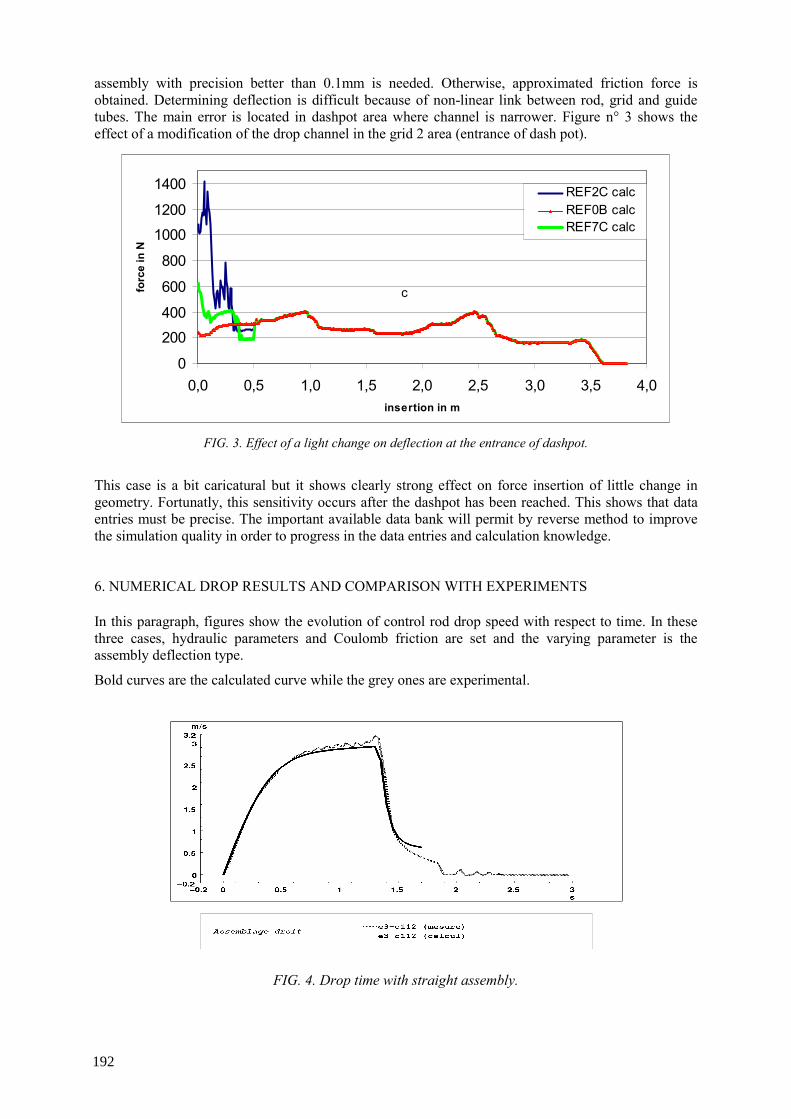
assembly with precision better than 0.1mm is needed. Otherwise, approximated friction force is obtained. Determining deflection is difficult because of non-linear link between rod, grid and guide tubes. The main error is located in dashpot area where channel is narrower. Figure n° 3 shows the effect of a modification of the drop channel in the grid 2 area (entrance of dash pot).
0
200
400
600
800
1000
1200
1400
0,0 0,5 1,0 1,5 2,0 2,5 3,0 3,5 4,0insertion in m
forc
e in
N
REF2C calcREF0B calcREF7C calc
c
FIG. 3. Effect of a light change on deflection at the entrance of dashpot.
This case is a bit caricatural but it shows clearly strong effect on force insertion of little change in geometry. Fortunatly, this sensitivity occurs after the dashpot has been reached. This shows that data entries must be precise. The important available data bank will permit by reverse method to improve the simulation quality in order to progress in the data entries and calculation knowledge. 6. NUMERICAL DROP RESULTS AND COMPARISON WITH EXPERIMENTS In this paragraph, figures show the evolution of control rod drop speed with respect to time. In these three cases, hydraulic parameters and Coulomb friction are set and the varying parameter is the assembly deflection type.
Bold curves are the calculated curve while the grey ones are experimental.
FIG. 4. Drop time with straight assembly.
192
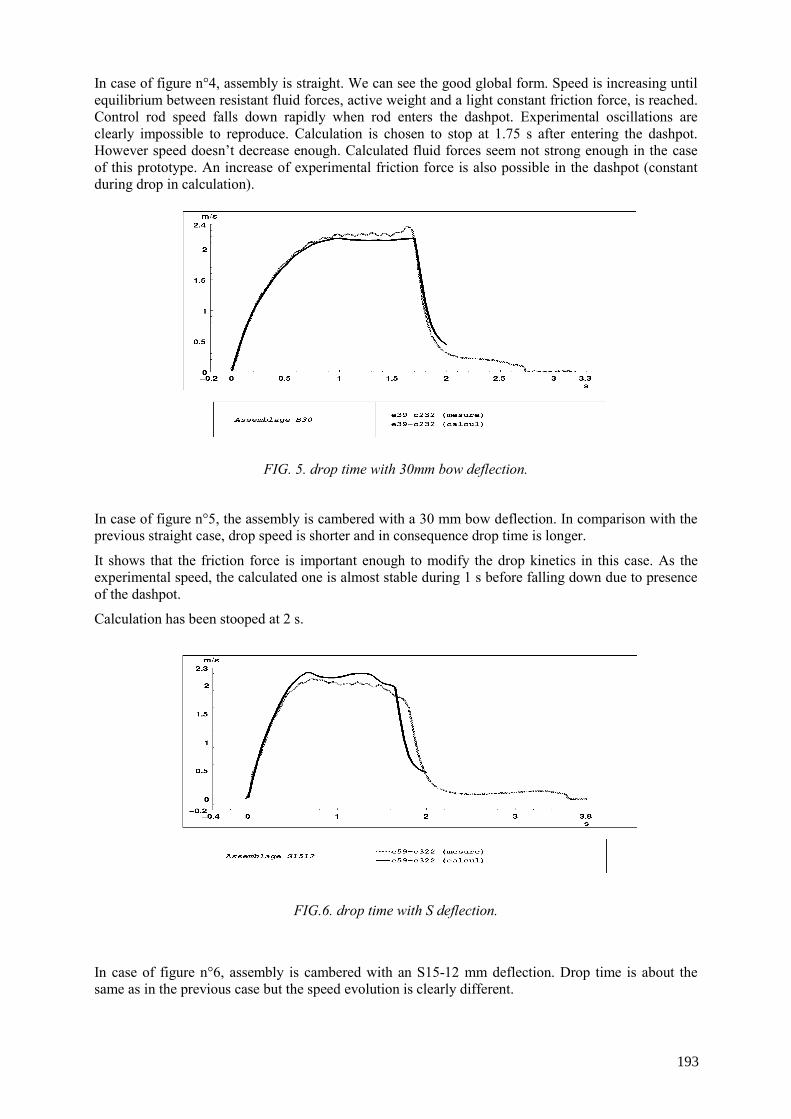
In case of figure n°4, assembly is straight. We can see the good global form. Speed is increasing until equilibrium between resistant fluid forces, active weight and a light constant friction force, is reached. Control rod speed falls down rapidly when rod enters the dashpot. Experimental oscillations are clearly impossible to reproduce. Calculation is chosen to stop at 1.75 s after entering the dashpot. However speed doesn’t decrease enough. Calculated fluid forces seem not strong enough in the case of this prototype. An increase of experimental friction force is also possible in the dashpot (constant during drop in calculation).
FIG. 5. drop time with 30mm bow deflection.
In case of figure n°5, the assembly is cambered with a 30 mm bow deflection. In comparison with the previous straight case, drop speed is shorter and in consequence drop time is longer.
It shows that the friction force is important enough to modify the drop kinetics in this case. As the experimental speed, the calculated one is almost stable during 1 s before falling down due to presence of the dashpot.
Calculation has been stooped at 2 s.
FIG.6. drop time with S deflection.
In case of figure n°6, assembly is cambered with an S15-12 mm deflection. Drop time is about the same as in the previous case but the speed evolution is clearly different.
193
As for bow deflection, simulation shows clearly the importance of friction force, in drop calculation.
It is important to take into account the real long and slim geometry of the component to calculate correctly the contact and friction.
Those three curves recently obtained without important fitting allows confidence in industrial results for such calculations in a near future. A default signature appears in calculated curves for both type of studied deflection. It can be considered as a good result for such a recent calculation method and such a big component.
7. CONCLUSION AND PROSPECTS
Long contact and friction calculations may be applied to determine insertion strength and drop time and good results compared with experience for these two cases of control rod motions in fuel assembly are obtained.
The numerical model allows to analyze the effect of different parameters either in insertion or drop calculations and to determine those whose effect is significant compared to the others.
Those calculations obtained without important fitting, show the importance of friction in the drop kinetics when assembly is deflected.
The use of these methods will be more industrial in the next few months.
REFERENCES
[1] COLLARD, B., Compte-rendu des essais CIGARE 900, Mwe. Technical note DEC SECA/LHC
98/016.. (1998). [2] LONGATTE-LACAZZEDIEU, E., BOYERE, E., VIVAN, L. Documentation de référence,
documentation de validation, documentation d’utilisation du module de calcul de cinétique de chute de grappe avec Code_Aster, EDF report HI86 /03/024A (2004).
[3] TARDIEU, N., MASSIN, P., Contact-frottement discret en 2D et 3D. Manuel de référence Code_Aster R5.03.51-C. (2003).
194
NEUTRON IRRADIATION EFFECTS ON HYDROGEN SOLUBILITY IN IRRADIATED ZIRCALOY-4 STRUCTURAL COMPONENTS
P. VIZCAÍNO, A.D. BANCHIK CAE-CNEA, Ezeiza, Argentina J.P. ABRIATA CAB-CNEA, S.C. Bariloche, Argentina Abstract In recent experiments carried out at the Synchrotron Light National Laboratory (LNLS1), x-ray diffraction diagrams have been obtained from neutron-irradiated Zircaloy-4 samples. These samples were taken from a cooling channel that was removed from Atucha 1 Nuclear Power Station -Argentina- after 10.3 years of full power operation. These samples have about 180 ppm hydrogen/deuterium due to the hydrogen pick up which takes place while the component is in service. The diffraction diagrams obtained in similar unirradiated Zircaloy-4 samples clearly show the peaks corresponding to <111>δ and <200>δ planes, which are the most intense of the δ-hydride phase, even for concentrations as low as 20 ppm. The high intensity of the x-ray beam and the good peak-background relation has allowed to quantify the hydrogen contents in the unirradiated samples used as a reference for comparisons proposes. The <111>δ and <200>δ peaks observed in irradiated samples annealed at 400 and 600°C show a recovery of the hydride crystalline structure compared to the material in the “as received” condition. An increase in the area under the peaks is observed, which is directly related to the amount of hydride phase present in the sample. These results support the hydrogen traps hypothesis posed in previous works. Key words: Zircaloy-4, irradiated, hydrogen, DRX, LNLS 1. INTRODUCTION In a power nuclear reactor, the radiation damage strongly affects many properties of the materials used to manufacture their components. In the case of zirconium alloys, the neutron damage effect and the adding of hydrogen/deuterium combine to produce material embrittlement. Within this framework, it is very interesting to know the effect of neutron damage on hydrogen solubility in metal. Recent works have determined the temperature of terminal solid solubility in dissolution, TSSdirrad, and the dissolution enthalpy, ∆Hirrad with differential scanning calorimetry, DSC, [1–3]. The values of these magnitudes measured in irradiated samples “as received” are really low compared to those of non-irradiated material. The gradual recovery of these values with post irradiation annealings towards the unirradiated ones have been interpreted by means of a hydrogen trap hypothesis. This hypothesis assumes that a fraction of the hydrogen concentration in volume is related to defects generated by irradiation instead of being precipitated as hydrides [1-5]. 1.1. X-ray Diffraction In the study of structures and identification of crystalline compounds, the most useful technique is undoubtedly X-ray diffraction. The identification by means of this technique requires the sample to contain at least 3 to 5% of the compound of interest. This fact represents a serious limitation when compound under analysis is a very small fraction of the bulk. This is the case of hydrides in Zr alloys in the range of technological interest, the solubility range in the αZr phase ([H] <650ppm).
1 Laboratorio Nacional de Luz Sincrotrón, Campinas, Estado de Sao Paulo, Brasil.
195
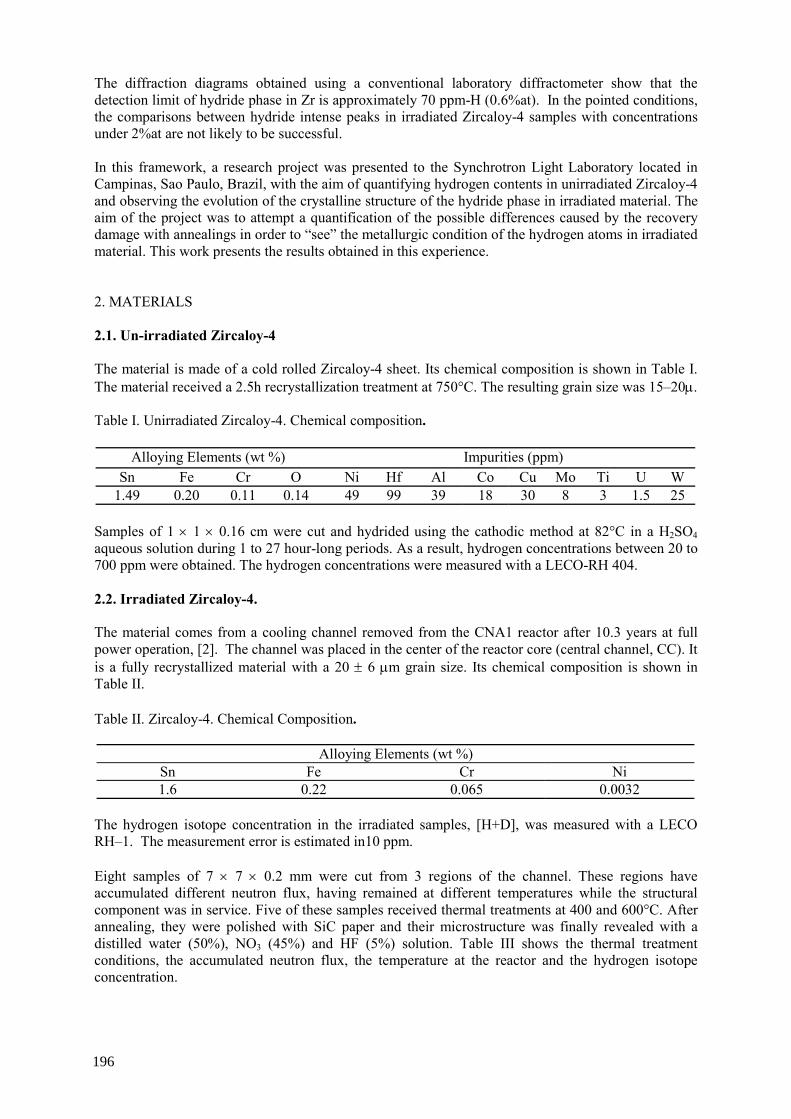
The diffraction diagrams obtained using a conventional laboratory diffractometer show that the detection limit of hydride phase in Zr is approximately 70 ppm-H (0.6%at). In the pointed conditions, the comparisons between hydride intense peaks in irradiated Zircaloy-4 samples with concentrations under 2%at are not likely to be successful. In this framework, a research project was presented to the Synchrotron Light Laboratory located in Campinas, Sao Paulo, Brazil, with the aim of quantifying hydrogen contents in unirradiated Zircaloy-4 and observing the evolution of the crystalline structure of the hydride phase in irradiated material. The aim of the project was to attempt a quantification of the possible differences caused by the recovery damage with annealings in order to “see” the metallurgic condition of the hydrogen atoms in irradiated material. This work presents the results obtained in this experience. 2. MATERIALS 2.1. Un-irradiated Zircaloy-4 The material is made of a cold rolled Zircaloy-4 sheet. Its chemical composition is shown in Table I. The material received a 2.5h recrystallization treatment at 750°C. The resulting grain size was 15–20µ.
Table I. Unirradiated Zircaloy-4. Chemical composition.
Alloying Elements (wt %) Impurities (ppm) Sn Fe Cr O Ni Hf Al Co Cu Mo Ti U W
1.49 0.20 0.11 0.14 49 99 39 18 30 8 3 1.5 25 Samples of 1 × 1 × 0.16 cm were cut and hydrided using the cathodic method at 82°C in a H2SO4 aqueous solution during 1 to 27 hour-long periods. As a result, hydrogen concentrations between 20 to 700 ppm were obtained. The hydrogen concentrations were measured with a LECO-RH 404. 2.2. Irradiated Zircaloy-4. The material comes from a cooling channel removed from the CNA1 reactor after 10.3 years at full power operation, [2]. The channel was placed in the center of the reactor core (central channel, CC). It is a fully recrystallized material with a 20 ± 6 µm grain size. Its chemical composition is shown in Table II.
Table II. Zircaloy-4. Chemical Composition.
Alloying Elements (wt %) Sn Fe Cr Ni 1.6 0.22 0.065 0.0032
The hydrogen isotope concentration in the irradiated samples, [H+D], was measured with a LECO RH–1. The measurement error is estimated in10 ppm. Eight samples of 7 × 7 × 0.2 mm were cut from 3 regions of the channel. These regions have accumulated different neutron flux, having remained at different temperatures while the structural component was in service. Five of these samples received thermal treatments at 400 and 600°C. After annealing, they were polished with SiC paper and their microstructure was finally revealed with a distilled water (50%), NO3 (45%) and HF (5%) solution. Table III shows the thermal treatment conditions, the accumulated neutron flux, the temperature at the reactor and the hydrogen isotope concentration.
196
Table III. Irradiated Zircaloy-4, previous history of the material, [H+D] and thermal treatments
TT Region Sample Top °C
Fluence x1022n/cm2
[H+D] ppm-Heq °C h
1CC 1 263 <0.05 180 - - 2 400 0.5 3 600 4
2CC 1 268 0.7 180 - - 2 400 0.5 3 600 4
3CC 1 280 1.0 170 - - 2 600 4
3. EXPERIMENTAL 3.1. DRX Diagram of Hydrided Zircaloy-4 Samples In the range of compositions of interest for the present work (1–6 %at hydrogen), a conventional diffractometer is close to its detection limit. Limitations obviously increase as [H] decreases. Figure 1 shows the diffraction diagrams obtained with a laboratory diffractometer for 4 unirradiated Zircaloy-4 samples with [H] values of 70, 320, 340 and 520 ppm. The 30°≤ 2θ ≤34° interval is observed, only including the <111>δ line of the δ-hydride phase (2θ = 32.4°), which is the most intense peak of the hydride structure. As it is observed, it is difficult to distinguish the peak from the background for 70 ppm (<1%at). The second intense peak (60%), <200>δ plane reflection; can be appreciated for ~ 4 %at. 3.2. DRX in the LNLS The experiments were carried out in the D12A-XRD1 line, covering all the X-ray spectral range. This line is usually used for research on single crystals and polycrystalline structures with high resolution X-ray diffraction. The photonic flux in this line may reach 5 × 10¹⁰ photons/sec at 8 MeV (λ=1. 542484 Å). The line has a mono-chromator formed by two Si single crystals, which use the radiation reflected by <111> plane. A scintillator is used as a detector and another detector placed before the beam incidence in the sample (Monitor) is used to control the incident beam intensity.
197
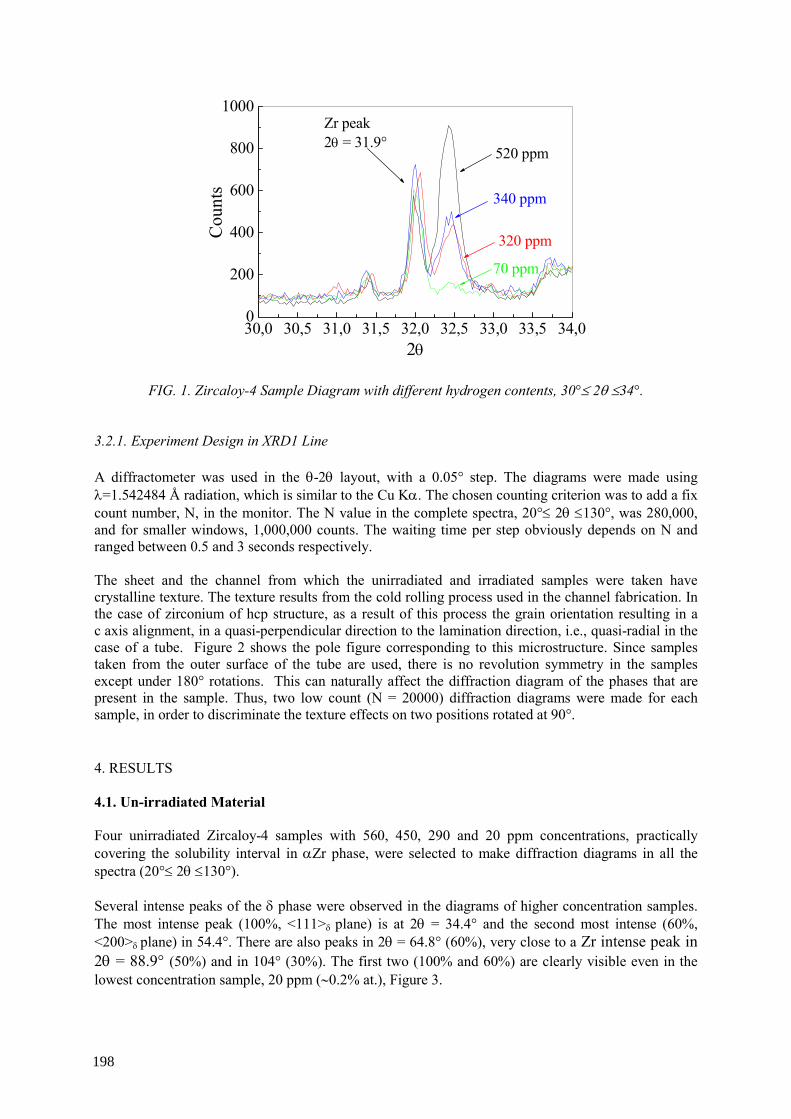
30,0 30,5 31,0 31,5 32,0 32,5 33,0 33,5 34,00
200
400
600
800
1000 Zr peak 2θ = 31.9°
70 ppm
320 ppm
340 ppm
520 ppm
Cou
nts
2θ
FIG. 1. Zircaloy-4 Sample Diagram with different hydrogen contents, 30°≤ 2θ ≤34°.
3.2.1. Experiment Design in XRD1 Line A diffractometer was used in the θ-2θ layout, with a 0.05° step. The diagrams were made using λ=1.542484 Å radiation, which is similar to the Cu Kα. The chosen counting criterion was to add a fix count number, N, in the monitor. The N value in the complete spectra, 20°≤ 2θ ≤130°, was 280,000, and for smaller windows, 1,000,000 counts. The waiting time per step obviously depends on N and ranged between 0.5 and 3 seconds respectively. The sheet and the channel from which the unirradiated and irradiated samples were taken have crystalline texture. The texture results from the cold rolling process used in the channel fabrication. In the case of zirconium of hcp structure, as a result of this process the grain orientation resulting in a c axis alignment, in a quasi-perpendicular direction to the lamination direction, i.e., quasi-radial in the case of a tube. Figure 2 shows the pole figure corresponding to this microstructure. Since samples taken from the outer surface of the tube are used, there is no revolution symmetry in the samples except under 180° rotations. This can naturally affect the diffraction diagram of the phases that are present in the sample. Thus, two low count (N = 20000) diffraction diagrams were made for each sample, in order to discriminate the texture effects on two positions rotated at 90°. 4. RESULTS 4.1. Un-irradiated Material Four unirradiated Zircaloy-4 samples with 560, 450, 290 and 20 ppm concentrations, practically covering the solubility interval in αZr phase, were selected to make diffraction diagrams in all the spectra (20°≤ 2θ ≤130°). Several intense peaks of the δ phase were observed in the diagrams of higher concentration samples. The most intense peak (100%, <111>δ plane) is at 2θ = 34.4° and the second most intense (60%, <200>δ plane) in 54.4°. There are also peaks in 2θ = 64.8° (60%), very close to a Zr intense peak in 2θ = 88.9° (50%) and in 104° (30%). The first two (100% and 60%) are clearly visible even in the lowest concentration sample, 20 ppm (∼0.2% at.), Figure 3.
198
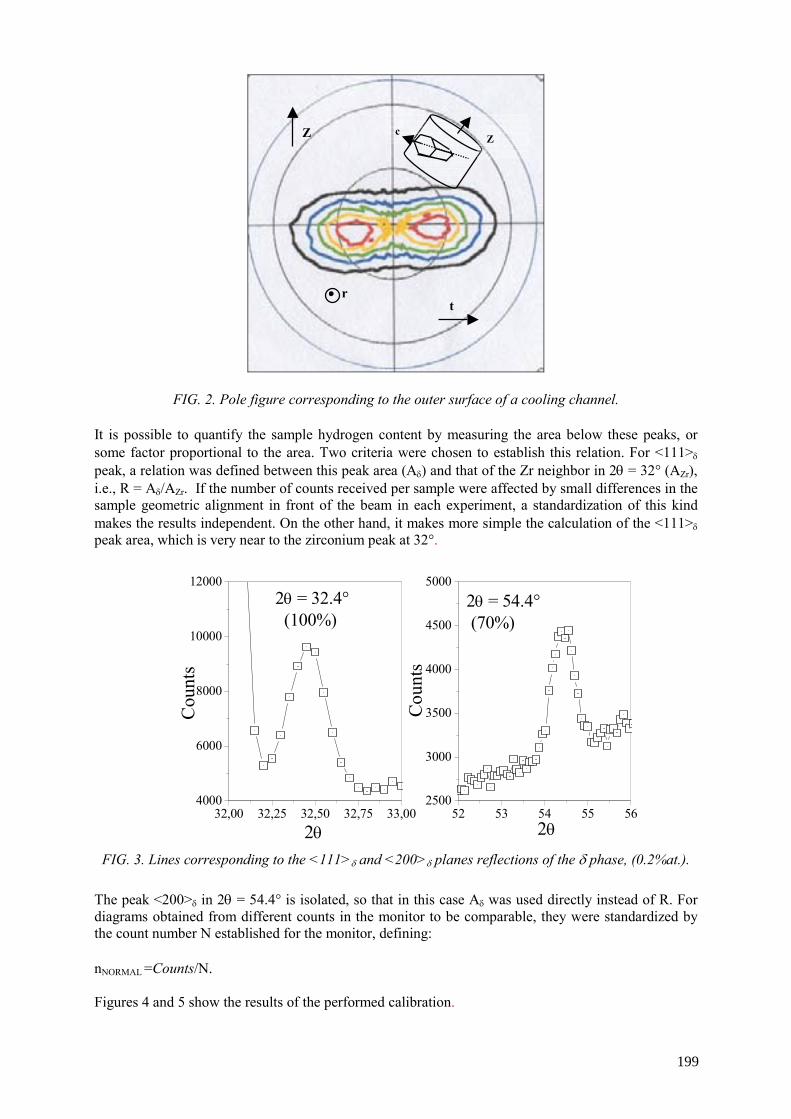
FIG. 2. Pole figure corresponding to the outer surface of a cooling channel. It is possible to quantify the sample hydrogen content by measuring the area below these peaks, or some factor proportional to the area. Two criteria were chosen to establish this relation. For <111>δ peak, a relation was defined between this peak area (Aδ) and that of the Zr neighbor in 2θ = 32° (AZr), i.e., R = Aδ/AZr. If the number of counts received per sample were affected by small differences in the sample geometric alignment in front of the beam in each experiment, a standardization of this kind makes the results independent. On the other hand, it makes more simple the calculation of the <111>δ peak area, which is very near to the zirconium peak at 32°.
32,00 32,25 32,50 32,75 33,004000
6000
8000
10000
12000 2θ = 32.4° (100%)
Cou
nts
2θ52 53 54 55 56
2500
3000
3500
4000
4500
50002θ = 54.4° (70%)
Cou
nts
2θ
FIG. 3. Lines corresponding to the <111>δ and <200>δ planes reflections of the δ phase, (0.2%at.). The peak <200>δ in 2θ = 54.4° is isolated, so that in this case Aδ was used directly instead of R. For diagrams obtained from different counts in the monitor to be comparable, they were standardized by the count number N established for the monitor, defining: nNORMAL =Counts/N. Figures 4 and 5 show the results of the performed calibration.
Z
t • r
Z c
199
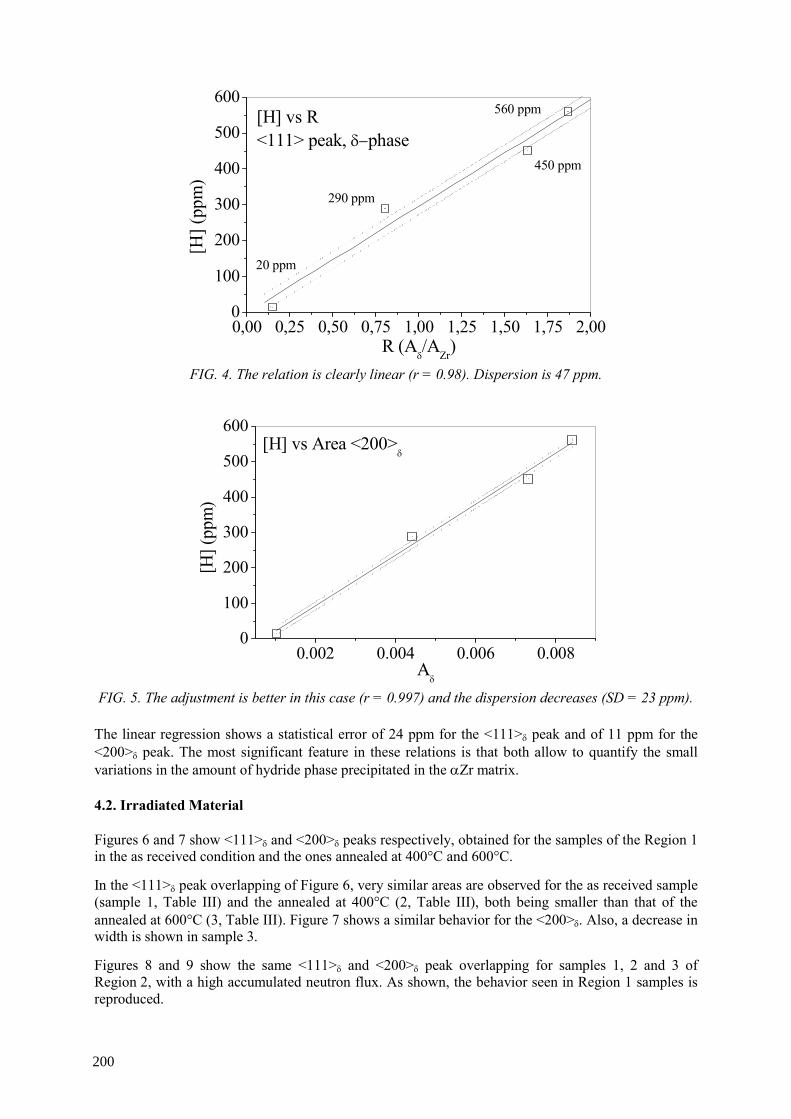
0,00 0,25 0,50 0,75 1,00 1,25 1,50 1,75 2,000
100
200
300
400
500
600560 ppm
290 ppm
450 ppm
20 ppm
[H] (
ppm
)
R (Aδ/AZr)
[H] vs R<111> peak, δ−phase
FIG. 4. The relation is clearly linear (r = 0.98). Dispersion is 47 ppm.
0.002 0.004 0.006 0.0080
100
200
300
400
500
600
Aδ
[H] (
ppm
)
[H] vs Area <200>δ
FIG. 5. The adjustment is better in this case (r = 0.997) and the dispersion decreases (SD = 23 ppm).
The linear regression shows a statistical error of 24 ppm for the <111>δ peak and of 11 ppm for the <200>δ peak. The most significant feature in these relations is that both allow to quantify the small variations in the amount of hydride phase precipitated in the αZr matrix. 4.2. Irradiated Material Figures 6 and 7 show <111>δ and <200>δ peaks respectively, obtained for the samples of the Region 1 in the as received condition and the ones annealed at 400°C and 600°C.
In the <111>δ peak overlapping of Figure 6, very similar areas are observed for the as received sample (sample 1, Table III) and the annealed at 400°C (2, Table III), both being smaller than that of the annealed at 600°C (3, Table III). Figure 7 shows a similar behavior for the <200>δ. Also, a decrease in width is shown in sample 3.
Figures 8 and 9 show the same <111>δ and <200>δ peak overlapping for samples 1, 2 and 3 of Region 2, with a high accumulated neutron flux. As shown, the behavior seen in Region 1 samples is reproduced.
200
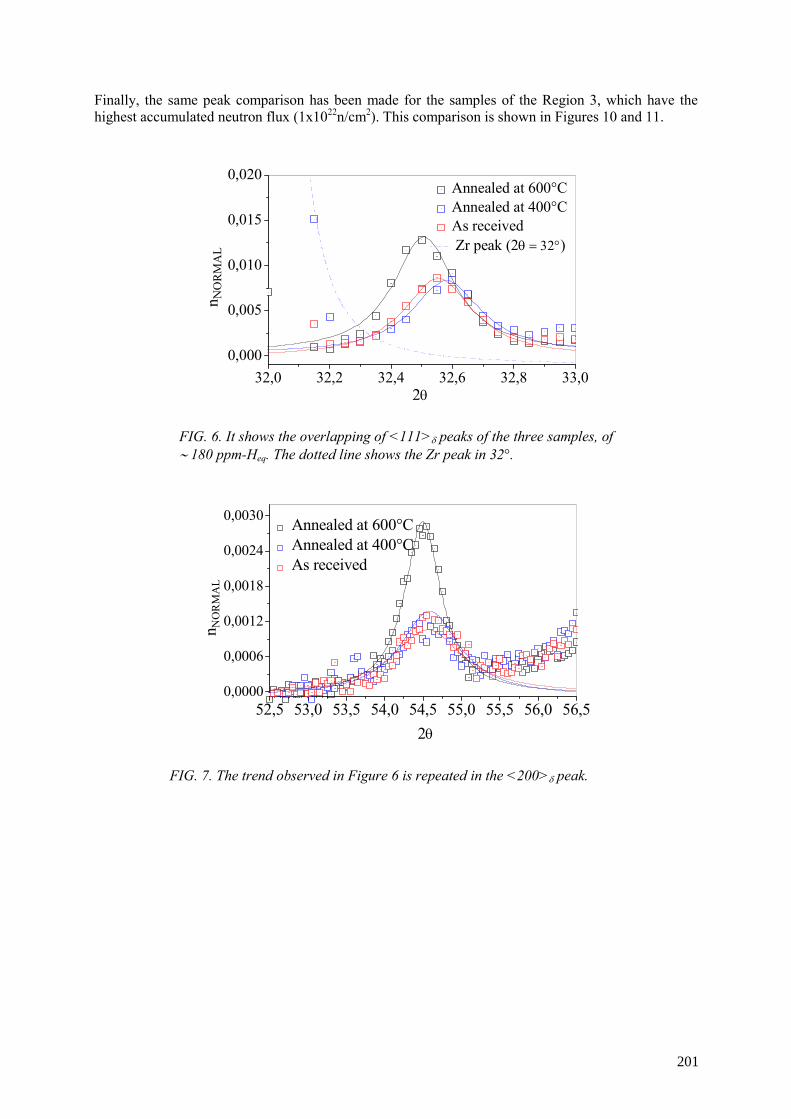
Finally, the same peak comparison has been made for the samples of the Region 3, which have the highest accumulated neutron flux (1x10²²n/cm2). This comparison is shown in Figures 10 and 11.
32,0 32,2 32,4 32,6 32,8 33,00,000
0,005
0,010
0,015
0,020
n NO
RMA
L
2θ
Annealed at 600°CAnnealed at 400°CAs received Zr peak (2θ = 32°)
FIG. 6. It shows the overlapping of <111>δ peaks of the three samples, of ∼ 180 ppm-Heq. The dotted line shows the Zr peak in 32°.
52,5 53,0 53,5 54,0 54,5 55,0 55,5 56,0 56,50,0000
0,0006
0,0012
0,0018
0,0024
0,0030
n NO
RM
AL
2θ
Annealed at 600°C Annealed at 400°C As received
FIG. 7. The trend observed in Figure 6 is repeated in the <200>δ peak.
201

32,0 32,2 32,4 32,6 32,8 33,00,000
0,004
0,008
0,012
0,016
0,020
n NO
RM
AL
2θ
Annealed at 600°C Annealed at 400°C As received
FIG. 8. Overlapped <111>δ peaks for samples 1, 2 and 3 of Region 2.
52,5 53,0 53,5 54,0 54,5 55,0 55,5 56,0 56,50,0000
0,0005
0,0010
0,0015
0,0020
0,0025
0,0030
0,0035
n NO
RM
AL
2θ
Annealed at 600°C Annealed at 400°C As received
FIG. 9. <200>δ peaks, samples 1,2 and 3, Region 2.
32,0 32,2 32,4 32,6 32,8 33,00,000
0,005
0,010
0,015
0,020
0,025
0,030
n NO
RM
AL
2θ
Annealed at 600°C As received
FIG. 10. Overlapping of <111>δ peaks for samples 1 and 2 of Region 3.
202
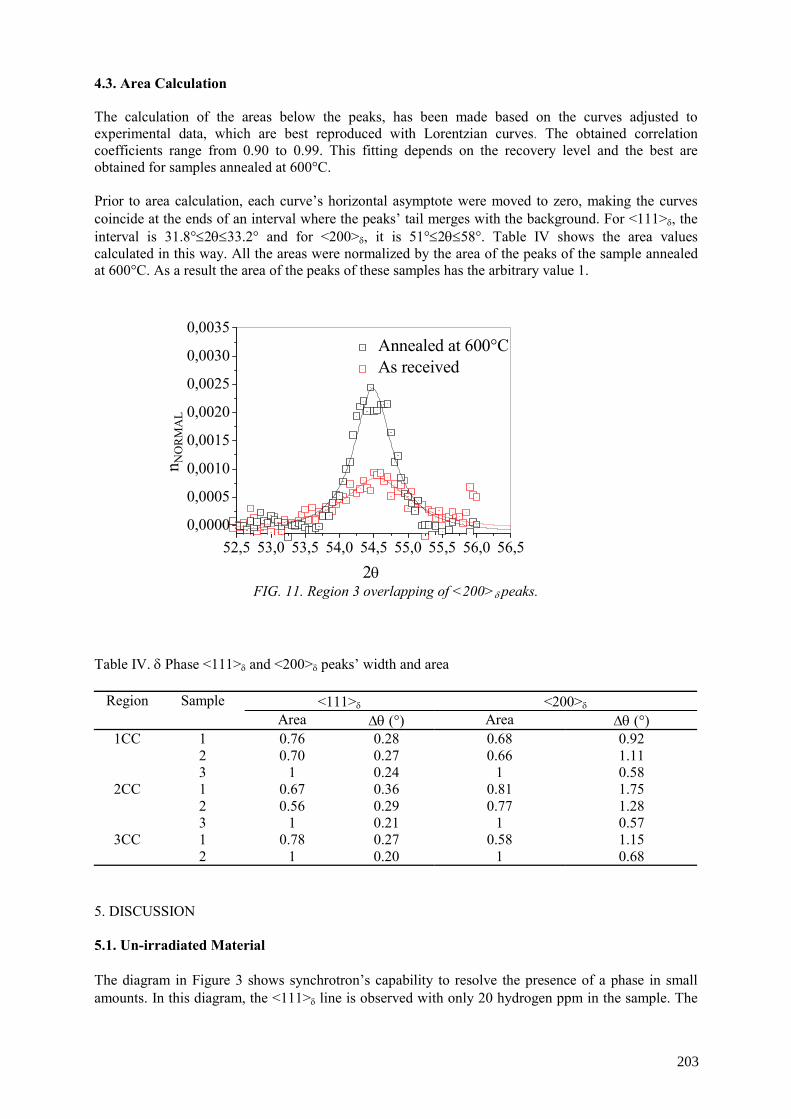
4.3. Area Calculation The calculation of the areas below the peaks, has been made based on the curves adjusted to experimental data, which are best reproduced with Lorentzian curves. The obtained correlation coefficients range from 0.90 to 0.99. This fitting depends on the recovery level and the best are obtained for samples annealed at 600°C. Prior to area calculation, each curve’s horizontal asymptote were moved to zero, making the curves coincide at the ends of an interval where the peaks’ tail merges with the background. For <111>δ, the interval is 31.8°≤2θ≤33.2° and for <200>δ, it is 51°≤2θ≤58°. Table IV shows the area values calculated in this way. All the areas were normalized by the area of the peaks of the sample annealed at 600°C. As a result the area of the peaks of these samples has the arbitrary value 1.
52,5 53,0 53,5 54,0 54,5 55,0 55,5 56,0 56,50,0000
0,0005
0,0010
0,0015
0,0020
0,0025
0,0030
0,0035
n NO
RM
AL
2θ
Annealed at 600°C As received
FIG. 11. Region 3 overlapping of <200>δ peaks.
Table IV. δ Phase <111>δ and <200>δ peaks’ width and area
<111>δ <200>δ Region Sample Area ∆θ (°) Area ∆θ (°)
1CC 1 0.76 0.28 0.68 0.92 2 0.70 0.27 0.66 1.11 3 1 0.24 1 0.58
2CC 1 0.67 0.36 0.81 1.75 2 0.56 0.29 0.77 1.28 3 1 0.21 1 0.57
3CC 1 0.78 0.27 0.58 1.15 2 1 0.20 1 0.68
5. DISCUSSION 5.1. Un-irradiated Material The diagram in Figure 3 shows synchrotron’s capability to resolve the presence of a phase in small amounts. In this diagram, the <111>δ line is observed with only 20 hydrogen ppm in the sample. The
203
peak height/background ratio in 2.2 exceeds 40% the same relation for Figure 1, obtained in a laboratory diffractometer for a 70 ppm sample, in this case of 1.45. Also, several Zr(Fe,Cr)2 phase most intense peaks, typical Zircaloy-4 precipitates, both in irradiated and unirradiated material have been observed, which so far could only be studied in Zircaloy-4 with TEM. The calibration straight lines that were built using the R=Aδ/AZr for <111>δ or Aδ for <200>δ areas relation with a reasonably small experimental error (24 ppm for <111>δ) show that hydride content quantification is possible in a concentration range that is well below the laboratory DRX equipment detection limits (2–3%at.). In LNLS it was possible to detect 0.2%at hydrogen contents (precipitated as hydride) without any difficulty, and to build calibration straight lines with good correlation. 5.2. Irradiated Material As shown in Table IV, the <111>δ and <200>δ peak width in the as received samples doubles the width of those annealed at 600°C. This effect, also seen in the αZr matrix peaks (these results are not presented here) is very similar to the evolution of Zr peaks in the laminated Zircaloy-4 structure recovery process with annealings. This shows that the recovery from diffraction domain distortion caused by plastic deformation is very similar to the radiation damage recovery. This crystalline lattice distortion effect also appears in the background, which decreases with annealings, while the peaks appears substantially narrow. Figures 7 and 9 show the tail of the peak corresponding to the <110>αZr plane reflection of Zr in 2θ = 57° (does not appear in the graphic) overlapping the hydride <200>δ in the as received sample, and a considerable decrease in overlapping for the samples annealed at 600°C. Together with the narrowing, there is an increase in the peak height for samples annealed at 600°C which doubles that of the as received samples or of the samples annealed at 400°C. The effects described so far show that neutron radiation highly distorted the crystalline structure, being the recovery process similar to the cold rolled material recovery. This is shown by the short thermal treatment at 400°C, after which the peaks are more harmonic and better fittings were possible. On the other hand the annealing at 600°C (4h) produced peaks similar to those of an unirradiated recrystallized material. However, the result that we consider most relevant in the present work is the interpretation that may be given to the differences observed in the calculation of areas of the irradiated samples in the three described conditions. Table IV shows that the peaks of the as received samples and samples annealed at 400°C have a smaller area than those completely recovered. Measured values are between 20% and 45% lower than those of the 600°C annealing. Regarding hydrogen concentrations in these samples, this represents a lack of 40 to 80 ppm hydrogen, which should be forming hydrides at the temperature at which the diagrams were obtained (room temperature). With these results, it is possible to think in a hydride phase with diffraction domains that are sufficiently distorted by neutron radiation to reflect X photons in a diffuse manner, adding to the overall diagram background and decreasing the count in the angular position corresponding to the reflecting planes. However, if results obtained using DSC in this same material in previous works are taken into account, i.e., TSSdirrad y ∆Hirrad values significantly lower than those of unirradiated material and their evolution towards unirradiated material values with annealings, this phenomenon may be explained by posing a hydrogen atom-defect interaction, [2,3]. This hypothesis, originally made by W. Lewis [5], allows an interpretation that is compatible with the results obtained with DRX at the LNLS and with DSC, considering that a fraction of the hydrogen concentration in volume is trapped in radiation-generated defect clusters in an amorphous manner, precluding the formation of the hydride well known crystalline structure, [2-4]. 6. CONCLUSIONS The X-ray diffraction diagrams generated with high intensity synchrotron light have allowed the view of the most intense peaks in the hydride phase in samples containing 0.2%at concentrations.
204
The evolution of the <111>δ y <200>δ peak width and height caused by thermal treatments shows that neutron radiation also affects hydride crystalline structure. The third relevant effect for the purpose of this work is the increase in the area of these peaks with 600°C annealings, since treatments at 400°C do not generate any significant changes. The area increase, which is 30% in average, is interpreted as an evidence of a real increase in the hydride amount precipitated in the metal. This increase is compatible with the hydrogen traps hypothesis posed in previous works.
ACKNOWLEDGEMENTS We are very grateful to Dr. Aldo F. Craievich for his support and help both at the preparation stage of the project and during its enforcement at Campinas. We would also like to thank Dr. Marcia Fantini for her support during our stay at the USP and Dr. Eduardo Granados, who is in charge of line D12-XRD1 at the LNLS, for his suggestions while we carried out the experiment. In addition I am grateful to Cintia Fagundez for her collaboration with the dilatometric measurement that I have shown in my oral presentation and to Nicolas Litvak for his pole figures data.
REFERENCES [1] A. MCMINN, E.C. DARBY, Y.J.S. SCHOFIELD, ‘The Terminal Solid Solubility of Hydrogen in Zirconium Alloys’, Zirconium in the Nuclear Industry: Twelfth International Symposium, ASTM STP 1354, (2000), pp. 173–195. [2] P. VIZCAÍNO, A. D. BANCHIK, J. P. ABRIATA. ‘Solubility of Hydrogen in Zircaloy- 4: Irradiation Induced Increase and Thermal Recovery’, Journal of Nuclear Materials. Vol./Issue 304/2-3, (2002), pp.96–106. [3] P. VIZCAÍNO, A.D. BANCHIK, J.P. ABRIATA, ‘Hydride phase dissolution enthalpy in neutron irradiated Zircaloy-4’. Journal of Nuclear Materials. Volume/Issue assigned: 336/1 pp 54–64, in press. [4] P. VIZCAÍNO, A.D. BANCHIK, J.P. ABRIATA, ‘Calorimetric Determination of the δ-Hydride Dissolution Enthalpy in Zircaloy–4’. Metallurgical Materials and Transactions A. Vol.35A, 8, (2004), pp. 2343–2349. [5] M.B. LEWIS, ‘Deuterium Defect Trapping in Ion–Irradiated Zirconium’, Journal of Nuclear Materials 125, (1984), pp. 152–159.
205

VIBRATIONS AND ROD-TO-GRID FRETTING
(Session 3)
Chairpersons
J. VALLORY France
KYU-TAE KIM Republic of Korea

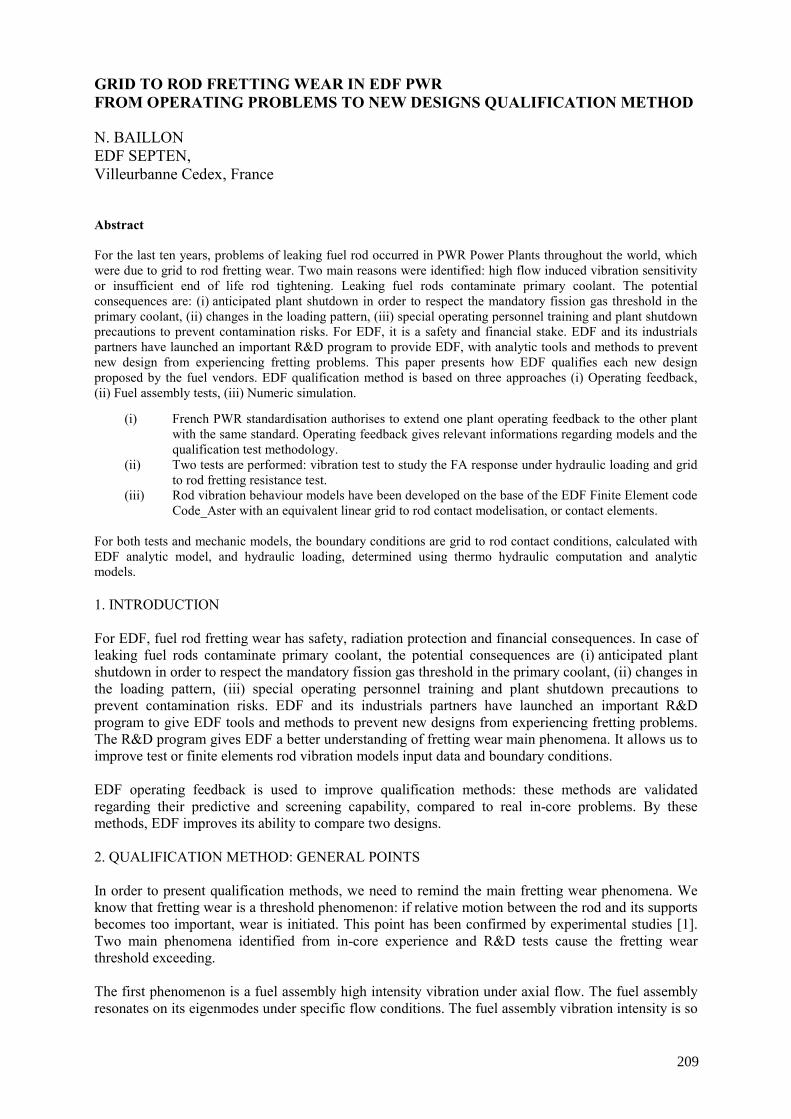
GRID TO ROD FRETTING WEAR IN EDF PWR FROM OPERATING PROBLEMS TO NEW DESIGNS QUALIFICATION METHOD N. BAILLON EDF SEPTEN, Villeurbanne Cedex, France Abstract For the last ten years, problems of leaking fuel rod occurred in PWR Power Plants throughout the world, which were due to grid to rod fretting wear. Two main reasons were identified: high flow induced vibration sensitivity or insufficient end of life rod tightening. Leaking fuel rods contaminate primary coolant. The potential consequences are: (i) anticipated plant shutdown in order to respect the mandatory fission gas threshold in the primary coolant, (ii) changes in the loading pattern, (iii) special operating personnel training and plant shutdown precautions to prevent contamination risks. For EDF, it is a safety and financial stake. EDF and its industrials partners have launched an important R&D program to provide EDF, with analytic tools and methods to prevent new design from experiencing fretting problems. This paper presents how EDF qualifies each new design proposed by the fuel vendors. EDF qualification method is based on three approaches (i) Operating feedback, (ii) Fuel assembly tests, (iii) Numeric simulation.
(i) French PWR standardisation authorises to extend one plant operating feedback to the other plant with the same standard. Operating feedback gives relevant informations regarding models and the qualification test methodology.
(ii) Two tests are performed: vibration test to study the FA response under hydraulic loading and grid to rod fretting resistance test.
(iii) Rod vibration behaviour models have been developed on the base of the EDF Finite Element code Code_Aster with an equivalent linear grid to rod contact modelisation, or contact elements.
For both tests and mechanic models, the boundary conditions are grid to rod contact conditions, calculated with EDF analytic model, and hydraulic loading, determined using thermo hydraulic computation and analytic models. 1. INTRODUCTION For EDF, fuel rod fretting wear has safety, radiation protection and financial consequences. In case of leaking fuel rods contaminate primary coolant, the potential consequences are (i) anticipated plant shutdown in order to respect the mandatory fission gas threshold in the primary coolant, (ii) changes in the loading pattern, (iii) special operating personnel training and plant shutdown precautions to prevent contamination risks. EDF and its industrials partners have launched an important R&D program to give EDF tools and methods to prevent new designs from experiencing fretting problems. The R&D program gives EDF a better understanding of fretting wear main phenomena. It allows us to improve test or finite elements rod vibration models input data and boundary conditions. EDF operating feedback is used to improve qualification methods: these methods are validated regarding their predictive and screening capability, compared to real in-core problems. By these methods, EDF improves its ability to compare two designs. 2. QUALIFICATION METHOD: GENERAL POINTS In order to present qualification methods, we need to remind the main fretting wear phenomena. We know that fretting wear is a threshold phenomenon: if relative motion between the rod and its supports becomes too important, wear is initiated. This point has been confirmed by experimental studies [1]. Two main phenomena identified from in-core experience and R&D tests cause the fretting wear threshold exceeding. The first phenomenon is a fuel assembly high intensity vibration under axial flow. The fuel assembly resonates on its eigenmodes under specific flow conditions. The fuel assembly vibration intensity is so
209
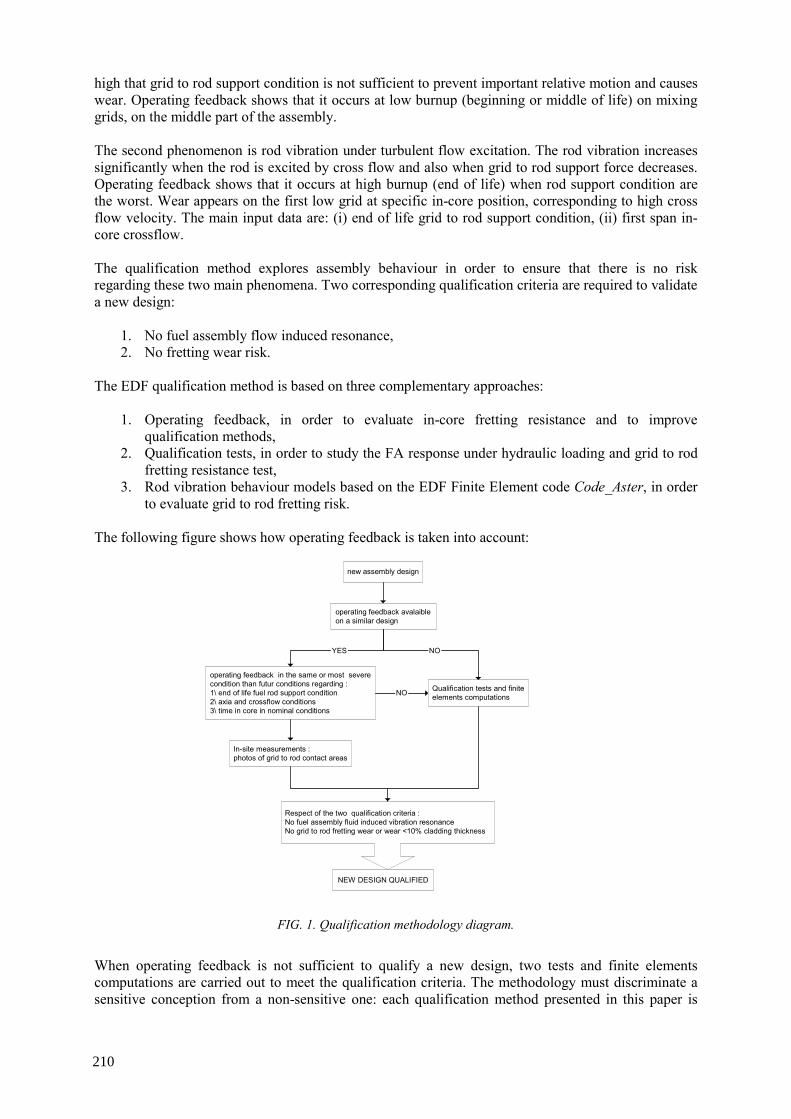
high that grid to rod support condition is not sufficient to prevent important relative motion and causes wear. Operating feedback shows that it occurs at low burnup (beginning or middle of life) on mixing grids, on the middle part of the assembly. The second phenomenon is rod vibration under turbulent flow excitation. The rod vibration increases significantly when the rod is excited by cross flow and also when grid to rod support force decreases. Operating feedback shows that it occurs at high burnup (end of life) when rod support condition are the worst. Wear appears on the first low grid at specific in-core position, corresponding to high cross flow velocity. The main input data are: (i) end of life grid to rod support condition, (ii) first span in-core crossflow. The qualification method explores assembly behaviour in order to ensure that there is no risk regarding these two main phenomena. Two corresponding qualification criteria are required to validate a new design:
1. No fuel assembly flow induced resonance, 2. No fretting wear risk.
The EDF qualification method is based on three complementary approaches:
1. Operating feedback, in order to evaluate in-core fretting resistance and to improve qualification methods,
2. Qualification tests, in order to study the FA response under hydraulic loading and grid to rod fretting resistance test,
3. Rod vibration behaviour models based on the EDF Finite Element code Code_Aster, in order to evaluate grid to rod fretting risk.
The following figure shows how operating feedback is taken into account:
FIG. 1. Qualification methodology diagram.
When operating feedback is not sufficient to qualify a new design, two tests and finite elements computations are carried out to meet the qualification criteria. The methodology must discriminate a sensitive conception from a non-sensitive one: each qualification method presented in this paper is
new assembly design
operating feedback avalaibleon a similar design
operating feedback in the same or most severecondition than futur conditions regarding :1\ end of life fuel rod support condition2\ axia and crossflow conditions3\ time in core in nominal conditions
YES
Qualification tests and finiteelements computations
NO
Respect of the two qualification criteria :No fuel assembly fluid induced vibration resonanceNo grid to rod fretting wear or wear <10% cladding thickness
NO
In-site measurements :photos of grid to rod contact areas
NEW DESIGN QUALIFIED
210
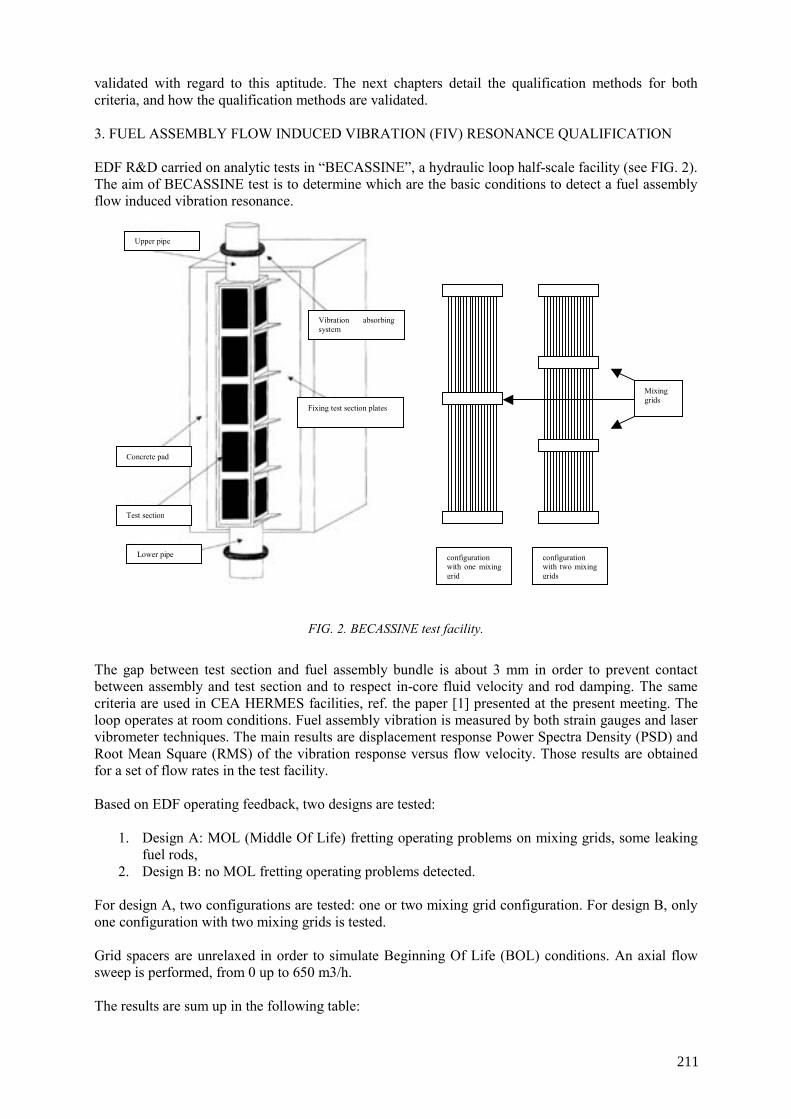
validated with regard to this aptitude. The next chapters detail the qualification methods for both criteria, and how the qualification methods are validated. 3. FUEL ASSEMBLY FLOW INDUCED VIBRATION (FIV) RESONANCE QUALIFICATION EDF R&D carried on analytic tests in “BECASSINE”, a hydraulic loop half-scale facility (see FIG. 2). The aim of BECASSINE test is to determine which are the basic conditions to detect a fuel assembly flow induced vibration resonance.
FIG. 2. BECASSINE test facility.
The gap between test section and fuel assembly bundle is about 3 mm in order to prevent contact between assembly and test section and to respect in-core fluid velocity and rod damping. The same criteria are used in CEA HERMES facilities, ref. the paper [1] presented at the present meeting. The loop operates at room conditions. Fuel assembly vibration is measured by both strain gauges and laser vibrometer techniques. The main results are displacement response Power Spectra Density (PSD) and Root Mean Square (RMS) of the vibration response versus flow velocity. Those results are obtained for a set of flow rates in the test facility. Based on EDF operating feedback, two designs are tested:
1. Design A: MOL (Middle Of Life) fretting operating problems on mixing grids, some leaking fuel rods,
2. Design B: no MOL fretting operating problems detected. For design A, two configurations are tested: one or two mixing grid configuration. For design B, only one configuration with two mixing grids is tested. Grid spacers are unrelaxed in order to simulate Beginning Of Life (BOL) conditions. An axial flow sweep is performed, from 0 up to 650 m3/h. The results are sum up in the following table:
Upper pipe
Lower pipe
Concrete pad
Test section
Fixing test section plates
Vibration absorbingsystem
configuration with one mixing grid
configuration with two mixing grids
Mixing grids
211
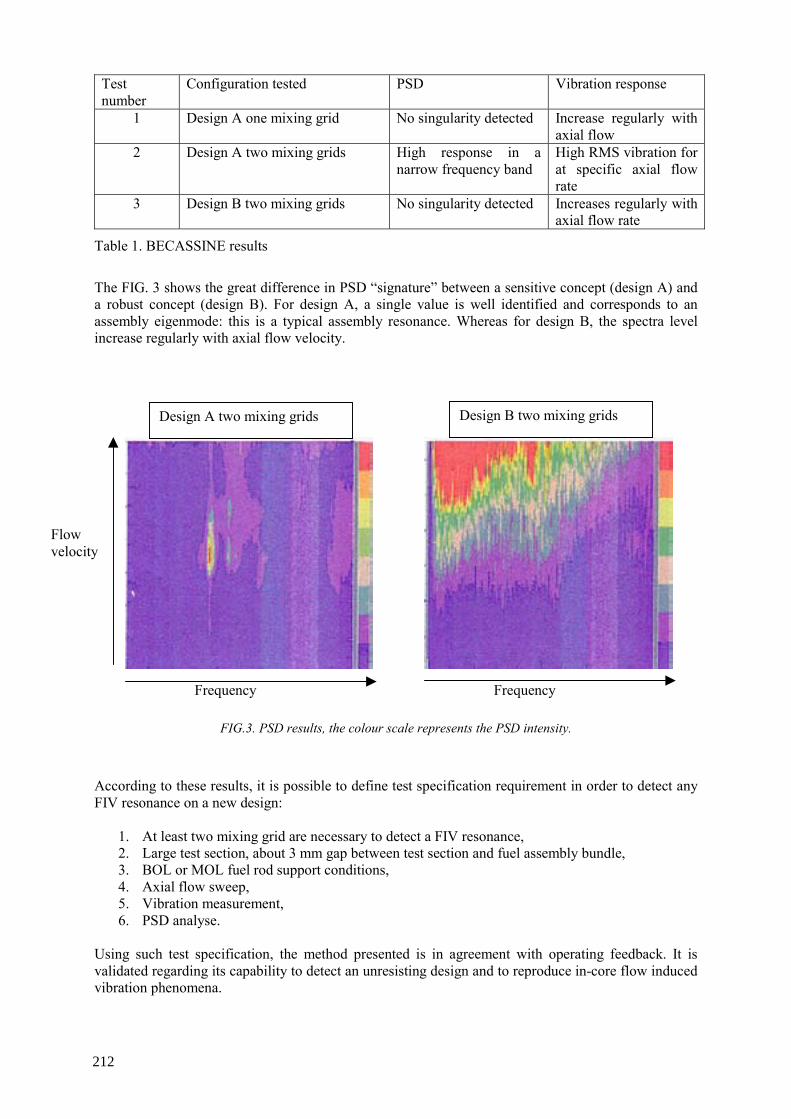
Test number
Configuration tested PSD Vibration response
1 Design A one mixing grid No singularity detected Increase regularly with axial flow
2 Design A two mixing grids High response in a narrow frequency band
High RMS vibration for at specific axial flow rate
3 Design B two mixing grids No singularity detected Increases regularly with axial flow rate
Table 1. BECASSINE results
The FIG. 3 shows the great difference in PSD “signature” between a sensitive concept (design A) and a robust concept (design B). For design A, a single value is well identified and corresponds to an assembly eigenmode: this is a typical assembly resonance. Whereas for design B, the spectra level increase regularly with axial flow velocity.
FIG.3. PSD results, the colour scale represents the PSD intensity.
According to these results, it is possible to define test specification requirement in order to detect any FIV resonance on a new design:
1. At least two mixing grid are necessary to detect a FIV resonance, 2. Large test section, about 3 mm gap between test section and fuel assembly bundle, 3. BOL or MOL fuel rod support conditions, 4. Axial flow sweep, 5. Vibration measurement, 6. PSD analyse.
Using such test specification, the method presented is in agreement with operating feedback. It is validated regarding its capability to detect an unresisting design and to reproduce in-core flow induced vibration phenomena.
Flow velocity
Frequency Frequency
Design A two mixing grids Design B two mixing grids
212
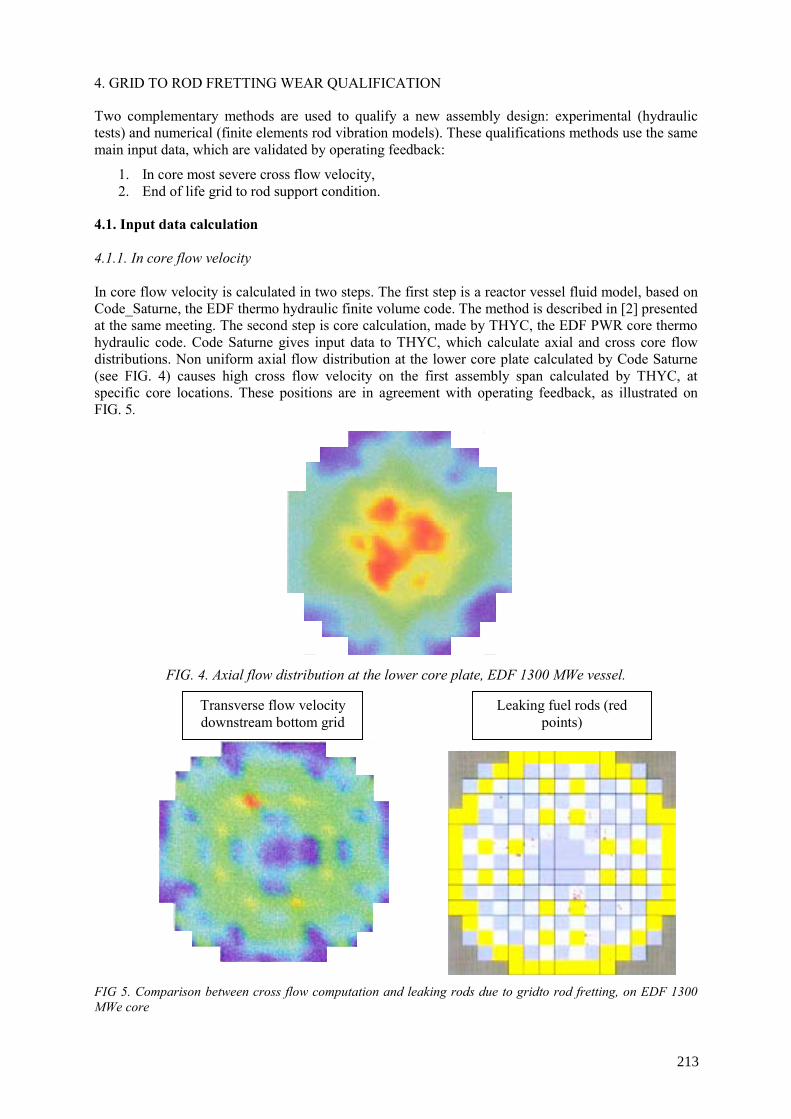
4. GRID TO ROD FRETTING WEAR QUALIFICATION
Two complementary methods are used to qualify a new assembly design: experimental (hydraulic tests) and numerical (finite elements rod vibration models). These qualifications methods use the same main input data, which are validated by operating feedback:
1. In core most severe cross flow velocity, 2. End of life grid to rod support condition.
4.1. Input data calculation
4.1.1. In core flow velocity In core flow velocity is calculated in two steps. The first step is a reactor vessel fluid model, based on Code_Saturne, the EDF thermo hydraulic finite volume code. The method is described in [2] presented at the same meeting. The second step is core calculation, made by THYC, the EDF PWR core thermo hydraulic code. Code Saturne gives input data to THYC, which calculate axial and cross core flow distributions. Non uniform axial flow distribution at the lower core plate calculated by Code Saturne (see FIG. 4) causes high cross flow velocity on the first assembly span calculated by THYC, at specific core locations. These positions are in agreement with operating feedback, as illustrated on FIG. 5.
FIG. 4. Axial flow distribution at the lower core plate, EDF 1300 MWe vessel.
FIG 5. Comparison between cross flow computation and leaking rods due to gridto rod fretting, on EDF 1300 MWe core
Transverse flow velocity downstream bottom grid
Leaking fuel rods (red points)
213
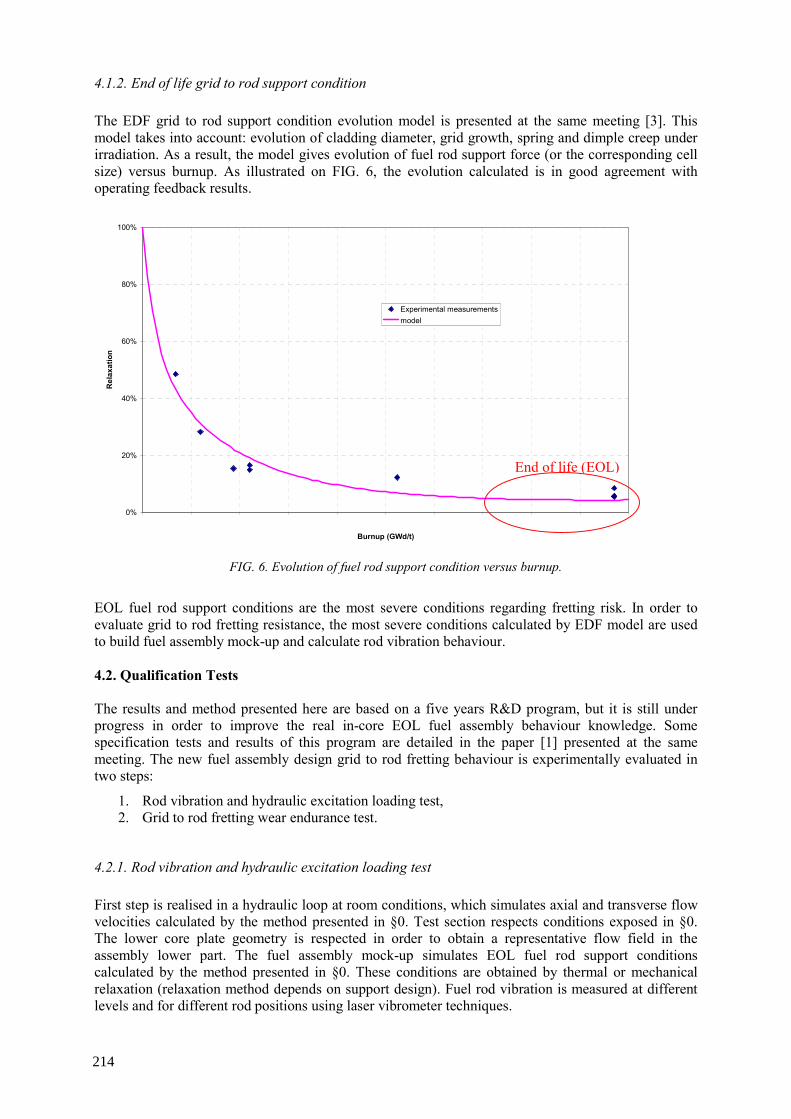
4.1.2. End of life grid to rod support condition The EDF grid to rod support condition evolution model is presented at the same meeting [3]. This model takes into account: evolution of cladding diameter, grid growth, spring and dimple creep under irradiation. As a result, the model gives evolution of fuel rod support force (or the corresponding cell size) versus burnup. As illustrated on FIG. 6, the evolution calculated is in good agreement with operating feedback results.
0%
20%
40%
60%
80%
100%
0 10 20 30 40 50 60 70 80 90 100
Burnup (GWd/t)
Rel
axat
ion
Experimental measurementsmodel
FIG. 6. Evolution of fuel rod support condition versus burnup.
EOL fuel rod support conditions are the most severe conditions regarding fretting risk. In order to evaluate grid to rod fretting resistance, the most severe conditions calculated by EDF model are used to build fuel assembly mock-up and calculate rod vibration behaviour. 4.2. Qualification Tests The results and method presented here are based on a five years R&D program, but it is still under progress in order to improve the real in-core EOL fuel assembly behaviour knowledge. Some specification tests and results of this program are detailed in the paper [1] presented at the same meeting. The new fuel assembly design grid to rod fretting behaviour is experimentally evaluated in two steps:
1. Rod vibration and hydraulic excitation loading test, 2. Grid to rod fretting wear endurance test.
4.2.1. Rod vibration and hydraulic excitation loading test First step is realised in a hydraulic loop at room conditions, which simulates axial and transverse flow velocities calculated by the method presented in §0. Test section respects conditions exposed in §0. The lower core plate geometry is respected in order to obtain a representative flow field in the assembly lower part. The fuel assembly mock-up simulates EOL fuel rod support conditions calculated by the method presented in §0. These conditions are obtained by thermal or mechanical relaxation (relaxation method depends on support design). Fuel rod vibration is measured at different levels and for different rod positions using laser vibrometer techniques.
End of life (EOL)
214
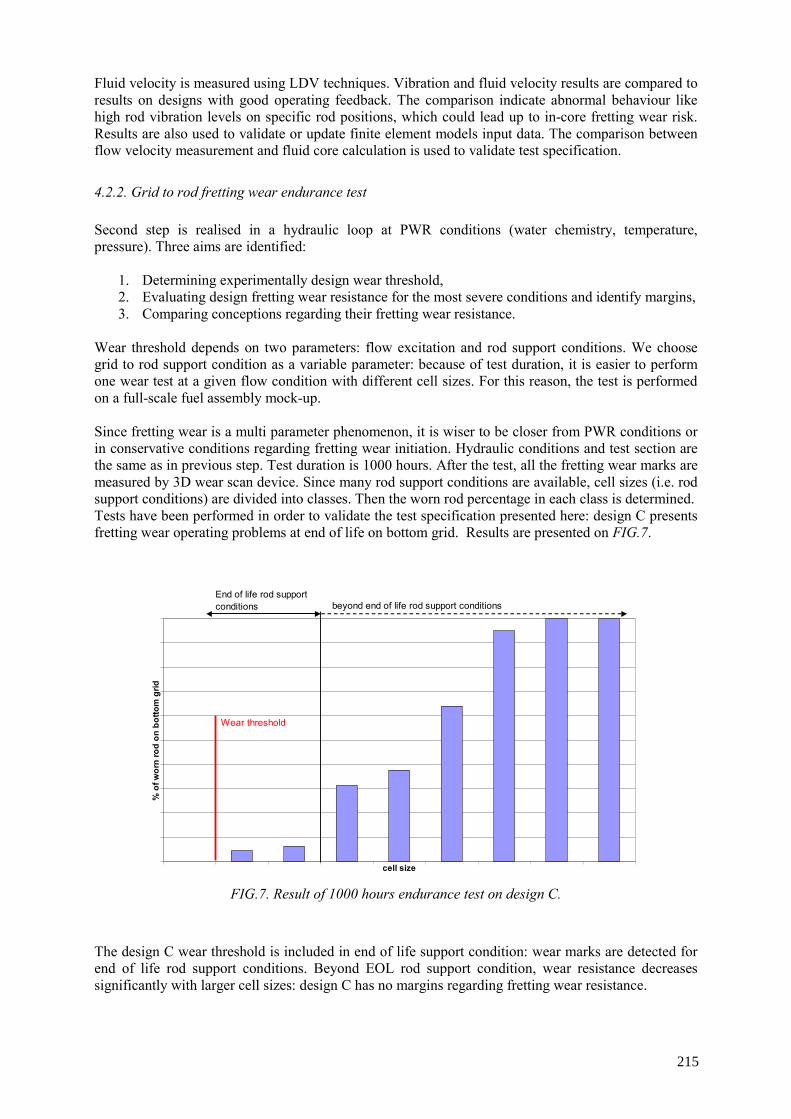
Fluid velocity is measured using LDV techniques. Vibration and fluid velocity results are compared to results on designs with good operating feedback. The comparison indicate abnormal behaviour like high rod vibration levels on specific rod positions, which could lead up to in-core fretting wear risk. Results are also used to validate or update finite element models input data. The comparison between flow velocity measurement and fluid core calculation is used to validate test specification.
4.2.2. Grid to rod fretting wear endurance test Second step is realised in a hydraulic loop at PWR conditions (water chemistry, temperature, pressure). Three aims are identified:
1. Determining experimentally design wear threshold, 2. Evaluating design fretting wear resistance for the most severe conditions and identify margins, 3. Comparing conceptions regarding their fretting wear resistance.
Wear threshold depends on two parameters: flow excitation and rod support conditions. We choose grid to rod support condition as a variable parameter: because of test duration, it is easier to perform one wear test at a given flow condition with different cell sizes. For this reason, the test is performed on a full-scale fuel assembly mock-up. Since fretting wear is a multi parameter phenomenon, it is wiser to be closer from PWR conditions or in conservative conditions regarding fretting wear initiation. Hydraulic conditions and test section are the same as in previous step. Test duration is 1000 hours. After the test, all the fretting wear marks are measured by 3D wear scan device. Since many rod support conditions are available, cell sizes (i.e. rod support conditions) are divided into classes. Then the worn rod percentage in each class is determined. Tests have been performed in order to validate the test specification presented here: design C presents fretting wear operating problems at end of life on bottom grid. Results are presented on FIG.7.
FIG.7. Result of 1000 hours endurance test on design C.
The design C wear threshold is included in end of life support condition: wear marks are detected for end of life rod support conditions. Beyond EOL rod support condition, wear resistance decreases significantly with larger cell sizes: design C has no margins regarding fretting wear resistance.
cell size
% o
f wor
n ro
d on
bot
tom
grid
Wear threshold
End of life rod supportconditions beyond end of life rod support conditions
215
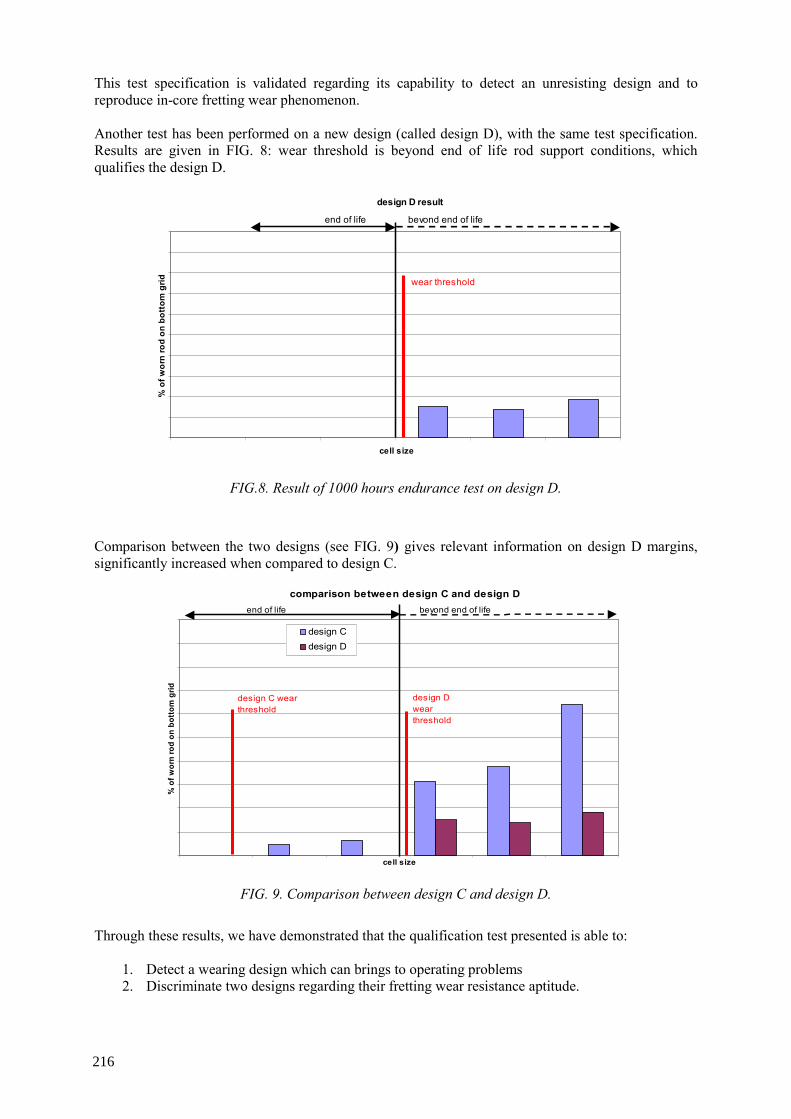
This test specification is validated regarding its capability to detect an unresisting design and to reproduce in-core fretting wear phenomenon. Another test has been performed on a new design (called design D), with the same test specification. Results are given in FIG. 8: wear threshold is beyond end of life rod support conditions, which qualifies the design D.
FIG.8. Result of 1000 hours endurance test on design D.
Comparison between the two designs (see FIG. 9) gives relevant information on design D margins, significantly increased when compared to design C.
FIG. 9. Comparison between design C and design D.
Through these results, we have demonstrated that the qualification test presented is able to:
1. Detect a wearing design which can brings to operating problems 2. Discriminate two designs regarding their fretting wear resistance aptitude.
comparison between design C and design D
cell size
% o
f wor
n ro
d on
bot
tom
grid
design Cdesign D
design C wear threshold
design D wear threshold
end of life beyond end of life
design D result
cell size
% o
f wor
n ro
d on
bot
tom
grid wear threshold
end of life beyond end of life
216
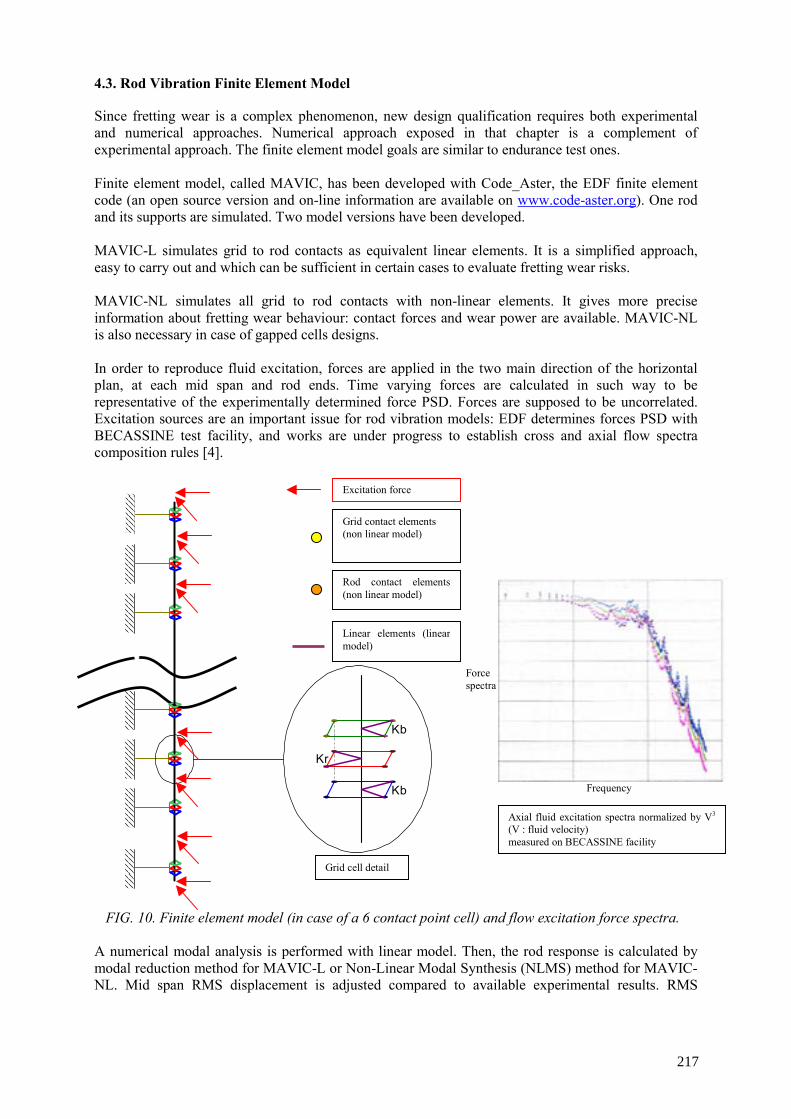
4.3. Rod Vibration Finite Element Model
Since fretting wear is a complex phenomenon, new design qualification requires both experimental and numerical approaches. Numerical approach exposed in that chapter is a complement of experimental approach. The finite element model goals are similar to endurance test ones. Finite element model, called MAVIC, has been developed with Code_Aster, the EDF finite element code (an open source version and on-line information are available on www.code-aster.org). One rod and its supports are simulated. Two model versions have been developed. MAVIC-L simulates grid to rod contacts as equivalent linear elements. It is a simplified approach, easy to carry out and which can be sufficient in certain cases to evaluate fretting wear risks. MAVIC-NL simulates all grid to rod contacts with non-linear elements. It gives more precise information about fretting wear behaviour: contact forces and wear power are available. MAVIC-NL is also necessary in case of gapped cells designs. In order to reproduce fluid excitation, forces are applied in the two main direction of the horizontal plan, at each mid span and rod ends. Time varying forces are calculated in such way to be representative of the experimentally determined force PSD. Forces are supposed to be uncorrelated. Excitation sources are an important issue for rod vibration models: EDF determines forces PSD with BECASSINE test facility, and works are under progress to establish cross and axial flow spectra composition rules [4].
FIG. 10. Finite element model (in case of a 6 contact point cell) and flow excitation force spectra.
A numerical modal analysis is performed with linear model. Then, the rod response is calculated by modal reduction method for MAVIC-L or Non-Linear Modal Synthesis (NLMS) method for MAVIC-NL. Mid span RMS displacement is adjusted compared to available experimental results. RMS
Kb
Kr
Kb
Grid contact elements (non linear model)
Rod contact elements(non linear model)
Linear elements (linearmodel)
Excitation force
Grid cell detail
Axial fluid excitation spectra normalized by V3
(V : fluid velocity) measured on BECASSINE facility
Frequency
Force spectra
217
rotation gives indication of grid to rod fretting risk: it is compared to the grid design wear threshold, which is evaluated on analytical tests. Since rod rotation is under threshold, there is no fretting risk. With the non-linear version, wear power values are obtained at each contact point, which give an indication on wear risk margins: wear risk increases with wear power. Design C and D (the same as previously) have been compared using MAVIC-NL. Excitation levels and grid to rod contact conditions simulate the most severe conditions experimented in core. Results for the bottom grid are summed up in Table 2. Design C Design D Rod rotation / grid design wear threshold
1.47 0.38
Contact power (relative values) 1 0.08
Table 2. Comparison between designs C and D using MAVIC-NL on bottom grid
Design C rod rotation level on bottom grid is significantly higher than wear threshold, which indicates an important fretting risk: MAVIC-NL results correspond to operating experience, and are able to detect an unresisting design. Design D rod rotation is well under wear threshold, and compared to design C contact power is more than ten times lower. As a consequence, design D is qualified, and has significant margins regarding contact power values. This result confirms endurance tests results. Both numerical and experimental results give complementary results, which qualifies design D with a good reliability. 5. CONCLUSION EDF fretting wear qualification methods have been exposed. Fretting wear qualification is based on complementary approaches:
Operating feedback analysis: operating approach, Qualification tests analysis: experimental approach, Rod vibration model: numerical approach.
Operating feedback problems analysis and understanding is the basis to qualify a new design. Both experimental and numerical approaches have been validated regarding their capacity to reproduce in-core fretting problems. Concerning FIV resonance, only an experimental approach is available. It gives acceptable results if some specifications are respected. Concerning grid to rod fretting wear due to rod vibration, experimental and numerical approaches are available. Both approaches are consistent, which is a guarantee to detect any fretting wear problem. Thanks to the methods exposed, EDF is able to qualify a new design with a good reliability regarding fretting risks, and to quantify design margins. Qualification methods presented here enable to compare different designs regarding its fretting wear robustness, which is an important choice criterion for new designs.
ACKNOWLEDGEMENTS The author would like to thank for their technical support:
EDF R&D MFTT department and particularly Christelle Raynaud (BECASSINE tests), EDF R&D AMA department, The French Atomic Energy Commission Core Hydromechanics Laboratory.
218

REFERENCES [1] J. VALLORY (CEA CADARACHE, core hydromechanics lab.), “Methodology of PWR fuel
rod vibration and fretting evaluation in HERMES facilities”, TCM on fuel assembly structural behaviour, CEA CADARACHE FRANCE, 2004.
[2] Y. FOURNIER (EDF R&D),“Evaluation of fluid flow in the core of a PWR and fuel assembly nozzle area with Code Saturne”, TCM on fuel assembly structural behaviour, CEA CADARACHE FRANCE, 2004.
[3] A. BILLEREY (EDF SEPTEN), “Evolution of the fuel rod support under irradiation and its impact on the mechanical behaviour of the fuel assemblies”, TCM on fuel assembly structural behaviour, CEA CADARACHE FRANCE, 2004.
[4] G. GOBILLOT (CEA CADARACHE, core hydromechanics lab.), “Determination of turbulent excitation spectra superposition’s rules in various cases of 2D mixed flow redistribution in PWR fuel assemblies”, TCM on fuel assembly structural behaviour, CEA CADARACHE FRANCE, 2004.
219

METHODOLOGY OF PWR FUEL ROD VIBRATION AND FRETTING EVALUATION IN HERMES FACILITIES J. VALLORY French Atomic Energy Commission, Saint Paul lez Durance, France Abstract
In recent years, more demanding PWR core designs and operating strategies (longer cycle length, higher burn up, low leakage core…) have been chosen to improve capacity factors and fuel cycle economics. Moreover, in the current environment, fuel reliability remains an important concern. Within this context, fuel failures caused by grid-to-rod fretting now appear as a main issue due to new fuel assembly designs and their interaction with operating plants. In order to evaluate fuel assembly (FA) performances in terms of grid-to-rod fretting prior to its in-core operating, the CEA has developed the capacity to test fuel assembly prototypes in full-scale facilities so that wear and fuel vibrations can be evaluated experimentally. This paper will present these two steps:
- The first step will consist of evaluating the fuel vibrations and fluid velocity fields in the HERMES T facility under variable flow conditions,
- The second step will involve wear evaluation at nominal PWR conditions in the HERMES P facility using a 3-dimensional wear bench especially adapted to characterize fuel rod wear extensively. In order to improve FA qualification, the fuel assembly boundary conditions in operating plants have been studied and led to specific modifications in the HERMES facilities. The PWR scale 1 test facility HERMES P operating at nominal conditions has been modified to take these evolutions into account owing to our improved knowledge of both the mechanical and hydraulic in-reactor FA behavior. One of the major improvements, that is to be presented in the paper, concerns the hydraulic loop which has been modified. Its purpose is to simulate various in-core redistributions. Along with scale 1 test facilities, some ‘reduced scale’ test facilities (GRILLON) are operated to test determining parameters (temperature, test duration, etc…). Analytical results have been used as input data to define the methodology for the wear experimentation in test facilities of fuel assembly designs. For example, results obtained on wear
- With/without oxidation emphasized the importance of parameters such as water chemistry and temperature for qualification tests,
- Data scattering underlined the necessity to conduct wear qualification on actual scale 1-17*17 fuel assembly mock-ups.
The methodology has been qualified on some FA designs and illustrative results will be presented in the paper. 1. INTRODUCTION
The study of fuel rods’ wear is a topical question: safety aspects give rise to the reduction of contamination and the fuel cladding represents the first containment barrier. It is then necessary to maintain its integrity under all operating conditions. Furthermore, current PWR core designs and operating strategies tend to push fuel duty (higher burn up, longer cycle length,…) increasing the risk of grid-to-rod fretting occurrence. Within this context, the CEA operates full scale or less industrial « easy-to-operate » facilities to study the fretting of fuel rods. The fretting wear is a surface damage resulting from relative motion between two surfaces in contact under pressure. In the case of PWR, the fuel rod vibrations are induced by the coolant water. A relative motion exists between the rod and the fuel assembly grid cell composed of springs and dimples. The phenomenon is difficult to grasp since this relative motion is altered during the operating lifetime due to irradiation effects (for example, the spring forces are reduced because of irradiation-induced relaxation and might lead to very low spring force or even small gaps). The effect of irradiation has to be simulated in test facilities. Moreover, the thermal hydraulic and chemical PWR conditions tend to increase the
221

difficulty to reproduce and analyze the vibration induced damage of cladding tubes and fretting parameters are difficult to control and study individually. It is however necessary to evaluate fretting in test facilities since the material of the fuel rod is radioactive and impossible to study in core. Furthermore, extracting worn components from the core is extremely expensive. The aim of the present work is to present the CEA test methodology and facilities along with some wear results and a review of studies applied to grid-to-rod fretting. Regarding experimental studies, the test apparatus are quite specific since they all deal with flow induced type of fuel rod excitation. The realism of the excitation imposed to the structure is an important parameter when one wants to study the fretting process. 2. GRID TO ROD FRETTING METHODOLOGY EVOLUTIONS At the end of the 1990’s, the CEA launched an important R & D program to study grid-to-rod fretting. The project is twofold. One aspect is dedicated to analytical studies in order to point out major physical parameters acting on grid-to-rod fretting and to develop models to predict fuel rod vibrations and ultimately wear. Some of these results are input data of the project’s second part. It consists in the definition of a methodology dedicated to fuel rod fretting evaluation of a new PWR design in flow test facilities prior to its in-core operations. In order to define such a methodology, we had to: – Improve the knowledge of in core fuel assembly behavior so that we could closely simulate it in a
flow test facility, – Conduct some analytical studies to evaluate major parameters acting on wear in the best manner
possible, – Finally define a methodology of fuel rod vibrations and grid-to-rod fretting evaluation, which resulted
in adapting the test facilities. 2.1. In core fuel assembly behavior The mechanical FA behavior in the core has been studied on the neutron noise measured on site. The FA modal frequencies identified on the neutron noise spectrum indicates that FA vibrates on a non-contact basis with other FA in the core (figure 1).
FIG. 1. Neutron noise spectrum (fuel assembly vibration modes).
Fuel assembly Beam / mode 1 Beam / mode 2
222
The HERMES P is an out-of-pile flow test facility operating at PWR nominal conditions and dedicated to ‘endurance tests’ for vibrations and wear evaluation. Since this facility was designed at first to measure pressure drop coefficients up to the reactor Reynolds number, it was built so that the flow housing represents the hydraulic channel seen by the FA in the reactor. This design induced multiple FA contacts on the test shroud and did not represent FA in-core boundary conditions for the purpose of vibrations and wear evaluation. A new FA holder was designed with large internal dimensions and now any gap between the FA and the test shroud can be generated using additional plates. The maximum dimensions were chosen so that the test section can be used for FA large amplitude seismic types of excitation at PWR conditions. The gap size between the FA and the test shroud for vibrations and wear evaluation was optimized so that: – No contact is observed in air prior to the test, – The by pass to FA flow velocity rate is similar to the one observed in the core, – No additional damping is induced by the gap size on peripheral fuel rods.
The mechanical boundary conditions of the upper and lower core plate in the test facility were also improved. Furthermore, some calculations of the flow distribution in the core were done by industrial partners, the EDF and FRAMATOME-ANP using thermal hydraulic codes. The results showed that some transverse flow deviations could be observed on the first FA span and had to be simulated in a single bundle channel test facility [1]. For that purpose, a transverse branch was added to the hydraulic loop and the test channel modified for transverse flow injection. For the FA mock-up, the mechanical properties are altered during the operating life time due to an irradiation effect [2, 3]: the diameter of the rod is slightly changed due to pressure forces and neutron flux. Also the spring forces are reduced because of irradiation-induced relaxation and grid growth. These phenomena tend to reduce the normal force of the spring acting on the fuel rod and might open gaps between the rod and the grid cell. The effect of irradiation is simulated in test facilities by mechanical relaxation of the springs to simulate different restraining conditions of the fuel rod. The fuel rod damping evolution due to the effect of rod-pellet interaction is also a concern in the designing of the FA mock-up.
2.2. Analytical studies on grid-to-rod fretting To contribute to the improvement of the wear evaluation methodology in flow test facilities, some analytical studies are being carried out to analyze the effect of major parameters such as endurance length, test temperature, chemistry, etc… For that purpose, the CEA has built the GRILLON test facilities [4]. These test apparatuses have been built on a reduced scale (5×5 or 1×1 fuel mock-ups, reduced in height- 2 to 3 spans, hydraulic loop operating at cold conditions for GRILLON Froid) and deal with the flow-induced type of fuel rod excitation. The realism of the excitation imposed on the structure is an important parameter when we want to study the fretting process (small amplitudes of vibration). The endurance length effect has been studied in the GRILLON Froid test facility. Since wear is a very scattering phenomenon, it has to be evaluated from a statistical point of view. Two fuel mock-ups were used and the three endurance tests lasted 500, 1000 and 2000 hours respectively. On the design studied, the endurance rate decreased with endurance length as shown in figure 2.
223
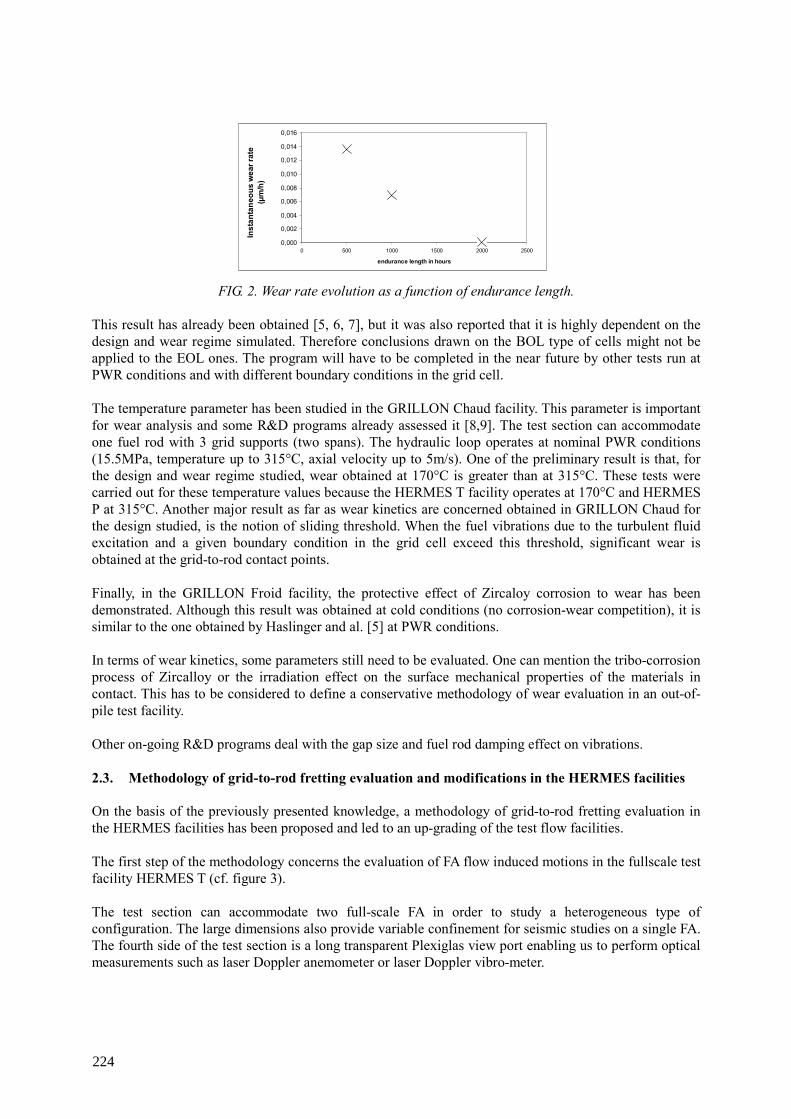
0,000
0,002
0,004
0,006
0,008
0,010
0,012
0,014
0,016
0 500 1000 1500 2000 2500
endurance length in hours
Inst
anta
neou
s w
ear r
ate
(µm
/h)
FIG. 2. Wear rate evolution as a function of endurance length. This result has already been obtained [5, 6, 7], but it was also reported that it is highly dependent on the design and wear regime simulated. Therefore conclusions drawn on the BOL type of cells might not be applied to the EOL ones. The program will have to be completed in the near future by other tests run at PWR conditions and with different boundary conditions in the grid cell. The temperature parameter has been studied in the GRILLON Chaud facility. This parameter is important for wear analysis and some R&D programs already assessed it [8,9]. The test section can accommodate one fuel rod with 3 grid supports (two spans). The hydraulic loop operates at nominal PWR conditions (15.5MPa, temperature up to 315°C, axial velocity up to 5m/s). One of the preliminary result is that, for the design and wear regime studied, wear obtained at 170°C is greater than at 315°C. These tests were carried out for these temperature values because the HERMES T facility operates at 170°C and HERMES P at 315°C. Another major result as far as wear kinetics are concerned obtained in GRILLON Chaud for the design studied, is the notion of sliding threshold. When the fuel vibrations due to the turbulent fluid excitation and a given boundary condition in the grid cell exceed this threshold, significant wear is obtained at the grid-to-rod contact points. Finally, in the GRILLON Froid facility, the protective effect of Zircaloy corrosion to wear has been demonstrated. Although this result was obtained at cold conditions (no corrosion-wear competition), it is similar to the one obtained by Haslinger and al. [5] at PWR conditions. In terms of wear kinetics, some parameters still need to be evaluated. One can mention the tribo-corrosion process of Zircalloy or the irradiation effect on the surface mechanical properties of the materials in contact. This has to be considered to define a conservative methodology of wear evaluation in an out-of-pile test facility. Other on-going R&D programs deal with the gap size and fuel rod damping effect on vibrations. 2.3. Methodology of grid-to-rod fretting evaluation and modifications in the HERMES facilities
On the basis of the previously presented knowledge, a methodology of grid-to-rod fretting evaluation in the HERMES facilities has been proposed and led to an up-grading of the test flow facilities. The first step of the methodology concerns the evaluation of FA flow induced motions in the fullscale test facility HERMES T (cf. figure 3). The test section can accommodate two full-scale FA in order to study a heterogeneous type of configuration. The large dimensions also provide variable confinement for seismic studies on a single FA. The fourth side of the test section is a long transparent Plexiglas view port enabling us to perform optical measurements such as laser Doppler anemometer or laser Doppler vibro-meter.
224
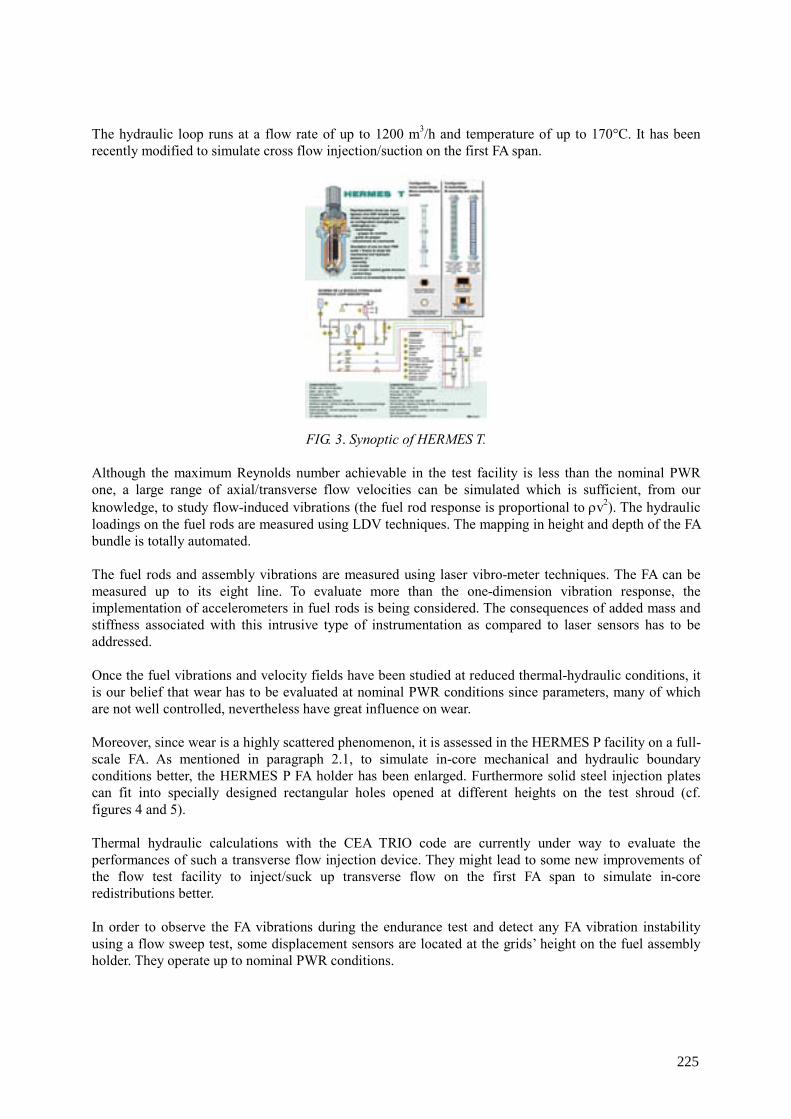
The hydraulic loop runs at a flow rate of up to 1200 m3/h and temperature of up to 170°C. It has been recently modified to simulate cross flow injection/suction on the first FA span.
FIG. 3. Synoptic of HERMES T.
Although the maximum Reynolds number achievable in the test facility is less than the nominal PWR one, a large range of axial/transverse flow velocities can be simulated which is sufficient, from our knowledge, to study flow-induced vibrations (the fuel rod response is proportional to ρv2). The hydraulic loadings on the fuel rods are measured using LDV techniques. The mapping in height and depth of the FA bundle is totally automated. The fuel rods and assembly vibrations are measured using laser vibro-meter techniques. The FA can be measured up to its eight line. To evaluate more than the one-dimension vibration response, the implementation of accelerometers in fuel rods is being considered. The consequences of added mass and stiffness associated with this intrusive type of instrumentation as compared to laser sensors has to be addressed. Once the fuel vibrations and velocity fields have been studied at reduced thermal-hydraulic conditions, it is our belief that wear has to be evaluated at nominal PWR conditions since parameters, many of which are not well controlled, nevertheless have great influence on wear. Moreover, since wear is a highly scattered phenomenon, it is assessed in the HERMES P facility on a full-scale FA. As mentioned in paragraph 2.1, to simulate in-core mechanical and hydraulic boundary conditions better, the HERMES P FA holder has been enlarged. Furthermore solid steel injection plates can fit into specially designed rectangular holes opened at different heights on the test shroud (cf. figures 4 and 5). Thermal hydraulic calculations with the CEA TRIO code are currently under way to evaluate the performances of such a transverse flow injection device. They might lead to some new improvements of the flow test facility to inject/suck up transverse flow on the first FA span to simulate in-core redistributions better. In order to observe the FA vibrations during the endurance test and detect any FA vibration instability using a flow sweep test, some displacement sensors are located at the grids’ height on the fuel assembly holder. They operate up to nominal PWR conditions.
225

FIG. 4. Synoptic of HERMES P. FIG. 5. HERMES P FA holder and solid steel injection plate.
Grid-to-rod wear on the cladding is evaluated using a 3D wear scan and measurement device (figure 6).
FIG. 6. 3D wear scan and measurement device.
For statistical purposes, all fuel rods are extracted from the FA after the endurance test in HERMES P and visually observed at all grid elevations. A measurement device based on optical high resolution micro-topograph is being developed to automate this analysis. 3. RESULTS OF THE REFERENCE TESTS A reference test had to be conducted to validate the relevance of this approach, which consists in: – (Step 1) evaluating the FA vibrations and hydraulic loadings fields in the HERMES T flow facility, – (Step 2) simulating the PWR thermal hydraulic conditions in the HERMES P facility, during a
1000 h endurance test, to evaluate wear of a new design.
In a heterogeneous configuration (FA of different designs), the fuel rod vibrations were measured using a laser vibrometer (figure 7).
226
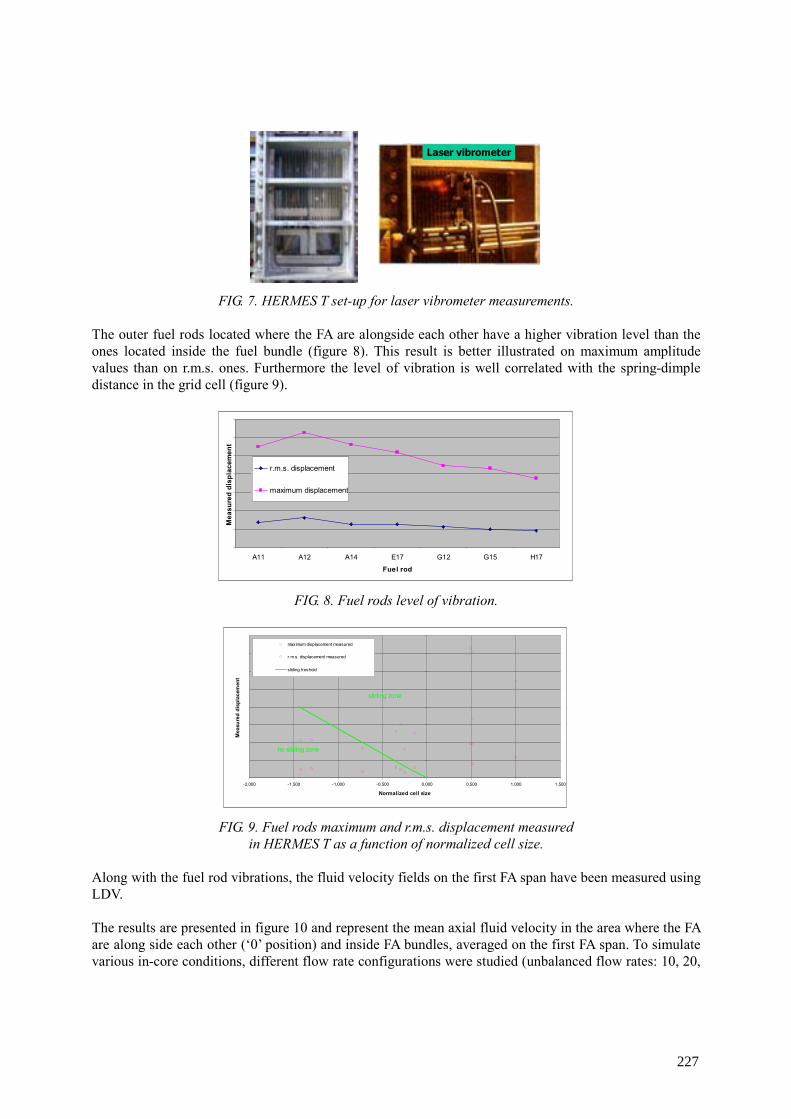
FIG. 7. HERMES T set-up for laser vibrometer measurements. The outer fuel rods located where the FA are alongside each other have a higher vibration level than the ones located inside the fuel bundle (figure 8). This result is better illustrated on maximum amplitude values than on r.m.s. ones. Furthermore the level of vibration is well correlated with the spring-dimple distance in the grid cell (figure 9).
A11 A12 A14 E17 G12 G15 H17
Fuel rod
Mea
sure
d di
spla
cem
ent
r.m.s. displacement
maximum displacement
FIG. 8. Fuel rods level of vibration.
-2,000 -1,500 -1,000 -0,500 0,000 0,500 1,000 1,500
Normalized cell size
Mea
sure
d di
spla
cem
ent
maximum displacement measured
r.m.s. displacement measured
sliding treshold
sliding zone
no sliding zone
FIG. 9. Fuel rods maximum and r.m.s. displacement measured
in HERMES T as a function of normalized cell size. Along with the fuel rod vibrations, the fluid velocity fields on the first FA span have been measured using LDV. The results are presented in figure 10 and represent the mean axial fluid velocity in the area where the FA are along side each other (‘0’ position) and inside FA bundles, averaged on the first FA span. To simulate various in-core conditions, different flow rate configurations were studied (unbalanced flow rates: 10, 20,
Laser vibrometerLaser vibrometer
227
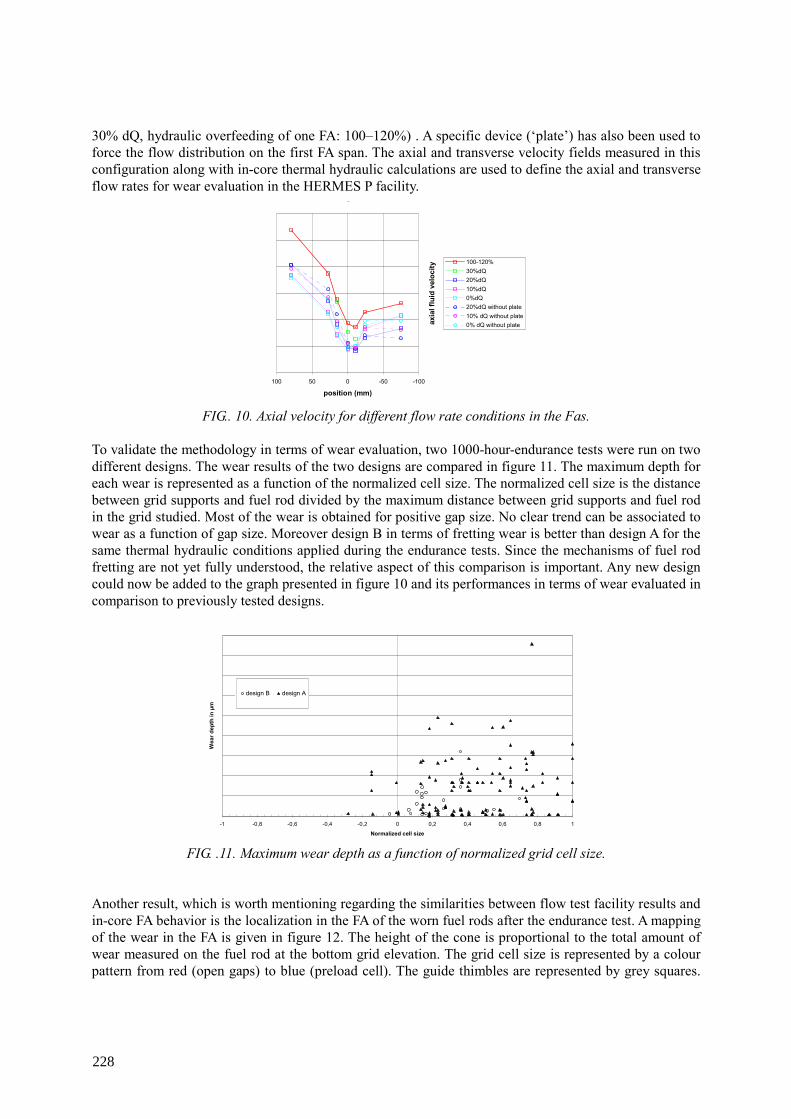
30% dQ, hydraulic overfeeding of one FA: 100–120%) . A specific device (‘plate’) has also been used to force the flow distribution on the first FA span. The axial and transverse velocity fields measured in this configuration along with in-core thermal hydraulic calculations are used to define the axial and transverse flow rates for wear evaluation in the HERMES P facility.
-100-50050100
position (mm)
axia
l flu
id v
eloc
ity
100-120%30%dQ20%dQ10%dQ0%dQ20%dQ without plate10% dQ without plate0% dQ without plate
FIG.. 10. Axial velocity for different flow rate conditions in the Fas.
To validate the methodology in terms of wear evaluation, two 1000-hour-endurance tests were run on two different designs. The wear results of the two designs are compared in figure 11. The maximum depth for each wear is represented as a function of the normalized cell size. The normalized cell size is the distance between grid supports and fuel rod divided by the maximum distance between grid supports and fuel rod in the grid studied. Most of the wear is obtained for positive gap size. No clear trend can be associated to wear as a function of gap size. Moreover design B in terms of fretting wear is better than design A for the same thermal hydraulic conditions applied during the endurance tests. Since the mechanisms of fuel rod fretting are not yet fully understood, the relative aspect of this comparison is important. Any new design could now be added to the graph presented in figure 10 and its performances in terms of wear evaluated in comparison to previously tested designs.
-1 -0,8 -0,6 -0,4 -0,2 0 0,2 0,4 0,6 0,8 1
Normalized cell size
Wea
r dep
th in
µm
design B design A
FIG. .11. Maximum wear depth as a function of normalized grid cell size.
Another result, which is worth mentioning regarding the similarities between flow test facility results and in-core FA behavior is the localization in the FA of the worn fuel rods after the endurance test. A mapping of the wear in the FA is given in figure 12. The height of the cone is proportional to the total amount of wear measured on the fuel rod at the bottom grid elevation. The grid cell size is represented by a colour pattern from red (open gaps) to blue (preload cell). The guide thimbles are represented by grey squares.
228

Although rod-to-grid gap size has a first order influence on wear, it is shown in this graph that wear is obtained at specific locations on the FA. More degraded fuel rods are observed in the FA half where the larger grid cells are localized (orange to red cells). But also, downstream from the lower core plate holes (represented by blue dots on the graph) where the hydraulic excitation is maximum.
FIG. 12. Worn fuel rod localization in the FA tested in HERMES P.
4. CONCLUSIONS
The CEA has developed a methodology of PWR fuel assembly vibration and fretting evaluation in HERMES facilities, which has been presented in this paper. The improvement of this methodology is an ongoing process. The final objective being:
– For the test facility to simulate as closely as possible the in-core conditions, – For the FA mock-ups to simulate best the conditions that exist throughout the in-core life of the fuel.
The improvement of this methodology is made possible thanks to an extensive R&D program dedicated to the study of the fuel assembly structural behavior. Semi-analytical to analytical test facilities are appropriate devices to study fuel rod wear since the phenomenon is difficult to grasp and model. Some attempts are being made also to model the fuel rod wear. Although the modelling of the hydraulic loadings and fuel rod vibration response is quite satisfactory, a lot has to be done to model the grid-to-rod wear mechanism.
ACKNOWLEDGMENTS
The author would like to thank FRAMATOME-ANP and EDF-SEPTEN for their technical and financial support.
NOMENCLATURE FA : Fuel Assembly PWR : Pressurized Water Reactor BOL : Beginning Of Life EOL : End Of Life LDV : Laser Doppler Anemometry
229
REFERENCES
[1] S.J. KING et al., D.V. PARAMONOV, Flow induced vibration and fretting wear in PWR fuel, Proc. of the 10th international Conference on Nuclear Engineering, ICONE 10-22399, Arlington, USA (2002). [2] A. BILLEREY, “Evolution of the fuel rod support under irradiation and its impact on the mechanical behavior of the fuel assemblies”, Proc. of the 11th international Conference on Nuclear Engineering, ICONE 11-36073, Tokyo, Japan (2003). [3] Y. H. KIM, S.Y. JEON, J.W. KIM, “Fretting wear of fuel rods due to flow induced vibrations”, Proc. of the 14th international Conference on Structural Mechanics in Reactor Technology, SMIRT CO4-4, page 149–156, Lyon, France (1997). [4] J. VALLORY, A. TEKATLIAN, C. PHALIPPOU, E. VIALLET, “Wear of zirconium alloys within grid-to-rod interaction: review and analyses, current experiments and future prospects”, Proc. of the LWR Fuel Performance Conference, Park City, USA (2000). [5] K. H. HASLINGER and al., “Qualification testing of PWR fuel assemblies at ABB” Proc. of the 14th international Conference on Structural Mechanics in Reactor Technology, SMIRT CO4-5, page 157–164, Lyon, France (1997). [6] J. STABEL, K. KOEBBE, L.G. STEPHENS, “Experimental and analytical procedures for approving fretting free fuel rod support”, Proc. of the LWR Fuel Performance Conference, Park City, USA (2000). [7] P. L. KO, “Wear of Zirconium alloys due to fretting and periodic impacting”, Wear, 55, 369–384 (1979). [8] S.J. KING et al., F.M. GUEROUT, N.J. FISHER, “Fretting wear behavior from autoclave tests and hydraulic loop endurance tests of zirconium alloy fuel rod and grid-support designs”, Proc. of the 5th international Symposium “Contribution of Materials Investigation in the Resolution of Problems Encountered in PWR”, Fontevraud, France (2002). [9] N.J. FISHER et al., “Fretting wear of zirconium alloy”, Proc. of the 14th international Conference on Structural Mechanics in Reactor Technology, SMIRT LO6-2, page 183–191, Lyon, France (1997).
230
NON-LINEAR VIBRATIONS OF FUEL RODS UNDER TURBULENT EXCITATION B. D'USTON AREVA Framatome ANP, Lyon, France
Abstract
Irradiation-induced relaxation causes the fuel rod restraining forces to decrease to a very low level. Such restraining forces, in conjunction with some particular hydraulic conditions, result in drastic changes of vibratory regime of the rod bundle. Due to the slippage and lift-off occurring at the rod to grid interface, the clamping factor as well as the damping coefficient should no longer be derived from a linear theory. An explicit model is processed in a direct integration scheme, which is well suited to handle major changes of boundary conditions during simulation. The turbulent excitation is built consistently with the semi empiric spectra, as a time history of distributed forces. The excitation consists of a finite set of independent random forces, obtained by projection of the pressure fluctuation onto realistic shapes; BOL mode shapes for example. This paper presents the structural model of a single rod that is used to simulate the vibration under turbulent excitation. A comparative study is performed to display the role of the restraining force; an attempt to address the fretting wear issue is then proposed.
1. INTRODUCTION Fuel assemblies of pressurized water reactors (PWR) are exposed to hydraulic conditions with generates turbulent excitations of significant intensity. Such excitations cause rod vibrations, which can be easily controlled on fresh structures by adequate clamping conditions at each grid level. These clamping conditions are obtained by a set of preloaded springs pressing the rod against dimple pairs.
Even when made of material like Inconel, the grid springs are subjected to irradiation induced relaxation. Furthermore, the restraining force decrease is accelerated by the rods creep down and the grids strip growth. In such conditions, the spring force may reach very low levels at the end of life of the fuel assemblies, which are brought to very high discharge burnups.
The range of nominal clamping conditions is reduced in the same proportion as the spring forces. Beyond that range, the rod to grid connections exhibit a non linear behaviour that can be attributed to two distinct phenomena; the slippage and the lift off which occur at the cladding to spring and dimples interfaces.
This paper presents a structural model that intends to simulate the non linear vibrations of a single fuel rod subjected to representative turbulent excitations, while giving a close insight to the rod to grid connection thanks to a detailed and explicit model of the contacts involved in this connection.
A study has been conducted to evaluate and compare the vibratory behaviour of a single fuel rod supported by bimetallic grids at beginning and at end of life. The results of this study will help to better define and interpret analytical experiments that are still under completion.
This approach also helped to validate design changes that were adopted in order to enhance the robustness of the fuel against fretting failures.
2. MODEL PRESENTATION
2.1. Structural model of the rod
Consistently with the Euler-Bernouilli-Navier approximation (1), the structural model is mainly composed of slender beam elements featuring 2 degrees of freedom (dof's) per node.
231
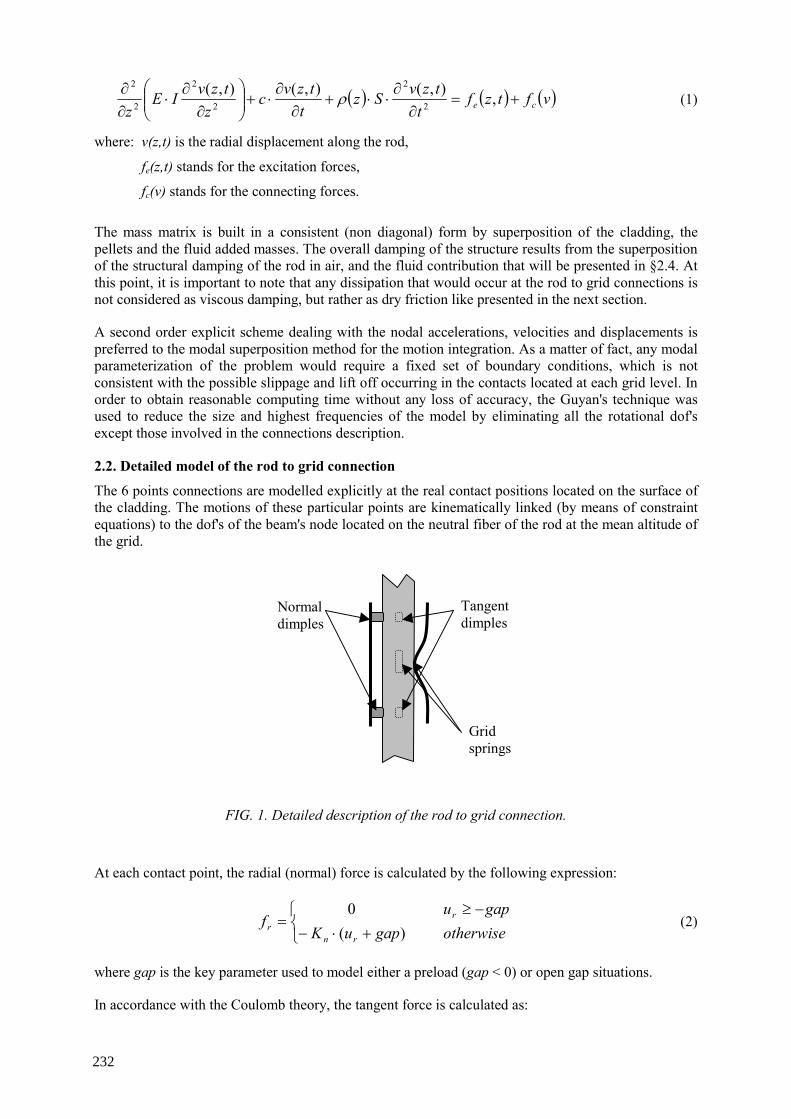
( ) ( ) ( )vftzft
tzvSzt
tzvcz
tzvIEz ce +=
∂∂⋅⋅+
∂∂⋅+
∂
∂⋅
∂∂ ,),(),(),(
2
2
2
2
2
2
ρ (1)
where: v(z,t) is the radial displacement along the rod,
fe(z,t) stands for the excitation forces,
fc(v) stands for the connecting forces.
The mass matrix is built in a consistent (non diagonal) form by superposition of the cladding, the pellets and the fluid added masses. The overall damping of the structure results from the superposition of the structural damping of the rod in air, and the fluid contribution that will be presented in §2.4. At this point, it is important to note that any dissipation that would occur at the rod to grid connections is not considered as viscous damping, but rather as dry friction like presented in the next section.
A second order explicit scheme dealing with the nodal accelerations, velocities and displacements is preferred to the modal superposition method for the motion integration. As a matter of fact, any modal parameterization of the problem would require a fixed set of boundary conditions, which is not consistent with the possible slippage and lift off occurring in the contacts located at each grid level. In order to obtain reasonable computing time without any loss of accuracy, the Guyan's technique was used to reduce the size and highest frequencies of the model by eliminating all the rotational dof's except those involved in the connections description.
2.2. Detailed model of the rod to grid connection
The 6 points connections are modelled explicitly at the real contact positions located on the surface of the cladding. The motions of these particular points are kinematically linked (by means of constraint equations) to the dof's of the beam's node located on the neutral fiber of the rod at the mean altitude of the grid.
FIG. 1. Detailed description of the rod to grid connection.
At each contact point, the radial (normal) force is calculated by the following expression:
+⋅−−≥
=otherwisegapuK
gapuf
rn
rr )(
0 (2)
where gap is the key parameter used to model either a preload (gap < 0) or open gap situations.
In accordance with the Coulomb theory, the tangent force is calculated as:
Normal dimples
Tangent dimples
Grid springs
232
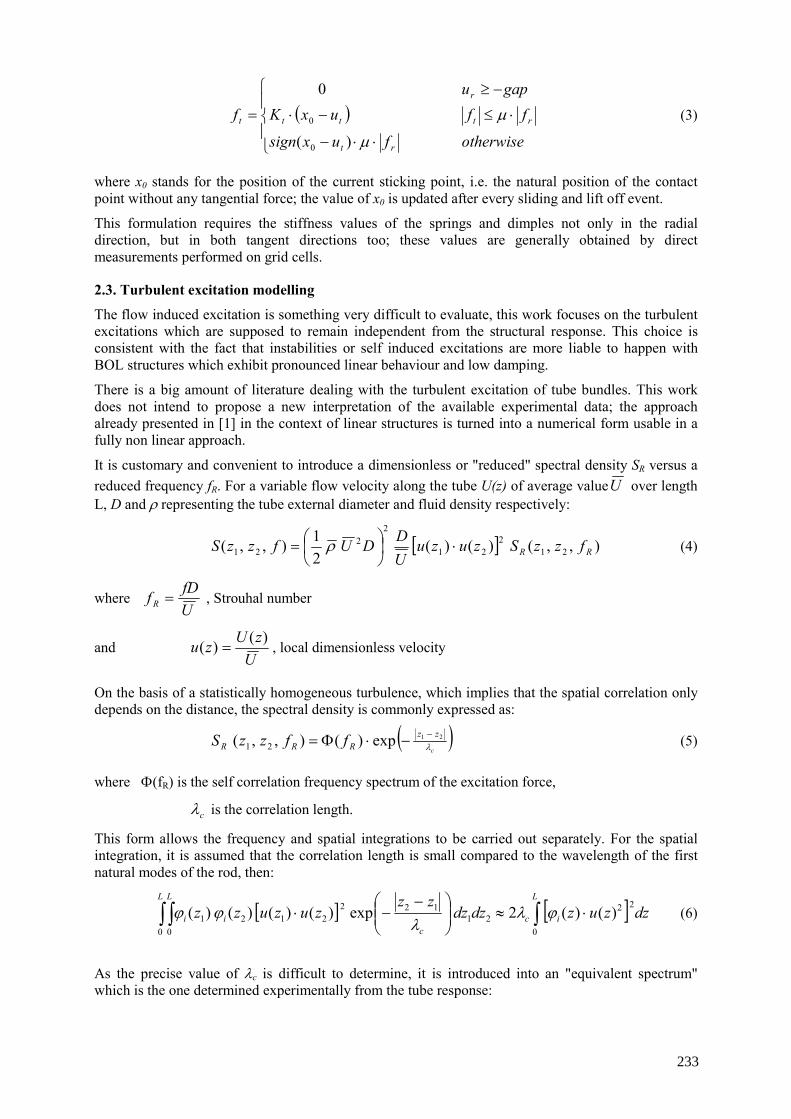
( )
⋅⋅−
⋅≤−⋅
−≥
=
otherwisefuxsign
ffuxKgapu
f
rt
rttt
r
t
µ
µ
)(
0
0
0 (3)
where x0 stands for the position of the current sticking point, i.e. the natural position of the contact point without any tangential force; the value of x0 is updated after every sliding and lift off event.
This formulation requires the stiffness values of the springs and dimples not only in the radial direction, but in both tangent directions too; these values are generally obtained by direct measurements performed on grid cells.
2.3. Turbulent excitation modelling
The flow induced excitation is something very difficult to evaluate, this work focuses on the turbulent excitations which are supposed to remain independent from the structural response. This choice is consistent with the fact that instabilities or self induced excitations are more liable to happen with BOL structures which exhibit pronounced linear behaviour and low damping.
There is a big amount of literature dealing with the turbulent excitation of tube bundles. This work does not intend to propose a new interpretation of the available experimental data; the approach already presented in [1] in the context of linear structures is turned into a numerical form usable in a fully non linear approach.
It is customary and convenient to introduce a dimensionless or "reduced" spectral density SR versus a reduced frequency fR. For a variable flow velocity along the tube U(z) of average valueU over length L, D and ρ representing the tube external diameter and fluid density respectively:
[ ] ),,()()(21),,( 21
221
22
21 RR fzzSzuzuUDDUfzzS ⋅
= ρ (4)
where UfDf R = , Strouhal number
and U
zUzu )()( = , local dimensionless velocity
On the basis of a statistically homogeneous turbulence, which implies that the spatial correlation only depends on the distance, the spectral density is commonly expressed as:
( )c
zzRRR ffzzS λ
21exp)(),,( 21−−⋅Φ= (5)
where Φ(fR) is the self correlation frequency spectrum of the excitation force,
cλ is the correlation length.
This form allows the frequency and spatial integrations to be carried out separately. For the spatial integration, it is assumed that the correlation length is small compared to the wavelength of the first natural modes of the rod, then:
[ ] [ ] dzzuzdzdzzz
zuzuzzL
ic
L L
cii ∫∫ ∫ ⋅≈
−−⋅
0
22
02
01
1222121 )()(2exp)()()()( ϕλ
λϕϕ (6)
As the precise value of λc is difficult to determine, it is introduced into an "equivalent spectrum" which is the one determined experimentally from the tube response:
233
)()( Rc
Re fL
f Φ=Φλ
(7)
The excitation can be introduced as a set of independent random modal forces Fi such as:
dfSF ii ∫∞
=0
2 (8)
where ( )Reii faLUDDUS Φ
= 22
22
21 ρ (8')
and [ ] dzzuzL
aL
ii
2
0
22 )()(2∫ ⋅= ϕ (8")
Equivalent spectra are available in cases of pure axial and pure transverse flows; it is assumed here that the excitation due to any combination of axial and transverse flows can be obtained by the addition of the spectral densities calculated in each situation. Finally, the generalized force time histories are generated as uncorrelated random processes consistently with (8') in a frequency range that makes sense with the dynamic characteristics of the structure, and over a duration that guarantees a steady state structural behaviour. 2.4. Model damping
For practical reasons, the overall damping is taken into account in a modal form. The modal shapes are those determined at beginning of life (i.e. at null amplitude). The structural damping is determined experimentally in the corresponding (BOL or EOL) conditions. Typically, values ranging from 0.3% to 1% of critical damping are considered for structural damping of the first natural modes.
Additional damping due to the fluid is considered, the following semi-empiric expression was established in ref [2]:
( )
⋅+−⋅
⋅⋅= −
22,06
0
2 327.0108.1exp73.102 eRi
eeRi
hi Rf
RRfm
Dπρξ (9)
where D
UR axial
eν⋅
= Reynold's number of axial flow
3. APPLICATIONS
3.1. AFA 3GL fuel rods vibrations under turbulent excitation
The following application has been conducted in order to better understand some results of tests that are still under completion. No experimental data will be shown, but the numerical results will help to explain the difficulties encountered in the interpretation of the test results already acquired.
The aim of the study is to simulate the vibratory behaviour of the fuel rods at different stages of irradiation, while subjected to a representative turbulent excitation; the design under investigation is the 14 feet AFA 3GL fuel assembly. A particular attention is given to vibration rating of the first span.
234
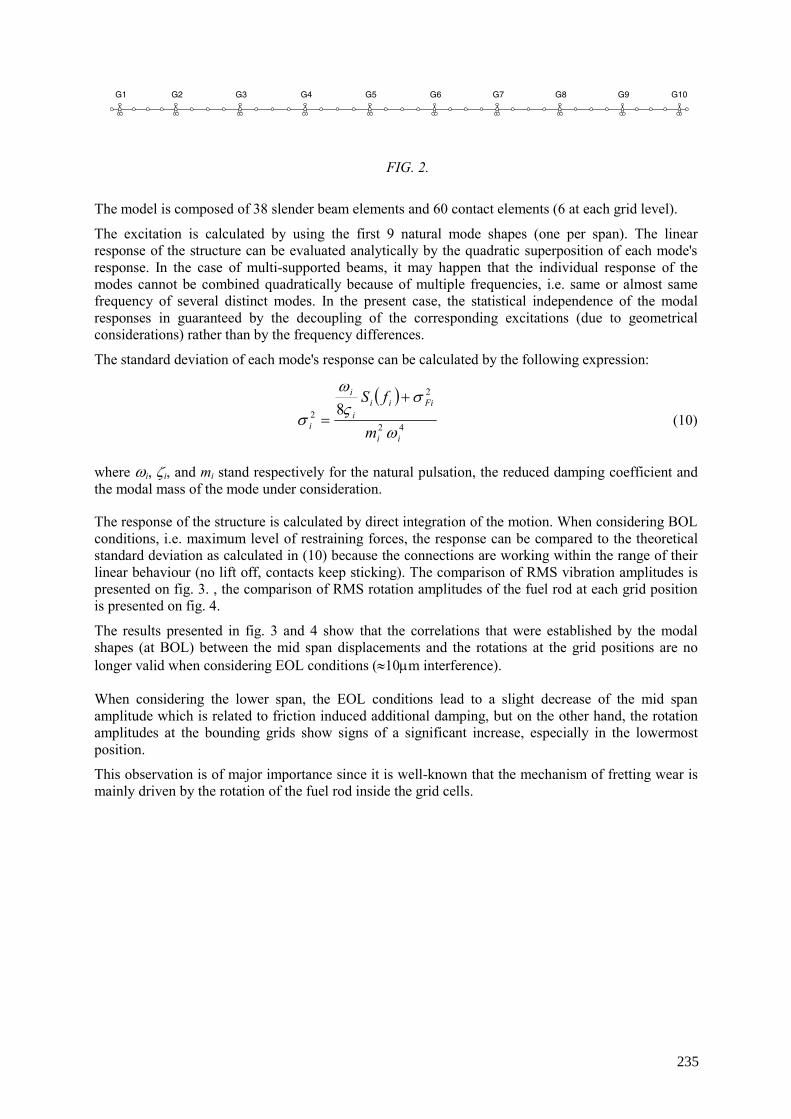
G1 G2 G3 G4 G5 G6 G7 G8 G9 G10
FIG. 2.
The model is composed of 38 slender beam elements and 60 contact elements (6 at each grid level).
The excitation is calculated by using the first 9 natural mode shapes (one per span). The linear response of the structure can be evaluated analytically by the quadratic superposition of each mode's response. In the case of multi-supported beams, it may happen that the individual response of the modes cannot be combined quadratically because of multiple frequencies, i.e. same or almost same frequency of several distinct modes. In the present case, the statistical independence of the modal responses in guaranteed by the decoupling of the corresponding excitations (due to geometrical considerations) rather than by the frequency differences.
The standard deviation of each mode's response can be calculated by the following expression:
( )42
2
2 8
ii
Fiiii
i
i m
fS
ω
σςω
σ+
= (10)
where ωi, ζi, and mi stand respectively for the natural pulsation, the reduced damping coefficient and the modal mass of the mode under consideration.
The response of the structure is calculated by direct integration of the motion. When considering BOL conditions, i.e. maximum level of restraining forces, the response can be compared to the theoretical standard deviation as calculated in (10) because the connections are working within the range of their linear behaviour (no lift off, contacts keep sticking). The comparison of RMS vibration amplitudes is presented on fig. 3. , the comparison of RMS rotation amplitudes of the fuel rod at each grid position is presented on fig. 4.
The results presented in fig. 3 and 4 show that the correlations that were established by the modal shapes (at BOL) between the mid span displacements and the rotations at the grid positions are no longer valid when considering EOL conditions (≈10µm interference).
When considering the lower span, the EOL conditions lead to a slight decrease of the mid span amplitude which is related to friction induced additional damping, but on the other hand, the rotation amplitudes at the bounding grids show signs of a significant increase, especially in the lowermost position.
This observation is of major importance since it is well-known that the mechanism of fretting wear is mainly driven by the rotation of the fuel rod inside the grid cells.
235
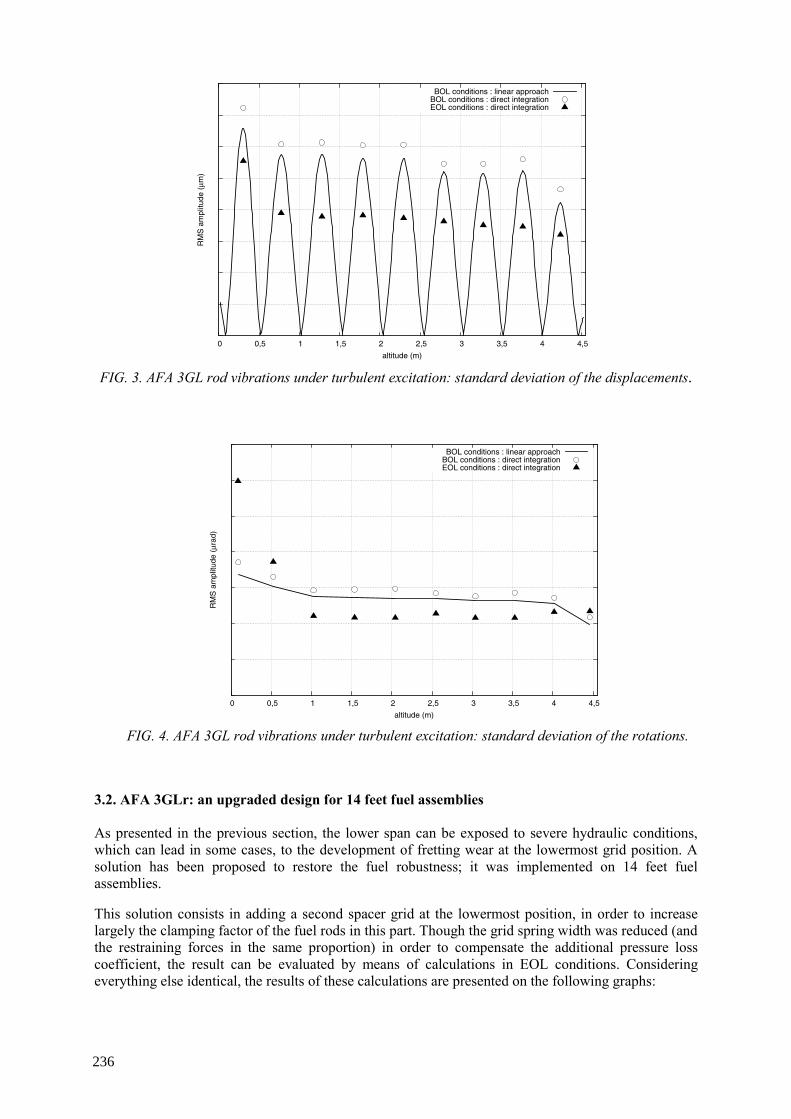
0 0,5 1 1,5 2 2,5 3 3,5 4 4,5
RM
S a
mpl
itude
(µm
)
altitude (m)
BOL conditions : linear approachBOL conditions : direct integrationEOL conditions : direct integration
FIG. 3. AFA 3GL rod vibrations under turbulent excitation: standard deviation of the displacements.
0 0,5 1 1,5 2 2,5 3 3,5 4 4,5
RM
S a
mpl
itude
(µr
ad)
altitude (m)
BOL conditions : linear approachBOL conditions : direct integrationEOL conditions : direct integration
FIG. 4. AFA 3GL rod vibrations under turbulent excitation: standard deviation of the rotations.
3.2. AFA 3GLr: an upgraded design for 14 feet fuel assemblies As presented in the previous section, the lower span can be exposed to severe hydraulic conditions, which can lead in some cases, to the development of fretting wear at the lowermost grid position. A solution has been proposed to restore the fuel robustness; it was implemented on 14 feet fuel assemblies.
This solution consists in adding a second spacer grid at the lowermost position, in order to increase largely the clamping factor of the fuel rods in this part. Though the grid spring width was reduced (and the restraining forces in the same proportion) in order to compensate the additional pressure loss coefficient, the result can be evaluated by means of calculations in EOL conditions. Considering everything else identical, the results of these calculations are presented on the following graphs:
236
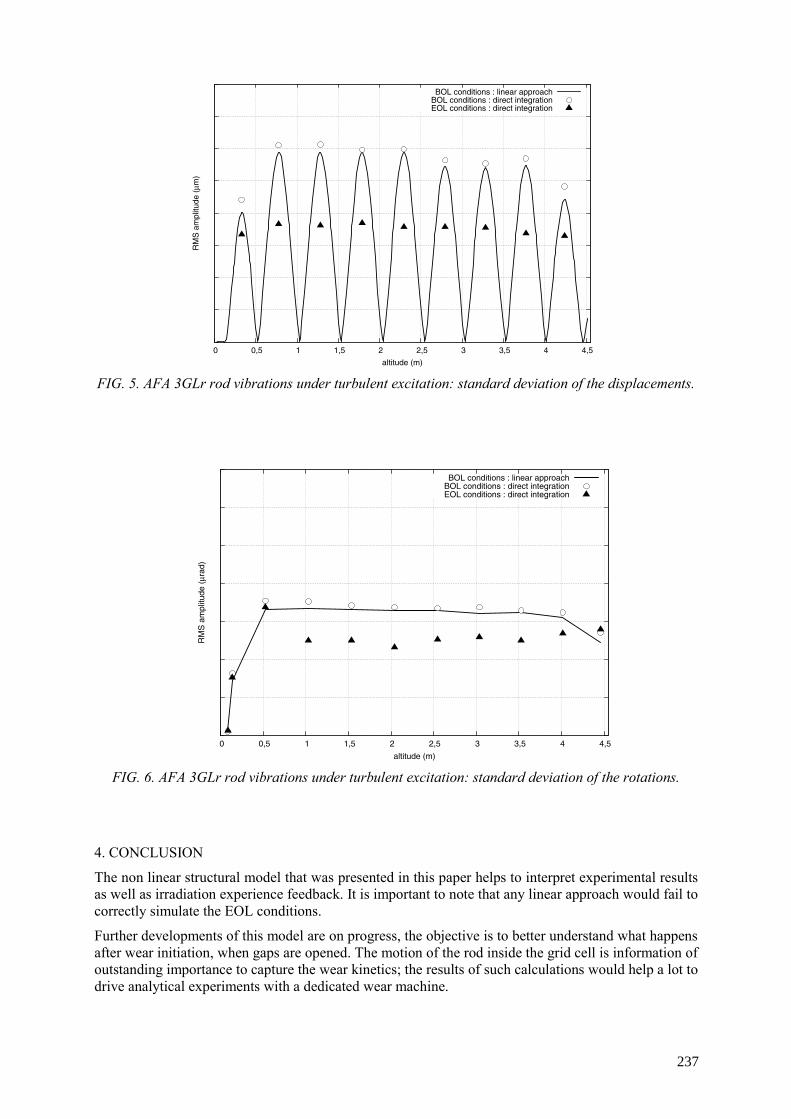
0 0,5 1 1,5 2 2,5 3 3,5 4 4,5
RM
S a
mpl
itude
(µm
)
altitude (m)
BOL conditions : linear approachBOL conditions : direct integrationEOL conditions : direct integration
FIG. 5. AFA 3GLr rod vibrations under turbulent excitation: standard deviation of the displacements.
0 0,5 1 1,5 2 2,5 3 3,5 4 4,5
RM
S a
mpl
itude
(µr
ad)
altitude (m)
BOL conditions : linear approachBOL conditions : direct integrationEOL conditions : direct integration
FIG. 6. AFA 3GLr rod vibrations under turbulent excitation: standard deviation of the rotations.
4. CONCLUSION
The non linear structural model that was presented in this paper helps to interpret experimental results as well as irradiation experience feedback. It is important to note that any linear approach would fail to correctly simulate the EOL conditions.
Further developments of this model are on progress, the objective is to better understand what happens after wear initiation, when gaps are opened. The motion of the rod inside the grid cell is information of outstanding importance to capture the wear kinetics; the results of such calculations would help a lot to drive analytical experiments with a dedicated wear machine.
237

REFERENCES
[1] RIGAUDEAU J., MOREL E., “Flow induced vibration analysis of PWR fuel rods validated from a variety of in-loop tests”, in Pressure Vessel Technology in the New Millenium (Proc. Int. Conf PVP-2001, Atlanta, Georgia, USA, 22–26 July 2001), ASME, CD-ROM.
[2] CONNORS H.J., SAVORELLI S.J., KRAMER N.F.A., “Hydrodynamic damping of rod bundles in axial flows”, Flow-induced Vibration of circular cylindrical structures, ASME (Orlando – US) 1982.
238
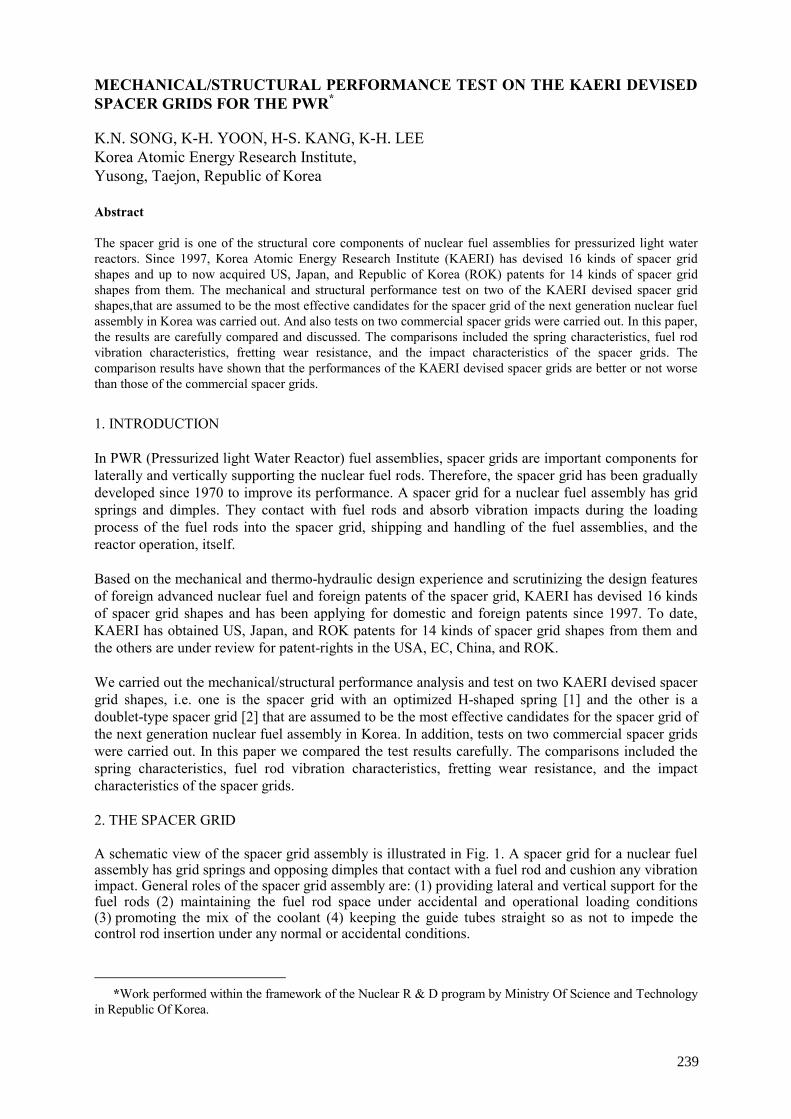
MECHANICAL/STRUCTURAL PERFORMANCE TEST ON THE KAERI DEVISED SPACER GRIDS FOR THE PWR*
K.N. SONG, K-H. YOON, H-S. KANG, K-H. LEE Korea Atomic Energy Research Institute, Yusong, Taejon, Republic of Korea Abstract The spacer grid is one of the structural core components of nuclear fuel assemblies for pressurized light water reactors. Since 1997, Korea Atomic Energy Research Institute (KAERI) has devised 16 kinds of spacer grid shapes and up to now acquired US, Japan, and Republic of Korea (ROK) patents for 14 kinds of spacer grid shapes from them. The mechanical and structural performance test on two of the KAERI devised spacer grid shapes,that are assumed to be the most effective candidates for the spacer grid of the next generation nuclear fuel assembly in Korea was carried out. And also tests on two commercial spacer grids were carried out. In this paper, the results are carefully compared and discussed. The comparisons included the spring characteristics, fuel rod vibration characteristics, fretting wear resistance, and the impact characteristics of the spacer grids. The comparison results have shown that the performances of the KAERI devised spacer grids are better or not worse than those of the commercial spacer grids.
1. INTRODUCTION In PWR (Pressurized light Water Reactor) fuel assemblies, spacer grids are important components for laterally and vertically supporting the nuclear fuel rods. Therefore, the spacer grid has been gradually developed since 1970 to improve its performance. A spacer grid for a nuclear fuel assembly has grid springs and dimples. They contact with fuel rods and absorb vibration impacts during the loading process of the fuel rods into the spacer grid, shipping and handling of the fuel assemblies, and the reactor operation, itself. Based on the mechanical and thermo-hydraulic design experience and scrutinizing the design features of foreign advanced nuclear fuel and foreign patents of the spacer grid, KAERI has devised 16 kinds of spacer grid shapes and has been applying for domestic and foreign patents since 1997. To date, KAERI has obtained US, Japan, and ROK patents for 14 kinds of spacer grid shapes from them and the others are under review for patent-rights in the USA, EC, China, and ROK. We carried out the mechanical/structural performance analysis and test on two KAERI devised spacer grid shapes, i.e. one is the spacer grid with an optimized H-shaped spring [1] and the other is a doublet-type spacer grid [2] that are assumed to be the most effective candidates for the spacer grid of the next generation nuclear fuel assembly in Korea. In addition, tests on two commercial spacer grids were carried out. In this paper we compared the test results carefully. The comparisons included the spring characteristics, fuel rod vibration characteristics, fretting wear resistance, and the impact characteristics of the spacer grids. 2. THE SPACER GRID A schematic view of the spacer grid assembly is illustrated in Fig. 1. A spacer grid for a nuclear fuel assembly has grid springs and opposing dimples that contact with a fuel rod and cushion any vibration impact. General roles of the spacer grid assembly are: (1) providing lateral and vertical support for the fuel rods (2) maintaining the fuel rod space under accidental and operational loading conditions (3) promoting the mix of the coolant (4) keeping the guide tubes straight so as not to impede the control rod insertion under any normal or accidental conditions.
*Work performed within the framework of the Nuclear R & D program by Ministry Of Science and Technology in Republic Of Korea.
239
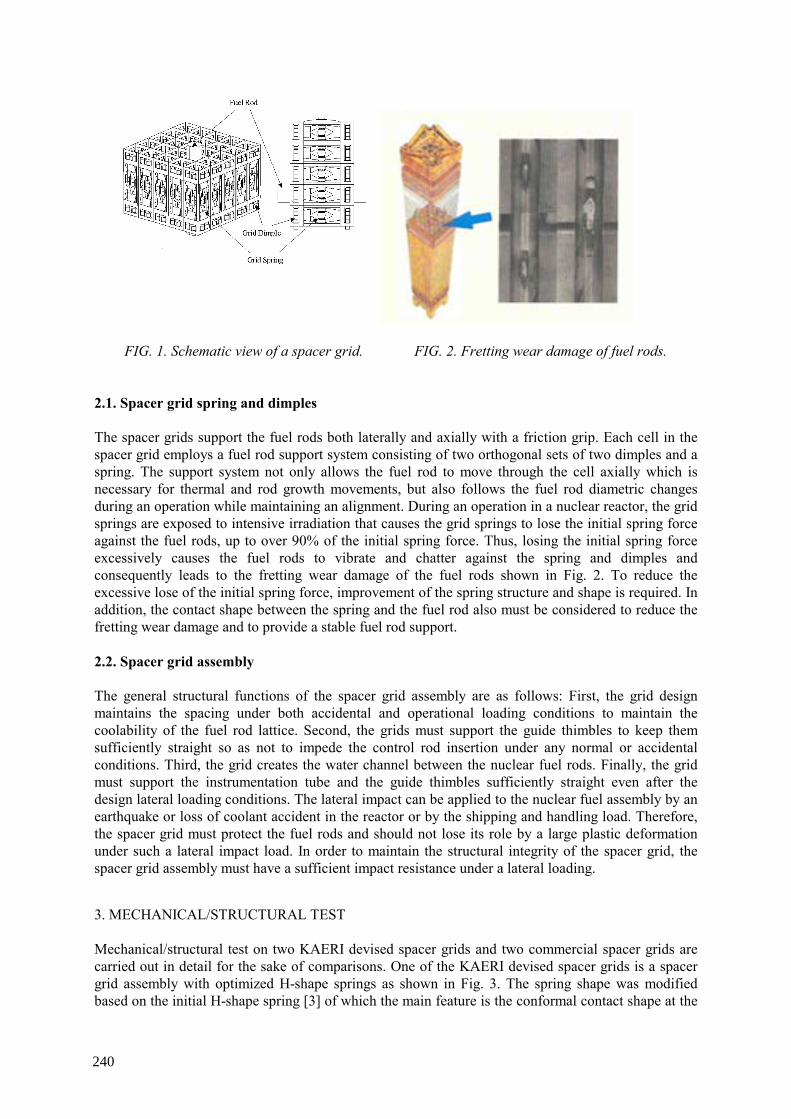
FIG. 1. Schematic view of a spacer grid. FIG. 2. Fretting wear damage of fuel rods.
2.1. Spacer grid spring and dimples The spacer grids support the fuel rods both laterally and axially with a friction grip. Each cell in the spacer grid employs a fuel rod support system consisting of two orthogonal sets of two dimples and a spring. The support system not only allows the fuel rod to move through the cell axially which is necessary for thermal and rod growth movements, but also follows the fuel rod diametric changes during an operation while maintaining an alignment. During an operation in a nuclear reactor, the grid springs are exposed to intensive irradiation that causes the grid springs to lose the initial spring force against the fuel rods, up to over 90% of the initial spring force. Thus, losing the initial spring force excessively causes the fuel rods to vibrate and chatter against the spring and dimples and consequently leads to the fretting wear damage of the fuel rods shown in Fig. 2. To reduce the excessive lose of the initial spring force, improvement of the spring structure and shape is required. In addition, the contact shape between the spring and the fuel rod also must be considered to reduce the fretting wear damage and to provide a stable fuel rod support. 2.2. Spacer grid assembly The general structural functions of the spacer grid assembly are as follows: First, the grid design maintains the spacing under both accidental and operational loading conditions to maintain the coolability of the fuel rod lattice. Second, the grids must support the guide thimbles to keep them sufficiently straight so as not to impede the control rod insertion under any normal or accidental conditions. Third, the grid creates the water channel between the nuclear fuel rods. Finally, the grid must support the instrumentation tube and the guide thimbles sufficiently straight even after the design lateral loading conditions. The lateral impact can be applied to the nuclear fuel assembly by an earthquake or loss of coolant accident in the reactor or by the shipping and handling load. Therefore, the spacer grid must protect the fuel rods and should not lose its role by a large plastic deformation under such a lateral impact load. In order to maintain the structural integrity of the spacer grid, the spacer grid assembly must have a sufficient impact resistance under a lateral loading.
3. MECHANICAL/STRUCTURAL TEST Mechanical/structural test on two KAERI devised spacer grids and two commercial spacer grids are carried out in detail for the sake of comparisons. One of the KAERI devised spacer grids is a spacer grid assembly with optimized H-shape springs as shown in Fig. 3. The spring shape was modified based on the initial H-shape spring [3] of which the main feature is the conformal contact shape at the
240

contact part between the spring and the fuel rod. To improve the performance of the initial H-shape spring, we adopted the systematic optimization design technique and obtained an optimized spring shape including the contact contour [4]. We have acquired US and ROK patents for both the initial H-shape spring and the optimized H-shape spring. The other is the doublet-type spacer grid. This spacer is also modified based on the initial doublet spacer [5].
FIG. 3. KAERI devised spacer grid spring shape (Left: Opt. H; Right: Doublet-type).
FIG. 4. Fixture for the spring characteristic test. FIG. 5. Spring characteristic for the springs. of which the main feature is the support of the fuel rod with a line contact. The double-type spacer is being applied for US, EC, China, and ROK patents. For the sake of comparisons, we selected two commercial spacer grids as references. One is widely used in the current commercial fuel assembly, which is designated in this paper as Ref. A. The other is a cutting-edge spacer grid designated in this paper as Ref. B, which was developed recently and is now being loaded into a reactor for a Lead Test Assembly [6]. 3.1. Elastic-plastic characteristics Force-deflection test on four kinds of spacer grid springs are carried out up to the plastic range. The tests are carried out on a spring specimen prepared by wire-cutting and using the fixture shown in Fig. 4 to fix both edges of the spring specimen [7]. Figure 5 shows the test results. From the point of view of the fuel rod support, we recommend the stiffness of a spring to be 100–250 N. From Fig. 5, the stiffness of the KAERI devised spacer grid springs are within the recommended stiffness range while that of Ref. A is not within the recommended stiffness range. In addition, we found the elastic range to be wide and the plastic setting to be less for the KAERI devised springs when compared to those of the commercial springs. The reason that the reaction force of the Doublet-type spring increases suddenly around the deflection of 0.5 mm is attributed to the unusual shape and structure of the spring.
0.0 0.2 0.4 0.6 0.8 1.0 1.20
100
200
300
400Grid Spring(Zry-4)
P (N
)
δ (mm)
Doublet : 114 (N/mm) Opt.H : 233 (N/mm) Ref.A : 708 (N/mm) Ref.B : 210 (N/mm)
241
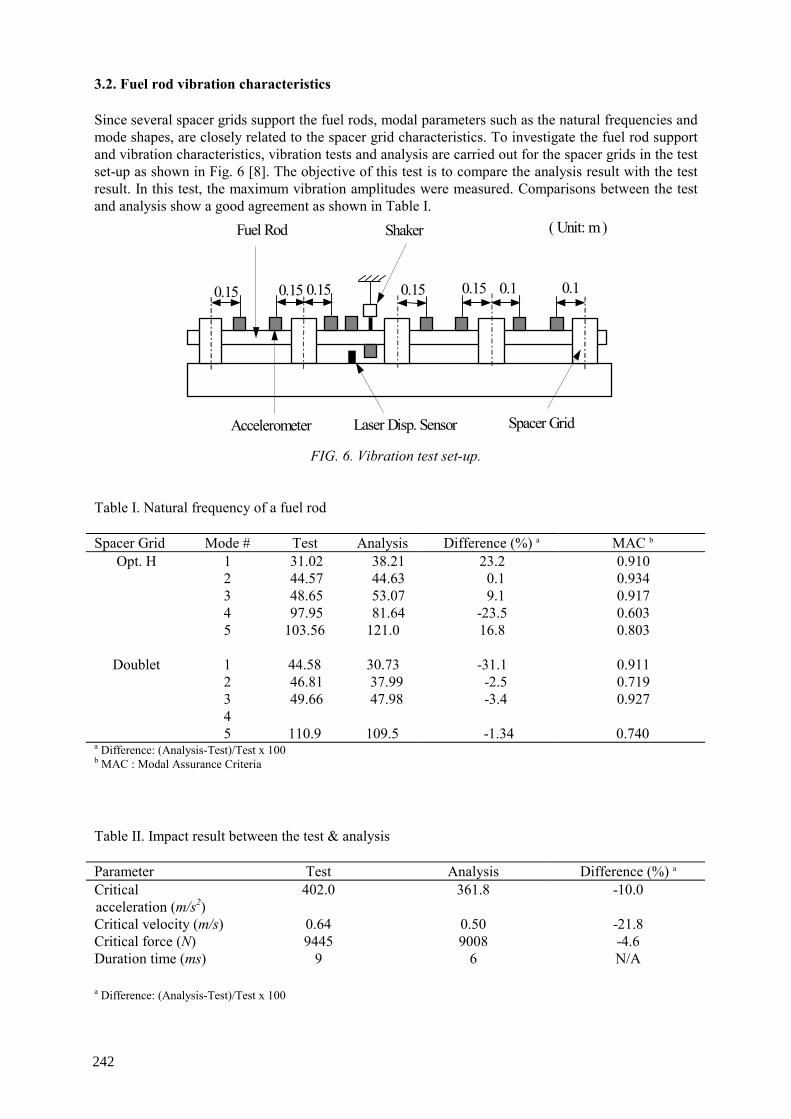
3.2. Fuel rod vibration characteristics Since several spacer grids support the fuel rods, modal parameters such as the natural frequencies and mode shapes, are closely related to the spacer grid characteristics. To investigate the fuel rod support and vibration characteristics, vibration tests and analysis are carried out for the spacer grids in the test set-up as shown in Fig. 6 [8]. The objective of this test is to compare the analysis result with the test result. In this test, the maximum vibration amplitudes were measured. Comparisons between the test and analysis show a good agreement as shown in Table I.
0.15 0.15 0.15 0.15 0.15 0.1 0.1
Laser Disp. Sensor Accelerometer
Fuel Rod Shaker
Spacer Grid
( Unit: m )
FIG. 6. Vibration test set-up.
Table I. Natural frequency of a fuel rod Spacer Grid Mode # Test Analysis Difference (%) a MAC b
Opt. H 1 2 3 4 5
31.02 44.57 48.65 97.95 103.56
38.21 44.63 53.07 81.64 121.0
23.2 0.1 9.1 -23.5 16.8
0.910 0.934 0.917 0.603 0.803
Doublet
1 2 3 4 5
44.58 46.81 49.66
110.9
30.73
37.99 47.98
109.5
-31.1 -2.5 -3.4
-1.34
0.911 0.719 0.927
0.740
a Difference: (Analysis-Test)/Test x 100 b MAC : Modal Assurance Criteria Table II. Impact result between the test & analysis Parameter Test Analysis Difference (%) a Critical acceleration (m/s2) Critical velocity (m/s) Critical force (N) Duration time (ms)
402.0
0.64 9445
9
361.8
0.50 9008
6
-10.0
-21.8 -4.6 N/A
a Difference: (Analysis-Test)/Test x 100
242
3.3. Impact characteristics Impact tests and analysis on the spacer grid assemblies are carried out and the results are shown in Table II. Detailed test and analysis procedures are shown in Ref. [9]. Table 2 shows that the test and analysis results are in good agreement to within a 20% error range. 3.4. Fretting-wear characteristics It is generally known that wear occurs on the contact region between a tube and its support when the tube vibrates. If the vibration amplitude is small, the wear is termed as fretting. We performed two kinds of wear resistance tests, i.e. the influence of the contact shape and the supporting condition for the tube wear was investigated experimentally; the wear evolution during the increase of the wear period was also examined. The objective of these tests is for a comparison of the relative fretting performance of each spring type. Two different fretting wear testers were used for the present test. One is for sliding wear and the other is for sliding and impacting wear [10]. In the sliding wear tester, the contact normal force and slip displacement can be varied by using an eccentric cylinder and level system. In this test the spring and tube specimens are always in positive contact. In the sliding and impact wear tester, the gap between the spring and the tube can be imposed. All the tests were carried out in air and under water at room temperature. Under other test conditions, such as in water or at a high temperature, the wear characteristics will be different but the trends are assumed to be similar. In the sliding test, the tube oscillated axially with the normal force of 10 N and 30 N, which was exerted by the spring. Single contact was constituted between the tube and the spring. The range of the slip displacement was varied by 10, 30, 50, 80, and 100㎛ for each normal force. The frequency of oscillation was set at 30 Hz since the first natural frequency of a fuel rod is assumed to be located around it. Vibration amplitude becomes the greatest at the first natural frequency, so it is thought that the wear occurs dominantly at this frequency. The test ended when the number of oscillation cycles reached 105. To investigate the wear evolution during the increase of the wear period, we performed the test by increasing the number of oscillation cycles up to 3×10⁵, 5×10⁵, and 106. In the sliding and impact wear test, the test condition was designated to simulate the variation of the contact condition between the fuel rod and the grid spring mechanically, to compare only the wear in different conditions. As the fuel burnup increases in the reactor, the grid material loosens up due to degradation and creeps down the fuel rod. Contact force between the grid spring and the rod decreases. Further increasing the burnup can form a gap between them. The test condition for the sliding and impact wear test was classified by two conditions: normal force of 5 N and a gap of 0.1 mm. Each test ended when the oscillation cycle reached 106 in the sliding and impact test. A surface roughness tester was used to obtain the traces of the wear contour on the tubes, which were logged while a stylus passed over the worn surface. Three-dimensional shape of the wear was obtained by assembling the traces. Wear volume was finally evaluated from the geometry data of the accumulated traces using a specially developed program [11]. A test of each condition was repeated three times, and the wear volume averaged. Overall, wear volume increases as the slip displacement increases at a normal force as shown in Fig. 7 [12] and Fig. 8 [13]. It is apparently found that there is a certain value of the slip displacement range after which the wear volume increases considerably. The volume increases slowly up to 50 µm when the normal force is 10 N and up to 80 µm when it is 30 N. Beyond these displacement ranges, the volume increases considerably. This is commonly found regardless of the spring type. The slip displacement range when the wear volume increases considerably is termed the “critical slip range.” The term “range” is used since it is the value between the peak and valley in the slip displacement cycle. So, the critical slip range is within 50~80 µm at the normal force of 10 N and 80~100 µm at 30 N.
243
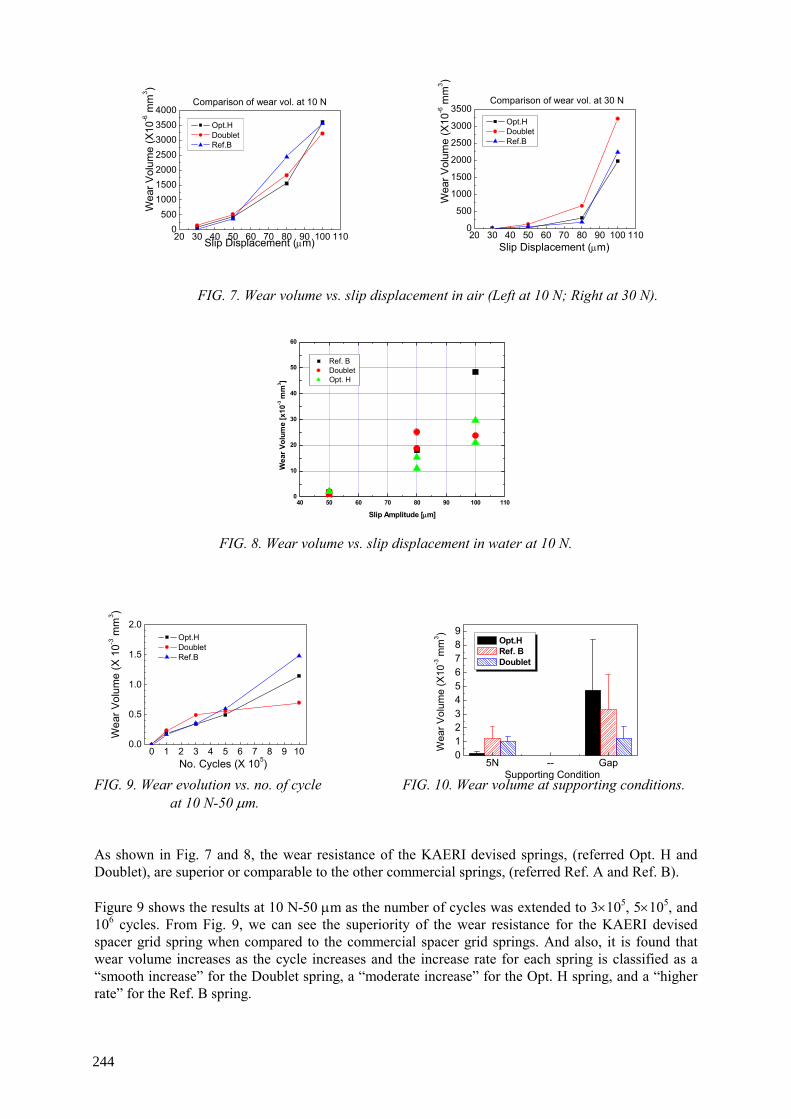
FIG. 7. Wear volume vs. slip displacement in air (Left at 10 N; Right at 30 N).
40 50 60 70 80 90 100 1100
10
20
30
40
50
60
Wea
r Vol
ume
[x10
-3 m
m3 ]
Slip Amplitude [µm]
Ref. B Doublet Opt. H
FIG. 8. Wear volume vs. slip displacement in water at 10 N.
FIG. 9. Wear evolution vs. no. of cycle FIG. 10. Wear volume at supporting conditions.
at 10 N-50 µm. As shown in Fig. 7 and 8, the wear resistance of the KAERI devised springs, (referred Opt. H and Doublet), are superior or comparable to the other commercial springs, (referred Ref. A and Ref. B). Figure 9 shows the results at 10 N-50 µm as the number of cycles was extended to 3×10⁵, 5×10⁵, and 106 cycles. From Fig. 9, we can see the superiority of the wear resistance for the KAERI devised spacer grid spring when compared to the commercial spacer grid springs. And also, it is found that wear volume increases as the cycle increases and the increase rate for each spring is classified as a “smooth increase” for the Doublet spring, a “moderate increase” for the Opt. H spring, and a “higher rate” for the Ref. B spring.
20 30 40 50 60 70 80 90 100 1100
5001000150020002500300035004000
Comparison of wear vol. at 10 N
Wea
r Vol
ume
(X10
-6 m
m3 )
Slip Displacement (µm)
Opt.H Doublet Ref.B
20 30 40 50 60 70 80 90 100 1100
500
1000
1500
2000
2500
3000
3500 Opt.H Doublet Ref.B
Comparison of wear vol. at 30 N
Slip Displacement (µm)
Wea
r Vol
ume
(X10
-6 m
m3 )
5N -- Gap0123456789
Supporting Condition
Wea
r Vol
ume
(X10
-3 m
m3 )
Opt.H Ref. B Doublet
0 1 2 3 4 5 6 7 8 9 100.0
0.5
1.0
1.5
2.0
Wea
r Vol
ume
(X 1
0-3 m
m3 )
No. Cycles (X 105)
Opt.H Doublet Ref.B
244
wear volume increases as the cycle increases and the increase rate for each spring is classified as a “smooth increase” for the Doublet spring, a “moderate increase” for the Opt. H spring, and a “higher rate” for the Ref. B spring. The influence of the gap on the wear was the primary concern of the test. Figure 10 shows the test results at the test conditions under a normal force of 5 N and a gap of 0.1 mm. In Fig. 10, relatively good wear resistance is found on the tube specimen when contacted with the Opt. H spring compared to the Doublet spring and Ref. B spring. However, a superior wear resistance was provided by the Doublet spring when the supporting condition varied from a normal force of 5 N to a gap condition. Conversely, the wear volume for the Opt. H and Ref. B spring was found to increase as the normal force decreased. 4. CONCLUSIONS Since 1997, KAERI has devised 16 kinds of spacer grid shapes and up to now acquired US, Japan, and ROK patents for 14 kinds of spacer grid shapes from them. The mechanical/structural performance tests for two KAERI devised spacer grid shapes that are assumed to be the most effective candidates for the spacer grid of the next generation nuclear fuel assembly in Korea were carried out. And also tests on two commercial spacer grids were carried out. The results of the comparisons show that the performances of the KAERI devised candidates are good or comparable to those of the commercial spacer grids from the points of view of the spring characteristics, fretting wear resistance, fuel rod vibration characteristics and the impact characteristics of the spacer grids.
ACKNOWLEDGEMENTS
This project has been carried out under the nuclear R & D program by MOST (Ministry Of Science and Technology in Republic of Korea).
REFERENCES
[1] K.H. YOON, K.N. SONG et al., Spacer Grid for Nuclear Fuel Assemblies with Grid Springs Maintaining Conformal Contact with Fuel Rods and Enlarged Elastic Range, US Patent US 6,707,872 B2 (2004).
[2] H.S. KANG, K.N. SONG et al., Side-slotted Nozzle type Double Sheet Spacer Grid for Nuclear Fuel Assemblies, US Patent US 6,744,843 B2 (2004).
[3] K.H. YOON, K.N. SONG et al., Spacer Grid with H-spring for Fuel Rods for Use in Nuclear Reactor Fuel Assemblies, US Patent US 6,167,105 (2000).
[4] K.N. SONG et al., Shape Optimization of Spacer Grid Springs to Support Nuclear Fuel Rods, ICONE11-36500 (2002).
[5] H.S. KANG, K.N. SONG et al., Grid with Nozzle-type Coolant Deflecting Channels for Use in Nuclear Reactor Fuel Assemblies, US Patent 6,130,927 (2000).
[6] K.T. KIM, PLUS7TM Advanced Fuel Assembly Development Program for KSNPs and APR 1400, Proceedings of the 17th KAIF/KNS Annual Conference, Seoul, Korea (2002).
[7] S.P. HEO et al., Predicting the Characteristic Curve of a Spacer Grid Spring by Finite Element Analysis, Proceedings of the 6th International Conference on Computational Structures Technology, Prague, Czech Republic (2002).
[8] M.H. CHOI et al., Vibration Analysis of a Dummy Fuel Rod Continuously Supported by Spacer, Proceedings of the SMIRT-17, Paper # B01-3, Prague, Czech Republic (2003).
[9] K.H. YOON et al., Dynamic Impact Analysis of Grid Structure using Multi Point Constraints Condition, Computers & Structures 82 (2004), 2221–2228.
[10] H.K. KIM AND Y.H. LEE, Influence of Contact Shape and Supporting Condition on Tube Fretting Wear, Proceedings of the 14th International Conference of Wear of Materials (WOM-
245

[12] K.N. SONG et al., Mechanical/ Structural Analysis and Test on the KAERI Designed Spacer Grids for the Advanced LWR Fuel, Proceedings of the Korean Nuclear Society Autumn Meeting (2003).
[13] Young-Ho LEE et al., Analysis of Worn Area Characteristic in the Fretting Wear of Nuclear Fuel Rod, Proceedings of the Korean Society of Mechanical Engineers Autumn Meeting (2003).
246
FLOW-INDUCED GRID-TO-ROD FRETTING WEAR IN PWR FUEL ASSEMBLIES KYU-TAE KI, YOUNG-KI JANG Korea Nuclear Fuel Company, Daejeon, Republic of Korea
Abstract It is generally known that flow-induced vibration at the nuclear fuel assembly structures may cause grid-to-rod fretting wear and subsequently rod failure. The flow-induced grid-to-rod fretting wear is found to initiate at a certain critical grid-to-rod gap that is strongly correlated with the extent of flow-induced vibration. Based on in-reactor fretting wear-induced failure and out-of-pile flow test results, three vibration mechanisms acting on the grid-to-rod fretting wear have been described, which are high turbulence-induced fuel rod vibration with the combination of excessive grid-to-rod gap, self-excited fuel assembly vibration in a low frequency range caused by hydraulically unbalanced mixing vanes of the spacer grid assembly and self-excited spacer grid strap vibration in quite a high frequency range caused by some spacer grid designs. The impact of three vibration mechanisms on various grid designs is discussed along with various out-of-pile flow tests. On the other hand, three fretting wear progress models for high turbulence-induced fuel rod vibration have been proposed, which are constant work rate, constant work density rate and linear work density rate. The three wear progress models were employed to predict the fretting wear-induced fuel rod failure time of various grid designs. It is generally said that the work density rate model or the linear work density rate model predicts the rod failure time conservatively. Based on the comparison of rod failure times estimated by the long-term endurance test results and in-reactor fretting wear-induced fuel failure, the long-term endurance test guidelines are proposed. 1. INTRODUCTION Certain plants over the world have still suffered significant fuel rod failure caused by the grid-to-rod fretting wear. The fretting wear-induced failures may have something to do with fuel design, fabrication, reactor operational conditions and fuel assembly locations in the reactor core. However, it is generally said that excessive flow-induced vibration combined with the lack of grid-to-rod positive contact force will cause the grid-to-rod fretting wear-induced fuel failure [1]. Obviously fuel vendors have been striving to develop fretting-free fuel through their advanced fuel development programs. Korea Nuclear Fuel Company (KNFC) has recently developed the PLUS7 fuel, an advanced nuclear fuel for KSNPs, jointly with Westinghouse to improve flow-induced grid-to-rod fretting wear resistance, to enhance thermal performance and to increase high burnup performance. In order to evaluate the effect of the PLUS7 mid-grid spring and dimple design on flow-induced grid-to-rod fretting wear, various out-of-pile flow tests for the PLUS7 design have been performed and its results have been compared with other mid-grid designs’ results. In this paper, based on in-reactor fretting wear-induced failure and out-of-pile flow test results, three vibration mechanisms acting on the grid-to-rod fretting wear are described, which are high turbulence-induced fuel rod vibration with the combination of excessive grid-to-rod gap, self-excited fuel assembly vibration in a low frequency range caused by hydraulically unbalanced mixing vanes of the spacer grid assembly and self-excited spacer grid strap vibration in quite a high frequency range caused by some spacer grid designs. The impact of three vibration mechanisms on the PLUS7 mid-grid spring and dimple design is discussed along with various out-of-pile flow tests. On the other hand, the impact of the PLUS7 mid-grid spring and dimple design on grid-to-rod fretting wear-induced fuel failure times are discussed, based on three fretting wear progress models proposed in this paper. In addition, out-of pile flow test guidelines for checking the fretting wear resistance performance are proposed, which may be employed to check fretting wear resistance of newly developed grids.
247
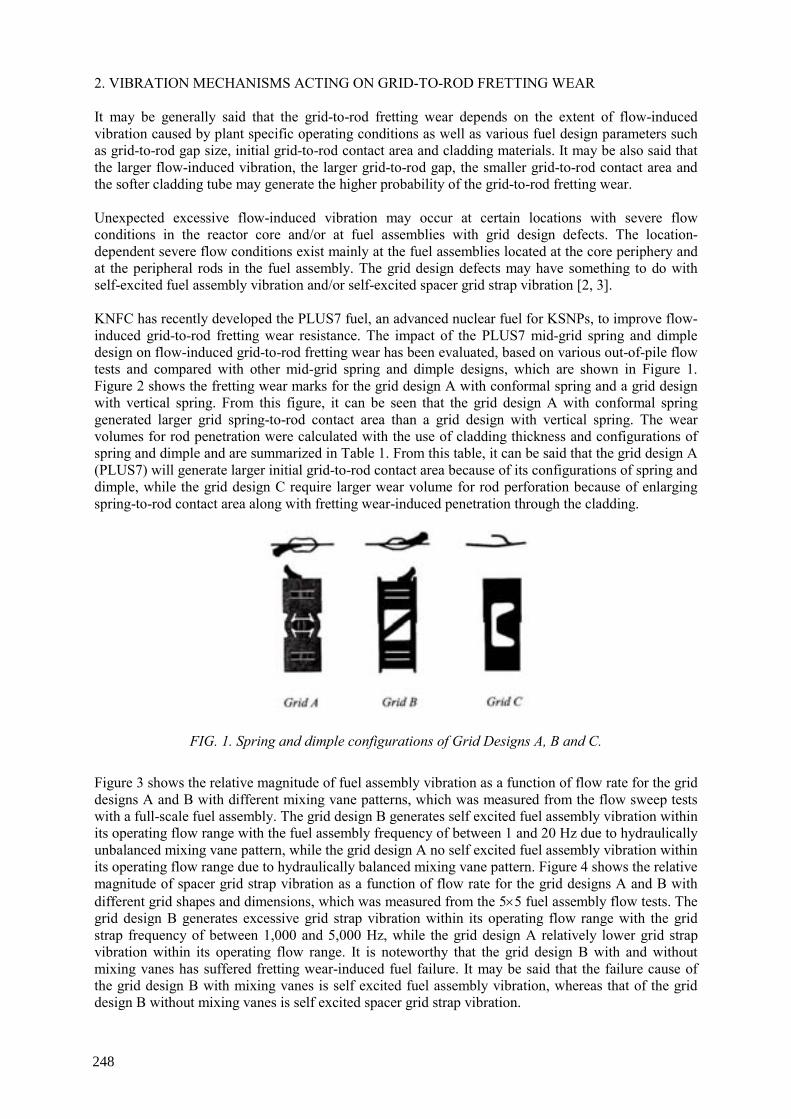
2. VIBRATION MECHANISMS ACTING ON GRID-TO-ROD FRETTING WEAR It may be generally said that the grid-to-rod fretting wear depends on the extent of flow-induced vibration caused by plant specific operating conditions as well as various fuel design parameters such as grid-to-rod gap size, initial grid-to-rod contact area and cladding materials. It may be also said that the larger flow-induced vibration, the larger grid-to-rod gap, the smaller grid-to-rod contact area and the softer cladding tube may generate the higher probability of the grid-to-rod fretting wear. Unexpected excessive flow-induced vibration may occur at certain locations with severe flow conditions in the reactor core and/or at fuel assemblies with grid design defects. The location-dependent severe flow conditions exist mainly at the fuel assemblies located at the core periphery and at the peripheral rods in the fuel assembly. The grid design defects may have something to do with self-excited fuel assembly vibration and/or self-excited spacer grid strap vibration [2, 3]. KNFC has recently developed the PLUS7 fuel, an advanced nuclear fuel for KSNPs, to improve flow-induced grid-to-rod fretting wear resistance. The impact of the PLUS7 mid-grid spring and dimple design on flow-induced grid-to-rod fretting wear has been evaluated, based on various out-of-pile flow tests and compared with other mid-grid spring and dimple designs, which are shown in Figure 1. Figure 2 shows the fretting wear marks for the grid design A with conformal spring and a grid design with vertical spring. From this figure, it can be seen that the grid design A with conformal spring generated larger grid spring-to-rod contact area than a grid design with vertical spring. The wear volumes for rod penetration were calculated with the use of cladding thickness and configurations of spring and dimple and are summarized in Table 1. From this table, it can be said that the grid design A (PLUS7) will generate larger initial grid-to-rod contact area because of its configurations of spring and dimple, while the grid design C require larger wear volume for rod perforation because of enlarging spring-to-rod contact area along with fretting wear-induced penetration through the cladding.
FIG. 1. Spring and dimple configurations of Grid Designs A, B and C.
Figure 3 shows the relative magnitude of fuel assembly vibration as a function of flow rate for the grid designs A and B with different mixing vane patterns, which was measured from the flow sweep tests with a full-scale fuel assembly. The grid design B generates self excited fuel assembly vibration within its operating flow range with the fuel assembly frequency of between 1 and 20 Hz due to hydraulically unbalanced mixing vane pattern, while the grid design A no self excited fuel assembly vibration within its operating flow range due to hydraulically balanced mixing vane pattern. Figure 4 shows the relative magnitude of spacer grid strap vibration as a function of flow rate for the grid designs A and B with different grid shapes and dimensions, which was measured from the 5×5 fuel assembly flow tests. The grid design B generates excessive grid strap vibration within its operating flow range with the grid strap frequency of between 1,000 and 5,000 Hz, while the grid design A relatively lower grid strap vibration within its operating flow range. It is noteworthy that the grid design B with and without mixing vanes has suffered fretting wear-induced fuel failure. It may be said that the failure cause of the grid design B with mixing vanes is self excited fuel assembly vibration, whereas that of the grid design B without mixing vanes is self excited spacer grid strap vibration.
248
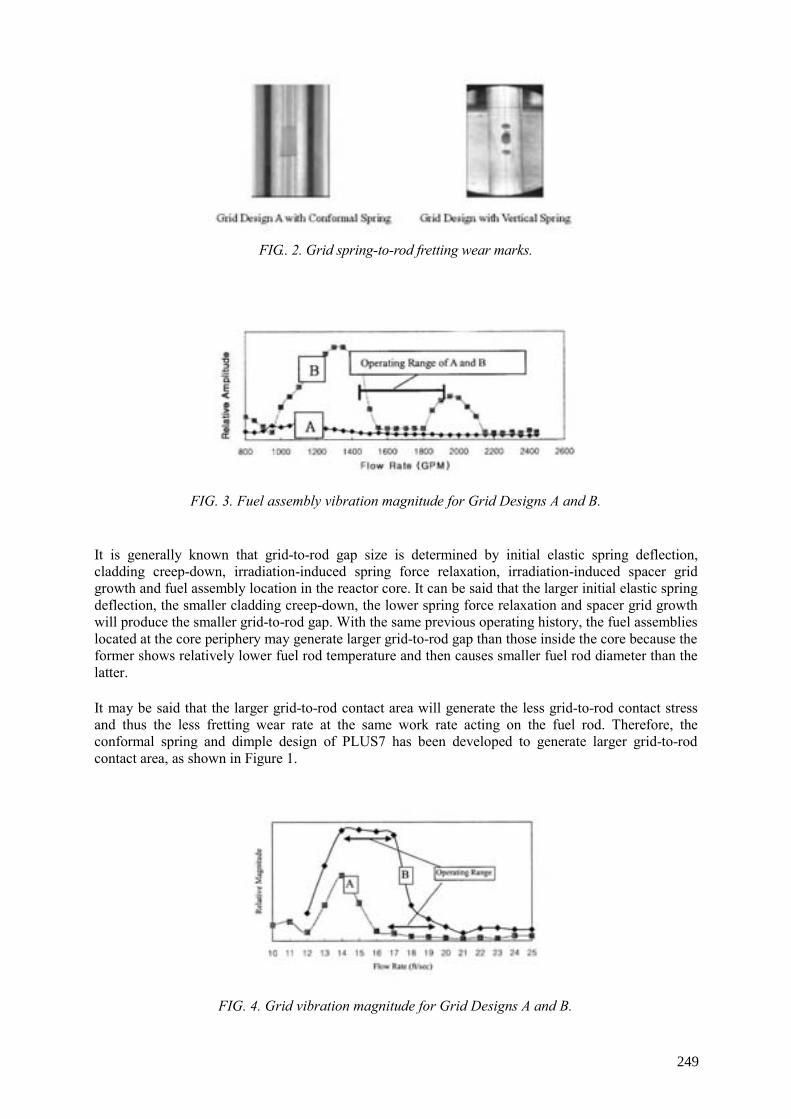
FIG.. 2. Grid spring-to-rod fretting wear marks.
FIG. 3. Fuel assembly vibration magnitude for Grid Designs A and B. It is generally known that grid-to-rod gap size is determined by initial elastic spring deflection, cladding creep-down, irradiation-induced spring force relaxation, irradiation-induced spacer grid growth and fuel assembly location in the reactor core. It can be said that the larger initial elastic spring deflection, the smaller cladding creep-down, the lower spring force relaxation and spacer grid growth will produce the smaller grid-to-rod gap. With the same previous operating history, the fuel assemblies located at the core periphery may generate larger grid-to-rod gap than those inside the core because the former shows relatively lower fuel rod temperature and then causes smaller fuel rod diameter than the latter.
It may be said that the larger grid-to-rod contact area will generate the less grid-to-rod contact stress and thus the less fretting wear rate at the same work rate acting on the fuel rod. Therefore, the conformal spring and dimple design of PLUS7 has been developed to generate larger grid-to-rod contact area, as shown in Figure 1.
FIG. 4. Grid vibration magnitude for Grid Designs A and B.
249
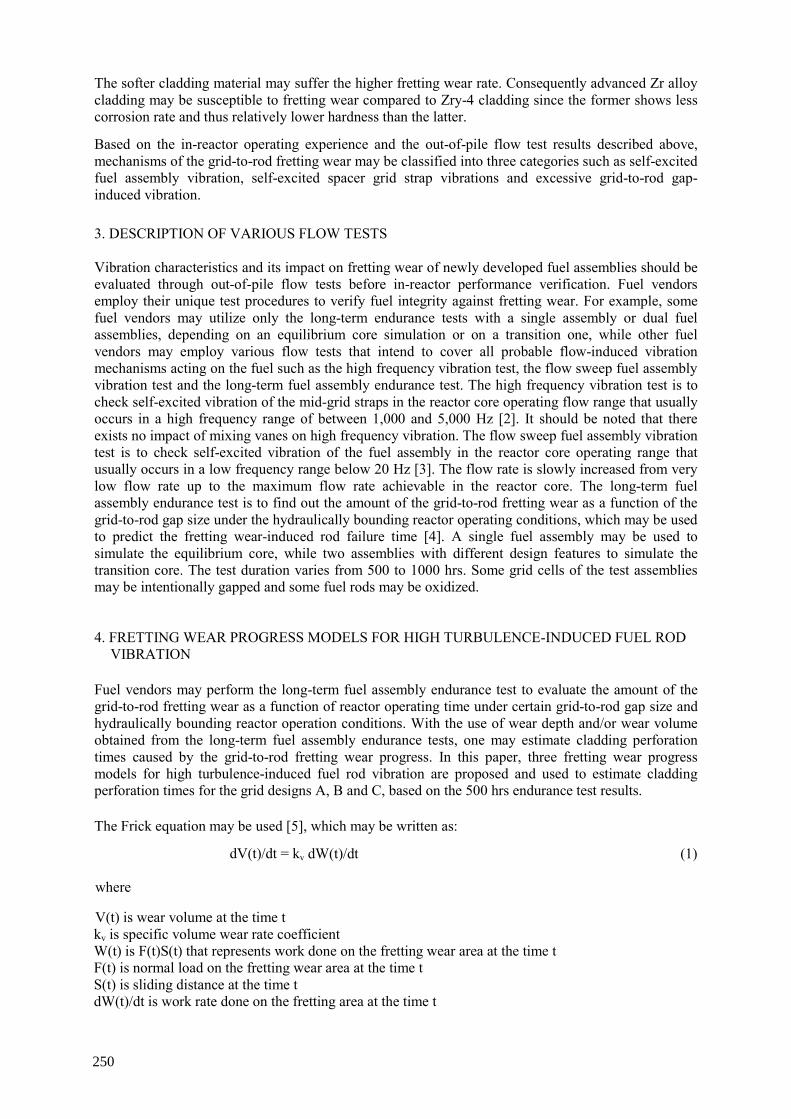
The softer cladding material may suffer the higher fretting wear rate. Consequently advanced Zr alloy cladding may be susceptible to fretting wear compared to Zry-4 cladding since the former shows less corrosion rate and thus relatively lower hardness than the latter.
Based on the in-reactor operating experience and the out-of-pile flow test results described above, mechanisms of the grid-to-rod fretting wear may be classified into three categories such as self-excited fuel assembly vibration, self-excited spacer grid strap vibrations and excessive grid-to-rod gap-induced vibration. 3. DESCRIPTION OF VARIOUS FLOW TESTS Vibration characteristics and its impact on fretting wear of newly developed fuel assemblies should be evaluated through out-of-pile flow tests before in-reactor performance verification. Fuel vendors employ their unique test procedures to verify fuel integrity against fretting wear. For example, some fuel vendors may utilize only the long-term endurance tests with a single assembly or dual fuel assemblies, depending on an equilibrium core simulation or on a transition one, while other fuel vendors may employ various flow tests that intend to cover all probable flow-induced vibration mechanisms acting on the fuel such as the high frequency vibration test, the flow sweep fuel assembly vibration test and the long-term fuel assembly endurance test. The high frequency vibration test is to check self-excited vibration of the mid-grid straps in the reactor core operating flow range that usually occurs in a high frequency range of between 1,000 and 5,000 Hz [2]. It should be noted that there exists no impact of mixing vanes on high frequency vibration. The flow sweep fuel assembly vibration test is to check self-excited vibration of the fuel assembly in the reactor core operating range that usually occurs in a low frequency range below 20 Hz [3]. The flow rate is slowly increased from very low flow rate up to the maximum flow rate achievable in the reactor core. The long-term fuel assembly endurance test is to find out the amount of the grid-to-rod fretting wear as a function of the grid-to-rod gap size under the hydraulically bounding reactor operating conditions, which may be used to predict the fretting wear-induced rod failure time [4]. A single fuel assembly may be used to simulate the equilibrium core, while two assemblies with different design features to simulate the transition core. The test duration varies from 500 to 1000 hrs. Some grid cells of the test assemblies may be intentionally gapped and some fuel rods may be oxidized. 4. FRETTING WEAR PROGRESS MODELS FOR HIGH TURBULENCE-INDUCED FUEL ROD
VIBRATION
Fuel vendors may perform the long-term fuel assembly endurance test to evaluate the amount of the grid-to-rod fretting wear as a function of reactor operating time under certain grid-to-rod gap size and hydraulically bounding reactor operation conditions. With the use of wear depth and/or wear volume obtained from the long-term fuel assembly endurance tests, one may estimate cladding perforation times caused by the grid-to-rod fretting wear progress. In this paper, three fretting wear progress models for high turbulence-induced fuel rod vibration are proposed and used to estimate cladding perforation times for the grid designs A, B and C, based on the 500 hrs endurance test results.
The Frick equation may be used [5], which may be written as:
dV(t)/dt = kv dW(t)/dt (1) where
V(t) is wear volume at the time t kv is specific volume wear rate coefficient W(t) is F(t)S(t) that represents work done on the fretting wear area at the time t F(t) is normal load on the fretting wear area at the time t S(t) is sliding distance at the time t dW(t)/dt is work rate done on the fretting area at the time t
250

However, it is generally found that the fretting wear initiates only after forming a certain critical grid-to-rod gap that is strongly correlated with both the extent of flow-induced vibration and grid-to-rod contact shape. In other words, the fretting wear seems to start only after the work rate exceeds a critical value. The equation (1), therefore, should be modified as;
dV(t)/dt = 0, if W(t) ≤ Wo and dV(t)/dt = kv d[F(t)S(t)]/dt, if W(t) > Wo (2)
where Wo is critical work needed to initiate fretting wear
It may be said that Wo depends on configurations of spring and dimple, spring stiffness and contacting material hardness. The wear depth rate, however, is more convenient to predict time for the wear-induced rod perforation than the wear volume rate. The equation (2) is proposed as follows:
dD(t)/dt = 0, if σ (t) ≤ σo and dD(t)/dt = kd d[σ(t)S(t)]]/dt, if σ(t) > σo (3)
where
D(t) is fretting wear depth at the time t kd is specific depth wear rate coefficient σ(t) is F(t)/A(t) that represents stress acting on the fretting wear area considered at the time t A(t) is grid-to-rod contact area at the time t σo is critical stress needed to initiate fretting wear
Based on the equations (2) and (3), one may predict time-dependent fretting wear depth assuming various work rate or work density rate acting on the fretting wear area.
4.1. Constant work rate model
We may assume that the work rate is constant regardless of the fretting wear progress. With the use of the equation (2), the wear volume may increase in a linear manner as follows;
V(t) = 0, if t ≤ to, V(t) = kv C1 (t-to) = kvc (t-to) if t > to (4)
where
d[W(t)]/dt is assumed to be constant, C1, which represents constant work rate to is time when work exceeds the critical work, Wo kvc is corrected specific volume wear rate coefficient
The wear volume may be converted into the wear depth as follows;
D(t) = 0, if t ≤ to, D(t) = kvc (t- to)/A(t), if t > to (5)
From the equation (5), it can be said that the fretting wear depth would be retarded if the fretting wear area increased with the fretting wear progress.
4.2. Constant work density rate model
One may assume that the work density rate, i.e., d[σ(t)S(t)]/dt, is constant regardless of the fretting wear progress. With the use of the equation (3), the wear depth may increase in a linear manner as follows;
251
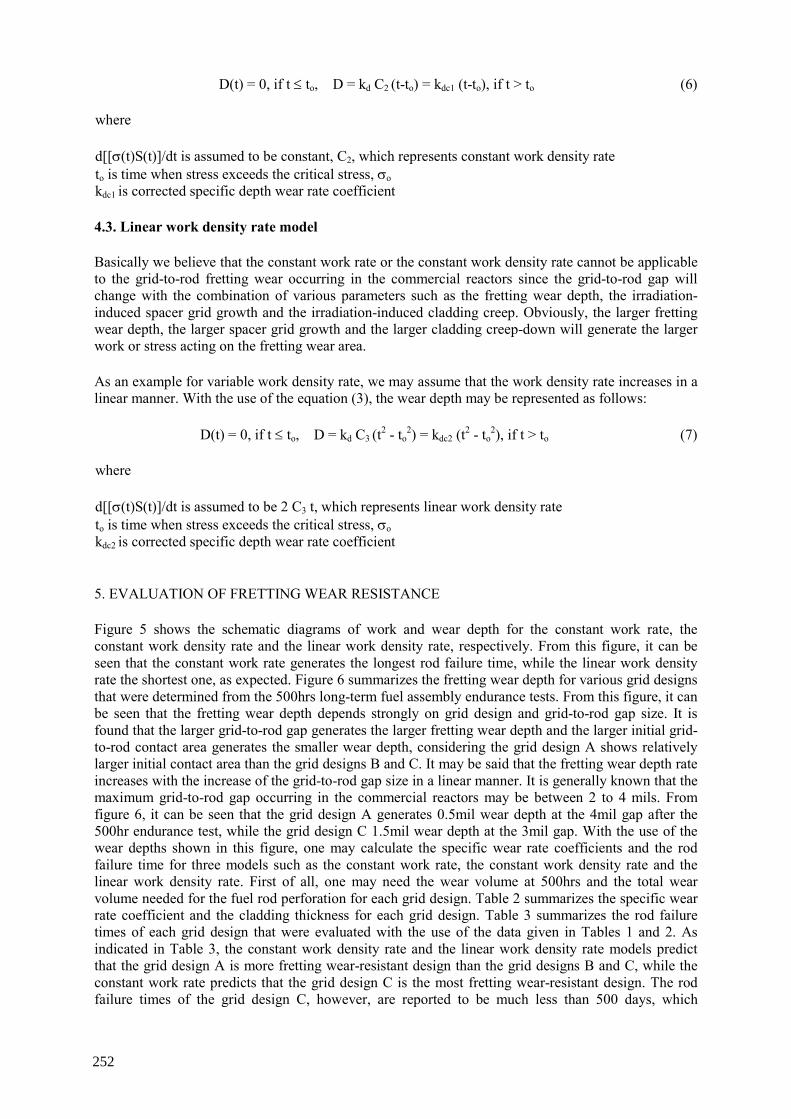
D(t) = 0, if t ≤ to, D = kd C2 (t-to) = kdc1 (t-to), if t > to (6)
where
d[[σ(t)S(t)]/dt is assumed to be constant, C2, which represents constant work density rate to is time when stress exceeds the critical stress, σo kdc1 is corrected specific depth wear rate coefficient
4.3. Linear work density rate model
Basically we believe that the constant work rate or the constant work density rate cannot be applicable to the grid-to-rod fretting wear occurring in the commercial reactors since the grid-to-rod gap will change with the combination of various parameters such as the fretting wear depth, the irradiation-induced spacer grid growth and the irradiation-induced cladding creep. Obviously, the larger fretting wear depth, the larger spacer grid growth and the larger cladding creep-down will generate the larger work or stress acting on the fretting wear area.
As an example for variable work density rate, we may assume that the work density rate increases in a linear manner. With the use of the equation (3), the wear depth may be represented as follows:
D(t) = 0, if t ≤ to, D = kd C3 (t2 - to2) = kdc2 (t2 - to
2), if t > to (7)
where
d[[σ(t)S(t)]/dt is assumed to be 2 C3 t, which represents linear work density rate to is time when stress exceeds the critical stress, σo kdc2 is corrected specific depth wear rate coefficient
5. EVALUATION OF FRETTING WEAR RESISTANCE
Figure 5 shows the schematic diagrams of work and wear depth for the constant work rate, the constant work density rate and the linear work density rate, respectively. From this figure, it can be seen that the constant work rate generates the longest rod failure time, while the linear work density rate the shortest one, as expected. Figure 6 summarizes the fretting wear depth for various grid designs that were determined from the 500hrs long-term fuel assembly endurance tests. From this figure, it can be seen that the fretting wear depth depends strongly on grid design and grid-to-rod gap size. It is found that the larger grid-to-rod gap generates the larger fretting wear depth and the larger initial grid-to-rod contact area generates the smaller wear depth, considering the grid design A shows relatively larger initial contact area than the grid designs B and C. It may be said that the fretting wear depth rate increases with the increase of the grid-to-rod gap size in a linear manner. It is generally known that the maximum grid-to-rod gap occurring in the commercial reactors may be between 2 to 4 mils. From figure 6, it can be seen that the grid design A generates 0.5mil wear depth at the 4mil gap after the 500hr endurance test, while the grid design C 1.5mil wear depth at the 3mil gap. With the use of the wear depths shown in this figure, one may calculate the specific wear rate coefficients and the rod failure time for three models such as the constant work rate, the constant work density rate and the linear work density rate. First of all, one may need the wear volume at 500hrs and the total wear volume needed for the fuel rod perforation for each grid design. Table 2 summarizes the specific wear rate coefficient and the cladding thickness for each grid design. Table 3 summarizes the rod failure times of each grid design that were evaluated with the use of the data given in Tables 1 and 2. As indicated in Table 3, the constant work density rate and the linear work density rate models predict that the grid design A is more fretting wear-resistant design than the grid designs B and C, while the constant work rate predicts that the grid design C is the most fretting wear-resistant design. The rod failure times of the grid design C, however, are reported to be much less than 500 days, which
252
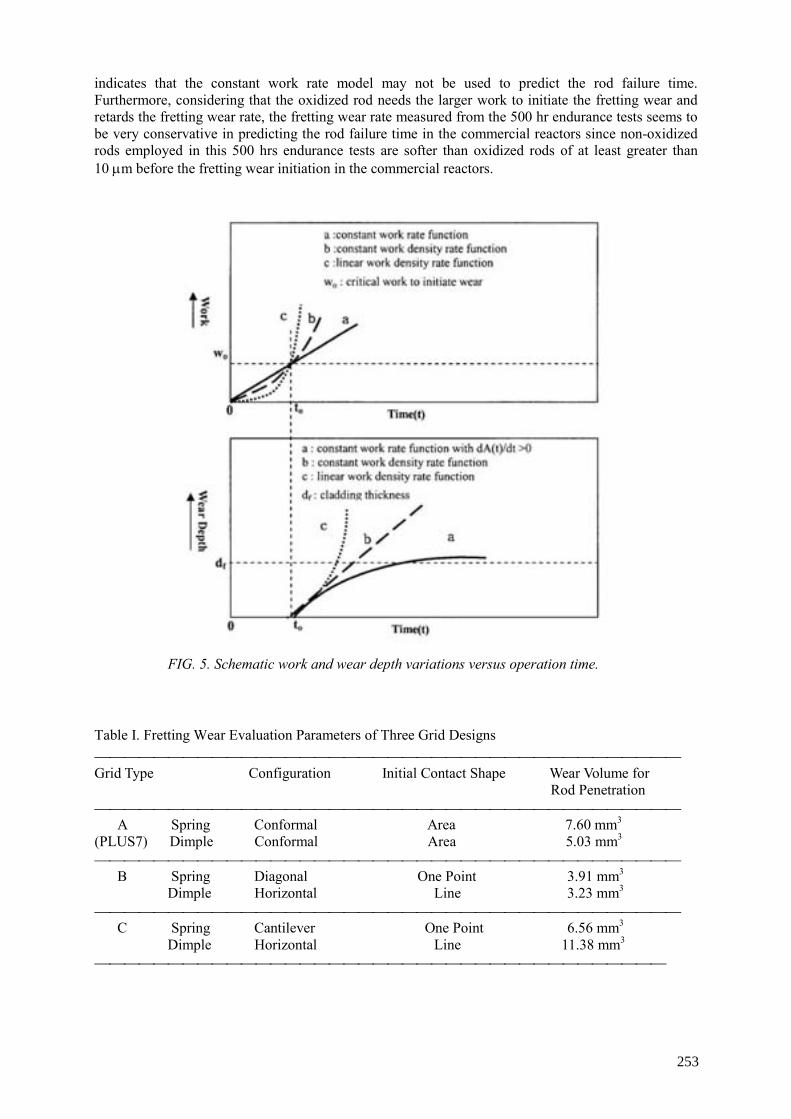
indicates that the constant work rate model may not be used to predict the rod failure time. Furthermore, considering that the oxidized rod needs the larger work to initiate the fretting wear and retards the fretting wear rate, the fretting wear rate measured from the 500 hr endurance tests seems to be very conservative in predicting the rod failure time in the commercial reactors since non-oxidized rods employed in this 500 hrs endurance tests are softer than oxidized rods of at least greater than 10 µm before the fretting wear initiation in the commercial reactors.
FIG. 5. Schematic work and wear depth variations versus operation time.
Table I. Fretting Wear Evaluation Parameters of Three Grid Designs Grid Type Configuration Initial Contact Shape Wear Volume for
Rod Penetration
A Spring Conformal Area 7.60 mm3 (PLUS7) Dimple Conformal Area 5.03 mm3
B Spring Diagonal One Point 3.91 mm3 Dimple Horizontal Line 3.23 mm3
C Spring Cantilever One Point 6.56 mm3
Dimple Horizontal Line 11.38 mm3
253
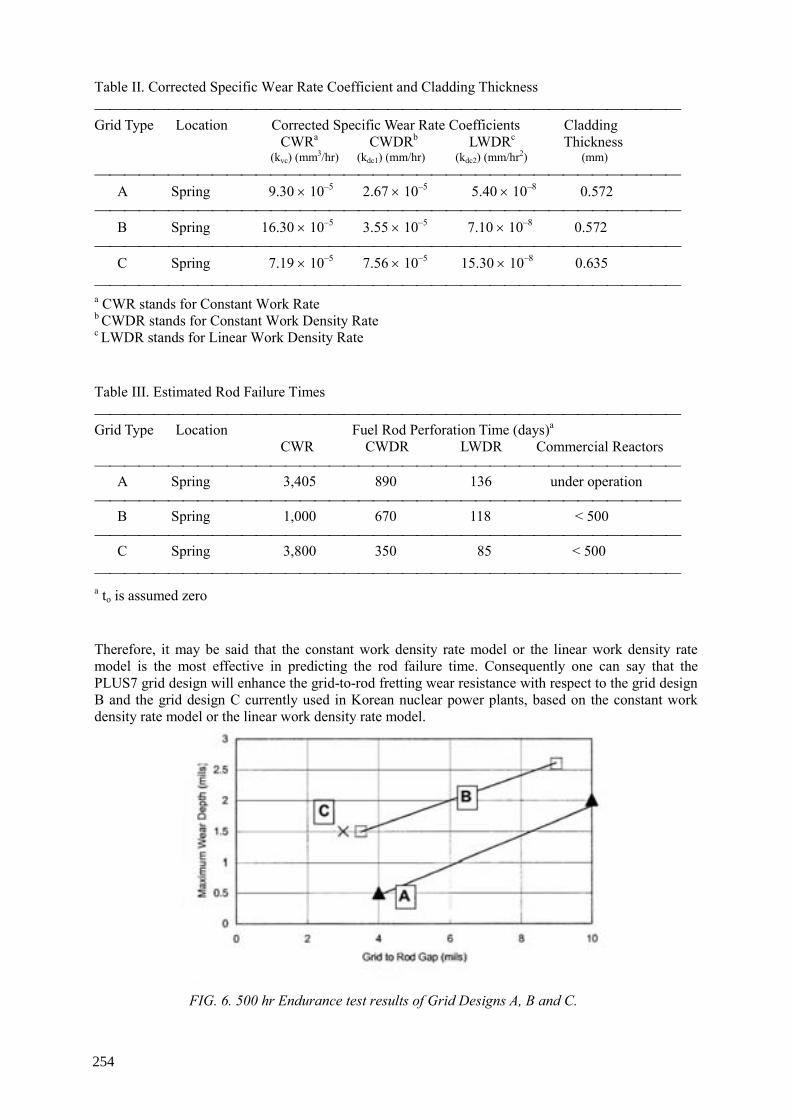
Table II. Corrected Specific Wear Rate Coefficient and Cladding Thickness Grid Type Location Corrected Specific Wear Rate Coefficients Cladding
CWRa CWDRb LWDRc Thickness (kvc) (mm3/hr) (kdc1) (mm/hr) (kdc2) (mm/hr2) (mm)
A Spring 9.30 × 10⁻⁵ 2.67 × 10⁻⁵ 5.40 × 10⁻⁸ 0.572
B Spring 16.30 × 10⁻⁵ 3.55 × 10⁻⁵ 7.10 × 10⁻⁸ 0.572
C Spring 7.19 × 10⁻⁵ 7.56 × 10⁻⁵ 15.30 × 10⁻⁸ 0.635
a CWR stands for Constant Work Rate b CWDR stands for Constant Work Density Rate c LWDR stands for Linear Work Density Rate Table III. Estimated Rod Failure Times Grid Type Location Fuel Rod Perforation Time (days)a
CWR CWDR LWDR Commercial Reactors
A Spring 3,405 890 136 under operation
B Spring 1,000 670 118 < 500
C Spring 3,800 350 85 < 500 a to is assumed zero
Therefore, it may be said that the constant work density rate model or the linear work density rate model is the most effective in predicting the rod failure time. Consequently one can say that the PLUS7 grid design will enhance the grid-to-rod fretting wear resistance with respect to the grid design B and the grid design C currently used in Korean nuclear power plants, based on the constant work density rate model or the linear work density rate model.
FIG. 6. 500 hr Endurance test results of Grid Designs A, B and C.
254
6. GUIDELINES FOR FRETTING WEAR VERIFICATION TESTS Fuel vendors have been developing various advanced grid designs to enhance thermal performance as well as to eliminate the grid-to-rod fretting wear-induced fuel failure. However, grid designs with high thermal performance generally generate high vibration that may cause the grid-to-rod fretting wear. Therefore, it is important to check if there exist vibration sources of advanced fuel that is unacceptable at the grid-to-rod fretting wear standpoint. Consequently three kinds of out-of-pile tests for vibration and fretting wear characteristics investigation are proposed as follows; – High Frequency Vibration Tests to check self-excited vibration of grid strap – Flow Sweep Tests to check self-excited vibration of fuel assembly – Long-term Endurance Tests to check fretting wear rate of the spacer grid springs and dimples
For the long-term endurance tests, three key test conditions are to be employed as follows; – Employ oxidized rods rather than non-oxidized ones to simulate the commercial reactor
circumstance – Generate work rates much greater than a critical work rate needed to initiate fretting wear on
oxidized rods – Introduce various grid-to-rod gap sizes versus axial grid locations To estimate the fuel rod failure time of some grid design under commercial reactor operation conditions with the use of the current long-term endurance test results, the constant work density rate model or the linear work density rate model is recommended. 7. CONCLUSIONS Three vibration mechanisms acting on the grid-to-rod fretting wear are the high turbulence-induced excessive fuel rod vibration, the self-excited fuel assembly vibration in a low frequency range caused by hydraulically unbalanced mixing vanes of the spacer grid assembly and the self-excited spacer grid strap vibration in quite a high frequency range caused by spacer grid design. One may predict rod failure time may be predicted by the combination of the long-term endurance test results and the constant work density rate model or the linear work density rate model.
REFERENCES [1] M.W. KENNARD, D.J. SUNDERLAND, and J.E. HARBOTTLE, “A Study of Grid-to-Rod
Fretting Wear in PWR Fuel Assembly”, Stoller Report (April 1995). [2] M.E. CONNER, “VISTA High Frequency Vibration Test Report-16x16KAFD Mid-Grid
Designs,” KAFD-01D-77, KNFC/Westinghouse Report (December, 2001). [3] Y.K. JANG and R.Y. LU, “FACTS Fuel Assembly Vibration Test Report-16x16KAFD”,
KAFD-01D-114, KNFC/Westinghouse Report (December, 2001). [4] R.Y. LU, “VIPER 16x16 KAFD Fuel Assembly and KSNP Fuel Assembly Long-term Wear
Test Report”, KAFD-01D-115, KNFC/Westinghouse Report (December, 2001). [5] T.M. FRICK, T.E. SOBEK and J.R. REAVIS, “Overview on the Development and
Implementation of Methodologies to Compute Vibration and Wear of Steam Generator Tubes Symposium on Flow-Induced Vibration””, ASME 3 (1894).
255

DEVELOPMENT OF A FRETTING-WEAR AND FLOW-INDUCED VIBRATION MODEL FOR THE FUEL RODS
P.R. RUBIOLO, D.V. PARAMONOV, M.Y. YOUNG Westinghouse Electric Company, LLC, Pittsburgh, Pennsylvania, United States of America Abstract A model developed to predict fretting-wear performance and vibration response of fuel rods is presented. The model was derived using classic approximations such as the generalized pseudo-forces method and modal analysis. It includes all hydraulic, structural and tribological effects considered to be of sufficient importance for the prediction of the fretting-wear performance. In order to deal with inherent variability associated with some of these phenomena, the numerical implementation of the method was tuned to a large body of experimental data. Method benchmarking was carried out by predicting an endurance test of a full size nuclear fuel assembly.
1. INTRODUCTION Fuel assemblies of pressurize water reactors (PWR) are exposed to severe thermal, mechanical and radiation conditions during operation. Core flow fields may result in severe fuel rod vibration, which in turn might lead in excessive cladding fretting-wear. Because of the increasing demand on the performance on the fuel assemblies, the fretting-wear damage has become a significant concern for nuclear designers [1–2]. This phenomenon is governed by a set of complex hydraulic, thermal, structural and tribological phenomena, which do not remain constant during nuclear fuel operation in reactor core. A key parameter in evaluating the performance of a given fuel design is the wear rate. This parameter requires the determination of the dynamic response of the fuel rod and the knowledge of the wear coefficient between the rod and its supports. In order to predict the dynamic response of a nuclear fuel rod, a Non-Linear Vibration Model (NLVM) has been developed [3–4]. This model determines the rod frequency response and motion, the support impact forces and the sliding and sticking distances. Based of these parameters, the work and wear rates are calculated. This paper provides a description of the main characteristics of the integrated fretting-wear analysis method and describes its implementation for predicting the endurance fretting-wear tests of full size nuclear fuel assemblies. Comparisons of model predictions against the results of a finite Element Method (FEM) and experimental test data are also presented. 2. MODEL DEVELOPMENT The overall approach is depicted in FIG 1. Test conditions such as flow rate, temperature, position of assemblies and test duration; and the assembly characteristics such as rod and assembly dimensions, location and loss coefficient of grids, nozzles and other features are used to determine axial and lateral flow components in the assemblies on rod-by-rod basis. The resulting flow field is then used to calculate the force exerted onto the fuel rods and caused by the axial turbulent flow. A sub-scale rod bundle (VISTA) or full assembly (VIPER) test facilities are used to benchmark analytical predictions of the excitation force. Given the level of excitation, a Non-Linear Vibration Model (NLVM) is used to determine rod vibration response depending on rod properties and support conditions such as grid-to-rod gap, rod position and preload. When structural properties of rod supports are accounted for, support response and work rate can be calculated. Rod response and work rate predictions were verified against VIPER and AECL single cell fretting wear tests, respectively. Analysis of actual scar shapes in VIPER and AECL tests also serves to determine wear volume-to-scar area relationships for tilted supports; which coupled with data on material properties and wear regime are used to project
257
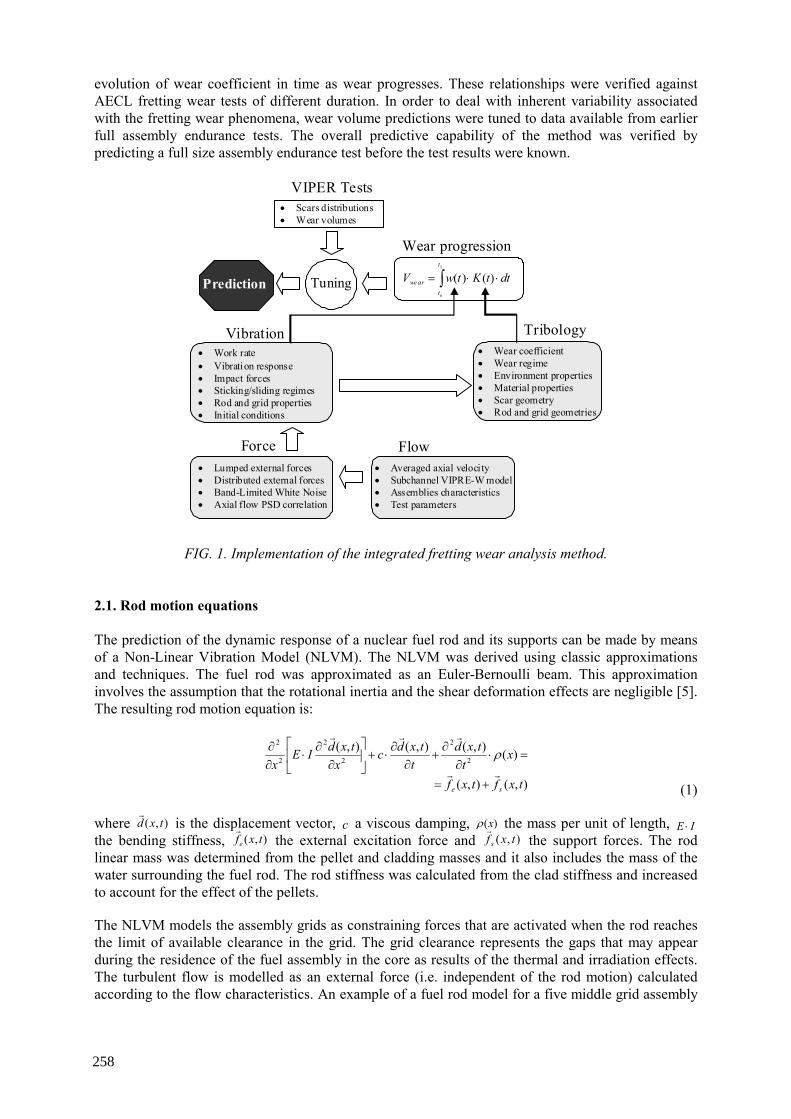
evolution of wear coefficient in time as wear progresses. These relationships were verified against AECL fretting wear tests of different duration. In order to deal with inherent variability associated with the fretting wear phenomena, wear volume predictions were tuned to data available from earlier full assembly endurance tests. The overall predictive capability of the method was verified by predicting a full size assembly endurance test before the test results were known.
∫ ⋅⋅=1
)()(t
twe ar
o
dttKtwV
FlowForce
Vibration Tribology
Wear progression
VIPER Tests
TuningPrediction
• Wear coefficient • Wear regime • Environment properties • Material properties • Scar geometry • Rod and grid geometries
• Work rate • Vibration response • Impact forces • Sticking/sliding regimes • Rod and grid properties • Initial conditions
• Lumped external forces • Distributed external forces • Band-Limited White Noise • Axial flow PSD correlation
• Averaged axial velocity • Subchannel VIPRE-W model• Assemblies characteristics • Test parameters
• Scars distributions • Wear volumes
FIG. 1. Implementation of the integrated fretting wear analysis method. 2.1. Rod motion equations The prediction of the dynamic response of a nuclear fuel rod and its supports can be made by means of a Non-Linear Vibration Model (NLVM). The NLVM was derived using classic approximations and techniques. The fuel rod was approximated as an Euler-Bernoulli beam. This approximation involves the assumption that the rotational inertia and the shear deformation effects are negligible [5]. The resulting rod motion equation is:
),(),(
)(),(),(),(2
2
2
2
2
2
txftxf
xt
txdt
txdcx
txdIEx
se +=
=⋅∂
∂+
∂∂
⋅+
∂∂
⋅∂∂ ρ
(1) where ),( txd is the displacement vector, c a viscous damping, )(xρ the mass per unit of length, IE ⋅ the bending stiffness, ),( txfe the external excitation force and ),( txf s the support forces. The rod linear mass was determined from the pellet and cladding masses and it also includes the mass of the water surrounding the fuel rod. The rod stiffness was calculated from the clad stiffness and increased to account for the effect of the pellets. The NLVM models the assembly grids as constraining forces that are activated when the rod reaches the limit of available clearance in the grid. The grid clearance represents the gaps that may appear during the residence of the fuel assembly in the core as results of the thermal and irradiation effects. The turbulent flow is modelled as an external force (i.e. independent of the rod motion) calculated according to the flow characteristics. An example of a fuel rod model for a five middle grid assembly
258
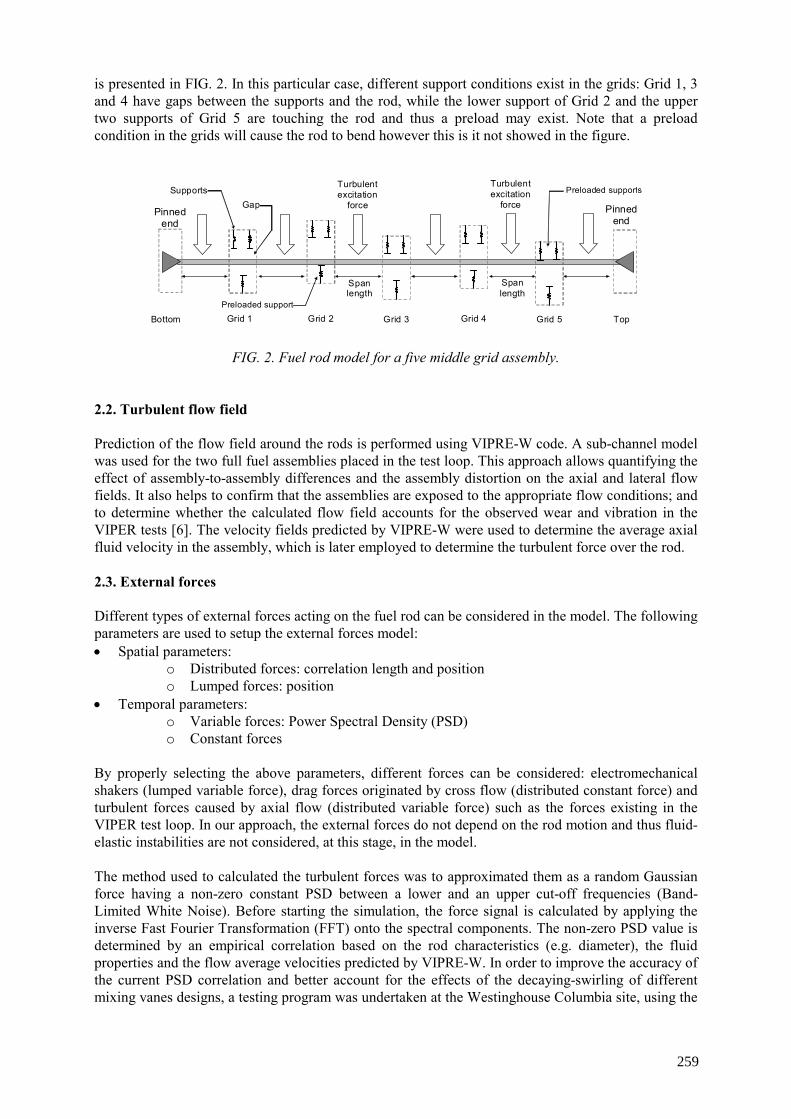
is presented in FIG. 2. In this particular case, different support conditions exist in the grids: Grid 1, 3 and 4 have gaps between the supports and the rod, while the lower support of Grid 2 and the upper two supports of Grid 5 are touching the rod and thus a preload may exist. Note that a preload condition in the grids will cause the rod to bend however this is it not showed in the figure.
Grid 3
Pinned end
Pinned end
Span length
Grid 2 Grid 1 Top Bottom
Turbulent excitation
force
Grid 5
Span length
Grid 4
Turbulent excitation
forceSupports
Gap
Preloaded support
Preloaded supports
FIG. 2. Fuel rod model for a five middle grid assembly. 2.2. Turbulent flow field Prediction of the flow field around the rods is performed using VIPRE-W code. A sub-channel model was used for the two full fuel assemblies placed in the test loop. This approach allows quantifying the effect of assembly-to-assembly differences and the assembly distortion on the axial and lateral flow fields. It also helps to confirm that the assemblies are exposed to the appropriate flow conditions; and to determine whether the calculated flow field accounts for the observed wear and vibration in the VIPER tests [6]. The velocity fields predicted by VIPRE-W were used to determine the average axial fluid velocity in the assembly, which is later employed to determine the turbulent force over the rod. 2.3. External forces Different types of external forces acting on the fuel rod can be considered in the model. The following parameters are used to setup the external forces model: • Spatial parameters:
o Distributed forces: correlation length and position o Lumped forces: position
• Temporal parameters: o Variable forces: Power Spectral Density (PSD) o Constant forces
By properly selecting the above parameters, different forces can be considered: electromechanical shakers (lumped variable force), drag forces originated by cross flow (distributed constant force) and turbulent forces caused by axial flow (distributed variable force) such as the forces existing in the VIPER test loop. In our approach, the external forces do not depend on the rod motion and thus fluid-elastic instabilities are not considered, at this stage, in the model. The method used to calculated the turbulent forces was to approximated them as a random Gaussian force having a non-zero constant PSD between a lower and an upper cut-off frequencies (Band-Limited White Noise). Before starting the simulation, the force signal is calculated by applying the inverse Fast Fourier Transformation (FFT) onto the spectral components. The non-zero PSD value is determined by an empirical correlation based on the rod characteristics (e.g. diameter), the fluid properties and the flow average velocities predicted by VIPRE-W. In order to improve the accuracy of the current PSD correlation and better account for the effects of the decaying-swirling of different mixing vanes designs, a testing program was undertaken at the Westinghouse Columbia site, using the
259
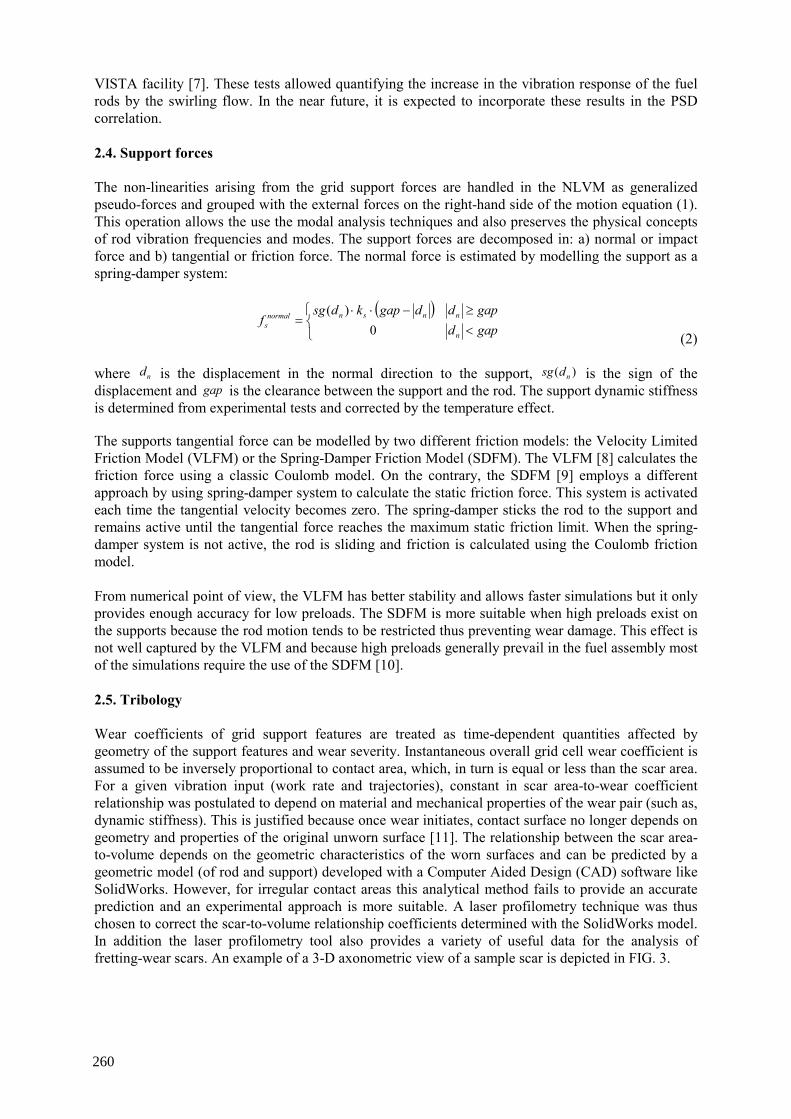
VISTA facility [7]. These tests allowed quantifying the increase in the vibration response of the fuel rods by the swirling flow. In the near future, it is expected to incorporate these results in the PSD correlation. 2.4. Support forces The non-linearities arising from the grid support forces are handled in the NLVM as generalized pseudo-forces and grouped with the external forces on the right-hand side of the motion equation (1). This operation allows the use the modal analysis techniques and also preserves the physical concepts of rod vibration frequencies and modes. The support forces are decomposed in: a) normal or impact force and b) tangential or friction force. The normal force is estimated by modelling the support as a spring-damper system:
( )
<≥−⋅⋅
=gapdgapddgapkdsg
fn
nnsnnormals 0
)(
(2) where nd is the displacement in the normal direction to the support, )( ndsg is the sign of the displacement and gap is the clearance between the support and the rod. The support dynamic stiffness is determined from experimental tests and corrected by the temperature effect. The supports tangential force can be modelled by two different friction models: the Velocity Limited Friction Model (VLFM) or the Spring-Damper Friction Model (SDFM). The VLFM [8] calculates the friction force using a classic Coulomb model. On the contrary, the SDFM [9] employs a different approach by using spring-damper system to calculate the static friction force. This system is activated each time the tangential velocity becomes zero. The spring-damper sticks the rod to the support and remains active until the tangential force reaches the maximum static friction limit. When the spring-damper system is not active, the rod is sliding and friction is calculated using the Coulomb friction model. From numerical point of view, the VLFM has better stability and allows faster simulations but it only provides enough accuracy for low preloads. The SDFM is more suitable when high preloads exist on the supports because the rod motion tends to be restricted thus preventing wear damage. This effect is not well captured by the VLFM and because high preloads generally prevail in the fuel assembly most of the simulations require the use of the SDFM [10]. 2.5. Tribology Wear coefficients of grid support features are treated as time-dependent quantities affected by geometry of the support features and wear severity. Instantaneous overall grid cell wear coefficient is assumed to be inversely proportional to contact area, which, in turn is equal or less than the scar area. For a given vibration input (work rate and trajectories), constant in scar area-to-wear coefficient relationship was postulated to depend on material and mechanical properties of the wear pair (such as, dynamic stiffness). This is justified because once wear initiates, contact surface no longer depends on geometry and properties of the original unworn surface [11]. The relationship between the scar area-to-volume depends on the geometric characteristics of the worn surfaces and can be predicted by a geometric model (of rod and support) developed with a Computer Aided Design (CAD) software like SolidWorks. However, for irregular contact areas this analytical method fails to provide an accurate prediction and an experimental approach is more suitable. A laser profilometry technique was thus chosen to correct the scar-to-volume relationship coefficients determined with the SolidWorks model. In addition the laser profilometry tool also provides a variety of useful data for the analysis of fretting-wear scars. An example of a 3-D axonometric view of a sample scar is depicted in FIG. 3.
260
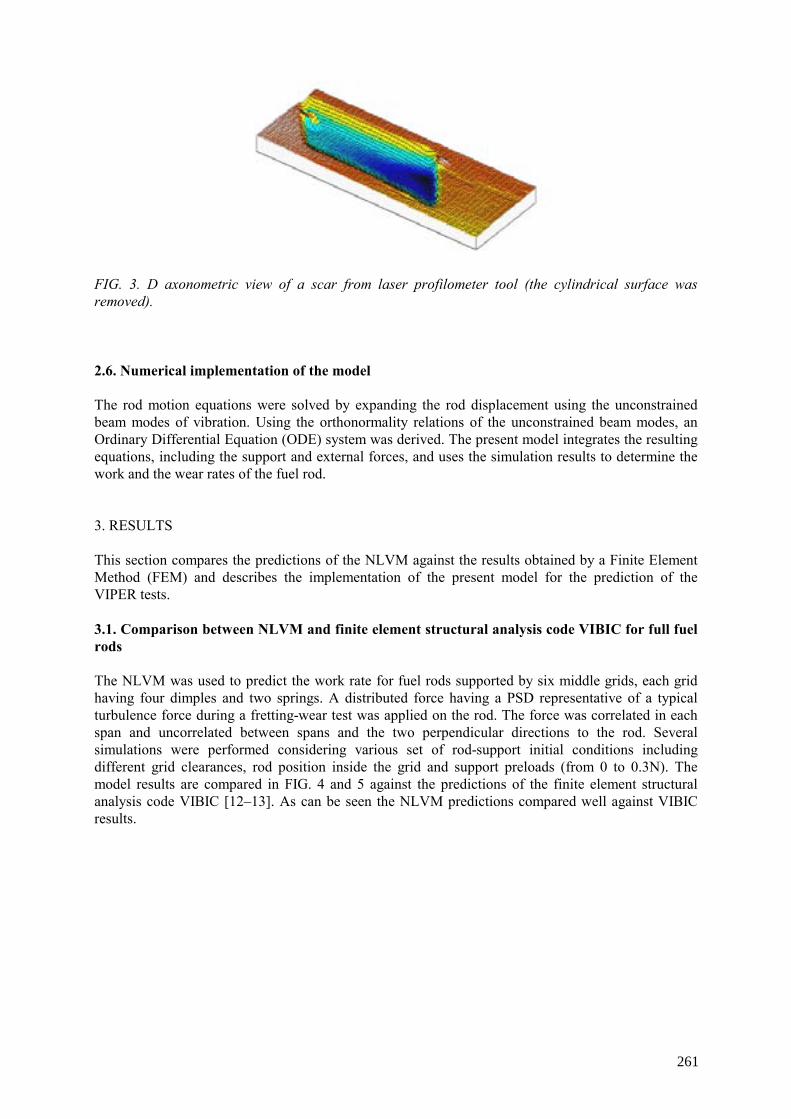
FIG. 3. D axonometric view of a scar from laser profilometer tool (the cylindrical surface was removed). 2.6. Numerical implementation of the model The rod motion equations were solved by expanding the rod displacement using the unconstrained beam modes of vibration. Using the orthonormality relations of the unconstrained beam modes, an Ordinary Differential Equation (ODE) system was derived. The present model integrates the resulting equations, including the support and external forces, and uses the simulation results to determine the work and the wear rates of the fuel rod. 3. RESULTS This section compares the predictions of the NLVM against the results obtained by a Finite Element Method (FEM) and describes the implementation of the present model for the prediction of the VIPER tests. 3.1. Comparison between NLVM and finite element structural analysis code VIBIC for full fuel rods The NLVM was used to predict the work rate for fuel rods supported by six middle grids, each grid having four dimples and two springs. A distributed force having a PSD representative of a typical turbulence force during a fretting-wear test was applied on the rod. The force was correlated in each span and uncorrelated between spans and the two perpendicular directions to the rod. Several simulations were performed considering various set of rod-support initial conditions including different grid clearances, rod position inside the grid and support preloads (from 0 to 0.3N). The model results are compared in FIG. 4 and 5 against the predictions of the finite element structural analysis code VIBIC [12–13]. As can be seen the NLVM predictions compared well against VIBIC results.
261
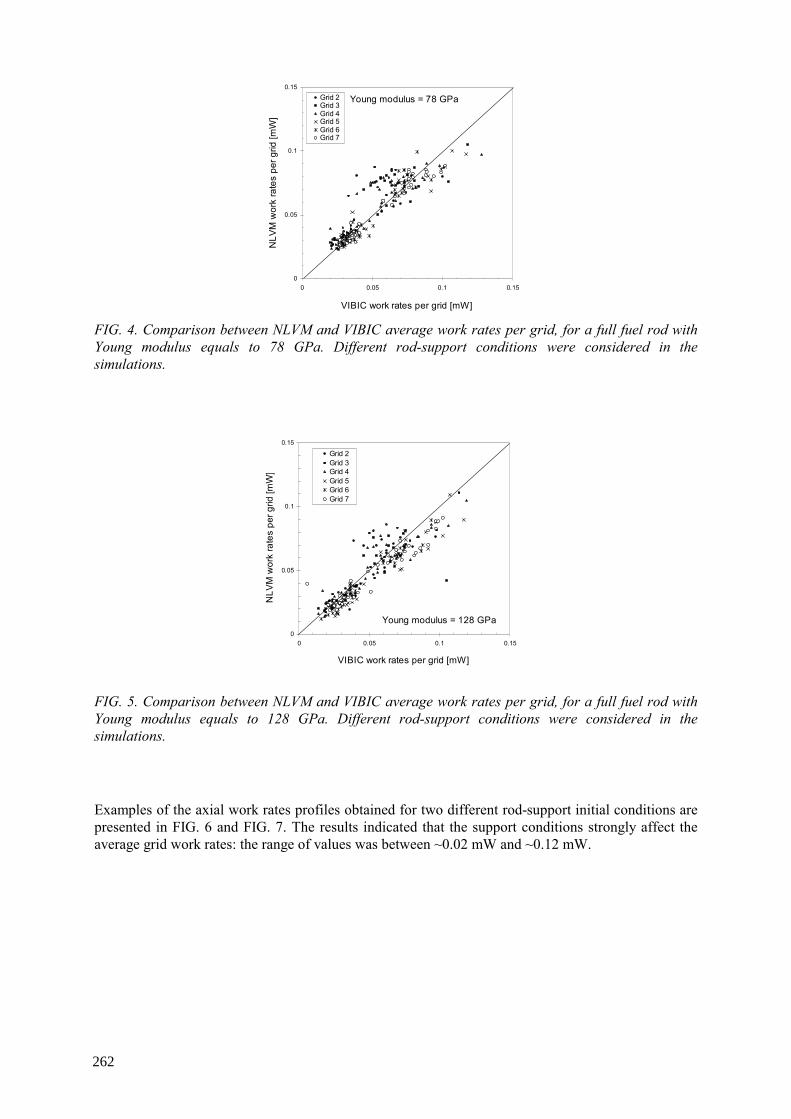
0
0.05
0.1
0.15
0 0.05 0.1 0.15
VIBIC work rates per grid [mW]
NLV
M w
ork
rate
s pe
r grid
[mW
]
Grid 2Grid 3Grid 4Grid 5Grid 6Grid 7
Young modulus = 78 GPa
FIG. 4. Comparison between NLVM and VIBIC average work rates per grid, for a full fuel rod with Young modulus equals to 78 GPa. Different rod-support conditions were considered in the simulations.
0
0.05
0.1
0.15
0 0.05 0.1 0.15
VIBIC work rates per grid [mW]
NLV
M w
ork
rate
s pe
r grid
[mW
]
Grid 2Grid 3Grid 4Grid 5Grid 6Grid 7
Young modulus = 128 GPa
FIG. 5. Comparison between NLVM and VIBIC average work rates per grid, for a full fuel rod with Young modulus equals to 128 GPa. Different rod-support conditions were considered in the simulations. Examples of the axial work rates profiles obtained for two different rod-support initial conditions are presented in FIG. 6 and FIG. 7. The results indicated that the support conditions strongly affect the average grid work rates: the range of values was between ~0.02 mW and ~0.12 mW.
262
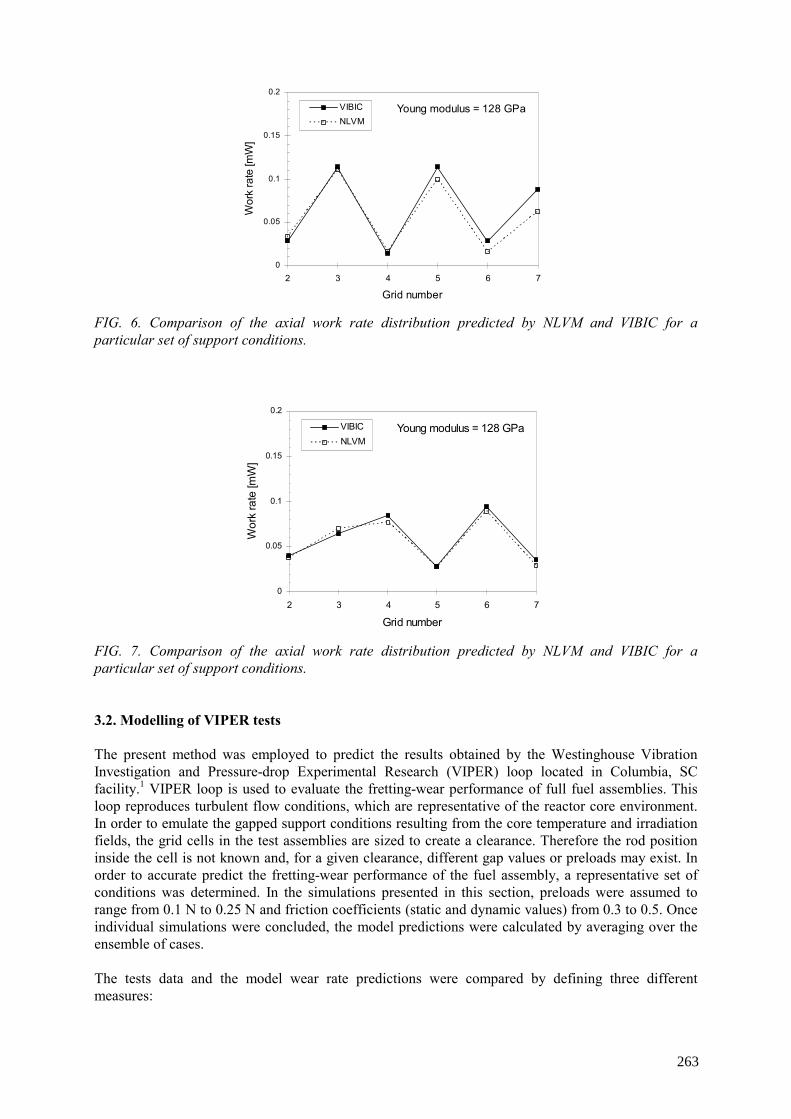
0
0.05
0.1
0.15
0.2
2 3 4 5 6 7
Grid number
Wor
k ra
te [m
W]
VIBICNLVM
Young modulus = 128 GPa
FIG. 6. Comparison of the axial work rate distribution predicted by NLVM and VIBIC for a particular set of support conditions.
0
0.05
0.1
0.15
0.2
2 3 4 5 6 7
Grid number
Wor
k ra
te [m
W]
VIBICNLVM
Young modulus = 128 GPa
FIG. 7. Comparison of the axial work rate distribution predicted by NLVM and VIBIC for a particular set of support conditions. 3.2. Modelling of VIPER tests The present method was employed to predict the results obtained by the Westinghouse Vibration Investigation and Pressure-drop Experimental Research (VIPER) loop located in Columbia, SC facility.1 VIPER loop is used to evaluate the fretting-wear performance of full fuel assemblies. This loop reproduces turbulent flow conditions, which are representative of the reactor core environment. In order to emulate the gapped support conditions resulting from the core temperature and irradiation fields, the grid cells in the test assemblies are sized to create a clearance. Therefore the rod position inside the cell is not known and, for a given clearance, different gap values or preloads may exist. In order to accurate predict the fretting-wear performance of the fuel assembly, a representative set of conditions was determined. In the simulations presented in this section, preloads were assumed to range from 0.1 N to 0.25 N and friction coefficients (static and dynamic values) from 0.3 to 0.5. Once individual simulations were concluded, the model predictions were calculated by averaging over the ensemble of cases. The tests data and the model wear rate predictions were compared by defining three different measures:
263

1. Wear rate Averaged on the Scar Counts (ASC), 2. Wear rate Averaged on the Worn Cells (AWC), 3. Wear rate Averaged on the Number of Cells (ANC). These measures were found to be useful for defining a meaningful norm to compare model and experimental results and also for understanding the rod-support conditions existing in the test. For example, small values of ANC and ASC may indicate small wear coefficients or excitation forces. On the contrary, small ANC and large ASC are more likely to occur when high preloads prevail in the supports thus preventing wear damage, except in a few unloaded cells. Due to the large uncertainties that exist in the system parameters such as wear coefficient, preloads, rod position, friction coefficients, stiffness, damping, etc., the implementation of the model was performed in two stages. In the first stage, the model predictions were compared to a representative collection of VIPER tests and one tuning parameter was calculated for each of the three wear averages in order to improve the quantitative agreement between the model results and the data. The statistical deviation of the tuning parameters indicated that they can be considered independent of test and grid design. Therefore they can be applied for predicting the performance of new fuel designs. In the second stage, the tuned model was applied to make a prediction for a new fuel assembly design. The prediction was performed before the test results were known. Examples of the results obtained in the first stage, (after the model has been tuned), are presented in FIG. 8 to FIG. 11. These results correspond to two different fuel designs (named designs A and B) with and without Intermediate Flow Mixers (IFMs). The wear rates were compared against the experimental data on a grid-by-grid basis and normalized to the mean wear rate for the assembly design A without IFMs. Generally speaking, a good agreement was found between the NLVM results and the experimental data. However, it is worth to note that in some cases (see FIG. 8 and FIG. 11), significant deviations exist between the test results and the model predictions. In addition for the design A without IFMs, large variations of the wear rates were measured along the grids while one should expect a nearly uniform wear rate as the flow conditions were approximately uniform. These deviations are attributed to variability of the system parameters; in particular support preloads and wear coefficients. The data variability can be estimated in the plots from the error bars.
0
1
2
3
0 2 4 6 8
Grid number
NLVM resultsTest results
Wea
r rat
e
Design A
FIG. 8. Axial wear rates distribution per grid for Fuel Design A without IFMs. Wear values are normalized to the total average test wear value of this design.
264
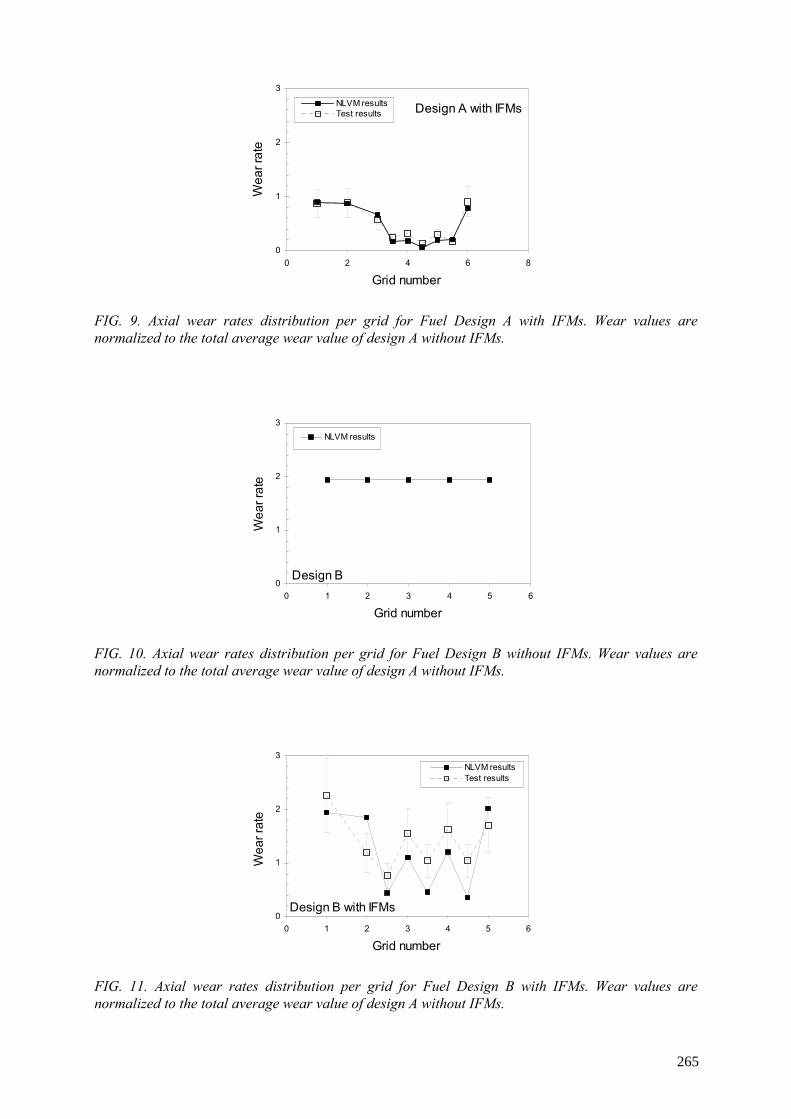
0
1
2
3
0 2 4 6 8
Grid number
NLVM resultsTest results
Wea
r rat
e
Design A with IFMs
FIG. 9. Axial wear rates distribution per grid for Fuel Design A with IFMs. Wear values are normalized to the total average wear value of design A without IFMs.
0
1
2
3
0 1 2 3 4 5 6
Grid number
NLVM results
Wea
r rat
e
Design B
FIG. 10. Axial wear rates distribution per grid for Fuel Design B without IFMs. Wear values are normalized to the total average wear value of design A without IFMs.
0
1
2
3
0 1 2 3 4 5 6
Grid number
NLVM resultsTest results
Wea
r rat
e
Design B with IFMs
FIG. 11. Axial wear rates distribution per grid for Fuel Design B with IFMs. Wear values are normalized to the total average wear value of design A without IFMs.
265
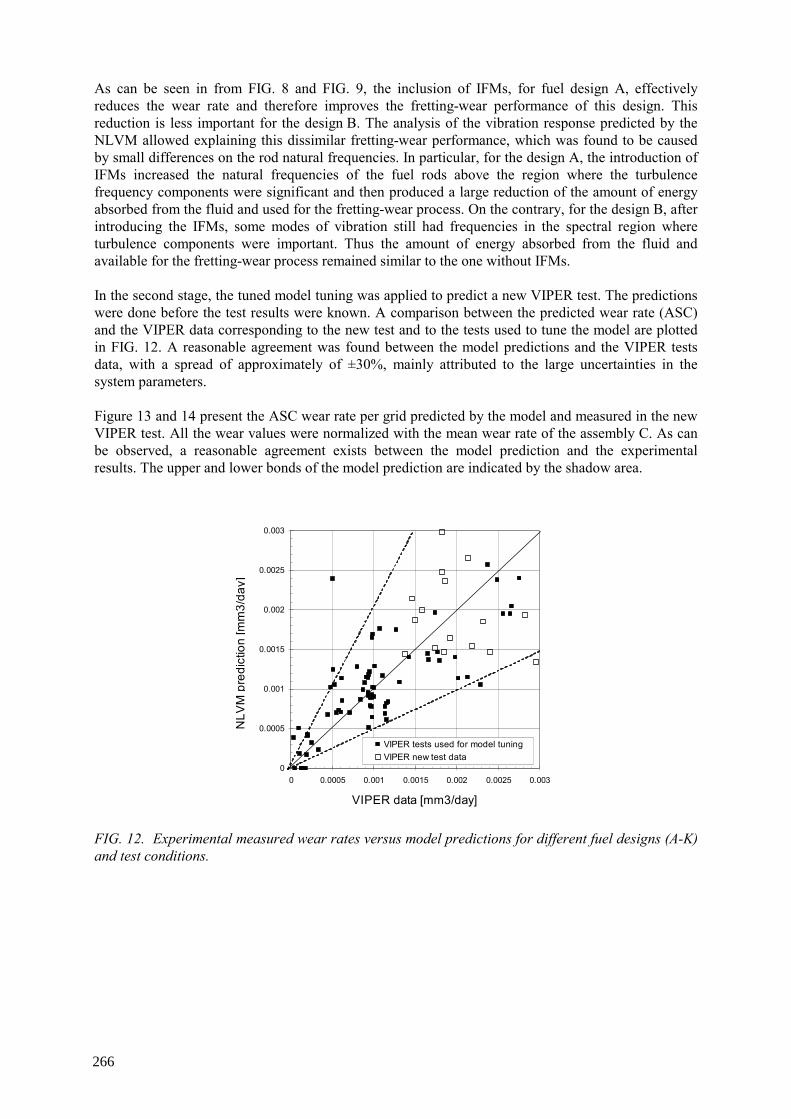
As can be seen in from FIG. 8 and FIG. 9, the inclusion of IFMs, for fuel design A, effectively reduces the wear rate and therefore improves the fretting-wear performance of this design. This reduction is less important for the design B. The analysis of the vibration response predicted by the NLVM allowed explaining this dissimilar fretting-wear performance, which was found to be caused by small differences on the rod natural frequencies. In particular, for the design A, the introduction of IFMs increased the natural frequencies of the fuel rods above the region where the turbulence frequency components were significant and then produced a large reduction of the amount of energy absorbed from the fluid and used for the fretting-wear process. On the contrary, for the design B, after introducing the IFMs, some modes of vibration still had frequencies in the spectral region where turbulence components were important. Thus the amount of energy absorbed from the fluid and available for the fretting-wear process remained similar to the one without IFMs. In the second stage, the tuned model tuning was applied to predict a new VIPER test. The predictions were done before the test results were known. A comparison between the predicted wear rate (ASC) and the VIPER data corresponding to the new test and to the tests used to tune the model are plotted in FIG. 12. A reasonable agreement was found between the model predictions and the VIPER tests data, with a spread of approximately of ±30%, mainly attributed to the large uncertainties in the system parameters. Figure 13 and 14 present the ASC wear rate per grid predicted by the model and measured in the new VIPER test. All the wear values were normalized with the mean wear rate of the assembly C. As can be observed, a reasonable agreement exists between the model prediction and the experimental results. The upper and lower bonds of the model prediction are indicated by the shadow area.
0
0.0005
0.001
0.0015
0.002
0.0025
0.003
0 0.0005 0.001 0.0015 0.002 0.0025 0.003
VIPER tests used for model tuningVIPER new test data
VIPER data [mm3/day]
NLV
M p
redi
ctio
n [ m
m3/
d ay]
FIG. 12. Experimental measured wear rates versus model predictions for different fuel designs (A-K) and test conditions.
266
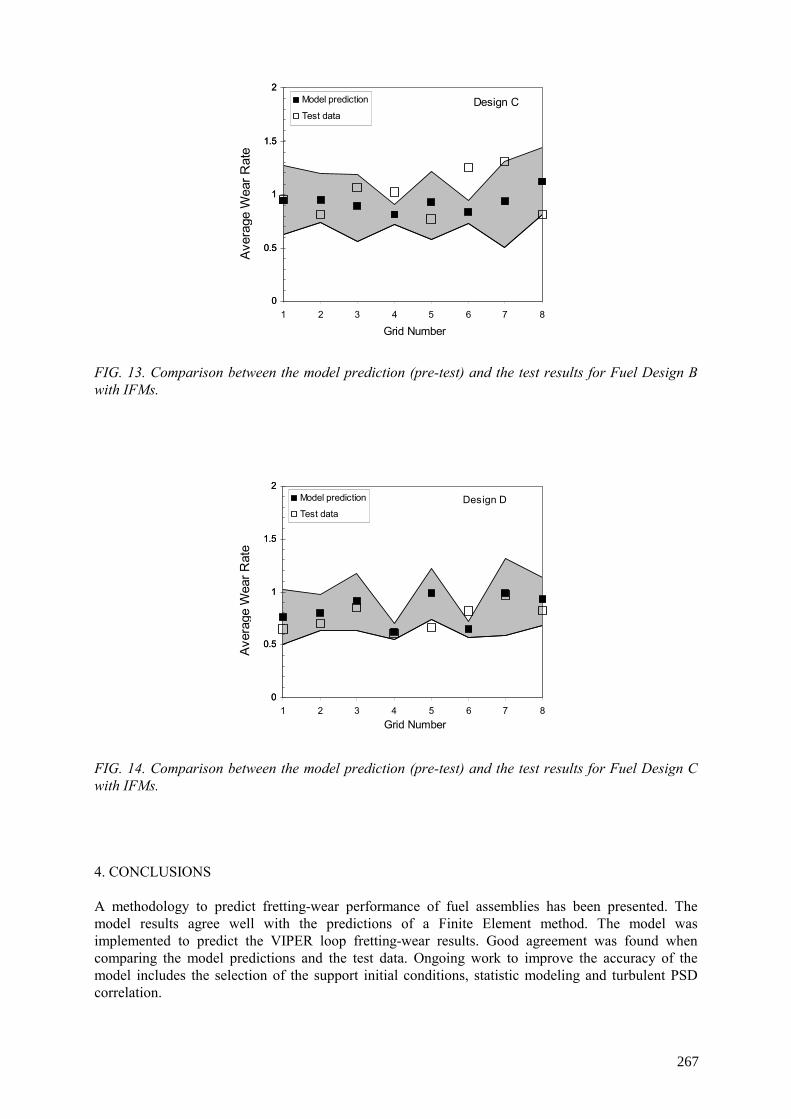
0
0.5
1
1.5
2
1 2 3 4 5 6 7 8
Aver
age
Wea
r Rat
e
Design C
0
0.5
1
1.5
2
1 2 3 4 5 6 7 8
Model prediction
Test data
Grid Number
FIG. 13. Comparison between the model prediction (pre-test) and the test results for Fuel Design B with IFMs.
0
0.5
1
1.5
2
1 2 3 4 5 6 7 8
Aver
age
Wea
r Rat
e
Design D
0
0.5
1
1.5
2
1 2 3 4 5 6 7 8
Model prediction
Test data
Grid Number
FIG. 14. Comparison between the model prediction (pre-test) and the test results for Fuel Design C with IFMs. 4. CONCLUSIONS A methodology to predict fretting-wear performance of fuel assemblies has been presented. The model results agree well with the predictions of a Finite Element method. The model was implemented to predict the VIPER loop fretting-wear results. Good agreement was found when comparing the model predictions and the test data. Ongoing work to improve the accuracy of the model includes the selection of the support initial conditions, statistic modeling and turbulent PSD correlation.
267
REFERENCES
[1] KING, S.J., et al., “Flow Induced Vibration and Fretting Wear in PWR Fuel”, Proceedings of ICONE-10, 10th International Conference on Nuclear Engineering, Arlington, USA (2002).
[2] PARAMONOV, D.V., et al., “Flow Induced Vibration And Fretting Wear: An Integrated Approach”, Proceedings of 5th FSI, AE & FIV+N Symposium, ASME Flow Induced Vibration 2002 Conference, USA (2002).
[3] RUBIOLO, P.R., “Non Linear Fuel Rod Vibration Model: Parametric Studies”, 2004 International Meeting on LWR Fuel Performance, USA (2004).
[4] RUBIOLO, P.R., PARAMONOV, D.V., "Study of Fuel Rod and Grid Supports Interaction", Proceedings of the ASME Pressure Vessel and Piping Conference, USA (2003).
[5] MEIROVITCH, L., Fundamentals of Vibrations, McGraw-Hill, New York (2001). [6] PARAMONOV, D.V., et al., “The Flow Field In A Reactor Core And Its Effect On Rod
Vibration And Wear”, Proceedings of Symposium on Flow-Induced Vibration-2001, ASME Pressure Vessels and Piping Conference, USA (2001).
[7] POMIRLEANU, R.O., “Mechanisms for flow-induced vibration of nuclear fuel rods”, 2004 International Meeting on LWR Fuel Performance, USA (2004).
[8] ROGERS, R.J., PICK, R.J., “On the Dynamic Spatial Response of a Heat Exchanger Tube with Intermittent Baffle Contacts”, Nuclear Engineering and Design 36 (1976) 81–90.
[9] ANTUNES, J., et al., “Coulomb Friction Modelling in Numerical Simulations of Vibration and Wear Work Rate of Multispan Tube Bundles”, Journal of Fluids and Structures 4 (1990) 287–304.
[10] RUBIOLO, P.R., "Effect of Support Conditions on the Vibration Behaviour of a Fuel Rods", 8th International Conference on Flow-Induced Vibrations, France (2004).
[11] PARAMONOV, D.V., et al., “Understanding Fretting Wear Progression”, Proceedings of the 2003 International Meeting on LWR Fuel Performance, Germany (2003).
[12] DAVIES, H.G., ROGERS, R.J., “The Vibration of Structures Elastically Constrained at Discrete Points”, Journal of Sound and Vibration 63 (1979) 437–447.
[13] ROGERS, R.J., PICK, R.J., “On the Dynamic Spatial Response of a Heat Exchanger Tube with Intermittent Baffle Contacts”, Nuclear Engineering and Design 36 (1976) 81–90.
268
ACCIDENT CONDITIONS EVALUATION AND MODELING
(Session 4)
B. LADOUCEUR France
V. MORI
France

FUEL ASSEMBLY DAMPING FOR ACCIDENT STUDIES: AN ANALYTICAL APPROACH B. LADOUCEUR AREVA FRAMATOME-ANP, Lyon J. WOILLEZ FLUOREM, Ecully M. FONTAINE Ecole Centrale, Lyon France Abstract The mechanical accident studies call for the use of assembly mechanical models, which must be fitted to reactor conditions. In such model, the assembly damping is of a first importance for assembly lateral response under seismic conditions. Different tests have shown that this damping is mainly due to fluid structure interaction forces, which are added to the mechanical damping of the structure. The purpose of this paper is to present an analytical approach which helps understanding the different phenomena involved in the hydraulic damping. Calculations were performed for harmonic movement of the rod bundle with parameterization on frequency and amplitude )sin(0 tXX ⋅⋅= ω in a range covering the assembly movement during seismic event. These calculations were performed with and without axial flow. The results show that the fluid structure interaction forces can be expressed by: )cos(0 ϕω +⋅⋅= tFF , from which can be deduced the water coupling mass and the water damping. 1. INTRODUCTION Accident events such as earthquake or LOCA call for the use of qualified structural models to predict the assembly lateral behaviour. These models represent the assembly physical properties such as lengths, mass, stiffness, frequencies, and also the fluid to structure interaction forces. The latter calls for the use of two-folded physical phenomena: a coupling mass and a damping. The damping term can be measured directly by pluck tests or harmonic excitation in air, still water and flowing water conditions, while the coupling mass can be accessed only indirectly, typically from natural frequencies. For given amplitude, the reduced damping values in cold conditions are typically 10% in air, 20% in still water, and 40 to 50% in flowing water. The figure 1 illustrates the main results obtained from loop tests and shows the strong effect of water flow.
271
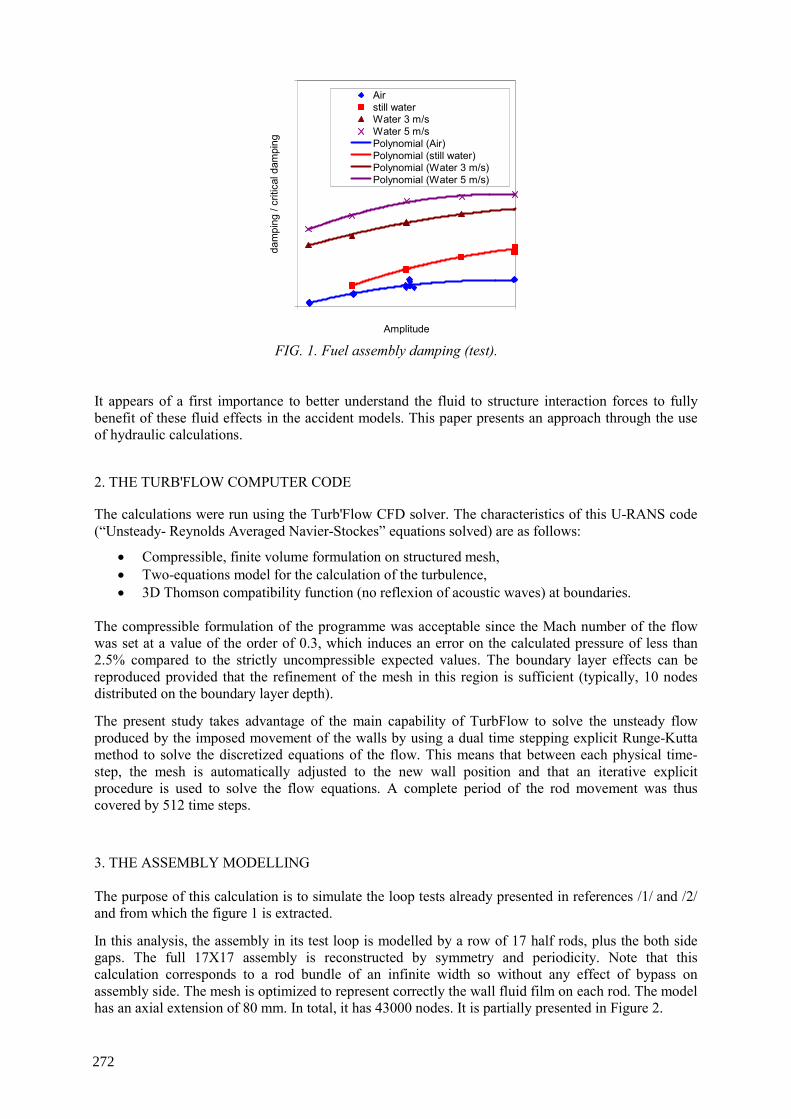
0
1
0 10Amplitude
dam
ping
/ cr
itica
l dam
ping
Airstill waterWater 3 m/sWater 5 m/sPolynomial (Air)Polynomial (still water)Polynomial (Water 3 m/s)Polynomial (Water 5 m/s)
FIG. 1. Fuel assembly damping (test).
It appears of a first importance to better understand the fluid to structure interaction forces to fully benefit of these fluid effects in the accident models. This paper presents an approach through the use of hydraulic calculations. 2. THE TURB'FLOW COMPUTER CODE The calculations were run using the Turb'Flow CFD solver. The characteristics of this U-RANS code (“Unsteady- Reynolds Averaged Navier-Stockes” equations solved) are as follows:
• Compressible, finite volume formulation on structured mesh, • Two-equations model for the calculation of the turbulence, • 3D Thomson compatibility function (no reflexion of acoustic waves) at boundaries.
The compressible formulation of the programme was acceptable since the Mach number of the flow was set at a value of the order of 0.3, which induces an error on the calculated pressure of less than 2.5% compared to the strictly uncompressible expected values. The boundary layer effects can be reproduced provided that the refinement of the mesh in this region is sufficient (typically, 10 nodes distributed on the boundary layer depth).
The present study takes advantage of the main capability of TurbFlow to solve the unsteady flow produced by the imposed movement of the walls by using a dual time stepping explicit Runge-Kutta method to solve the discretized equations of the flow. This means that between each physical time-step, the mesh is automatically adjusted to the new wall position and that an iterative explicit procedure is used to solve the flow equations. A complete period of the rod movement was thus covered by 512 time steps.
3. THE ASSEMBLY MODELLING The purpose of this calculation is to simulate the loop tests already presented in references /1/ and /2/ and from which the figure 1 is extracted.
In this analysis, the assembly in its test loop is modelled by a row of 17 half rods, plus the both side gaps. The full 17X17 assembly is reconstructed by symmetry and periodicity. Note that this calculation corresponds to a rod bundle of an infinite width so without any effect of bypass on assembly side. The mesh is optimized to represent correctly the wall fluid film on each rod. The model has an axial extension of 80 mm. In total, it has 43000 nodes. It is partially presented in Figure 2.
272

FIG. 2. Mesh of the rod row.
Note that, in a first step, the grids are not represented, although they are supposed to play a significant role in the total assembly damping. The fuel rod part of the model, considered as a rigid body, has a sine imposed movement of given amplitude and frequency. At each time step, the flow inlet boundary conditions are set equal to the outlet ones by secondary iterations. This means that the model represents the behaviour of a rod of an infinite length with a uniform single amplitude movement. The fluid characteristics correspond to water at RT conditions:
• Density = 1000 kg/m3, • Dynamic viscosity = 10–3 kg/m/s, • Fluid incompressible.
The axial velocity is defined as the average velocity over the total cross section of the model. 4. RESULTS The first result from these calculations is that the axial velocity is not evenly distributed in the flow channel: for an average value of 5 m/s, the velocity in the side gaps is nearly 9 m/s while it is only 4 m/s inside the rod bundle. This result, which was not unexpected is illustrated in figure 3.
FIG. 3. Stationary axial flow
The second result is that the forces induced by the pressure gradients are much higher (about 1000 times) than the viscous forces. This observation will help extrapolating the test results to hot conditions. The third result is that the pressure force resultant follows the rod velocity with a phase shift. These pressure forces are nearly identical for each rod, except for peripheral rods where they are slightly higher. This is illustrated in figures 4 and 5.
273
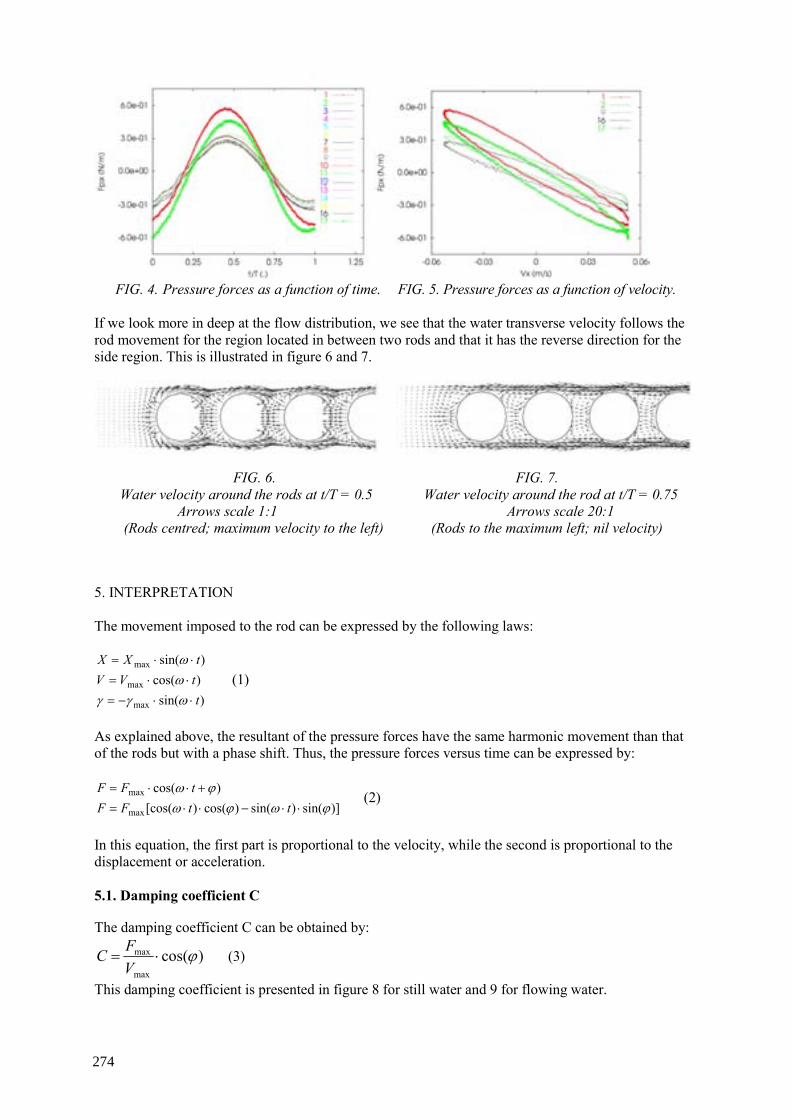
FIG. 4. Pressure forces as a function of time. FIG. 5. Pressure forces as a function of velocity.
If we look more in deep at the flow distribution, we see that the water transverse velocity follows the rod movement for the region located in between two rods and that it has the reverse direction for the side region. This is illustrated in figure 6 and 7.
FIG. 6. FIG. 7. Water velocity around the rods at t/T = 0.5 Water velocity around the rod at t/T = 0.75
Arrows scale 1:1 Arrows scale 20:1 (Rods centred; maximum velocity to the left) (Rods to the maximum left; nil velocity)
5. INTERPRETATION The movement imposed to the rod can be expressed by the following laws:
)sin()cos()sin(
max
max
max
ttVVtXX
⋅⋅−=⋅⋅=⋅⋅=
ωγγωω
(1)
As explained above, the resultant of the pressure forces have the same harmonic movement than that of the rods but with a phase shift. Thus, the pressure forces versus time can be expressed by:
)]sin()sin()cos()[cos()cos(
max
max
ϕωϕωϕω
⋅⋅−⋅⋅=+⋅⋅=
ttFFtFF
(2)
In this equation, the first part is proportional to the velocity, while the second is proportional to the displacement or acceleration. 5.1. Damping coefficient C The damping coefficient C can be obtained by:
)cos(max
max ϕ⋅=VFC (3)
This damping coefficient is presented in figure 8 for still water and 9 for flowing water.
274
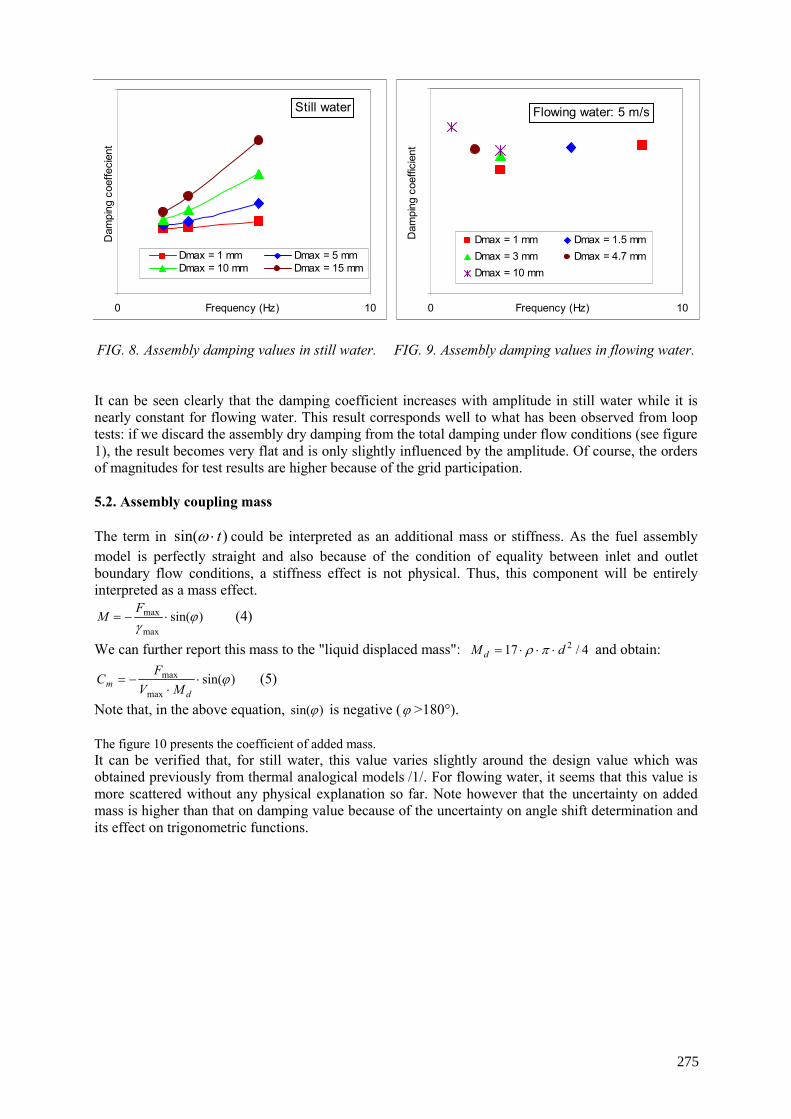
0
5000
0 10Frequency (Hz)
Dam
ping
coe
ffici
ent
Dmax = 1 mm Dmax = 1.5 mmDmax = 3 mm Dmax = 4.7 mmDmax = 10 mm
Flowing water: 5 m/s
0
000
0 10Frequency (Hz)
Dam
ping
coe
ffeci
ent
Dmax = 1 mm Dmax = 5 mmDmax = 10 mm Dmax = 15 mm
Still water
FIG. 8. Assembly damping values in still water. FIG. 9. Assembly damping values in flowing water.
It can be seen clearly that the damping coefficient increases with amplitude in still water while it is nearly constant for flowing water. This result corresponds well to what has been observed from loop tests: if we discard the assembly dry damping from the total damping under flow conditions (see figure 1), the result becomes very flat and is only slightly influenced by the amplitude. Of course, the orders of magnitudes for test results are higher because of the grid participation. 5.2. Assembly coupling mass The term in )sin( t⋅ω could be interpreted as an additional mass or stiffness. As the fuel assembly model is perfectly straight and also because of the condition of equality between inlet and outlet boundary flow conditions, a stiffness effect is not physical. Thus, this component will be entirely interpreted as a mass effect.
)sin(max
max ϕγ
⋅−=F
M (4)
We can further report this mass to the "liquid displaced mass": 4/17 2dM d ⋅⋅⋅= πρ and obtain:
)sin(max
max ϕ⋅⋅
−=d
m MVF
C (5)
Note that, in the above equation, )sin(ϕ is negative (ϕ >180°). The figure 10 presents the coefficient of added mass. It can be verified that, for still water, this value varies slightly around the design value which was obtained previously from thermal analogical models /1/. For flowing water, it seems that this value is more scattered without any physical explanation so far. Note however that the uncertainty on added mass is higher than that on damping value because of the uncertainty on angle shift determination and its effect on trigonometric functions.
275
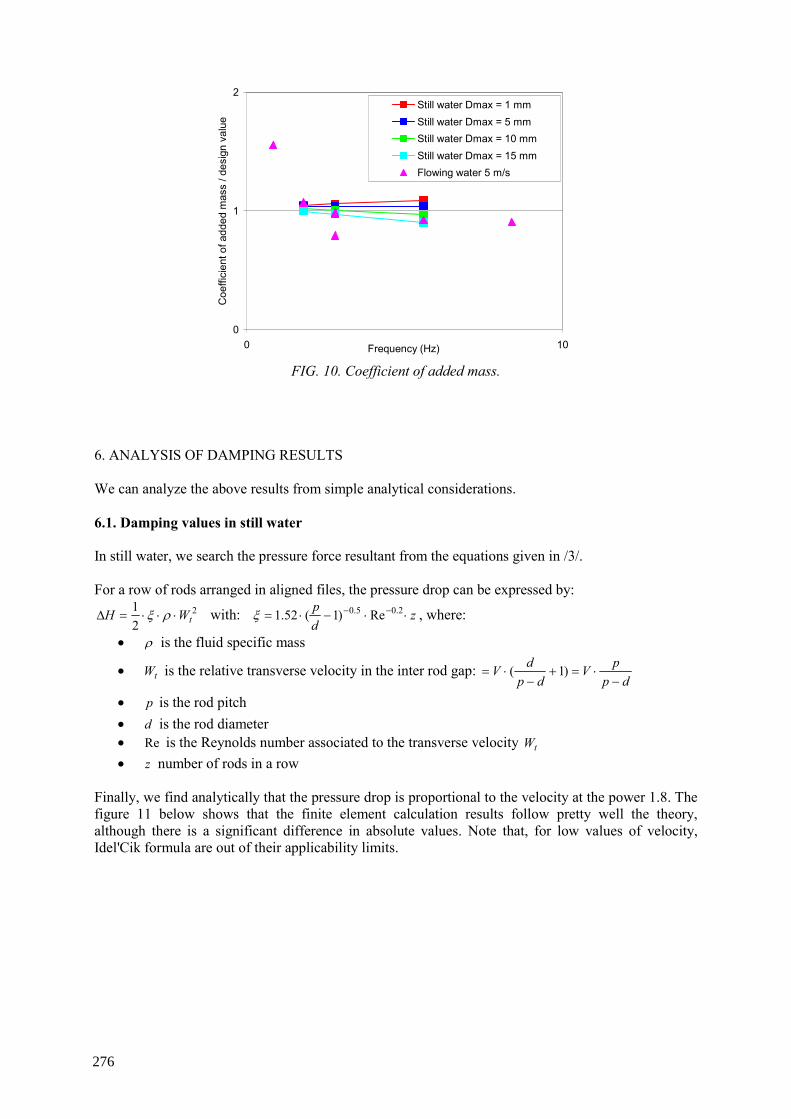
0
1
2
0 10Frequency (Hz)
Coe
ffici
ent o
f add
ed m
ass
/ des
ign
valu
e
Still water Dmax = 1 mmStill water Dmax = 5 mmStill water Dmax = 10 mmStill water Dmax = 15 mmFlowing water 5 m/s
FIG. 10. Coefficient of added mass.
6. ANALYSIS OF DAMPING RESULTS We can analyze the above results from simple analytical considerations. 6.1. Damping values in still water In still water, we search the pressure force resultant from the equations given in /3/. For a row of rods arranged in aligned files, the pressure drop can be expressed by:
2
21
tWH ⋅⋅⋅=∆ ρξ with: zdp
⋅⋅−⋅= −− 2.05.0 Re)1(52.1ξ , where:
• ρ is the fluid specific mass
• tW is the relative transverse velocity in the inter rod gap: dp
pVdp
dV−
⋅=+−
⋅= )1(
• p is the rod pitch • d is the rod diameter • Re is the Reynolds number associated to the transverse velocity tW • z number of rods in a row
Finally, we find analytically that the pressure drop is proportional to the velocity at the power 1.8. The figure 11 below shows that the finite element calculation results follow pretty well the theory, although there is a significant difference in absolute values. Note that, for low values of velocity, Idel'Cik formula are out of their applicability limits.
276
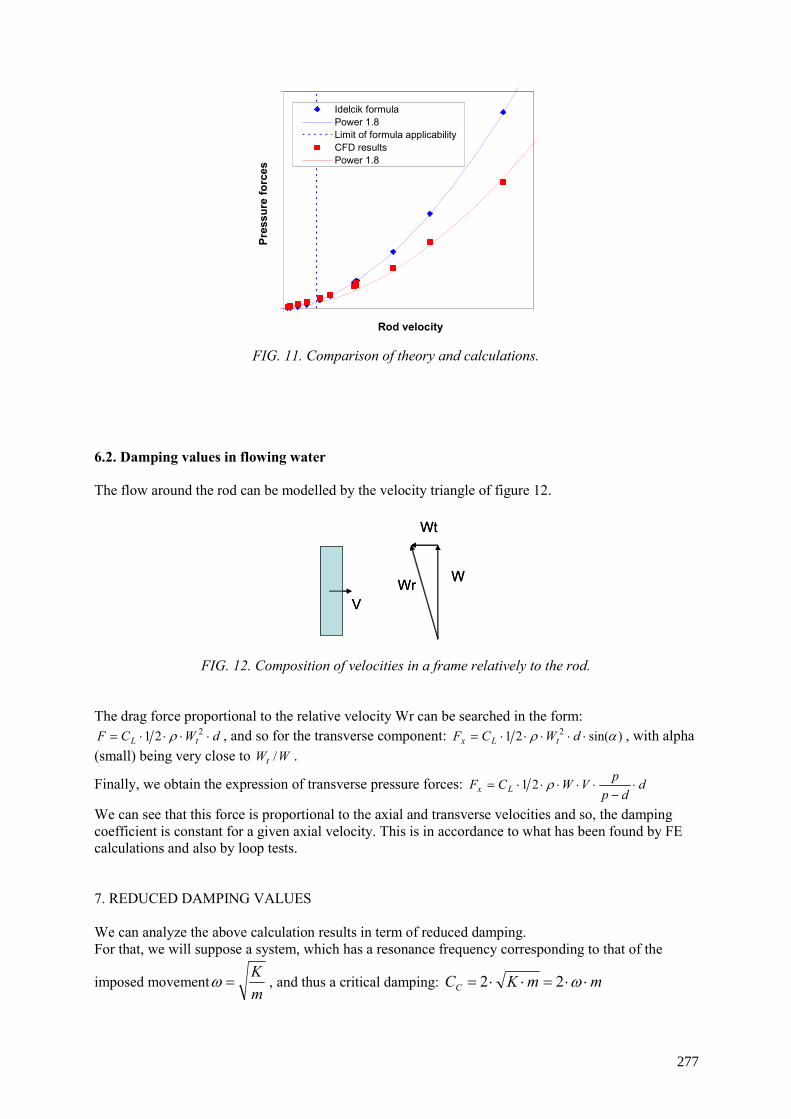
0
200
0 0.6Rod velocity
Pres
sure
forc
es
Idelcik formulaPower 1.8Limit of formula applicabilityCFD resultsPower 1.8
FIG. 11. Comparison of theory and calculations.
6.2. Damping values in flowing water The flow around the rod can be modelled by the velocity triangle of figure 12.
V
W
Wt
WrV
W
Wt
Wr
FIG. 12. Composition of velocities in a frame relatively to the rod. The drag force proportional to the relative velocity Wr can be searched in the form:
dWCF tL ⋅⋅⋅⋅= 221 ρ , and so for the transverse component: )sin(21 2 αρ ⋅⋅⋅⋅⋅= dWCF tLx , with alpha (small) being very close to WWt / .
Finally, we obtain the expression of transverse pressure forces: ddp
pVWCF Lx ⋅−
⋅⋅⋅⋅⋅= ρ21
We can see that this force is proportional to the axial and transverse velocities and so, the damping coefficient is constant for a given axial velocity. This is in accordance to what has been found by FE calculations and also by loop tests. 7. REDUCED DAMPING VALUES We can analyze the above calculation results in term of reduced damping. For that, we will suppose a system, which has a resonance frequency corresponding to that of the
imposed movementmK
=ω , and thus a critical damping: mmKCC ⋅⋅=⋅⋅= ω22
277
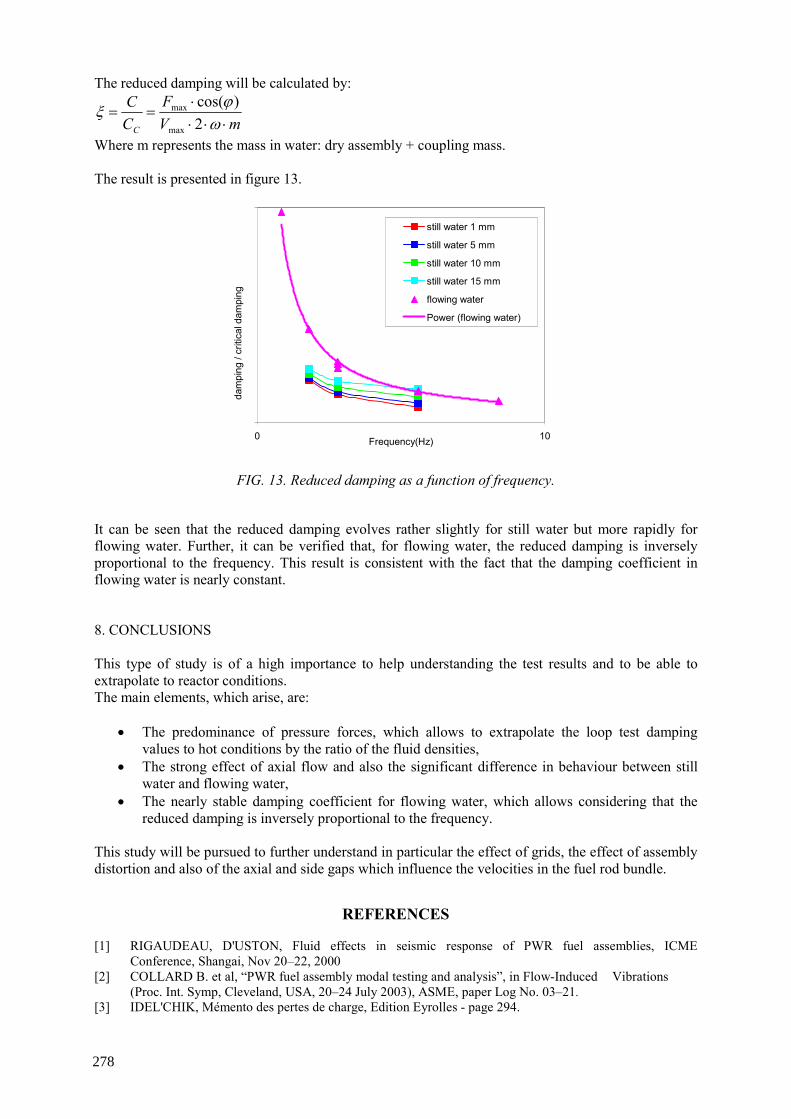
The reduced damping will be calculated by:
mVF
CC
C ⋅⋅⋅⋅
==ω
ϕξ2
)cos(
max
max
Where m represents the mass in water: dry assembly + coupling mass. The result is presented in figure 13.
0%
40%
0 10Frequency(Hz)
dam
ping
/ cr
itica
l dam
ping
still water 1 mm
still water 5 mm
still water 10 mm
still water 15 mm
flowing water
Power (flowing water)
FIG. 13. Reduced damping as a function of frequency.
It can be seen that the reduced damping evolves rather slightly for still water but more rapidly for flowing water. Further, it can be verified that, for flowing water, the reduced damping is inversely proportional to the frequency. This result is consistent with the fact that the damping coefficient in flowing water is nearly constant. 8. CONCLUSIONS This type of study is of a high importance to help understanding the test results and to be able to extrapolate to reactor conditions. The main elements, which arise, are:
• The predominance of pressure forces, which allows to extrapolate the loop test damping values to hot conditions by the ratio of the fluid densities,
• The strong effect of axial flow and also the significant difference in behaviour between still water and flowing water,
• The nearly stable damping coefficient for flowing water, which allows considering that the reduced damping is inversely proportional to the frequency.
This study will be pursued to further understand in particular the effect of grids, the effect of assembly distortion and also of the axial and side gaps which influence the velocities in the fuel rod bundle.
REFERENCES [1] RIGAUDEAU, D'USTON, Fluid effects in seismic response of PWR fuel assemblies, ICME Conference, Shangai, Nov 20–22, 2000 [2] COLLARD B. et al, “PWR fuel assembly modal testing and analysis”, in Flow-Induced Vibrations (Proc. Int. Symp, Cleveland, USA, 20–24 July 2003), ASME, paper Log No. 03–21. [3] IDEL'CHIK, Mémento des pertes de charge, Edition Eyrolles - page 294.
278
FLOW INDUCED DAMPING OF A PWR FUEL ASSEMBLY
B. COLLARD French Atomic Energy Commission/Nuclear Energy Directorate, Saint Paul lez Durance, France Abstract In the justification of the lateral strength of PWR fuel assemblies under seismic accident, the impact forces on grids are usually the most limiting ones. Knowledge of the fuel assembly behavior or kinematics is essential in order to compute these maximum loads. The aim of the study is to measure the mechanical characteristics of a fuel assembly in semi-realistic conditions and to extend these measurements to in-core environment. Both experimental tests and theoretical developments are necessary. We present the test conditions and the methods used to determine the fuel assembly characteristics. The nonlinear computations are introduced and commented.
1. CONTEXT The mechanical design of a PWR core must meet the safety requirements for seismic accidents or loss of coolant accidents. During such events, large fuel assembly displacements are induced either by the earthquake ground motions transmitted to the reactor core, or by the blowdown-produced pressure forces. The horizontal component of the motion causes lateral fuel assembly distortions and impacts at mixing grid levels between assemblies or with the core plates.
In order to prove the reliability of the control rod drop and of the core cooling, we must demonstrate that the mixing grid integrity is preserved. The mixing grid integrity (fuel assembly guide tube integrity), with respect to the impact forces, is more limiting than assembly distortions for control rod drop [3] [5].
Knowledge of the fuel assembly kinematics is essential to calculate the maximum loads. Therefore our study aims at characterizing the behavior of a fuel assembly under different fluid environments and when submitted to various excitations. 2. EXPERIMENTAL PROCEDURE Measurement tests on full-scale fuel assemblies under axial flow are performed in the CEA Hermes test facility presented in Figure 1. Cf. [6] for more information on the Hermes test facility and instrumentation. The first three modes of the system are directly excited by a hydraulic jack, which imposes a displacement of the structure. Two different sustained excitations are applied to the middle grid of the assembly. The first is a frequency sweep sinus, the second a random seismic like excitation within a range of 0–10 Hz.
A load cell measures the force applied on the assembly by the excitation system (co-located displacement and force measurement).
The main parameters that we must identify are the damping and the lateral stiffness of the fuel assembly in the flow.
2.1. Stiffness
The mechanical structure of the fuel assembly represents the main part of the system stiffness. The added fluid stiffness is not really significant. The effect of irradiation on the fuel assembly induces the softening of the structure due to the relaxation of the grid cells [1]. So we will characterize beginning-of-life (BOL) and end-of-life (EOL) or degraded assemblies (i.e. over end-of-life assemblies with degraded grid springs and dimples). The first way to measure this parameter is to perform quasi-static tests with very low charge and discharge cycles: this gives us a measurement of the quasi-static stiffness. Figure 2 presents such
279

results. We observe a significant softening (about 1/3 ratio, 6.7 daN/mm versus 2.2 daN/mm) of the degraded fuel assembly (FA) with respect to the BOL assembly. The important hysteresis of the system is observed. It results principally from friction between the fuel rods and the grid springs and dimples. We notice that the hysteresis decreases in degraded fuel assemblies, inducing a decrease in the structural damping.
280
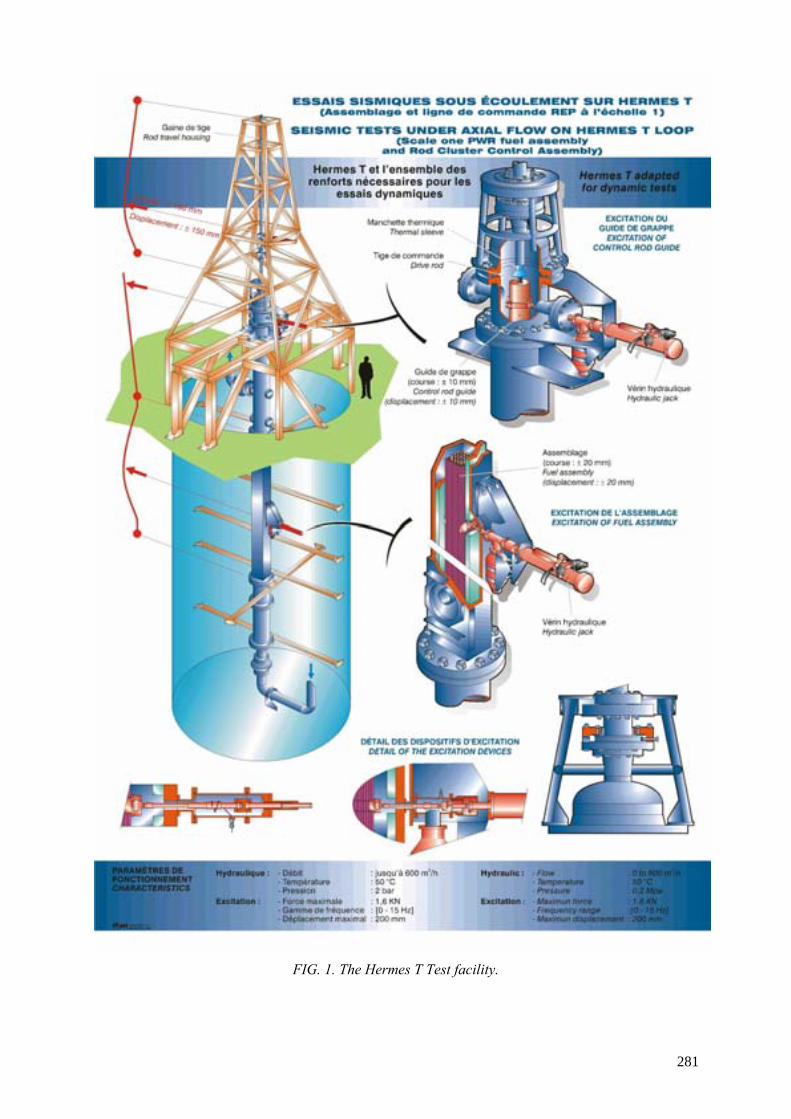
FIG. 1. The Hermes T Test facility.
281
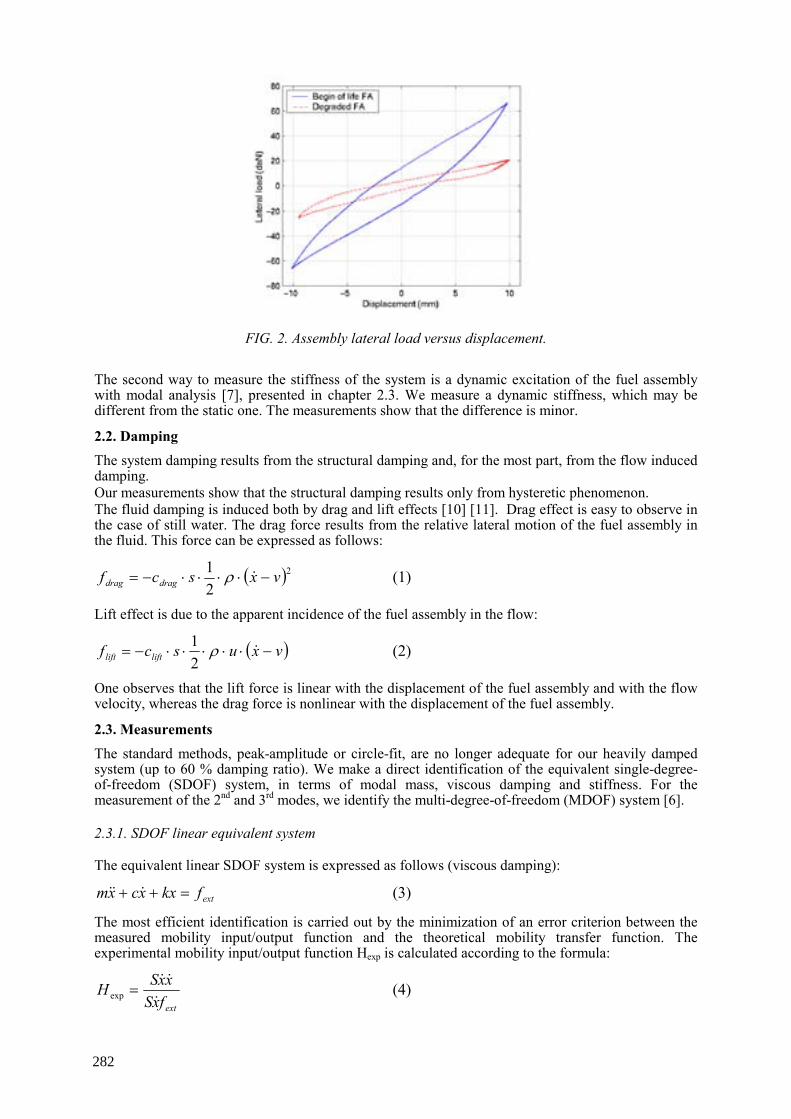
FIG. 2. Assembly lateral load versus displacement.
The second way to measure the stiffness of the system is a dynamic excitation of the fuel assembly with modal analysis [7], presented in chapter 2.3. We measure a dynamic stiffness, which may be different from the static one. The measurements show that the difference is minor.
2.2. Damping
The system damping results from the structural damping and, for the most part, from the flow induced damping. Our measurements show that the structural damping results only from hysteretic phenomenon. The fluid damping is induced both by drag and lift effects [10] [11]. Drag effect is easy to observe in the case of still water. The drag force results from the relative lateral motion of the fuel assembly in the fluid. This force can be expressed as follows:
( )221 vxscf dragdrag −⋅⋅⋅⋅−= ρ (1)
Lift effect is due to the apparent incidence of the fuel assembly in the flow:
( )vxuscf liftlift −⋅⋅⋅⋅⋅−= ρ21 (2)
One observes that the lift force is linear with the displacement of the fuel assembly and with the flow velocity, whereas the drag force is nonlinear with the displacement of the fuel assembly.
2.3. Measurements
The standard methods, peak-amplitude or circle-fit, are no longer adequate for our heavily damped system (up to 60 % damping ratio). We make a direct identification of the equivalent single-degree-of-freedom (SDOF) system, in terms of modal mass, viscous damping and stiffness. For the measurement of the 2nd and 3rd modes, we identify the multi-degree-of-freedom (MDOF) system [6]. 2.3.1. SDOF linear equivalent system The equivalent linear SDOF system is expressed as follows (viscous damping):
extfkxxcxm =++ (3)
The most efficient identification is carried out by the minimization of an error criterion between the measured mobility input/output function and the theoretical mobility transfer function. The experimental mobility input/output function Hexp is calculated according to the formula:
extfxSxxSH =exp (4)
282
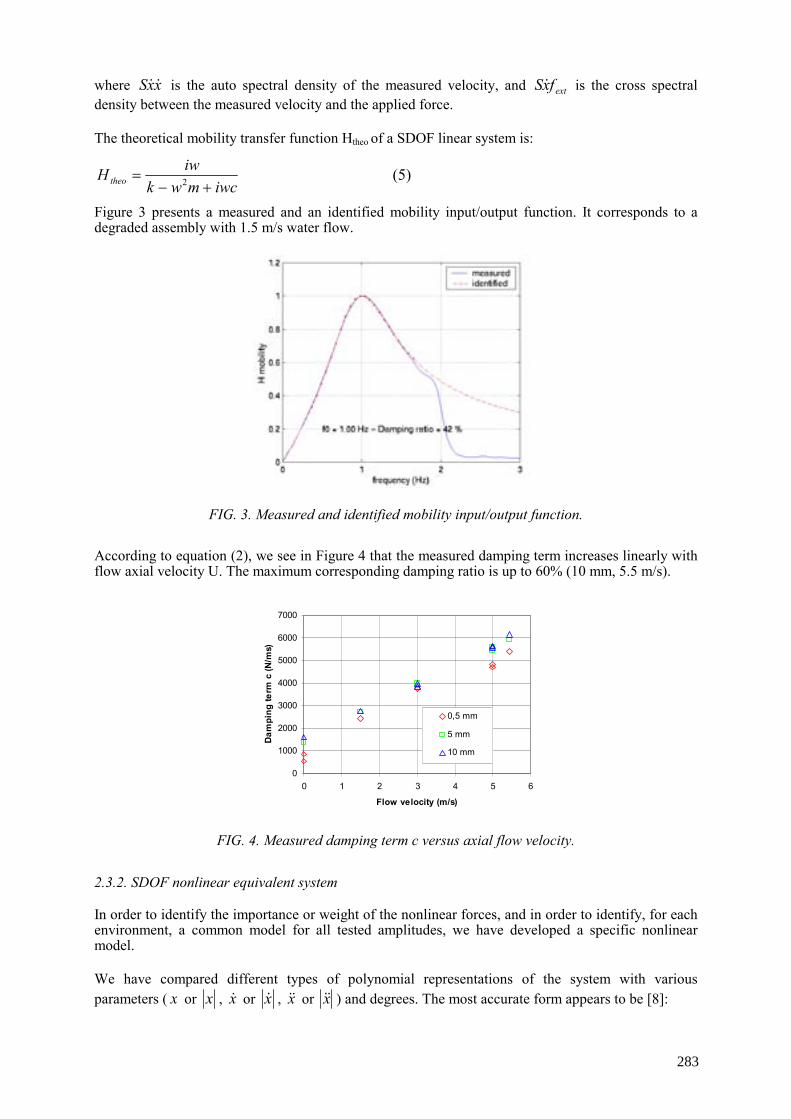
where xxS is the auto spectral density of the measured velocity, and extfxS is the cross spectral density between the measured velocity and the applied force. The theoretical mobility transfer function Htheo of a SDOF linear system is:
iwcmwkiwHtheo +−
= 2 (5)
Figure 3 presents a measured and an identified mobility input/output function. It corresponds to a degraded assembly with 1.5 m/s water flow.
FIG. 3. Measured and identified mobility input/output function.
According to equation (2), we see in Figure 4 that the measured damping term increases linearly with flow axial velocity U. The maximum corresponding damping ratio is up to 60% (10 mm, 5.5 m/s).
0
1000
2000
3000
4000
5000
6000
7000
0 1 2 3 4 5 6
Flow velocity (m/s)
Dam
ping
term
c (N
/ms)
0,5 mm
5 mm
10 mm
FIG. 4. Measured damping term c versus axial flow velocity.
2.3.2. SDOF nonlinear equivalent system In order to identify the importance or weight of the nonlinear forces, and in order to identify, for each environment, a common model for all tested amplitudes, we have developed a specific nonlinear model.
We have compared different types of polynomial representations of the system with various parameters ( x or x , x or x , x or x ) and degrees. The most accurate form appears to be [8]:
283
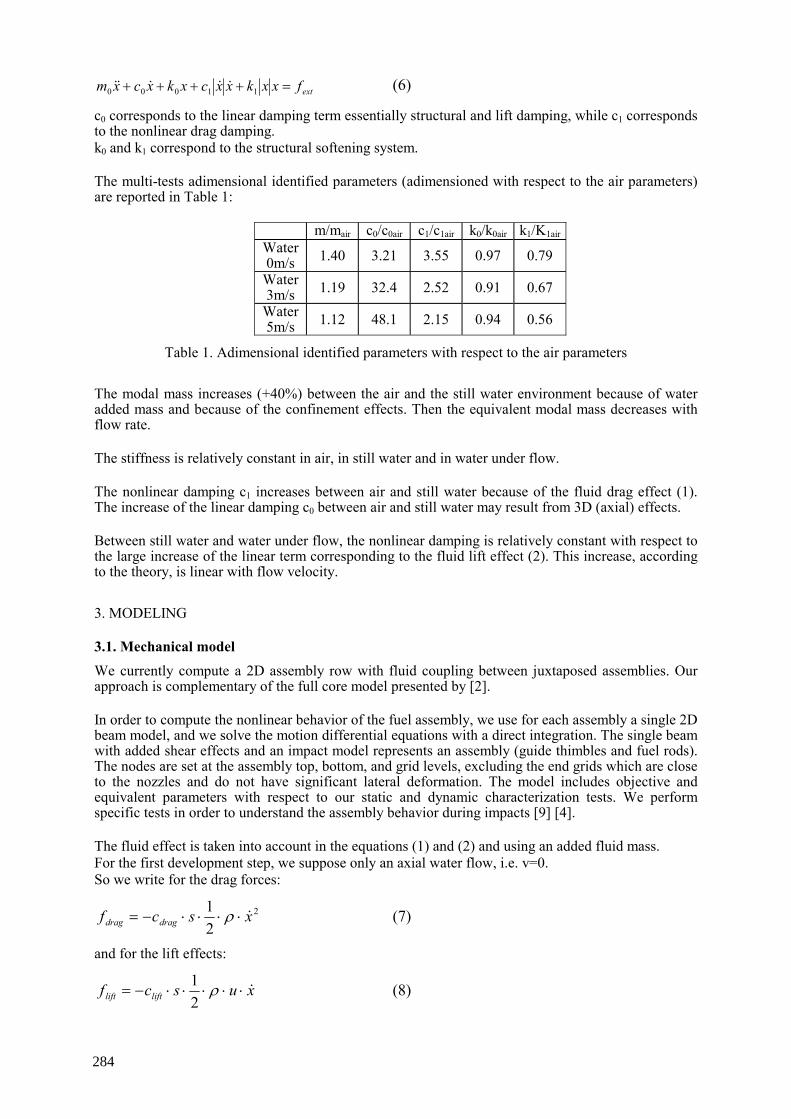
extfxxkxxcxkxcxm =++++ 11000 (6)
c0 corresponds to the linear damping term essentially structural and lift damping, while c1 corresponds to the nonlinear drag damping. k0 and k1 correspond to the structural softening system. The multi-tests adimensional identified parameters (adimensioned with respect to the air parameters) are reported in Table 1:
m/mair c0/c0air c1/c1air k0/k0air k1/K1air Water 0m/s 1.40 3.21 3.55 0.97 0.79
Water 3m/s 1.19 32.4 2.52 0.91 0.67
Water 5m/s 1.12 48.1 2.15 0.94 0.56
Table 1. Adimensional identified parameters with respect to the air parameters
The modal mass increases (+40%) between the air and the still water environment because of water added mass and because of the confinement effects. Then the equivalent modal mass decreases with flow rate. The stiffness is relatively constant in air, in still water and in water under flow. The nonlinear damping c1 increases between air and still water because of the fluid drag effect (1). The increase of the linear damping c0 between air and still water may result from 3D (axial) effects. Between still water and water under flow, the nonlinear damping is relatively constant with respect to the large increase of the linear term corresponding to the fluid lift effect (2). This increase, according to the theory, is linear with flow velocity.
3. MODELING
3.1. Mechanical model
We currently compute a 2D assembly row with fluid coupling between juxtaposed assemblies. Our approach is complementary of the full core model presented by [2]. In order to compute the nonlinear behavior of the fuel assembly, we use for each assembly a single 2D beam model, and we solve the motion differential equations with a direct integration. The single beam with added shear effects and an impact model represents an assembly (guide thimbles and fuel rods). The nodes are set at the assembly top, bottom, and grid levels, excluding the end grids which are close to the nozzles and do not have significant lateral deformation. The model includes objective and equivalent parameters with respect to our static and dynamic characterization tests. We perform specific tests in order to understand the assembly behavior during impacts [9] [4]. The fluid effect is taken into account in the equations (1) and (2) and using an added fluid mass. For the first development step, we suppose only an axial water flow, i.e. v=0. So we write for the drag forces:
2
21 xscf dragdrag ⋅⋅⋅⋅−= ρ (7)
and for the lift effects:
xuscf liftlift ⋅⋅⋅⋅⋅−= ρ21 (8)
284
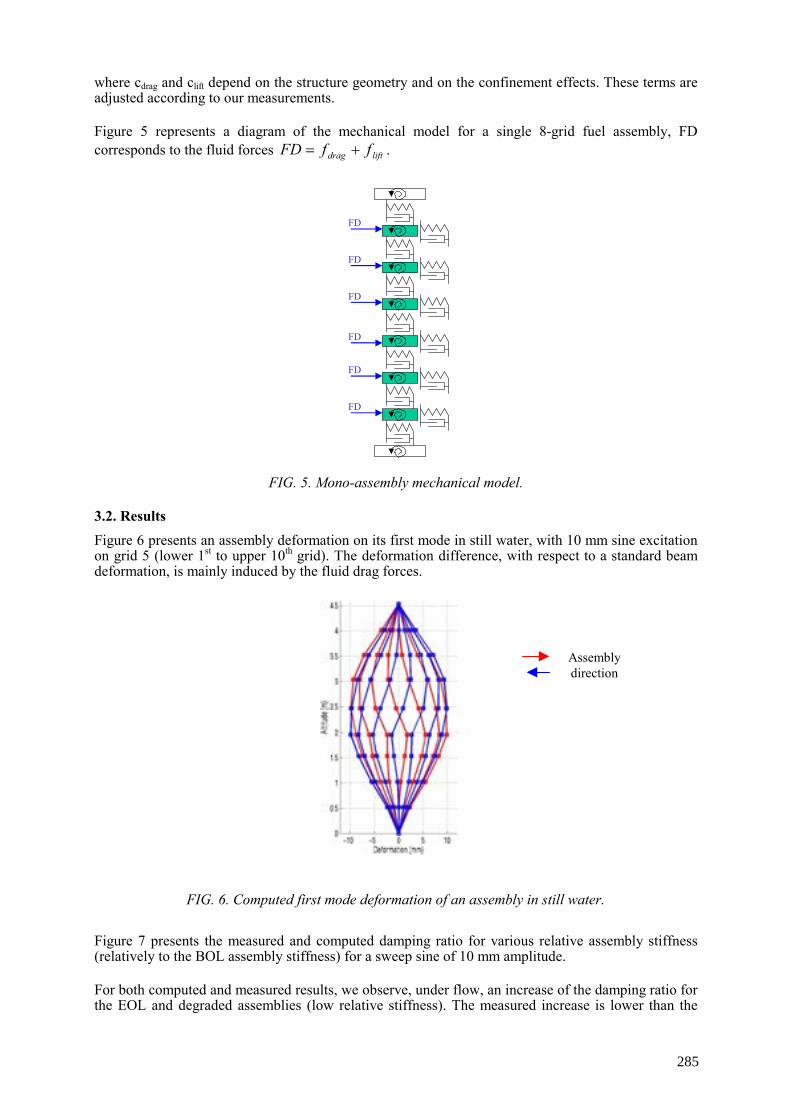
where cdrag and clift depend on the structure geometry and on the confinement effects. These terms are adjusted according to our measurements. Figure 5 represents a diagram of the mechanical model for a single 8-grid fuel assembly, FD corresponds to the fluid forces liftdrag ffFD += .
FD
FD
FD
FD
FD
FD
FIG. 5. Mono-assembly mechanical model.
3.2. Results
Figure 6 presents an assembly deformation on its first mode in still water, with 10 mm sine excitation on grid 5 (lower 1st to upper 10th grid). The deformation difference, with respect to a standard beam deformation, is mainly induced by the fluid drag forces.
FIG. 6. Computed first mode deformation of an assembly in still water.
Figure 7 presents the measured and computed damping ratio for various relative assembly stiffness (relatively to the BOL assembly stiffness) for a sweep sine of 10 mm amplitude. For both computed and measured results, we observe, under flow, an increase of the damping ratio for the EOL and degraded assemblies (low relative stiffness). The measured increase is lower than the
Assembly direction
285
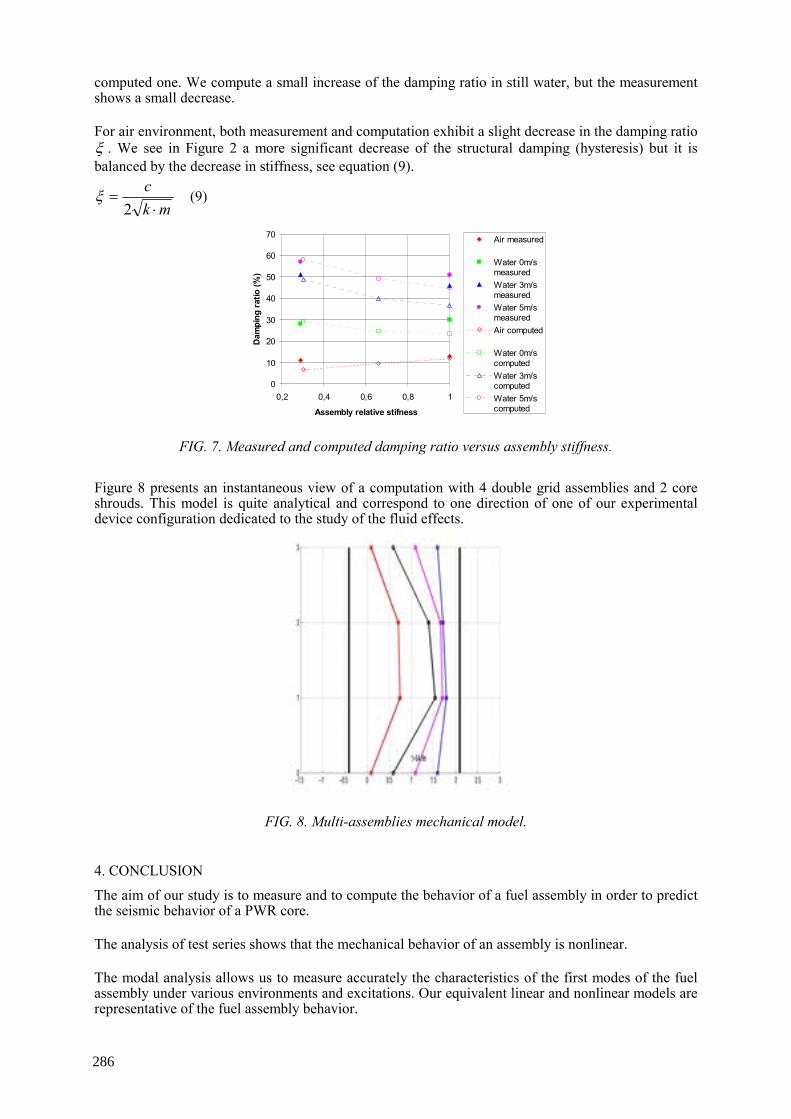
computed one. We compute a small increase of the damping ratio in still water, but the measurement shows a small decrease. For air environment, both measurement and computation exhibit a slight decrease in the damping ratio ξ . We see in Figure 2 a more significant decrease of the structural damping (hysteresis) but it is balanced by the decrease in stiffness, see equation (9).
mkc⋅
=2
ξ (9)
0
10
20
30
40
50
60
70
0,2 0,4 0,6 0,8 1
Assembly relative stifness
Dam
ping
ratio
(%)
Air measured
Water 0m/smeasuredWater 3m/smeasuredWater 5m/smeasuredAir computed
Water 0m/scomputedWater 3m/scomputedWater 5m/scomputed
FIG. 7. Measured and computed damping ratio versus assembly stiffness.
Figure 8 presents an instantaneous view of a computation with 4 double grid assemblies and 2 core shrouds. This model is quite analytical and correspond to one direction of one of our experimental device configuration dedicated to the study of the fluid effects.
FIG. 8. Multi-assemblies mechanical model.
4. CONCLUSION
The aim of our study is to measure and to compute the behavior of a fuel assembly in order to predict the seismic behavior of a PWR core. The analysis of test series shows that the mechanical behavior of an assembly is nonlinear. The modal analysis allows us to measure accurately the characteristics of the first modes of the fuel assembly under various environments and excitations. Our equivalent linear and nonlinear models are representative of the fuel assembly behavior.
286
In order to increase the efficiency of the models and to obtain a better understanding of the assemblies and fluid system, a research and development program is now underway in the CEA laboratories. We focus in particular on the fluid effects and on the hydrodynamic coupling.
5. NOMENCLATURE
c : Viscous damping
dragc : Fluid drag coefficient
liftc : Fluid lift coefficient
extf : External force
dragf : Fluid drag force
liftf : Fluid lift force k : Stiffness m : Modal mass s : Reference surface u : Axial velocity of the fluid v : Transverse velocity of the fluid w : Pulsation x : Lateral position of the fuel assembly x : Transverse velocity of the fuel assembly x : Transverse acceleration of the fuel assembly ξ : Damping ratio ρ : Density of the fluid
REFERENCES
[1] BILLEREY A., 2003, “Evolution of the fuel rod support under irradiation and its impact on the mechanical behavior of the fuel assemblies” in Nuclear Engineering (Proc. 11th Int. Conf , Tokyo, 2003, ICONE-11), JSME/ASME, Tokyo, 2003, CD-ROM, paper 36073. [2] BROC D. et al, 2004, “Seismic behavior of PWR reactors cores, whole core model with fluid structure interaction effects”, Flow-Induced Vibrations, FIV-2004 (Proc. 8th Int. Conf. Paris, France, 6–9 July 2004), SHF, Paris, CD-ROM. [3] COLLARD B., “RRCA drop kinetics test, calculation, and analysis. Abnormal friction force evaluation”, in Nuclear Engineering (Proc. 7th Int. Conf, Tokyo, 1999, ICONE-7, JSME/ASME, Tokyo, 1999, paper 7386. [4] COLLARD B., VALLORY J., et al, “Impact forces on a core shroud of an excited PWR fuel assembly”, in Nuclear Engineering (Proc. 9th Int. Conf, Nice, France, 8–12 April 2001), SFEN, 2001, CD-ROM. [5] COLLARD B., “Rod cluster control assembly drop kinetics with seismic excitation”, in Nuclear Engineering (Proc. 11th Int. Conf, Tokyo, 2003, ICONE-11), JSME/ASME, Tokyo, 2003, CD-ROM, paper 36419. [6] COLLARD B. et al, “PWR fuel assembly modal testing and analysis”, in Flow-Induced Vibrations (Proc. Int. Symp, Cleveland, USA, 20–24 July 2003), ASME, paper Log No. 03- 21. [7] EWINS D.J., Modal Testing: Theory and Practice, Research Studies Press LTD. [8] PISAPIA S. et al, “Modal testing and identification of a PWR fuel assembly” in Structural Mechanics in Reactor Technology (Proc. 17 Int. Conf. SMIRT-17, Prague, Czech Rep., 17–22 August 2003), IASMIRT, Prague, 2003, paper Log #C01-4. [9] QUEVAL J.C. et al, “Seismic tests of interacting full-scale fuel assemblies on shaking table”, in Structural Mechanics in Reactor Technology (Proc. 16 Int. Conf. SMIRT-16, Washington D.C., USA, 12–17 August 2001), Transactions IASMIRT, Paper Log #1691.
287

[10] VIALLET E. et al, “Prediction of flow induced damping of a PWR fuel assembly in case of seismic and LOCA case”, in Structural Mechanics in Reactor Technology (Proc. 17 Int. Conf. SMIRT-17, Prague, Czech Rep., 17–22 August 2003), IASMIRT, Prague, 2003, paper Log #C01-1. [11] VIALLET E. et al, “Validation of PWR core seismic models with shaking table tests on interacting scale 1 fuel assemblies”, in Structural Mechanics in Reactor Technology (Proc. 17 Int. Conf. SMIRT-17, Prague, Czech Rep., 17–22 August 2003), IASMIRT, Prague, 2003, paper Log #C01-2.
288
RESULTS OF CRUSH TESTS PERFORMED ON IRRADIATED PWR ZIRCALOY-4 SPACER GRIDS P. YVON∗, R. SCHILL, P. COFFRE, X. AVERTY DMN/SEMI, CEA Saclay, Gif/Yvette J. RIGAUDEAU, B. D'USTON Framatome ANP, Lyon A. BILLEREY EDF SEPTEN, Villeurbanne France Abstract
The resistance of Pressurized Water Reactor (PWR) spacer grids to accidental impact loads has been determined up to now from tests on non-irradiated grids. The justification for this, is based on considerations about grid strap mechanical properties which are increased by irradiation and thus beginning of life results are expected to bound all situations. However, EDF and FRAMATOME-ANP launched a test program in 1995 to quantify the impact of irradiation on the buckling response of PWR fuel assembly grids. Spacer grids irradiated for 1 and 4 cycles in a French 900 MW reactor have undergone buckling tests in hot cells at CEA-SACLAY. In addition to the determination of crush limit, special attention was paid to the dummy rod insertion and extraction forces. The first conclusion is that after the test, the grids remain sound with very few defects at strap intersections, even in the case of a displacement of 15 mm. Therefore the grids keep sufficient ductility to accommodate large distortions. In addition, the crush limit for irradiated grids is somewhat smaller than that of fresh grids: about 25% for 1-cycle grids and 40% for 4-cycle grids. This reduction is attributed at the first order to grid spring relaxation.
Keywords: spacer grids, irradiation, stability, crush tests, Zircaloy-4 1. INTRODUCTION
The grid resistance to accident event impact loads has been determined so far from tests on non-irradiated grids. The justification for this, presented in the Standard Review Plan, is based on considerations about grid strap mechanical properties, which are increased by irradiation and thus that we expected beginning of life (BOL) results to bound all situations. In 1995, EDF and FRAMATOME-ANP decided to set up a test to evaluate the response of irradiated PWR fuel assembly grids under lateral impact. This summary report presents the tests and test results obtained for irradiated grids from a French 900 MW reactor, which have undergone buckling tests in hot cells at CEA-SACLAY.
∗ Phone: (+33) 1 69 08 41 17, Fax: (+33) 1 69 08 26 81 e-mail: [email protected]
289
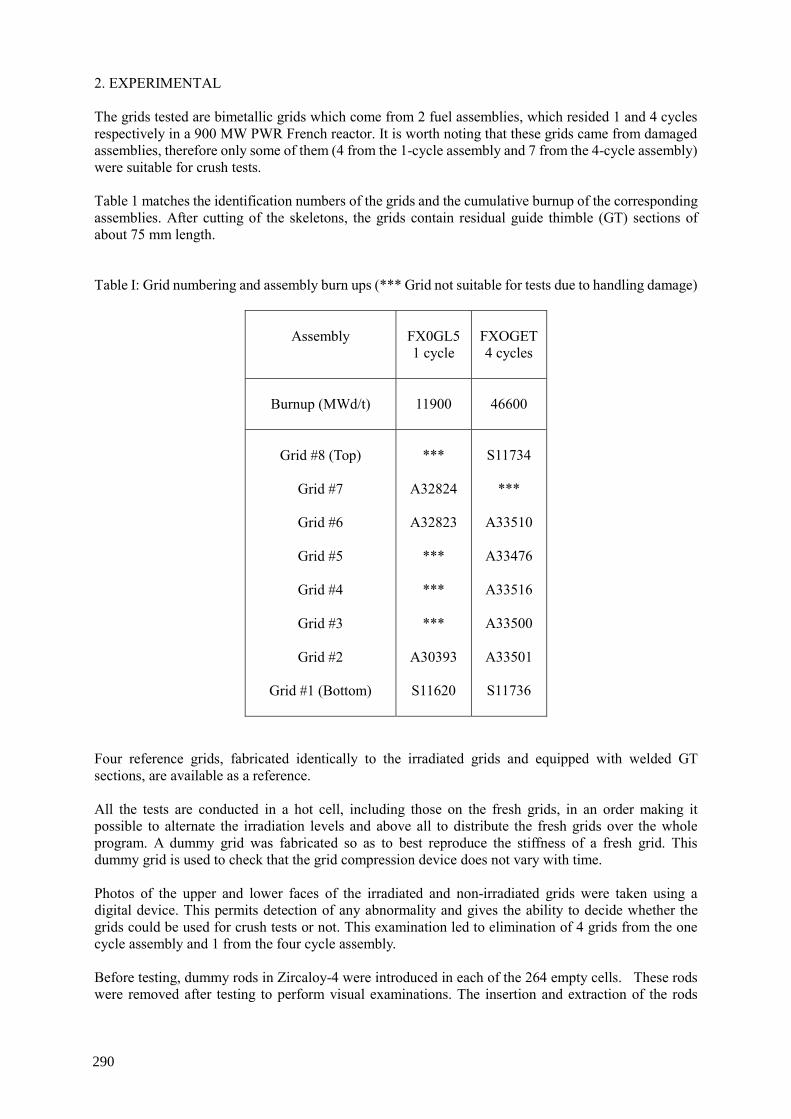
2. EXPERIMENTAL
The grids tested are bimetallic grids which come from 2 fuel assemblies, which resided 1 and 4 cycles respectively in a 900 MW PWR French reactor. It is worth noting that these grids came from damaged assemblies, therefore only some of them (4 from the 1-cycle assembly and 7 from the 4-cycle assembly) were suitable for crush tests. Table 1 matches the identification numbers of the grids and the cumulative burnup of the corresponding assemblies. After cutting of the skeletons, the grids contain residual guide thimble (GT) sections of about 75 mm length. Table I: Grid numbering and assembly burn ups (*** Grid not suitable for tests due to handling damage)
Assembly
FX0GL5 1 cycle
FXOGET 4 cycles
Burnup (MWd/t)
11900
46600
Grid #8 (Top)
Grid #7
Grid #6
Grid #5
Grid #4
Grid #3
Grid #2
Grid #1 (Bottom)
***
A32824
A32823
***
***
***
A30393
S11620
S11734
***
A33510
A33476
A33516
A33500
A33501
S11736
Four reference grids, fabricated identically to the irradiated grids and equipped with welded GT sections, are available as a reference.
All the tests are conducted in a hot cell, including those on the fresh grids, in an order making it possible to alternate the irradiation levels and above all to distribute the fresh grids over the whole program. A dummy grid was fabricated so as to best reproduce the stiffness of a fresh grid. This dummy grid is used to check that the grid compression device does not vary with time. Photos of the upper and lower faces of the irradiated and non-irradiated grids were taken using a digital device. This permits detection of any abnormality and gives the ability to decide whether the grids could be used for crush tests or not. This examination led to elimination of 4 grids from the one cycle assembly and 1 from the four cycle assembly. Before testing, dummy rods in Zircaloy-4 were introduced in each of the 264 empty cells. These rods were removed after testing to perform visual examinations. The insertion and extraction of the rods
290
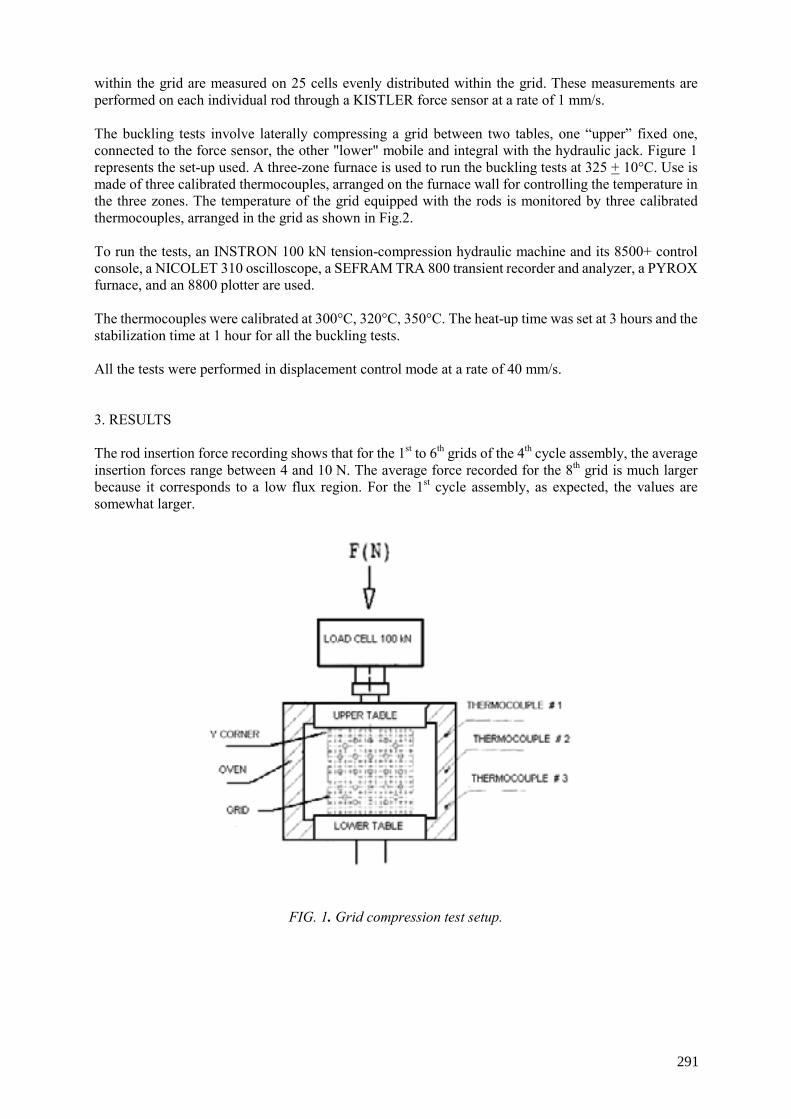
within the grid are measured on 25 cells evenly distributed within the grid. These measurements are performed on each individual rod through a KISTLER force sensor at a rate of 1 mm/s.
The buckling tests involve laterally compressing a grid between two tables, one “upper” fixed one, connected to the force sensor, the other "lower" mobile and integral with the hydraulic jack. Figure 1 represents the set-up used. A three-zone furnace is used to run the buckling tests at 325 + 10°C. Use is made of three calibrated thermocouples, arranged on the furnace wall for controlling the temperature in the three zones. The temperature of the grid equipped with the rods is monitored by three calibrated thermocouples, arranged in the grid as shown in Fig.2. To run the tests, an INSTRON 100 kN tension-compression hydraulic machine and its 8500+ control console, a NICOLET 310 oscilloscope, a SEFRAM TRA 800 transient recorder and analyzer, a PYROX furnace, and an 8800 plotter are used. The thermocouples were calibrated at 300°C, 320°C, 350°C. The heat-up time was set at 3 hours and the stabilization time at 1 hour for all the buckling tests. All the tests were performed in displacement control mode at a rate of 40 mm/s.
3. RESULTS
The rod insertion force recording shows that for the 1st to 6th grids of the 4th cycle assembly, the average insertion forces range between 4 and 10 N. The average force recorded for the 8th grid is much larger because it corresponds to a low flux region. For the 1st cycle assembly, as expected, the values are somewhat larger.
FIG. 1. Grid compression test setup.
291
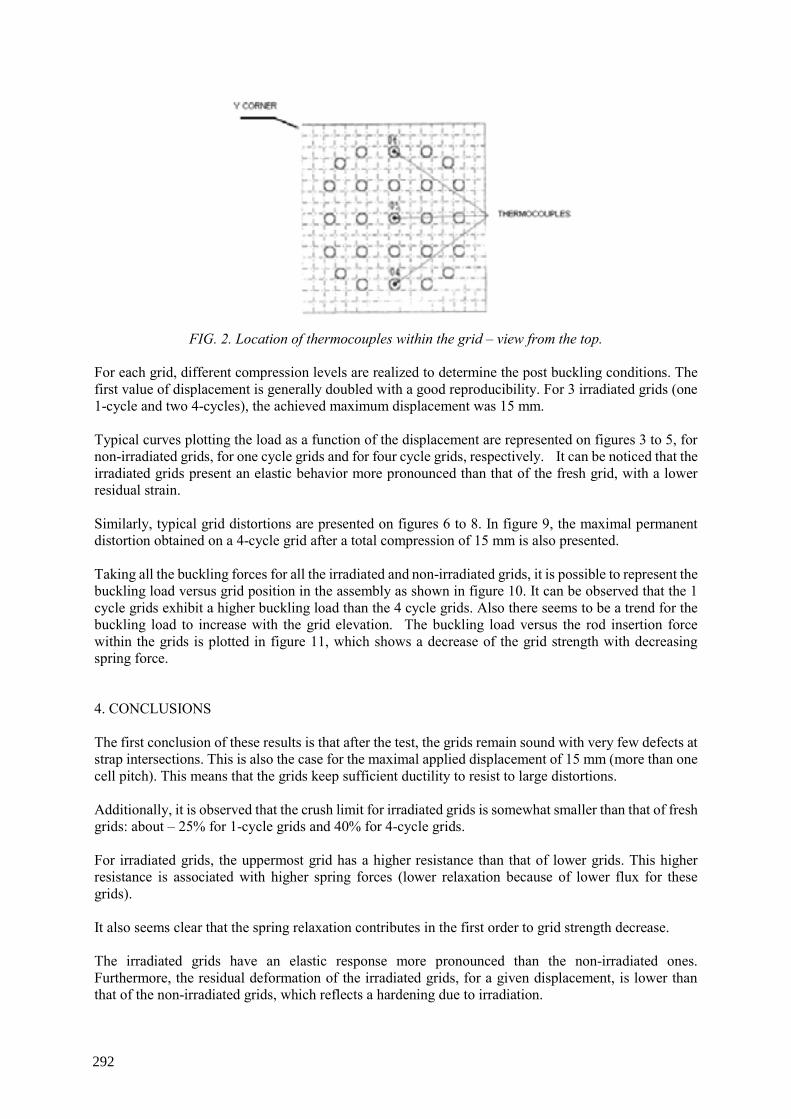
For each grid, different compression levels are realized to determine the post buckling conditions. The first value of displacement is generally doubled with a good reproducibility. For 3 irradiated grids (one 1-cycle and two 4-cycles), the achieved maximum displacement was 15 mm. Typical curves plotting the load as a function of the displacement are represented on figures 3 to 5, for non-irradiated grids, for one cycle grids and for four cycle grids, respectively. It can be noticed that the irradiated grids present an elastic behavior more pronounced than that of the fresh grid, with a lower residual strain. Similarly, typical grid distortions are presented on figures 6 to 8. In figure 9, the maximal permanent distortion obtained on a 4-cycle grid after a total compression of 15 mm is also presented. Taking all the buckling forces for all the irradiated and non-irradiated grids, it is possible to represent the buckling load versus grid position in the assembly as shown in figure 10. It can be observed that the 1 cycle grids exhibit a higher buckling load than the 4 cycle grids. Also there seems to be a trend for the buckling load to increase with the grid elevation. The buckling load versus the rod insertion force within the grids is plotted in figure 11, which shows a decrease of the grid strength with decreasing spring force. 4. CONCLUSIONS
The first conclusion of these results is that after the test, the grids remain sound with very few defects at strap intersections. This is also the case for the maximal applied displacement of 15 mm (more than one cell pitch). This means that the grids keep sufficient ductility to resist to large distortions. Additionally, it is observed that the crush limit for irradiated grids is somewhat smaller than that of fresh grids: about – 25% for 1-cycle grids and 40% for 4-cycle grids. For irradiated grids, the uppermost grid has a higher resistance than that of lower grids. This higher resistance is associated with higher spring forces (lower relaxation because of lower flux for these grids). It also seems clear that the spring relaxation contributes in the first order to grid strength decrease. The irradiated grids have an elastic response more pronounced than the non-irradiated ones. Furthermore, the residual deformation of the irradiated grids, for a given displacement, is lower than that of the non-irradiated grids, which reflects a hardening due to irradiation.
FIG. 2. Location of thermocouples within the grid – view from the top.
292
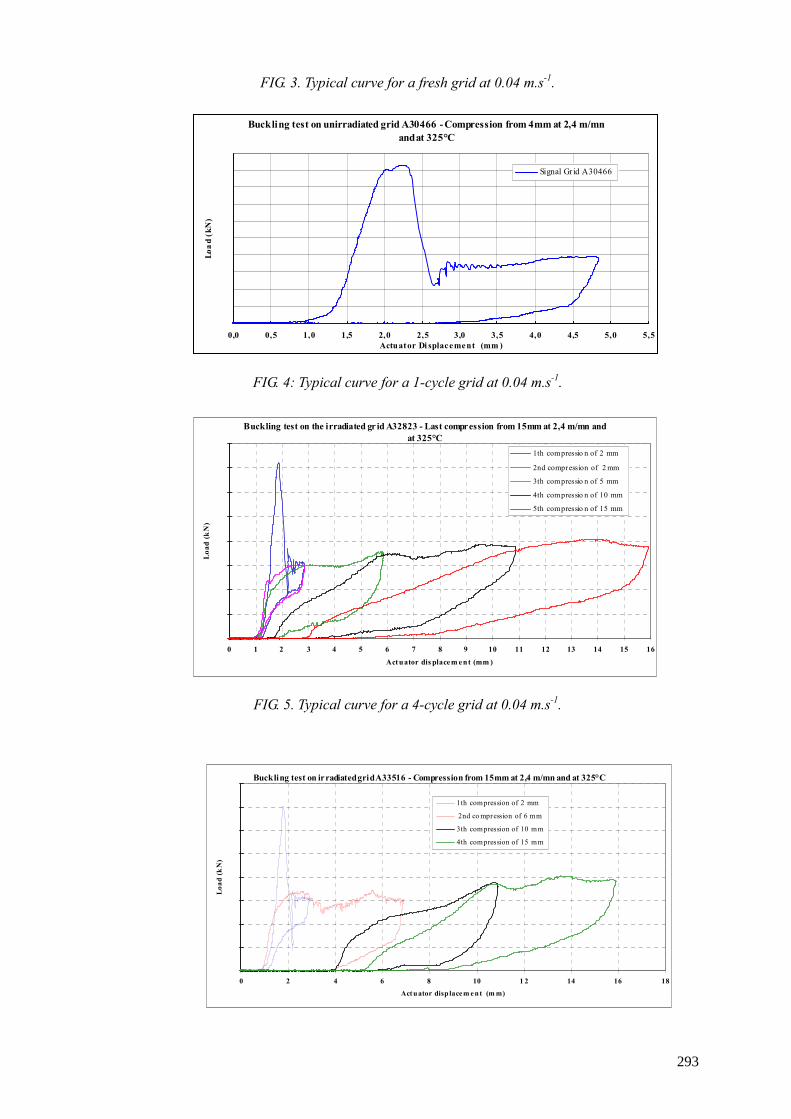
FIG. 3. Typical curve for a fresh grid at 0.04 m.s-1.
FIG. 4: Typical curve for a 1-cycle grid at 0.04 m.s-1.
FIG. 5. Typical curve for a 4-cycle grid at 0.04 m.s-1.
Buckling test on unirradiated grid A30466 - Compression from 4mm at 2,4 m/mn and at 325°C
0
2
4
6
8
10
12
14
16
18
20
0,0 0,5 1,0 1,5 2,0 2,5 3,0 3,5 4,0 4,5 5,0 5,5Actuator Di splacement (mm )
Load
(kN
)
Signal Gr id A30466
Buckling test on the irradiated gr id A32823 - Last compression from 15mm at 2,4 m/mn and at 325°C
0
2
4
6
8
10
12
14
16
0 1 2 3 4 5 6 7 8 9 10 11 12 13 14 15 16
Actuator dis placem ent (mm )
Loa
d (k
N)
1th compressio n of 2 mm
2nd compression of 2 mm
3th compressio n of 5 mm
4th compressio n of 10 mm
5th compressio n of 15 mm
Buckling test on irradiated grid A33516 - Compression from 15mm at 2,4 m/mn and at 325°C
0
2
4
6
8
10
12
14
16
0 2 4 6 8 10 1 2 14 16 18
Actuator disp lacem ent (m m)
Load
(k
N)
1th compression of 2 mm
2nd co mpression of 6 mm
3th compression of 10 mm
4th compression of 15 mm
293
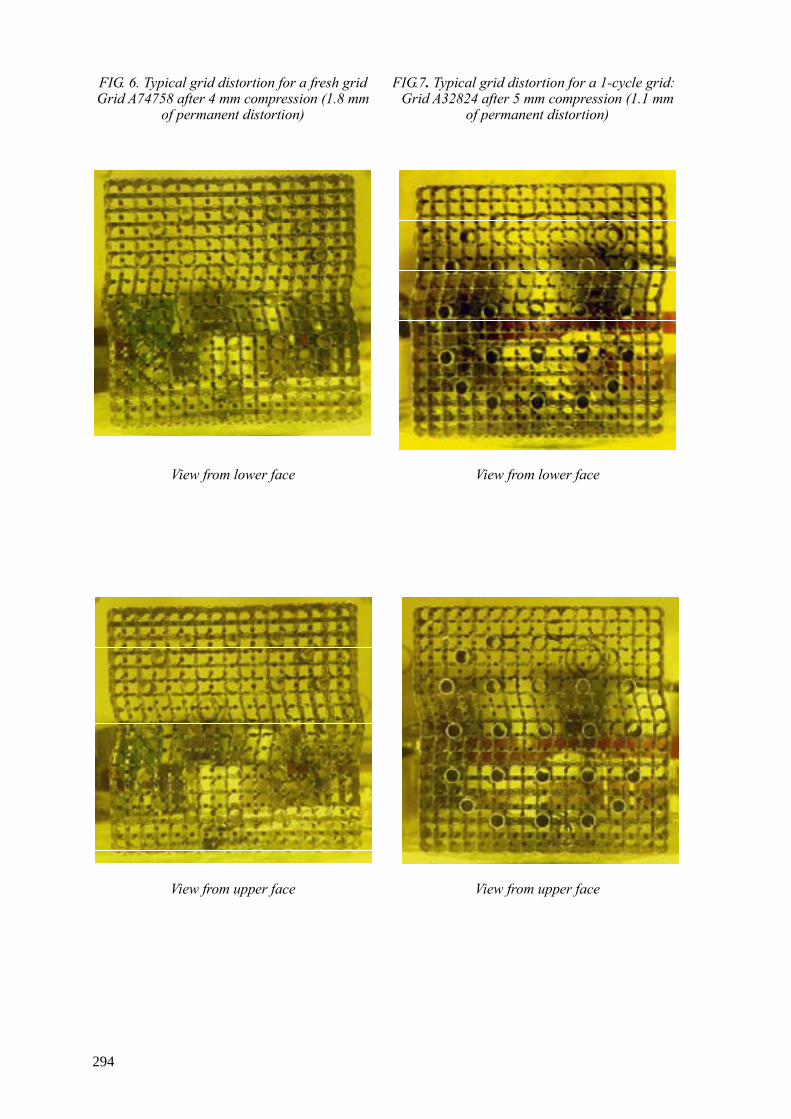
FIG. 6. Typical grid distortion for a fresh grid Grid A74758 after 4 mm compression (1.8 mm
of permanent distortion)
FIG.7. Typical grid distortion for a 1-cycle grid:Grid A32824 after 5 mm compression (1.1 mm
of permanent distortion)
View from lower face View from lower face
View from upper face
View from upper face
294

FIG. 8. Typical grid distortion for a 4 cycle grid: Grid A33510 after 5 mm
compression (1.2 mm of permanent distortion)
FIG. 9. Maximum achieved grid distortion for a 4-cycle grid: Grid A33516
after 15 mm compression (6.3 mm of permanent distortion)
View from lower face
View from lower face
View from upper face View from upper face
295
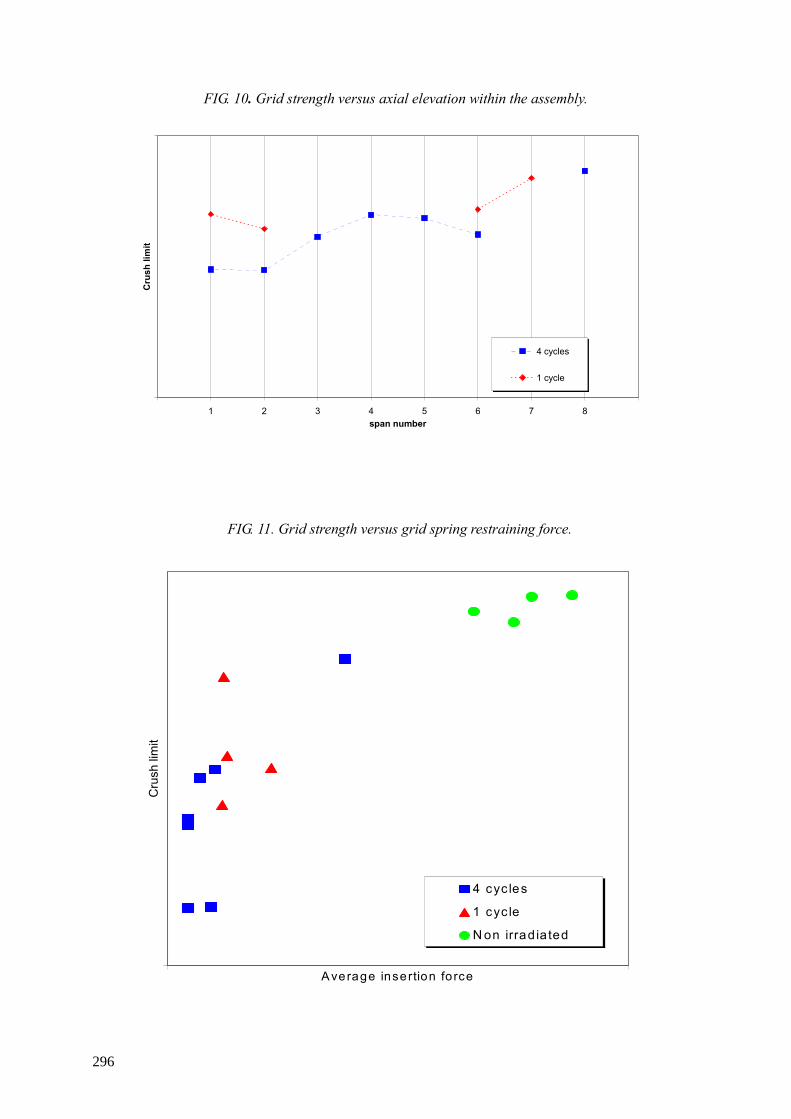
FIG. 10. Grid strength versus axial elevation within the assembly.
FIG. 11. Grid strength versus grid spring restraining force.
0 1 2 3 4 5 6 7 8 9span number
Cru
sh li
mit
4 cycles
1 cycle
A verage insertion fo rce
Cru
sh li
mit
4 cyc les
1 cyc le
N on irrad ia ted
296
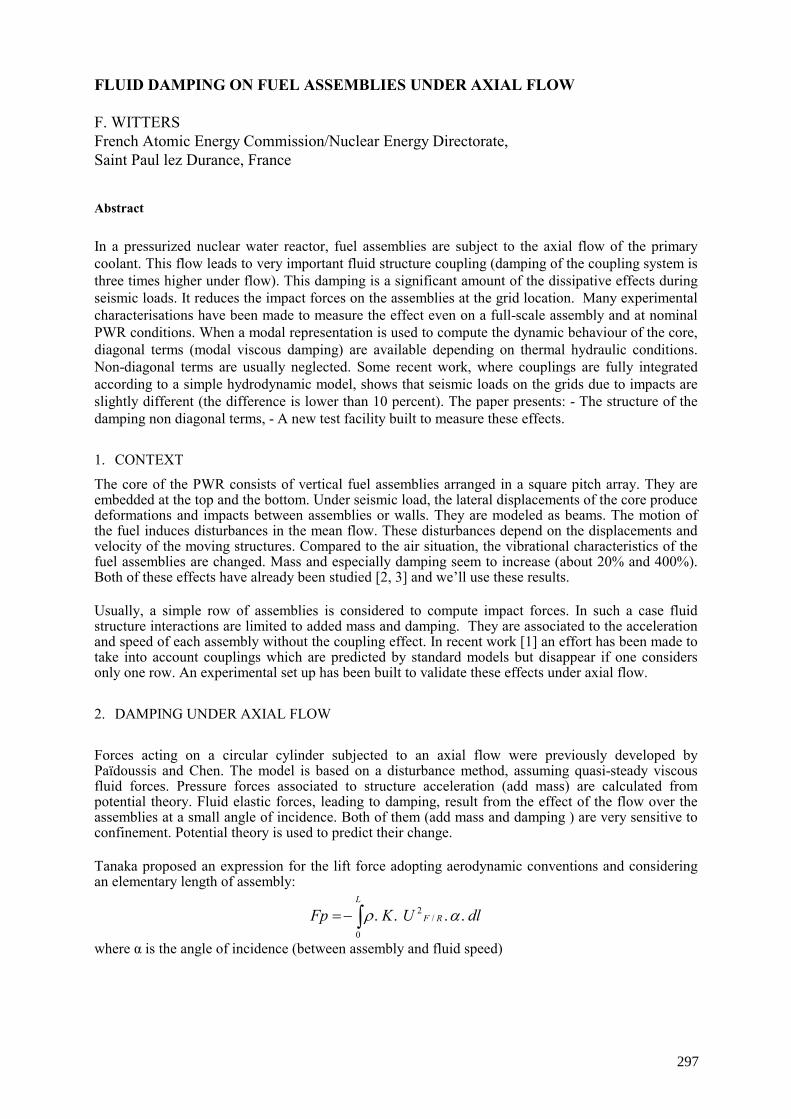
FLUID DAMPING ON FUEL ASSEMBLIES UNDER AXIAL FLOW
F. WITTERS French Atomic Energy Commission/Nuclear Energy Directorate, Saint Paul lez Durance, France Abstract
In a pressurized nuclear water reactor, fuel assemblies are subject to the axial flow of the primary coolant. This flow leads to very important fluid structure coupling (damping of the coupling system is three times higher under flow). This damping is a significant amount of the dissipative effects during seismic loads. It reduces the impact forces on the assemblies at the grid location. Many experimental characterisations have been made to measure the effect even on a full-scale assembly and at nominal PWR conditions. When a modal representation is used to compute the dynamic behaviour of the core, diagonal terms (modal viscous damping) are available depending on thermal hydraulic conditions. Non-diagonal terms are usually neglected. Some recent work, where couplings are fully integrated according to a simple hydrodynamic model, shows that seismic loads on the grids due to impacts are slightly different (the difference is lower than 10 percent). The paper presents: - The structure of the damping non diagonal terms, - A new test facility built to measure these effects.
1. CONTEXT
The core of the PWR consists of vertical fuel assemblies arranged in a square pitch array. They are embedded at the top and the bottom. Under seismic load, the lateral displacements of the core produce deformations and impacts between assemblies or walls. They are modeled as beams. The motion of the fuel induces disturbances in the mean flow. These disturbances depend on the displacements and velocity of the moving structures. Compared to the air situation, the vibrational characteristics of the fuel assemblies are changed. Mass and especially damping seem to increase (about 20% and 400%). Both of these effects have already been studied [2, 3] and we’ll use these results. Usually, a simple row of assemblies is considered to compute impact forces. In such a case fluid structure interactions are limited to added mass and damping. They are associated to the acceleration and speed of each assembly without the coupling effect. In recent work [1] an effort has been made to take into account couplings which are predicted by standard models but disappear if one considers only one row. An experimental set up has been built to validate these effects under axial flow.
2. DAMPING UNDER AXIAL FLOW
Forces acting on a circular cylinder subjected to an axial flow were previously developed by Païdoussis and Chen. The model is based on a disturbance method, assuming quasi-steady viscous fluid forces. Pressure forces associated to structure acceleration (add mass) are calculated from potential theory. Fluid elastic forces, leading to damping, result from the effect of the flow over the assemblies at a small angle of incidence. Both of them (add mass and damping ) are very sensitive to confinement. Potential theory is used to predict their change. Tanaka proposed an expression for the lift force adopting aerodynamic conventions and considering an elementary length of assembly:
dlUKFpL
RF ....0
/2 αρ∫−=
where α is the angle of incidence (between assembly and fluid speed)
297

FIG. 1. Lift force on an assembly. The structure displacement induces disturbances in the mean flow (vF/R0). This flow is calculated assuming that:
- The vertical component of unsteady velocity is of a higher order, - The steady flow distribution in the cross section is uniform, - The displacements and angle are slight.
FP.X = -K ρ (VF/R0)2 (b-a) cos(b)
cos(b) ~ 1 The damping force is associated to the part of FP proportional to the speed of the structure (VC/R0).
Famor. = -K ρ (1+A) VF/R0 VC/R0
The K coefficient is a lift coefficient. It has to be measured. The potential theory is a simple way to transpose experimental results from test facility to the values core.
With these hypotheses, speed and pressure fields are governed by conservation equations.
Mass:
( ) 0V div =
Momentum:
PtV ∇−=
∂∂
ρ
Speed continuity:
nXn.V i ⋅=
3. COUPLING EFFECTS We have previously introduced forces acting on a moving assembly, but the pressure and speed disturbance are not null in its vicinity. Figures 2 and 3 show the pressure and speed field in half a PWR resulting from a displacement of one assembly located far from the wall. Each assembly is represented by four circles.
FP
UF/R0
a = ( ∂ XC / ∂ Z )/t vF/R0 = -A VC/R0 b = (1+A) (VC/R0 / UF/R0)
Z VF/C
VC/R0 VF/R0
b
a
298
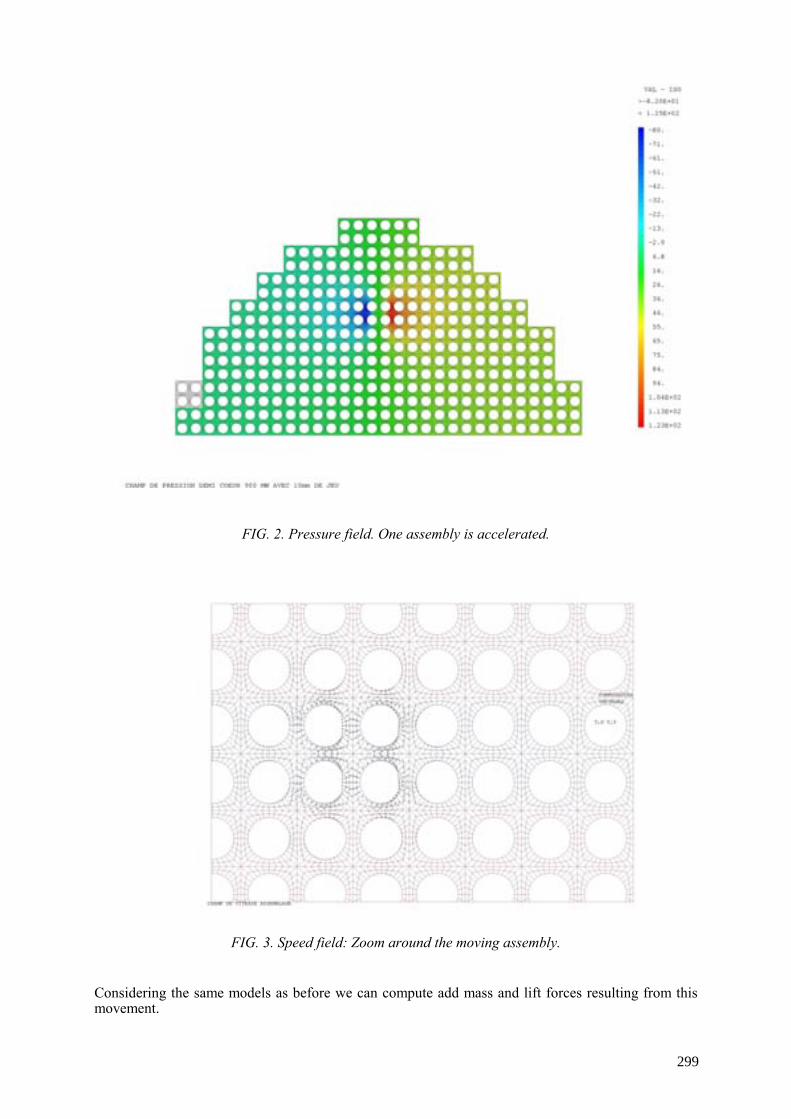
FIG. 2. Pressure field. One assembly is accelerated.
FIG. 3. Speed field: Zoom around the moving assembly.
Considering the same models as before we can compute add mass and lift forces resulting from this movement.
299
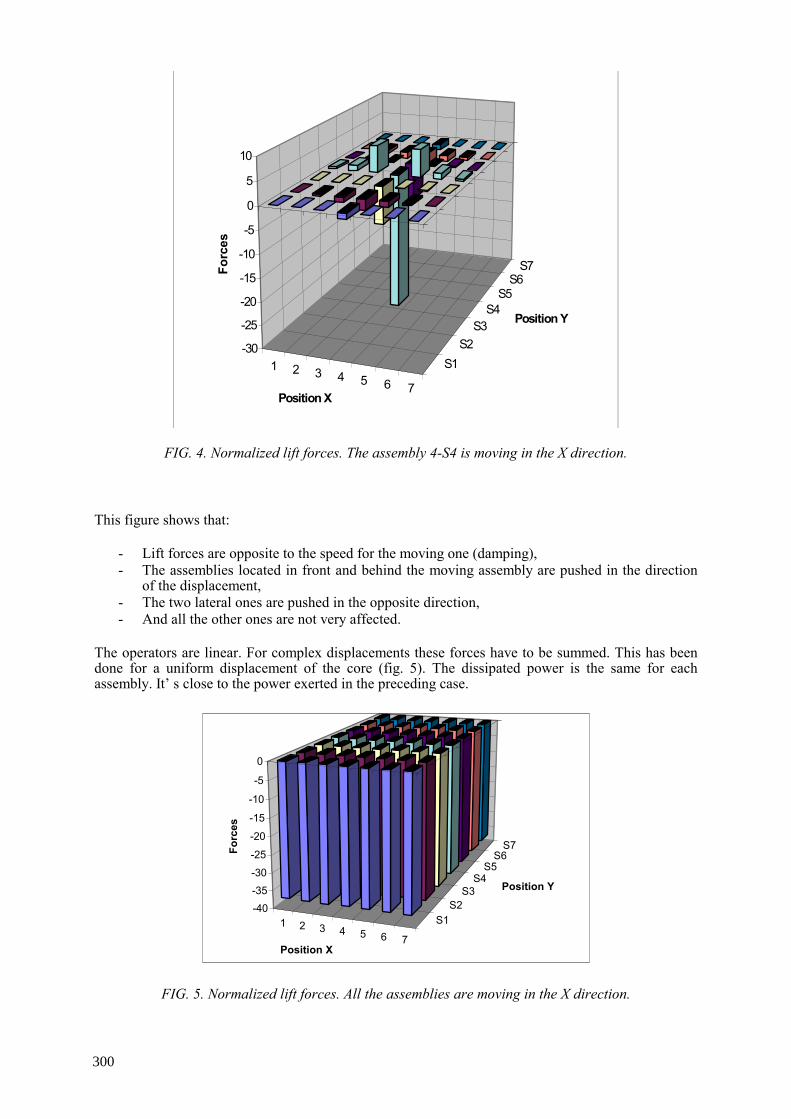
1 2 3 4 5 6 7
S1S2
S3S4
S5S6
S7
-30
-25
-20
-15
-10
-5
0
5
10
Forc
es
Position X
Position Y
FIG. 4. Normalized lift forces. The assembly 4-S4 is moving in the X direction. This figure shows that:
- Lift forces are opposite to the speed for the moving one (damping), - The assemblies located in front and behind the moving assembly are pushed in the direction
of the displacement, - The two lateral ones are pushed in the opposite direction, - And all the other ones are not very affected.
The operators are linear. For complex displacements these forces have to be summed. This has been done for a uniform displacement of the core (fig. 5). The dissipated power is the same for each assembly. It’ s close to the power exerted in the preceding case.
1 2 3 4 5 6 7
S1S2
S3S4
S5S6
S7
-40-35
-30
-25
-20
-15
-10
-5
0
Forc
es
Position X
Position Y
FIG. 5. Normalized lift forces. All the assemblies are moving in the X direction.
300
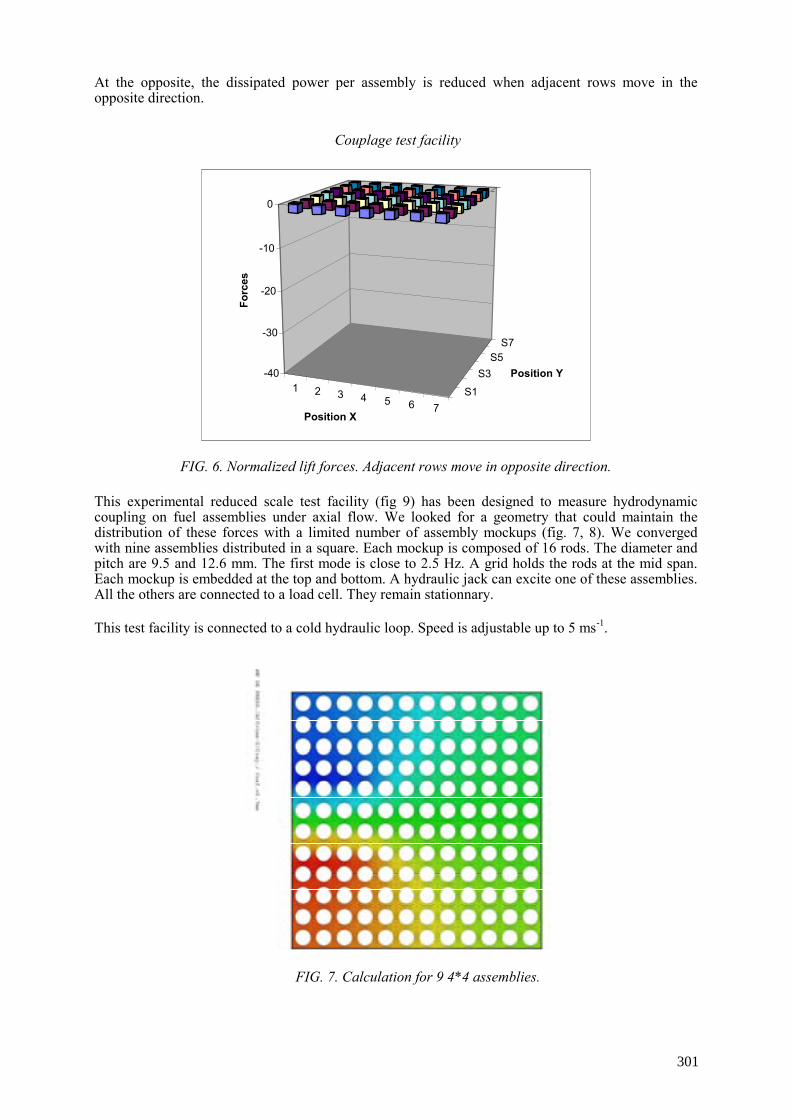
At the opposite, the dissipated power per assembly is reduced when adjacent rows move in the opposite direction.
Couplage test facility
1 2 3 4 5 6 7S1
S3S5
S7
-40
-30
-20
-10
0
Forc
es
Position X
Position Y
FIG. 6. Normalized lift forces. Adjacent rows move in opposite direction. This experimental reduced scale test facility (fig 9) has been designed to measure hydrodynamic coupling on fuel assemblies under axial flow. We looked for a geometry that could maintain the distribution of these forces with a limited number of assembly mockups (fig. 7, 8). We converged with nine assemblies distributed in a square. Each mockup is composed of 16 rods. The diameter and pitch are 9.5 and 12.6 mm. The first mode is close to 2.5 Hz. A grid holds the rods at the mid span. Each mockup is embedded at the top and bottom. A hydraulic jack can excite one of these assemblies. All the others are connected to a load cell. They remain stationnary. This test facility is connected to a cold hydraulic loop. Speed is adjustable up to 5 ms-1.
FIG. 7. Calculation for 9 4*4 assemblies.
301
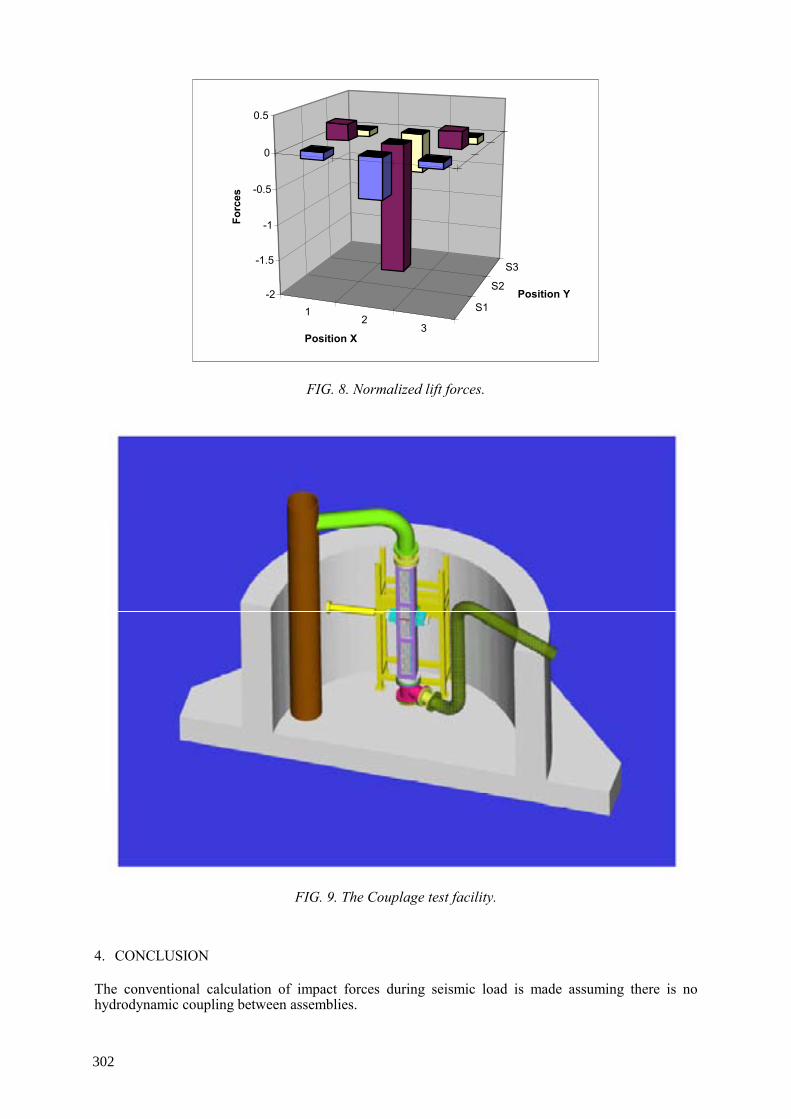
12
3
S1
S2
S3
-2
-1.5
-1
-0.5
0
0.5
Forc
es
Position X
Position Y
FIG. 8. Normalized lift forces.
FIG. 9. The Couplage test facility.
4. CONCLUSION The conventional calculation of impact forces during seismic load is made assuming there is no hydrodynamic coupling between assemblies.
302
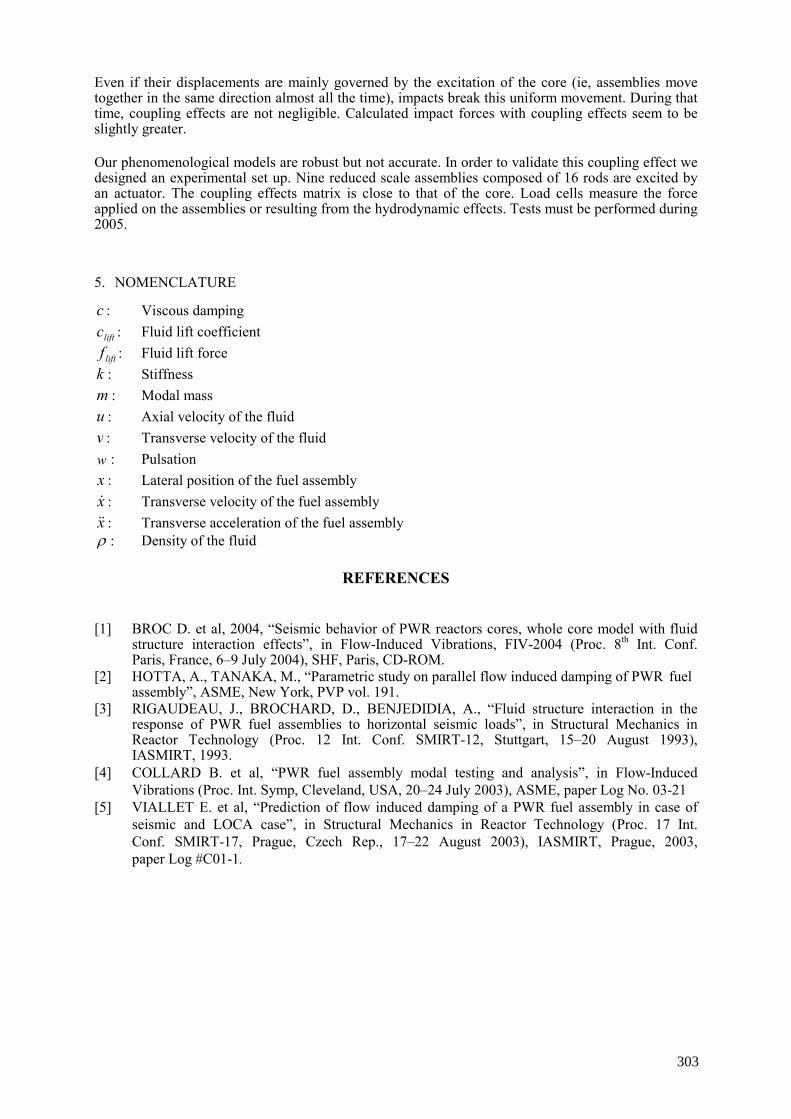
Even if their displacements are mainly governed by the excitation of the core (ie, assemblies move together in the same direction almost all the time), impacts break this uniform movement. During that time, coupling effects are not negligible. Calculated impact forces with coupling effects seem to be slightly greater. Our phenomenological models are robust but not accurate. In order to validate this coupling effect we designed an experimental set up. Nine reduced scale assemblies composed of 16 rods are excited by an actuator. The coupling effects matrix is close to that of the core. Load cells measure the force applied on the assemblies or resulting from the hydrodynamic effects. Tests must be performed during 2005.
5. NOMENCLATURE
c : Viscous damping
liftc : Fluid lift coefficient
liftf : Fluid lift force k : Stiffness m : Modal mass u : Axial velocity of the fluid v : Transverse velocity of the fluid w : Pulsation x : Lateral position of the fuel assembly x : Transverse velocity of the fuel assembly x : Transverse acceleration of the fuel assembly ρ : Density of the fluid
REFERENCES
[1] BROC D. et al, 2004, “Seismic behavior of PWR reactors cores, whole core model with fluid structure interaction effects”, in Flow-Induced Vibrations, FIV-2004 (Proc. 8th Int. Conf. Paris, France, 6–9 July 2004), SHF, Paris, CD-ROM. [2] HOTTA, A., TANAKA, M., “Parametric study on parallel flow induced damping of PWR fuel assembly”, ASME, New York, PVP vol. 191. [3] RIGAUDEAU, J., BROCHARD, D., BENJEDIDIA, A., “Fluid structure interaction in the response of PWR fuel assemblies to horizontal seismic loads”, in Structural Mechanics in Reactor Technology (Proc. 12 Int. Conf. SMIRT-12, Stuttgart, 15–20 August 1993), IASMIRT, 1993. [4] COLLARD B. et al, “PWR fuel assembly modal testing and analysis”, in Flow-Induced Vibrations (Proc. Int. Symp, Cleveland, USA, 20–24 July 2003), ASME, paper Log No. 03-21 [5] VIALLET E. et al, “Prediction of flow induced damping of a PWR fuel assembly in case of seismic and LOCA case”, in Structural Mechanics in Reactor Technology (Proc. 17 Int. Conf. SMIRT-17, Prague, Czech Rep., 17–22 August 2003), IASMIRT, Prague, 2003, paper Log #C01-1.
303

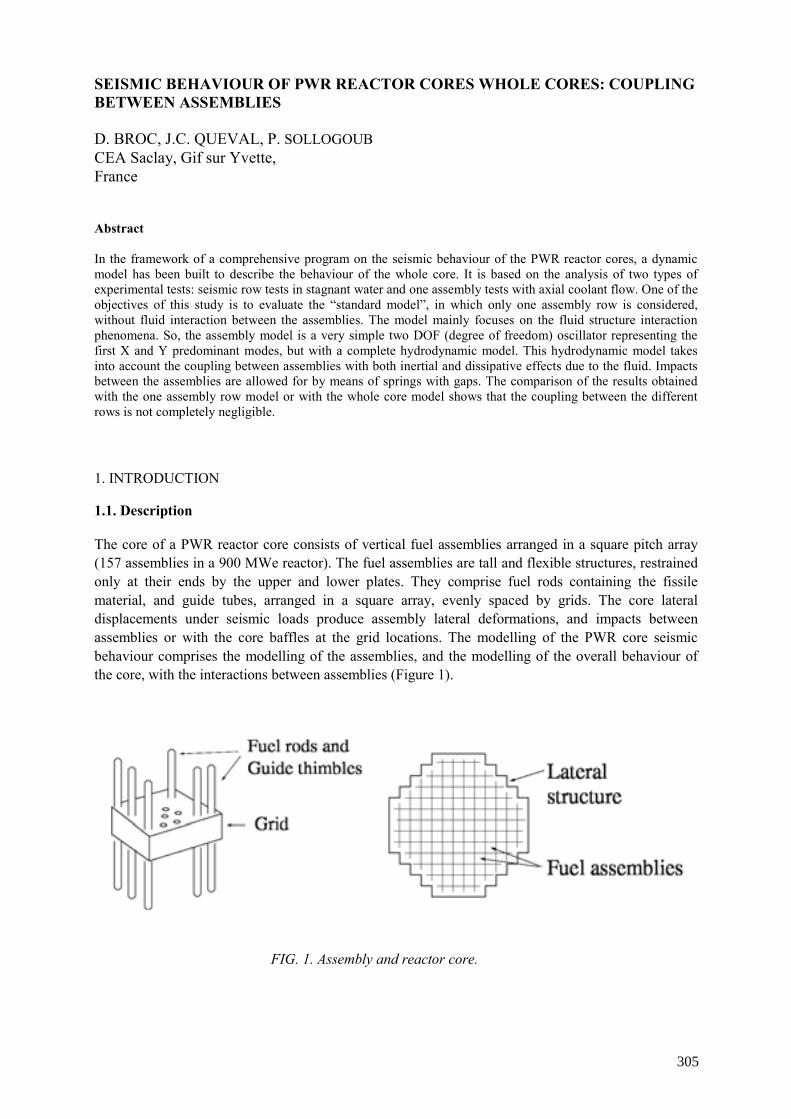
SEISMIC BEHAVIOUR OF PWR REACTOR CORES WHOLE CORES: COUPLING BETWEEN ASSEMBLIES D. BROC, J.C. QUEVAL, P. SOLLOGOUB CEA Saclay, Gif sur Yvette, France Abstract In the framework of a comprehensive program on the seismic behaviour of the PWR reactor cores, a dynamic model has been built to describe the behaviour of the whole core. It is based on the analysis of two types of experimental tests: seismic row tests in stagnant water and one assembly tests with axial coolant flow. One of the objectives of this study is to evaluate the “standard model”, in which only one assembly row is considered, without fluid interaction between the assemblies. The model mainly focuses on the fluid structure interaction phenomena. So, the assembly model is a very simple two DOF (degree of freedom) oscillator representing the first X and Y predominant modes, but with a complete hydrodynamic model. This hydrodynamic model takes into account the coupling between assemblies with both inertial and dissipative effects due to the fluid. Impacts between the assemblies are allowed for by means of springs with gaps. The comparison of the results obtained with the one assembly row model or with the whole core model shows that the coupling between the different rows is not completely negligible.
1. INTRODUCTION 1.1. Description The core of a PWR reactor core consists of vertical fuel assemblies arranged in a square pitch array (157 assemblies in a 900 MWe reactor). The fuel assemblies are tall and flexible structures, restrained only at their ends by the upper and lower plates. They comprise fuel rods containing the fissile material, and guide tubes, arranged in a square array, evenly spaced by grids. The core lateral displacements under seismic loads produce assembly lateral deformations, and impacts between assemblies or with the core baffles at the grid locations. The modelling of the PWR core seismic behaviour comprises the modelling of the assemblies, and the modelling of the overall behaviour of the core, with the interactions between assemblies (Figure 1).
FIG. 1. Assembly and reactor core.
305
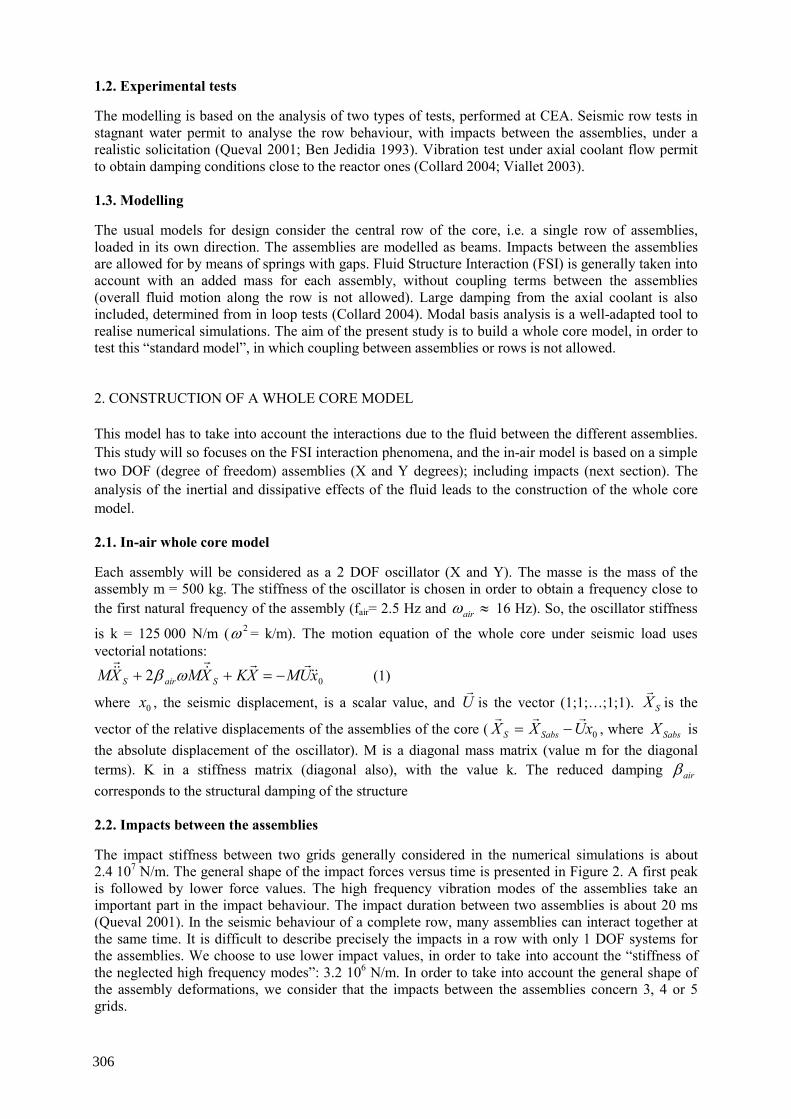
1.2. Experimental tests
The modelling is based on the analysis of two types of tests, performed at CEA. Seismic row tests in stagnant water permit to analyse the row behaviour, with impacts between the assemblies, under a realistic solicitation (Queval 2001; Ben Jedidia 1993). Vibration test under axial coolant flow permit to obtain damping conditions close to the reactor ones (Collard 2004; Viallet 2003). 1.3. Modelling
The usual models for design consider the central row of the core, i.e. a single row of assemblies, loaded in its own direction. The assemblies are modelled as beams. Impacts between the assemblies are allowed for by means of springs with gaps. Fluid Structure Interaction (FSI) is generally taken into account with an added mass for each assembly, without coupling terms between the assemblies (overall fluid motion along the row is not allowed). Large damping from the axial coolant is also included, determined from in loop tests (Collard 2004). Modal basis analysis is a well-adapted tool to realise numerical simulations. The aim of the present study is to build a whole core model, in order to test this “standard model”, in which coupling between assemblies or rows is not allowed. 2. CONSTRUCTION OF A WHOLE CORE MODEL
This model has to take into account the interactions due to the fluid between the different assemblies. This study will so focuses on the FSI interaction phenomena, and the in-air model is based on a simple two DOF (degree of freedom) assemblies (X and Y degrees); including impacts (next section). The analysis of the inertial and dissipative effects of the fluid leads to the construction of the whole core model.
2.1. In-air whole core model
Each assembly will be considered as a 2 DOF oscillator (X and Y). The masse is the mass of the assembly m = 500 kg. The stiffness of the oscillator is chosen in order to obtain a frequency close to the first natural frequency of the assembly (fair= 2.5 Hz and ≈airω 16 Hz). So, the oscillator stiffness
is k = 125 000 N/m ( 2ω = k/m). The motion equation of the whole core under seismic load uses vectorial notations:
02 xUMXKXMXM SairS −=++ ωβ (1)
where 0x , the seismic displacement, is a scalar value, and U is the vector (1;1;…;1;1). SX is the
vector of the relative displacements of the assemblies of the core ( 0xUXX SabsS −= , where SabsX is the absolute displacement of the oscillator). M is a diagonal mass matrix (value m for the diagonal terms). K in a stiffness matrix (diagonal also), with the value k. The reduced damping airβ corresponds to the structural damping of the structure
2.2. Impacts between the assemblies
The impact stiffness between two grids generally considered in the numerical simulations is about 2.4 107 N/m. The general shape of the impact forces versus time is presented in Figure 2. A first peak is followed by lower force values. The high frequency vibration modes of the assemblies take an important part in the impact behaviour. The impact duration between two assemblies is about 20 ms (Queval 2001). In the seismic behaviour of a complete row, many assemblies can interact together at the same time. It is difficult to describe precisely the impacts in a row with only 1 DOF systems for the assemblies. We choose to use lower impact values, in order to take into account the “stiffness of the neglected high frequency modes”: 3.2 106 N/m. In order to take into account the general shape of the assembly deformations, we consider that the impacts between the assemblies concern 3, 4 or 5 grids.
306

FIG. 2. Impact forces versus time: general shape.
The equations corresponding to this model can be solved using a modal basis, in a numerical code, with external forces for the impacts when they occur. For a 157 assembly core, the modal basis obviously comprises 314 modes which have the same frequency (157 X modes and 157 Y modes) f = fair. Any displacement vector can be a modal vector, in so far as the orthogonality properties of the modal basis are fulfilled.
2.3. Inertial effects of the fluid
The inertial effects of the fluid lead to the “added mass” notion (Broc 2001). The forces applied on the assemblies by the fluid are:
LDAaDSA XMMxUMXMF )( +++−= (2)
F is the vector of the forces, AM is the diagonal “added mass matrix” (value am for the diagonal
terms). DM is the diagonal “displaced mass” matrix (value dm for the diagonal terms). LX is the vector of the relative displacements of the fluid.
FIG. 3. Mesh of the reactor core.
307

LX is the mean fluid displacement through the cell, and can be called “Darcy’s acceleration”, by analogy with the “Darcy’s velocity used in hydrology or for fluid flow in porous media (De Marsily 1981). The results of Brochard and Cheval (2001) in the Fluid Structure Interaction homogenization are used in order to solve the equation of the fluid on a numerical mesh in which each fuel assembly is represented by one finite element (Figure 3). A “fluid matrix” LM is obtained, that verify:
SLL XMX = . So, it is possible to eliminate LX in the expression of the force applied by the fluid, and to take it into
account in the dynamic equation of the core: SLDDADLS XMMMMxMF ))((0 ++−+= (3) The equation of the whole core, taking into account the inertial effects of the fluid, can be written as:
SSLDAA XKXMMMMM ++−+ ))(( aD xMM )( −−= (4) 3. VIBRATION MODES
From the previous equations it is possible to determine the 314 vibration modes (157 modes X and 157 modes Y). In the “without coupling” case, all the frequencies are equal to 2.26 Hz. In the “with coupling” case, 186 modes have this 2.16 Hz frequency. The 128 other modes have higher frequency, and the last mode has a frequency of 2.44 Hz (close to the 2.5 Hz in-air frequency). The figure 4 presents the shape of different modes; The first shape correspond to the lowest 2.16 Hz frequencies. No global movement of the fluid occurs. The others shapes correspond to global movement of the fluid. The higher frequency is obtained for the higher degree of organization (1 cell in the core) and low relative displacements between the fluid and the assemblies. In those modes with global movement of the fluid, interactions between the assemblies or between rows take place.
FIG. 4. Shape of different vibration modes.
4. DISSIPATIVE EFFECTS Water is commonly considered as a perfect fluid in vibration problems, which lead to negligible friction effects. This is true in stagnant water (no global constant flow) and if the displacements of the structure are small with respect to the structure dimension. For seismic tests performed in stagnant water it can be demonstrated that head loss take place for the fluid flow through the assemblies. as the displacements are not “small” and as the Reynolds number is high (Figure 5).
308
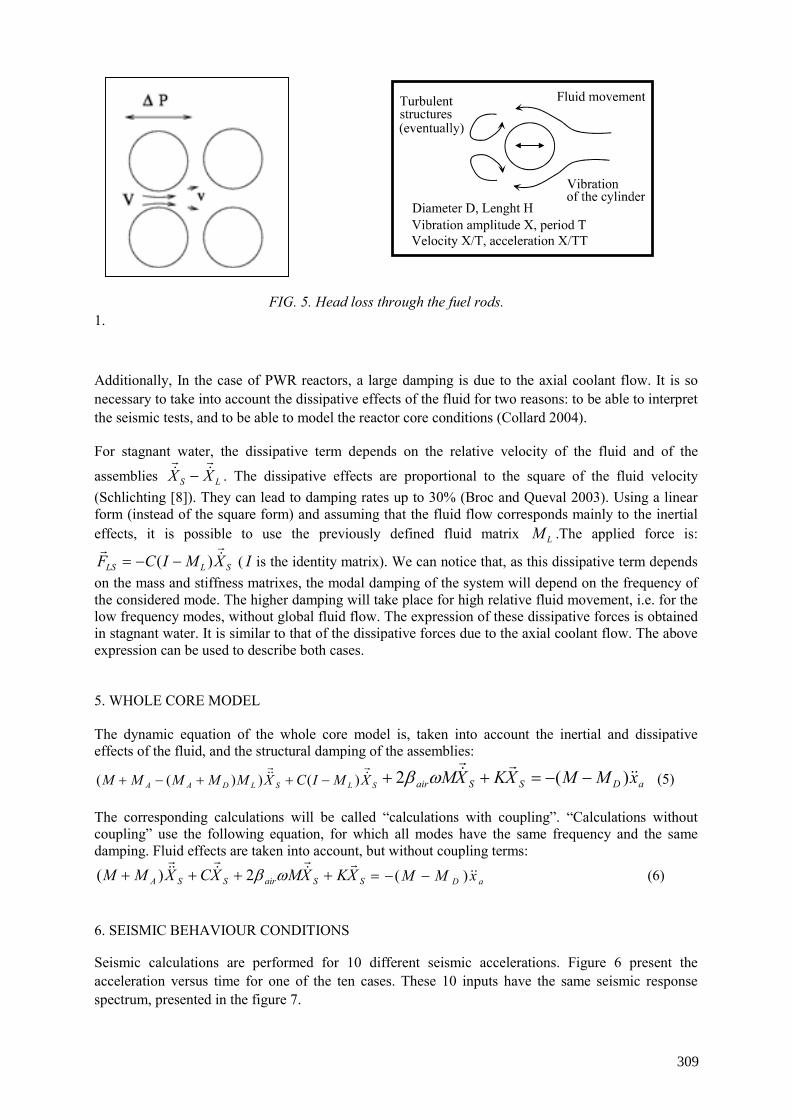
FIG. 5. Head loss through the fuel rods. 1.
Additionally, In the case of PWR reactors, a large damping is due to the axial coolant flow. It is so necessary to take into account the dissipative effects of the fluid for two reasons: to be able to interpret the seismic tests, and to be able to model the reactor core conditions (Collard 2004). For stagnant water, the dissipative term depends on the relative velocity of the fluid and of the
assemblies LS XX − . The dissipative effects are proportional to the square of the fluid velocity (Schlichting [8]). They can lead to damping rates up to 30% (Broc and Queval 2003). Using a linear form (instead of the square form) and assuming that the fluid flow corresponds mainly to the inertial effects, it is possible to use the previously defined fluid matrix LM .The applied force is:
SLLS XMICF )( −−= ( I is the identity matrix). We can notice that, as this dissipative term depends on the mass and stiffness matrixes, the modal damping of the system will depend on the frequency of the considered mode. The higher damping will take place for high relative fluid movement, i.e. for the low frequency modes, without global fluid flow. The expression of these dissipative forces is obtained in stagnant water. It is similar to that of the dissipative forces due to the axial coolant flow. The above expression can be used to describe both cases.
5. WHOLE CORE MODEL The dynamic equation of the whole core model is, taken into account the inertial and dissipative effects of the fluid, and the structural damping of the assemblies:
SLSLDAA XMICXMMMMM )())(( −++−+ aDSSair xMMXKXM )(2 −−=++ ωβ (5)
The corresponding calculations will be called “calculations with coupling”. “Calculations without coupling” use the following equation, for which all modes have the same frequency and the same damping. Fluid effects are taken into account, but without coupling terms:
SSairSSA XKXMXCXMM ++++ ωβ2)( aD xMM )( −−= (6) 6. SEISMIC BEHAVIOUR CONDITIONS
Seismic calculations are performed for 10 different seismic accelerations. Figure 6 present the acceleration versus time for one of the ten cases. These 10 inputs have the same seismic response spectrum, presented in the figure 7.
309
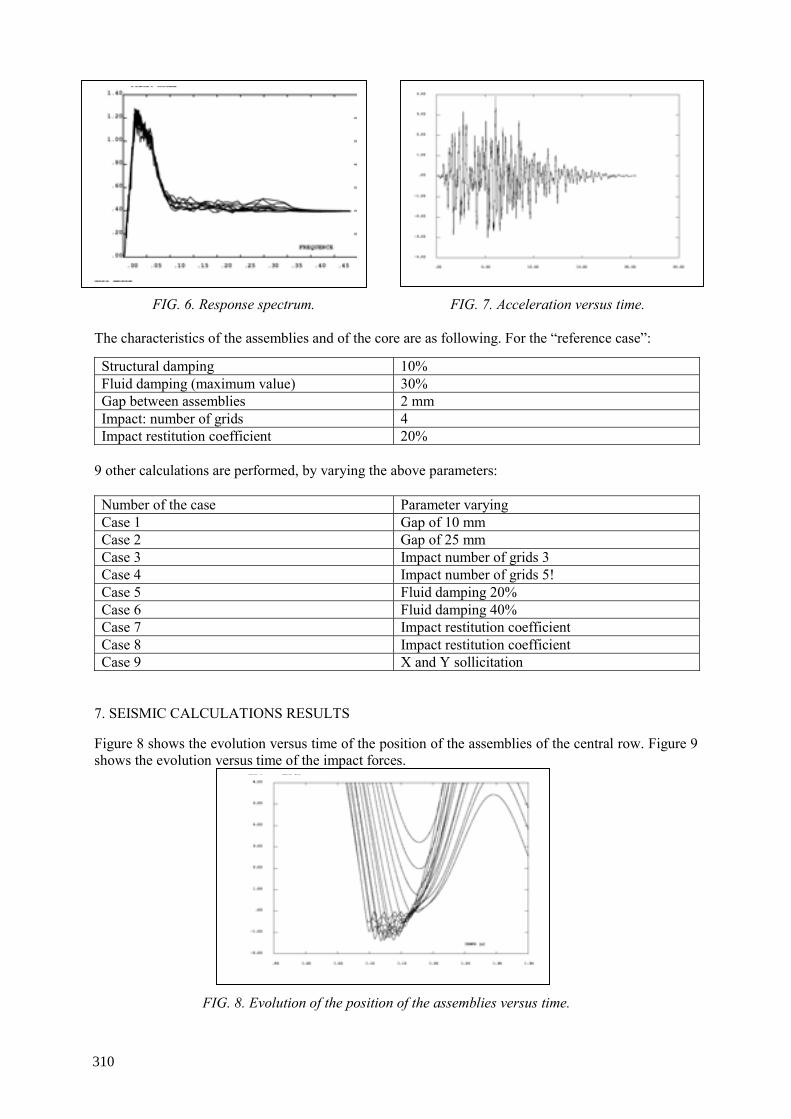
FIG. 6. Response spectrum. FIG. 7. Acceleration versus time.
The characteristics of the assemblies and of the core are as following. For the “reference case”:
Structural damping 10% Fluid damping (maximum value) 30% Gap between assemblies 2 mm Impact: number of grids 4 Impact restitution coefficient 20%
9 other calculations are performed, by varying the above parameters: Number of the case Parameter varying Case 1 Gap of 10 mm Case 2 Gap of 25 mm Case 3 Impact number of grids 3 Case 4 Impact number of grids 5! Case 5 Fluid damping 20% Case 6 Fluid damping 40% Case 7 Impact restitution coefficient Case 8 Impact restitution coefficient Case 9 X and Y sollicitation
7. SEISMIC CALCULATIONS RESULTS
Figure 8 shows the evolution versus time of the position of the assemblies of the central row. Figure 9 shows the evolution versus time of the impact forces.
FIG. 8. Evolution of the position of the assemblies versus time.
310

FIG. 9. Evolution of the position of the assemblies versus time.
The “with coupling model”, taking into account the coupling fluid matrix, lead to vibration modes with higher frequency than without coupling. It is interesting to look at the contribution of those modes in the seismic response of the core. The figure 10 presents the energy versus time in the whole core. This energy is the sum of the potential energy (due to the stiffness of the 2 DOF oscillators) and of the kinetic energy. Three curves are presented for the “with coupling” case: the evolution versus time of the energy of the 314 modes, the evolution versus time of the energy of the 186 2.16 Hz modes, and the evolution versus time of the energy of the 128 modes with frequencies higher than 2.16 Hz. In the “with coupling” case, about 90% of the energy is in the low frequency modes, but about 10% is in the higher frequency modes. The coupling modes are not negligible.
FIG. 10. Energy versus vibration modes.
311
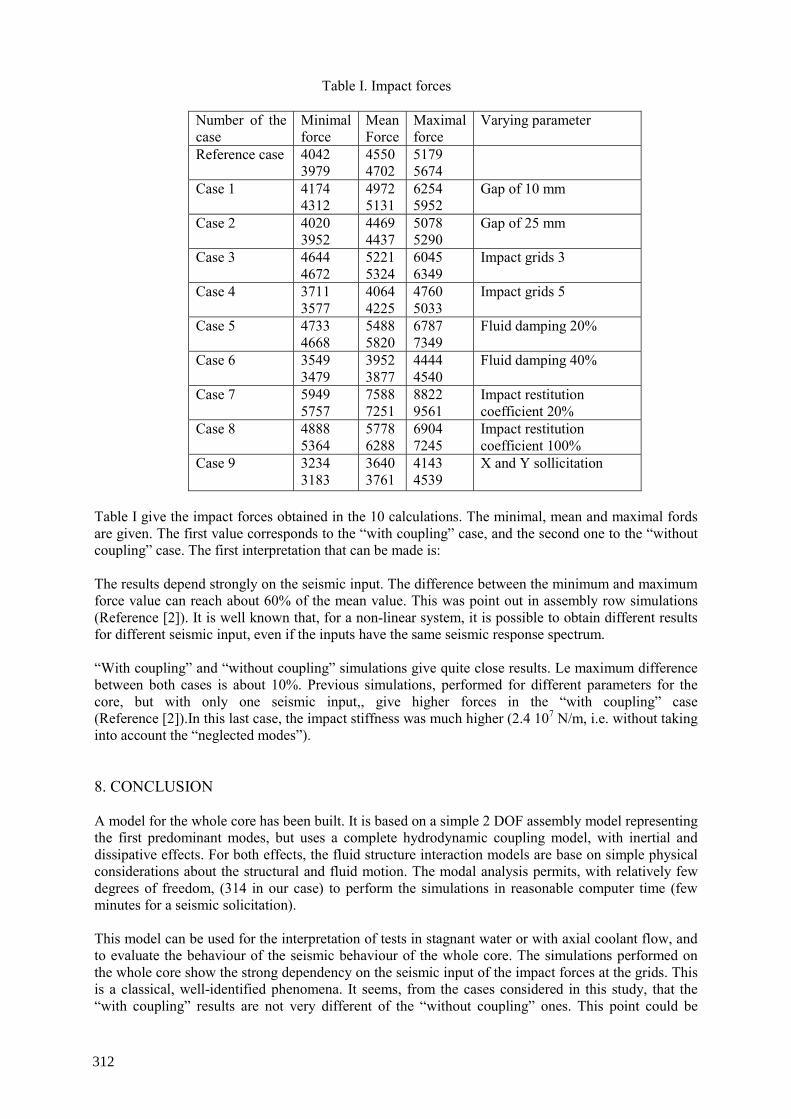
Table I. Impact forces
Number of the case
Minimal force
Mean Force
Maximal force
Varying parameter
Reference case 4042 3979
4550 4702
5179 5674
Case 1 4174 4312
4972 5131
6254 5952
Gap of 10 mm
Case 2 4020 3952
4469 4437
5078 5290
Gap of 25 mm
Case 3 4644 4672
5221 5324
6045 6349
Impact grids 3
Case 4 3711 3577
4064 4225
4760 5033
Impact grids 5
Case 5 4733 4668
5488 5820
6787 7349
Fluid damping 20%
Case 6 3549 3479
3952 3877
4444 4540
Fluid damping 40%
Case 7 5949 5757
7588 7251
8822 9561
Impact restitution coefficient 20%
Case 8 4888 5364
5778 6288
6904 7245
Impact restitution coefficient 100%
Case 9 3234 3183
3640 3761
4143 4539
X and Y sollicitation
Table I give the impact forces obtained in the 10 calculations. The minimal, mean and maximal fords are given. The first value corresponds to the “with coupling” case, and the second one to the “without coupling” case. The first interpretation that can be made is: The results depend strongly on the seismic input. The difference between the minimum and maximum force value can reach about 60% of the mean value. This was point out in assembly row simulations (Reference [2]). It is well known that, for a non-linear system, it is possible to obtain different results for different seismic input, even if the inputs have the same seismic response spectrum. “With coupling” and “without coupling” simulations give quite close results. Le maximum difference between both cases is about 10%. Previous simulations, performed for different parameters for the core, but with only one seismic input,, give higher forces in the “with coupling” case (Reference [2]).In this last case, the impact stiffness was much higher (2.4 107 N/m, i.e. without taking into account the “neglected modes”). 8. CONCLUSION A model for the whole core has been built. It is based on a simple 2 DOF assembly model representing the first predominant modes, but uses a complete hydrodynamic coupling model, with inertial and dissipative effects. For both effects, the fluid structure interaction models are base on simple physical considerations about the structural and fluid motion. The modal analysis permits, with relatively few degrees of freedom, (314 in our case) to perform the simulations in reasonable computer time (few minutes for a seismic solicitation). This model can be used for the interpretation of tests in stagnant water or with axial coolant flow, and to evaluate the behaviour of the seismic behaviour of the whole core. The simulations performed on the whole core show the strong dependency on the seismic input of the impact forces at the grids. This is a classical, well-identified phenomena. It seems, from the cases considered in this study, that the “with coupling” results are not very different of the “without coupling” ones. This point could be
312
studied more precisely, as it depends on the way to describe the impact between two grids in the numerical simulations. The analysis of the energy repartition between the different modes shows that the “coupling modes” are solicited when impact occur. Even if the influence on the impact forces is not very sensitive, coupling between assemblies by the fluid take place under seismic input.
REFERENCES
[1] BROC D. & al 2003, “Seismic behaviour of a PWR reactor core: Fluid structure interaction effects”, in Structural Mechanics in Reactor Technology (Proc. 17 Int. Conf. SMIRT-17, Prague, Czech Rep., 17–22 August 2003), IASMIRT, Prague, 2003, in CD-ROM. [2] BROC D. 2001 & al, Analysis of confinement effects for in water seismic tests on PWR fuel assemblies, in Structural Mechanics in Reactor Technology (Proc. 16 Int. Conf. SMIRT-16, Washington D.C., USA, 12–17 August 2001), Transactions IASMIRT, Washington, in CD- ROM. [3] RIGAUDEAU J. & al, “Hydrodynamic coupling in seismic response of PWR fuel assemblies and other immersed structures”, in Proc. ASME PVP Conf. (Boston, 1999) ASME, Vol 394, 201–208. [4] QUEVAL J.C. & al 2001, “Seismic tests of interacting full scale fuel assemblies on shaking table”, in Structural Mechanics in Reactor Technology (Proc. 16 Int. Conf. SMIRT-16, Washington D.C., USA, 12–17 August 2001), Transactions IASMIRT, Washington, in CD- ROM. [5] CHEVAL K. & al 2001, Modélisation du comportement sismique de structures multitubulaires baignées par un fluide dense, Thesis Evry. [6] DE MARSILY G. 1981, Hydrogéologie quantitative, Masson. [7] SCHLICHTING H. & al, Boundary Layer Theory. Springer Verlag. [8] VERPEAUX P. & al 1989, “A modern approach of computer codes for structural analysis”, in Structural Mechanics in Reactor Technology (Proc. 10 Int. Conf. SMIRT-10, Anahaim Washington D.C., USA, 12–17 August 2001), Transactions IASMIRT, Washington, in CD- ROM. SMIRT 10 Anaheim 1989. [9] BEN JEDIDIA A. 1993, Etude du comportement sismique d’un Coeur de réacteur nucléaire de type REP. Thesis. [10] COLLARD B. & al 2004: Flow induced damping of a PWR Fuel assembly. FIV 2004. [11] VIALLET E. & al 2003, Prediction of flow induced damping of a PWR fuel assembly in case of seismic and LOCA case. SMIRT 17.
313


LIST OF PARTICIPANTS
Alonso-Pacheco, J. M. ENUSA Industrias Avanzadas, S.A., Madrid, Spain
Andriambololona, H. EDF/DAMA, Clamart, France
Aullo, M. ENUSA Industrias Avanzadas, S.A., Madrid, Spain
Baillon, N. EDF/SEPTEN, Villeurbanne, Cedex, France
Baleon, J.-P. Framatome-ANP, Lyon, France
Bekriev, D. Kozloduy NPP Plc., Bulgaria
Billerey, A. EDF/SEPTEN, Villeurbanne, Cedex, France
Bosselut, D.-J. EDF R & D, Clamart, France
Bouchter, J.-C. CEA Saclay, Gif sur Yvette, Cedex, France
Brasnarof, D. O. Comision Nacional de Energia Atomica (CNEA), San Carlos de Bariloche, Rio Negro, Argentina
Broc, D. CEA Saclay, Gif sur Yvette, Cedex, France
Chaigne, G. EDF/SEPTEN, Villeurbanne, Cedex, France
Chen, Yu Shanghai Nuclear Engineering Research and Design Institute, Shanghai, China
Collard, B. CEA Cadarache, Saint Paul lez Durance, France
D’Aletto, T. CEA Cadarache, Saint Paul lez Durance, France
D’Uston, B. Framatome-ANP, Lyon, France
Dalleur, J.-P. Tractebel, Brussels, Belgium
Dolgov, A.B. JSC “TVEL”, Moscow, Russian Federation
Durce, K Slovenske Elektrarne, a.s. Bratislava, Slovakia
Ecomie, S. EDF/SEPTEN, Villeurbanne, Cedex, France
Espeel, E.J.H. Ministry of Housing, Spatial planning and the Environment The Hague, Netherlands
Forgeron T. CEA Saclay, Gif sur Yvette Cedex, France Fournier, Y. EDF/SEPTEN, Villeurbanne, Cedex, France
Ghoneim, M. Atomic Energy Authority, Cairo, Egypt
Gobillot, G. CEA Cadarache, Saint Paul lez Durance, France Guillet, J.-L. CEA Saclay, Gif sur Yvette, Cedex, France
Halpert, S.G. Comision Nacional de Energia Atomica (CNEA), Buenos Aires, Argentina
Holdaway, G.J. British Energy Generation Ltd, United Kingdom
Ivanov, A. JSC “Mashinostroitelny Zavod”, Moskovskaya oblast, Russian Federation
315

Izquiedo, P. CEA Saclay, Gif sur Yvette, Cedex, France
Kacmar, M. Slovenske Elektrarne Bohunice NPP, Bohunice, Slovakia
Kaydalov, V.B. FSUE OKBM, Nizny Novgorod, Russian Federation
Kim, K.-T. Korea Nuclear Fuel Company, Daejon, Republic of Korea
Kritski, V. FSUE LI "VNIPIET", St.-Petersburg, Russian Federation
Ladouceur, B. Framatome-ANP, Lyon, France
Markiewics, M.E. Comision Nacional de Energia Atomica (CNEA), San Carlos de Bariloche, Argentina
Martin Ghiselli, A. Comision Nacional de Energia Atomica (CNEA), Buenos Aires, Argentina
Maurice, A. EDF/SEPTEN, Villeurbanne, Cedex, France
Mori, V. CEA Cadarache, Saint Paul lez Durance, France Nemec, T. Slovenian Nuclear Safety Administration,
Ljubljana, Slovenia
Nhili, R. EDF DCN, St Denis, Cedex, France
Odintsov, N. JSC “Mashinostroitelny Zavod”, Moskovskaya oblast, Russian Federation
Oh, D.-S. Korea Atomic Energy Research Institute (KAERI), Yuseong-ku, Republic of Korea
Pauthenet, J. EDF/SEPTEN, Villeurbanne, Cedex, France
Petit, M. IRSN, Saint Paul Lez Durance, Cedex, France
Pettersson, H.L. Vattenfall Bränsle AB, Stockholm, Sweden
Peybernes, J. CEA Cadarache, Saint Paul lez Durance, France Phalippou, C. CEA Saclay, Gif sur Yvette, Cedex, France
Pigat, J. EDF DCN, St Denis, Cedex, France
Pogaru, N.P Nuclear Power Corporation of India Ltd (NPCIL), Mumbay, India
Rabenstein, W.D. Westinghouse Electric Corporation, Columbia, United States of America
Rancoeur, L. EDF R&D, Moret sur Loing, Cedex, France
Riverola, J. ENUSA Industrias Avanzadas, S.A., Madrid, Spain
Rubiolo, P.R. Westinghouse Electric Company, Pittsburgh, Pennsylvania, United States of America
Shustov, M.A. JSC Novosibirsk Chemical Concentrates Plant, Novosibirsk, Russian Federation
Simakov, G. JSC “Mashinostroitelny Zavod”, Moskovskaya oblast, Russian Federation
316

Song, K.-N. Korea Atomic Energy Research Institute (KAERI), Yuseong-ku, Republic of Korea
Touboul, F. CEA Saclay, Gif sur Yvette, Cedex, France
Troyanov, V.M. JSC “TVEL”, Moscow, Russian Federation
Vallory, J. CEA Cadarache, Saint Paul lez Durance, France
van Bloois, J.T. Borssele Nuclear Power Station, Vlissingen, Netherlands
Vasilchenko, I. N. FSUE OKB “GIDROPRESS”, Podolsk, Moscow Region, Russian Federation
Vizcaino, P. FEX, Mol, Belgium
Waeckel, N. EDF/SEPTEN, Villeurbanne Cedex, France Witters, F. CEA Cadarache, Saint Paul lez Durance, France
Woillez, J. FLUOREM, Ecully, France
Yvon, P. CEA Saclay, Gif sur Yvette, Cedex, France Zsoldos, J. Hungarian Atomic Energy Authority, Budapest, Hungary
317