Embed Size (px)
Citation preview

Accepted Manuscript
Title: Structural characteristics of the collagen network in human normal, degradedand repair articular cartilages observed in polarized light and scanning electronmicroscopies
Authors: A. Changoor, M. Nelea, S. Méthot, N. Tran-Khanh, A. Chevrier, A. Restrepo,M.S. Shive, C.D. Hoemann, M.D. Buschmann
PII: S1063-4584(11)00283-4
DOI: 10.1016/j.joca.2011.09.007
Reference: YJOCA 2515
To appear in: Osteoarthritis and Cartilage
Received Date: 5 January 2011
Accepted Date: 23 September 2011
Please cite this article as: Changoor A, Nelea M, Méthot S, Tran-Khanh N, Chevrier A, Restrepo A,Shive MS, Hoemann CD, Buschmann MD. Structural characteristics of the collagen network in humannormal, degraded and repair articular cartilages observed in polarized light and scanning electronmicroscopies, Osteoarthritis and Cartilage (2011), doi: 10.1016/j.joca.2011.09.007
This is a PDF file of an unedited manuscript that has been accepted for publication. As a service toour customers we are providing this early version of the manuscript. The manuscript will undergocopyediting, typesetting, and review of the resulting proof before it is published in its final form. Pleasenote that during the production process errors may be discovered which could affect the content, and alllegal disclaimers that apply to the journal pertain.

MANUSCRIP
T
ACCEPTED
ACCEPTED MANUSCRIPT
1
Structural characteristics of the collagen network in human normal, degraded and 1
repair articular cartilages observed in polarized light and scanning electron 2
microscopies 3
4
A Changoor1, M Nelea1, S Méthot2, N Tran-Khanh1, A Chevrier1, A Restrepo2, MS 5
Shive2, CD Hoemann1, MD Buschmann1* 6
7
1Institute of Biomedical Engineering, Department of Chemical Engineering 8
Ecole Polytechnique de Montreal, P.O. Box 6079, Station Centre-Ville 9
Montreal, Quebec, Canada, H3C 3A7 10
2Piramal Healthcare (Canada), 475 Armand-Frappier Blvd., Montreal, Quebec, Canada, 11
H7V 4B3 12
13
*Corresponding author 14
Institute of Biomedical Engineering, Department of Chemical Engineering 15
École Polytechnique of Montréal, P.O. Box 6079, Station Centre-Ville 16
Montreal, Québec, Canada, H3C 3A7 17
Tel.: 514-340-4711 ext. 4931 18
Fax: 514-340-2980 19
E-mail address: [email protected] 20
21
Running Title: Collagen structure in articular cartilage 22

MANUSCRIP
T
ACCEPTED
ACCEPTED MANUSCRIPT
2
Abstract 23
Objective: This study characterizes collagen organization in human normal (n=6), 24
degraded (n=6) and repair (n=22) cartilages, using polarized light (PLM) and scanning 25
electron (SEM) microscopies. 26
27
Design: Collagen organization (CO) was assessed using a recently developed PLM-CO 28
score (Changoor et al. Osteoarthr. Cartil. 2011; 19:126-35), and zonal proportions 29
measured. SEM images were captured from locations matched to PLM. Fibre orientations 30
were assessed in SEM and compared to those observed in PLM. CO was also assessed in 31
individual SEM images and combined to generate a SEM-CO score for overall collagen 32
organization analogous to PLM-CO. Fibre diameters were measured in SEM. 33
34
Results: PLM-CO and SEM-CO scores were correlated, r=0.786 (p<0.00001, n=32), 35
after excluding two outliers. Orientation observed in PLM was validated by SEM since 36
PLM/SEM correspondence occurred in 91.6% of samples. Proportions of the deep (DZ), 37
transitional (TZ) and superficial (SZ) zones averaged 74.0±9.1%, 18.6±7.0%, and 38
7.3±1.2% in normal, and 45.6±10.7%, 47.2±10.1% and 9.5±3.4% in degraded cartilage, 39
respectively. Fibre diameters in normal cartilage increased with depth from the articular 40
surface [55.8±9.4nm (SZ), 87.5±1.8nm (TZ) and 108.2±1.8nm (DZ)]. Fibre diameters 41
were smaller in repair biopsies [60.4±0.7nm (SZ), 63.2±0.6nm (TZ) and 67.2±0.8nm 42
(DZ)]. Degraded cartilage had wider fibre diameter ranges and bimodal distributions, 43
possibly reflecting new collagen synthesis and remodelling or collagen fibre unravelling. 44
Repair tissues revealed the potential of micro-fracture based repair procedures to produce 45

MANUSCRIP
T
ACCEPTED
ACCEPTED MANUSCRIPT
3
zonal collagen organization resembling native articular cartilage structure. Values are 46
reported as mean±95% confidence interval. 47
48
Conclusion: This detailed assessment of collagen architecture could benefit the 49
development of cartilage repair strategies intended to recreate functional collagen 50
architecture. 51
52
Keywords: articular cartilage repair, articular cartilage degradation, histological score, 53
collagen fibre diameter, polarized light microscopy, scanning electron microscopy 54
55

MANUSCRIP
T
ACCEPTED
ACCEPTED MANUSCRIPT
1
Introduction 1
The biomechanical properties and durability of articular cartilage depend 2
primarily on the highly organized, fibrillar collagen type II network1,2. In mature 3
cartilage, it consists of three zones where collagen fibres are oriented tangentially to the 4
articular surface in the superficial zone (SZ), have no predominant orientation in the 5
transitional zone (TZ) and become aligned perpendicularly to, and finally anchored in, 6
the calcified cartilage and subchondral bone in the deep zone (DZ)3,4. This stratified 7
architecture results from post-natal endochondral development processes5,6. However, 8
once this mature structure is achieved, the turnover rate of collagen becomes extremely 9
low7,8, contributing to the limited intrinsic repair capacity of normal adult articular 10
cartilage. 11
Strategies for repairing focal cartilage defects include tissue-engineered 12
constructs9, cell therapies10, scaffold-based solutions11 and surgical techniques12. These 13
approaches engage extrinsic repair processes originating from tissue-engineered 14
constructs, implanted cells or the subchondral bone, which may additionally interact with 15
other joint tissues. These strategies aim to generate a lasting durable and functional repair 16
cartilage tissue. Consequently, recreating stratified collagen architecture similar to that of 17
native hyaline articular cartilage is paramount13,14. 18
Collagen organization (CO) and other structural features of the collagen network, 19
including collagen fibre diameters, have been directly compared between normal and 20
osteoarthritic cartilages15,16. However, relatively few reports analyze the collagen network 21
in repair cartilage17-20 or tissue-engineered constructs21-23. More recently, quantitative 22
analyses of stereological features (fibre anisotropy and diameter) in repair cartilage, 23
MANUSCRIP
T
ACCEPTED
ACCEPTED MANUSCRIPT
2
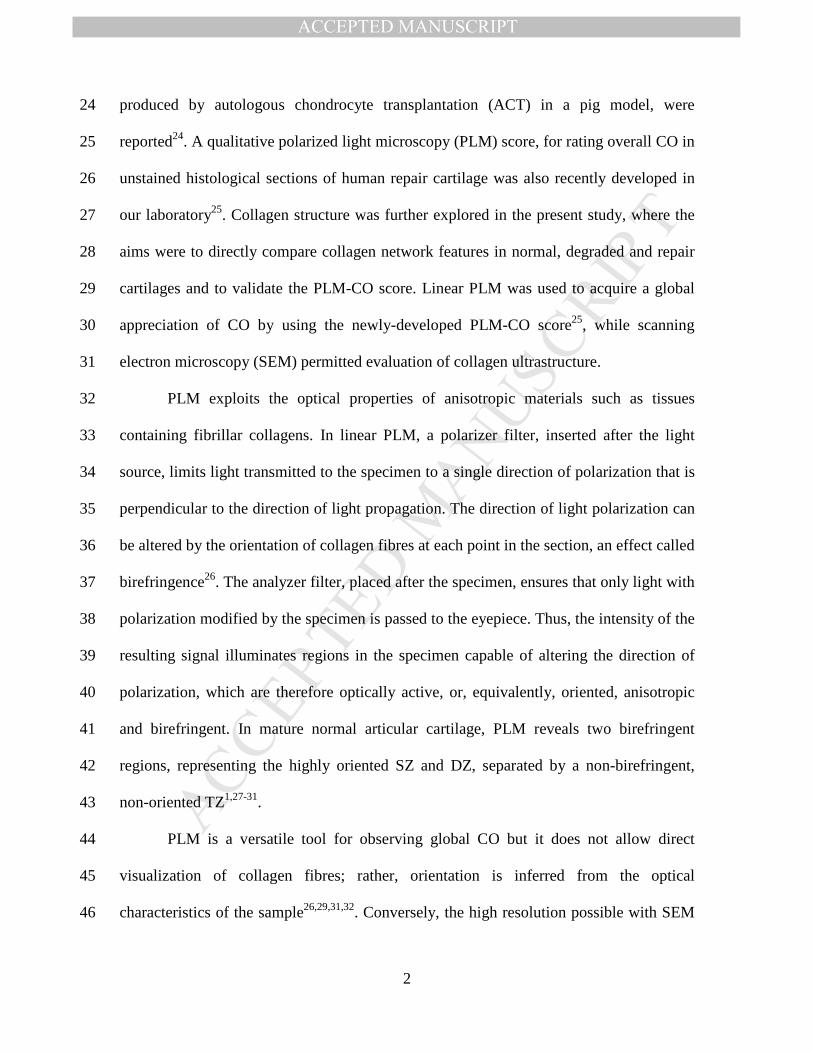
produced by autologous chondrocyte transplantation (ACT) in a pig model, were 24
reported24. A qualitative polarized light microscopy (PLM) score, for rating overall CO in 25
unstained histological sections of human repair cartilage was also recently developed in 26
our laboratory25. Collagen structure was further explored in the present study, where the 27
aims were to directly compare collagen network features in normal, degraded and repair 28
cartilages and to validate the PLM-CO score. Linear PLM was used to acquire a global 29
appreciation of CO by using the newly-developed PLM-CO score25, while scanning 30
electron microscopy (SEM) permitted evaluation of collagen ultrastructure. 31
PLM exploits the optical properties of anisotropic materials such as tissues 32
containing fibrillar collagens. In linear PLM, a polarizer filter, inserted after the light 33
source, limits light transmitted to the specimen to a single direction of polarization that is 34
perpendicular to the direction of light propagation. The direction of light polarization can 35
be altered by the orientation of collagen fibres at each point in the section, an effect called 36
birefringence26. The analyzer filter, placed after the specimen, ensures that only light with 37
polarization modified by the specimen is passed to the eyepiece. Thus, the intensity of the 38
resulting signal illuminates regions in the specimen capable of altering the direction of 39
polarization, which are therefore optically active, or, equivalently, oriented, anisotropic 40
and birefringent. In mature normal articular cartilage, PLM reveals two birefringent 41
regions, representing the highly oriented SZ and DZ, separated by a non-birefringent, 42
non-oriented TZ1,27-31. 43
PLM is a versatile tool for observing global CO but it does not allow direct 44
visualization of collagen fibres; rather, orientation is inferred from the optical 45
characteristics of the sample26,29,31,32. Conversely, the high resolution possible with SEM 46
MANUSCRIP
T
ACCEPTED
ACCEPTED MANUSCRIPT
3
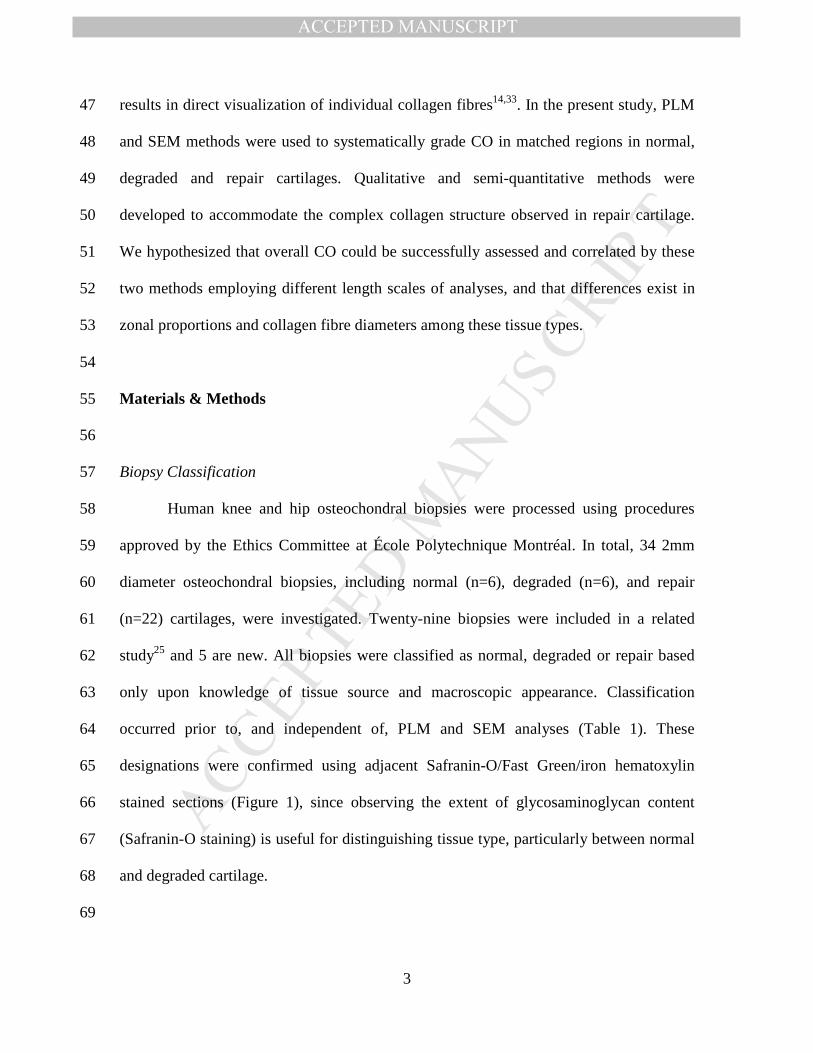
results in direct visualization of individual collagen fibres14,33. In the present study, PLM 47
and SEM methods were used to systematically grade CO in matched regions in normal, 48
degraded and repair cartilages. Qualitative and semi-quantitative methods were 49
developed to accommodate the complex collagen structure observed in repair cartilage. 50
We hypothesized that overall CO could be successfully assessed and correlated by these 51
two methods employing different length scales of analyses, and that differences exist in 52
zonal proportions and collagen fibre diameters among these tissue types. 53
54
Materials & Methods 55
56
Biopsy Classification 57
Human knee and hip osteochondral biopsies were processed using procedures 58
approved by the Ethics Committee at École Polytechnique Montréal. In total, 34 2mm 59
diameter osteochondral biopsies, including normal (n=6), degraded (n=6), and repair 60
(n=22) cartilages, were investigated. Twenty-nine biopsies were included in a related 61
study25 and 5 are new. All biopsies were classified as normal, degraded or repair based 62
only upon knowledge of tissue source and macroscopic appearance. Classification 63
occurred prior to, and independent of, PLM and SEM analyses (Table 1). These 64
designations were confirmed using adjacent Safranin-O/Fast Green/iron hematoxylin 65
stained sections (Figure 1), since observing the extent of glycosaminoglycan content 66
(Safranin-O staining) is useful for distinguishing tissue type, particularly between normal 67
and degraded cartilage. 68
69

MANUSCRIP
T
ACCEPTED
ACCEPTED MANUSCRIPT
4
Tissue Sources & Processing 70
The previous publication25 contains a complete description of tissue sources and 71
processing related to the 29 biopsies. Briefly, normal cartilage samples from donors with 72
no history of degenerative joint disease were biopsies (n=4) and a larger osteochondral 73
block from the medial femoral condyle (MFC) of a 24-year-old male donor (n=1) 74
(LifeLink Tissue Bank, Tampa, FL; RTI Biologics Inc., Alachua, FL). Analyses on the 75
osteochondral block were limited to a 2mm-wide central portion to approximate biopsy 76
dimensions. Degraded cartilage biopsies (n=2) were obtained from tissue removed during 77
hip arthroplasty procedures. Repair cartilage biopsies (n=22) were retrieved during 78
standardized, second-look arthroscopies, 13 months post-treatment during a randomized 79
clinical trial, (sponsored by BioSyntech Canada Inc., now Piramal Healthcare (Canada), 80
Montreal, Canada), where the ability of microfracture augmented with the cartilage repair 81
device BST-CarGel® was compared to microfracture alone for repairing focal cartilage 82
lesions. Biopsies were fixed in 10% neutral buffered formalin (NBF), decalcified in 0.5N 83
HCl/0.1% glutaraldehyde, paraffin embedded and sectioned at 5µm. 84
The 29 biopsies described above were supplemented with 5 additional femoral 85
head biopsies, classified as either normal or degraded. The normal biopsy (n=1) was 86
collected from the centre of a femoral head removed during treatment for femoral neck 87
fracture. The degraded biopsies (n=4), with mild to extensive surface roughening, were 88
collected from tissue removed during hip arthroplasties, where three were from the 89
centres of osteoarthritic lesions and one from a region adjacent to a lesion. These five 90
specimens were fixed in 10% NBF for a minimum of 30 days, decalcified in 10% 91

MANUSCRIP
T
ACCEPTED
ACCEPTED MANUSCRIPT
5
EDTA/0.1% (v/v) paraformaldehyde for 17.5 hours at 37°C, embedded in paraffin and 92
sectioned at 5µm. 93
Sections were deparaffinized and rehydrated. Sections for PLM analysis were 94
mounted unstained in Permount (Fisher Scientific, Hampton, NH). Adjacent sections for 95
SEM were post-fixed in 2% glutaraldehyde/0.1M sodium cacodylate for 10 minutes, then 96
rinsed and stored in distilled water for a minimum of 10 minutes prior to being 97
transferred to an adhesive carbon tab mounted on an aluminum sample stub (Cedarlane 98
Laboratories Ltd., Burlington, Canada). Sections were dried manually with compressed 99
air and a uniform layer of gold applied (Agar manual sputter coater, Marivac Inc., 100
Montréal, Canada). SEM images were captured in conventional high-vacuum mode on a 101
Quanta FEG 200 ESEM (FEI Company, Hillsboro, OR) at 20kV and a working distance 102
of 5mm. Additional adjacent sections were stained with Safranin-O/Fast Green/iron 103
hematoxylin or immunostained for collagen type II34. 104
105
PLM Analyses 106
Collagen organization was evaluated using the PLM-CO score, consisting of a 0-5 107
ordinal scale that rates the extent that CO resembles the zonal structure observed in 108
young adult hyaline articular cartilage (score of 5) versus completely disorganized 109
architecture (score of 0)25. Scoring was performed on blinded sections by three 110
independent trained readers at a polarization light microscope, whose scores were 111
averaged. PLM-CO scores for 28 biopsies were previously used to assess inter-reader 112
reliability25, although scores for only a subset of these [normal (n=5), degraded (n=2) and 113
repair (n=4)] were previously reported25. In the present study, all PLM-CO scores were 114

MANUSCRIP
T
ACCEPTED
ACCEPTED MANUSCRIPT
6
incorporated into a new analysis to assess correlation with an analogous SEM assessment 115
(described below). 116
Collagen orientation was labelled (PLM-OL) in each region of interest (ROI) as 117
either vertical, horizontal, oblique, multiple, or non-oriented (Figure 2) by viewing 118
sections at the microscope and rotating with respect to the fixed crossed polarizers. ROIs 119
were defined as either a single zone (superficial, transitional, deep), or an area of 120
birefringent or non-birefringent tissue. Orientation was referenced to the subchondral 121
bone-cartilage interface. 122
Thicknesses of ROIs and total cartilage were measured on digital PLM images 123
using a customized Bioquant template (Bioquant Osteo II v.8.40.20, Nashville, TN). 124
PLM images were captured with a camera (Hitachi HV-F22 Progressive Scan Colour 3-125
CCD) mounted on the microscope. Image processing included extracting the green plane 126
from the original RGB image, equalizing to improve contrast, and deconvoluting to 127
sharpen edges (Northern Eclipse v7.0, Empix Imaging Inc., Mississauga, Canada). 128
Birefringence characteristics, judged by the reader, were used to distinguish boundaries 129
between ROIs. Average thickness was calculated from a minimum of seven, equally-130
spaced line measurements per ROI. Total cartilage thickness was determined 131
independently in a similar manner. For each biopsy, average ROI thicknesses were 132
summed and compared to the independently-measured average total cartilage thickness. 133
If they differed by less than 10% ROI thickness measurements were accepted. 134
135
136
137
MANUSCRIP
T
ACCEPTED
ACCEPTED MANUSCRIPT
7
SEM Analyses 138
Low magnification (80x) SEM images were annotated with ROIs observed in 139
PLM and sites for high magnification imaging identified (Figure 3). These sites were 140
placed at regular intervals to ensure systematic sampling of collagen orientation. High 141
magnification images (80,000x), averaging (±95% CI) 16±2 images per sample, were 142
captured at each pre-defined site and used to determine collagen orientation (SEM-OL), 143
overall collagen organization (Cumulative SEM-CO), and to measure fibre diameters 144
(Table 1). These methods were developed and tested during separate unpublished 145
validation studies, which were reviewed by an independent quality assurance unit. 146
Collagen orientation labels (SEM-OL) describe the predominant orientation in 147
each image (Figure 4). To assess whether the collection of SEM images captured for each 148
ROI reflected the global orientation observed in PLM, SEM-OL were compared to PLM-149
OL. A correspondence score, from 0-2, was assigned, where a score of 2 signified that 150
SEM confirmed the orientation identified by PLM, 0 signified that it did not, and a score 151
of 1 was intermediate. A correspondence score of 2 was assigned when SEM-OL 152
matched PLM-OL in more than two-thirds of SEM images, a score of 1 if this criteria 153
was satisfied by one-third to two-thirds of images, and 0 when less than one-third of 154
SEM-OL agreed with PLM-OL. For example, in a panel of 9 SEM images, a score of 2 155
applied when at least 7 images matched PLM, a score of 1 when 4-6 images reflected 156
PLM, and a score of 0 if less than 3 agreed with PLM. 157
The SEM collagen organization score (Cumulative SEM-CO) was used to gauge 158
the extent that overall CO resembled that of hyaline cartilage; an assessment analogous to 159
the PLM-CO score25. First, each ROI identified in PLM (Figure 3), was assigned to either 160

MANUSCRIP
T
ACCEPTED
ACCEPTED MANUSCRIPT
8
SZ, TZ or DZ based on its location within the sample. For example, an ROI adjacent to 161
subchondral bone was assigned to the DZ, while an ROI at the articulating surface was 162
assigned to the SZ. The orientation in each SEM image was then scored (SEM-CO), 163
based on the orientation expected for that particular zone, on an ordinal scale of 0-2 164
(Table 2). Appropriate orientation scored 2 while inappropriate orientation scored 0, with 165
1 being intermediate. Scoring was performed independently by three trained readers, then 166
averaged for each zone, and finally averaged scores were summed to produce a single 167
Cumulative SEM-CO score per biopsy. Reader training involved demonstrating how to 168
assign orientations and SEM-CO scores by comparing against a bank of example images. 169
Collagen fibre diameters were measured using XT Docu v.3.2 (Soft Imaging 170
System GmbH, FEI Company, Hillsboro, OR). Calibration was performed from 10x to 171
200,000x magnifications with NIST-traceable MRS-4 patterns (Geller Microanalytical 172
Laboratory, Boston, MA). An average of 12±1 fibres were measured per image with an 173
average of 16±2 images collected per sample. 174
175
Statistical Analysis 176
Shapiro-Wilk tests for normality indicated a mixture of normal (PLM-CO, 177
p>0.05) and non-normal (Cumulative SEM-CO, p<0.05) distributions. Correlation 178
coefficients between the PLM-CO and SEM-CO scores were calculated. Outliers, defined 179
as residuals greater than 2 standard deviations, were removed depending on Cook’s 180
distances, which evaluate the influence of individual data points on the regression model, 181
and upon close examination of the data35. Sensitivity testing was performed by running 182
an equivalent non-parametric test, the Spearman rank order correlation, for comparison. 183

MANUSCRIP
T
ACCEPTED
ACCEPTED MANUSCRIPT
9
Zonal distributions of fibre diameter measurements were examined using histograms. 184
Analyses were performed using Statistica v.9 (StatSoft Inc., Tulsa, OK). 185
186
Results 187
188
SEM confirms collagen orientation observed in PLM 189
SEM-OL verified that global fibre orientations observed in PLM reflected 190
collagen ultrastructure. SEM-OL/PLM-OL correspondence was confirmed in 91.6% of 191
ROIs (76 of 83 ROIs) assessed from 28 biopsies, which received scores of 1 or 2. The 192
remaining 8.4% (7 ROIs) received scores of 0, reflecting disagreement between PLM and 193
SEM, and consisted mainly of regions with PLM-OL of multiple. The restricted field of 194
view of the SEM images, where one 80,000x image covers a 3.42 x 2.96 µm2 area, did 195
not always capture global orientation in regions where mixtures of oriented and non-196
oriented tissue were present. 197
198
PLM-CO and SEM-CO scores are moderately correlated 199
The Cumulative SEM-CO score was linearly correlated to the average PLM-CO 200
score, r=0.681 (p=0.00001, R2=0.463, n=34). Two outliers were identified with residuals 201
greater than two standard deviations and large Cook’s distances compared to other data 202
points, indicating a greater than average influence on the regression model. Outlier 203
exclusion improved the correlation to r=0.786 (p<0.00001, R2=0.618, n=32) (Figure 5). 204
Variability observed between the scores emphasizes differences in their respective 205
approaches. This is exemplified by both outliers, which were repair cartilage with 206

MANUSCRIP
T
ACCEPTED
ACCEPTED MANUSCRIPT
10
irregular tissue characteristics compared to the majority of biopsies. Outlier A (PLM-207
CO=0.33, Cumulative SEM-CO=5.29) was unusual because mixed mesenchymal tissue 208
occupied greater than 50% of the biopsy width near the subchondral bone-cartilage 209
interface. A narrow vertically-oriented DZ was visible but deemed insufficient for 210
anchoring repair cartilage to subchondral bone, resulting in a low PLM-CO score. The 211
elevated Cumulative SEM-CO score arose because additional zones above the DZ were 212
included, whereas in the PLM-CO score they are excluded by definition when the DZ is 213
inadequate. Outlier B (PLM-CO=2.00, Cumulative SEM-CO=0.97) consisted of multiple 214
fragmented pieces but received a relatively high PLM-CO score because the DZ occupied 215
the full thickness of repair tissue attached to subchondral bone. The lower SEM-CO score 216
reflected DZ orientation that deviated from vertical. Outlier B occurs because of length 217
scale differences, where SEM could resolve vertical and oblique orientations while global 218
orientation (PLM) was best described as vertical. 219
Results obtained from the Spearman rank order correlation were concurrent with 220
parametric testing. Significant (p<0.05) correlations between CO methods were detected, 221
where r=0.527 (n=34) or r=0.617 (n=32) when outliers were removed. 222
223
Zonal proportions 224
Values are reported as mean with uncertainty expressed by 95% confidence 225
intervals (CI): mean (lower limit, upper limit). 226
Normal cartilage biopsies (n=6), consisting of 5 from central MFCs and 1 from 227
the central region of a femoral head, had zonal proportions ranging from 58-87% [74.0% 228

MANUSCRIP
T
ACCEPTED
ACCEPTED MANUSCRIPT
11
(64.9%, 83.1%)] in the DZ, 8-31% [18.6% (11.6%, 25.6%)] in the TZ, and 5-10% [7.3% 229
(6.1%, 8.5%)] in the SZ. 230
Zonal proportions were altered in degraded cartilage where the DZ, TZ, and SZ 231
occupied 33-59% [45.6% (34.8%, 56.3%), n=4], 36-59% [47.2 (37.1%, 57.4%), n=4], 232
and 5-17% [9.5% (6.1%, 13.0%), n=6], respectively. In 2 of 6 biopsies, no distinction 233
could be made between the transitional and deep zones17 and thus they were measured 234
together. Both had predominantly vertical orientation in PLM, although non–uniform, 235
with darkened areas indicating pericellular degradation (Figure 1). 236
The variable organization of the repair cartilage tissues prevented representative 237
zonal proportions from being calculated for this group as a whole. 238
239
Collagen fibre diameters 240
Histograms of collagen fibre diameters illustrate characteristics related to tissue 241
type (Figure 6). In normal cartilage, a pattern of increasing diameter with depth from the 242
articular surface was observed. Fibres in repair cartilage were smaller in diameter on 243
average with narrower ranges in the TZ and DZ. Diameters in degraded cartilage 244
exhibited a wider range compared to either normal or repair. Evidence of a bimodal 245
distribution was present in 3 of 6 degraded biopsies. 246

MANUSCRIP
T
ACCEPTED
ACCEPTED MANUSCRIPT
12
Discussion 247
This study provides a detailed comparison of collagen structure in normal, 248
degraded and repair cartilages that could contribute to developing repair procedures 249
capable of recreating functional collagen architecture. Characterizing normal collagen 250
structure establishes a benchmark against which repair cartilage can be compared, and 251
analyses of degraded cartilage identifies structural features that would ideally be avoided. 252
Both study hypotheses were supported; overall CO was successfully assessed at different 253
length scales, and different cartilage types exhibited separate zonal proportions and fibre 254
diameter profiles. 255
256
Validation of the PLM-CO score using SEM 257
PLM-CO and Cumulative SEM-CO evaluated collagen organization at different 258
length scales and were correlated (r=0.786), thereby demonstrating internal consistency 259
between these methods (Figure 5). Discrepancies between the two methods were 260
associated with the highly localized nature of the SEM images. In principle, either 261
approach is appropriate, however, while SEM is a powerful tool for observing 262
ultrastructural details in biological samples at a submicrometric level, it requires 263
specialized equipment and sample preparation methods, and is labour intensive. In 264
contrast, PLM can be performed on unstained histological sections that can be examined 265
promptly on a light microscope equipped with polarization filters. 266
PLM relies on inferences about orientation based on the optical properties of 267
fibrillar collagen and does not directly identify collagen fibres. We found a high PLM-268
OL/SEM-OL correspondence (91.6%) establishing that the global orientations observed 269

MANUSCRIP
T
ACCEPTED
ACCEPTED MANUSCRIPT
13
in PLM reflected the actual orientation of collagen fibres, as described previously28,31,36. 270
Thus, the PLM-CO score could reasonably be incorporated into routine histological 271
assessment of repair cartilage without adding significantly to study costs. 272
273
Features of Normal Articular Cartilage 274
Normal articular cartilage received PLM-CO scores from 3-5 (maximum 5) and 275
SEM-CO scores greater than 4 (maximum 6) (Figure 5). PLM revealed smooth texture 276
with visible cell lacunae25 (Figure 1) and SEM illustrated expected zonal orientations 277
(Figure 3). 278
Proportions of total thickness, averaging 74% (DZ), 19% (TZ) and 7% (SZ) were 279
similar to the approximate percentages for human knee cartilage of 63% (DZ), 26% (TZ) 280
and 9% (SZ) reported by Kurkijarvi et al.37, and coincide with the ranges (average±SD) 281
of 75.4±11.4% (DZ), 19.5±10.1% (TZ), and 5.2±2.2% (SZ) reported by Nissi et al.38. 282
Similarly, the pattern of fibre diameters increasing with depth from the articular 283
surface (Figure 6) is consistent with previous reports in humans16,39,40 and animals4,24,27,41. 284
Absolute diameters of collagen are more difficult to compare because they vary with 285
anatomical location and measurement technique. 286
287
Features of Degraded Articular Cartilage 288
PLM-CO of degraded cartilage were between 2-3 and all samples exhibited a 289
patchy texture, resulting from a loss of pericellular birefringence, and decreased Safranin-290
O staining in the interterritorial matrix (Figure 1). In 5 of 6 degraded biopsies, SEM-CO 291
were higher than what might be expected based on the regression line (Figure 5). Zonal 292

MANUSCRIP
T
ACCEPTED
ACCEPTED MANUSCRIPT
14
proportions were altered compared to normal, often with the DZ reduced and the TZ 293
increased. 294
These features of degraded cartilage can be attributed to matrix alterations 295
associated with early osteoarthritis, where enzymatic degradation mediated by 296
chondrocytes leads to a disordered, non-birefringent, collagen architecture in the 297
pericellular matrix42,43. Decreased crosslinking or interconnectedness in the interterritorial 298
matrix reduces proteoglycan retention, resulting in decreased Safranin-O staining, 299
although fibres generally remain radially oriented44 (Figure 3). Proteoglycan depletion, 300
commonly detected in softened cartilage, may have enhanced the appearance of collagen 301
fibres in SEM, resulting in higher SEM-CO scores (Figures 3 & 5). 302
The bimodal distribution of fibre diameters (Figure 6) and the larger diameter 303
range present in degraded cartilage compared to normal have not been previously 304
reported, although the general ultrastructure of osteoarthritic cartilage has been 305
described15,16,39,40,45. The novel observation of a population of smaller fibres suggests 306
remodelling processes or collagen fibre unravelling may be occurring. While the turnover 307
rate in healthy adult cartilage is extremely low7,8, chondrocytes in injured cartilage can 308
increase synthesis of extracellular matrix components8,46,47. Recently, improved SEM 309
protocols have provided evidence of collagen fibres disassembling into prototypic fibrils 310
in osteoarthritic cartilage45. 311
312
Features of Repair Cartilage 313
Repair cartilage demonstrated greater variability and complexity in organization 314
and spanned the full range of CO scores (Figure 5). Several biopsies received PLM-CO 315

MANUSCRIP
T
ACCEPTED
ACCEPTED MANUSCRIPT
15
above 2, indicating the ability of microfracture-based cartilage repair procedures to 316
produce repair tissue with multi-zonal architecture one year post-treatment. Considering 317
the SEM analyses, this study provides the first ultrastructural evidence of collagen fibres 318
in repair cartilage approximating the stratified organization observed in native cartilage. 319
Our study is the first to report collagen fibre diameters from human repair 320
cartilage. They ranged from approximately 25-130nm and contained smaller fibres than 321
normal cartilage (Figure 6). However, evidence of the pattern of larger fibres in the DZ 322
that diminish near the articular surface was detected in 5 out of 11 multi-zonal repair 323
biopsies. Fibre diameters of repair cartilage produced by ACT in an immature pig model 324
ranged from 20-80nm 1 year post-op, with occasional fibres greater than 100nm24. A 325
similar range was reported in tissue produced in a chondrocyte-polymer construct 326
cultured with calf chondrocytes after 6 weeks under optimized bioreactor conditions23. In 327
these studies, measurements were made throughout the cartilage depth and were 328
comparable to controls, which were both immature animal models23, 24. Thus, our study is 329
the first to demonstrate that microfracture-based cartilage repair procedures could 330
reproduce zone dependent collagen fibre diameters. 331
The importance of recreating collagen structure in repair cartilage was 332
acknowledged in recent reviews13,14 because it is recognized as a critical factor for 333
biomechanical function and durability of articular cartilage. Understanding the biological 334
processes that lead to the characteristic anisotropy of mature cartilage is important for 335
achieving this goal5,13 as is having the ability to evaluate CO in a way that allows 336
comparisons between repair strategies. To date, cartilage repair studies describing CO, 337
produced by ACT or microfracture in humans or animals, have employed PLM to 338

MANUSCRIP
T
ACCEPTED
ACCEPTED MANUSCRIPT
16
describe general tissue morphology, or to illustrate collagen anchoring repair tissue to 339
subchondral bone, but have not detailed different levels of CO17-19,48-50. The PLM-CO 340
score25, which was validated in the present study, provides a means of systematically 341
assessing CO in repair tissues and could facilitate comparisons among repair strategies. 342
343
Technical Considerations & Limitations 344
The variable nature of collagen structure in repair cartilage prompted the 345
development of semi-quantitative approaches for measuring zone proportions and 346
comparing fibre orientations. These methods were more flexible than rigorous 347
quantitative PLM approaches20 yet were applied by multiple readers with high 348
reproducibility (data not shown) and provided a meaningful assessment of collagen 349
structure in various cartilage types. 350
Similarly, sample preparation methods for SEM were developed for compatibility 351
with human repair biopsies. We believe this is the first report describing SEM imaging of 352
standard histological sections of articular cartilage. The fragility of these sections to 353
electron beam exposure precluded removing non-collagenous components, which may 354
have contributed to the smooth, lamellar SZ appearance (Figure 3) by masking fibrillar 355
structure. Critical point drying was not used as it can obscure collagen fibre appearance 356
compared to air-drying51. 357
The close proximity of PLM-CO and SEM-CO scores between normal and 358
degraded biopsies emphasizes the continuous nature of cartilage degeneration, suggesting 359
that zonal organization alone may be insufficient to distinguish mildly degenerated 360
cartilage from normal. Variability was due to the tissue sources, cadaveric knees or 361

MANUSCRIP
T
ACCEPTED
ACCEPTED MANUSCRIPT
17
osteoarthritic femoral heads, where the extent of degradation could not be controlled. 362
However, other features were associated with degraded cartilage, including loss of 363
pericellular orientation and altered zonal proportions. Bimodal fibre diameter profiles 364
were not observed in 3 biopsies likely because of the range of degradative changes 365
present. Nonetheless, assessing birefringence characteristics is important because it 366
permits an appreciation of collagen orientation, which is not possible with conventional 367
histological methods. 368
369
Conclusions 370
Characterization of the collagen network provides important data about this 371
critical cartilage feature essential to successful biomechanical function and durability. 372
Normal cartilage was multi-zonal with proportions averaging 74% (DZ), 19% (TZ) and 373
7% (SZ), and fibre diameters averaging 108.2 (106.4, 109.9) nm (DZ) and decreasing to 374
87.5 (85.8, 89.3) nm (TZ) and 55.8 (46.4, 65.2) nm (SZ). Degraded cartilage had altered 375
zonal proportions, approximately 46% (DZ), 47% (TZ) and 10% (SZ), loss of pericellular 376
birefringence, and evidence of bimodal fibre diameter distributions possibly indicating 377
remodelling or collagen fibre disassembly. Repair biopsies revealed that microfracture-378
based repair procedures are capable of producing stratified collagen architecture that 379
approximates normal cartilage, although fibres were thinner than normal 1-year post-380
treatment. The PLM-CO score was validated using systematically-sampled SEM images 381
and offers a simple method for assessing CO that reflects genuine collagen ultrastructure. 382
The PLM-CO score can assist investigators in their efforts towards recreating the 383

MANUSCRIP
T
ACCEPTED
ACCEPTED MANUSCRIPT
18
specialized collagen network of articular cartilage, which is an important endpoint for 384
cartilage repair procedures. 385
386
Acknowledgements: The authors thank Dr. W.D. Stanish (Orthopaedic Surgery 387
Department, Dalhousie University, Halifax, Canada), principal investigator of the multi-388
centre randomized clinical trial from which repair biopsies were obtained, as well as all 389
of the participating surgeons, Drs. P. MacDonald (Pan Am Clinic, Winnipeg, Canada), N. 390
Mohtadi (Orthopedics, University of Calgary Sports Medicine Center, Calgary, Canada), 391
P. Marks (Sunnybrook Health Sciences Centre, Toronto, Canada), M. Malo (Hôpital du 392
Sacré-Coeur de Montréal, Montreal, Canada), R. McCormack (New West Sports 393
Medicine, Vancouver, Canada), J. Desnoyers (Orthopedic Surgery, Hôpital Charles 394
LeMoyne, Greenfield Park, Canada), S. Pelet (Centre Hospitalier Affilié Universitaire de 395
Québec (CHAUQ), Quebec City, Canada), G. Lopez (FREMAP Centro de Prevención y 396
Rehabilitación, Madrid, Spain), J. Vaquero (Hospital General Universitario Gregorio 397
Marañón, Madrid, Spain), F. Maculé (Hospital Clinic i Provincial de Barcelona, 398
Barcelona, Spain). We acknowledge Dr. Anie Philip for providing degraded cartilage 399
samples, Dr. Jun Sun for biopsy retrieval, Dr. Gaoping Chen and Viorica Lascau-Coman 400
for preparation of the histological sections, and Julie Tremblay for quality assurance. 401
402
Funding provided by the Natural Sciences and Engineering Research Council of Canada 403
(NSERC), Canadian Institutes of Health Research (CIHR), BioSyntech Canada Inc., and 404
the Biomedical Science and Technology Research Group/Le Groupe de recherche en 405
sciences et technologies biomédicales (GRSTB). 406
MANUSCRIP
T
ACCEPTED
ACCEPTED MANUSCRIPT
19
Conflict of Interest Statement: The authors report no conflict of interest. 407
408
Authors’ Contributions : The authors participated in the study conception and design 409
(Changoor, MN, MDB), clinical trial design and management (AR, MS) and retrieval of 410
repair cartilage biopsies (AR, MS). The authors acquired data (Changoor, MN, SM, 411
NTK, Chevrier, CH), performed statistical analysis and data assembly (Changoor), as 412
well as data interpretation (all authors). The authors contributed to drafting the 413
manuscript (Changoor, MDB) and critical revision (all authors). All authors approved the 414
final version of the manuscript. AC ([email protected]) and MDB 415
([email protected]) take responsibility for the integrity of the work as a 416
whole. 417

MANUSCRIP
T
ACCEPTED
ACCEPTED MANUSCRIPT
20
References 418
419
1. Korhonen RK, Wong M, Arokoski J, Lindgren R, Helminen HJ, Hunziker EB, et 420
al. Importance of the superficial tissue layer for the indentation stiffness of 421
articular cartilage. Med Eng Phys 2002;24(2):99-108. 422
2. Shirazi R, Shirazi-Adl A, Hurtig M. Role of cartilage collagen fibrils networks in 423
knee joint biomechanics under compression. J Biomech 2008;41(16):3340-8. 424
3. Benninghoff A. Form und bau der gelenkknorpel in ihren beziehungen zur 425
funktion. Zeitschrift fur Zellforschung 1925;2:783-862. 426
4. Hedlund H, Mengarelli-Widholm S, Reinholt FP, Svensson O. Stereologic studies 427
on collagen in bovine articular cartilage. APMIS 1993;101(2):133-40. 428
5. Hunziker EB, Kapfinger E, Geiss J. The structural architecture of adult 429
mammalian articular cartilage evolves by a synchronized process of tissue 430
resorption and neoformation during postnatal development. Osteoarthritis 431
Cartilage 2007;15(4):403-13. 432
6. van Turnhout MC, Schipper H, Engel B, Buist W, Kranenbarg S, van Leeuwen 433
JL. Postnatal development of collagen structure in ovine articular cartilage. BMC 434
Dev Biol 2010;10:62. 435
7. Bank RA, Bayliss MT, Lafeber FP, Maroudas A, Tekoppele JM. Ageing and 436
zonal variation in post-translational modification of collagen in normal human 437
articular cartilage. The age-related increase in non-enzymatic glycation affects 438
biomechanical properties of cartilage. Biochem J 1998;330 ( Pt 1):345-51. 439
8. Eyre D. Collagen of articular cartilage. Arthritis Res 2002;4(1):30-5. 440

MANUSCRIP
T
ACCEPTED
ACCEPTED MANUSCRIPT
21
9. Crawford DC, Heveran CM, Cannon WD, Jr., Foo LF, Potter HG. An autologous 441
cartilage tissue implant neocart for treatment of grade III chondral injury to the 442
distal femur: Prospective clinical safety trial at 2 years. Am J Sports Med 443
2009;37(7):1334-43. 444
10. Saris DB, Vanlauwe J, Victor J, Haspl M, Bohnsack M, Fortems Y, et al. 445
Characterized chondrocyte implantation results in better structural repair when 446
treating symptomatic cartilage defects of the knee in a randomized controlled trial 447
versus microfracture. Am J Sports Med 2008;36(2):235-46. 448
11. Shive MS, Hoemann CD, Restrepo A, Hurtig MB, Duval N, Ranger P, et al. BST-449
CarGel: In situ chondroinduction for cartilage repair. Operative Techniques in 450
Orthopaedics 2006;16:271-8. 451
12. Mithoefer K, McAdams T, Williams RJ, Kreuz PC, Mandelbaum BR. Clinical 452
efficacy of the microfracture technique for articular cartilage repair in the knee: 453
An evidence-based systematic analysis. Am J Sports Med 2009;37(10):2053-63. 454
13. Hunziker EB. The elusive path to cartilage regeneration. Adv Mater 2009;21(32-455
33):3419-24. 456
14. Responte DJ, Natoli RM, Athanasiou KA. Collagens of articular cartilage: 457
Structure, function, and importance in tissue engineering. Crit Rev Biomed Eng 458
2007;35(5):363-411. 459
15. Clark JM, Simonian PT. Scanning electron microscopy of "fibrillated" and 460
"malacic" human articular cartilage: Technical considerations. Microsc Res Tech 461
1997;37(4):299-313. 462

MANUSCRIP
T
ACCEPTED
ACCEPTED MANUSCRIPT
22
16. Redler I. A scanning electron microscopic study of human normal and 463
osteoarthritic articular cartilage. Clin Orthop Relat Res 1974(103):262-8. 464
17. Bi X, Li G, Doty SB, Camacho NP. A novel method for determination of collagen 465
orientation in cartilage by fourier transform infrared imaging spectroscopy (FT-466
IRIS). Osteoarthritis Cartilage 2005;13(12):1050-8. 467
18. Gooding CR, Bartlett W, Bentley G, Skinner JA, Carrington R, Flanagan A. A 468
prospective, randomised study comparing two techniques of autologous 469
chondrocyte implantation for osteochondral defects in the knee: Periosteum 470
covered versus type I/III collagen covered. Knee 2006;13(3):203-10. 471
19. Richardson JB, Caterson B, Evans EH, Ashton BA, Roberts S. Repair of human 472
articular cartilage after implantation of autologous chondrocytes. J Bone Joint 473
Surg Br 1999;81(6):1064-8. 474
20. Vasara AI, Hyttinen MM, Pulliainen O, Lammi MJ, Jurvelin JS, Peterson L, et al. 475
Immature porcine knee cartilage lesions show good healing with or without 476
autologous chondrocyte transplantation. Osteoarthritis Cartilage 477
2006;14(10):1066-74. 478
21. Elder BD, Athanasiou KA. Effects of confinement on the mechanical properties 479
of self-assembled articular cartilage constructs in the direction orthogonal to the 480
confinement surface. J Orthop Res 2008;26(2):238-46. 481
22. Kelly TA, Ng KW, Wang CC, Ateshian GA, Hung CT. Spatial and temporal 482
development of chondrocyte-seeded agarose constructs in free-swelling and 483
dynamically loaded cultures. J Biomech 2006;39(8):1489-97. 484

MANUSCRIP
T
ACCEPTED
ACCEPTED MANUSCRIPT
23
23. Riesle J, Hollander AP, Langer R, Freed LE, Vunjak-Novakovic G. Collagen in 485
tissue-engineered cartilage: Types, structure, and crosslinks. J Cell Biochem 486
1998;71(3):313-27. 487
24. Langsjo TK, Vasara AI, Hyttinen MM, Lammi MJ, Kaukinen A, Helminen HJ, et 488
al. Quantitative analysis of collagen network structure and fibril dimensions in 489
cartilage repair with autologous chondrocyte transplantation. Cells Tissues Organs 490
2010. 491
25. Changoor A, Tran-Khanh N, Methot S, Garon M, Hurtig MB, Shive MS, et al. A 492
polarized light microscopy method for accurate and reliable grading of collagen 493
organization in cartilage repair. Osteoarthritis Cartilage 2011;19(1):126-35. 494
26. Modis L. Physical backgrounds of polarization microscopy. In: Organization of 495
the extracellular matrix: A polarization microscopic approach, Modis L, Ed. Boca 496
Raton: CRC Press 1991:9-30. 497
27. Arokoski JP, Hyttinen MM, Lapvetelainen T, Takacs P, Kosztaczky B, Modis L, 498
et al. Decreased birefringence of the superficial zone collagen network in the 499
canine knee (stifle) articular cartilage after long distance running training, 500
detected by quantitative polarised light microscopy. Ann Rheum Dis 501
1996;55(4):253-64. 502
28. Hughes LC, Archer CW, ap Gwynn I. The ultrastructure of mouse articular 503
cartilage: Collagen orientation and implications for tissue functionality. A 504
polarised light and scanning electron microscope study and review. Eur Cell 505
Mater 2005;9:68-84. 506

MANUSCRIP
T
ACCEPTED
ACCEPTED MANUSCRIPT
24
29. Kiraly K, Hyttinen MM, Lapvetelainen T, Elo M, Kiviranta I, Dobai J, et al. 507
Specimen preparation and quantification of collagen birefringence in unstained 508
sections of articular cartilage using image analysis and polarizing light 509
microscopy. Histochem J 1997;29(4):317-27. 510
30. Rieppo J, Toyras J, Nieminen MT, Kovanen V, Hyttinen MM, Korhonen RK, et 511
al. Structure-function relationships in enzymatically modified articular cartilage. 512
Cells Tissues Organs 2003;175(3):121-32. 513
31. Speer DP, Dahners L. The collagenous architecture of articular cartilage. 514
Correlation of scanning electron microscopy and polarized light microscopy 515
observations. Clin Orthop Relat Res 1979(139):267-75. 516
32. Ortmann R. Use of polarized light for quantitative determination of the 517
adjustment of the tangential fibres in articular cartilage. Anat Embryol (Berl) 518
1975;148(2):109-20. 519
33. Zhou W, Apkarian RP, Wang ZL, Joy D. Fundamentals of scanning electron 520
microscopy. In: Scanning microscopy for nanotechnology: Techniques and 521
applications, Zhou W, Wang ZL, Eds. New York: Springer 2006:1-40. 522
34. Hoemann CD, Tran-Khanh N, Methot S, Chen G, Marchand C, Lascau-Coman V, 523
et al. Correlation of tissue histomorphometry with ICRS histology scores in 524
biopsies obtained from a randomized controlled clinical trial comparing BST-525
CarGel™ versus microfracture (abstract). Paper presented at: International 526
Cartilage Repair Society Congress 2010; Sitges, Spain. 527

MANUSCRIP
T
ACCEPTED
ACCEPTED MANUSCRIPT
25
35. Chatterjee S, Hadi AS. Simple linear regression. In: Regression analysis by 528
example. Fourth Edition ed. Hoboken, New Jersey: John Wiley & Sons, Inc. 529
2006:21-52. 530
36. Kaab MJ, Gwynn IA, Notzli HP. Collagen fibre arrangement in the tibial plateau 531
articular cartilage of man and other mammalian species. J Anat 1998;193 (Pt 532
1):23-34. 533
37. Kurkijarvi JE, Nissi MJ, Rieppo J, Toyras J, Kiviranta I, Nieminen MT, et al. The 534
zonal architecture of human articular cartilage described by t2 relaxation time in 535
the presence of Gd-DTPA2. Magn Reson Imaging 2008;26(5):602-7. 536
38. Nissi MJ, Rieppo J, Toyras J, Laasanen MS, Kiviranta I, Jurvelin JS, et al. T(2) 537
relaxation time mapping reveals age- and species-related diversity of collagen 538
network architecture in articular cartilage. Osteoarthritis Cartilage 539
2006;14(12):1265-71. 540
39. Hwang WS, Li B, Jin LH, Ngo K, Schachar NS, Hughes GN. Collagen fibril 541
structure of normal, aging, and osteoarthritic cartilage. J Pathol 1992;167(4):425-542
33. 543
40. Weiss C, Rosenberg L, Helfet AJ. An ultrastructural study of normal young adult 544
human articular cartilage. J Bone Joint Surg Am 1968;50(4):663-74. 545
41. Clarke IC. Articular cartilage: A review and scanning electron microscope study. 546
1. The interterritorial fibrillar architecture. J Bone Joint Surg Br 1971;53(4):732-547
50. 548
42. Hollander AP, Pidoux I, Reiner A, Rorabeck C, Bourne R, Poole AR. Damage to 549
type II collagen in aging and osteoarthritis starts at the articular surface, originates 550

MANUSCRIP
T
ACCEPTED
ACCEPTED MANUSCRIPT
26
around chondrocytes, and extends into the cartilage with progressive 551
degeneration. J Clin Invest 1995;96(6):2859-69. 552
43. Poole CA. Articular cartilage chondrons: Form, function and failure. J Anat 553
1997;191 ( Pt 1):1-13. 554
44. Chen MH, Broom N. On the ultrastructure of softened cartilage: A possible model 555
for structural transformation. J Anat 1998;192 ( Pt 3):329-41. 556
45. Stolz M, Gottardi R, Raiteri R, Hansen U, Bruckner P, Daniels AU, et al. The 557
supramolecular structure and assembly of collagen fibrils in normal and 558
osteoarthritic human articular cartilage by scanning electron microscopy 559
(abstract). Paper presented at: Annual Meeting of the Orthopaedic Research 560
Society, 2011; Long Beach, California, USA. 561
46. Lippiello L, Hall D, Mankin HJ. Collagen synthesis in normal and osteoarthritic 562
human cartilage. J Clin Invest 1977;59(4):593-600. 563
47. Nelson F, Dahlberg L, Laverty S, Reiner A, Pidoux I, Ionescu M, et al. Evidence 564
for altered synthesis of type II collagen in patients with osteoarthritis. J Clin 565
Invest 1998;102(12):2115-25. 566
48. Knutsen G, Engebretsen L, Ludvigsen TC, Drogset JO, Grontvedt T, Solheim E, 567
et al. Autologous chondrocyte implantation compared with microfracture in the 568
knee. A randomized trial. J Bone Joint Surg Am 2004;86-A(3):455-64. 569
49. Roberts S, McCall IW, Darby AJ, Menage J, Evans H, Harrison PE, et al. 570
Autologous chondrocyte implantation for cartilage repair: Monitoring its success 571
by magnetic resonance imaging and histology. Arthritis Res Ther 2003;5(1):R60-572
73. 573

MANUSCRIP
T
ACCEPTED
ACCEPTED MANUSCRIPT
27
50. Roberts S, Menage J, Sandell LJ, Evans EH, Richardson JB. 574
Immunohistochemical study of collagen types I and II and procollagen IIa in 575
human cartilage repair tissue following autologous chondrocyte implantation. 576
Knee 2009;16(5):398-404. 577
51. Kobayashi S, Yonekubo S, Kurogouchi Y. Cryoscanning electron microscopic 578
study of the surface amorphous layer of articular cartilage. J Anat 1995;187(Pt 579
2):429-44. 580
581

MANUSCRIP
T
ACCEPTED
ACCEPTED MANUSCRIPT
28
List of Figures 582
583
Figure 1: Histological images for (a-c) normal (PLM-CO score=3.67, Cumulative SEM-584
CO score=5.04) and (d-f) degraded (PLM-CO score=3.33, Cumulative SEM-CO 585
score=2.93) cartilage. An example (g-i) of high quality repair cartilage that received a 586
PLM-CO score of 3.00 and Cumulative SEM-CO score of 4.72. Images are from 587
consecutive sections and are Safranin-O/Fast Green/iron hematoxylin stained (a, d, g), 588
collagen type II immunostained (b, e, h) or unstained and viewed in polarized light (c, f, 589
i). The PLM-CO score ranges from 0 to 5 and the Cumulative SEM-CO score ranges 590
from 0 to 6. The image in (c) was published previously25. 591
592
Figure 2: Labels used to describe collagen orientation observed in PLM (PLM-OL) with 593
examples. Orientations are referenced to the subchondral bone (SB)-cartilage interface. 594
Arrows indicate the direction of the section with respect to the analyzer filter, where 595
sections A, B & D were at 45° and sections C & E were at 90°. (A) Vertically oriented 596
tissue, identified by the bracket, is perpendicular to the subchondral bone visible at the 597
bottom of the image. (B) Horizontally oriented tissue is present above the dotted line. (C) 598
Oblique cartilage emanating from subchondral bone becomes birefringent only at 90° 599
indicating that fibres are at approximately 45° to the subchondral bone interface. (D) 600
Non-oriented tissue is illustrated in the region bounded by dotted lines. Birefringent 601
tissue can be observed at the bottom of the image. (E) An example of a region with 602
multiple orientations, where the (*) indicates birefringent, predominantly vertically 603
oriented tissue and the (>) indicates non-oriented tissue. ROIs are defined as either a 604

MANUSCRIP
T
ACCEPTED
ACCEPTED MANUSCRIPT
29
single zone (superficial, transitional, deep), or an area of birefringent or non-birefringent 605
tissue. Scale bars are 250 µm. 606
607
Figure 3: Examples of SEM images for normal, repair and degraded cartilages from the 608
superficial, transitional and deep zones. The top row contains the low magnification (80x) 609
SEM images (scale bars are 500 µm) with the non-calcified tissue outlined in white and 610
surrounded by carbon substrate. Zones are identified (SZ, TZ, DZ), as well as the sites 611
where high magnification images were captured (�). Subsequent rows contain one high 612
magnification (80 000x) image per zone per cartilage type and the location from which 613
each image was captured is identified by (�) on the corresponding low magnification 614
image. Scale bars are 500 µm and 500 nm for low and high magnification images 615
respectively. 616
617
Figure 4: Reference SEM images illustrating the collagen fibre orientations used to 618
assign collagen orientation labels (SEM-OL). The orientation labels Vertical (A), 619
Horizontal (B), and Oblique (C), with reference to the horizontal cartilage-bone interface, 620
were assigned if the majority of fibres were predominantly in one of these directions. 621
Non-oriented (D) was used to label images where no predominant orientation existed. 622
Multiple indicated that either (E) tissue of several different orientations were present or 623
(F) that oriented and non-oriented tissue were present in the same images. Scale bars are 624
500 nm. 625
626

MANUSCRIP
T
ACCEPTED
ACCEPTED MANUSCRIPT
30
Figure 5: Scatterplot of the Cumulative SEM-CO score vs. PLM-CO score with linear 627
regression and 95% confidence intervals with outliers removed (n=32). Data points are 628
normal (�), degraded (�), or repair (�) cartilages. Outliers are identified as A & B. 629
PLM-CO scores for 11 of 29 biopsies were reported previously25 and are used here to 630
demonstrate a linear relationship between PLM and SEM methods for evaluating 631
collagen organization. 632
633
Figure 6: Representative histograms of collagen fibre diameters from SZ, TZ & DZ of 634
(A) normal, (B) degraded and (C) repair cartilage tissues. (D) Summary of fibre diameter 635
measurements for 6 normal, 6 degraded, and 22 repair biopsies. Measurements were 636
pooled for each tissue type and numbers reported as average (AVG), 95% confidence 637
interval (95% CI), minimum (MIN), maximum (MAX), and total number of fibres (N) 638
per zone. 639
640

MANUSCRIP
T
ACCEPTED
ACCEPTED MANUSCRIPT
31
List of Tables 641
Table 1: Summary of assessments made with PLM and SEM methods. ROIs are defined 642
as either a single zone (superficial, transitional, deep), or an area of birefringent or non-643
birefringent tissue. All scores were developed and tested during separate unpublished 644
validation studies, which were reviewed by an independent quality assurance unit. 645
646
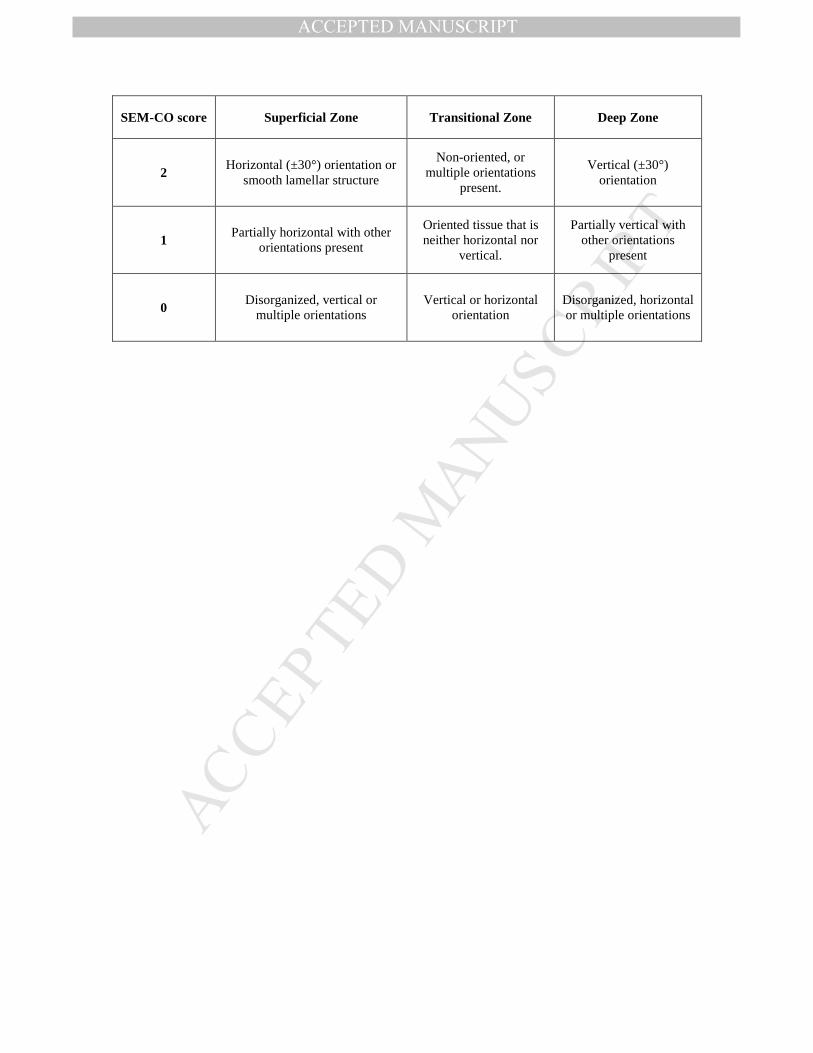
Table 2: The SEM collagen organization (SEM-CO) score for individual images. SEM-647
CO scores assess whether the orientation observed in an individual SEM image reflects 648
the orientation expected for the zone from which it originated. The SEM-CO were 649
averaged per zone and added to produce a Cumulative SEM-CO score reflecting overall 650
collagen organization. 651
652

MANUSCRIP
T
ACCEPTED
ACCEPTED MANUSCRIPT
Score Description Measurement Scale
PLM-CO Qualitative assessment of overall
collagen organization using a published PLM score25
View unstained 5µm sections at the
microscope in linear polarized light
Ordinal : 0-5 Average calculated from
scores of 3 readers. Complete scoring criteria described in Changoor et
al.25
PLM-OL Predominant orientation in each
ROI identified
View unstained 5µm sections at the
microscope in linear polarized light
1 of 5 orientation labels (Figure 2).
SEM-CO Observed orientation compared to that expected based on the
zone where the image was taken
High-magnification SEM images are scored
individually
Ordinal : 0-2 (Table 2)
Cumulative SEM-CO
SEM–CO scores averaged for each zone, then the averages
summed over 3 zones Mathematical
Continuous score: 0-6
SEM-OL Predominant orientation
observed in each SEM image
High-magnification SEM images are
labelled individually.
1 of 5 orientation labels (Figure 4)
PLM-OL/ SEM-OL
Correspondence
Correspondence between orientations observed in PLM
and SEM
For each ROI, PLM-OL is compared to the panel of SEM images labelled
with SEM-OL
Ordinal : 0-2 2=SEM/PLM agreement
1=partial agreement 0=no agreement
Zone proportions
Measurements of zone thicknesses and total cartilage
thickness
PLM images measured using software
(Bioquant Osteo II)
Zonal percentages as a proportion of total cartilage thickness
Fibre diameters Measurements of fibre diameters
An average of 12±1 fibres measured in each
high-magnification SEM image using
software (XT-Docu)
Histograms of fibre diameters by zone
MANUSCRIP
T
ACCEPTED
ACCEPTED MANUSCRIPT
SEM-CO score Superficial Zone Transitional Zone Deep Zone
2 Horizontal (±30°) orientation or
smooth lamellar structure
Non-oriented, or multiple orientations
present.
Vertical (±30°) orientation
1 Partially horizontal with other
orientations present
Oriented tissue that is neither horizontal nor
vertical.
Partially vertical with other orientations
present
0 Disorganized, vertical or
multiple orientations Vertical or horizontal
orientation Disorganized, horizontal or multiple orientations

MANUSCRIP
T
ACCEPTED
ACCEPTED MANUSCRIPT

MANUSCRIP
T
ACCEPTED
ACCEPTED MANUSCRIPT

MANUSCRIP
T
ACCEPTED
ACCEPTED MANUSCRIPT

MANUSCRIP
T
ACCEPTED
ACCEPTED MANUSCRIPT

MANUSCRIP
T
ACCEPTED
ACCEPTED MANUSCRIPT

MANUSCRIP
T
ACCEPTED
ACCEPTED MANUSCRIPT