Embed Size (px)
Citation preview
Structural Context of Mid-Tertiary Mineralization in the Mammoth and San Manuel Districts, Southeastern Arizona
U.S. GEOLOGICAL SURVEY BULLETIN 2042-C

Chapter C
Structural Context of Mid-Tertiary Mineralization in the Mammoth and San Manuel Districts, Southeastern Arizona
By ERIC R. FORCE and LESLIE J. COX
Three generations of extensional faulting and associated tilting affected mid-Tertiary mineralization of the Mammoth vein set and the newly described Shultz Spring altered area
U.S. GEOLOGICAL SURVEY BULLETIN 2042-C
MINERAL RESOURCE STUDIES ALONG THE SIERRITA-MOGOLLON TRANSECT, ARIZONA-NEW MEXICO

U.S. DEPARTMENT OF THE INTERIOR
MANUEL LUJAN, JR., Secretary
U.S. GEOLOGICAL SURVEY
Dallas L. Peck, Director
Any use of trade, product, or firm namesin this publication is for descriptive purposes onlyand does not imply endorsement by the U.S. Government
UNITED STATES GOVERNMENT PRINTING OFFICE, WASHINGTON : 1992
For sale byBook and Open-File Report Sales U.S. Geological Survey Federal Center, Box 25286 Denver, CO 80225
Library of Congress Cataloging in Publication Data
Force, Eric R.Structural context of mid-Tertiary mineralization in the Mammoth and San
Manuel districts, southeastern Arizona : three generations of extensional faulting and associated tilting affected mid-Tertiary mineralization of the Mammoth vein set and the newly described Shultz Spring altered area / by Eric R. Force and Leslie J. Cox.
p. cm. (Mineral resource studies along the Sierrita-Mogollon Transect, Arizona-New Mexico ; ch. C) (U.S. Geological Survey bulletin ; 2042)
Includes bibliographical references.1. Geology, Structural Arizona. 2. Geology, Stratigraphic Tertiary. 3.
Metallogeny Arizona. I. Cox, Leslie J. II. Title. III. Series. IV. Series: U.S. Geological Survey bulletin ; 2042. QE75.B9 no. 2042 [QE627.5.A6] 557.3 s dc20[549.9791] 92-30105
CIP
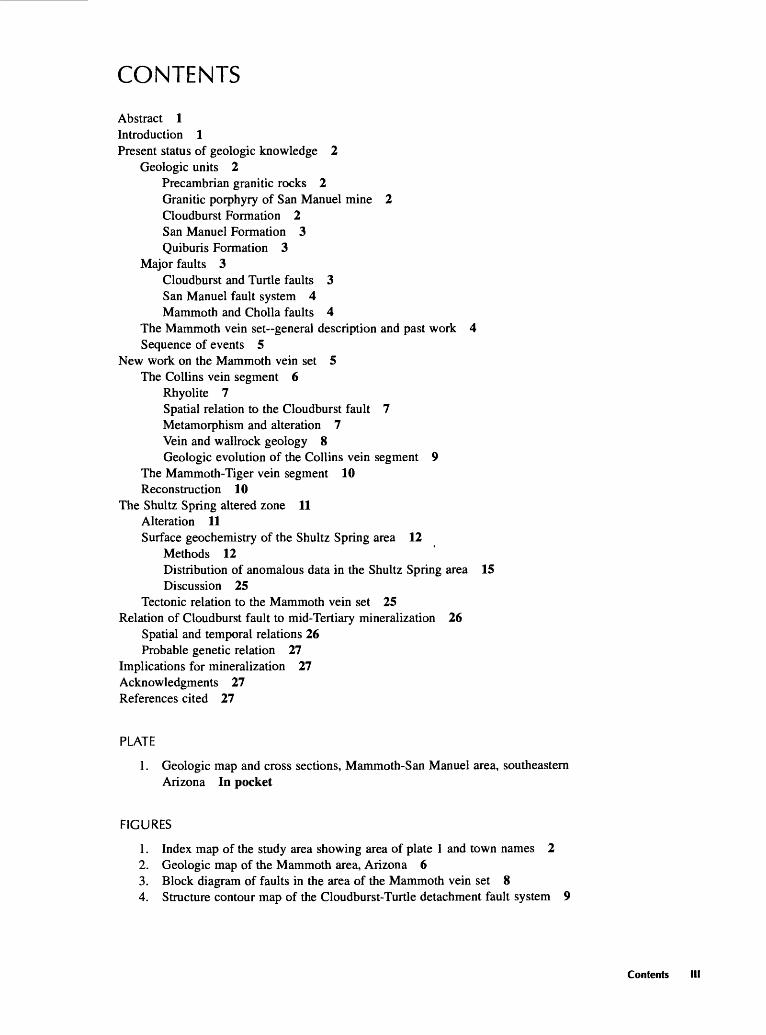
CONTENTS
Abstract 1 Introduction 1Present status of geologic knowledge 2
Geologic units 2Precambrian granitic rocks 2 Granitic porphyry of San Manuel mine 2 Cloudburst Formation 2 San Manuel Formation 3 Quiburis Formation 3
Major faults 3Cloudburst and Turtle faults 3 San Manuel fault system 4 Mammoth and Cholla faults 4
The Mammoth vein set general description and past work 4 Sequence of events 5
New work on the Mammoth vein set 5 The Coilins vein segment 6
Rhyolite 7Spatial relation to the Cloudburst fault 7 Metamorphism and alteration 7 Vein and wallrock geology 8 Geologic evolution of the Coilins vein segment 9
The Mammoth-Tiger vein segment 10 Reconstruction 10
The Shuitz Spring altered zone 11 Alteration 11Surface geochemistry of the Shuitz Spring area 12
Methods 12Distribution of anomalous data in the Shuitz Spring area 15 Discussion 25
Tectonic relation to the Mammoth vein set 25 Relation of Cloudburst fault to mid-Tertiary mineralization 26
Spatial and temporal relations 26 Probable genetic relation 27
Implications for mineralization 27 Acknowledgments 27 References cited 27
PLATE
1. Geologic map and cross sections, Mammoth-San Manuel area, southeastern Arizona In pocket
FIGURES
1. Index map of the study area showing area of plate 1 and town names 22. Geologic map of the Mammoth area, Arizona 63. Block diagram of faults in the area of the Mammoth vein set 84. Structure contour map of the Cloudburst-Turtle detachment fault system
Contents III
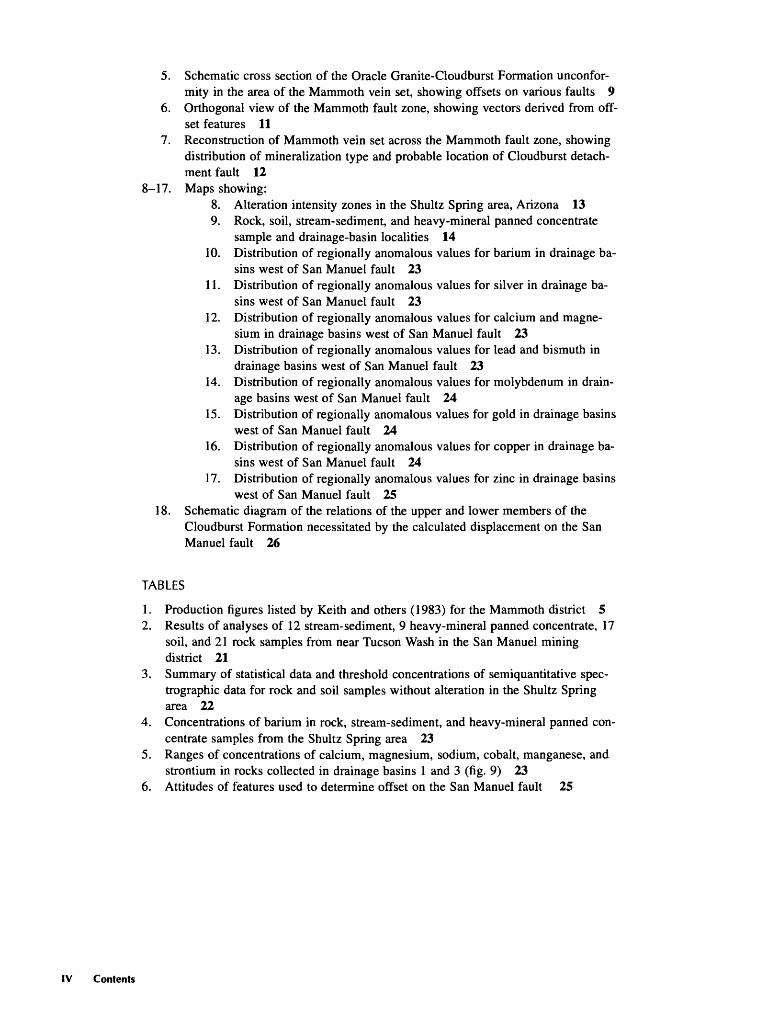
5. Schematic cross section of the Oracle Granite-Cloudburst Formation unconfor mity in the area of the Mammoth vein set, showing offsets on various faults 9
6. Orthogonal view of the Mammoth fault zone, showing vectors derived from off set features 11
7. Reconstruction of Mammoth vein set across the Mammoth fault zone, showing distribution of mineralization type and probable location of Cloudburst detach ment fault 12
8-17. Maps showing:8. Alteration intensity zones in the Shultz Spring area, Arizona 139. Rock, soil, stream-sediment, and heavy-mineral panned concentrate
sample and drainage-basin localities 1410. Distribution of regionally anomalous values for barium in drainage ba
sins west of San Manuel fault 2311. Distribution of regionally anomalous values for silver in drainage ba
sins west of San Manuei fault 2312. Distribution of regionally anomalous values for calcium and magne
sium in drainage basins west of San Manuel fault 2313. Distribution of regionally anomalous values for lead and bismuth in
drainage basins west of San Manuel fault 2314. Distribution of regionally anomalous values for molybdenum in drain
age basins west of San Manuel fault 2415. Distribution of regionally anomalous values for gold in drainage basins
west of San Manuel fault 2416. Distribution of regionally anomalous values for copper in drainage ba
sins west of San Manuei fault 2417. Distribution of regionally anomalous values for zinc in drainage basins
west of San Manuel fault 2518. Schematic diagram of the relations of the upper and lower members of the
Cloudburst Formation necessitated by the calculated displacement on the San Manuel fault 26
TABLES
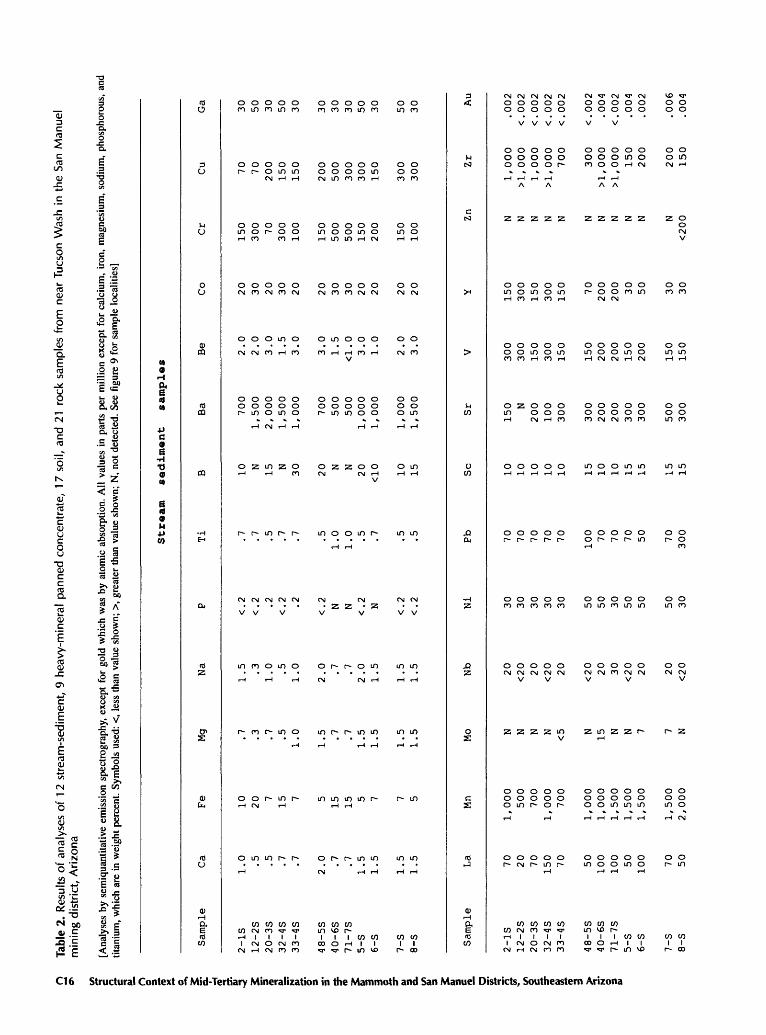
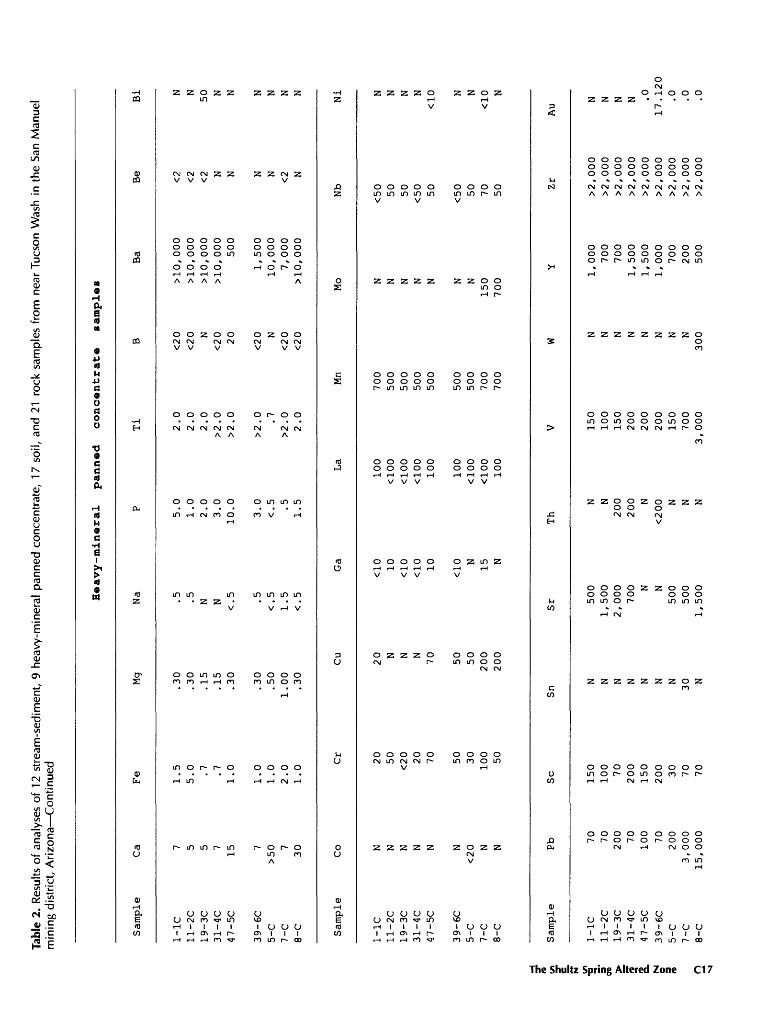
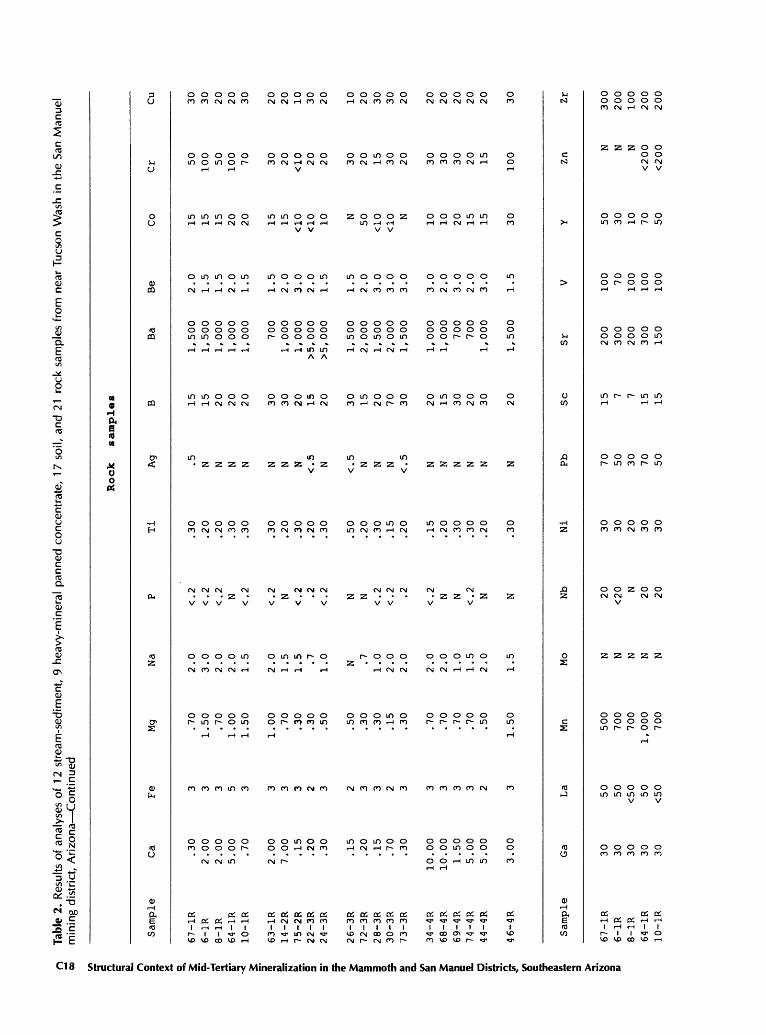
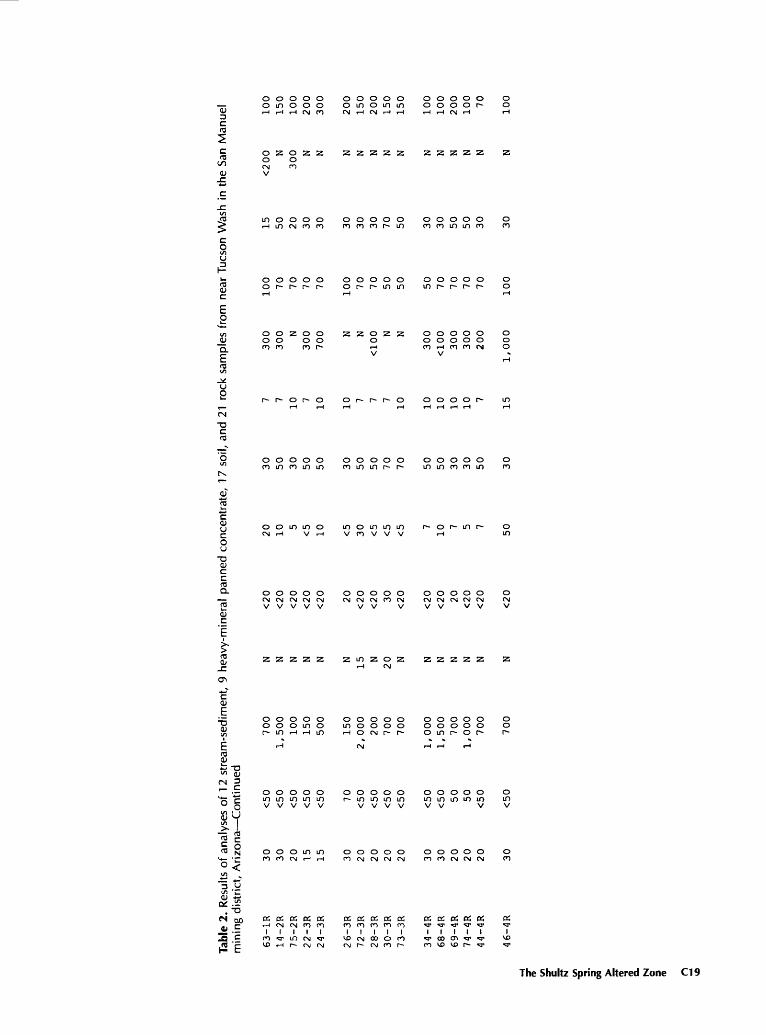
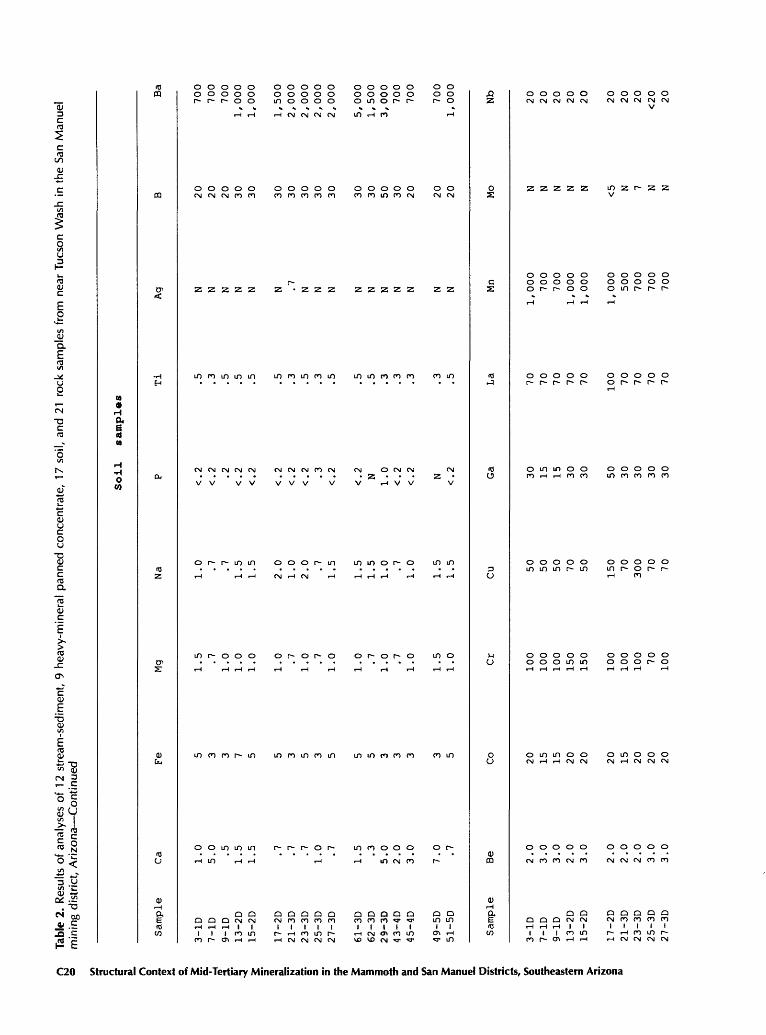
1. Production figures listed by Keith and others (1983) for the Mammoth district 52. Results of analyses of 12 stream-sediment, 9 heavy-mineral panned concentrate, 17
soil, and 21 rock samples from near Tucson Wash in the San Manuel mining district 21
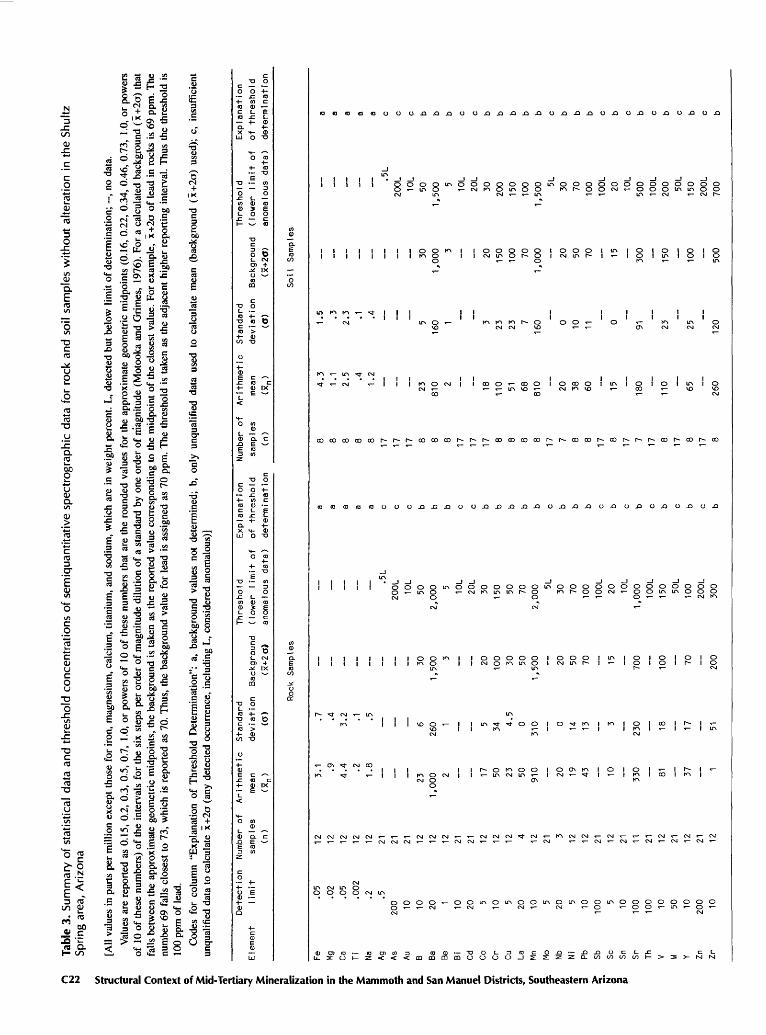
3. Summary of statistical data and threshold concentrations of semiquantitative spec- trographic data for rock and soil samples without alteration in the Shultz Spring area 22
4. Concentrations of barium in rock, stream-sediment, and heavy-mineral panned con centrate samples from the Shultz Spring area 23
5. Ranges of concentrations of calcium, magnesium, sodium, cobalt, manganese, and strontium in rocks collected in drainage basins 1 and 3 (fig. 9) 23
6. Attitudes of features used to determine offset on the San Manuel fault 25
IV Contents
Structural Context of Mid-Tertiary Mineralization in the Mammoth and San Manuel Districts, Southeastern Arizona
By Eric R. Force and Leslie J. Cox
Abstract
The Mammoth district of Au, Ag, Mo, V, Pb, Zn vein deposits of mid-Tertiary age (22.0 to 22.5 Ma) spatially over laps the San Manuel porphyry copper district of late Creta ceous to early Tertiary age, and shares its mid-Tertiary extensional history. Host rocks of the Mammoth vein set in clude rocks as young as the upper Oligocene to lower Mi ocene Cloudburst Formation, a thick syn-extensional pile of intermediate volcanic rocks and conglomerate, and associat ed rhyolite of extrusive and very shallow intrusive origin. The Mammoth vein set itself is emplaced into a fault, subse quently rotated, that originated as a high-angle oblique re verse fault with about 35 m (115 ft) of dip-slip movement and an unknown amount of right-lateral movement.
The Shultz Spring altered area to the southwest, de scribed here for the first time, is also hosted by the Cloud burst Formation. It shows concentric alteration zones of pyrite and hematite-chlorite and weak Ba, Ag, Pb, Mo, Au, Cu mineralization. No continuous vein set is present.
Three episodes of extensional faulting have influenced the configuration of mid-Tertiary mineralization. These are described from youngest to oldest:
1. Basin-range faulting on the steeply northeast-dipping Mammoth fault zone has cut the steeply southwest-dipping vein into the Collins and Mammoth-Tiger segments, by down-to-the-northeast dip-slip movement of 264±2 m (866± 6 ft), calculated from the intersections of three planar fea tures with the fault plane. The two segments when recon structed represent 550 m (1,800 ft) of vertical relief to the lowest exploited level.
2. Low-angle normal faulting on two splays of the southwest-dipping San Manuel fault system, concurrent with accumulation of the lower Miocene San Manuel Formation, and with northeast tilting of about 25°, clearly postdates the Mammoth vein set. However, these veins have not been found on the upper plate of the faults. Recalculation of total offset on the San Manuel fault system yields approximately 2,363 m (7,750 ft) of separation, top toward S. 46° W. This vector prohibits the Shultz Spring altered area from being a
Manuscript approved for publication, July 14, 1992.
correlative feature; instead the Ford mine area on the lower plate of the fault system may correlate with the Shultz Spring area, and the Mammoth vein set probably has been eroded from the upper plate.
3. The Cloudburst detachment fault, now horizontal, formed concurrently with the Cloudburst Formation and ro tated it about 30° to the northeast. The Turtle fault apparently bounds both the detachment and this rotation on the south and functioned as a side ramp for detachment. The Mam moth vein set cuts the Turtle fault, but close spatial and tem poral relation of the vein set with the detachment suggests a genetic relation also: (1) The vein itself and concentric zones of mineral assemblages within it are centered under the inter section of the detachment surface with its side ramp, and (2) the vein set is coextensive with intrusive rhyolite, and appar ently formed as rhyolite cooled. Rhyolite intrusion is demon- strably coeval with detachment. Detachment must have affected mineralization in some way; probably the oxide- dominated mineral assemblages are such an effect.
Extensive epidote-chlorite alteration extends above the Cloudburst fault plane about 60 m (200 ft) into the Cloud burst Formation. Those segments of the Mammoth vein set emplaced in the Cloudburst Formation show further wallrock epidotization, with the same alteration roof, again suggesting close temporal relations of detachment and veining. Structur al extrapolation from nearby detachment outcrops suggests that below elevations of about 2,900 ft (885 m), the vein set is entirely in the lower plate of the Cloudburst detachment system.
Other conclusions reached in this paper are (1) the northeast splay of the San Manuel fault system moved most recently, based on stratigraphic relations in the San Manuel Formation, (2) the unconformity between the Oracle Granite and the Cloudburst Formation forms a structural marker in wallrocks of the Mammoth vein set but is camouflaged by rhyolite intrusion, and (3) the Laramide porphyry copper de posit at the San Manuel mine was probably tilted only about 25° to 30° by mid-Tertiary extension.
INTRODUCTION
The San Manuel and Mammoth mining districts are spatially overlapping centers of mineralization of late
Introduction C1
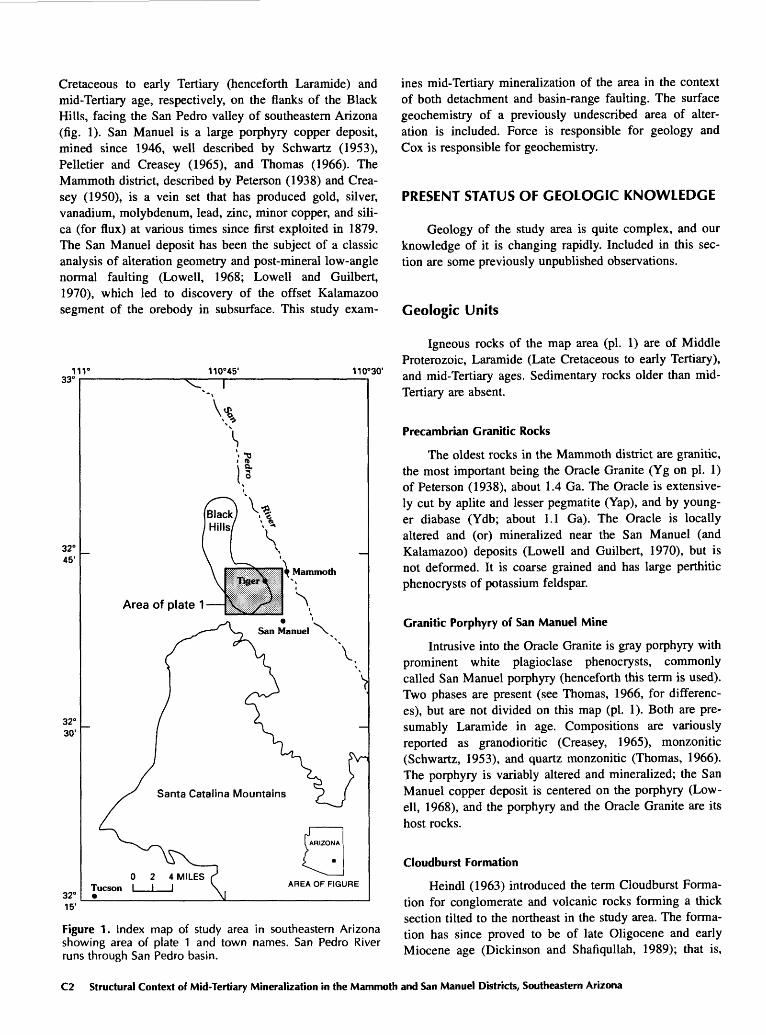
Cretaceous to early Tertiary (henceforth Laramide) and mid-Tertiary age, respectively, on the flanks of the Black Hills, facing the San Pedro valley of southeastern Arizona (fig. 1). San Manuel is a large porphyry copper deposit, mined since 1946, well described by Schwartz (1953), Pelletier and Creasey (1965), and Thomas (1966). The Mammoth district, described by Peterson (1938) and Crea sey (1950), is a vein set that has produced gold, silver, vanadium, molybdenum, lead, zinc, minor copper, and sili ca (for flux) at various times since first exploited in 1879. The San Manuel deposit has been the subject of a classic analysis of alteration geometry and post-mineral low-angle normal faulting (Lowell, 1968; Lowell and Guilbert, 1970), which led to discovery of the offset Kalamazoo segment of the orebody in subsurface. This study exam-
33°111° 110°45' 110°30'
32° 45'
32° 30'
32° 15'
Area of plate 1
Santa Catalina Mountains
AREA OF FIGURE
Figure 1. Index map of study area in southeastern Arizona showing area of plate 1 and town names. San Pedro River runs through San Pedro basin.
ines mid-Tertiary mineralization of the area in the context of both detachment and basin-range faulting. The surface geochemistry of a previously undescribed area of alter ation is included. Force is responsible for geology and Cox is responsible for geochemistry.
PRESENT STATUS OF GEOLOGIC KNOWLEDGE
Geology of the study area is quite complex, and our knowledge of it is changing rapidly. Included in this sec tion are some previously unpublished observations.
Geologic Units
Igneous rocks of the map area (pi. 1) are of Middle Proterozoic, Laramide (Late Cretaceous to early Tertiary), and mid-Tertiary ages. Sedimentary rocks older than mid- Tertiary are absent.
Precambrian Granitic Rocks
The oldest rocks in the Mammoth district are granitic, the most important being the Oracle Granite (Yg on pi. 1) of Peterson (1938), about 1.4 Ga. The Oracle is extensive ly cut by aplite and lesser pegmatite (Yap), and by young er diabase (Ydb; about 1.1 Ga). The Oracle is locally altered and (or) mineralized near the San Manuel (and Kalamazoo) deposits (Lowell and Guilbert, 1970), but is not deformed. It is coarse grained and has large perthitic phenocrysts of potassium feldspar.
Granitic Porphyry of San Manuel Mine
Intrusive into the Oracle Granite is gray porphyry with prominent white plagioclase phenocrysts, commonly called San Manuel porphyry (henceforth this term is used). Two phases are present (see Thomas, 1966, for differenc es), but are not divided on this map (pi. 1). Both are pre sumably Laramide in age. Compositions are variously reported as granodioritic (Creasey, 1965), monzonitic (Schwartz, 1953), and quartz monzonitic (Thomas, 1966). The porphyry is variably altered and mineralized; the San Manuel copper deposit is centered on the porphyry (Low ell, 1968), and the porphyry and the Oracle Granite are its host rocks.
Cloudburst Formation
Heindl (1963) introduced the term Cloudburst Forma tion for conglomerate and volcanic rocks forming a thick section tilted to the northeast in the study area. The forma tion has since proved to be of late Oligocene and early Miocene age (Dickinson and Shafiqullah, 1989); that is,
C2 Structural Context of Mid-Tertiary Mineralization in the Mammoth and San Manuel Districts, Southeastern Arizona
contemporaneous with extension related to widespread de tachment faulting in southeastern Arizona. Discordant in- trusives (Ti) of the same general age are present in the map area, also.
The Cloudburst Formation is subdivided into a lower member (Tci) that consists of volcanic rocks with lesser conglomerate, and an upper member (Tcu) that consists of conglomerate with minor pyroclastics and one thin flow (Weibei, 1981). The thickness of the lower member is esti mated as 1,500 to 2,450 m (5,000 to 8,000 ft) from a base outside the area of plate 1, and that of the upper member, bounded above by an unconformity, is estimated as 2,130 m (7,000 ft). Volcanic rocks of the lower member are mostly of intermediate composition, some fragmental. Conglomerate in the lower member has mixed sources; clasts of Oracle Granite and rocks related to it in a prove nance sense (Precambrian diabase and aplite; porphyry, some clasts altered and (or) mineralized) may be either less or more abundant than angular volcanic fragments. Some of the volcanic conglomerate beds probably repre sent lahars.
Near the Mammoth district, rhyolite of both intrusive and extrusive origin, including ash-flow tuff, is present to ward the top of the lower member. Similar rhyoiite north of the study area has been dated at 23 Ma (Dickinson and Shafiquiiah, 1989).
The upper member of the Cloudburst Formation, con sisting almost entirely of conglomerate, itself contains a lower zone characterized by volcanic clasts and an upper zone characterized by clasts of Oracle Granite and related rocks (Weibei, 1981). The boundary (pi. 1) coincides ap proximately with an arenite unit (Tcua). A volcanic flow (Tcuv) is in the lower zone. Sedimentary transport was to ward the east throughout, according to Weibei; this is evaluated below. All of the conglomerate has an iron-rich matrix that is most commonly red-orange to purple-gray but in alteration zones described below the matrix is green or rusty.
Weibei (1981) traced a light-colored compound tuff- breccia (Tcut) near the top of the upper member for over 2 km (pi. 1) and dated potassium feldspar from it at 22.5 Ma. The significance of this date is discussed below.
San Manuel Formation
Heindl (1963) introduced the San Manuel Formation for conglomerate that is less tilted, less indurated, unal tered, and paler in matrix color than conglomerate of the underlying Cloudburst Formation. The contact between the Cloudburst and the overlying San Manuel appears to be conformable (and gradational in matrix color) in one area, and the contact is difficult to map in such sections. How ever, an unconformity is apparent (pi. 1) where the San Manuel Formation overlaps the tuff of the upper Cloud burst Formation. The absence of intrusions or of any alter
ation (of either hydrothermal or contact-metamorphic type) in the San Manuel, and the incorporation in it of clasts of rhyolite and altered Cloudburst, also suggest some regional significance of the unconformity separating the two formations. Very little time is represented by this unconformity, as basal San Manuel Formation gives ages of 22 Ma (Dickinson and Shafiquiiah, 1989). Heindl (1963) recognized two members of the San Manuel For mation, the underlying Kannally Member (Tsml), defined by a predominance of Oracle Granite and related detritus, and the overlying Tucson Wash Member (Tsmu), defined by clasts of Cloudburst Formation (conglomerate and vol canic rocks). The contact between members corresponds to a change from easterly to southwesterly sediment transport (Dickinson, 1991). We find that the Tucson Wash Member is further divisible into two parts (not mapped). The lower part (the only part exposed in Tucson Wash itself) is char acterized by clasts of the Cloudburst Formation (mostly volcanogenic conglomerate, some with secondary epidote), of rhyolite, of Mammoth vein quartz, and in the portion south of San Manuel mine, of mineralized porphyry. These clasts must have come from the northeast (pi. 1). The up per part consists of volcanic detritus and is best exposed in the open pit of the San Manuel mine. The lower part of the Tucson Wash Member rests directly on the Cloudburst Formation in one area, discussed below.
Quiburis Formation
Basin fill of the San Pedro valley to the east is called the Quiburis Formation (Tq; Heindl, 1963). Within the map area it consists of gravel dipping northeast about 5°; locally the dip is steep against the Mammoth, Cholla, and related faults that bound the formation on the west. The Quiburis Formation is post-mid-Miocene in age (Dickin son and Shafiquiiah, 1989).
Major Faults
The map area contains so many faults of different ages that reconstruction is an intricate puzzle. The faults are de scribed in apparent order of age from oldest to youngest.
Cloudburst and Turtle Faults
The subhorizontal Cloudburst fault (of Dickinson, 1987) forms a structural floor for exposed units north of the Turtle fault. Where the Cloudburst fault is exposed in the northwestern part of the map area (pi. 1), it dips gently eastward and separates Precambrian granitic rocks from overlying Cloudburst Formation that dips steeply north east. The Cloudburst fault is thus a detachment fault and is thought to be of regional importance in the San Pedro- Santa Catalina Mountains area (Dickinson, 1991).
Present Status of Geologic Knowledge C3
The Turtle fault separates the Oracle Granite and re lated rocks on the southeast from the Cloudburst Forma tion to the northwest. The fault is delineated by earlier work only in the San Manuel-Mammoth area, but Dickin- son (1987) showed that a corresponding fault is present to the southwest on the upper plate of the younger San Man uel fault. Both segments of the Turtle fault dip 50° or more northwestward, with apparent movement being up- to-the-southeast.
Two lines of evidence suggest that the Turtle fault was active during deposition of the Cloudburst Formation: (1) The lower portions of the Cloudburst Formation are truncated against the fault, but upper portions overlap the fault (on both plates of the younger San Manuel fault) and rest unconformably on the Oracle Granite (fig. 2; pi. 1), and (2) the fault plane of the Turtle fault has been altered as much as the adjacent Cloudburst Formation and is cut by every post-depositional fault that cuts the Cloudburst Formation. Thus the Turtle fault must be about the same age as the Cloudburst Formation. Dickinson (1991) sug gests that the Turtle fault is a tear or ramp fault related to the Cloudburst detachment system, which is known to have controlled Cloudburst deposition.
A late stage of movement on the Turtle fault was ap parently down-to-the-south (pi. 1; fig. 2). The resulting minor offsets are the basis on which Peterson (1938) and Creasey (1965) mapped the Turtle fault into the Cloud burst Formation east of the Mammoth fault.
San Manuel Fault System
The map pattern of plate 1 reflects the San Manuel fault system more clearly than any other single structure. The fault juxtaposes older rocks to the northeast against younger rocks to the southwest and dips gently southwest. In the San Manuel mine, for example, the Oracle Granite is structurally overlain by the San Manuel Formation dipping northeastward into a fault plane that dips southwest. The San Manuel fault system has been interpreted as a thrust fault, a strike-slip fault, and a normal fault by various in vestigators. Lowell (1968) proved it to be a low-angle nor mal fault by correlating alteration, mineralization, and intrusive features between the San Manuel porphyry cop per deposit and its structurally overlying Kalamazoo seg ment in the subsurface to the southwest. In so doing he verified suggestions of fault movement first made by Steele and Rubly (1947). Lowell's landmark paper, and a subse quent one by Lowell and Guilbert (1970), became models of both porphyry alteration geometry and detachment fault ing. The fault separation listed by Lowell has the upper block translated about 2,440 m (8,000 ft) along an average dip of 25° to 30°, toward S. 55° W. We independently de rive a slightly different vector in this paper.
Creasey (1965) recognized that two en echelon seg ments of the San Manuel fault are present in one area. Our
map (pi. 1) extends the area between the two segments of the fault.
Dickinson (1991) presents evidence that the San Manuel Formation was deposited synchronously with and in response to movement on the San Manuel fault. In ad dition, we find that the lower part of the Tucson Wash Member, rather than the Kannally Member, is the basal lithology of the formation everywhere northeast of the southwest splay of the fault. Blocks of rhyolite and epidot- ic Cloudburst Formation, some large enough to be mapped by Creasey (1965), are incorporated in the basal Tucson Wash Member against the northeast splay of the fault, sug gesting that this splay was active during deposition. This in turn suggests that the northeastern splay of the fault moved more recently, since the Tucson Wash is the upper member toward the southeast where the section is more complete. Derivation of the blocks was apparently from north of the Turtle fault, consistent with its down-to-the- south late movement.
Mammoth and Cholla Faults
Along the eastern side of the map area, steep east- dipping basin-and-range faults have dropped the San Pedro basin down relative to the Black Hills. Most prominent among these in the map area are the Mammoth and Cholla faults, which locally drop Quiburis Formation to the east against Oracle Granite to the west. These faults also cut and offset the Turtle fault and the San Manuel fault.
Terminology of these faults is confused. Early work ers refer to a Mammoth fault, tentatively correlated with the East fault of the San Manuel mine, and to a Cholla fault east of it. The two converge to the northwest in the Tiger-Mammoth area. Creasey (1965) in both map and text refers to the Cholla fault of earlier workers as the Mammoth fault, but Pelletier and Creasey (1965) in the same report use the original terminology. Our map uses the Cholla fault in the original sense, as have other post- 1965 workers (Thomas, 1966). Subsurface information shows that east-side downthrow on the Cholla fault de creases northwestward from about 210 to 90 m (700 to 300 ft) near Tiger (Schwartz, 1953). The Cholla fault is intimately related to the older Dream vein (not mapped separately) as discussed below. In the Mammoth-Tiger area and northward, one can consider fault movement as occurring on a single Mammoth fault zone.
The Mammoth Vein Set-General Description and Past Work
Veins of the Mammoth set were mined discontinuous- ly from 1879 to 1959, with about 2 million tons of ore removed. Effort was primarily directed at gold in the early years of production; the total recovery was about 400,000 ounces (Creasey, 1950). In later years, silver (about 1 mil-
C4 Structural Context of Mid-Tertiary Mineralization in the Mammoth and San Manuel Districts, Southeastern Arizona
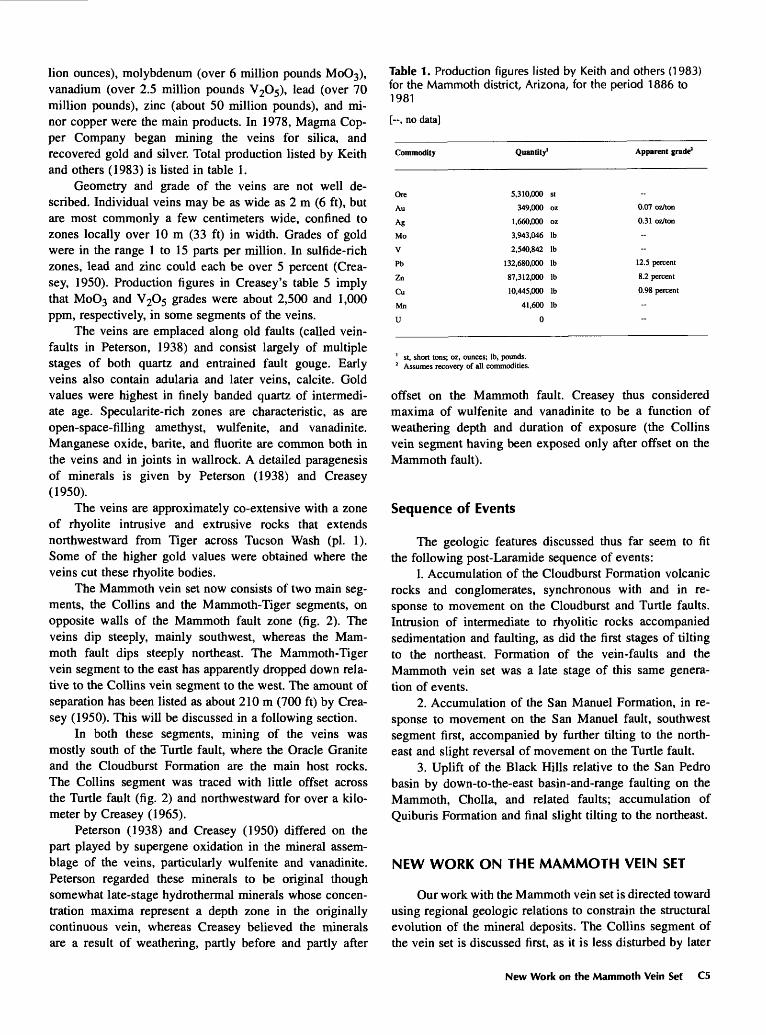
lion ounces), molybdenum (over 6 million pounds vanadium (over 2.5 million pounds V2O5), lead (over 70 million pounds), zinc (about 50 million pounds), and mi nor copper were the main products. In 1978, Magma Cop per Company began mining the veins for silica, and recovered gold and silver. Total production listed by Keith and others (1983) is listed in table 1.
Geometry and grade of the veins are not well de scribed. Individual veins may be as wide as 2 m (6 ft), but are most commonly a few centimeters wide, confined to zones locally over 10 m (33 ft) in width. Grades of gold were in the range 1 to 15 parts per million. In sulfide-rich zones, lead and zinc could each be over 5 percent (Crea- sey, 1950). Production figures in Creasey's table 5 imply that MoO3 and V2O5 grades were about 2,500 and 1,000 ppm, respectively, in some segments of the veins.
The veins are emplaced along old faults (called vein- faults in Peterson, 1938) and consist largely of multiple stages of both quartz and entrained fault gouge. Early veins also contain adularia and later veins, calcite. Gold values were highest in finely banded quartz of intermedi ate age. Specularite-rich zones are characteristic, as are open-space-filling amethyst, wulfenite, and vanadinite. Manganese oxide, barite, and fluorite are common both in the veins and in joints in wallrock. A detailed paragenesis of minerals is given by Peterson (1938) and Creasey (1950).
The veins are approximately co-extensive with a zone of rhyolite intrusive and extrusive rocks that extends northwestward from Tiger across Tucson Wash (pi. 1). Some of the higher gold values were obtained where the veins cut these rhyolite bodies.
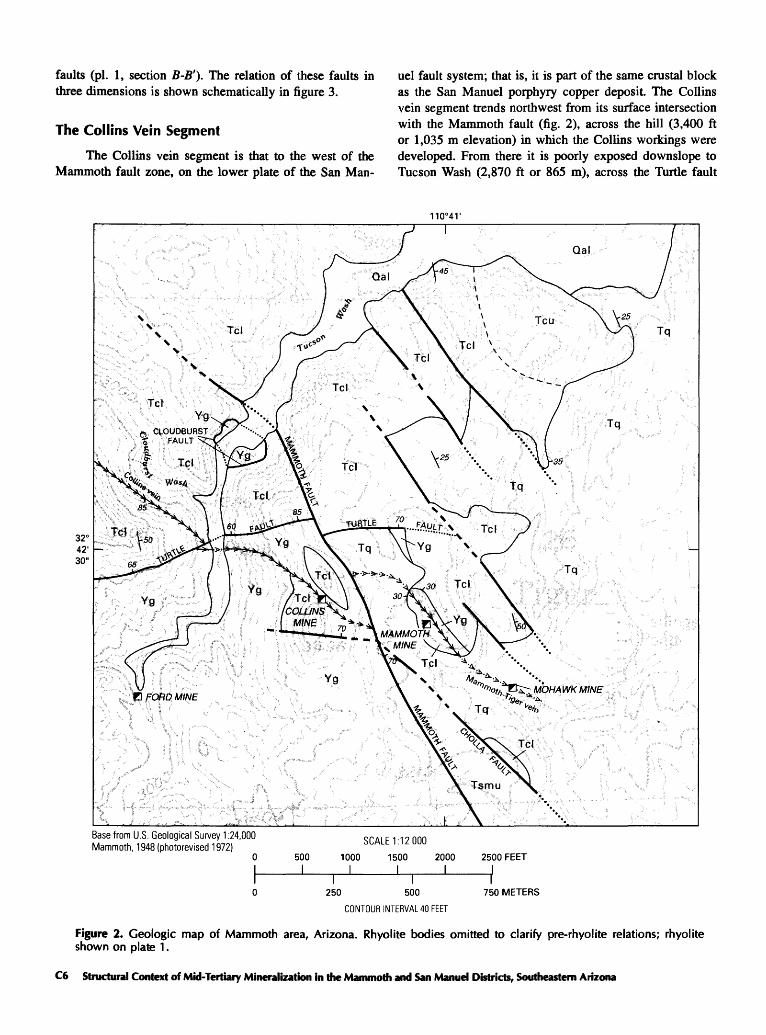
The Mammoth vein set now consists of two main seg ments, the Collins and the Mammoth-Tiger segments, on opposite walls of the Mammoth fault zone (fig. 2). The veins dip steeply, mainly southwest, whereas the Mam moth fault dips steeply northeast. The Mammoth-Tiger vein segment to the east has apparently dropped down rela tive to the Collins vein segment to the west. The amount of separation has been listed as about 210 m (700 ft) by Crea sey (1950). This will be discussed in a following section.
In both these segments, mining of the veins was mostly south of the Turtle fault, where the Oracle Granite and the Cloudburst Formation are the main host rocks. The Collins segment was traced with little offset across the Turtle fault (fig. 2) and northwestward for over a kilo meter by Creasey (1965).
Peterson (1938) and Creasey (1950) differed on the part played by supergene oxidation in the mineral assem blage of the veins, particularly wulfenite and vanadinite. Peterson regarded these minerals to be original though somewhat late-stage hydrothermal minerals whose concen tration maxima represent a depth zone in the originally continuous vein, whereas Creasey believed the minerals are a result of weathering, partly before and partly after
Table 1. Production figures listed by Keith and others (1983) for the Mammoth district, Arizona, for the period 1886 to 1981
[--, no data]
Commodity Quantity1 Apparent grade2
Ore
Au
Ag
Mo
V
Pb
Zn
Cu
Mn
U
5,310,000
349,000
1,660,000
3,943,046
2,540,842
132,680,000
87,312,000
10,445,000
41,600
0
st
oz
oz
Ib
Ib
Ib
Ib
Ib
Ib
0.07 oz/ton
0.31 oz/ton
-
-
12.5 percent
8.2 percent
0.98 percent
-
~
1 st, short tons; oz, ounces; Ib, pounds.2 Assumes recovery of all commodities.
offset on the Mammoth fault. Creasey thus considered maxima of wulfenite and vanadinite to be a function of weathering depth and duration of exposure (the Collins vein segment having been exposed only after offset on the Mammoth fault).
Sequence of Events
The geologic features discussed thus far seem to fit the following post-Laramide sequence of events:
1. Accumulation of the Cloudburst Formation volcanic rocks and conglomerates, synchronous with and in re sponse to movement on the Cloudburst and Turtle faults. Intrusion of intermediate to rhyolitic rocks accompanied sedimentation and faulting, as did the first stages of tilting to the northeast. Formation of the vein-faults and the Mammoth vein set was a late stage of this same genera tion of events.
2. Accumulation of the San Manuel Formation, in re sponse to movement on the San Manuel fault, southwest segment first, accompanied by further tilting to the north east and slight reversal of movement on the Turtle fault.
3. Uplift of the Black Hills relative to the San Pedro basin by down-to-the-east basin-and-range faulting on the Mammoth, Cholla, and related faults; accumulation of Quiburis Formation and final slight tilting to the northeast.
NEW WORK ON THE MAMMOTH VEIN SET
Our work with the Mammoth vein set is directed toward using regional geologic relations to constrain the structural evolution of the mineral deposits. The Collins segment of the vein set is discussed first, as it is less disturbed by later
New Work on the Mammoth Vein Set C5
faults (pi. 1, section B-B'). The relation of these faults in uel fault system; that is, it is part of the same crustal block three dimensions is shown schematically in figure 3. as the San Manuel porphyry copper deposit. The Collins
vein segment trends northwest from its surface intersectionThe Collins Vein Segment with the Mammoth fault ^ 2>' across ** hil1 (3 >400 ft
or 1,035 m elevation) in which the Collins workings wereThe Collins vein segment is that to the west of the developed. From there it is poorly exposed downslope to
Mammoth fault zone, on the lower plate of the San Man- Tucson Wash (2,870 ft or 865 m), across the Turtle fault
110°4V
Base from U.S. Geological Survey 1:24,000 Mammoth, 1948(photorevised 1972)
0
SCALE 1:1 2 000500 1000 1500 2000 2500 FEET _| | ______ I I ______ I
250 500
CONTOUR INTERVAL 40 FEET
750 METERS
Figure 2. Geologic map of Mammoth area, Arizona. Rhyolite bodies omitted to clarify pre-rhyolite relations; rhyolite shown on plate 1.
C6 Structural Context of Mid-Tertiary Mineralization in the Mammoth and San Manuel Districts, Southeastern Arizona

with little offset, and thence northwestward high on the bluffs southwest of Cloudburst Wash (up to 3,480 ft or 1,060 m), finally crossing the wash at 3,040 feet or 925 m. Thus the vein south of the Turtle fault shows about 160 m (530 ft) of surface relief, and the vein north of it, about 135 m (440 ft). The host rocks are Oracle Granite and Cloudburst Formation south of the Turtle fault, and entire ly Cloudburst Formation north of it. Workings described in the literature are all south of the Turtle fault, but signifi cant effort has clearly been expended on working the northern portion as well.
Rhyolite
The veins of the Collins segment, like the Mammoth- Tiger segment, are closely associated with a swarm of rhy- olite bodies on both sides of the Turtle fault (pi. 1). The rhyolite is of course intrusive where Oracle Granite is the host rock, but in Cloudburst host rocks it appears to be both intrusive and extrusive. Most of the clearly extrusive rhyo lite bodies have the characteristic stratigraphy and structure of welded tuff, and are concordant to bedding in conglom erate of the Cloudburst Formation. Rhyolite bodies at a high angle to extrusive rhyolite bodies must be intrusive, yet beds of conglomerate above such intrusive rhyolite bod ies characteristically contain rhyolite cobbles; this suggests that each intrusive rhyolite body vented nearby.
Qal
Tq
Tsmu
Tcu
Tel
Yg
50
EXPLANATION
Quaternary alluvium
Quiburis Formation
San Manuel Formation, Tucson Wash Member
Cloudburst Formation, upper member
Cloudburst Formation, lower member
Oracle .Granite
Contact Showing dip, where known. Dashed where approximately located
Faults approximately contemporaneous with accumulation of Cloudburst Formation Showing dip, where known. Dashed where approximately located; dotted where concealed
Faults approximately contemporaneous with accumulation of Quiburis Formation Showing dip, where known. Dashed where approximately located; dotted where concealed
Strike and dip of inclined beds
Mammoth vein set Showing dip, where known. Dashed where approximately located; dotted where concealed
Figure 2. Continued
Many of the intrusive rhyolite bodies are recrystal- lized to muscovite, quartz, and epidote at the expense of feldspar. This alteration was apparently deuteric, as rhy- olitic ash-flow tuff beds are not altered in this way. Near the Collins vein segment, intrusive rhyolite contains quartz veinlets that form 10 percent or more of the rock. Each veinlet shows traces of the same zoning morphology shown by the Mammoth vein set on a larger scale. Quartz veining in other host rocks of the main vein does not reach this density. It is likely that cooling rhyolite was the source of silica in the Mammoth vein set; silica was prob ably released by the reaction:
potassium feldspar+water=muscovite+quartz
Spatial Relation to the Cloudburst Fault
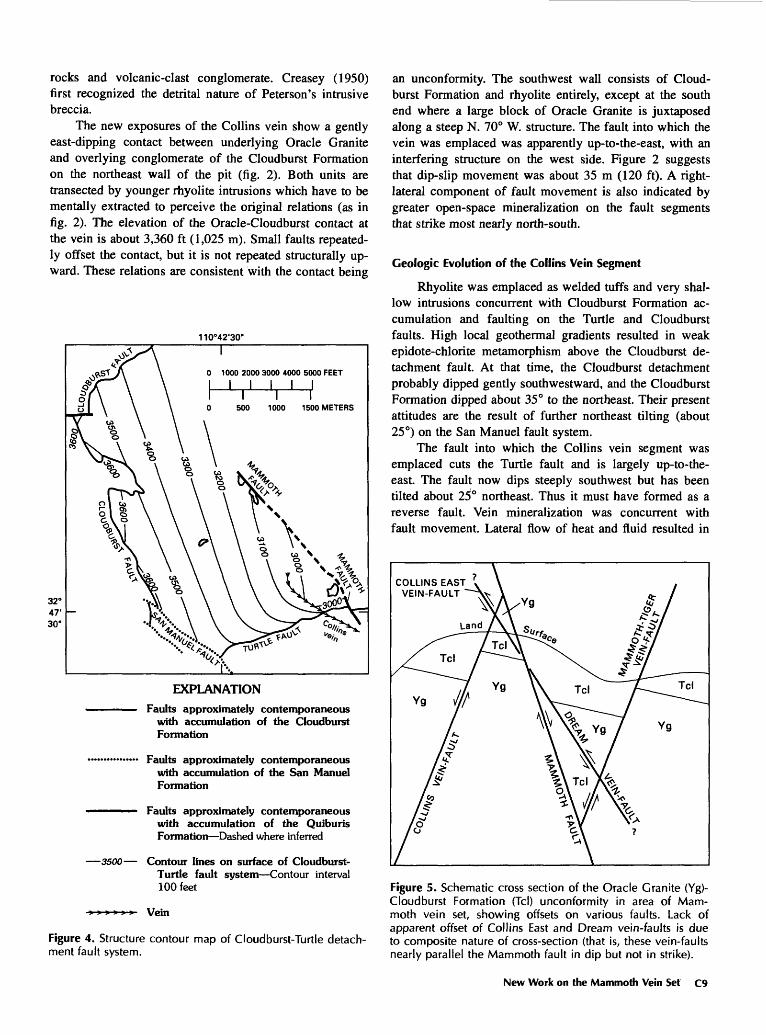
Four outcrops of Oracle Granite surrounded by Cloudburst Formation (pi. 1; fig. 2) were mapped by Crea- sey (1965), one as a window through the Cloudburst de tachment fault. All four outcrops have proved to be such windows and define a regular, very gentle eastward dip on the detachment surface (fig. 4). The detachment slices off steeply dipping conglomerate beds in the Cloudburst For mation. Individual rhyolite bodies are similarly cut off, but without displacing the rhyolite swarm at map scale. Thus rhyolite emplacement, Cloudburst Formation, and move ment on both Cloudburst and Turtle faults must all be broadly synchronous.
The Collins vein segment crops out near one window, and using this control point, one can say that the subhori- zontal detachment intersects the part of the Collins vein segment north of the Turtle fault at an elevation of about 2,900 to 3,000 ft (about 900 m; fig. 4). This underground portion of the Collins vein is undescribed.
Metamorphism and Alteration
In the area north of the Turtle fault, Cloudburst For mation rocks that host the Collins vein segment are char acterized by epidote-chlorite alteration or metamorphism. The consequent induration of the Cloudburst Formation in this area is undoubtedly a reason that some earlier workers considered the Cloudburst to be of probable Laramide age. The alteration in Oracle Granite south of the Turtle fault is difficult to distinguish from older Laramide propylitic al teration associated with the San Manuel deposit.
Two styles of alteration were observed: (1) Regional alteration in which epidote replaces conglomerate matrix and both phenocrysts and groundmass of volcanic rocks. Epidote also partly fills fractures and vesicles, accompa nied by calcite. Such alteration occupies lower elevations in the Cloudburst Formation through much of the block occupied by the Collins vein segment. That is, the upper limit of this alteration is a gently dipping plane. (2) More local alteration in the immediate vicinity of the Collins
New Work on the Mammoth Vein Set C7
vein segment, where Cloudburst Formation host rocks are saturated with epidote and chlorite; fractures and vesicles are generally filled completely. Associated veinlets are quartz and minor adularia rather than calcite. A marginal zone shows manganese oxides and (or) barite on joint sur faces. This style of alteration extends only about 100 m (300 ft) laterally from the Collins vein segment and asso ciated rhyolite. It does not seem to project structurally up ward any farther than the first style of alteration; that is, the wallrocks of the Collins segment lack epidote where the vein crosses hills higher in elevation than about 3,100 feet (945 m).
The first style of alteration probably reflects high lo cal geothermal gradients and fluid movement induced by tectonic denudation on the Cloudburst detachment fault where it is present at depths of 100 m (300 ft) or less (fig. 4). The second probably represents heat and fluid transport laterally from the vein system, which acted as a conduit. Cooling rhyolite and other shallow intrusions into the Cloudburst Formation are probably a source of heat for both styles of alteration.
Vein and Wall rock Geology
The Collins segment of the Mammoth vein set strikes about N. 40° to 50° W. and dips about 70° to the southwest; variations in attitude are shown in detail by Peterson (1938). Mineralization is stronger where strike is more northerly. The subsidiary Collins East vein (not mapped) dips steeply northeast (fig. 5), and the projected intersection with the main Collins segment plunges gently southeast.
New exposures of the Collins vein segment are a re sult of open-pit silica mining in the area of the old Collins mine, on a hilltop at an elevation of about 3,300 to 3,400 feet (about 1,020 m). Detailed maps in Peterson (1938) are a poor guide to these exposures, partly because his study predated open-pit mining and relied on underground and natural-outcrop information, and partly because his rock identifications were faulty. Peterson used "intrusive brec cia" and "volcanic" units, which respectively correspond, only approximately, with the rhyolite-clast conglomerate lithology of the Cloudburst Formation and with undiffer- entiated Cloudburst Formation including both volcanic
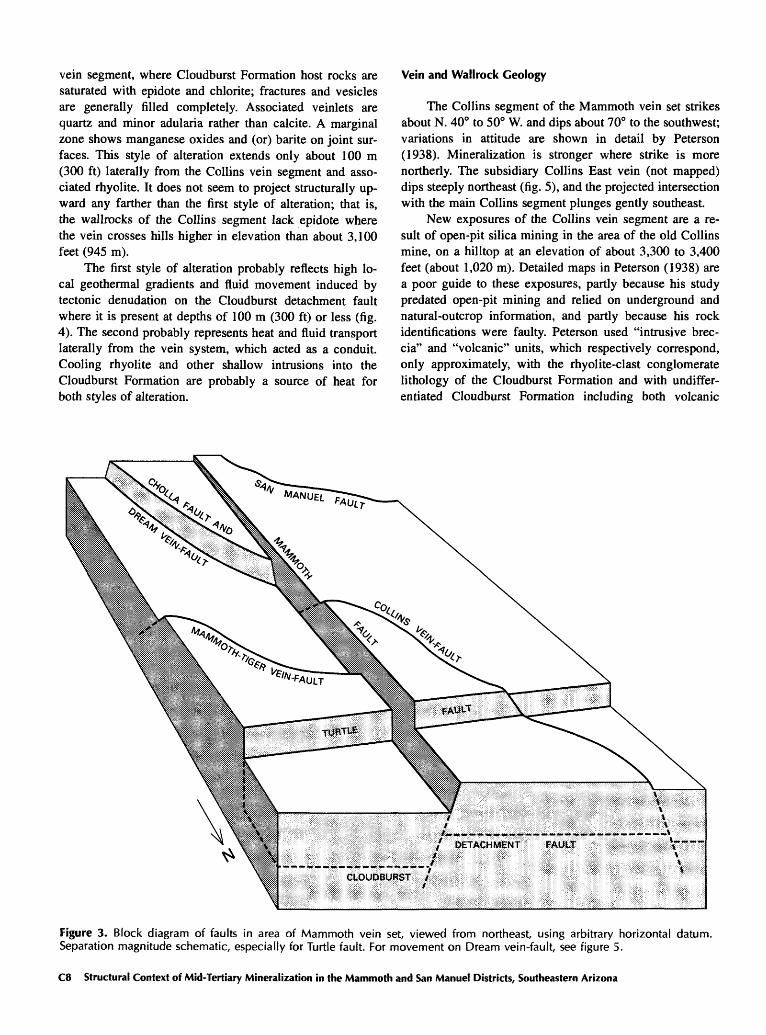
Figure 3. Block diagram of faults in area of Mammoth vein set, viewed from northeast, using arbitrary horizontal datum. Separation magnitude schematic, especially for Turtle fault. For movement on Dream vein-fault, see figure 5.
C8 Structural Context of Mid-Tertiary Mineralization in the Mammoth and San Manuel Districts, Southeastern Arizona
rocks and volcanic-clast conglomerate. Creasey (1950) first recognized the detrital nature of Peterson's intrusive breccia.
The new exposures of the Collins vein show a gently east-dipping contact between underlying Oracle Granite and overlying conglomerate of the Cloudburst Formation on the northeast wall of the pit (fig. 2). Both units are transected by younger rhyolite intrusions which have to be mentally extracted to perceive the original relations (as in fig. 2). The elevation of the Oracle-Cloudburst contact at the vein is about 3,360 ft (1,025 m). Small faults repeated ly offset the contact, but it is not repeated structurally up ward. These relations are consistent with the contact being
110042'30'
32° 47' 30"
0 1000 2000 3000 4000 5000 FEET
I I I I I\
500I I
1000 1500 METERS
EXPLANATIONFaults approximately contemporaneous
with accumulation of the Cloudburst Formation
Faults approximately contemporaneous with accumulation of the San Manuel Formation
Faults approximately contemporaneous with accumulation of the Quiburis Formation Dashed where inferred
-3500 Contour lines on surface of Cloudburst- Turtle fault system Contour interval 100 feet
Vein
an unconformity. The southwest wall consists of Cloud burst Formation and rhyolite entirely, except at the south end where a large block of Oracle Granite is juxtaposed along a steep N. 70° W. structure. The fault into which the vein was emplaced was apparently up-to-the-east, with an interfering structure on the west side. Figure 2 suggests that dip-slip movement was about 35 m (120 ft). A right- lateral component of fault movement is also indicated by greater open-space mineralization on the fault segments that strike most nearly north-south.
Geologic Evolution of the Collins Vein Segment
Rhyolite was emplaced as welded tuffs and very shal low intrusions concurrent with Cloudburst Formation ac cumulation and faulting on the Turtle and Cloudburst faults. High local geothermal gradients resulted in weak epidote-chlorite metamorphism above the Cloudburst de tachment fault. At that time, the Cloudburst detachment probably dipped gently southwestward, and the Cloudburst Formation dipped about 35° to the northeast. Their present attitudes are the result of further northeast tilting (about 25°) on the San Manuel fault system.
The fault into which the Collins vein segment was emplaced cuts the Turtle fault and is largely up-to-the- east. The fault now dips steeply southwest but has been tilted about 2f>° northeast. Thus it must have formed as a reverse fault. Vein mineralization was concurrent with fault movement. Lateral flow of heat and fluid resulted in
COLLINS EAST VEIN-FAULT
Figure 4. Structure contour map of Cloudburst-Turtle detach ment fault system.
Figure 5. Schematic cross section of the Oracle Granite (Yg)- Cloudburst Formation (Tel) unconformity in area of Mam moth vein set, showing offsets on various faults. Lack of apparent offset of Collins East and Dream vein-faults is due to composite nature of cross-section (that is, these vein-faults nearly parallel the Mammoth fault in dip but not in strike).
New Work on the Mammoth Vein Set C9
an epidote-saturated aureole around the vein, indicating that the geothermal gradient was still high.
The Mammoth-Tiger Vein Segment
The Mammoth-Tiger segment of the Mammoth vein set is east of the Mammoth fault zone. At depth this vein segment is truncated by the Mammoth fault zone (pi. 1, section B-B').
In many ways the surface traces of the Mammoth- Tiger and Collins vein segments are similar. The Mam moth-Tiger vein dips southwest about 70°; mineralization is apparently strongest in the most north-south-striking parts of the vein. At depth the Mammoth-Tiger vein inter sects the subsidiary Dream vein (not mapped), dipping northeast 45° to 65° (fig. 5); the intersection plunges gen tly southeast (Peterson, 1938). The veins are closely asso ciated with rhyolite, mostly intrusive near the veins but locally extrusive in the same crustal block. The Mam moth-Tiger vein segment intersects the Mammoth fault zone south of the Turtle fault (fig. 2). Its host rocks are both Oracle Granite and Cloudburst Formation. Alteration is chloride but not epidotic in the Cloudburst host rocks of the Mammoth-Tiger vein segment.
As in the Collins vein segment, recent open-pit min ing of the Mammoth-Tiger vein segment has clarified rela tions shown by Peterson (1938). West of the vein-fault, only Cloudburst Formation is exposed, whereas on the east side, Oracle Granite is overlain by Cloudburst Forma tion conglomerate along a gently east-dipping contact whose elevation at the vein is about 3,200 feet (975 m; fig. 2). Both pit walls are cut by intrusive rhyolite (pi. 1). Peterson (1938) describes the contact in his text (his p. 11), and his plates show it to the south in the subsurface Mohawk mine workings, where "arkose" is shown overly ing Oracle Granite. Thus the relations at the Mammoth- Tiger open cut are similar to those in the Collins open cut the vein-fault is down on the west, and an Oracle- Cloudburst contact is exposed on the east wall of the pit. Exposure of this valuable relation in both cuts is apparent ly fortuitous. As in the Collins vein segment, the relation of mineralization intensity to strike of vein-faults suggests a component of right-lateral motion.
Reconstruction
Offsets of three local features can be used to recon struct the Mammoth-Tiger and Collins vein segments across the Mammoth fault zone:
1. The offset of the veins themselves. Peterson's (1938) subsurface data and more generalized information in Creasey (1950) suggest a downdip separation of 260 to 300 m (850 to 1,000 ft) on the plane of the fault, or 230 to
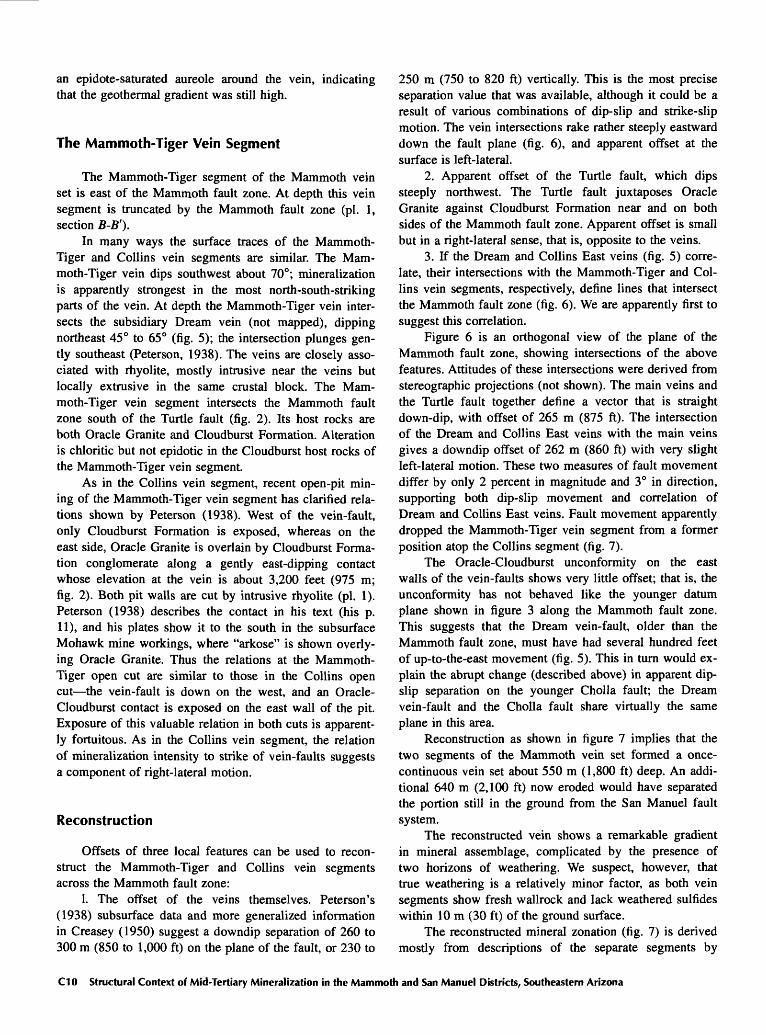
250 m (750 to 820 ft) vertically. This is the most precise separation value that was available, although it could be a result of various combinations of dip-slip and strike-slip motion. The vein intersections rake rather steeply eastward down the fault plane (fig. 6), and apparent offset at the surface is left-lateral.
2. Apparent offset of the Turtle fault, which dips steeply northwest. The Turtle fault juxtaposes Oracle Granite against Cloudburst Formation near and on both sides of the Mammoth fault zone. Apparent offset is small but in a right-lateral sense, that is, opposite to the veins.
3. If the Dream and Collins East veins (fig. 5) corre late, their intersections with the Mammoth-Tiger and Col lins vein segments, respectively, define lines that intersect the Mammoth fault zone (fig. 6). We are apparently first to suggest this correlation.
Figure 6 is an orthogonal view of the plane of the Mammoth fault zone, showing intersections of the above features. Attitudes of these intersections were derived from stereographic projections (not shown). The main veins and the Turtle fault together define a vector that is straight down-dip, with offset of 265 m (875 ft). The intersection of the Dream and Collins East veins with the main veins gives a downdip offset of 262 m (860 ft) with very slight left-lateral motion. These two measures of fault movement differ by only 2 percent in magnitude and 3° in direction, supporting both dip-slip movement and correlation of Dream and Collins East veins. Fault movement apparently dropped the Mammoth-Tiger vein segment from a former position atop the Collins segment (fig. 7).
The Oracle-Cloudburst unconformity on the east walls of the vein-faults shows very little offset; that is, the unconformity has not behaved like the younger datum plane shown in figure 3 along the Mammoth fault zone. This suggests that the Dream vein-fault, older than the Mammoth fault zone, must have had several hundred feet of up-to-the-east movement (fig. 5). This in turn would ex plain the abrupt change (described above) in apparent dip- slip separation on the younger Cholla fault; the Dream vein-fault and the Cholla fault share virtually the same plane in this area.
Reconstruction as shown in figure 7 implies that the two segments of the Mammoth vein set formed a once- continuous vein set about 550 m (1,800 ft) deep. An addi tional 640 m (2,100 ft) now eroded would have separated the portion still in the ground from the San Manuel fault system.
The reconstructed vein shows a remarkable gradient in mineral assemblage, complicated by the presence of two horizons of weathering. We suspect, however, that true weathering is a relatively minor factor, as both vein segments show fresh wallrock and lack weathered sulfides within 10 m (30 ft) of the ground surface.
The reconstructed mineral zonation (fig. 7) is derived mostly from descriptions of the separate segments by
CIO Structural Context of Mid-Tertiary Mineralization in the Mammoth and San Manuel Districts, Southeastern Arizona
Peterson (1938) and Creasey (1950). The economic miner al assemblage of the veins is oxide-dominated except for the deepest 60 m (200 ft), where lead and zinc show their maximum concentrations as sulfides. At shallower depths, lesser lead and zinc are present as carbonates. Molybde num and vanadium values reach maxima at 60 to 400 m (200 to 1,300 ft) above the deepest levels of mineraliza tion as the oxides wulfenite and vanadinite, respectively. These constituents are virtually absent at deeper levels. Copper, as carbonate and silicate minerals, shows a maxi mum at 180 m (600 ft) above the lowest level, but lesser copper sulfide increases downward. Gold distribution is ir regular and may indeed be controlled by post-faulting re distribution. Peterson noted that the zonation outlined above is present along the strike of the veins also, such that the solutions seem to be derived from deep under the northwest end of the Collins vein segment.
THE SHULTZ SPRING ALTERED ZONE
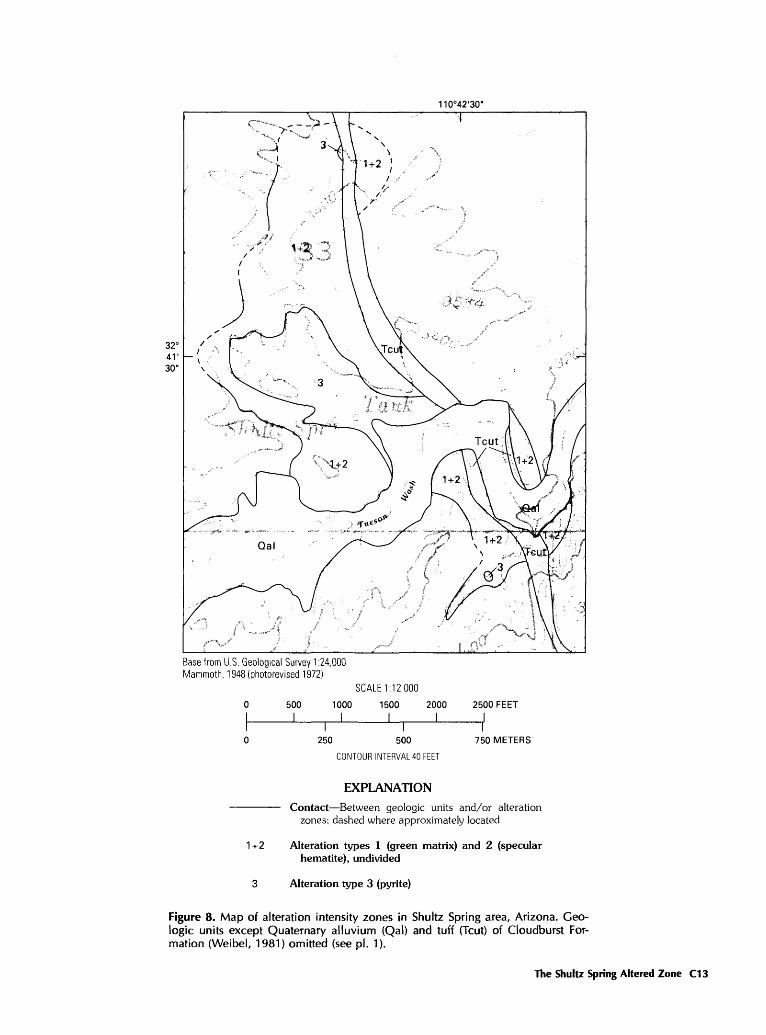
A narrow area elongated northwest-southeast is al tered and weakly mineralized in and north of Tucson Wash, near Shultz Spring, on the upper plate of the San Manuel fault system (fig. 8). This alteration is previously undescribed. Conglomerate of the upper member of the Cloudburst Formation is the host rock. The overlying San Manuel Formation nearby is unaltered, so the alteration is apparently mid-Tertiary.
Alteration
Alteration and mineralization in the Shultz Spring area are disseminated. A continuous set of veins is not present, though some quartz veining occurs. Alteration of
FEET4750
4500
4250
4000
3750
3500
3250
3000
2750
2500
2250
NNW FEET
4750
4500
4250
4000
3750
3500
3250
3000
2750
2500
2250
Dream vein intersection / I
3000 2500 2000 1500 1000
DISTANCE ALONG FAULT TRACE, IN FEET
500
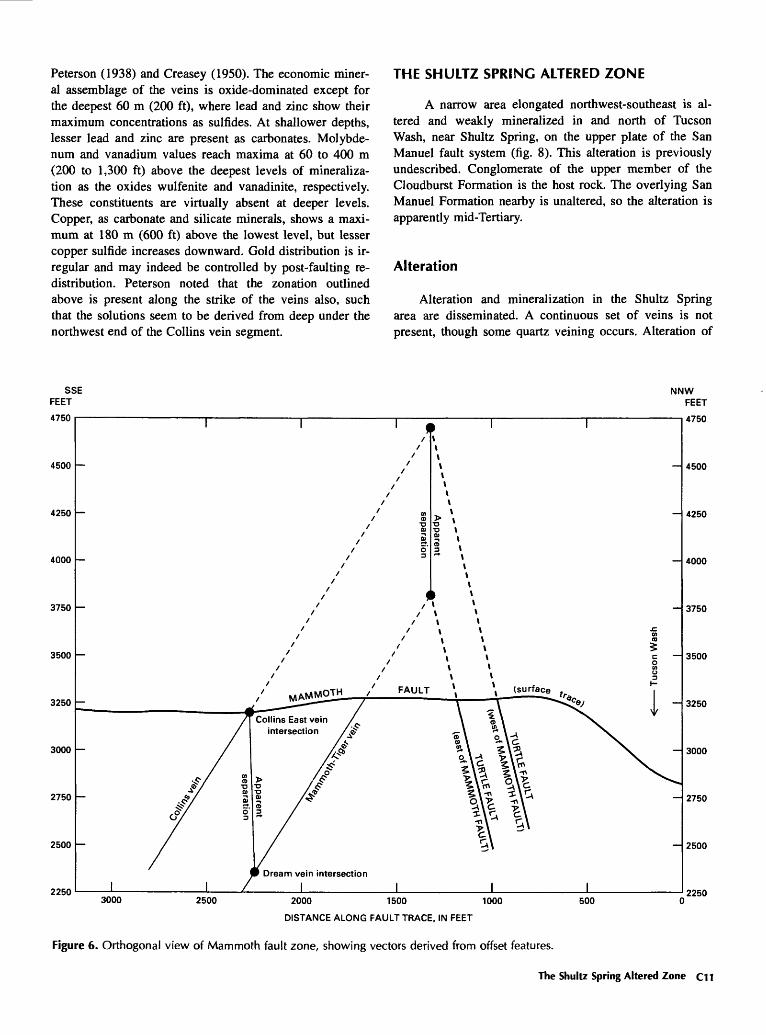
Figure 6. Orthogonal view of Mammoth fault zone, showing vectors derived from offset features.
The Shultz Spring Altered Zone C11
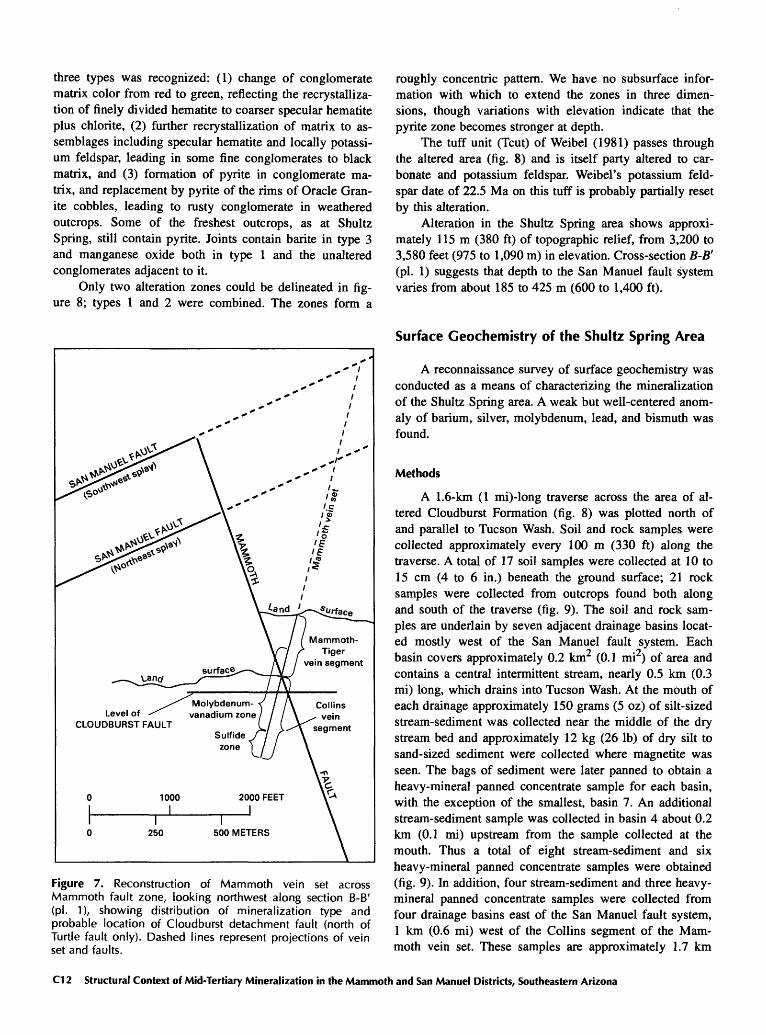
three types was recognized: (1) change of conglomerate matrix color from red to green, reflecting the recrystalliza- tion of finely divided hematite to coarser specular hematite plus chlorite, (2) further recrystallization of matrix to as semblages including specular hematite and locally potassi um feldspar, leading in some fine conglomerates to black matrix, and (3) formation of pyrite in conglomerate ma trix, and replacement by pyrite of the rims of Oracle Gran ite cobbles, leading to rusty conglomerate in weathered outcrops. Some of the freshest outcrops, as at Shultz Spring, still contain pyrite. Joints contain barite in type 3 and manganese oxide both in type 1 and the unaltered conglomerates adjacent to it.
Only two alteration zones could be delineated in fig ure 8; types 1 and 2 were combined. The zones form a
Mammoth- Tiger
vein segment
Molybdenum- Level of ^ vanadium zone
CLOUDBURST FAULTSulfide
zone
250
Figure 7. Reconstruction of Mammoth vein set across Mammoth fault zone, looking northwest along section B-B' (pi. 1), showing distribution of mineralization type and probable location of Cloudburst detachment fault (north of Turtle fault only). Dashed lines represent projections of vein set and faults.
roughly concentric pattern. We have no subsurface infor mation with which to extend the zones in three dimen sions, though variations with elevation indicate that the pyrite zone becomes stronger at depth.
The tuff unit (Tcut) of Weibel (1981) passes through the altered area (fig. 8) and is itself party altered to car bonate and potassium feldspar. Weibel's potassium feld spar date of 22.5 Ma on this tuff is probably partially reset by this alteration.
Alteration in the Shultz Spring area shows approxi mately 115 m (380 ft) of topographic relief, from 3,200 to 3,580 feet (975 to 1,090 m) in elevation. Cross-section B-B' (pi. 1) suggests that depth to the San Manuel fault system varies from about 185 to 425 m (600 to 1,400 ft).
Surface Geochemistry of the Shultz Spring Area
A reconnaissance survey of surface geochemistry was conducted as a means of characterizing the mineralization of the Shultz Spring area. A weak but well-centered anom aly of barium, silver, molybdenum, lead, and bismuth was found.
Methods
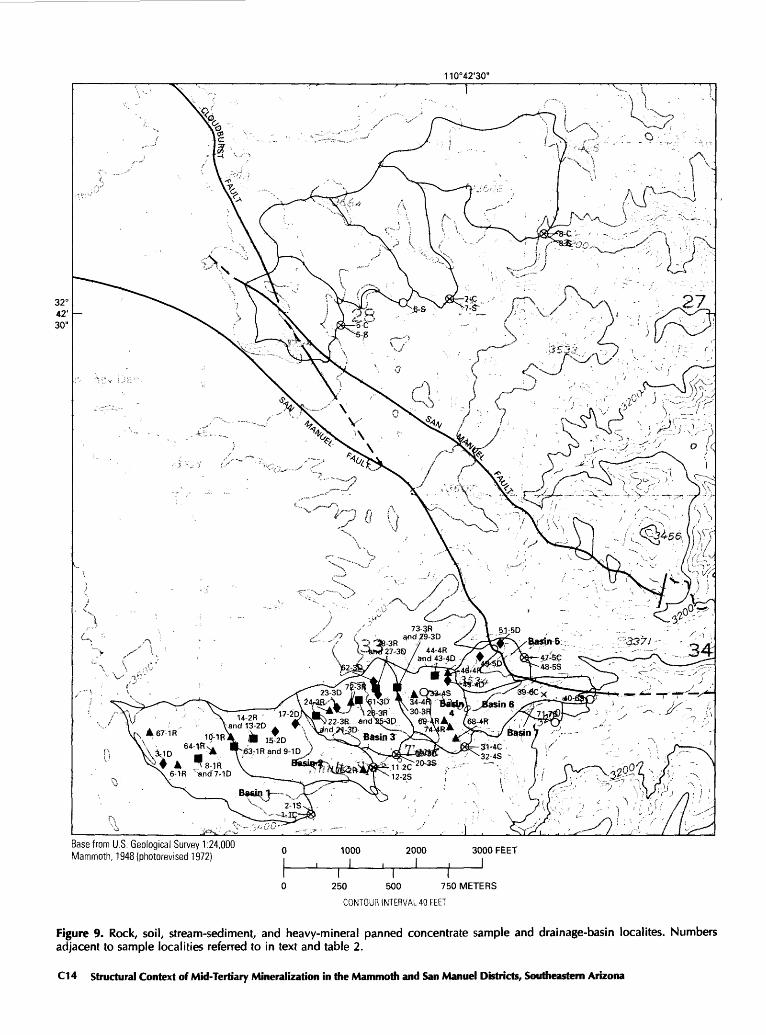
A 1.6-km (1 mi)-long traverse across the area of al tered Cloudburst Formation (fig. 8) was plotted north of and parallel to Tucson Wash. Soil and rock samples were collected approximately every 100 m (330 ft) along the traverse. A total of 17 soil samples were collected at 10 to 15 cm (4 to 6 in.) beneath the ground surface; 21 rock samples were collected from outcrops found both along and south of the traverse (fig. 9). The soil and rock sam ples are underlain by seven adjacent drainage basins locat ed mostly west of the San Manuel fault system. Each basin covers approximately 0.2 km2 (0.1 mi2) of area and contains a central intermittent stream, nearly 0.5 km (0.3 mi) long, which drains into Tucson Wash. At the mouth of each drainage approximately 150 grams (5 oz) of silt-sized stream-sediment was collected near the middle of the dry stream bed and approximately 12 kg (26 Ib) of dry silt to sand-sized sediment were collected where magnetite was seen. The bags of sediment were later panned to obtain a heavy-mineral panned concentrate sample for each basin, with the exception of the smallest, basin 7. An additional stream-sediment sample was collected in basin 4 about 0.2 km (0.1 mi) upstream from the sample collected at the mouth. Thus a total of eight stream-sediment and six heavy-mineral panned concentrate samples were obtained (fig. 9). In addition, four stream-sediment and three heavy- mineral panned concentrate samples were collected from four drainage basins east of the San Manuel fault system, 1 km (0.6 mi) west of the Collins segment of the Mam moth vein set. These samples are approximately 1.7 km
C12 Structural Context of Mid-Tertiary Mineralization in the Mammoth and San Manuel Districts, Southeastern Arizona
110°42'30"
Base from U.S. Geological Survey 1:24,000 Mammoth, 1948(photorevised 1972)
SCALE 1:12 000
D 500I
1000I
1500 I
2000 25I
I I I250 500
CONTOUR INTERVAL 40 FEET
750 METERS
1+2
EXPLANATIONContact Between geologic units and/or alteration
zones; dashed where approximately located
Alteration types 1 (green matrix) and 2 (specular hematite), undivided
Alteration type 3 (pyrite)
Figure 8. Map of alteration intensity zones in Shultz Spring area, Arizona. Geo logic units except Quaternary alluvium (Qal) and tuff (Tcut) of Cloudburst For mation (Weibel, 1981) omitted (see pi. 1).
The Shultz Spring Altered Zone C13
110°42'30"
Base from U.S. Geological Survey 1:24,000 Mammoth, 1948(photorevised 1972)
1000 2000 I
3000 FEET
I I I 250 500 750 METERS
CONTOUR INTERVAL 40 FEET
Figure 9. Rock, soil, stream-sediment, and heavy-mineral panned concentrate sample and drainage-basin localites. Numbers adjacent to sample localities referred to in text and table 2.
C14 Structural Context of Mid-Tertiary Mineralization in the Mammoth and San Manuel Districts, Southeastern Arizona
(1 mi) northeast of the samples collected in the Shultz Spring area and allow some comparison between samples from Cloudburst Formation on the lower and upper plates of the San Manuel fault system.
All samples were submitted to the U.S. Geological Survey, Denver, Colo., for sample preparation and analyses by two techniques: the six-step DC-ARC emission-spectro- graphic method for 35 elements (analyst: R. Hopkins) and the graphite-furnace atomic-absorption method for gold (analyst: B. Roushey). For the panned-concentrate sam ples, only the nonferromagnetic, minus 35-mesh fraction was analyzed. The results of the analyses are presented in table 2.
The following elements were not detected in any rock, soil, stream-sediment, or panned concentrate samples by the emission-spectrographic method at the detection limits given in parts per million (ppm) in parentheses after the element (the second, higher number is the detection limit for pan concentrated samples only): arsenic (200, 500), gold (10, 20), cadmium (20, 50), germanium (10, 20), and antimony (100, 200). In general, the detection limits for bismuth (10), thorium (100), tin (10), tungsten (20), and zinc (200) were also too high to be useful in this study.
The reliability of the analytical data is of course a major factor in its use. Although some of the analytical data presented here are probably not adequate for detailed geochemical work, they are believed to be useful as a re connaissance tool to differentiate areas with anomalous metal concentrations from those containing only back ground concentrations.
For elements with sufficient unqualified data the background values, the mean plus-or-minus two standard deviations, are calculated using the values reported for 12 unaltered rock and 8 unaltered soil samples. Lower limits of anomalous concentration data, the thresholds, were also established (table 3). For elements that have insufficient
EXPLANATION
Sample locality Numbers referred to in table 2
A Rock
+ Soil
Rock and soil
O Stream sediment
x Heavy-mineral panned concentrate
Drainage basin Numbers referred to in text and tables
San Manuel and Cloudburst faults Dashed where inferred
Figure 9. Continued
unqualified data to calculate the mean, any detected occur rence, including values qualified with "L", is considered anomalous where the detection limit of the method greatly exceeds their average crustal abundances. For gold values determined by the atomic-absorption method, any detected occurrence, excluding L.002, is considered anomalous. The thresholds established for soil samples in table 3 are also used to determine the anomalous stream-sediment sample data. Histograms (not shown) were drawn for the heavy-mineral panned concentrate data and the highest separate values are considered anomalous.
Distribution of Anomalous Data in the Shultz Spring Area
Barium
The highest concentrations of barium are found to be roughly coincident with the zone of mapped mineralization which occupies most of basin 3 (table 4; figs. 8, 9, and 10). All soil samples collected in basin 3 contain amounts of barium at threshold (1,500 ppm) or greater (table 3).
Silver
Four of the five samples which contain detectable sil ver are also located within basin 3 (fig. 11). The silver- bearing samples have high amounts of barium (fig. 10) as well as low amounts of calcium (fig. 12). Three of the high barium-silver rock samples (samples 26-3R, 28-3R, and 22-3R, fig. 9, table 2) are characterized by white to pale yellowish orange (N9 to 10YR 8/6 of Munsell system of color identification (Goddard and others, 1984)) clay al teration. These altered rocks contain low amounts of calci um, magnesium, sodium, cobalt, manganese, and strontium in comparison to unaltered rocks collected from basin 1 (table 5).
Lead
Whereas as much as 15,000 ppm lead is found in heavy-mineral panned concentrate samples collected from drainage basins on the lower San Manuel plate to the east, values of s200 ppm lead occur in the Shultz Spring area. However, two of the three samples containing anomalous concentrations of lead in the Shultz Spring area lie within basin 3 (fig. 13).
Bismuth
Fifty ppm bismuth was found in one sample: the heavy- mineral panned concentrate sample from basin 3 (fig. 13).
Molybdenum
All rock, soil, and stream-sediment samples with de tectable (s5L ppm) molybdenum are located in the central
The Shultz Spring Altered Zone CIS
Tabl
e 2.
Res
ults
of
anal
yses
of
12 s
trea
m-s
edim
ent,
9 he
avy-
min
eral
pan
ned
conc
entr
ate,
17
soil,
and
21
rock
sam
ples
fro
m n
ear
Tuc
son
Was
h in
the
San
Man
uel
min
ing
dis
tric
t, A
rizo
na
[Ana
lyse
s by
sem
iqua
ntita
tive
emis
sion
spe
ctro
grap
hy,
exce
pt f
or g
old
whi
ch w
as b
y at
omic
abs
orpt
ion.
All
valu
es i
n pa
rts
per
mill
ion
exce
pt f
or c
alci
um,
iron,
mag
nesi
um,
sodi
um,
phos
phor
ous,
and
tit
aniu
m, w
hich
are
in
wei
ght p
erce
nt.
Sym
bols
use
d: <
, le
ss t
han
valu
e sh
own;
>,
grea
ter
than
val
ue s
how
n; N
, not
det
ecte
d. S
ee f
igur
e 9
for
sam
ple
loca
litie
s]
3-. § 3* & IU a. . q
Stream
sediment
samples
Sample
2-15
12-2S
20-3S
32-4S
33-4S
48-55
40-6S
71-75
5-S
6-S
7-S
8-S Sample
2-1S
12-25
20-3S
32-4S
33-4S
48-5S
40-65
71-75
5-S
6-S
7-S
8-S
Ca
1.0 .5 .5 .7 .7
2.0 .7 .7
1.5
1.5
1.5
1.5 La 70 20 70
150 70 50
100
100 50
100 70 50
Fe 10 207
157 5
15 155 7 7 5
Mn
1,000
500
700
1,000
700
1,000
1,000
1,500
1,500
1,500
1,500
2,000
Mg .7 .3 .7 .5
1.0
1.5 .7 .7
1.5
1.5
1.5
1.5
Mo N N N N<5
N 15 N N 7 7 N
Na
1.5 .3
1.0 .5
1.0
2.0 .7 .7
2.0
1.5
1.5
1.5
Nb 20
<20 20
<20 20
<20 20 30
<20 20 20
<20
P
<.2
<.2 .2
<.2 .2
<.2 N N
<.2 N <.2
<.2 Ni 30 30 30 30 30 50 50 30 50 50 50 30
Ti .7 .7 .5 .7 .7 .51.0
1.0 .5 .7 .5 .5 Pb 70 70 70 70 70
100 70 70 70 50 70
300
B 10 N 15 N30
20 N N
20
<10 10 15 Sc 10 10 10 10 10 15 10 10 15 15 15 15
Ba
700
1,500
2,000
1,500
1,000
700
500
500
1,000
1,000
1,000
1,500
Sr
150 N
200
100
300
300
200
200
300
300
500
300
Be
2.0
2.0
3.0
1.5
3.0
3.0
1.5
<1.0
3.0
1.0
2.0
3.0
V 300
300
150
300
150
150
200
200
150
200
150
150
Co
20 30 20
30 20
20 30 30 20 20
20
20
Y 150
300
150
300
150 70
200
200 30 50 30 30
Cr
150
300 70
300
100
150
500
500
150
200
150
100
Zn N N N N N N N N N N N<200
Cu 70 70
200
150
150
200
500
300
300
150
300
300 Zr
1,000
>1,000
1,000
>1,000
700
300
>1,000
>1,000
150
200
200
150
Ga 30 50 30 50 30
30 30 30 50 30 50 30
Au
.002
<.002
<.002
<.002
<.002
<.002
.004
<.002
.004
.002
.006
.004
Tabl
e 2.
Res
ults
of
anal
yses
of
12 s
trea
m-s
edim
ent,
9 he
avy-
min
eral
pan
ned
conc
entr
ate,
17
soil,
and
21
rock
sam
ples
fro
m n
ear
Tuc
son
Was
h in
the
San
Man
uel
min
ing
dis
tric
t, A
rizo
na C
ontin
ued
n N
Heavy-mineral
panned
concentrate
samples
Sample
1-1C
11-2C
19-3C
31-4
C47
-5C
39-6
C5-
C7-
C8-
C Samp
le
1-1C
11-2C
19-3C
31-4
C47-5C
39-6
C5-
C7-
C8-
C
Samp
le
1-1C
11-2
C19-3C
31-4C
47-5C
39-6C
5-C
7-C
8-C
Ca
7 5 5 715
7>50 730 Co
N N N N N N<20 N N Pb
70 7020
0 7010
0 7020
03,000
15,0
00
Fe 1.5
5.0 .7 .7
1.0
1.0
1.0
2.0
1.0
Cr 20 50<2
0 20 70 50 30 100 50
Sc 150
100 70
200
150
200 30 70 70
Mg
.30
.30
.15
.15
.30
.30
.50
1.00 .30
Cu 20 N N N 70 50 50200
200
Sn
N N N N N N N 30N
Na
P Ti
.5
5.0
2.0
.5
1.0
2.0
N 2.
0 2.
0N
3.0
>2.0
<.5
10.0
>2.0
.5
3.0
>2.0
<.5
<.5
.71.
5 .5
>2.0
<.5
1.5
2.0
Ga
La
Mn
<10
100
700
10
<100
500
<10
<100
500
<10
<100
50
010
10
0 50
0
<10
100
500
N <1
00
500
15
<100
700
N 100
700
Sr
Th
V
500
N 15
01,500
N 10
02,000
200
150
700
200
200
N N
200
N <2
00
200
500
N 150
500
N 70
01,500
N 3,000
B <20
<20 N
<20 20 <20 N
<20
<20 W
N N N N N N N N30
0
Ba
>10,000
>10,000
>10,000
>10,000
500
1,50
010,000
7,00
0>10,000
Mo
N N N N N N N15
0700
Y 1,00
070
070
01,
500
1,50
01,
000
700
200
500
Be <2 <2 <2 N N N N <2 N
Nb
<50 50 50
<50 50
<50 50 70 50
Zr
>2,000
>2,000
>2,000
>2,000
>2,000
>2,000
>2,000
>2,000
>2,000
Bi
N N50 N N N N N N Ni N N N N
<10 N N
<10 N
Au
N N N N .017.120
.0 .0 .0
n 00 itructura n o fe X g, 2 QL 3. 5* -< 2 5' n si gj. 5' 3 5* n 2 3 3 £ 2 a. if 2 IU 2. O 5* 2,n' ff
Tab
le 2
. R
esul
ts o
f an
alys
es o
f 12
str
eam
-sed
imen
t, 9
heav
y-m
iner
al p
anne
d co
ncen
trat
e, 1
7 so
il, a
nd 2
1 ro
c m
inin
g di
stri
ct,
Ari
zona
C
onti
nued
k sa
mpl
es f
rom
nea
r Tu
c:so
n W
ash
in t
he S
an M
lanu
el
Ro
ck
sam
ple
s
Sam
ple
67-1
R6-
1R8-
1R
64-1
R10
-1R
63-1
R14
-2R
75-2
R22
-3R
24-3
R
26-3
R72
-3R
28-3
R30
-3R
73-3
R
34-4
R68
-4R
69-4
R74
-4R
44-4
R
46-4
R
Ca .30
2.0
02.0
05.0
0.7
0
2.0
07
.00
.15
.20
.30
.15
.20
.15
.70
.30
10
.00
10.0
01
.50
5.0
05.0
0
3.0
0
Fe 3 3 3 5 3 3 3 3 2 3 2 3 3 2 3 3 3 3 3 2 3
Mg .70
1.5
0.7
01.0
01
.50
1.0
0.7
0.3
0.3
0.5
0
.50
.30
.30
.15
.30
.70
.70
.70
.70
.50
1.5
0
Na
2.0
3.0
2.0
2.0
1.5
2.0
1.5
1.5 .7
1.0 N .7
1.0
2.0
2.0
2.0
2.0
1.0
1.5
2.0
1.5
P T
i
<.2
.3
0<
.2
.20
<.2
.2
0N
.30
<.2
.3
0
<.2
.3
0N
.20
<.2
.3
0.2
.2
0<
.2
.30
N .5
0N
.20
<.2
.3
0<
.2
.15
.2
.20
<.2
.1
5N
.20
N .3
0<
.2
.30
N .2
0
N .3
0
Ag .5 N N N N N N N <
.5 N <.5 N N N <.5 N N N N N N
B 15 15 20 20 20 30 30 20 15 20 30 15 20 70 30 20 15 30 20 30 20
Ba
1,5
00
1,5
00
1,0
00
1,0
00
1,0
00
700
1,0
00
1,0
00
>5
,00
0>
5,0
00
1,5
00
2,0
00
1,5
00
2,0
00
1,5
00
1,0
00
1,0
00
700
700
1,0
00
1,5
00
Be
2.0
1.5
1.5
2.0
1.5
1.5
2.0
3.0
2.0
1.5
1.5
2.0
3.0
3.0
3.0
3.0
2.0
3.0
2.0
3.0
1.5
Co 15 15 15 20 20 15 15<
10 <10 10 N 50
<10
<10 N 10 10 20 15 15 30
Cr 50
100 50 100 70 30 20
<10 20 20 30 20 15 30 20 30 30 30 20 15
100
Cu 30 30 20 20 30 20 20 10 30 20 10 20 30 30 20 20 20 20 20 20 30
Samp
leGa
LaMn
MoNb
NiPb
ScSr
ZnZr
> N* O IU
67-1R
6-1R
8-1R
64-1R
10-1R
30
30 30 30 30
50
50
<50 50
<50
500
700
700
1,000
700
N N N N N
20
<20 N20 20
30
30 20 30 30
70
50 30 70 50
157 7
15 15
200
300
200
300
150
100
70100
100
100
50
30 10 70 50
N N N<200
<200
300
200
100
200
200
n I
Tabl
e 2.
Res
ults
of
anal
yses
of
12 s
trea
m-s
edim
ent,
9 he
avy-
min
eral
pan
ned
conc
entr
ate,
17
soil,
and
21
rock
sam
ples
fro
m n
ear
Tuc
son
Was
h in
the
San
Man
uel
min
ing
dis
tric
t, A
rizo
na C
ontin
ued
63
-1R
30
<
50
700
N <
20
20
30
7 300
100
15
<2
00
100
14-2R
75-2R
22-3R
24-3R
30
20 15 15
<50
<50
<50
<50
1,500
100
150
500
N N N N
<20
<20
<20
<20
105
<5 10
50 30 5050
7107
10
300 N
300
700
70 70 70
70
50 20 30 30
N300 N N
150
100
200
300
26-3
R
30
70
150
N 20
<
5 30
10
N
100
30
N 200
72-3R
28-3R
30-3R
73-3R
34-4R
68-4R
69-4R
74-4R
44-4R
20 20 20 20 30 30 20 2020
<50
<50
<50
<50
<50
<50 50 50
<50
2,000
200
700
700
1,000
1,500
700
1,000
700
15N
20N N N N N N
<20
<20 30
<20
<20
<20 20
<20
<20
30 <5 <5 <5
7107 5 7
505070 70 50 50 30 30 50
7 7 710 10 10 10 107
N<100 N N
300
<100
300
300
200
70 70
50
50 50 70 70 70 70
30 30 70 50 30 30 50 50 30
N N N N N N N N N
150
200
150
150
100
100
200
100 70
46-4
R
30
<50
700
N <
20
50
30
15
1,0
00
100
30
N 100
n
Tabl
e 2.
Res
ults
of
anal
yses
of
12 s
trea
m-s
edim
ent,
9 he
avy-
min
eral
pan
ned
conc
entr
ate,
17
soil,
and
21
rock
sam
ples
fro
m n
ear
Tuc
son
Was
h in
the
San
Man
uel
min
ing
dist
rict,
Arizo
na
Co
ntin
ue
d
3 n IU a.
Soil
samples
Samp
le
3-1D
7-1D
9-1D
13-2D
15-2D
17-2D
21-3D
23-3D
25-3D
27-3D
61-3D
62-3D
29-3D
43-4D
45-4D
49-5D
51-5D
Sample
3-1D
7-1D
9-1D
13-2D
15-2D
17-2D
21-3D
23-3D
25-3D
27-3D
Ca 1.0
5.0 .5
1.5
1.5 .7 .7 .7
1.0 .7
1.5 .3
5.0
2.0
3.0
7.0 .7
Be
2.0
3.0
3.0
2.0
3.0
2.0
2.0
2.0
3.0
3.0
Fe
5 3 3 7 5 5 3 5 3 5 5 5 3 3 3 3 5
Co 20 15 15 20 20 20 15 20 20 20
Mg 1.5 .7
1.0
1.0
1.0
1.0 .7
1.0 .7
1.0
1.0 .7
1.0 .7
1.0
1.5
1.0 Cr
100
100
100
150
150
100
100
100 70
100
Na 1.0 .7 .7
1.5
1.5
2.0
1.0
2.0 .7
1.5
1.5
1.5
1.0 .7
1.0
1.5
1.5
Cu 50 50 50 70 50
150 70
300 70 70
P
<.2
<.2 .2
<.2
<.2
<.2
<.2
<.2 .3
<.2
<.2 N 1.0
<.2
<.2 N
<.2 Ga 30 15 15 30 30 50 30 30 30 30
Ti .5 .3 .5 .5 .5 .5 .3 .5 .3 .5 .5 .5 .3 .3 .3 .3 .5 La
70 70 70 70 70
100 70 70 70 70
Ag N N N N N N .7 N N N N N N N N N N Mn
1,000
700
700
1,000
1,000
1,000
500
700
700
700
B 20 20 20
30 30 30 30 30 30 30 30 30 50 30 20 20 20 Mo N N N N N <5N 7 N N
Ba
700
700
700
1,000
1,000
1,500
2,000
2,000
2,000
2,000
5,000
1,500
3,000
700
700
700
1,000
Nb
20
20
20 20 20 20 20 20
<20 20

Tabl
e 2.
Res
ults
of
anal
yses
of
12 s
trea
m-s
edim
ent,
9 he
avy-
min
eral
pan
ned
conc
entr
ate,
17
soil,
and
21
rock
sam
ples
fro
m n
ear
Tuc
son
Was
h in
the
San
Man
uel
min
ing
dis
tric
t, A
rizo
na C
ontin
ued
n v> c 5F f
1' n I n n K9
61-3D
62-3D
29-3D
43-4D
45-4D
49-5D
51-5D
Sample
3-1D
7-1D
9-1D
13-2D
15-2D
17-2D
21-3D
23-3D
25-3D
27-3D
61-3D
62-3D
29-3D
43-4D
45-4D
49-5D
51-5D
2.0
3.0
3.0
3.0
2.0
1.5
2.0 Ni 50 30 30 50 50 30 30 30 30 50 30 30 20
20
30 30
30
20 20 15 15 15 20 20 Pb 70 50 50 70 70 70 7010
0 70 50 70 70 50
50
50 50
70
100
100 70 50
100
100
100 Sc 15 15 15 15 15 20 15 20 15 20 20 20 15
15
15 15
15
100
100 70 50 70 50 70
Sr
100
100
<100
150
100
200
<100
100
150
<100
150
150
300
<100
300
300
200
30 30 20 15 15 20 30 V 100
100
100
150
100
150
150
150
150
150
150
150
100
100
100
150
100
70 70 70 70 70 50 70 Y 100 50 50 70 70 100 70 70
100
100
150
100 70
70
50 30
100
700
700
1,000
700
700
700
700 Zn
<200 N N N
<200 N
<200 N N N N N N N N N
<200
N N<5N N N N Zr
500
200
300
300
150
300
500
500
500
500
500
700
150
300
200
150
300
20 20 20 20<20 20 20 Au
<.002
N<.002
N<.002
.002
<.002
.002
<.002
<.002
.006
.002
<.002
.002
.002
<.002
.002
Q
Tabl
e 3.
Sum
mar
y of
sta
tistic
al d
ata
and
thre
shol
d co
ncen
trat
ions
of
sem
(qua
ntita
tive
spec
trog
raph
ic d
ata
for
rock
and
soi
l sa
mpl
es w
ithou
t al
tera
tion
in t
he S
hultz
w
Sprin
g ar
ea,
Ari
zona
£
3 [A
ll va
lues
in
part
s pe
r m
illio
n ex
cept
tho
se f
or ir
on,
mag
nesi
um, c
alci
um,
titan
ium
, an
d so
dium
, whi
ch a
re i
n w
eigh
t pe
rcen
t. L,
det
ecte
d bu
t be
low
lim
it of
det
erm
inat
ion;
,
no d
ata.
c V
alue
s ar
e re
port
ed a
s 0.
15,
0.2,
0.3
, 0.
5, 0
.7,
1.0,
or
pow
ers
of 1
0 of
thes
e nu
mbe
rs t
hat
are
the
roun
ded
valu
es f
or t
he a
ppro
xim
ate
geom
etri
c m
idpo
ints
(0.
16,
0.22
, 0.
34,
0.46
, 0.
73,
1.0,
or
pow
ers
£.
of 1
0 of
thes
e nu
mbe
rs)
of th
e in
terv
als
for
the
six
step
s pe
r or
der
of m
agni
tude
dilu
tion
of a
sta
ndar
d by
one
ord
er o
f m
agni
tude
(M
otoo
ka a
nd G
rim
es,
1976
). Fo
r a
calc
ulat
ed b
ackg
roun
d (x
+2o
) th
at
Q
falls
bet
wee
n th
e ap
prox
imat
e ge
omet
ric
mid
poin
ts,
the
back
grou
nd is
take
n as
the
rep
orte
d va
lue
corr
espo
ndin
g to
the
mid
poin
t of
the
clos
est
valu
e. F
or e
xam
ple,
x+
2o o
f le
ad i
n ro
cks
is 6
9 pp
m. T
he
2-
num
ber
69 f
alls
clo
sest
to
73,
whi
ch i
s re
port
ed a
s 70
. T
hus,
the
bac
kgro
und
valu
e fo
r le
ad i
s as
sign
ed a
s 70
ppm
. T
he t
hres
hold
is
take
n as
the
adj
acen
t hi
gher
rep
ortin
g in
terv
al.
Thu
s th
e th
resh
old
is
£
100
ppm
of
lead
.Q ^
Cod
esfo
r co
lum
n"E
xpla
natio
nof
Thr
esho
ld D
eter
min
atio
n":
a, b
ackg
roun
d va
lues
not
dete
rmin
ed;
b,on
ly u
nqua
lifie
d da
ta u
sed
to c
alcu
late
mea
n (b
ackg
roun
d (x
+2o
) us
ed);
c, i
nsuf
fici
ent
5;
unqu
alif
ied
data
to
calc
ulat
e x+
2o (
any
dete
cted
occ
urre
nce,
inc
ludi
ng L
, co
nsid
ered
ano
mal
ous)
]
£ 3.
§T ~<
Ele
men
t
2'
3 f S
Fe3'
Mg
S-
Ca*
Tiw
Na
3 Ag
2.
As
B)
Au§
. B
$
BaI
teI
Bi
n Cd
0
Co3?
" C
rc? =
Cu
&
La£
Mn
£
Mo
1"
Nb
ff
N!3
Pb>
Sb
§
Scg
Sn Sr
Th V W Y Zn Zr
Det
ecti
on
lim
it
.05
.02
.05
.002
.2 .520
0 10 10 201 10 20 5 10 5 20 10 5 20 5 10 100 5 10 100
100 10 50 10
200 10
Num
ber
ofsa
mpl
es(n
)
12 12 12 12 12 21 21 21 12 12 12 21 21 12 12 12 4 12 21 3 12 12 21 12 21 11 21 12 21 12 21 12
Ari
thm
etic
mea
n(x
n) 3.
1 .94.4 .2
1.8 23
1,00
0 2 17 50 23 50 910 20 19 43 10 330 81 37
1
Sta
ndar
d
Th
resh
old
dev
iati
on
Bac
kgro
und
(low
er
I im
it o
f(o
~)
(x+
20)
anom
alou
s dat
a)
Roc
k S
ampl
es
.7 .43.
2 .1 .5,5
L20
0L 10L
6 30
50
260
1,50
0 2,
000
1 3
5 10L
20L
5 20
30
34
100
150
4.5
30
500
50
7031
0 1,
500
2,00
0 5L0
20
3014
50
70
13
70
100
100L
3 15
20 10
L23
0 70
0 1,
000
100L
18
100
150 50
L17
70
10
020
0L51
20
0 30
0
Expla
nat
ion
of
thre
sho
ldN
umbe
r of
sam
ples
det
erm
inat
ion
(n
)
a a a a a c c c b b b c c b b b b b c b b b c b c b c b c b c b
8 8 8 8 8 17 17 17 8 8 8 17 17 17 8 8 8 8 17 7 8 8 17 8 17 7 17 8 17 8 17 8
Ari
thm
etic
mea
n(x
n)
4.3 1.1
2.5 .4 1.2 23 810 2 18 110 51 68 810 20 38 60 15 180
110 65 260
Sta
nd
ard
dev
iati
on
(0)
1.5 .3
2.3 .1 .4 5
160 1 3 23 23 7
160 0 10 11 0 91
23
25
120
Bac
kgro
und
(x+
20)
Soil
S
ampl
es
_ _ _ 301,
000 3 20 15
010
0 701,
000 _ 20 50 70 15 __ 300 150 100 500
Thr
esho
ld(
low
er
lim
it
ofan
omal
ous
dat
a)
__ _
.5L
200L 10
L50
1,50
0 5 10L
20L
30 200
150
100
1,50
0 5L 30 70 100
100L 20 10
L50
010
0L20
0 50L
150
200L
700
Expla
nat
ion
of
thre
sho
ldd
eter
min
atio
n
a a a a a c c c b b b c c b b b b b c b b b c b c b c b c b c b
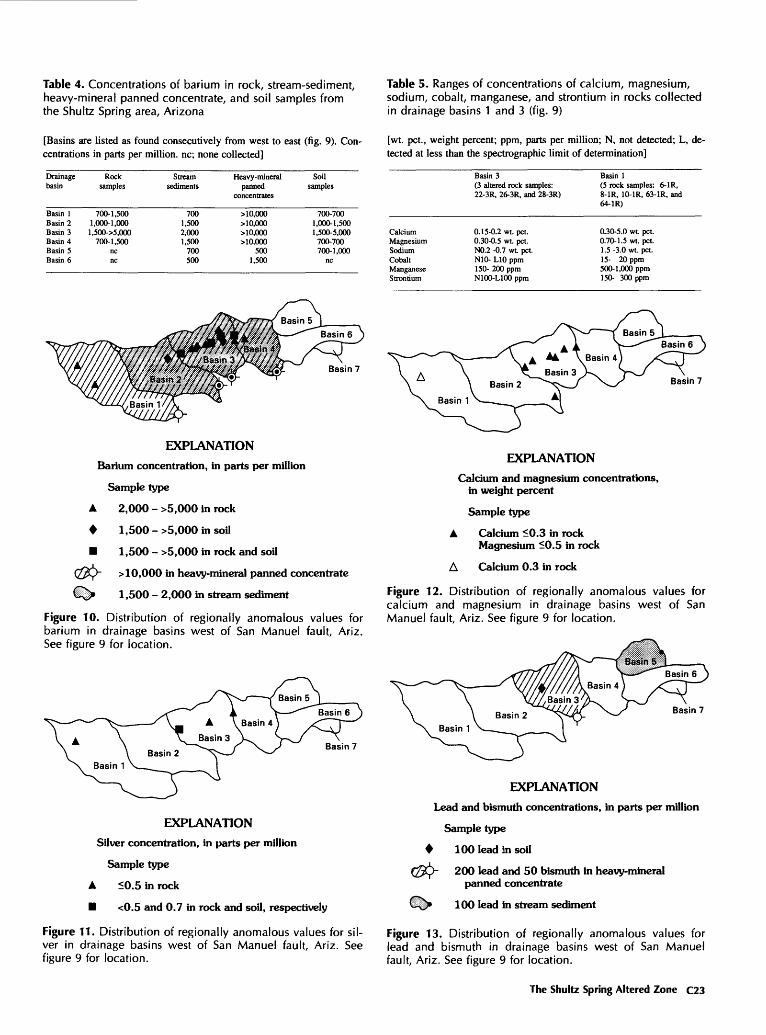
Table 4. Concentrations of barium in rock, stream-sediment, heavy-mineral panned concentrate, and soil samples from the Shultz Spring area, Arizona
[Basins are listed as found consecutively from west to east (fig. 9). Con centrations in parts per million, nc; none collected]
Table 5. Ranges of concentrations of calcium, magnesium, sodium, cobalt, manganese, and strontium in rocks collected in drainage basins 1 and 3 (fig. 9)
[wt. pet., weight percent; ppm, parts per million; N, not detected; L, de tected at less than the spectrographic limit of determination]
Drainage basin
Basin 1 Basin 2 Basin 3 Basin 4 Basin 5 Basin 6
Rock samples
700-1,500 1,000-1,000 1,500->5,000
700-1,500 nc nc
Stream sediments
700 1,500 2,000 1,500
700 500
Heavy-mineral panned
concentrates
>10,000 >10,000 >10,000 >10,000
500 1,500
Soil samples
700-700 1,000-1,500 1,500-5,000
700-700 700-1,000
nc
Calcium Magnesium Sodium Cobalt Manganese Strontium
Basin 3 (3 altered rock samples: 22- 3R, 26-3R, and 28-3R)
0.15-0.2 wt. pet. 0.30-0.5 wt. pet. N0.2 -0.7 wt pet. N10- L10 ppm 150- 200 ppm N100-L100 ppm
Basin 1 (5 rock samples: 6-1R, 8-1R, 10-1R, 63-1R, and 64-1R)
0.30-5.0 wt. pet. 0.70-1.5 wt. pet. 1.5 -3.0 WL pet. 15- 20 ppm 500-1,000 ppm 150- 300 ppm
Basin 7
EXPLANATION
Barium concentration, in parts per million
Sample type
A 2,000 - >5,000 in rock
* l,500->5,000insoil
1,500->5,000 in rock and soil
>10,000 in heavy-mineral panned concentrate
ii|> 1,500 - 2,000 in stream sediment
Figure 10. Distribution of regionally anomalous values for barium in drainage basins west of San Manuel fault, Ariz. See figure 9 for location.
EXPLANATIONCalcium and magnesium concentrations,
in weight percent
Sample type
A Calcium <0.3 in rockMagnesium 10.5 in rock
A Calcium 0.3 in rock
Figure 12. Distribution of regionally anomalous values for calcium and magnesium in drainage basins west of San Manuel fault, Ariz. See figure 9 for location.
Basin 7
Basin 7
EXPLANATION
Silver concentration, in parts per million
Sample type
A <0.5 in rock
<0.5 and 0.7 in rock and soil, respectively
Figure 11. Distribution of regionally anomalous values for sil ver in drainage basins west of San Manuel fault, Ariz. See figure 9 for location.
EXPLANATION
Lead and bismuth concentrations, in parts per million
Sample type
100 lead in soil
200 lead and 50 bismuth in heavy-mineral panned concentrate
100 lead in stream sediment
Figure 13. Distribution of regionally anomalous values for lead and bismuth in drainage basins west of San Manuel fault, Ariz. See figure 9 for location.
The Shultz Spring Altered Zone C23
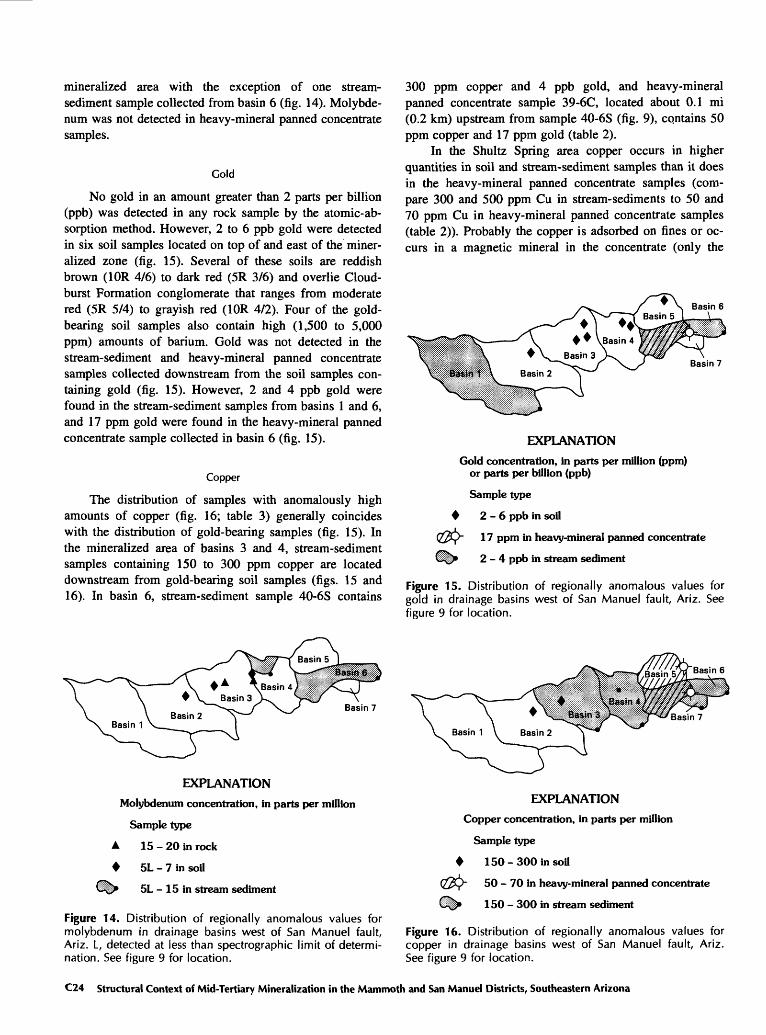
mineralized area with the exception of one stream- sediment sample collected from basin 6 (fig. 14). Molybde num was not detected in heavy-mineral panned concentrate samples.
Gold
No gold in an amount greater than 2 parts per billion (ppb) was detected in any rock sample by the atomic-ab sorption method. However, 2 to 6 ppb gold were detected in six soil samples located on top of and east of the miner alized zone (fig. 15). Several of these soils are reddish brown (10R 4/6) to dark red (5R 3/6) and overlie Cloud burst Formation conglomerate that ranges from moderate red (5R 5/4) to grayish red (10R 4/2). Four of the gold- bearing soil samples also contain high (1,500 to 5,000 ppm) amounts of barium. Gold was not detected in the stream-sediment and heavy-mineral panned concentrate samples collected downstream from the soil samples con taining gold (fig. 15). However, 2 and 4 ppb gold were found in the stream-sediment samples from basins 1 and 6, and 17 ppm gold were found in the heavy-mineral panned concentrate sample collected in basin 6 (fig. 15).
Copper
The distribution of samples with anomalously high amounts of copper (fig. 16; table 3) generally coincides with the distribution of gold-bearing samples (fig. 15). In the mineralized area of basins 3 and 4, stream-sediment samples containing 150 to 300 ppm copper are located downstream from gold-bearing soil samples (figs. 15 and 16). In basin 6, stream-sediment sample 40-6S contains
Basin 7
EXPLANATION
Molybdenum concentration, in parts per million
Sample type
A 15-20 in rock
4 5L - 7 in soil
ilp* 5L - 15 in stream sediment
Figure 14. Distribution of regionally anomalous values for molybdenum in drainage basins west of San Manuel fault, Ariz. L, detected at less than spectrographic limit of determi nation. See figure 9 for location.
300 ppm copper and 4 ppb gold, and heavy-mineral panned concentrate sample 39-6C, located about 0.1 mi (0.2 km) upstream from sample 40-6S (fig. 9), cqntains 50 ppm copper and 17 ppm gold (table 2).
In the Shultz Spring area copper occurs in higher quantities in soil and stream-sediment samples than it does in the heavy-mineral panned concentrate samples (com pare 300 and 500 ppm Cu in stream-sediments to 50 and 70 ppm Cu in heavy-mineral panned concentrate samples (table 2)). Probably the copper is adsorbed on fines or oc curs in a magnetic mineral in the concentrate (only the
Basin 6
Basin 7
EXPLANATIONGold concentration, in parts per million (ppm)
or parts per billion (ppb)
Sample type
> 2-6 ppb in soil
17 ppm in heavy-mineral panned concentrate
2-4 ppb in stream sediment
Figure 15. Distribution of regionally anomalous values for gold in drainage basins west of San Manuel fault, Ariz. See figure 9 for location.
EXPLANATIONCopper concentration, in parts per million
Sample type
150-300 in soil
50 - 70 in heavy-mineral panned concentrate
> 150 - 300 in stream sediment
Figure 16. Distribution of regionally anomalous values for copper in drainage basins west of San Manuel fault, Ariz. See figure 9 for location.
£24 Structural Context of Mid-Tertiary Mineralization in the Mammoth and San Manuel Districts, Southeastern Arizona

nonferromagnetic fraction of the heavy-mineral panned concentrate sample was analyzed). Higher values (200 ppm) of copper occur in the heavy-mineral panned con centrate samples east of the San Manuel fault.
Zinc
Zinc-bearing samples are located mostly west of the altered area at Shultz Spring (figs. 8 and 17). Zinc was detected at less than 200 ppm in rock and soil samples in basin 1. Zinc was not detected in the stream-sediment or in the heavy-mineral panned concentrate samples. A white (N9) to pale-yellowish-orange (10 YR 8/6) altered rock containing minor amounts of pyrite was collected at Shultz Spring. This rock contains 300 ppm zinc and is de pleted in calcium (0.15 percent) and manganese (100 ppm).
Table 6. Attitudes of features used to determine offset on the San Manuel fault
[(P) planes for which strike and dip are listed; (L) line for which trend and plunge are listed]
Turtle fault (P) Cloudburst-Over-
Upper plate of San Manuel fault
N. 51° E., 62° NW. N. 41° W., 30° ME.
Lower plate of San Manuel fault
N. 66° E., 62° NW. N. 28° W., 35° ME.
Oracle unconformity (P) Intersection (L) N. 35° E., 28° ME. N. 43° E., 34° NE.
fault that does not include the Mammoth vein set (samples 5-S, 5-C, 6-S, 7-S, 7-C, 8-S, and 8-C, fig. 9 and table 2).
Tectonic Relation to the Mammoth Vein Set
Discussion
A zone characterized by high amounts of barium; low, but detectable, values of silver, lead, molybdenum, gold, and copper; depleted amounts of calcium, manga nese, magnesium, sodium, strontium, and cobalt; and a single occurrence of 50 ppm bismuth coincides with the Shultz Spring altered area. Some of the rock and soil sam ples peripherally located west of the altered area contain low amounts of zinc.
Economic mineralization in the Shultz Spring airea may be rather modest considering the impressive amounts of alteration and local pyrite concentrations. The most en riched stream-sediments and concentrates from the Shultz Spring area are not as high in mineral concentrations as samples from an area on the lower plate of the San Manuel
Basin 7
EXPLANATION
Zinc concentration, in parts per million
Sample type
A 200L and 300 in rock
200L in soil
Figure 17. Distribution of regionally anomalous values for zinc in drainage basins west of San Manuel fault, Ariz. L, detected at less than spectrographic limit of determination. See figure 9 for location.
Since both the Mammoth vein set and the Shultz Spring altered area are pre-San Manuel Formation and thus pre-San Manuel fault system, and since the shape and orientation of their altered areas are similar, one might ex pect that the Shultz Spring area is the faulted upper por tion of the Mammoth vein set. If this were so, the offset shown in section B-B' (pi. 1) would be 3,475 m (11,400 ft) or more. The fault offset listed by Lowell (1968) is about 2,440 m (8,000 ft) but his figure 3 suggests that the offset may be about 3,050 m (10,000 ft) horizontally, or 3,350 m (11,000 ft) along the fault plane. In view of the resultant uncertain correlation of altered areas, we derived our own vector for total movement on the San Manuel fault system. We used two features whose potential for correlation was not clear in 1968, the Turtle fault and the Oracle-Cloud burst unconformity. These two planar features, present on both upper and lower plates of the San Manuel fault sys tem (table 6), intersect along a line that is offset by the fault. A fault-plane solution (similar to fig. 6) yields a sep aration magnitude of 2,363 m (7,750 ft), very close to Lowell's value, but in a direction of S. 46° W., or 9° from Lowell's direction of S. 55° W. Our method does not yield an independent estimate of the dip of the fault system.
Our value of separation on the San Manuel fault sys tem suggests that the Mammoth vein set and the Shultz Spring altered area are not the same feature. Quite possi bly the entire upper-plate segment of the Mammoth vein set has been eroded away (section B-B', pi. 1). Conversely, the Shultz Spring altered area corresponds (using our new vector) with the Ford (or Thunderbird) mine area (pi. 1; fig. 2) on the lower plate, though uncertainty of the dips makes the correlation tentative. The Ford mine is an al tered area with epidotized black dikes, quartz veins, and faults striking N. 10° to 60° W., dipping steeply either east or west. These characteristics are compatible with Shultz Spring alteration zones. If the proposed correlation is cor rect, the Ford mine alteration is of mid-Tertiary age.
The Shultz Spring Altered Zone £25
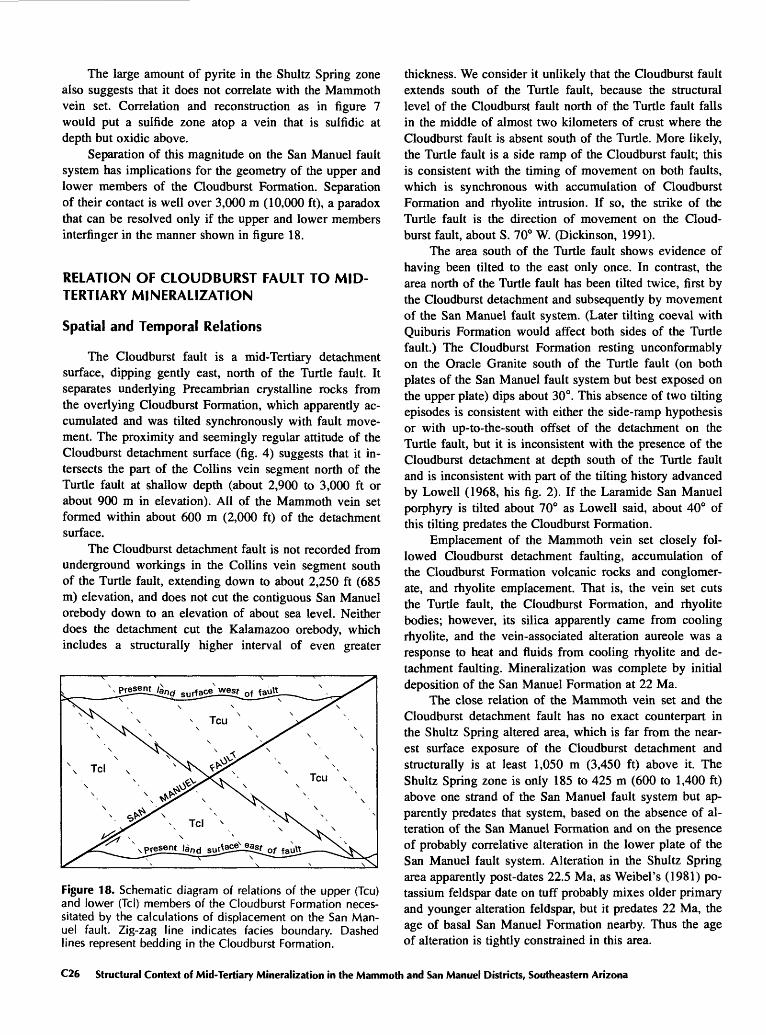
The large amount of pyrite in the Shultz Spring zone also suggests that it does not correlate with the Mammoth vein set. Correlation and reconstruction as in figure 7 would put a sulfide zone atop a vein that is sulfidic at depth but oxidic above.
Separation of this magnitude on the San Manuel fault system has implications for the geometry of the upper and lower members of the Cloudburst Formation. Separation of their contact is well over 3,000 m (10,000 ft), a paradox that can be resolved only if the upper and lower members intern"nger in the manner shown in figure 18.
RELATION OF CLOUDBURST FAULT TO MID- TERTIARY MINERALIZATION
Spatial and Temporal Relations
The Cloudburst fault is a mid-Tertiary detachment surface, dipping gently east, north of the Turtle fault. It separates underlying Precambrian crystalline rocks from the overlying Cloudburst Formation, which apparently ac cumulated and was tilted synchronously with fault move ment. The proximity and seemingly regular attitude of the Cloudburst detachment surface (fig. 4) suggests that it in tersects the part of the Collins vein segment north of the Turtle fault at shallow depth (about 2,900 to 3,000 ft or about 900 m in elevation). All of the Mammoth vein set formed within about 600 m (2,000 ft) of the detachment surface.
The Cloudburst detachment fault is not recorded from underground workings in the Collins vein segment south of the Turtle fault, extending down to about 2,250 ft (685 m) elevation, and does not cut the contiguous San Manuel orebody down to an elevation of about sea level. Neither does the detachment cut the Kalamazoo orebody, which includes a structurally higher interval of even greater
Figure 18. Schematic diagram of relations of the upper (Tcu) and lower (Tel) members of the Cloudburst Formation neces sitated by the calculations of displacement on the San Man uel fault. Zig-zag line indicates fades boundary. Dashed lines represent bedding in the Cloudburst Formation.
thickness. We consider it unlikely that the Cloudburst fault extends south of the Turtle fault, because the structural level of the Cloudburst fault north of the Turtle fault falls in the middle of almost two kilometers of crust where the Cloudburst fault is absent south of the Turtle. More likely, the Turtle fault is a side ramp of the Cloudburst fault; this is consistent with the timing of movement on both faults, which is synchronous with accumulation of Cloudburst Formation and rhyolite intrusion. If so, the strike of the Turtle fault is the direction of movement on the Cloud burst fault, about S. 70° W. (Dickinson, 1991).
The area south of the Turtle fault shows evidence of having been tilted to the east only once. In contrast, the area north of the Turtle fault has been tilted twice, first by the Cloudburst detachment and subsequently by movement of the San Manuel fault system. (Later tilting coeval with Quiburis Formation would affect both sides of the Turtle fault.) The Cloudburst Formation resting unconformably on the Oracle Granite south of the Turtle fault (on both plates of the San Manuel fault system but best exposed on the upper plate) dips about 30°. This absence of two tilting episodes is consistent with either the side-ramp hypothesis or with up-to-the-south offset of the detachment on the Turtle fault, but it is inconsistent with the presence of the Cloudburst detachment at depth south of the Turtle fault and is inconsistent with part of the tilting history advanced by Lowell (1968, his fig. 2). If the Laramide San Manuel porphyry is tilted about 70° as Lowell said, about 40° of this tilting predates the Cloudburst Formation.
Emplacement of the Mammoth vein set closely fol lowed Cloudburst detachment faulting, accumulation of the Cloudburst Formation volcanic rocks and conglomer ate, and rhyolite emplacement. That is, the vein set cuts the Turtle fault, the Cloudburst Formation, and rhyolite bodies; however, its silica apparently came from cooling rhyolite, and the vein-associated alteration aureole was a response to heat and fluids from cooling rhyolite and de tachment faulting. Mineralization was complete by initial deposition of the San Manuel Formation at 22 Ma.
The close relation of the Mammoth vein set and the Cloudburst detachment fault has no exact counterpart in the Shultz Spring altered area, which is far from the near est surface exposure of the Cloudburst detachment and structurally is at least 1,050 m (3,450 ft) above it. The Shultz Spring zone is only 185 to 425 m (600 to 1,400 ft) above one strand of the San Manuel fault system but ap parently predates that system, based on the absence of al teration of the San Manuel Formation and on the presence of probably correlative alteration in the lower plate of the San Manuel fault system. Alteration in the Shultz Spring area apparently post-dates 22.5 Ma, as Weibel's (1981) po tassium feldspar date on tuff probably mixes older primary and younger alteration feldspar, but it predates 22 Ma, the age of basal San Manuel Formation nearby. Thus the age of alteration is tightly constrained in this area.
C26 Structural Context of Mid-Tertiary Mineralization in the Mammoth and San Manuel Districts, Southeastern Arizona
Probable Genetic Relation
The close spatial and temporal relation of the Cloud burst detachment fault with the Mammoth vein set implies that detachment faulting must have had an effect on min eralization. On the other hand, the timing and geometry of mineralization is not that of detachment mineralization in the strict sense, as described by Spencer and Welty (1986) and Roddy and others (1988). In such deposits, mineral ization forms along detachment surfaces and related steep normal faults by circulation of hot fluids during and im mediately following fault movement, in response to tec tonic denudation. Thus for the Mammoth vein set the exact form of the relation between detachment and miner alization is unclear.
The Mammoth vein set corresponds to the detach ment model (Spencer and Welty, 1986; Roddy and others, 1988; Long, 1992) in the following respects:
1. Dominance of oxide-facies over sulfide-facies min eralization.
2. Localization of mineralization near flexures of the detachment surface in this case under the intersection of the Turtle side-ramp fault and the main Cloudburst detach ment fault, based on the geometry of mineral zonation.
3. Early potassium feldspar and sulfide mineraliza tion in this case early adularia, and slightly later sphaler ite, galena, and chalcopyrite.
4. Late oxide-dominated mineralization in this case wulfenite, vanadinite, manganese oxides, barite, chrysocol- la, and malachite. Perhaps cerussite and smithsonite have this origin also.
5. Peripheral barite-manganese oxide-fluorite assem blages.
6. Characteristic amethyst and specularite gangue.7. Widespread epidote-chlorite alteration in this case
most conspicuous in Tertiary rocks atop the detachment.8. The elemental assemblage Au-Ag-Ba-Pb-Zn-Cu,
commonly without As, Sb, Hg, or Tl.Some dissimilarities of the Mammoth vein set with
the detachment model are these:9. Mineralization not along the detachment fault but
on a cross-cutting structure.10. Presence of molybdenite and vanadinite. Howev
er, the Mammoth vein set is larger and better studied than most deposits that define the model.
11. Association with cooling rhyolite (but see Welty and Spencer, 1986).
Two possible solutions to the problem of the relation between detachment and mineralization are: (1) Rhyolite drove mineralization, but precipitation was in a chemical and physical environment conditioned by immediately pre vious detachment, and (2) two fluids were necessary for ore formation; one was supplied by rhyolite and the other was transported along the detachment fault. These possibilities could be tested with fluid-inclusion and isotopic studies.
The Shultz Spring altered area may be detachment re lated, but the evidence is weak. The structural distance above the Cloudburst detachment fault is great, and alter ation apparently predates the spatially closer San Manuel fault system. The abundance of pyrite in the Shultz Spring area is apparently unusual for detachment-related mineral systems, as is the bismuth anomaly. Favoring a relation to detachment faulting are the specularite-adularia alteration and the Ba-Mn-Cu-Zn-Au elemental association.
IMPLICATIONS FOR MINERALIZATION
The Mammoth vein set shows intricate spatial and temporal relations both to rhyolite intrusions and to de tachment along the nearby Cloudburst-Turtle fault system. Zoning within the vein suggests that the central part of the mineralized system lies under the intersection of the Cloudburst detachment and its Turtle side ramp. Further exploration in this area is warranted, as is examination of the Cloudburst-Turtle fault system itself.
The newly described Shultz Spring alteration is co eval with the Mammoth vein set but is apparently not closely related. Based on reconaissance geochemical sam pling, it appears to be weakly mineralized at the surface, but zoning relations suggest pervasive replacement by py rite at depth.
Some conclusions of this work have implications for the older San Manuel and Kalamazoo deposits. A "back- stripping" procedure of progressively removing faults and correlative tilting shows that steep tilting of mid-Tertiary rocks was confined to the domain north of the Turtle fault. South of it, mid-Tertiary tilting is only about 25° to 30°. Thus unless some tilting preceded mid-Tertiary extension, the Laramide San Manuel porphyry was tilted far less than Lowell (1968) believed. This is worthy of further investi gation, especially as the San Manuel and Kalamazoo de posits gave rise to models of porphyry zonation.
ACKNOWLEDGMENTS
Lively discussion with W.R. Dickinson in the field and during compilation contributed greatly to many con cepts presented here. Table 1 was contributed by Keith Long. Reviewers Robert Kamilli and Keith Long consider ably improved the manuscript. Jon Spencer suggested the two-fluid detachment-mineralization concept. Martin Rex of Magma Copper Company facilitated access to workings on the Mammoth vein set. The Shultz Spring altered zone was discussed with Robert Hockett. Discussion with Tim Hait initiated the concept of figure 18.
REFERENCES CITED
Creasey, S.C., 1950, Geology of the St. Anthony (Mammoth) area, Final County, Arizona, in Arizona zinc and lead
References Cited C27
deposits, part 1, chapter 6: Arizona Bureau of Mines Bulle tin 156, p. 63-84.
-1965, Geology of the San Manuel area, Final County, Arizona: U.S. Geological Survey Professional Paper 471, 64 p.
Dickinson, W.R., 1987, General geologic map of Catalina core complex and San Pedro trough: Arizona Geological Survey Miscellaneous Map MM-87-A (1:62,500).
1991, Tectonic setting of faulted Tertiary strata associated with the Catalina core complex in southern Arizona: Geo logical Society of America Special Paper 264, 106 p.
Dickinson, W.R. and Shafiqullah, M., 1989, K-Ar and F-T ages for syntectonic mid-Tertiary volcano-sedimentary sequences associated with the Catalina core complex and San Pedro trough in southern Arizona: Isochron/West, no. 52, p. 15-27.
Goddard, E.N., Parker, D.T., De Ford, R.K., Rove, O.N., Singe- wald, J.T., Jr., and Overbeck, R.M., 1984, Rock-color chart: Geological Society of America, Boulder, Colorado.
Heindl, L.A., 1963, Cenozoic geology in the Mammoth area, Pi- nal County, Arizona: U.S. Geological Survey Bulletin 1141- E, 40 p.
Keith, S.B., Gest, D.E., DeWitt, E., Toll, N.W., and Everson, B.A., 1983, Metallic mineral districts and production in Ari zona: Arizona Bureau of Geology and Mineral Technology, Bulletin 194, p. 34-35.
Long, K.R., 1992, Preliminary descriptive deposit model for de tachment fault-related mineralization in Bliss, J.D., ed., De velopments in mineral deposit modelling: U.S. Geological Survey Bulletin 2004, p. 52-56.
Lowell, J.D., 1968, Geology of the Kalamazoo orebody, San Manuel district, Arizona: Economic Geology, v. 63, p. 645- 654.
Lowell, J.D. and Guilbert, J.M., 1970, Lateral and vertical alter ation-mineralization zoning in porphyry ore deposits: Eco nomic Geology, v. 65, p. 373-408.
Motooka, J.M., and Grimes, D.J., 1976, Analytical precision of one-sixth order semiquantitative spectrographic analysis: U.S. Geological Survey Circular 738, 25 p.
Pelletier, J.D., and Creasey, S.C., 1965, Ore deposits, in Geology of the San Manuel area, Final County, Arizona: U.S. Geo logical Survey Professional Paper 471, p. 29-59.
Peterson, N.P, 1938, Geology and ore deposits of the Mammoth mining camp area, Final County, Arizona: Arizona Bureau of Mines Bulletin 144, 63 p.
Roddy, M.S., Reynolds, S.J., Smith, B.M. and Ruiz, J., 1988, K- metasomatism and detachment-related mineralization, Har- cuvar Mountains, Arizona: Geological Society of America Bulletin, v. 100, p. 1627-1639.
Schwartz, G.M., 1953, Geology of the San Manuel copper de posit, Arizona: U.S. Geological Survey Professional Paper 256, 63 p.
Spencer, J.E., and Welty, J.W., 1986, Possible controls of base- and precious-metal mineralization associated with Tertiary detachment faults in the lower Colorado River trough, Ari zona and California: Geology, v. 14, p. 195-198.
Steele, H.J., and Rubly, G.R., 1947, San Manuel prospect: Amer ican Institute of Mining and Metallurgical Engineers, Tech nical Publication 2255, 12 p.
Thomas, L.A., 1966, Geology of the San Manuel ore body, in Titley, S.R. and Hicks, C.L., eds. Geology of the porphyry copper deposits, southwestern North America: Tucson, Uni versity of Arizona Press, p. 133-142.
Weibel, W.L., 1981, Depositional history and geology of the Cloudburst Formation near Mammoth, Arizona: Tucson, University of Arizona, M.S. thesis, 81 p.
Welty, J.W., and Spencer, J.E., 1986, Two types of mineralization related to Tertiary detachment faults in the southwestern United States: Geological Society of America Abstracts with Programs, v. 18, no. 6, p. 785.
C28 Structural Context of Mid-Tertiary Mineralization in the Mammoth and San Manuel Districts, Southeastern Arizona

![Indigenous Enhanced Mineralization Pyrene, Benzo[a]pyrene ...Indigenous soil microorganism mineralization experiments. All of the mineralization experiments were performed by using](https://img.pdfslide.net/doc/110x75/5e7c41b0b7c4ef64181e5e16/indigenous-enhanced-mineralization-pyrene-benzoapyrene-indigenous-soil-microorganism.jpg)