Embed Size (px)
Citation preview

1Corresponding author: [email protected]
1
Rakenteiden Mekaniikka (Journal of Structural Mechanics)
Vol. 52, No 1, 2019, pp. 1–22
http://rakenteidenmekaniikka.journal.fi/index
https:/doi.org/10.23998/rm.77252
© 2019 The Authors
Open access under license CC BY 4.0
Structural fire analysis of simple steel structures
by using LS-DYNA
Zhongcheng Ma1, Jarmo Havula, and Markku Heinisuo
Summary. Currently, structural fire design is moving from prescriptive approach to
performance-based approach. One of the key essential techniques for performance-based
approach is the numerical analysis technique of steel structures in fire using advanced
calculation models. In this paper, the selected structural fire analysis procedure from 2D
temperature analysis to structural response using LS-DYNA was studied and validated by the
fire tests of a simply supported beam, a simple steel frame and a both axially and rotationally
restrained steel column. 2D implicit temperature analysis is efficient in these cases and
sufficient accuracy was achieved. Using explicit solver, structural response in fire can be
simulated up to collapse with the considerations of the temperature-dependent material non-
linearity and possible contacts in joints. Both beam element models and shell element models
were developed, and the structural responses were compared with the fire tests from literature.
Results show that the developed modeling techniques using LS-DYNA explicit solver can
effectively capture the key behavior of steel structures in fires. This key behavior includes
deformation responses of beam and column, axial forces developed due to restraints and fire
resistance time.
Keywords: structural fire analysis, 2D temperature analysis, steel structures, Hughes-Liu beam
element, Belytschko-Tsay shell element, LS-DYNA explicit solver
Received 25 June 2018. Accepted 1 January 2019. Published online 11 July 2019.
Introduction
When design steel structures, structural fire safety assessment is equally important as
the load-bearing design. In recent years, structural fire design is moving from current
'prescriptive' rules to performance-based method. The past fire incidents and large-scale
structural fire tests such as fire event in Broadgate (1991, UK), fire tests in William
Street (1992, Australia), and full-scale fire tests on a 8-storey steel-framed building in
Cardington (1995, 1996, UK) [1,2, 3] revealed that the current Eurocodes, although
conservative, are not addressing the true behavior of steel structures in fire since the

2
buildings are not acting as a series of individual members. It was found that the
structural member in a frame had a significantly better behavior in fire than that in the
standard fire resistance test. The standard fire test was very conservative by
disregarding the interaction between members [4]. Therefore, performance-based
method is the major trend in the structural fire safety design. The performance-based
method can also significantly reduce the overall construction cost of steel structures and
still produce safer design. Meanwhile, in current Eurocode 3 part 1.2, the advanced
models are allowed to be used in the structural fire design of steel structures.
One of the key factors for performance-based method is the utilization of finite
element analysis (FEA) techniques to simulate the structural response of building in fire
[5]. This requires both the knowledge in structural fire engineering and the advance of
commercial softwares (Abaqus, LS-DYNA, Ansys) in structural fire analysis. In last
decades, the understanding on the structural fire behavior has increased considerably,
the software functions have been developed for structural fire analysis. Increasing
understanding of structural fire behavior and development in both analysis software and
computer capacity enable the application of advanced calculation models in research
and engineering design practice [6]. However, relevant analysis techniques need to be
developed, benchmarked and validated by fire testing data. These techniques include
material data and models, analysis procedures, parameter sensitivity analysis, model
validations.
Recently, there is increasing interest in fire resistance simulation of steel structures
using LS-DYNA [7, 8, 9]. LS-DYNA is a commercial general-purpose finite element
software [19] and is one of the mostly common used explicit integration software [8]. It
has been used for the aircraft impact, progressive collapse analysis of World Trade
Center (WTC) by NIST [17, 18]. Rackauskaite et al [8] benchmarked four selected
testing cases to study the model parameter sensitivity of structural fire analysis in case
of fire using Hughes-Liu beam element by LS-DYNA explicit solver. It uses either
measured or analyzed temperature histories from other literatures and software as input.
Paik et al [7] conducted structural fire analysis of offshore installations in fire by shell
element in the new design procedure using LS-DYNA. The structural fire analysis
approach was first validated by fire test of a simply supported beam and then extend to
the structural response analysis of complex frame structure. The two important
parameters for fire boundary (emissivity factor and convection coefficient) were
adjusted in order to fit the structural response with test. These two parameters are
relatively far from the specified values from Eurocode 1 [13]. Therefore, there is also an
interest to investigate the results using both fire parameters and material properties
according to Eurocodes.
Objectives and structural fire analysis procedure in this study
Fire events and tests usually have long duration, lasting from a few minutes to a few
hours. The analysis time using explicit solver will be extremely long if no measure is
taken. In this study, three selected existing fire tests from literature were simulated
using Ls Dyna. The 2D temperature analysis of the fire tests are first carried out and the
results are compared with the testing measurement. Then the temperature histories and

3
distribution from 2D temperature analysis are used as input for the subsequent structural
response analysis. When performing 3D structural analysis, the mechanical loads are
applied to the structure at first, then the heating process starts, and temperature rises
inside the structure while mechanical loads are kept as constant. The mechanical loads
were first applied within 200 seconds, then heating process starts and continue up to
structural instability. The later process usually lasts from 900 seconds (15 minutes) to
7200 seconds (120 minutes). Due to the fact that the mechanical effect by heating
process is relatively slow, there is an interest to use a consistent time scaling factor for
the structural fire analysis of steel structures. A time scaling factor of 100 was used to
increase the computational efficiency both for load application and heating processes in
this study, the induced kinematic energy is monitored, and structural responses were
compared with the tests.
In this paper, three fire tests existing in literature are modelled and the results are
compared with the testing measurements. The numerical analysis techniques using Ls
Dyna for structural fire analysis are explored and the selected analysis procedure is
verified using both beam and shell elements. The analyses are carried out from
temperature analysis to structural response in fire. The analyzed temperature
distribution and history, structural deformation response and axial restraining forces are
compared with testing results and previous simulation in literature using other software.
It is of interest to use beam elements for larger structures in fire and shell element model
can be used if local, flexural and lateral-torsional buckling failures are of interest. New
fire test cases from literature are also modelled and studied in this paper.
The parameters for fire tests, such as convection coefficient and emissivity factor
were taken according to Eurocode 1 [13] for all cases. Thermal and mechanical
properties of steel and concrete are taken according to Eurocode 3 & 4 [14, 16].
FE modelling of simply supported beam
Description of fire test by Cong et al [15]
The simply supported steel beam was loaded by four concentrated forces applied at
locations L/8, 3L/8, 5L/8 and 7L/8, where L is the beam span length (Fig. 1). The
applied total force was 42 kN, which is equivalent to the uniformly distributed load of
10 kN/m. Both supports and beam ends in 150 mm range were fire protected.
The simply supported beam was heated by a horizontal furnace with oil burner. The
measured gas temperature is shown in Fig. 2(a). The top face of the upper flange was
covered by aluminum plate and exposed to air. All other sides were directly exposed to
fire. The height of the hot rolled I-section beam is 250 mm, the flange width is 125 mm,
the flange thickness is 9 mm and the web thickness is 6 mm. The span length of the
beam is 4.2 m. The measured yield strength of steel is 330 MPa and the tensile strength
is 415 MPa.

4
Figure 1. Simply supported beam under four-point loading.
(a) gas temperature (b) 2D thermal model
Figure 2. Gas temperature and FE model for temperature analysis.
2D model for temperature analysis
With the elevated gas temperature, the temperature of steel beam arises by radiative and
convective heat transfer. The 2D FE model was created to analyze the temperature
history (Fig. 2(b)). The cross-section of steel beam is heated from three sides by
convection and radiation. The top side of the cross-section is directly exposed to the air
of 20 oC. The *Boundary_Convection_Set is defined in the 2D thermal model for
convection heat transfer and *Boundary_Radiation_Set is defined for radiation heat
transfer. The heat input due to convection between surfaces of steel beam and the hot
gas is
(1)
where αc is the convection coefficient (W/m2K). According to EN 1991-1-2 [13], the
convection factor of 25 W/m2K for ISO standard fire in exposed side is used in this
thermal analysis, and 9 W/m2K for unexposed side. Ts is the surface temperature of steel
beam (oC), and T∞ is the gas temperature (oC).
The heat input due to the radiation is
(2)

5
where φ is configuration factor, taken as 1.0 in this analysis [13]; σ is Stephan-
Boltzmann constant (5.67x10⁻⁸ W/m2K4); ε is the resultant emissivity coefficient, taken
as 0.7 in this analysis according to EN 1993-1-2 [14].
The temperature-dependent thermal conductivity and specific heat of steel material
are defined according to EN 1993-1-2.
The temperature histories of the beam in the central points of lower flange, web and
top flange are illustrated in Fig. 3 and compared with the test measurement from Cong
et al [15]. It can be seen that the analyzed temperatures are higher than the measurement
for upper flange and web and very close to the measurement for lower flange. The
maximum differences are around 85 oC at 15 minutes in upper flange (34%), 70 oC at 35
minutes in web (12%), and 50 oC in lower flange at 50 minutes (8%), respectively. In
general, the agreement between analysis and measurement is good using the parameters
defined according to Eurocodes for lower flange and web, relative larger difference in
early phase of fire in upper flange. This is due to the heat sink effect of aluminum plate
placed on top of the upper flange during the test, which is not included in the FE model.
Figure 3. Temperature history of steel beam under fire.
Structural analysis using beam element model
Firstly, a FE model was created using Hughes-Liu beam elements with user-defined
integration in the cross-section. A total of 39 integration points in the cross section
(refinement factor k = 5) are defined in the model, and one integration point in the
middle of the element along the length. Temperature-dependent material model
MAT202 is used with updated definitions of elastic modulus, thermal expansion
coefficient and plastic stress-strain curves according to EN 1993-1-2, to override the
default definitions. User should be cautious with the embedded definition of MAT202
in LS-DYNA R9.01. Ununiform thermal loads were applied in LS-DYNA by
*Load_Thermal_Variable_Beam_Set. The temperature distribution in the cross-section
was represented by 13 points with temperature histories are defined. Five points are
defined in top and bottom flanges, respectively; five points are defined along the web
height. The temperature histories at these locations in the cross-section are the outputs
from 2D temperature analysis. Since the temperature difference between the tips and the
middle point is less than 20 oC (at 50 minutes) for both top and bottom flanges, the

6
average temperature histories are used, in order to simplify the model definitions.
Simply supported boundary is defined in the model. Pinned boundary condition is
defined in the left end and roller boundary condition is defined in right end with free
movement along the longitudinal axis. A mesh sensitivity study with the element length
of 30 mm and 60 mm shows very close deformation response (maximum difference of
displacement at mid-span is 1%) (Fig. 4).
Fire analysis following real time scale is very time/resource consuming for structural
analysis using explicit solver. Due to the quasi-static nature of the loading and heating
processes, the actual time can be scaled to speed up the analysis. The scaling factor was
studied in detail in [8]. In this case, a scale factor of 100 is used based on previous
experience [20]. The static loads are applied in four loading points simultaneously and
linearly increased to 10.5 kN for each point in 2 seconds. This process corresponds to a
loading duration of 3.3 minutes. Then the loading is kept constant. After that the heating
process starts. The total heating time of 18 seconds is defined in the FE model which
corresponds to a fire duration of 30 minutes. The further examination on the energy
ratios between kinematic energy and internal energy shows that the energy ratio is
0.87x10⁻⁴ for loading process and 0.11x10⁻² for heating process. We can conclude that
the kinematic effect is insignificant, and the used scaling factor is valid.
The deformation response from FE analysis shows that the FE model is able to
capture the deformational behavior of the simply supported beam using parameters and
material models according to EN1993-1-2. However, according to the failure criteria
defined in [12], the maximum deformation of L/20 or deformation rate of
(3)
where δ is the deformation of beam in mm, L is the beam span length and h is the height
of cross section. The maximum deformation at failure is 210 mm or the maximum
deformation rate is 19 mm/minute for the analyzed beam. In this case, the failure is
defined by the maximum deformation rate at 48 minutes from test and 42 minutes from
FE analysis. FE analysis in LS-DYNA using parameters and material models from
Eurocodes [13,14] gives a little conservative fire resistance prediction.
Structural analysis using shell element model
This FE model is created using shell elements with Belytschko-Tsay formulation.
Element size is 20 mm and three integration points are defined through the thickness.
Temperature-dependent piecewise linear plastic material model MAT255 is used in this
model, since MAT202 is not available for 3D shell element. The material properties and
stress-strain relations are defined according to EN 1993-1-2. The temperature
distribution and time history in the cross section are specified according to the output
from 2D temperature analysis using keyword *Load_Thermal_Variable. Uniform
temperatures are specified for flanges, and temperature gradient along the web height is
defined by the temperatures in six web nodes. Pinned boundary condition is specified
for the end nodes in the lower flange, with allowed axial movement in right end.
Furthermore, lateral support in out of web plane direction is defined for both end
sections.

7
Fig. 5 illustrates the deformation response of the simply supported beam in fire at
mid-span using shell elements. The deformation curve by FE analysis is able to capture
the major behavior of the simply supported beam in fire. The fire resistance according
to the failure criteria in Eq. 3 is around 42.5 minutes and the failure mode is lateral-
torsional buckling of the beam. The fire resistance time is similar to the case using beam
elements (42 minutes). Another case (FE-Shell-LR in Fig. 5) is analyzed with additional
lateral supports in the loading points to simulate the possible lateral restraints by the
actuators. The failure mode is plastic bending failure and lateral-torsional buckling
(LTB) in mid-span of loading. The failure mode is the same as the test observations
(Fig. 6). The deformation response using shell elements is closer to the test than beam
element model since shell element models can better capture the lateral-torsional
buckling failure mode. The corresponding fire resistance is 44 minutes, only slightly
longer than the case without lateral restraints in loading points.
Figure 4. Mid-span displacement by beam Figure 5. Mid-span displacement by shell
element model. element model.
FE modeling of simple frame
Fire test description
A natural fire test on a fully loaded, two-dimensional steel framework was carried out
by British Steel [10]. The steel frame consists of a 4553 mm length of 406 x 178 mm x
54kg/m BS4360:1979 Grade 43A (equivalent S275) universal beam section bolted to
two 3530 mm lengths of 203 x 203 x 52 kg/m Grade 43A universal column section. Fig.
7 illustrates the principal features of the test frame. The beam was unprotected, but four
1200x5550x150 mm precast concrete slabs were attached to the top flange. No
composite action was formed between concrete slabs and steel beam. The column was

8
pinned at both lower and upper ends. The web was protected by autoclaved aerated
concrete blocks. Six M20 Grade 8.8 bolts were used for beam-column connection. A
maximum 552 kN was applied on the top of each column. The test beam was loaded to
39.6 kN at four positions along the span. The test loads were maintained as a constant
during the fire tests. The gas temperature in the compartment is shown in Fig. 7(c).
Further details on the testing can be found in [10, 11].
(a) Bending deformation from test (b) LTB in central loading span
(c) Bending deformation from FE analysis (d) LTB from FE analysis
Figure 6. Failure modes of testing observation and FE analysis.
(a) Simple frame structure (b) beam-column connection (c) gas temperatures
Figure 7. Structural layout of the test frame and fire curves.
2D-temperature analysis
The mesh of the cross section of column is shown in Fig. 8(a). Due to the symmetry,
only half of the cross section is meshed, and no heat transfer is defined in the symmetric
boundary. Thermal properties of steel are defined according to EN 1994-1-2 [16]. The
conductivity and specific heat of aerated light-weight concrete are defined according to
[11]. The resultant emissivity coefficient is taken as 0.7 for left and lower sides facing
the fire (Fig. 8a). The resultant emissivity coefficient is taken as 0.3 in the side facing
the wall to account for some degree of radiative shadowing [11]. Convection coefficient
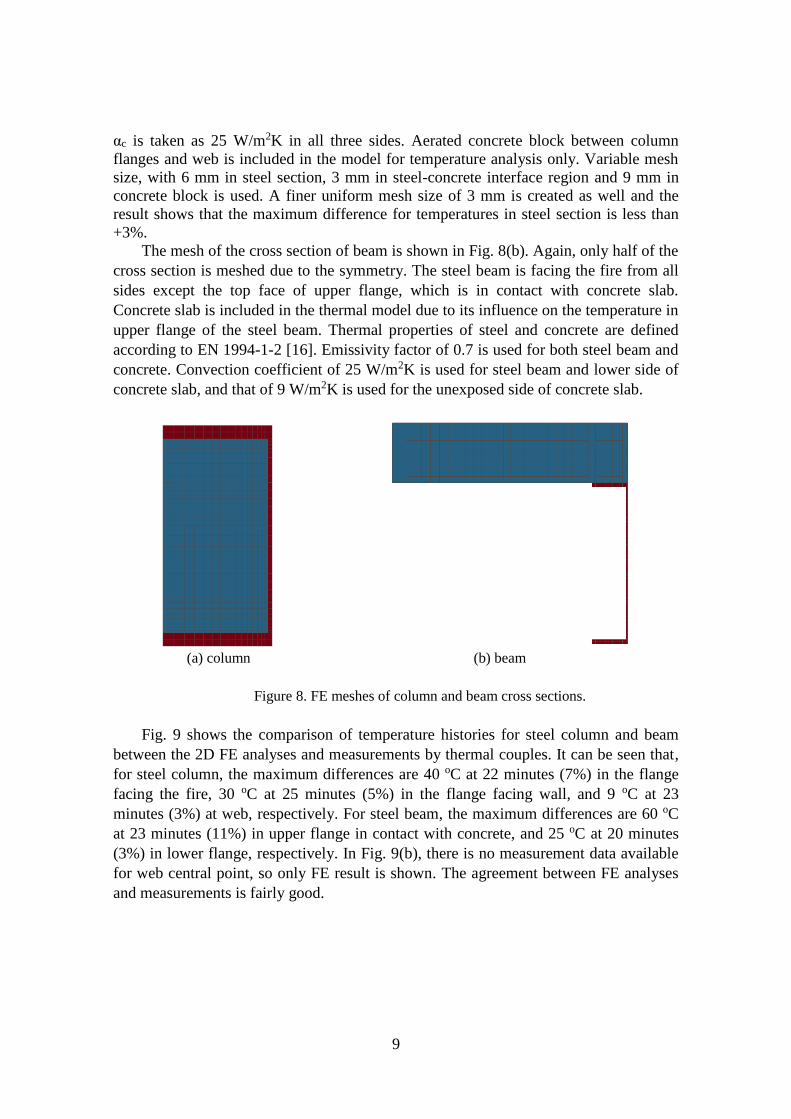
9
αc is taken as 25 W/m2K in all three sides. Aerated concrete block between column
flanges and web is included in the model for temperature analysis only. Variable mesh
size, with 6 mm in steel section, 3 mm in steel-concrete interface region and 9 mm in
concrete block is used. A finer uniform mesh size of 3 mm is created as well and the
result shows that the maximum difference for temperatures in steel section is less than
+3%.
The mesh of the cross section of beam is shown in Fig. 8(b). Again, only half of the
cross section is meshed due to the symmetry. The steel beam is facing the fire from all
sides except the top face of upper flange, which is in contact with concrete slab.
Concrete slab is included in the thermal model due to its influence on the temperature in
upper flange of the steel beam. Thermal properties of steel and concrete are defined
according to EN 1994-1-2 [16]. Emissivity factor of 0.7 is used for both steel beam and
concrete. Convection coefficient of 25 W/m2K is used for steel beam and lower side of
concrete slab, and that of 9 W/m2K is used for the unexposed side of concrete slab.
(a) column (b) beam
Figure 8. FE meshes of column and beam cross sections.
Fig. 9 shows the comparison of temperature histories for steel column and beam
between the 2D FE analyses and measurements by thermal couples. It can be seen that,
for steel column, the maximum differences are 40 oC at 22 minutes (7%) in the flange
facing the fire, 30 oC at 25 minutes (5%) in the flange facing wall, and 9 oC at 23
minutes (3%) at web, respectively. For steel beam, the maximum differences are 60 oC
at 23 minutes (11%) in upper flange in contact with concrete, and 25 oC at 20 minutes
(3%) in lower flange, respectively. In Fig. 9(b), there is no measurement data available
for web central point, so only FE result is shown. The agreement between FE analyses
and measurements is fairly good.

10
(a) column (b) beam
Figure 9. Temperature history of steel column and beam.
Structural analysis using beam element model
Hughes-Liu beam element with user defined cross section integration is used in the
modeling of simple frame. In total there are 39 integration points in the I-shape cross
section by defining refinement factor k as 5 in LS-DYNA. Temperature-dependent
material model MAT202 was used, but with redefined thermal expansion coefficient
(CTE) and stress-strain data according to EN1993-1-2. Non-uniform temperature
distribution in the cross sections of beam and column is defined by using
*Load_Thermal_Variable_Beam_Set keyword. Thermal loading histories for beam and
column are defined in the cross-section coordinates. For cross section of column, in
total fifteen temperature histories are defined, in which five data points in flange facing
the fire and flange facing the wall, respectively, and five data points along the web. For
cross section of beam, uniform temperature is assumed in flanges, and six data points
are specified in the web. These temperature histories are calculated from 2D
temperature analyses.
Due to the symmetry, only half of the structure is modelled. The FE model is
illustrated in Fig. 10(a). Pinned boundary condition is defined for the lower end of the
column, and symmetric boundary is defined in the right end of the beam. A discrete
beam element is used in the position 100 mm above the beam-column connection to
simulate the restraint from the secondary support frame. The spring constant is 6700
kN/m and the yielding force of the spring is 68 kN (MAT68) according to [11].
The loading and heating process are the same as the case for simply supported
beam. The ratio of kinetic energy to internal energy is in the level of 10-5, which is very
insignificant.

11
(a) beam element model (b) shell element model
Figure 10. FE models for simple frame.
The mid-span displacement history of steel beam, deformation of steel column and
axial force in the beam are examined in more detail in this analysis. Fig. 11(a) shows the
mid-span history of steel beam. The general deformation behavior is close to each other
between the FE analyses and testing measurement. However, the time to failure (run
away) varies a lot. FE analyses show that the fire resistance time of steel frame depends
on the yield strength of the steel. The actual yield strength of steel used in this frame
was not measured, hence the case with minimum yield strength of 275 MPa and the case
with possible yield strength of 350 MPa [15] were analyzed. The analyzed fire
resistance time is 14 minutes for fy = 275 MPa, and 16 minutes for fy = 350 MPa, while
the tested fire resistance is 19 minutes. The fire analysis results by another FE software
CEFICOSS in [11] using beam elements and yield strength fy = 350 MPa are included in
the comparison. Further details on FE analysis by CEFICOSS can be found in [11]. The
analyzed fire resistance time by CEFICOSS is 14 minutes for fy = 275 MPa, and 17.5
minutes for fy = 350 MPa. LS-DYNA gives conservative prediction in fire resistance
time in this analysis.
Fig. 11(b) shows the predicted axial compression forces by LS-DYNA and
CEFICOSS for the beam for yield strength of 350 MPa. The maximum axial
compression force is 100 kN by LS-DYNA and 124 kN by CEFICOSS. Since the time
to failure is different from test and FE analysis, an equivalence method is used for the
comparison of lateral deformation of column. The measured vertical displacement in the
beam mid-span is around 36.5 mm at 16 minutes, then the time to reach same vertical
displacement in beam is 14 minutes (case fy = 350 MPa). Then the lateral (horizontal)
deformation of column at 14 minutes from FE analysis is compared with that at 16
minutes from test measurement (Table 1). From Table 1, it can be seen that the
differences vary from -53% to +5.5% for beam element model, and -60% to -14% for
shell element model. This is due to the fact that the lateral displacements in the column
is relatively small, and it is sensitive to the boundary conditions in the ends of column.

12
The actual pinned joint in the lower end of column in the test may not work exactly the
same as pinned boundary definition in the FE models.
(a) Vertical mid-span displacement of beam (b) Axial compression forces of beam
Figure 11. Structural response of frame using beam element model in fire.
Table 1. Lateral displacements of column along the height.
Lateral Displacement (mm)
Distance along column height from lower end
(mm)
147 1477 2847
Lateral displacement by FE using beam
model at 14 min (mm)
4.48
(53%)
22.2
(+5.5%)
15.2
(29%)
Lateral displacement by FE using shell
model at 11 min (mm)
3.84
(60%)
17.5
(17%)
18.5
(14%)
Lateral displacement by test at 16 min (mm) 9.47 21.0 21.5
Note: The percentage value in the parenthesis indicates the difference from reported testing
measurement result.
Structural analysis using shell element model
This FE model was created using shell elements with Belytschko-Tsay formulation
(Fig. 10(b)). Hourglass control is used with hourglass control type IHQ = 5 (Flanagan-
Belytschko stiffness form) and hourglass coefficient QM = 0.1. Element size is 50 mm
and three integration points are defined through the thickness. In order to avoid local
crush failure in the webs of lower and upper ends of columns in fire under the axial
load, the thickness of end plates is increased to 50 mm in the analysis. A refined model

13
with 20 mm mesh size was analyzed and the deformation history of at mid-span of
beam is almost identical (max difference around 1%). This proves that the used mesh
size is acceptable. Temperature-dependent piecewise linear plastic material model
MAT255 is used and mechanical properties are specified according to EN1993-1-2.
Beam is supported laterally out of the web plane in four loading positions on top flange
to model the lateral supports by concrete slabs.
Six discrete beam elements are used to model the bolt connection between column
and beam. The translational spring stiffness of 2E6 kN/m is specified for x-, y- and z-
directions and the rotational spring stiffness of 2E4 kN.m/rad is specified for rotational
directions. Automatic surface to surface contact is defined between the end plate of steel
beam and the inner flange of column facing the fire, to simulate the compression contact
in the lower part of beam end plate against column flange.
Fig. 12 shows the vertical deformation response of beam at mid-span during fire.
The predicted fire resistance time is 12.5 minutes when yield strength is 275 MPa and
13.7 minutes when yield strength is 350 MPa. The predicted fire resistance time is less
than the corresponding beam element model. Table 2 summarizes the fire resistance
time by FE using beam and shell models, and compares the predicted fire resistance
time with the test. The failure criteria are defined in the same way as simply supported
beam case, i.e. the maximum deformation of L/20 or deformation rate according to Eq.
3, whichever occurs earlier. It can be seen that fire resistances by FE analyses are
smaller than the test, and prediction using beam elements gives closer fire resistance to
the test.
From Fig. 12 it can also be seen that the effect of steel grade on deformation
response at mid-span of steel beam is not as big as the case using beam elements. This is
due to that the failure modes using shell elements are first lateral-torsional buckling of
steel beam and then the collapse of beam web. This structural behavior is not simulated
by beam elements model. However, it is not clear that how the concrete slabs and
additional support system interact with steel beam in the fire test. Considerable twisting
of steel beam was observed after the test [10].
Axial compression force developed in the beam is shown in Fig. 10(b). The axial
force is similar to the FE prediction using beam element model. The maximum
predicted compression force is 102 kN. Lateral displacement along the column height at
11 minutes is shown in Table 1. The corresponding vertical displacement at beam mid-
span in shell model is 36.5 mm at 11 minutes, corresponding to the same displacement
at 16 minutes at test. The predicted lateral deformation in column is closer to the test
measurement in the locations away from lower column end than that near lower end.
FE modeling of restrained column
Fire test description
Ali and O’Connor [21] tested both axially and rotationally restrained steel column under
fire. The steel column is 127x76UB13 and grade is S275. Column length is 1800mm.
Both ends of the column were welded with two 200x750x40 mm steel plates. These two
plates provide rotational restraints in both ends of column. The ends of the top and
bottom plates were connected with the rig using two light bolts in each end, so that the

14
edge restraints can be considered as simply supported [21]. The imposed stiffness of
axial restraint is around 57 kN/mm [21]. On the top of the column, an axial load of 205
kN is applied. The heated length of column is around 1750 mm, and both top and
bottom plates are located outside of the furnace. The column temperatures in different
locations are measured using thermocouples. The average column temperature is shown
Table 2. Predicted fire resistance time versus fire test.
fy = 275 MPa fy = 350 MPa
Predicted time to failure by beam model (min) 14.0 16.0
Predicted time to failure by shell model (min) 12.5 13.7
Predicted time to failure by beam model –
CEFICOSS [11] (min)
14.0 17.5
Time to failure by fire test (min) 19.0 19.0
Figure 12. Vertical displacement of beam in fire using shell element model.
in Fig. 14. This average column temperature curve will be used in the structural analysis
and temperature analysis of steel column is not necessary in this case. Further details on
the tests can be seen in [21].
From [21], the axial restraints work in a way so that it provides axial restraint when
column expands vertically and is subjected to compression force. After material
softening and the column buckling occur, the axial force decreases to zero and the
system will not provide further restraint in axial direction. In another word, the axial

15
restraint only works when thermal expansion of column causes additional compression
force in the system.
(a) beam model (b) shell model
Figure 13. FE models using beam and shell elements. Fig. 14. Average column
temperature versus time.
FE analysis using beam element model
Hughes-Liu beam elements with user-defined integration in the cross section were used
to model the steel column and plates. Based on the previous two analyses, the element
size of 50 mm is suitable for this structure. Therefore around 36 elements are used in the
column and 15 elements in each plate. A discrete beam is used on the top end of steel
column to model the axial spring restraint provided by vertical support system. A simple
calculation using simply supported beam model is used to calculate the stiffness of top
plate under vertical force in the middle of the beam span. Result shows that the stiffness
of axial restraint by top plate is 24.3 kN/mm in this model. Therefore, the axial stiffness
of the discrete beam (Fig. 13) is 32.7 kN/mm. By this the total axial stiffness provided
by the structural system in this model is 57 kN/mm. In order to avoid the axial restraint
during the loading phase (before furnace heating), *Boundary_SPC_Birth_Death is used
in defining the boundary conditions of both ends of top plate and upper node of discrete
beam. Fixed boundary condition in vertical direction is imposed only after the initial
static loading of 205 kN is applied. This is achieved by defining the starting time of the
boundary condition (Birth Time). During the heating process, the column will expand in
length direction, the axial restraints induce additional compression force in the column
and the total force is greater than initial loading. After buckling and material softening,
the force in column will decrease and reach 205 kN compression force again. This time
is set as end of the vertical restraints (Death Time), since the column lose stability in the
testing and otherwise, after that the axial force of restraints would become tensile.
The geometrical imperfection of L/1000 is applied to the mid-height of steel
column in the x-direction (around minor-axis) and the shape of imperfection is
approximately sinusoidal. The length range 1750 mm of steel column is heated using
the measured average column temperature curve (Fig. 14).

16
The axial force in the column, the axial displacement in the top end of column and
the lateral displacement at mid-span are studied and the analysis results are compared
with test measurement. The results were presented in the form of responses versus
average column temperature (Fig. 15). The actual yield strength of tested column was
not measured in the test. According to studies in [11, 15, 22], the actual yield strength of
S275 could be between 275-400 MPa. Therefore, two cases with yield strengths of 275
and 350 MPa were analyzed. It can be seen that yield strength has significant effect on
the structural response of the steel column and the case with yield strength of 350 MPa
gives better prediction in axial forces and lateral displacement at mid-span. The
development of axial force in the heated column shows that both the ascending phase
and peak value are close between testing result and FE prediction. The declination of
generated axial force in steel column by FE prediction is a little faster than testing
measurement. From the analysis, the applied axial load of 205 kN causes 1.14 mm axial
compression displacement before heating. It is assumed that the axial displacement
measurement (zero value) was started after loading and before heating. Therefore, the
total axial expansion by FE analysis is 3.05 mm and that by testing is stated as 2.0 mm
for yield strength of 350 MPa case. From Fig. 15(c) it can be seen that the development
of lateral displacement at mid-span of steel column is close between testing and FEA for
yield strength of 350 MPa case. The buckling temperature is 208 oC for FEA (yield
strength 350 MPa) and 225 oC for testing measurement. The failure temperature (run
away) is 365 oC for FE prediction and 425 oC for testing measurement.
FE analysis using shell element model
The FE model using shell elements is shown in Fig. 13(b). This FE model was created
using shell elements with Belytschko-Tsay formulation. Hourglass control is used with
hourglass control type IHQ = 5 (Flanagan-Belytschko stiffness form) and hourglass
coefficient QM = 0.1. Element size is 50 mm and five integration points are defined
through the thickness. In the bottom plate, the simply supported boundary conditions
are defined for left edge and right edge. In the top plate, similar boundaries are defined
but with birth time at 2 seconds (after 205 kN axial loading application is completed).
The death time is defined based on first run, i.e. the time corresponding to axial load
that reaches 205 kN compressive force again during heating process. At this point, the
axial restraint starts to be in tension otherwise and the restraint is released in test.
In both ends of steel column, two spider-type rigid bodies are defined for boundary
conditions and axial loading application. *Constrained_Nodal_Rigid_Body is used to
define the rigid bodies. Boundary conditions are specified in the master nodes of the
rigid bodies. In the lower end, hinged boundary condition with restrained z-axis rotation
is defined, and in the upper end, same hinged boundary and restrained z-axis rotation
but with free movement in z-direction (vertical). Discrete beam element is used to
model the axial restraints and the definition of boundary for top node is same as
described in above beam element model.
The loading and heating procedure are the same as in previous analyses. The axial force
in the column, the axial displacement in the top end of column and the lateral
displacement at mid-span are studied and the analysis results are compared with test
measurement (Fig. 16). Table 3 summarizes the major analysis results and compares

17
with test measurement. It can be seen that the FE analysis results using beam and shell
element model are very close to each other. The analysis results using yield strength of
350 MPa are closer to the test results in axial force and lateral displacement, but larger
difference for axial displacement. The difference could be narrowed down when the
exact material strength is known and the detailed configuration of axial restraint and
measurement setting in the test are known.
(a) axial forces (b) axial displacement
(c) lateral displacement at mid-span
Figure 15. Structural responses of steel column during fire using beam element model.
Conclusions
Three fire tests, with a simply supported steel beam, a simple steel frame and a
restrained column were modelled using LS-DYNA from 2D temperature analysis to
structural response analysis. The implicit scheme was used for 2D temperature analysis
since it is efficient. The structural fire analysis was carried out using explicit solver
since it involves large deformation, high-nonlinearity of temperature-dependent material
properties, and possible contact iterations. The thermal loadings of steel components

18
were exerted using 2D temperature analysis results. Since the actual heating process
during fire is long and it varies from minutes to a few hours, the analysis duration must
be scaled down to obtain reasonable computational efficiency. The structural response
and ratio of kinematic to internal energy are the major parameters showing the validity
of scaling. In the analyses carried out in this paper, a scaling factor of 100 is proved to
be suitable for the studied cases. A loading time of 2 seconds from zero to desired load
level were used in the analyses. This corresponding to an actual loading time of 3.3
minutes.
The deformation response at mid-span of beam, lateral displacement of column,
axial forces due to thermal expansion and restraints, and fire resistance time were
compared with the test measurement and previous analysis using CEFICOSS from
literature. In general, the agreement is fairly good for temperature histories. The
maximum temperature difference for simply supported beam case is 85 oC in top flange
at 15 minutes and 60 oC in top flange of beam at 23 minutes for simple frame case. LS-
DYNA explicit solver is able to predict the structural responses well in deformation
response and axial force due to restraints. It gives smaller fire resistance time when the
fire parameters and material properties were taken from Eurocodes. For all three fire
tests, the prediction by LS-DYNA is closer to the testing measurement by Hughes-Liu
beam element model for yield strength of 350 MPa case, except a larger difference in
axial displacement of restrained steel column. For simply supported beam case and
restrained steel column case, FE prediction using Belytschko-Tsay shell element is also
close to testing result, except larger difference in axial displacement for restrained
column case for yield strength 350 MPa. For simple frame case, FE prediction on the
fire resistance time (time to failure) using shell element has larger difference from the
test measurement.
The following improvements could be done in the future research, in order to
narrow the differences between FE modeling results and fire tests:
1) For standard furnace fire test, the emissivity and convection coefficients by
Eurocode give relatively higher temperature prediction in steel beam. A
calibration work could be carried out in future to give more accurate guideline in
this aspect.
2) For structural fire analysis, the strength of steel material has significant effect on
the fire resistance prediction and structural responses. Hence, in the future fire
tests, the strength properties of used steel materials should be carefully measured
and reported.
3) Generally speaking, beam element models give similar results of structural
responses in fire as shell element models., unless local failures (local buckling
and crushing) and lateral-torsional buckling are important. Shell element model
demands more computational resources than beam element model. In LS-
DYNA, proper hourglass control is necessary for reduced integration shell
element. The sensitivity of controlling parameters for hourglass could be studied
further and guideline could be given.
4) For simple frame case, further study could be made in future to investigate the
effect of different modeling methods for column end supports. The actual
support in lower end of column in the test may allow certain degree of lateral

19
movement. For axial displacement in restrained column case, the axial
displacement is only 2 mm, therefore the timing when displacement transducer
starts the measurement is critical (i.e. before or after vertical loading). This is not
reported in the literature.
(a) axial force (b) axial displacement
(c) lateral displacement at mid-span
Figure 16. Structural responses of steel column during fire using shell element model.

20
Table 3. Summary of FE analysis results and comparison with test.
FE models Max. axial
force (kN)
Max. axial
displacement
(mm)
Temperature
corresponding to
max. force and
displ. (oC)
Buckling
temperature (oC)
FEA Test FEA Test FEA Test FEA Test
Beam 275 MPa 335
(-7%)
360
2.31
(+15%)
2.0
165
(-31%)
240
160
(-29%)
225
350 MPa 377
(+5%)
3.05
(+52%)
236
(-2%)
208
(-8%)
Shell 275 MPa 338
(-6%)
2.43
(+22%)
170
(+29%)
165
(-27%)
350 MPa 379
(+5%)
3.30
(+65%)
231
(-4%)
214
(-5%)
References
[1] Johnson P.F. (1998). International developments in fire engineering of steel
structures. Journal of Constructional Steel Research, 46: 1–3.
https://doi.org/10.1016/s0143-974x(98)00113-8
[2] SCI (1991). Structural fire engineering: Investigation of broadgate phase 8 fire.
Steel Construction Institute.
[3] Baily C.G., Lennon T., Moore D.B. (1999). The behavior of full-scale steel-
framed building subjected to compartment fires. The Structural Engineer, 77 (8):
15–21.
[4] Ma Z. and Mäkeläinen P. (2006). Structural behavior of composite slim floor
frames in fire conditions. Journal of constructional steel research, 62(12): 1282-
1289. https://doi.org/10.1016/j.jcsr.2006.04.026
[5] Kodur V.K.R., Garlock M., Iwankiw N. (2012). Structures in fire: state-of-the-art,
research and training needs. Fire Technology, 48: 825-839.
https://doi.org/10.1007/s10694-011-0247-4
[6] Knobloch M. (2017). Structural fire design – developments in research and
assessment of fire in steel and composite structures. Eurosteel 2017, September
13-15. Copengagen, Denmark. https://doi.org/10.1002/cepa.44
[7] Paik J.K., Czujko J., Kim J.H., Park S.I., Islam M.S., Lee D.H. (2015). A new
procedure for the nonlinear structural response analysis of offshore installations in
fires. In Transactions - Society of Naval Architects and Marine Engineers 121:
224-250.

21
[8] Rackauskaite E., Kotsovinos P., Rein G. (2017). Model parameter sensitivity and
benchmarking of the explicit dynamic solver of LS-DYNA for structural analysis
in case of fire. Fire Safety Journal, 90: 123-138.
https://doi.org/10.1016/j.firesaf.2017.03.002
[9] Kwaśniewski L., Ali F., Balcerzak M., (2013). Coupled structural-thermal
calculations for restrained steel columns in fire", Journal of Structural Fire
Engineering, 4 (1), pp.59-70, https://doi.org/10.1260/2040-2317.4.1.59
[10] Cooke G.M.E., Latham D.J. (1987). The inherent fire resistance of a loaded steel
framework. Steel Construction Today, 1: 49-58.
[11] Franssen J.M., Cooke G.M.E., Latham D.J. (1995). Numerical simulation of a full
scale fire test on a loaded steel framework. Journal of Constructional Steel
Research, 35: 377-408. https://doi.org/10.1016/0143-974x(95)00010-s
[12] Li, G.Q., Wang, P.G. (2013). Advanced analysis and design of fire safety of steel
structures. Zhejiang University Press, China.
[13] EN1991-1-2 (2003). Eurocode 1: Actions on structures. Part 1-2: General actions.
Actions on structures exposed to fire. European Committee for Standardization
(CEN).
[14] EN1993-1-2 (2005). Eurocode 3: Design of steel structures - Part 1-2: General
rules - Structural fire design. European Committee for Standardization (CEN).
[15] Cong, S., Liang, S., Dong, Y. (2005). Experimental investigation of behavior of
simple supported steel beams under fire. Journal of Southeast University (Natural
Science Edition), 35 (sup (I)): 66-68.
[16] EN 1994-1-2 (2005). Eurocode 4 - Design of composite steel and concrete
structures - Part 1-2: General rules - Structural fire design. European Committee
for Standardization (CEN).
[17] Irfanoglu, A. (2012). Using numerical simulations and engineering reasoning
under uncertainty: study of the collapse of WTC-1. Computer-aided Civil and
Infrastructure Engineering, 27: 65-76.
https://doi.org/10.1111/j.1467-8667.2010.00700.x
[18] McAllister, T.P., Sadek, F., Gross, J.L., Kirkpatrick, S., MacNeill, R., Bocchieri,
R.T. (2013). Structural analysis of impact damage to world trade center buildings
1, 2, and 7. Fire Technology, 49: 615–642.
https://doi.org/10.1007/s10694-012-0286-5
[19] LSTC (2016). LS-DYNA 971 user’s manual, volume I to II (version R9.0.1).
Livermore Software Technology Corporation (LSTC), Livermore.
[20] Lu, W., Mäkeläinen, P., Outinen, J., Ma, Z. (2012). Investigation of behavior of
cold-formed steel sheeting systems in fire using finite element modelling.
Proceedings of the 21th International Specialty Conference on Cold-Formed Steel
Structures, St. Louis, Missouri, U.S.A., October 24-25, 2012.
[21] Ali, F., O’Connor, D. (2001). Structural performance of rotationally restrained
steel columns in fire. Fire Safety Journal, 36: 679-691.
https://doi.org/10.1016/s0379-7112(01)00017-0
[22] Yun, X., Gardner, L. (2017). Stress-strain curves for hot-rolled steels. Journal of
Constructional Steel Research, 133: 36-46.
https://doi.org/10.1016/j.jcsr.2017.01.024

22
Zhongcheng Ma, Jarmo Havula
Sheet Metal Center, School of Technology
Häme University of Applied Sciences
Visakaarre 9, 13100 Hämeenlinna
Finland
[email protected], [email protected]
Markku Heinisuo
Tampere University of Technology
Department of Civil Engineering
P.O.Box 600, FI-33101 Tampere
Finland