Embed Size (px)
Citation preview
STRUCTURAL, GEOCHRONOLOGICAL AND METAMORPHIC INVESTIGATION OF THE NORTH TEA LAKE MYLONITE ZONE: A LATE EXTENSIONAL
FEATURE WITHIN THE CENTRAL GNEISS BELT, GRENVILLE PROVINCE, ALGONQUIN PARK, ONTARIO.
Laura Ratcliffe
Submitted in partial fulfillment of the requirements for the degree of Bachelor of Science, Honours
Department of Earth Science Dalhousie University, Halifax, Nova Scotia
March 2011

LAURA M. RATCLIFFE
STRUCTURAL, GEOCHRONOLOGICAL AND METAMORPHIC INVESTIGATION OF
THE NORTH TEA LAKE MYLONITE ZONE: A LATE EXTENSIONAL FEATURE
WITHIN THE CENTRAL GNEISS BELT, GRENVILLE PROVINCE, ALGONQUIN
PARK, ONTARIO
APRIL 25, 2011
B.Sc. Honours MAY 2011

ABSTRACT
The Central Gneiss Belt (CGB) in the western Grenville Province of the Grenville orogen
(~1190 – 980 Ma) in southern Ontario exposes a Himalayan scale mountain belt at deep levels.
The recently identified North Tea Lake mylonite zone (NTLMZ) is a late, extensional,
greenschist facies mylonite zone lying conformably within an amphibolite facies nappe-
bounding thrust sense North Tea Lake shear zone (NTLSZ) which separates the Kiosk and
Bonfield domains within the western CGB.
Detailed mapping of a transect across the NTLMZ shows lithological and structural
variations within the shear zone. The NTLMZ has normal-sense shear determined from
microstructural kinematic indicators and extension direction determined from orientation of
rotated fold hinges to the down dip direction.
A temperature estimate at the time of mylonitization is based on 1) identification of
dynamic recrystallisation processes in quartz and feldspar (400-500 º C), 2) a mineral
assemblage suggestive of greenschist facies conditions (300-500 º C) and 3) Electron Backscatter
Diffraction (EBSD) analysis indicating the dominant slip system active in quartz (basal <a>,
300-400 º C).
An 40
Ar/ 39
Ar geochronology investigation of bulk rock samples and mineral separates
produced a reliable cooling age of hornblende to be 1025 ±19 Ma. A model assuming a
hornblende closure temperature of 500 º C and cooling rate of 2 º C Myr -1
suggests a NTLMZ
age of ~ 955 – 975 Ma. This age range suggests the NTLMZ was a late Grenville process.
In the extensional NTLMZ the footwall is brought closer to the surface indicating
exhumation of the study area, while PT changes from the earlier amphibolite facies NTLSZ to
the later green schist facies NTLMZ indicates cooling of the study area. Therefore the NTLMZ
suggests cooling and exhumation during late Grenville processes.

ii
TABLE OF CONTENTS Page
Table of Contents i
Table of Figures v
Table of Tables vii
Acknowledgements viii
1. Introduction
1.1 Introduction to the problem 1
1.2 Mapping Expedition 3
1.2 Study Objectives and Methods of Investigation 4
2. Field Relationships 5
2.1 General Statement 5
2.2 Mapping Methods 5
2.2.1Sample Collection 6
2.2.2 Structural Methods 6
2.3 Observations 7
2.3.1Tonalitic Straight Gneiss 12
2.3.2 Migmatite 12
2.3.3Weakly Mylonitized Folded Migmatite 12
2.3.4 Folded Gneiss Enclave 13
2.3.5Mylonitized Migmatite 14
2.3.6 Gneiss Enclaves 15
2.3.7 Mafic Pod 15
2.3.8 Granitic Straight Gneiss 16
2.4 Structural Observations 18
2.5 Discussion 20
2.5.1 Folds 20
2.5.2 Lineation 21
2.5.3 Pure vs. Simple Shear 21
2.5.4 Relationship of the NTLMZ to NTLSZ 21
2.6 Summary 22
3. Petrography 23
3.1 General statement 23
3.2 Methodology 23
3.3 Granitoid Migmatite 23
3.4 Mylonitized Migmatite 24
3.4.1 Mylonite Bands 24
3.4.2 Ultramylonite 25
3.4.3 Mylonitized Leucosomes 26
3.4.4 Hornblende Porphyroclasts 27
3.5 Discussion 28

iii
3.5.1 Mineralogy 29
3.5.2 Titanium Content in Biotite 29
3.5.3 Water Content 30
3.5 Summary 30
4. Microstructure 31
4.1 General statement 31
4.2 Methodology 31
4.3 Vorticity Vector and Fabric Asymmetry 31
4.4 Mineral Microstructure 34
4.5 Discussion 37
4.5.1 Extension Direction and Shear Sense 37
4.5.2 Deformation Processes 37
4.6 Summary 39
5. EBSD Analysis 40
5.1 EBSD General statement 40
5.2 EBSD Methodology 41
5.3 EBSD Results 42
5.3.1 Area 1 44
5.3.2 Area 3 44
5.4 Grain Size 47
5.5 Discussion 48
5.5.1 Flow Stress 48
5.5.2 Type of Strain 48
5.5.3 Slip Systems 48
5.6 Summary 49
6. 40
Ar/39
Ar Geochronology 50
6.1 General Statement 50
6.2 Methodology 51
6.2.1 Bulk Rock Samples 51
6.2.2 Mineral Separates 51
6.2.3 40
Ar/39
Ar Data Collection Methodology 51
6.3 Sample Descriptions 52
6.3.1 Bulk Rock Sample –AR I Ultramylonite 52
6.3.2 Bulk Rock Samples AR II- V Mylonite 52
6.3.3 Felsic Concentrate and Biotite Separate 53
6.3.4 Hornblende Separate 53
6.4 40
Ar/39
Ar Data 57
6.4.1 Bulk Rock Sample AR I Ultramylonite 58
6.4.2 Bulk Rock Sample AR III –V Mylonite 58
6.4.3 Felsic Concentrate Separate 58

iv
6.4.4 Hornblende Separate 58
6.5 Discussion 59
6.5.1 Bulk Rock Sample AR I Ultramylonite 59
6.5.2 Bulk Rock Sample AR III- V Mylonite 59
6.5.3 Hornblende Separate 60
6.5.4 Feldspar Separate 60
6.6 Summary 61
7. Discussion 62
7.1 General Statement 62
7.2 Age Model 62
7.3 Late Extensional Features in the Grenville 64
8. Conclusions 65
8.1 Conclusions 65
8.2 Recommendations for Further Study 66
References 67
Appendix A Abbreviations used in text and diagrams
Appendix B Hornblende EMP data
Appendix C Biotite EMP data
Appendix D Argon Data

v
TABLE OF FIGURES
Figure 1.1 Map of Grenville Province 2
Figure 1.2 Digital elevation map of study area 3
Figure 2.1 Photograph showing baseline 6
Figure 2.2 Topographic map showing elevation map in study area 8
Figure 2.3 Outcrop Map of NTLMZ Study area 10
Figure 2.4 Photograph of outcrop with units 11
Figure 2.5 Weakly mylonitized folded migmatite 13
Figure 2.6 Folded Gneiss 14
Figure 2.7 Outcrop photographs 17
Figure 2.8 Stereonet of folds 19
Figure 2.9 Fold in hand sample 20
Figure 3.1 Sample 3.3 D mylonite band 25
Figure 3.2 Ultramylonite band 26
Figure 3.3 Mylonitized Leucosome 27
Figure 3.4 Hornblende porphyroclast 28
Figure 4.1 Diagram of slide orientation 32
Figure 4.2 Sample 3.3 D porphyroclast asymmetry 33
Figure 4.3 Sample 3.3 D C’ shear bands 33
Figure 4.4 Photomicrograph showing dynamic recrystallisation 35
Figure 4.5 Photomicrograph showing dynamic recrystallisation 36
Figure 5.1 EBSD locations 43
Figure 5.2 OIM of quartz bands 45

vi
Figure 5.3 Pole diagrams 46
Figure 5.4 Grain size distribution 47
Figure 6.1 K-Chemical Map ARI 54
Figure 6.2 K- Chemical Map AR III 55
Figure 6.3 K- Chemical Map Leucosomes 56
Figure 6.4 Argon graph (all samples) 57
Figure 6.5 Argon graph – Hornblende 59
Figure 7.1 Age Model 63

vii
TABLE OF TABLES
Table 4.1 Orientation of this section view 32
Table 4.2 Modes of Dynamic Recrystallisation or Brittle 37

Acknowledgements
I would like to thank the faculty and staff of Dalhousie University’s Earth Science
Department for years of dedicated instruction and support, and the invaluable assistance
of Peter Regan and John Foster in the field, Jeff Marsh and Chris Gerbi with EBSD
interpretation, and Keith Taylor and Pete Reynolds with the Dalhousie University argon
geochron. In addition, I would like to thank Dan MacDonald and Gordon Brown with
Dalhousie University’s EMP and thin section preparation labs and Thomas Duffet for
technical assistance. I am deeply grateful to Becky Jamieson for encouragement and sage
advice, Kyle Landry, the Dawson society, and the Dalhousie Earth Science honours class
of 2011 for support and motivation. Finally, to my supervisor Nick Culshaw for his
guidance and expertise, and for the opportunity to work on some of Canada’s most
interesting and challenging, geology.

Chapter 1: Introduction
1
CHAPTER 1: INTRODUCTION
1.1 Introduction to the problem
The Grenville province (Fig 1.1), is the youngest component of the Canadian Shield, it was
formed during the 1190 – 980 Ma Grenville orogeny and exposes the doubly thickened crust at
middle to lower levels providing a unique opportunity to study a Himalayan-scale orogen at
depth. The Grenville province is divided into 1) the Grenville Front Tectonic Zone (GFTZ) the
youngest of the zones and bounding the province to the northwest; 2) the Central Gneiss Belt
(CGB), comprised of parautochthonous and allochthonous lithologically distinct high grade
ductile nappes (domains) of the Laurentian craton (pre-1400 Ma) stacked together with offshore
Laurentian supracrustal sequences at deep levels during collision; 3) the Central
Metasedimentary Belt (CMB) is composed of allochthonous post-1400 Ma magmatic arcs and
marginal basins (Culshaw et. al 1997; Culshaw 2010; Carr et al. 2000).
This study focuses on rocks within the CGB which, in the Algonquin Park region, are
subdivided into stacked domains (Fig 1.1) from the base to top: Bonfield, Kiosk, Algonquin
(McRaney, Novar, McLintock sub-domains) and Opeongo (Carr et al. 2000; Culshaw 2010). The
Bonfield domain consists of granitoid plutons and varied quartzofeldspathic gneiss
metamorphosed at amphibolite facies. The dominant feature of this domain is the Bonfield
batholith accompanied by smaller granitoid plutons. The Kiosk domain is predominantly
granulite facies orthogneiss with a strong SSE inclined gneissic fabric. The North Tea Lake
Shear Zone (NTLSZ) lies between the Kiosk and Bonfield domains. It is characterized by fine-
grained, highly attenuated banded gneiss with a SE-dipping fabric overprinting an earlier fabric.
The shear zone is approximately 3 km with a thrust shear sense (McLeish 2008).

Chapter 1: Introduction
2
Figure 1.1: Map of Grenville Province showing locations of: 1) Grenville orogen (top right map
inset), 2) GFTZ (top left), 3) CGB white area across centre of map, 4) CMB (bottom right), 5)
Bonfield and Kiosk domains separated by a line which is the NTLSZ. Figure from Culshaw
2010.
Reconnaissance work done in 2007 (McLeish 2008) identified two locations of mylonite
in the eastern arm of North Tea Lake, within the NTLSZ (Fig 1.2). The mylonite is anomalous
with respect to the NTLSZ fabric (and very unusual within the CGB) and so was identified as a
feature requiring further study. The eastern mylonite location is the focus of this study.

Chapter 1: Introduction
3
Figure 1.2: Digital Elevation Map of study area. Green circles in the eastern arm of North Tea
Lake mark the locations of mylonite, the study area is the green circle marked by the white
arrow. The study area is within the NTLSZ which trend is marked by the red line and thickness
is marked by the black line. Map compiled by Dr. Nicholas Culshaw.
1.2 Mapping Expedition
This project began with a two week expedition in northwestern Algonquin Park, Ontario,
August 6-19th
, 2010. The study area, on the east arm of North Tea Lake, is accessible by a one
day canoe paddle and portage from Algonquin Park access point # 1. A campsite is conveniently
located at the best exposure of the study area and was designated base camp for the group.
The purpose of this expedition was to collect more detailed information on a regional
scale shear zone and the mylonite within it, identified by reconnaissance mapping done by

Chapter 1: Introduction
4
Culshaw and McLeish in 2007 (McLeish 2008). Participants included Dr. Nicholas Culshaw,
John Foster, Laura Ratcliffe, and Peter Regan. John Foster investigated the NTLSZ bounding the
Kiosk and Bonfield domains as part of a MSc. project concurrently with this study of the
NTLMZ. Peter Regan assisted with the investigations while Dr. Culshaw oversaw and advised
the students.
1.3 Study Objectives and Methods of Investigation
The goal of this study is to characterize the North Tea Lake Mylonite Zone (NTLMZ) in
terms of kinematics, structural development, age and the PT conditions of the deformation.
Techniques employed to investigate these objectives include field observations, petrographic
study of the mineral assemblage, optical observations of microstructure, including dynamic
recrystallisation mechanisms and kinematics, EBSD analysis of quartz lattice preferred
orientations, and 40
Ar / 39
Ar geochronology (step-heating of biotite, hornblende and K-feldspar
separates and bulk rock samples).

Chapter 2: Field Relationships
5
CHAPTER 2: FIELD RELATIONSHIPS
2.1 General Statement
The goal of the field component of this study was to gather information to determine the
structure and kinematics of the NTLMZ and its relationship with the NTLSZ. This was
accomplished by detailed mapping of a transect across NTLMZ and collection of samples to be
further analyzed in the laboratory.
2.2 Mapping Methods
A detailed map was developed showing the location of each unit identified and its
relationship to the surrounding area. In order for the map to be as accurate as possible a baseline
(Fig. 2.1) with a known orientation was set along the outcrop. All samples, structural
measurements (e.g. foliations, folds limbs) and boundary locations were referenced to this base
line. Peter Regan developed a sketch of the outcrop outlines along the baseline which is used as
the foundation of the map. Rope marked with metre increments was used to mark the base line.
Each 11 m section was assigned a baseline identification number for sample reference. The
sections are 11 m each simply because this is the length of the rope that was available. The map
created in the field was then transposed to Adobe Illustrator. A summary of the map showing the
outcrops and the lithological and structural-textural boundaries of units is shown in Fig. 2.3. Two
map inserts with structural information and sample locations can be referenced in the back cover
for more detailed results of the mapping project.

Chapter 2: Field Relationships
6
Figure 2.1: Baseline on a mylonitized migmatite. Flagging tape marks metre increments.
Samples locations were then measured by the distance perpendicular to the baseline.
2.2.1 Sample Collection
The samples are from locations representative of each unit along the transect. The
samples were oriented and numbered with reference to the baseline section number and then
alphabetically named in the order it was collected from each baseline. (See map insert “Sample
Location Map” in back flap of thesis)
2.2.2 Structural Methods
The orientations of penetrative foliations and metre-scale folds were measured in the
field. To better determine the geometry of folds, measurements of limb attitudes and axial traces
were collected. These were then plotted on a stereonet and the orientation of the hinges
determined. One hand sample collected in the field contains a small fold (~10 cm) which was cut
with a saw to reveal the relationship between the axial planar foliation and the hinge line.

Chapter 2: Field Relationships
7
2.3 Observations
The NTLMZ outcrops in two locations in the east arm of North Tea Lake. This study
focuses on the location with the best exposure on the eastern peninsula of North Tea Lake (Fig
2.2). The study area covers a 115 m transect of the NTLMZ along the shoreline located within
the green box in Figure 2.2. The outcrops are bounded by the lake to the east and vegetation to
the west. The maximum elevation difference is about 40 ft on the northern section of the study
area, this is due to a ridge that creates steep cliffs (Fig. 2.4). The ridge slopes to the southeast so
the elevation difference decreases 20 ft in the centre of the transect. The southern section of the
transect is relatively flat with an elevation difference of 10 ft throughout. The map (Fig. 2.3) of
this study area runs northwest to southeast and therefore transects all exposed units of the shear
zone and the NTLMZ host rock, which bounds the northern and southern ends of the transect. A
section of the transect is shown in Fig. 2.4, this figure illustrates the relationship between units as
shown in Fig. 2.3.

Chapter 2: Field Relationships
8
Figure 2.2 Topographic map showing location of study area and nearby elevations (in feet), the
study area is about 370 ft wide and lies within the green square. Note the steep topography
(marked by the 1250 ft elevation contours) trending into the northeastern portion of the study
area.
The map (Fig. 2.3) shows the relationship between the lithological and structural-textural
units of the NTLMZ. The lithological boundaries indicate compositional changes between the
units. The NTLMZ is primarily composed of two compositionally distinct protoliths, these are
tonalitic gneiss and granitoid migmatite. More highly strained portions of these units form
different textural and structural units which are defined in Fig. 2.3 by the gradational textural-
structural boundary. The tonalitic straight gneiss, folded gneiss, and gneiss enclaves are all of a
tonalitic composition but have different structural-textural characteristics. Likewise, the weakly
to strongly mylonitized and locally folded migmatite and the protolith migmatite are all of the
same composition but are classified into different units by their structural-textural differences.

Chapter 2: Field Relationships
9
The granitic straight gneiss and mafic pod are lithologically distinct with no textural-structural
counterpart.
The structural and textural boundaries define the location of the NTLMZ within the study
area. The northern boundary of the NTLMZ is defined by the lower migmatite (host rock) and
the upper weakly mylonitized folded migmatite (NTLMZ) shown in Fig. 2.3: Baseline 1.2 & 2.1.
The southern boundary of the NTLSZ is defined by the lower mylonitized migmatite (NTLSZ)
and the upper granitic straight gneiss (host rock), shown in Fig. 2.3: Baseline 3.5. The units of
NTLMZ are stacked as a folded mylonitized migmatite and gneiss (Fig. 2.3: Baselines 2.1& 2.2),
overlain by a heterogeneous layer of strained migmatite (Fig. 2.3: Baselines 2.2-3.5). The
mylonitized migmatite contains lithologically distinct gneiss enclaves and a mafic pod indicated
by a lithological boundary.

Chapter 2: Field Relationships
10
Figure 2.3: Outcrop Map showing a 115 m transect of the North Tea Lake Mylonite Zone. The
transect is bounded by a lake to the west and lack of exposure to the east. The maximum
elevation change is 40 ft. For larger more detailed maps see inserts in flap at the back of thesis.

Chapter 2: Field Relationships
11
Figure 2.4: Photograph of outcrop in northern half of transect. The short dashed lines represent
changes in lithology while the long dashed lines show gradational changes in mylonitization of
the migmatite. Note the gneiss enclave which is lower in the section than the surrounding
mylonite. This figure also demonstrates the relationship between the SE dipping units such as the
folded protomylonite migmatite and the overlying mylonitized migmatite.

Chapter 2: Field Relationships
12
2.3.1 Tonalitic Straight Gneiss
The tonalitic straight gneiss is the lowest unit bounding the study area and host rock of
the NTLMZ, (Fig. 2.3: Baseline 1.1). The outcrop is dominated by a large isoclinal fold (3 x 1.5
m) of strongly layered tonalitic (quartz and plagioclase rich) gneiss. The tonalitic gneiss contains
some biotite/hornblende rich bands.
2.3.2 Migmatite
The migmatite unit (Fig. 2.3: Baseline 1.1-1.2, &4.1) is the protolith of the mylonitized
migmatite which defines the North Tea Lake shear zone. The first occurrence of migmatite
overlies the tonalitic straight gneiss in the northernmost outcrop. The migmatitic granitoid -
contains bands of pink leucosomes within a plagioclase-quartz rich (tonalitic) matrix. The
leucosome is primarily potassium feldspar and quartz (1-3mm grains), while the darker bands
contain more biotite, plagioclase and quartz of a smaller grain size (0.5 mm). The migmatite
contains characteristic hornblende porphyroblasts (1-5 mm) which are present throughout the
migmatite in varying concentrations. Outside the NTLMZ the migmatite is relatively straight
with a foliation dipping about 50º to the southeast.
2.3.3 Weakly Mylonitized Folded Migmatite
The weakly mylonitized folded migmatite (Fig. 2.5) unit overlies the protolith migmatite
(Fig. 2.3: Baseline 2.1). The gneissic banding between the leucosome and tonalitic layers is more
defined then in the protolith and the grain size of the leucosomes is reduced (0.5-1 mm)
suggesting it has been weakly mylonitized. The boundaries of this unit are gradational, the grain
size coarsens towards the lower migmatite unit and fines towards the overriding mylonite unit.

Chapter 2: Field Relationships
13
Figure 2.5: Weakly Mylonitized Folded Migmatite: a) Fold from plan view looking down axial
trace (60 cm board for scale). b) Folded protomylonite migmatite overlying straight migmatite
layer on cliff face (pencil for scale).
2.3.4 Folded Gneiss Enclave
A pod of folded tonalitic straight gneiss (Fig 2.6) is found between the weakly
mylonitized folded migmatite and the overlying mylonitized migmatite (Fig. 2.3: Baseline 2.1 &
2.2). The boundaries of the folded gneiss and surrounding units suggest this unit is an enclave
because the enclave does not extend across the outcrop (see 3 point junction of boundaries (Fig
2.3: Baseline 2.2)). The geometry of the folds in the gneiss enclave is similar to those of the
folded mylonitized migmatite. The similar fold structure to that of the folded migmatite suggests
a similar style of deformation related to the mylonitization event.
It is probable that this folded gneiss originated as an enclave of tonalitic straight
gneiss within the migmatite. The gneiss is composed of banded biotite rich and tonalitic layers.
The grain size is (0.5 to 1 mm).

Chapter 2: Field Relationships
14
Figure 2.6: a) Folded Gneiss (hand lens for scale), b) Folded Gneiss (pencil for scale) with fold
trace marked by dashed line. Strike and dip symbol shows southern limb joining the dominant
foliation of shear zone (077/39 SE).
2.3.5 Mylonitized Migmatite
There are several units of mylonitized migmatite. The mylonitization of the migmatite is
heterogeneous across the shear zone, and grades between weakly to strongly mylonitized
migmatite (Fig. 2.3: Baselines 3.1-3.4). The folded migmatite (Fig. 2.3: Baseline 2.1) is also
weakly mylonitized and marks the lowest unit of the NTLMZ. The strongest mylonitized
migmatite unit occurs at baseline 3.3 and 3.4, and the western portion of baseline 3.1 (Fig. 2.3).
The strain heterogeneity produces a weakly mylonitized migmatite (Fig. 2.3: Baselines 3.1& 3.2)
between the stronger mylonitized units. The mylonite consists of strongly foliated very fine-
grained bands of leucosome and grey bands (Fig. 2.1) dipping to the southeast. There is no

Chapter 2: Field Relationships
15
obvious lineation but elongated feldspar (4-6 mm) and hornblende (1-3 mm) porphyroclasts are
visible and show elongated tails perpendicular the strike of the foliation.
2.3.6 Gneiss Enclaves
There are two tonalitic gneiss enclaves in the mylonitized migmatite (Fig. 2.3: Baselines
3.1 & 3.2). These enclaves are composed of tonalitic banded gneiss very similar to that of the
tonalitic straight gneiss described in section 2.3.1. The northern enclave (labelled Gneiss Enclave
in Fig. 2.4) is surrounded by a mylonitized migmatite and located in a lower unit then the
mylonitized migmatite but is made visible by an eroded section of the mylonite. The second
enclave is 2 m southeast (Fig .2.3: Baseline 3.2).
The relationship between the two enclaves is unclear but it is probable the enclaves are
two exposed sections of the same unit which is separated by the mylonitized migmatite.
2.3.7 Mafic Pod
A mafic pod (Fig. 2.7.a) is present within the southernmost mylonite unit (Fig 2.3:
Baseline 3.4). The pod dip is concordant with the surrounding foliation. The mafic pod is
composed primarily of hornblende and biotite with 10% feldspar. The grains are 1-2 mm.
This pod is also thought to have been present in the protolith migmatite, and then
mylonitized with the rest of the shear zone.

Chapter 2: Field Relationships
16
2.3.8 Granitic Straight Gneiss
The unit overlying the mylonitized migmatite is granitic straight gneiss (Fig 2.7.b.). This
unit is the upper host rock unit bounding the NTLMZ (Fig. 2.3: Baseline 4.1). The outcrop
contains a large isoclinal fold. The granitic gneiss is fine grained (0.1-1mm) pink potassium-
feldspar rich layers banded with thinner dark layers.

Chapter 2: Field Relationships
17
Figure 2.7: Outcrop photographs: a) Mafic Pod in mylonitized migmatite dipping southeast, b)
Granitic Straight Gneiss isoclinals fold marking southern boundary of North Tea Lake shear
zone.

Chapter 2: Field Relationships
18
2.4 Structural Observations
The NTLMZ is dominated by a southeast dipping mylonitic foliation (Fig. 2.8.b) yet
there is no obvious lineation. It is difficult to observe aligned hornblende porphyroclasts but
observation of cut foliation surfaces suggest there is an alignment present. The gneissic foliation
of the NTLSZ is the same as the mylonitic foliation of the NTLMZ (Fig. 2.8.b). Folds were
located in two units described in section 2.3.3 and 2.3.4, including a weakly mylonitized folded
migmatite (Fig. 2.5), and a folded gneiss enclave (Fig. 2.6).
The stereonet in Fig 2.8.a shows the poles to fold limbs from eight folds located in these
units. The average profile plane dips to the northwest. The hinge as determined from the average
profile plane to plunges to the southeast close to the dip direction of the average mylonitic
foliation.

Chapter 2: Field Relationships
19
Figure 2.8: a) Stereonet of folds from folded units in section 2.1 and 2.2 showing: 1) poles to
limbs of individual folds (filled shapes), 2) average profile plane of folds (blue dashed plane), 3)
hinge lines of two individual folds (open hexagons), and 4) average hinge line (star). b) Stereonet
showing: 1) NTLMZ foliation poles (green squares), 2) average NTLMZ mylonitic foliation
plane (green plane), 3) average gneissic foliation of NTLSZ (black dashed plane), 4) average
hinge line (star).
The folds found in these units are asymmetrical and are exposed at high angles to their
profile planes. The lower limbs of the fold are often parallel with the axial planar foliation (Fig.
2.6.b). A hand sample from the folded gneiss unit in Fig. 2.9 shows the fold hinge plunging
down the axial planar foliation indicating it is a reclined fold.

Chapter 2: Field Relationships
20
Figure 2.9: Hand sample 2.2-E showing axial planar foliation by the dashed line, and the fold
hinge indicated by the solid arrow running through two locations of hinge point on the same fold.
The fold hinge is plunging down dip of the foliation indicating a reclined fold.
2.5 Discussion
2.5.1 Folds
The folded units provide useful information in determining the strain regime. The
asymmetrical reclined folds probably formed in a regime with a large simple shear component
because the folds are asymmetrical and (see section 2.4.3). The folds likely indicate the first
stage of shearing before they are strongly mylonitized. The folds are caused by simple shear
folding the pre-existing gneissic banding to form asymmetrical folds. As the shearing progresses
the fold hinges can be rotated into the transport direction (Culshaw 2005). Fold hinges plunge to
the southeast, the same orientation as the NTLMZ foliation dips. The down dip plunge is
Chapter 2: Field Relationships
21
compatible with a normal or thrust shear sense but is likely normal as deduced from independent
evidence (see chapter 4).
2.5.2 Lineation
A peculiar aspect of the mylonite zone is the lack of a widespread lineation despite
evidence for plane strain in thin section. This may in part result from the lack of outcrop
exposure of foliation surfaces. Alternatively, an obvious lineation may not have formed due to
the fine grain size, equigranular texture and monochromatic properties of the mylonite.
Nevertheless, inspection of foliation on saw cut surfaces reveals a preferred orientation of
hornblende which are either aligned or perpendicular to the extension direction (SE/NW).
2.5.3 Pure vs. Simple Shear
It is thought the shear zone was formed by simple shear because the wall rocks are
undeformed during the shear event and on account of the geometry of some microscopic
kinematic indicators and the nature of lattice preferred orientation patterns of mylonites (Chapter
4).
2.5.4 Relationship of the NTLMZ to the North Tea Lake Shear Zone.
The NTLMZ is found within the North Tea Lake Shear Zone and mylonitizes the
amphibolite facies rocks formed by the NTLSZ. The folds of NTLMZ fold the banding formed
by the NTLSZ, also the NTLMZ formed at lower grade (greenschist facies) then the NTLSZ
(amphibolite facies), therefore the NTLMZ formed after the NTLSZ. The foliations of the two
zones are parallel (Fig. 2.8.b), indicating a similar orientation of the strain field in the formation

Chapter 2: Field Relationships
22
of these zones. The similar orientations of foliations suggest the NTLMZ may be a reactivation
of the NTLSZ which exploited the pre-existing weakness created by the foliation.
2.6 Summary
The transect of the NTLMZ reveals units subdivided based on lithological and textural-
structural boundaries. The NTLMZ is a mylonitic shear zone which formed within the NTLSZ.
The structural observations in the field suggest the NTLMZ is a primarily simple shear, and
plane strain regime. It is possible the NTLMZ is a late reactiviation of the NTLSZ.

Chapter 3: Petrography
23
CHAPTER 3: PETROGRAPHY
3.1 General Statement
The mylonitization observed across the NTLSZ occurred primarily within the granitoid
migmatite which is further investigated to determine the minerals present. The goal of the
petrographic study is to identify deformation conditions by examining how the mineral
assemblage and grain size change between the protolith migmatite and the mylonitized zone. The
microstructure of the mylonitized migmatite is discussed in the next chapter (Chapter 4).
3.2 Methodology
This study employs the use of petrographic microscopes and glass covered thin sections
to determine which minerals are present. Electron microprobe (EMP) analysis provided data
used to determine the amount of titanium present in matrix and relict biotite to estimate changes
in temperature at the time of biotite growth.
3.3 Granitoid Migmatite
The migmatite shows compositional banding of leucosomes, mesosomes, and
melanosomes. Melanosomes zones are defined by dark brown biotite with a grain size range of
0.5-1mm, which is typically inter-grown with or bounding blue-green hornblende porphyroblasts
(0.3-10 mm). Mesosomes typically surround the hornblende and biotite; they are composed
primarily of fine grained (0.1-0.5 mm) inequigranular K-feldspar with tartan twinning, quartz
with equant subgrains and plagioclase. Leucosomes are much coarser grained (0.5-1.5 mm).
They contain K-feldspar with tartan twining and some myrmekitic zones, quartz with elongate
subgrains, and plagioclase and some biotite (0.2-0.5 mm).

Chapter 3: Petrography
24
3.4 Mylonitized Migmatite
Passchier and Trouw (2005) define mylonite as a foliated and usually lineated rock that
shows evidence for strong ductile deformation and normally contains fabric elements with
asymmetry. Protomylonites contain 10-50 % matrix, mylonite has 50-90% matrix and
ultramylonite has >90 % matrix. In this study matrix is considered to be any grains below 300
µm. The mylonitized migmatite consists of three zones; 1) mylonite bands, 2) ultra-mylonite
bands and 3) mylonitized leucosomes. The proportion of each zone in the outcrop is variable due
to the heterogeneity of the NTLMZ. On the outcrop scale most of the mylonitized migmatite is
classified as typical mylonite bands (80 % of rock), mylonitized leucosomes account for 18 % of
the outcrop, and 2% of the outcrop is ultra-mylonite. Hand samples and thin sections reveal
cross cutting chlorite veins through the mylonite.
3.4.1 Mylonite Bands
The mylonitized non-leucocratic bands are the dominant fabric of the NTLMZ. By a
visual estimate the matrix content ranges from 40 – 70 % in these bands. Fig. 3.1 shows mylonite
band with ~50 % matrix. The grain size of the matrix contains grains as small as 1 µm, and has
an average grain size of 10 µm, newly formed biotite grains have an average size of 10-50 µm.
Porphyroclasts within this band are grain size reduced rounded K-feldspar (0.1-0.5 mm). The
matrix is composed of very fine grained biotite ( Ti: 0.351 apfu) and quartz ribbons wrapped
around the feldspar porphyroclasts. Hornblende porphyroclasts (0.5-1.5 mm) are present in
varying abundance dependant on the particular band.
Chapter 3: Petrography
25
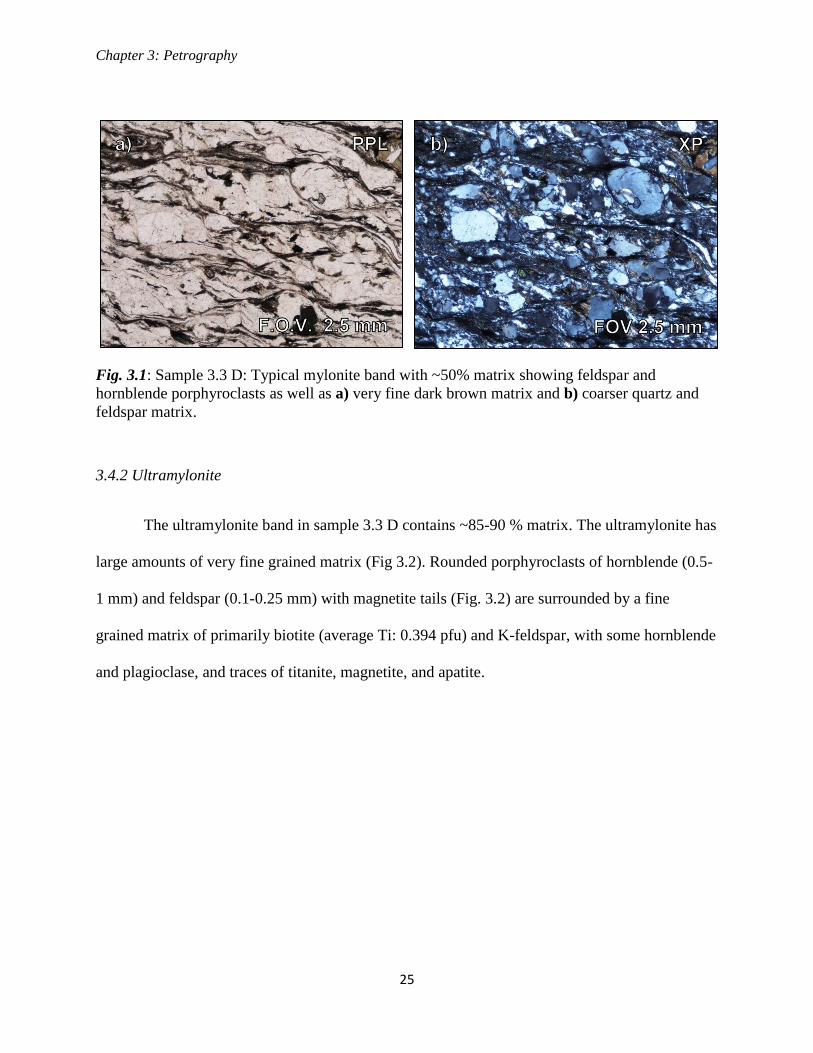
Fig. 3.1: Sample 3.3 D: Typical mylonite band with ~50% matrix showing feldspar and
hornblende porphyroclasts as well as a) very fine dark brown matrix and b) coarser quartz and
feldspar matrix.
3.4.2 Ultramylonite
The ultramylonite band in sample 3.3 D contains ~85-90 % matrix. The ultramylonite has
large amounts of very fine grained matrix (Fig 3.2). Rounded porphyroclasts of hornblende (0.5-
1 mm) and feldspar (0.1-0.25 mm) with magnetite tails (Fig. 3.2) are surrounded by a fine
grained matrix of primarily biotite (average Ti: 0.394 pfu) and K-feldspar, with some hornblende
and plagioclase, and traces of titanite, magnetite, and apatite.

Chapter 3: Petrography
26
Figure 3.2: Ultramylonite zone in sample 3.3 D and bulk rock sample ARI: showing hornblende
and K-feldspar porphyroclasts with magnetite tails, and very fine grained brown matrix.
3.4.3 Mylonitized Leucosomes
The mylonitized leucosomes (Fig. 3.3) are composed primarily of K-feldspar with
perthitic texture and tartan twinning (0.5-4mm), plagioclase (~0.5 mm) and quartz (0.1-0.2 mm).
The secondary minerals present include relict biotite (average Ti: 0.586 apfu) of a relatively
larger grain size (0.1-0.2 mm) than in the mylonite or ultramylonite and minor quantities of
calcite (0.1-0.3 mm) there are no hornblende porphyroclasts found in this zone.

Chapter 3: Petrography
27
Figure 3.3: Sample 3.1 H: Mylonitized Leucosome showing a) representative felsic minerals
Kfs-Qtz-Plg b) relict biotite grains within leucosome.
3.4.4 Hornblende Porphyroclasts
Hornblende porphyroclasts (Fig 3.4) are present throughout the mylonitized migmatite
primarily in the non-leucocratic zones. The hornblende has many inclusions, significantly biotite
grains (0.1-0.3 mm) with an average titanium content of 0.421 apfu. Fractures through the grains
commonly contain chlorite. The tails of the hornblende are composed of magnetite, ilmenite,
titanite and biotite.

Chapter 3: Petrography
28
Figure 3.4: Backscatter micrograph of sample 3.3 E showing hornblende porphyroclast with
inclusions of biotite, ilmenite, zircon, and late chlorite. Hornblende tails are made of magnetite,
ilmenite, and fine grained biotite and K-feldspar. Also shown is a chlorite vein cross-cutting
mylonite fabric.
3.5 Discussion
Greenschist conditions occur in a temperature range of 300-500 º C with a pressure of 2-8
kbar (Philpotts and Ague 2009). The mylonitization of the migmatite causes a significant grain-
size reduction in the mesosomes and melanosomes and some grain size reduction in the
leucosomes. The small grain size of the matrix (2-10 µm) is the main reason it is difficult to
discern between deformed pre-existing minerals and minerals which grew syn-mylonitization.

Chapter 3: Petrography
29
The heterogeneous grain size distribution, with volumetrically dominant fine-grained fraction,
indicates that grain size reduction caused by stress dominates over grain growth which occurs at
hotter temperatures suggesting high stress or low to moderate temperatures during
mylonitization.
3.5.1 Mineralogy
The mineral assemblage of the mylonitized migmatite does not change significantly from
its amphibolite-facies protolith. Chlorite occurs in three forms 1)within hornblende fractures, 2)
chloritization of biotite and 3) chlorite veins. There is not conclusive evidence to suggest
chloritization of biotite or hornblende occurred during the deformation event but it is certainly
possible because there is evidence of two chloritization events. The evidence of two
chloritization events is that the chlorite vein is found cross-cutting a chloritized hornblende and
is therefore the vein is post mylonitization and an earlier chloritization event. Epidote appears to
have grown in the tail of hornblende porphyroclasts during mylonitization. If the chloritization
did occur during mylonitization this would suggest green schist facies conditions.
3.5.2 Titanium Content in Biotite
Matrix biotite shows a lower titanium content (0.39 apfu in ultramylonite and 0.35 apfu
in typical mylonite) compared to relict biotite (0.42 apfu in hornblende inclusions and 0.59 apfu
in leucosomes) (Appendix C). Titanium content in biotite is generally lower with lower
crystallisation temperatures (e.g. Henry and Guidotti 2002). Therefore mylonitization within the
NTLMZ apparently occurred at lower temperatures than did migmatization or the deformation
event defined within the greater NTLSZ. This also indicates that matrix biotite grew or
recrystallised during mylonitization.

Chapter 3: Petrography
30
3.5.3 Water Content
Hydration could have occurred during retrogression of amphibolite gneiss if
chloritization of biotite and hornblende occurred at mylonitization. There is no evidence of K-
feldspar to muscovite reactions which would have supported a more hydrous environment.
3.5 Summary
The petrographic analysis does not indicate specific P-T conditions during deformation
but does suggest low to moderate temperatures, as evidenced by the large amount of grain size
reduced minerals and the potential for chloritization of minerals during deformation. The
titanium content of matrix and relict biotite also indicates a lower temperature at the time of
mylonitization than during protolith crystallization. The amount of hydration at the time of
deformation is uncertain as K-feldspar has not retrogressed to muscovite, but biotite and
hornblende may have retrogressed to chlorite in some instances.

Chapter 4: Microstructure
31
CHAPTER 4: MICROSTRUCTURE
4.1 General Statement
The goals of the microstructural investigation are to determine the kinematics of the
NTLMZ including extension direction and shear sense and to identify dynamic recrystallisation
processes of each mineral. These goals are accomplished by optical microscopy of oriented thin
sections and their microstructural subdomains.
4.2 Methodology
In order to determine the extension direction of the NTLMZ, which lacks an obvious
lineation work was done to determine the orientation of the vorticity vector. Eleven thin sections
of mylonitized migmatite cut perpendicular to the foliation were made at nine different
orientations (Table 4.1). The geometry of the slides was examined to establish the sense of shear
and the ‘strength’ of the asymmetry of sigma porphyroclasts. The orientation of the slide with the
strongest asymmetry is determined to be perpendicular the vorticity vector. Because the vorticity
vector is perpendicular to the extension direction the strongest asymmetry lies close to the
extension direction. The shear sense is determined in the southeast dipping mylonite zone by
kinematic indicators such as sigma porphyroclasts (hornblende and K-feldspar ), and C’ shear
bands.
Deformation processes are determined through optical microscopy, by examining the
dynamic microstructure of quartz, feldspar, and hornblende.
4.3 Vorticity Vector and Fabric Asymmetry
The orientation of the slides used to determine vorticity vector are shown in Table 4.1.
The thin sections with the strongest asymmetric porphyroclasts are slides 3 (252º) (Fig 4.2a) and

Chapter 4: Microstructure
32
6 (092º). The slides with no asymmetric porphyroclasts are slides 4 (160º (Fig 4.2b) and 7(002º).
Slides 1(195º) and 2(100º) did not contain porphyroclasts. (Fig. 4.1)
Table 4.1 Orientation of thin section view
Slide 1 2 3 4 5 6 7 8 9 10 11
Sample 3.1-H 3.1-H 3.3-D 3.3-D 3.3-E 3.3-E 3.3-E 3.3-E 3.3-B 3.4-B 3.5-A
Orientation 195 100 252 160 210 92 002 210 10 290 30
Figure 4.1: Diagram of slide orientation: line represents the viewing direction of the slide.
Symbols indicate the strength of asymmetry as well as the shear sense of the porphyroclasts in
each slide. Red lines show slide orientations with maximum asymmetry and therefore the lines
closest to the vorticity vector, green lines show slide orientation with no asymmetry. Symbols
show the shear sense of the porphyroclast in each direction. :No asymmetry, : Top to
the right shear, : Top to the left shear, : Poor asymmetry, :No porphyroclasts.

Chapter 4: Microstructure
33
When the viewing direction of the slide is to the southwest, the strike direction of
NTLMZ foliation, porphyroclasts have maximum top to the left asymmetry (Fig 4.2.a), when
slides face the southwest, parallel the strike direction of NTLMZ foliation, porphyroclasts show
no asymmetry and in many cases have no tails (Fig 4.2. b). C’ shear bands (Fig 4.3) and quartz
grains with an SPO oblique the foliation are found in quartz ribbons (Fig 4.4.a & b).
Figure 4.2: Sample 3.3 D a) Slide 3: Facing 252º SW showing maximum asymmetry (top to the
left). b) Slide 4: Facing 160º SE showing minimum asymmetry.
Figure 4.3: Sample 3.3 D: showing C’ shear bands with top to the left shear and foliation (top
dark band).
Chapter 4: Microstructure
34
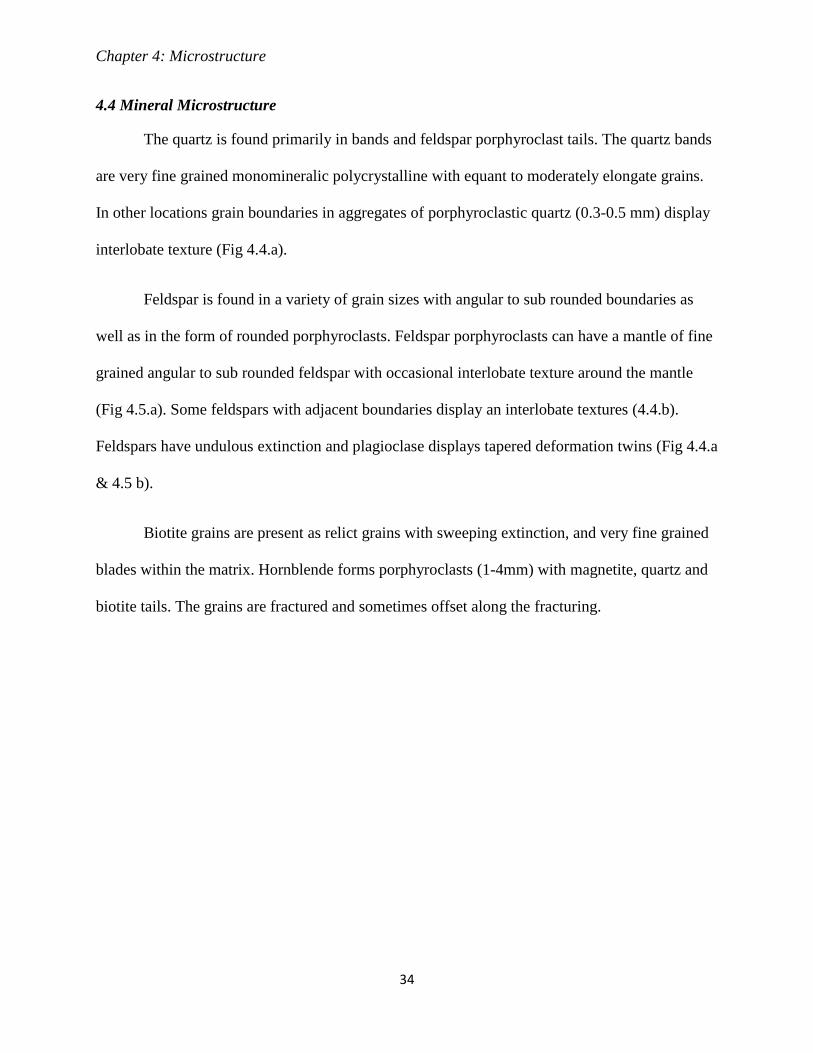
4.4 Mineral Microstructure
The quartz is found primarily in bands and feldspar porphyroclast tails. The quartz bands
are very fine grained monomineralic polycrystalline with equant to moderately elongate grains.
In other locations grain boundaries in aggregates of porphyroclastic quartz (0.3-0.5 mm) display
interlobate texture (Fig 4.4.a).
Feldspar is found in a variety of grain sizes with angular to sub rounded boundaries as
well as in the form of rounded porphyroclasts. Feldspar porphyroclasts can have a mantle of fine
grained angular to sub rounded feldspar with occasional interlobate texture around the mantle
(Fig 4.5.a). Some feldspars with adjacent boundaries display an interlobate textures (4.4.b).
Feldspars have undulous extinction and plagioclase displays tapered deformation twins (Fig 4.4.a
& 4.5 b).
Biotite grains are present as relict grains with sweeping extinction, and very fine grained
blades within the matrix. Hornblende forms porphyroclasts (1-4mm) with magnetite, quartz and
biotite tails. The grains are fractured and sometimes offset along the fracturing.

Chapter 4: Microstructure
35
Figure 4.4: Photomicrograph a) Slide 6: Polycrystalline quartz bands (bottom right), interlobate
quartz grain boundary of quartz porphyroclasts (middle left), angular feldspar (top right) b) Slide
3: Interlobate feldspar grain boundary (centre) and quartz band composed of asymmetric grains
and subgrain (upper center). BLG: bulging, SGR: subgrain rotation, qtz: quartz, fls: feldspar.

Chapter 4: Microstructure
36
Figure 4.5: Photomicrograph: Slide 6 showing: Feldspar core and mantle texture with
porphyroclast surrounded by a fine grained feldspar matrix. b) Slide 3 showing: plagioclase
porphyroclast with tapered twins (top right), quartz band (middle) and fractured hornblende
(bottom left). ). BLG: bulging, SGR: subgrain rotation, qtz: quartz, fls: feldspar.

Chapter 4: Microstructure
37
4.5 Discussion
4.5.1 Extension Direction and Shear Sense
The extension direction is interpreted to be roughly down dip the southeast dipping
foliation (SSE) because the vorticity vector is apparently oriented ENE, and the vorticity vector
is perpendicular the extension direction for non-coaxial flow. The shear sense is interpreted to be
normal because in the southeast dipping foliation slides facing SW had top to the left shear
shown by sigma-porphyroclasts and C’ shear bands.
4.5.2 Deformation Processes
Each mineral in the mylonite assemblage has a unique mode of dynamic recrystallisation
or brittle deformation dependant on the temperature at the time of deformation. The processes
include bulging (BLG), subgrain rotation (SGR) or brittle fracture. There was no grain boundary
migration (GBM) present. The deformation mechanisms are summarized in table 4.2.
Minerals with SGR are identified by equant grains in bands for example quartz bands,
minerals with BLG recrystallisation are identified by presence of interlobate texture, minerals
with GBM are identified by their amoeboid texture, and angular grain are indicative of brittle
deformation (Passchier and Trouw 2005).
Table 4.2: Modes of Dynamic Recrystallisation or Brittle Deformation in Minerals
Mineral Brittle Bulging Subgrain
Rotation
Grain Boundary
Migration
Quartz X X
Feldspar X X
Hornblende X

Chapter 4: Microstructure
38
Quartz recrystallisation processes indicate a temperature of 400-500 ºC because the
dominant recrystallisation mechanism is subgrain rotation which occurs most commonly in the
quartz bands (Passchier and Trouw 2005).
The angular to sub-rounded texture of feldspar suggests brittle fracture. Undulous
extinction can reflect internal microfracturing or dislocation glide. The rounded feldspar
porphyroclasts with core mantle texture typically are formed at conditions where BLG is the
dominant recrystallisation mechanism. Although interlobate texture (indicating BLG) is present,
it is rare, and the angular clasts of feldspar in the mantle and elsewhere suggest brittle fracture.
This suggests that a component of brittle and BLG deformation in the feldspar. The dominant
process is debatable because while most of the feldspar grains are angular, core-mantle textures
are thought to form by BLG. The evidence of angular grains in the mantle plus an interlobate
core boundary suggests both mechanisms were active.
Brittle deformation of feldspars occurs up to temperatures of 400 º C, and at temperatures
of 400-500 º C, although internal microfracturing is still the dominant deformation mechanism
BLG can also occur (Passchier and Trouw 2005). Core and mantle texture do not form until
medium grade temperatures of 450-600 º C when BLG is dominant (Passchier and Trouw 2005).
Given these parameters the feldspar probably deformed at a temperature where brittle fracturing
and BLG deformation were active such as the upper temperature range of the dominantly
microfracturing with some BLG recrystallisation range (450-500 º C).
Biotite deforms ductilely, at temperatures greater than 250 ºC, whereas hornblende
deforms brittlely below temperatures of 650-700 ºC. Given the temperature constraints of the

Chapter 4: Microstructure
39
mineral deformation processes, the mylonitization event probably occurred between 400-500 ºC
(Passchier and Trouw 2005).
4.6 Summary
Investigation of oriented slides suggests the NTLMZ is a normal-sense shear zone which
had a transport direction very close to down dip of the NTLMZ foliation. The varying
deformation processes observed in each mineral establish a deformation temperature for the
NTLMZ ~ 400-500 ºC.

Chapter 5: EBSD Analysis
40
CHAPTER 5: EBSD ANALYSIS
5.1 EBSD General Statement
In order to determine the lattice preferred orientation (LPO) of mylonitized quartz a
representative mylonite sample (3.3 E-Slide 6) was analyzed by Electron Backscatter Diffraction
(EBSD) using the Scanning Electron Microscope (SEM) facilities at the University of Maine.
The crystal lattice orientation of quartz was determined from automatically indexed diffraction
patterns to create Orientation Imaging Micrographs (OIM) and pole diagrams.
The orientation of data plotted on a pole diagram is presented with the rock’s foliation
plane represented by the horizontal line (labelled TD in Fig 5.3) and lineation also lies in this
plane and is represented by the east and west poles of the diagram. When the orientation of the
<c> and <a> axes of quartz crystals are plotted on the pole diagram the pattern created (e.g.
girdles or point maxima) can help determine the type of slip-system that was active during the
quartz deformation. The symmetry of the pattern can indicate coaxial or non-coaxial strain and in
asymmetric cases, the sense of shear.
In a correctly oriented thin section it is assumed the <c> axis girdle will be symmetric
about the foliation. At this stage in the study it cannot be confirmed the thin section analysed
(Fig 4. 1, labelled 92 º) is correctly oriented and so the data presented are preliminary results
until this can be resolved.

Chapter 5: EBSD Analysis
41
5.2 EBSD Methodology
To collect the EBSD data, we used EDAX-TSL Digiview IV and OIM v. 5 hardware and
software mounted on a Tescan Vega II Scanning Electron Microscope in the Department of
Earth Sciences, University of Maine. We simultaneously collected EDS (Energy Dispersive
Spectrometry) data for Mg, Al, Si, P, K, Ca, Ti, Fe elements using the EDAX Apollo40 system.
Operating conditions were a working distance of 25mm, 20 kV accelerating voltage, and ~11nA
beam current, with the uncoated sample tilted 70° from the beam normal. Mapping occurred on
a square grid at a step size of 1 micron, with band detection minimum and maximum of 8 and 11.
Orientation and Hough data were stored for post processing (Chris Gerbi, pers. comm., 2011).
The slide chosen for EBSD analysis is perpendicular the foliation and within the error of
the best approximation of the extension direction (~20 º). In practice the slide may not be exactly
perpendicular the foliation or be perfectly parallel the extension direction, additionally the local
flow plane may be distorted and not accurately represent bulk flow. These conditions cause pole
diagrams to be un-centred.
The data presented in the pole diagram required standard post processing procedures to
present the data in format comparable with published data. Area 1 (Fig 5.1.a) contained a pattern
symmetric about the foliation, but Area 3 (Fig 5.1.c) did not. The reason Area 3 may not have
symmetric patterns is because the orientation of the slide analysed is not perfectly parallel the
extension direction and the quartz deformation may reflect a heterogeneous flow field caused by
the rigid porphyroclasts around it. In order to create a pole diagram that could be used to
interpret mylonite conditions the data was manually rotated until the <c> axis patterns were
symmetrical about the TD. At this stage in the study only the plane of rotations but not the

Chapter 5: EBSD Analysis
42
direction of rotations is known. The significance of these rotations on the accuracy of the data is
yet to be assessed.
5.3 EBSD Results
Three areas from sample 3.3 E were selected for EBSD analysis. Each area analyzed
comprises a homogeneous, polycrystalline band of dynamically recrystallised quartz grains and
reflects a different micro-tectonic environment (Fig 5.1). Areas 1 and 3 were chosen for further
study because they are in ribbons parallel the NTLMZ foliation but Area 2 is in a ribbon that
appears to be wrapping around a porphyroclast and therefore not as representative of the
NTLMZ fabric.

Chapter 5: EBSD Analysis
43
Figure 5.1: EBSD locations in Sample 3.3 E (all same slide) a) Area 1 is a quartz band parallel
the foliation; b) Area 2 is the quartz tail of a porphyroclast and c) Area 3 is a quartz band 45 º to
the foliation. (viewing direction 92 º)

Chapter 5: EBSD Analysis
44
5.3.1 Area 1
The analysis of Area 1 involved mapping for orientation data, but EDS data was not
collected, therefore the map was cropped to an area known to contain only quartz. The quartz
grains analyzed are 2-25 µm and have a shape preferred orientation (SPO) oblique to the
foliation (Fig 5.2.a). Subgrains present in the area shown by the groups closely oriented equant
features within a grain (Fig. 5.2.Area 1).
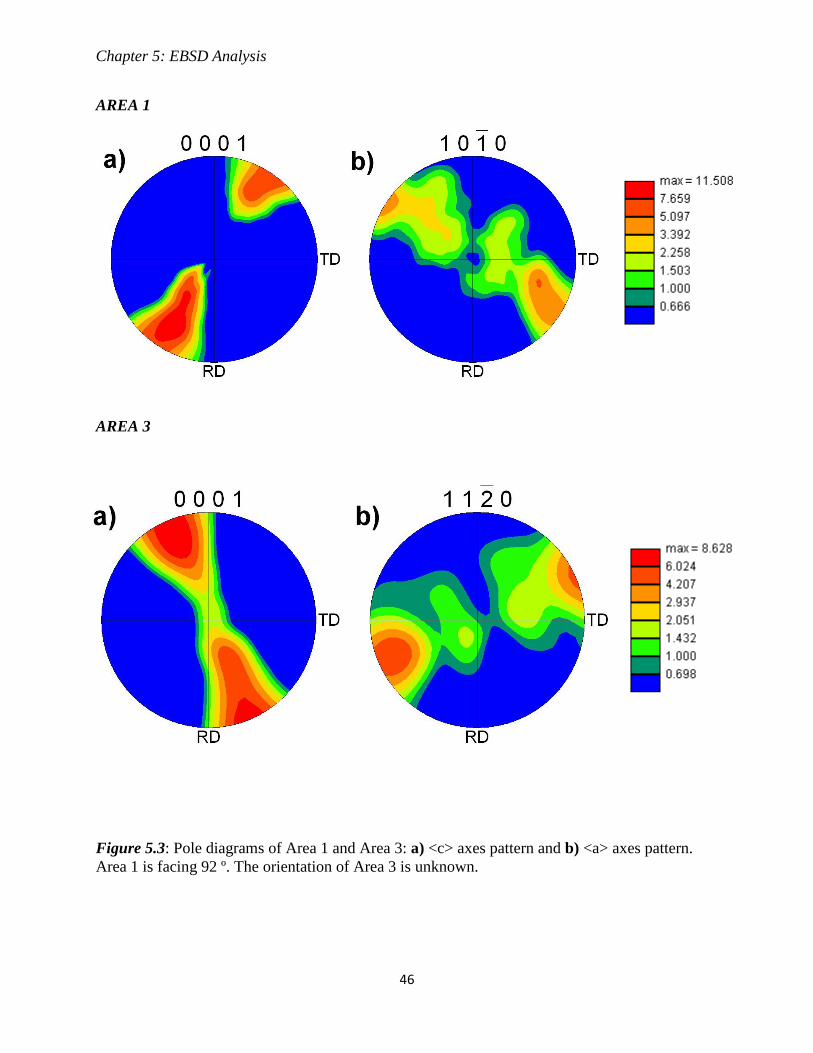
The pole diagram for Area 1 (Fig 5.3) has double <c> axis maxima extending from the
periphery towards the centre and nearly forming a single girdle. The <a> axes show a straight
girdle through the centre perpendicular the <c> axes with point maxima along the perimeters.
5.3.2 Area 3
Area 3 was mapped with EDS simultaneously with EBSD analysis to identify quartz
grains and their orientation. Additional rotation of the pole figure data were required to centre the
data. The rotations were 50º on TD, and 10 º on RD (The north-south line shown on pole
diagram). The size of the quartz grains are 2-25 µm but have weaker SPO than Area 1 (Fig
5.2.a). Presence of subgrains is shown by the large amount of equant features with similar
orientation in this area.
The pole diagram for Area 3 (Fig 4.5) has a single <c> axes girdle with strong clusters at
the periphery, and a lower density through the centre of the girdle. The <a> axes pattern shows a
double maxima perpendicular to the <c> axes at the periphery. There are also weaker clusters
between the centre and periphery double maxima along a straight girdle.

Chapter 5: EBSD Analysis
45
AREA 1
AREA 3
Figure 5.2: a) Image Quality (IQ) map showing
the location of the grain boundaries and the
confidence of the orientation index and b) Inverse
Pole Figure (IPF) showing the orientation
difference of grains. (See key)
KEY
Chapter 5: EBSD Analysis
46
AREA 1
AREA 3
Figure 5.3: Pole diagrams of Area 1 and Area 3: a) <c> axes pattern and b) <a> axes pattern.
Area 1 is facing 92 º. The orientation of Area 3 is unknown.

Chapter 5: EBSD Analysis
47
5.4 Grain Size
The grain size of recrystallised quartz in Area 3 was recorded during EBSD analysis,
quartz ranges from 1- 70 µm. Most grains range from 8-15 µm, the mean grain size is 12 µm,
which accounts for 12 % of the grains measured (Fig 5.4).
Figure 5.4: Area 3 grain size distribution of recrystallised quartz.

Chapter 5: EBSD Analysis
48
5.5 Discussion
5.5.1 Flow Stress
The mean recrystallised quartz grain size of Area 3 is 12 µm. This can be used as a
palaeopiezometer to measure the palaeostress during mylonitization. A grain size of 12 µm
correlates with a flow stress of 90 MPa (Stipp and Tullis 2003). Temperature variation does not
greatly affect the palaeopiezometer in the case of quartz (Passchier and Trouw 2005). 90 MPa is
relatively low in comparison to the range of stresses generally observed in the crust (up to 300
MPa) (Stipp and Tullis 2003).
5.5.2 Type of Strain
The pole diagrams in Areas 1 and 3 show <c> axes patterns with double maxima that are
close to a single girdle pattern. This pattern is comparable to a plane strain pattern because it is
close to a single girdle pattern (Fig 4.41: Passchier and Trouw 2005).
5.5.3 Slip Systems
The pole diagrams show double maxima <c> axes primarily in the periphery which is
representative of basal <a> slip, points between the centre and edge of the pole diagram are
representative of rhomb <a> slip. Prism <a> slip is represented by the points in the centre of the
pole diagram which are not present in Area 1 and 3 patterns. The <a> axes are consistent with
these observations (Fig 4.43: Passchier and Trouw 2005). Quartz basal <a> slip is typical of
temperatures between 300-400 º C, and quartz dominated by prism <a> slip is typical of
deformation temperatures between 400-500 ºC (Passchier and Trouw 2005). Rhomb<a> slip is
dominant at higher temperatures than basal <a> slip and lower temperatures than prism <a> slip
(Passchier and Trouw 2005). Given the presence of both basal <a> and rhomb <a> but absence

Chapter 5: EBSD Analysis
49
of prism <a> the temperature could be constrained to be in the upper temperature range indicated
by basal <a> slip (300-400 ºC).
5.6 Summary
The EBSD data provides some useful constraints on the mylonitization event. The palaeo
flow stress of quartz within the mylonite is 90 MPa as determined by the grain size distribution
graph of recrystallised quartz. The pole diagram patterns suggest deformation primarily by plane
strain, and the dominant slip system indicates temperatures in the upper range of 300-400 º C.

Chapter 6: 40
Ar/39
Ar Geochronology
50
CHAPTER 6: 40
Ar/ 39
Ar GEOCHRONOLOGY
6.1 General Statement
40 Ar/
39 Ar geochronology study was undertaken in the Argon Lab at Dalhousie
University to constrain the age of the NTLMZ. Five bulk rock samples and separates of biotite,
hornblende, and a felsic concentrate were analyzed. Unfortunately the gas produced by the
samples during step-heating escaped during analysis of both the biotite separate and bulk rock
sample ARII and 40
Ar/39
Ar and data were not produced for these samples.
Potassium bearing minerals are chosen for 40
Ar/39
Ar as the decay of parent isotope 40
K
occurs naturally to produce the daughter isotope 40
Ar by beta emission (McDougall and Harrison
1999). The 40
Ar/39
Ar dating method measures the time elapsed since the chosen potassium
bearing mineral cooled below the temperature at which argon gas can diffuse out of the crystal
lattice.
In order to obtain ages representative of the NTLMZ the samples selected for analysis
must contain potassium-bearing minerals that grew at the time of mylonitization and have a
closure temperature above the temperature of mylonitization, or that were reset during
mylonitization. Additionally, mineral closure temperature must be higher than the temperature
attained during younger thermal events so that the amount of 40
Ar/39
Ar will not have been reset.
It is therefore important to know 1) which minerals in the sample contain potassium, 2) whether
the minerals in the samples are new or relict grains and 3) the temperature at which the
mylonitization event occurred.
This chapter will examine the sources of potassium in each sample as well as show the
results of the ages produced by each sample and discuss their significance.

Chapter 6: 40
Ar/39
Ar Geochronology
51
6.2 Methodology
6.2.1 Bulk Rock Samples
Bulk rock samples (AR I – V) were selected based on observations of hand samples in an
effort to identify different bands of the mylonite which could reveal variation in bulk rock
results. Two thin sections that contain bands representative of the bulk rock samples were used to
determine detailed information on the texture and minerals of the samples. Electron Microprobe
(EMP) analysis was employed to acquire a chemical map indicating the K-bearing minerals
which allowed textural and grain size observations on the micron scale.
6.2.2 Mineral Separates
The biotite, felsic concentrate, and hornblende separates are from mylonitized
leucosomes in Sample 3.3 E. A portion of this rock was crushed with the jaw crusher and disc
mill and sieved to grain sizes between 125 – 210 µm and 210 – 500 µm. The crushed samples
were then separated with a Frantz magnetic separator to create mafic and felsic concentrated
separates. Biotite and hornblende were handpicked primarily from the mafic magnetic fraction of
(between 0.05 – 0.2 amps). with a grain size 210 – 500 µm. The felsic magnetic separate of ˃0.6
amps with a grain size of 125 – 210 µm was used as the felsic concentrate.
EMP work enabled determination of the sources of K (K-bearing minerals) within the
leucosome using a composition map, and hornblende Ca-K ratio from quantitative spot analyses.
6.2.3 40
Ar/39
Ar Data Collection Methodology
McDougall and Harrison (1988) described the principles and method of 40
Ar/39
Ar dating.
The separated mica concentrates were individually wrapped in aluminum foil, then stacked in an

Chapter 6: 40
Ar/39
Ar Geochronology
52
aluminum irradiation canister. Interspersed among the samples were five to seven aliquots of the
flux monitor, Fish Canyon tuff sanidine, which has an apparent K-Ar age of 28.205 ± 0.046 Ma
(Kuiper et al. 2008). The canister was irradiated with fast neutrons in the nuclear reactor at
McMaster University in Hamilton, Ontario, Canada. At Dalhousie University, a double -vacuum
tantalum resistance furnace was used to carry out the step-heating. Isotopic analyses were made
in a VG3600 mass spectrometer using both Faraday and electron multiplier collectors to measure
the abundance of 39
Ar for 40
Ar/39
Ar and 36
Ar/39
Ar ratios, respectively. Errors are reported at the
2σ level and include the uncertainty in the irradiation parameter, J, but do not incorporate
uncertainty in the assumed age of the flux monitor (Taylor, pers. comm. 2011).
6.3 Sample Descriptions
The samples selected for 40
Ar/39
Ar Geochronology include five bulk rock samples, a
biotite separate, hornblende separate and felsic separate. Following EMP work it is observed
samples AR II-V are all of the same texture and composition and so will be described together.
6.3.1Bulk Rock Sample –AR I Ultramylonite
AR I is from sample 3.3 D. The minerals containing potassium in this sample include
very fine grained matrix K-feldspar and biotite, and porphyroclasts of hornblende (Fig 6.1).
6.3.2 Bulk Rock Samples AR II-V Mylonite
Argon samples AR II and AR III are from sample 3.3 D, and argon samples AR IV and
AR V are from sample 3.3 E. Although some variation occurs between the bands representative
of these samples in the percent matrix variation is minimal.

Chapter 6: 40
Ar/39
Ar Geochronology
53
The occurrences of potassium in these mylonite bands are found in matrix and relict
orthoclase and biotite, and hornblende porphyroclasts (Fig 6.2).
6.3.3 Felsic Concentrate and Biotite Separate
Both these samples are separated from mylonitized leucosomes. The potassium in this
zone is located in the K-feldspar and biotite (Fig. 6.3.a). The potassium map in (Fig 6.4.b)
confirms the only sources of potassium from this zone are K-feldspar and biotite. Visual
observations of the grains show that no biotite is found in the felsic separate, and that small
amounts of hornblende are found in the biotite separate.
6.3.4 Hornblende Separate
Hornblendes were separated from the same crushed sample as the biotite and felsic
concentrate. The hornblende porphyroclasts are not found in leucosomes therefore the they must
be from a grains adjacent to the leucosomes were also crushed and that is the source for this
sample.
Hornblende EMP analysis revealed consistent composition throughout the several grains
in all locations (Appendix B). It is noted the hornblende porphyroclasts contain biotite inclusions
which will be accounted for by determining the calcium-potassium ratio with EMP data.

Chapter 6: 40
Ar/39
Ar Geochronology
54
Figure 6.1: Sample 3.3 D: ARI a) Electron Backscatter image showing mineralogy of very fine
grained ultramylonite matrix (grain size 1-15 µm) b) Compositional map showing minerals
containing potassium: biotite, hornblende, and K-feldspar (sodium rich).
Chapter 6: 40
Ar/39
Ar Geochronology
55
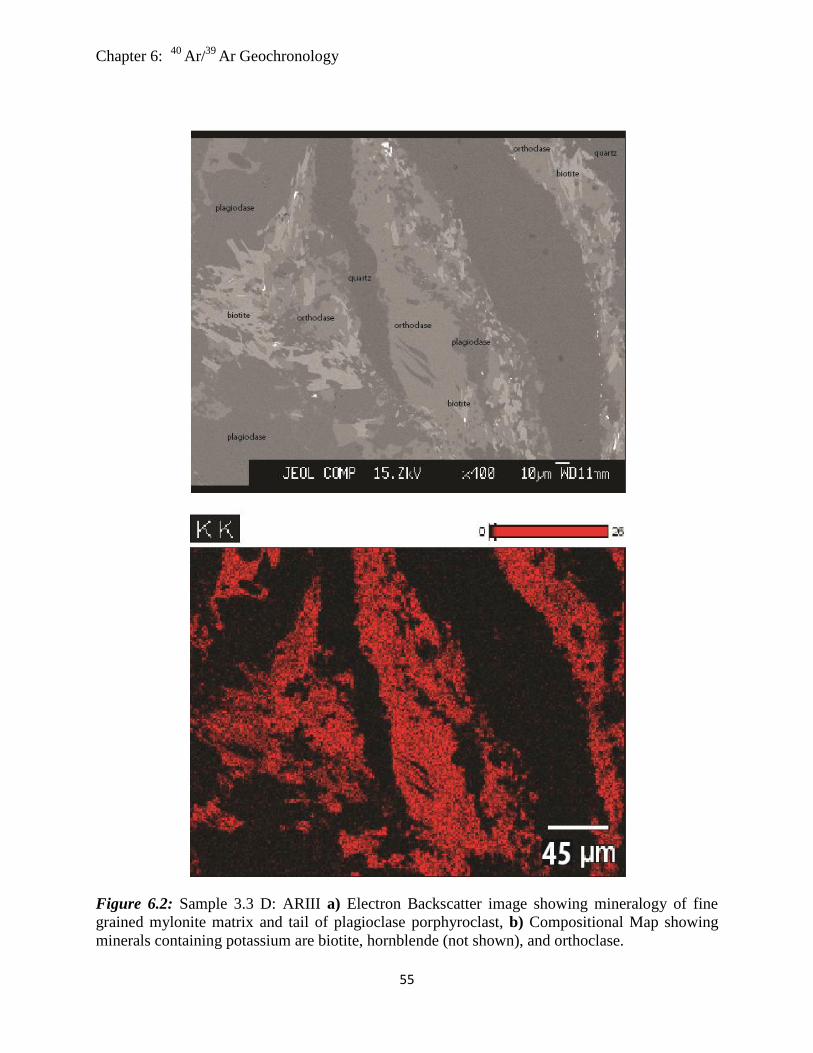
Figure 6.2: Sample 3.3 D: ARIII a) Electron Backscatter image showing mineralogy of fine
grained mylonite matrix and tail of plagioclase porphyroclast, b) Compositional Map showing
minerals containing potassium are biotite, hornblende (not shown), and orthoclase.

Chapter 6: 40
Ar/39
Ar Geochronology
56
Figure 6.3: Sample 3.3 E: Source of felsic and biotite separate for 39
Ar/40
Ar dating a) Electron
Backscatter image showing mineralogy of mylonitized leucosomes b) Compositional map
showing minerals containing potassium: K-feldspar and biotite.

Chapter 6: 40
Ar/39
Ar Geochronology
57
6.4 40
Ar/39
Ar Data
The results of the Argon study are shown in Fig 6.4. This graph shows the measured gas
of each of the six samples for which results were obtained. Individual graphs for each sample
can be found in Appendix D.
Figure 6.4: Graph showing 40
Ar/39
Ar data from samples processed. Note white bar representing
measured Ca/K in hornblende from EMP analysis. See key in lower graph for sample ID.
(Black=bulk rock sample AR I ultramylonite, red=bulk rock sample AR III mylonite, blue=bulk
rock sample AR IV mylonite, green=bulk rock sample AR V mylonite, yellow=felsic
concentrate separate, white=hornblende separate).

Chapter 6: 40
Ar/39
Ar Geochronology
58
6.4.1Bulk Rock Sample AR I Ultramylonite
Sample AR I shows a plateau at 1200 Ma. The 37
Ar/39
Ar ratio indicates hornblende gas
contributed to this age during higher temperatures of the step-wise heating process. The last 10%
of gas released is dominantly hornblende gas.
6.4.2 Bulk Rock Samples AR III – V Mylonite
The data for samples AR III-V follow the same trends. There are no plateaus in the data;
37 Ar/
39 Ar data shows a small amount of the gas released came from hornblende. The trend of the
data shows an age varying between 600 and 900 Ma until remnant gas at the end of step-heating
produces much higher ages.
6.4.3 Felsic Concentrate Separate
The felsic separate data also did not produce a plateau but the trend in the data is more
regular. The felsic separate begins at an age around 750 Ma the progressively reaches older ages
up to1400 Ma
6.4.4 Hornblende Separate
The hornblende separate produces the most regular plateau at 1025 Ma ± 19 (Fig 6.5).
This plateau occurs at the same stage as the majority of the hornblende gas is released. Fig 6.4
shows the Ca-K ratio of the EMP data is very close to that of gas produced from hornblende
therefore the age is representative of a hornblende separate with little contamination.

Chapter 6: 40
Ar/39
Ar Geochronology
59
Figure 6.5: Graph showing hornblende gas released during step-heating, revealing an age of
1025 Ma with an error of 19 Ma.
6.5 Discussion
6.5.1Bulk Rock Sample AR I Ultramylonite
Although sample AR I produced a plateau with an age of 1200 Ma, the pattern produced
is typical of excess argon or recoil. Due to this trend the data cannot be used.
6.4.3 Bulk Rock Samples AR III – V Mylonite
The trend displayed in all of these samples is interpreted to be an age that is the average
of all the minerals present (biotite, K-feldspar and hornblende) and therefore the age presented is
not a representative age of any mineral and cannot be used.

Chapter 6: 40
Ar/39
Ar Geochronology
60
6.5.3 Hornblende Separate
The plateau presented in the hornblende data (Fig 6.5) is a good representation of the age
at which hornblende closed to the diffusion of potassium and argon. The exact closure
temperature for hornblende in this system is unknown but is typically close to a temperature of
490 ºC (Faure and Mensing 2005). The mylonitization event is thought to occur at temperatures
lower then this (~450-500 ºC) from microstructure analysis and therefore the 1025 ± 19 Ma age
of the hornblende is representative of a time in the areas cooling history prior to mylonitization
of the NTLMZ.
6.5.4 Feldspar Separate
The feldspar separate data do not show a plateau providing an age. The separate does
have the advantage however that it is representing only K-feldspar which has a closure
temperature of 230 º C (Faure and Mensing 2005). The trend of the data starts at 750 Ma and
steadily rises to ages of 1400 Ma.
Although the trend does not represent a specific time in cooling history it may be
representative the polycyclic history of the area, with later thermal events resetting older ages of
K-feldspar. The latest known event in the area is the intrusion of the Grenville dyke swarm at
586 Ma (Kamo et al. 1995). A Grenville dyke is located on the southern shore of North Tea
Lake, and its close proximity could have partially reset the K-feldspar age.

Chapter 6: 40
Ar/39
Ar Geochronology
61
6.6 Summary
The 40
Ar/39
Ar study did not provide an age for the NTLMZ although ages from the
hornblende and feldspar separates are representative of the areas cooling history (McLeish
2008). The hornblende analysis specifically represents a cooling age of 1025 ± 25 Ma when the
study area was at ~500 º C.

Chapter 7: Discussion
62
CHAPTER 7: DISCUSSION
7.1 General Statement
This study presents structural, lithological, temperature, and geochronological findings
for the NTLMZ. Although the kinematics of the NTLMZ are well constrained the temperature
and age of the shear zone are left open to some interpretation. In this chapter a model to
determine the age of the NTLMZ is discussed as well as the context of the NTLMZ to the history
of the Grenville orogeny.
7.2 Age Model
The temperature of formation of the NTLMZ is still up for some debate. Titanium
content of relict and new biotite indicate mylonitization occurred at temperatures lower than the
amphibolite facies protolith (McLeish 2008). Study of the dynamic recrystallisation mechanisms
of quartz and feldspar in the mylonite suggest a temperature of 400-500 º C. Study of the glide
planes in quartz with EBSD techniques suggest a temperature of 300-400 º C. For the purpose of
this discussion the common temperature of the two methods, 400 º C will be considered the
deformation temperature of the NTLMZ.
The only reliable age produced by the 40
Ar / 39
Ar study is from the hornblende separate
which gave a cooling age of 1025 ± 19 Ma at 500 º C. This hornblende age is comparable to
hornblende ages obtained in the north of the Bonfield domain also at 1025 Ma (Cosca 1991).
If cooling continued at a rate typical of the Grenville until the mylonitization event the
age of the NTLMZ can be determined. A typical CMB cooling rate is 2-4º C Myr -1
(Cosca 1991)
and for the purpose of this model a cooling rate of 2 º C Myr -1
is assumed. Figure 7.1 plots these
variables.

Chapter 7: Discussion
63
Figure 7.1: Graph showing the age of the hornblende separate (1025 Ma or 1005 Ma) at its
closure temperature (500 ºC) and possible cooling rates of (10, 5 or 2 º C Myr -1
) until cooling
trends reach the probable temperature of mylonitization (400 º C) at which point the age of the
NLTMZ can be predicted.
If the hornblende age is 1025 Ma, with a cooling rate of 2 º C Myr -1
the mylonitization
event would have occurred at 975 Ma. With these same parameters but a hornblende age of 1005
Ma the mylonitization event would have occurred at 955 Ma.
If the cooling rate was different by 3 º C Myr -1
the age would have changed by 10 Ma,
and if the mylonitization temperature was changed by 50 º C the age of deformation would have
changed by 25 Ma. The temperature of the mylonitization is the most important variable in this
age model when using low cooling rates typical of Grenville cooling.
400
450
500
90091092093094095096097098099010001010102010301040
T (
oC
)
Time (Myr)
1025,10
1025,5
1025,2
1005,10
1005,5
1005,2

Chapter 7: Discussion
64
7.3 Late Extensional Features in the Grenville
If the NTLMZ occurred at an age of 975 – 955 Ma it is a late to post Grenvillian
extensional feature of the Grenville orogeny (1190- 980 Ma). With a typical geotherm of 25 º C
km -1
and a mylonitization temperature of 400 º C the NTLMZ would have deformed at a depth
of 16 km. In a 50 km thick crust the NTLMZ would have formed in the upper third of the crust.
Several other late Grenville extensional mylonites have been identified in the CMB (Culshaw
1985; Cosca 1991) suggesting a late orogenic extension perhaps during uplift in the CMB of the
Grenville orogeny.

Chapter 8: Conclusion
65
CHAPTER 8: CONCLUSIONS
8.1 Conclusions
1. The North Tea Lake Mylonite Zone (NTLMZ) is found conformably within the North Tea
Lake shear zone bounding the Kiosk and Bonfield domains. While the NTLSZ is thought to be a
thrust zone (McLeish 2008) the NTLMZ is an extensional feature which reactivates the NTLSZ.
2. Field observations and optical study of microstructure indicate the NTLMZ is a normal-sense
extensional shear zone with primarily simple shear in a plane strain regime. EBSD analysis
suggests a quartz flow stress of 90 MPa in the NTLMZ.
3. The extension direction of the shear zone is down dipof the foliation, this is indicated by fold
hinges which appear to have rotated parallel the dip and a best estimate of the vorticity vector to
be perpendicular dip.
4. Temperature of the NTLMZ was constrained by dynamic recrystallisation mechanisms (400-
500 º C), quartz slip planes (basal <a>, 300-500 º C) and the mineral assemblage (300-500 ºC) to
have a preferred value of 400 º C.
4. The age of the NTLMZ can be modeled from the stepwise 40
Ar/ 39
Ar degassing of hornblende
which indicates a cooling age of 1025 ± 19 Ma and with an assumed CMB cooling rate of 2 ºC
Myr -1
to have occurred between ~ 975 -955 Ma.
5. With a temperature assumption of 400 º C during mylonitization the NTLMZ deformation is
expected to have occurred at a depth of 16 km between 955 – 975 Ma with an assumed geotherm
of 25 º C per km. The hornblende age is representative of NTLSZ event, which formed in
amphibolite facies conditions (500-750 º C). With the same geotherm assumption the NTLSZ

Chapter 8: Conclusion
66
formed at depths 4-10 km greater than the NTLMZ indicating a period of exhumation in the
study area between 1025 Ma and 975 – 955 Ma.
8.2 Recommendations for Further Study
Further investigation of the NTLSZ involves follow up on the objectives of this study
with more detailed analysis. 1) A further temperature constraint could be conducted by
measuring the titanium content of quartz (Wark 2006), 2) Several samples of biotite separate
should be analyzed with 40
Ar/ 39
Ar techniques for a more direct determination of NTLMZ age
3) The EBSD data collected should be further investigated to ensure pole diagrams are presented
perpendicular the foliation and parallel extension direction and finally 4) a detailed literature
review should be carried out to relate the late extensional NTLMZ to similar features within the
CMB, CGB and Grenville province to build understanding of late orogenic processes.
67
REFERENCES
Carr, S. D., Easton, R. N., Jamieson, R. A., and Culshaw, N. G. 2000. Geologic transect across
the Grenville orogen of Ontario and New York. Canadian Journal of Earth Science, 37:
193-194.
Cosca, M. A., Sutter, J. F, and Essene, E. J. 1991. Cooling and inferred uplift/erosion history of
the Grenville orogen, Ontario: Constraints from 40
Ar/ 39
Ar Thermochronology.
Tectonics, 10: 959-977.
Culshaw, N. 2010. Aspects of the Geology of Algonquin Park.
Culshaw, N. G., Buckle folding and deep-crustal shearing of high-grade gneisses at the junction
of two major high-strain zones, Central Gneiss Belt. Grenville Province, Ontario.
Canadian Journal of Earth Sciences, 42, 1907-1925
Culshaw, N. 1987. Microstructure, c-axis pattern, microstrain, and kinematics of some S – C
mylonites in Grenville Gneiss. Journal of Structural Geology, 9: 299-311
Culshaw, N. G., Jamieson, R. A., Kethchum, W. F., Wodicka, N., Corrigan, D. & Reynolds, P.
H. (1997). Transect across the northwestern Grenville orogen, Georgian Bay, Ontario:
Polystage convergence and extension in the lower orogenic crust, Tectonics, 16: 966-
982.
Faure, G. and Mensing T. M.2005. Isotopes Principles and Applications Third Edition. John
Wiley & Sons, Inc. Hoboken, New Jersey.
68
Henry, D. J., and Guidotti, C. V. 2002.Ti in biotite from metapelitic rocks: Temperature effects,
crystallochemical controls and petrologic applications. American Mineralogist, 87: 375-
382.
Kamo, S. L., Krough, T. E, and Kumarapeli, P. S. 1995. Age of Grenville dyke swarm, Ontario-
Quebec: implications for the timing of the Iapetan rifting, Canadian Journal of Earth
Scineces, 32: 273-280
Kuiper, K.F., Deino, A., Hilgen, F.J.,Krijgsman, W.,Renne, P.R. and Wijbrans, J.R.
2008.Synchronizing rock clocks of Earth history, Science, 320: 500-504.
MacDougall, I and Harrison, T.M. 1988. Geochronology and thermochronology by the
40Ar/39Ar method. Oxford University Press, New York.
McLeish, D. F. 2008. Geology, petrology, and metamorphic history of western Algonquin Park:
Implications for the evolution of the western Grenville orogen. Senior Thesis.
Passchier, C. W., and Trouw, A. J. 2005. Micro-tectonics. Springer-Verlag Berlin Heidelberg,
Germany.
Philpotts , A., and Ague, J. 2009. Principles of Igneous and Metamorphic Petrology. Cambridge
University Press, New York.
Stipp, M., and Tullis. 2003. The recrystallised grain size piezometer for quartz. Geophys Res
Lett. 30: 2088
Vernon, R. H. 2004. A practical guide to rock microstructure, Cambridge University Press, New
York.

69
Wark, D. A., and Watson, B. 2006. TitaniQ: a titanium-in-quartz geothermometer. Contrib
Mineral Petrol. 152: 743-754

APPENDIX A: ABBREVIATIONS USED IN TEXT AND DIAGRAMS
40Ar/
39Ar- Argon-40/Argon-39 (Geochronological technique)
BLG- Bulging
CMB- Central Metasedimentary Belt
EBSD- Electron backscatter diffraction
EDS- Energy Dispersive Spectrometry
EMP- Electron Microprobe
GBM- Grain Boundary Migration
GFTZ- Grenville Front Tectonic Zone
LPO- Lattice preferred orientation
NTLMZ- North Tea Lake Mylonite Zone
NTLSZ- North Tea Lake Shear Zone
SPO- Shape preferred orientation
SGR- Subgrain rotation

Appendix B
Table B.1: Amphibole analyses
Sample 33D_ARI_1 33D_hbl_1 33D_hbl_2 33D_hbl_3 33D_hbl_4 33D_hbl_5 33D_hbl_6 33D_hbl_7 33D_hbl_8 33D_hbl_9 No. 13 72 73 74 75 76 77 78 79 80
Wt.%
SiO2 40.8802 41.3102 40.7236 40.3684 41.1165 41.313 41.2252 41.0391 41.1936 40.9642
TiO2 0.946 1.469 1.4545 0.9374 1.6999 1.7088 1.7086 1.4947 1.6983 1.4462
Al2O3 12.2459 11.7933 11.6778 12.1056 11.7555 11.6333 11.6924 11.4555 11.4534 11.722
FeO 17.9823 18.8754 19.2623 19.0707 19.0827 18.634 19.232 18.6964 18.693 19.1381
MnO 0.5116 0.801 0.8254 0.8022 0.7669 0.7558 0.7909 0.7622 0.8073 0.8024
MgO 8.7927 8.4026 8.4435 8.5989 8.6603 8.7752 8.5738 8.799 8.7038 8.6084
CaO 11.3941 11.7745 11.5198 11.6077 11.6729 11.4135 11.3002 11.5647 11.4774 11.3745
Na2O 1.704 1.6636 1.7865 1.5452 1.8297 1.9336 1.8532 1.8192 1.892 1.802
K2O 1.5016 1.7389 1.7549 1.7514 1.7463 1.6697 1.6978 1.7271 1.7517 1.8114
Cr203 0.036 0.0648 0.0692 0.0549 0.086 0.0481 0.0731 0.0648 0.049 0.0465
Total 95.9945 98.0245 97.6864 96.9965 98.6153 98.0525 98.321 97.5952 97.8857 97.8548
Cations (calculated on the basis of 23 O)
Si 6.3432 6.3340 6.2918 6.2715 6.2843 6.3248 6.3123 6.3251 6.3278 6.3050
Ti 0.1104 0.1694 0.1690 0.1095 0.1954 0.1967 0.1967 0.1732 0.1962 0.1674
Al 2.2395 2.1312 2.1264 2.2166 2.1176 2.0990 2.1100 2.0809 2.0736 2.1264
Fe 2.3335 2.4204 2.4889 2.4778 2.4392 2.3858 2.4627 2.4098 2.4014 2.4635
Mn 0.0672 0.1040 0.1080 0.1056 0.0993 0.0980 0.1026 0.0995 0.1050 0.1046
Mg 2.0336 1.9204 1.9445 1.9913 1.9730 2.0025 1.9568 2.0214 1.9929 1.9750
Ca 1.8943 1.9343 1.9069 1.9322 1.9115 1.8722 1.8539 1.9097 1.8890 1.8758
Na 0.5126 0.4946 0.5352 0.4654 0.5422 0.5740 0.5502 0.5436 0.5635 0.5378
K 0.2972 0.3401 0.3459 0.3471 0.3405 0.3261 0.3316 0.3396 0.3433 0.3557
Total 15.8316 15.8484 15.9165 15.9169 15.9029 15.8790 15.8768 15.9028 15.8926 15.9111

Table B.2: Amphibole analyses
Sample 33D_hbl_10 33D_hbl_11 33D_hbl_12 33D_hbl_13 33D_hbl_14 33D_hbl_15 33D_hbl_16 33D_hbl_17 33D_hbl_18 No. 81 82 83 84 85 86 87 88 89
Wt.%
SiO2 41.4035 41.2903 41.0683 41.0913 40.8965 41.4393 40.8676 41.4768 41.2886
TiO2 1.305 1.3053 1.4207 1.4426 0.6648 1.3068 1.4033 1.0775 1.2048
Al2O3 11.669 11.6528 11.7233 11.7808 11.9807 11.8906 11.5951 11.6668 11.5708
FeO 18.8252 18.752 18.6285 18.8515 18.8365 18.9416 18.6688 18.9618 18.8034
MnO 0.77 0.7861 0.7891 0.8384 0.7913 0.7593 0.8061 0.7774 0.742
MgO 8.7264 8.7479 8.6517 8.5589 8.9348 8.7762 8.7504 8.8302 8.8201
CaO 11.5225 11.6332 11.5257 11.5988 11.8127 11.5769 11.4928 11.5657 11.5217
Na2O 1.8114 1.7687 1.7953 1.8217 1.5317 1.7996 1.8276 1.8233 1.8685
K2O 1.7457 1.6919 1.6708 1.7014 1.6623 1.7067 1.7511 1.7423 1.7388
Cr203 0.0742 0.0648 0.0451 0.0851 0.0643 0.0278 0.0855 0.0401 0.0732
Total 97.9774 97.8002 97.4987 97.9554 97.3542 98.3221 97.4151 98.1381 97.7649
Cations (calculated on the basis of 23 O)
Si 6.3478 6.3400 6.3268 6.3137 6.3164 6.3259 6.3133 6.3535 6.3474
Ti 0.1505 0.1507 0.1646 0.1667 0.0772 0.1500 0.1630 0.1241 0.1393
Al 2.1085 2.1088 2.1286 2.1334 2.1809 2.1393 2.1111 2.1063 2.0965
Fe 2.4137 2.4080 2.4000 2.4224 2.4330 2.4182 2.4119 2.4291 2.4175
Mn 0.1000 0.1022 0.1030 0.1091 0.1035 0.0982 0.1055 0.1009 0.0966
Mg 1.9942 2.0022 1.9867 1.9602 2.0570 1.9969 2.0149 2.0162 2.0211
Ca 1.8928 1.9139 1.9024 1.9095 1.9548 1.8935 1.9022 1.8982 1.8978
Na 0.5385 0.5266 0.5362 0.5427 0.4587 0.5326 0.5474 0.5415 0.5569
K 0.3414 0.3314 0.3283 0.3335 0.3275 0.3323 0.3451 0.3405 0.3410
Total 15.8874 15.8838 15.8766 15.8911 15.9090 15.8870 15.9144 15.9102 15.9141
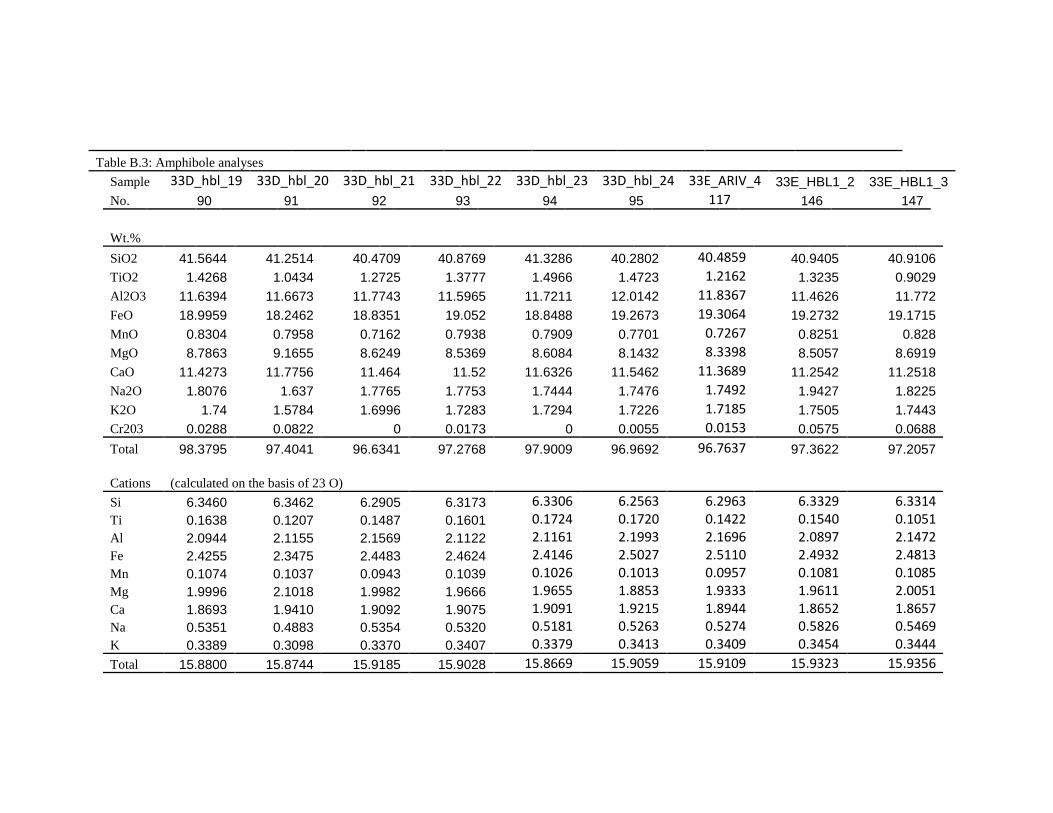
Table B.3: Amphibole analyses
Sample 33D_hbl_19 33D_hbl_20 33D_hbl_21 33D_hbl_22 33D_hbl_23 33D_hbl_24 33E_ARIV_4 33E_HBL1_2 33E_HBL1_3
No. 90 91 92 93 94 95 117 146 147
Wt.%
SiO2 41.5644 41.2514 40.4709 40.8769 41.3286 40.2802 40.4859 40.9405 40.9106
TiO2 1.4268 1.0434 1.2725 1.3777 1.4966 1.4723 1.2162 1.3235 0.9029
Al2O3 11.6394 11.6673 11.7743 11.5965 11.7211 12.0142 11.8367 11.4626 11.772
FeO 18.9959 18.2462 18.8351 19.052 18.8488 19.2673 19.3064 19.2732 19.1715
MnO 0.8304 0.7958 0.7162 0.7938 0.7909 0.7701 0.7267 0.8251 0.828
MgO 8.7863 9.1655 8.6249 8.5369 8.6084 8.1432 8.3398 8.5057 8.6919
CaO 11.4273 11.7756 11.464 11.52 11.6326 11.5462 11.3689 11.2542 11.2518
Na2O 1.8076 1.637 1.7765 1.7753 1.7444 1.7476 1.7492 1.9427 1.8225
K2O 1.74 1.5784 1.6996 1.7283 1.7294 1.7226 1.7185 1.7505 1.7443
Cr203 0.0288 0.0822 0 0.0173 0 0.0055 0.0153 0.0575 0.0688
Total 98.3795 97.4041 96.6341 97.2768 97.9009 96.9692 96.7637 97.3622 97.2057
Cations (calculated on the basis of 23 O)
Si 6.3460 6.3462 6.2905 6.3173 6.3306 6.2563 6.2963 6.3329 6.3314 Ti 0.1638 0.1207 0.1487 0.1601 0.1724 0.1720 0.1422 0.1540 0.1051 Al 2.0944 2.1155 2.1569 2.1122 2.1161 2.1993 2.1696 2.0897 2.1472 Fe 2.4255 2.3475 2.4483 2.4624 2.4146 2.5027 2.5110 2.4932 2.4813 Mn 0.1074 0.1037 0.0943 0.1039 0.1026 0.1013 0.0957 0.1081 0.1085 Mg 1.9996 2.1018 1.9982 1.9666 1.9655 1.8853 1.9333 1.9611 2.0051 Ca 1.8693 1.9410 1.9092 1.9075 1.9091 1.9215 1.8944 1.8652 1.8657 Na 0.5351 0.4883 0.5354 0.5320 0.5181 0.5263 0.5274 0.5826 0.5469 K 0.3389 0.3098 0.3370 0.3407 0.3379 0.3413 0.3409 0.3454 0.3444
Total 15.8800 15.8744 15.9185 15.9028 15.8669 15.9059 15.9109 15.9323 15.9356

Table B.4: Amphibole analyses
Sample 33D_hbl_19 33D_hbl_20 33D_hbl_21 33D_hbl_22 33D_hbl_23 33D_hbl_24 33E_ARIV_4 33E_HBL1_2 33E_HBL1_3
No. 90 91 92 93 94 95 117 146 147
Wt.%
SiO2 41.5644 41.2514 40.4709 40.8769 41.3286 40.2802 40.4859 40.9405 40.9106
TiO2 1.4268 1.0434 1.2725 1.3777 1.4966 1.4723 1.2162 1.3235 0.9029
Al2O3 11.6394 11.6673 11.7743 11.5965 11.7211 12.0142 11.8367 11.4626 11.772
FeO 18.9959 18.2462 18.8351 19.052 18.8488 19.2673 19.3064 19.2732 19.1715
MnO 0.8304 0.7958 0.7162 0.7938 0.7909 0.7701 0.7267 0.8251 0.828
MgO 8.7863 9.1655 8.6249 8.5369 8.6084 8.1432 8.3398 8.5057 8.6919
CaO 11.4273 11.7756 11.464 11.52 11.6326 11.5462 11.3689 11.2542 11.2518
Na2O 1.8076 1.637 1.7765 1.7753 1.7444 1.7476 1.7492 1.9427 1.8225
K2O 1.74 1.5784 1.6996 1.7283 1.7294 1.7226 1.7185 1.7505 1.7443
Cr203 0.0288 0.0822 0 0.0173 0 0.0055 0.0153 0.0575 0.0688
Total 98.3795 97.4041 96.6341 97.2768 97.9009 96.9692 96.7637 97.3622 97.2057
Cations (calculated on the basis of 23 O)
Si 6.3460 6.3462 6.2905 6.3173 6.3306 6.2563 6.2963 6.3329 6.3314 Ti 0.1638 0.1207 0.1487 0.1601 0.1724 0.1720 0.1422 0.1540 0.1051 Al 2.0944 2.1155 2.1569 2.1122 2.1161 2.1993 2.1696 2.0897 2.1472 Fe 2.4255 2.3475 2.4483 2.4624 2.4146 2.5027 2.5110 2.4932 2.4813 Mn 0.1074 0.1037 0.0943 0.1039 0.1026 0.1013 0.0957 0.1081 0.1085 Mg 1.9996 2.1018 1.9982 1.9666 1.9655 1.8853 1.9333 1.9611 2.0051 Ca 1.8693 1.9410 1.9092 1.9075 1.9091 1.9215 1.8944 1.8652 1.8657 Na 0.5351 0.4883 0.5354 0.5320 0.5181 0.5263 0.5274 0.5826 0.5469 K 0.3389 0.3098 0.3370 0.3407 0.3379 0.3413 0.3409 0.3454 0.3444
Total 15.8800 15.8744 15.9185 15.9028 15.8669 15.9059 15.9109 15.9323 15.9356
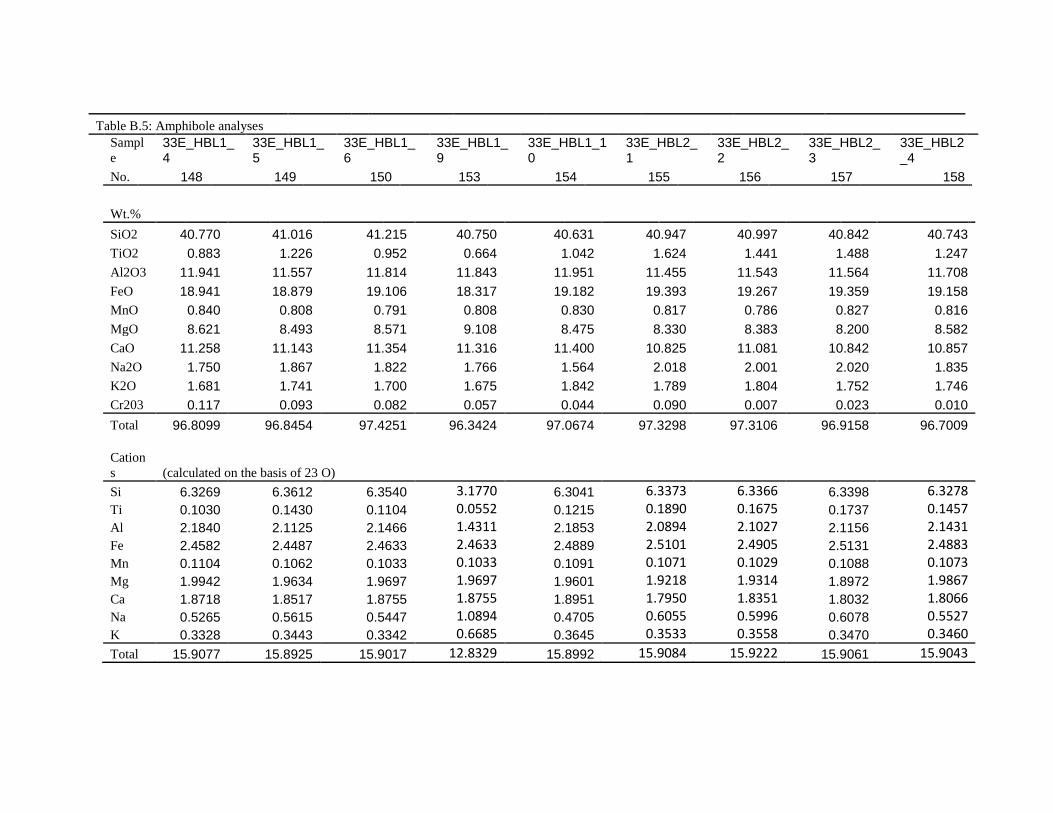
Table B.5: Amphibole analyses
Sampl
e 33E_HBL1_4
33E_HBL1_5
33E_HBL1_6
33E_HBL1_9
33E_HBL1_10
33E_HBL2_1
33E_HBL2_2
33E_HBL2_3
33E_HBL2_4
No. 148 149 150 153 154 155 156 157 158
Wt.%
SiO2 40.770 41.016 41.215 40.750 40.631 40.947 40.997 40.842 40.743
TiO2 0.883 1.226 0.952 0.664 1.042 1.624 1.441 1.488 1.247
Al2O3 11.941 11.557 11.814 11.843 11.951 11.455 11.543 11.564 11.708
FeO 18.941 18.879 19.106 18.317 19.182 19.393 19.267 19.359 19.158
MnO 0.840 0.808 0.791 0.808 0.830 0.817 0.786 0.827 0.816
MgO 8.621 8.493 8.571 9.108 8.475 8.330 8.383 8.200 8.582
CaO 11.258 11.143 11.354 11.316 11.400 10.825 11.081 10.842 10.857
Na2O 1.750 1.867 1.822 1.766 1.564 2.018 2.001 2.020 1.835
K2O 1.681 1.741 1.700 1.675 1.842 1.789 1.804 1.752 1.746
Cr203 0.117 0.093 0.082 0.057 0.044 0.090 0.007 0.023 0.010
Total 96.8099 96.8454 97.4251 96.3424 97.0674 97.3298 97.3106 96.9158 96.7009
Cation
s (calculated on the basis of 23 O)
Si 6.3269 6.3612 6.3540 3.1770 6.3041 6.3373 6.3366 6.3398 6.3278 Ti 0.1030 0.1430 0.1104 0.0552 0.1215 0.1890 0.1675 0.1737 0.1457 Al 2.1840 2.1125 2.1466 1.4311 2.1853 2.0894 2.1027 2.1156 2.1431 Fe 2.4582 2.4487 2.4633 2.4633 2.4889 2.5101 2.4905 2.5131 2.4883 Mn 0.1104 0.1062 0.1033 0.1033 0.1091 0.1071 0.1029 0.1088 0.1073 Mg 1.9942 1.9634 1.9697 1.9697 1.9601 1.9218 1.9314 1.8972 1.9867 Ca 1.8718 1.8517 1.8755 1.8755 1.8951 1.7950 1.8351 1.8032 1.8066 Na 0.5265 0.5615 0.5447 1.0894 0.4705 0.6055 0.5996 0.6078 0.5527 K 0.3328 0.3443 0.3342 0.6685 0.3645 0.3533 0.3558 0.3470 0.3460
Total 15.9077 15.8925 15.9017 12.8329 15.8992 15.9084 15.9222 15.9061 15.9043

Appendix C
EMP data for Biotite
Table C.1: Biotite analyses
No. 14 15 16 42 43 64 65 66 67 105
Wt.%
SiO2 34.66 36.73 36.54 36.34 35.89 37.91 43.06 38.22 36.49 36.47
TiO2 15.14 15.64 15.80 15.01 15.65 15.11 17.32 15.67 14.87 14.86
Al2O3 2.03 1.99 1.08 2.03 0.93 2.02 1.39 2.24 2.52 2.67
FeO 17.96 15.92 17.06 16.61 17.09 16.32 13.91 15.55 16.23 18.17
MnO 0.52 0.38 0.44 0.45 0.42 0.52 0.54 0.50 0.57 0.49
MgO 14.12 12.73 14.21 13.25 14.46 13.32 10.88 13.01 12.96 12.01
CaO 0.07 0.05 0.04 0.04 0.09 0.06 0.03 0.06 0.03 0.00
Na2O 0.04 0.02 0.03 0.01 0.02 0.03 0.16 0.05 0.04 0.04
K2O 7.14 8.67 8.73 9.20 8.13 9.25 10.56 9.86 9.41 9.46
Cr203 0.00 0.00 0.00 0.00 0.00 0.04 0.01 0.03 0.06 0.00
Total 91.66 92.13 93.93 92.95 92.67 94.60 97.92 95.24 93.25 94.22
Cations Pfu (22 oxygen)
Si 6.015 5.806 6.399 3.200 5.822 5.730 5.715 5.828 6.013 5.749
Ti 1.742 1.763 1.582 0.791 1.828 1.814 1.860 1.756 1.710 1.815
Al 0.352 0.448 0.383 0.255 0.400 0.445 0.333 0.450 0.539 0.384
Fe 1.905 2.081 1.764 1.764 2.100 2.274 2.333 2.233 2.136 2.281
Mn 0.043 0.043 0.031 0.031 0.051 0.059 0.063 0.053 0.049 0.069
Mg 3.088 3.153 2.857 2.857 2.979 2.961 3.032 2.872 2.572 3.016
Ca 0.028 0.019 0.000 0.000 0.017 0.008 0.014 0.014 0.004 0.004
Na 0.076 0.015 0.030 0.061 0.028 0.014 0.011 0.034 0.020 0.011
K 1.711 1.772 1.565 3.130 1.876 1.874 1.803 1.935 1.948 1.843
Total 14.960 15.100 14.626 12.089 15.102 15.178 15.165 15.175 14.991 15.172
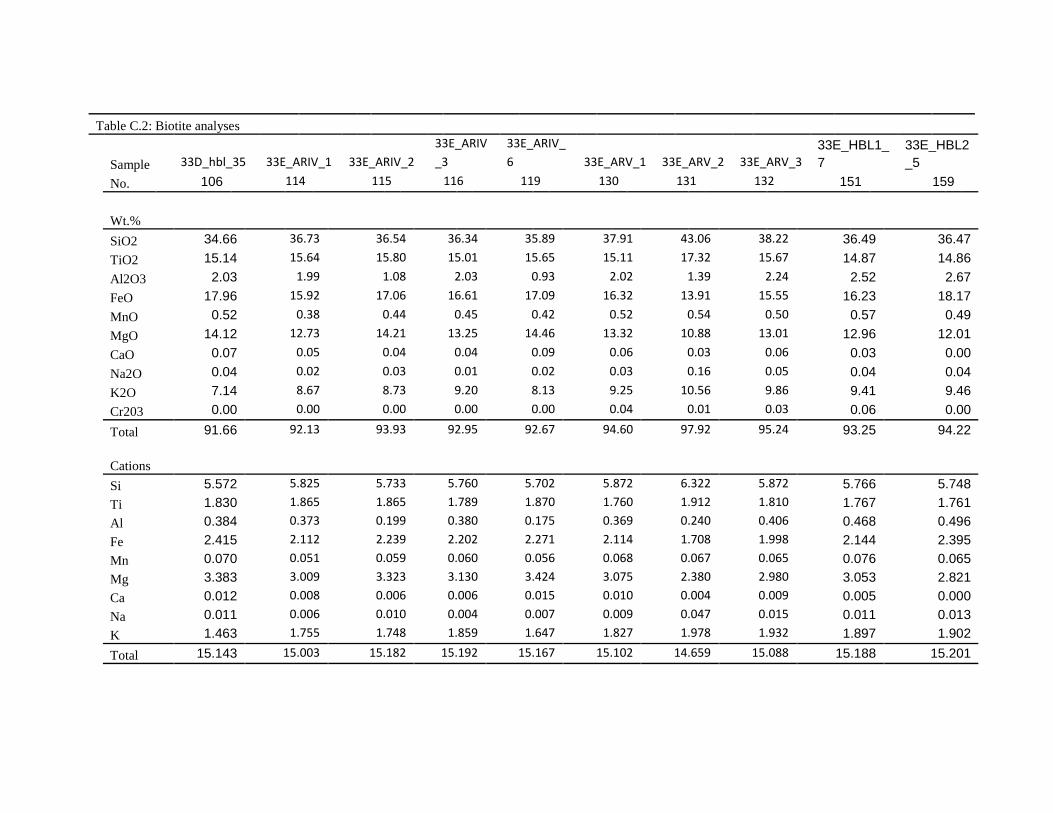
Table C.2: Biotite analyses
Sample 33D_hbl_35 33E_ARIV_1 33E_ARIV_2
33E_ARIV
_3
33E_ARIV_
6 33E_ARV_1 33E_ARV_2 33E_ARV_3
33E_HBL1_
7
33E_HBL2
_5
No. 106 114 115 116 119 130 131 132 151 159
Wt.%
SiO2 34.66 36.73 36.54 36.34 35.89 37.91 43.06 38.22 36.49 36.47
TiO2 15.14 15.64 15.80 15.01 15.65 15.11 17.32 15.67 14.87 14.86
Al2O3 2.03 1.99 1.08 2.03 0.93 2.02 1.39 2.24 2.52 2.67
FeO 17.96 15.92 17.06 16.61 17.09 16.32 13.91 15.55 16.23 18.17
MnO 0.52 0.38 0.44 0.45 0.42 0.52 0.54 0.50 0.57 0.49
MgO 14.12 12.73 14.21 13.25 14.46 13.32 10.88 13.01 12.96 12.01
CaO 0.07 0.05 0.04 0.04 0.09 0.06 0.03 0.06 0.03 0.00
Na2O 0.04 0.02 0.03 0.01 0.02 0.03 0.16 0.05 0.04 0.04
K2O 7.14 8.67 8.73 9.20 8.13 9.25 10.56 9.86 9.41 9.46
Cr203 0.00 0.00 0.00 0.00 0.00 0.04 0.01 0.03 0.06 0.00
Total 91.66 92.13 93.93 92.95 92.67 94.60 97.92 95.24 93.25 94.22
Cations
Si 5.572 5.825 5.733 5.760 5.702 5.872 6.322 5.872 5.766 5.748
Ti 1.830 1.865 1.865 1.789 1.870 1.760 1.912 1.810 1.767 1.761
Al 0.384 0.373 0.199 0.380 0.175 0.369 0.240 0.406 0.468 0.496
Fe 2.415 2.112 2.239 2.202 2.271 2.114 1.708 1.998 2.144 2.395
Mn 0.070 0.051 0.059 0.060 0.056 0.068 0.067 0.065 0.076 0.065
Mg 3.383 3.009 3.323 3.130 3.424 3.075 2.380 2.980 3.053 2.821
Ca 0.012 0.008 0.006 0.006 0.015 0.010 0.004 0.009 0.005 0.000
Na 0.011 0.006 0.010 0.004 0.007 0.009 0.047 0.015 0.011 0.013
K 1.463 1.755 1.748 1.859 1.647 1.827 1.978 1.932 1.897 1.902
Total 15.143 15.003 15.182 15.192 15.167 15.102 14.659 15.088 15.188 15.201

Table C.3: Biotite analyses
Sample 33E_HBL2_6 33E_Bt_1 33E_Bt_2 33E_Bt_3 33E_Bt_4 33E_Bt_5 33E_Bt_6 33E_Bt_7 33E_Bt_8 33E_Bt_9
No. 160 170 171 172 173 174 175 176 177 178
Wt.%
SiO2 33.13 36.29 36.39 36.13 36.33 34.97 36.63 38.80 36.30 36.62
TiO2 15.25 15.14 14.91 14.38 15.18 15.31 15.25 15.77 14.47 14.99
Al2O3 1.93 3.53 3.37 2.61 3.41 2.81 3.11 3.01 3.03 2.96
FeO 19.90 19.82 19.09 19.38 18.08 18.67 17.26 16.41 18.30 16.70
MnO 0.46 0.53 0.50 0.52 0.50 0.43 0.47 0.44 0.57 0.43
MgO 14.20 10.72 10.97 11.08 11.09 12.61 11.90 11.26 10.96 11.99
CaO 0.09 0.11 0.03 0.05 0.02 0.03 0.03 0.03 0.02 0.03
Na2O 0.02 0.03 0.04 0.01 0.04 0.02 0.08 0.08 0.05 0.04
K2O 5.31 9.46 9.62 9.25 9.67 7.82 9.72 10.19 9.06 9.57
Cr203 0.00 0.06 0.07 0.07 0.06 0.05 0.02 0.06 0.06 0.00
Total 90.29 95.73 95.04 93.55 94.54 92.77 94.70 96.12 92.98 93.54
Cations
Si 5.427 5.671 5.714 5.776 5.717 5.585 5.733 5.923 5.800 5.780
Ti 1.878 1.780 1.761 1.729 1.796 1.839 1.795 1.811 1.739 1.779
Al 0.373 0.650 0.624 0.492 0.633 0.528 0.573 0.542 0.571 0.551
Fe 2.726 2.591 2.507 2.591 2.378 2.494 2.259 2.095 2.445 2.204
Mn 0.064 0.070 0.067 0.071 0.067 0.059 0.062 0.058 0.077 0.058
Mg 3.467 2.497 2.566 2.640 2.600 3.002 2.777 2.561 2.611 2.821
Ca 0.015 0.019 0.005 0.008 0.004 0.006 0.005 0.004 0.003 0.005
Na 0.006 0.008 0.011 0.003 0.012 0.006 0.024 0.023 0.016 0.011
K 1.110 1.886 1.927 1.886 1.940 1.592 1.941 1.983 1.847 1.926
Total 15.067 15.171 15.182 15.194 15.147 15.111 15.168 14.999 15.108 15.134

Table C.4: Biotite analyses
Sample 33E_Bt_10 33E_Bt_11 33E_Bt_12 33E_Bt_13 33E_Bt_14
No. 179 180 181 182 183
Wt.%
SiO2 36.39 36.36 35.77 36.57 36.84
TiO2 15.22 14.93 15.25 14.94 14.96
Al2O3 3.14 3.16 3.52 2.76 3.86
FeO 17.45 17.70 17.99 17.80 17.21
MnO 0.43 0.47 0.49 0.53 0.49
MgO 12.23 11.85 11.87 12.07 11.62
CaO 0.04 0.05 0.08 0.04 0.05
Na2O 0.02 0.04 0.03 0.03 0.03
K2O 9.45 9.41 9.04 9.45 9.87
Cr203 0.04 0.06 0.06 0.07 0.03
Total 94.53 94.08 94.16 94.28 94.97
Cations
Si 5.699 5.725 5.632 5.751 5.728
Ti 1.792 1.767 1.806 1.767 1.749
Al 0.579 0.587 0.653 0.511 0.707
Fe 2.286 2.331 2.369 2.341 2.238
Mn 0.057 0.062 0.065 0.070 0.064
Mg 2.855 2.782 2.785 2.828 2.693
Ca 0.006 0.009 0.013 0.007 0.008
Na 0.007 0.012 0.011 0.009 0.009
K 1.887 1.891 1.815 1.895 1.957
Total 15.167 15.166 15.149 15.178 15.152

Appendix D.1 Bulk Rock Sample - AR 1 Ultramylonite T°C 39Ar(mV) 39Ar(%) AGE (Ma)±1σ % ATM 37Ar/39Ar 36Ar/40Ar 39Ar/40Ar % IIC 650 200.7 11.5 972.6 ± 4.6 10.1 0.4 0.000345 0.003186 0.03750 90.7 5.2 1205 ± 4.9 1 0.21 0.000036 0.002639 0.01775 114.1 6.5 1210.3 ± 5.6 1.3 0.21 0.000045 0.002616 0.01800 129.1 7.4 1209 ± 5.5 1 0.23 0.000037 0.002626 0.02825 105.9 6.1 1199.7 ± 4.6 1.1 0.29 0.00004 0.002652 0.02850 86.7 4.9 1181.7 ± 4.9 1.2 0.45 0.00004 0.002707 0.03875 78.8 4.5 1165.7 ± 4.7 1.3 0.66 0.000044 0.002754 0.05900 98.7 5.6 1187.1 ± 5 1.3 0.79 0.000046 0.002685 0.06950 195.9 11.2 1184.1 ± 5 1.6 0.79 0.000057 0.002686 0.061000 359.2 20.6 1180.2 ± 4.7 1.7 0.92 0.000057 0.002698 0.071050 166.5 9.5 1167.6 ± 18.3 2.34 1.6 0.000081 0.002718 0.131100 47.8 2.7 1435.1 ± 6.3 5.4 5.3 0.000183 0.001972 0.421150 47.2 2.7 1684.4 ± 6.7 5.7 6.37 0.000193 0.001548 0.491200 3 0.1 2322.7 ± 17.4 34.8 1.36 0.001178 0.000629 0.091250 3.9 0.2 2394.9 ± 17.9 32.4 1.62 0.001098 0.000617 0.111300 7.9 0.4 1948.7 ± 17.8 39 1.75 0.001322 0.000794 0.131325 0.5 0 2278.7 ± 131 80.1 0.74 0.002711 0.000198 0.05
TOTAL GAS AGE = 1198.1 ± 9.8 Ma J = .002536 ± 2.536E-05 37Ar/39Ar, 36Ar/40Ar AND 39Ar/40Ar ARE CORRECTED FOR MASS SPECTROMETERDISCRIMINATION, INTERFERING ISOTOPES AND SYSTEM BLANKS % IIC - INTERFERING ISOTOPES CORRECTION

Appendix D.2 Bulk Rock Sample - AR 3 Mylonite T°C 39Ar(mV) 39Ar(%) AGE (Ma)±1σ % ATM 37Ar/39Ar 36Ar/40Ar 39Ar/40Ar % IIC 550 91.6 2 626.3 ± 2.6 2.1 0.1 0.000071 0.006007 0.01600 230.2 5.1 647.8 ± 2.8 1 0.09 0.000036 0.005833 0.01650 510.8 11.4 694.7 ± 2.9 0.4 0.08 0.000015 0.005397 0700 585.4 13.1 788 ± 3.5 1.9 0.08 0.000064 0.004561 0750 563 12.6 858.9 ± 3.8 0.2 0.1 0.000007 0.004167 0.01800 483.7 10.8 883.1 ± 3.7 0.2 0.14 0.000007 0.004024 0.01850 412.3 9.2 802.8 ± 3.6 0.4 0.21 0.000014 0.004525 0.02900 466.4 10.4 764.7 ± 3.3 0.2 0.26 0.000009 0.004812 0.02950 517 11.6 867.9 ± 3.7 0.2 0.31 0.000008 0.004112 0.031000 347.6 7.8 1014.5 ± 4.3 0.3 0.53 0.000013 0.003361 0.041050 142.6 3.2 1203.5 ± 4.6 0.1 0.81 0.000005 0.00268 0.061100 48.8 1 1719.6 ± 9.5 0.8 1.81 0.000028 0.001584 0.131150 32.4 0.7 2317.1 ± 7.9 1.2 3.32 0.000043 0.000962 0.241200 5.9 0.1 3235.6 ± 19 5.1 4.73 0.000175 0.000481 0.321250 2.9 0 3396 ± 34.8 7.2 6.47 0.000245 0.000424 0.441300 2.3 0 3468.8 ± 73.1 15 7.44 0.000508 0.00037 0.51320 0.3 0 39.4 ± 51 25.1 0 0.000849 0.086366 0
TOTAL GAS AGE = 872.5 ± 7.2 Ma J = .002548 ± 2.548E-05 37Ar/39Ar, 36Ar/40Ar AND 39Ar/40Ar ARE CORRECTED FOR MASS SPECTROMETERDISCRIMINATION, INTERFERING ISOTOPES AND SYSTEM BLANKS % IIC - INTERFERING ISOTOPES CORRECTION

Appendix D.3 Bulk Rock Sample - AR 4 Mylonite T°C 39Ar(mV) 39Ar(%) AGE (Ma)±1σ % ATM 37Ar/39Ar 36Ar/40Ar 39Ar/40Ar % IIC 600 157.9 6.5 833.8 ± 75.8 0.7 0.09 0.000023 0.004313 0650 376.4 15.5 677.8 ± 2.9 0.4 0.07 0.000015 0.00557 0700 377.3 15.5 773.2 ± 3.6 4.4 0.08 0.000151 0.004556 0750 396.3 16.3 816.6 ± 3.4 0.1 0.1 0.000005 0.00445 0800 247.1 10.2 771.6 ± 3.2 0.2 0.16 0.000009 0.004768 0.01850 199.2 8.2 735.8 ± 3.1 0.4 0.2 0.000015 0.005045 0.02900 217.5 8.9 776.8 ± 3.2 0.5 0.2 0.000018 0.004716 0.02950 179.7 7.4 836.1 ± 3.4 0.5 0.24 0.000019 0.004304 0.021000 101.4 4.1 881.4 ± 3.7 0.8 0.36 0.000027 0.004017 0.031050 54.8 2.2 938.4 ± 4.1 1 0.46 0.000036 0.003699 0.041100 30.8 1.2 1053.9 ± 4.4 1.6 0.67 0.000057 0.003161 0.061150 25 1 1177.4 ± 5.3 2.3 0.69 0.000079 0.002707 0.051200 18.5 0.7 1249.3 ± 5.7 3.3 0.69 0.000115 0.002468 0.051250 10.7 0.4 1404.6 ± 9.7 8.9 1.17 0.000302 0.001972 0.091300 19.6 0.8 1066 ± 5.9 11.3 0.41 0.000383 0.002809 0.031320 7 0.2 1313.8 ± 12 21.1 2.82 0.000714 0.001879 0.23
TOTAL GAS AGE = 800.7 ± 12.1 Ma J = .002553 ± 2.553E-05 37Ar/39Ar, 36Ar/40Ar AND 39Ar/40Ar ARE CORRECTED FOR MASS SPECTROMETERDISCRIMINATION, INTERFERING ISOTOPES AND SYSTEM BLANKS % IIC - INTERFERING ISOTOPES CORRECTION

Appendix D.4 Bulk Rock Sample - AR 5 Mylonite T°C 39Ar(mV) 39Ar(%) AGE (Ma)±1σ % ATM 37Ar/39Ar 36Ar/40Ar 39Ar/40Ar % IIC 550 45.2 1.6 613.8 ± 2.7 1.7 0.17 0.000059 0.006194 0.01600 161.3 5.8 609.4 ± 2.6 1 0.09 0.000034 0.006292 0.01650 373.7 13.4 664.8 ± 3.5 0.5 0.08 0.000017 0.005705 0700 414 14.8 752 ± 3.4 3.3 0.07 0.000114 0.004773 0750 374.8 13.4 805.6 ± 3.4 0.3 0.08 0.00001 0.004524 0800 304.1 10.9 779 ± 3.3 0.2 0.13 0.000008 0.004719 0.01850 276.4 9.9 718.3 ± 3 0.3 0.17 0.000012 0.005205 0.01900 274.1 9.8 737.1 ± 3.1 0.4 0.19 0.000013 0.005042 0.02950 277.4 9.9 832.4 ± 3.4 0.3 0.29 0.000011 0.004343 0.021000 154.1 5.5 899.1 ± 3.6 0.4 0.63 0.000015 0.003937 0.051050 72.4 2.6 981.2 ± 4 0.6 1.31 0.000023 0.003511 0.121100 18.7 0.6 1172.5 ± 6.5 2 1.4 0.00007 0.002733 0.121150 12.8 0.4 1329.4 ± 6 3.4 2.29 0.000118 0.002263 0.181200 4.7 0.1 1517.4 ± 13 7 3.05 0.000239 0.0018 0.241250 13.3 0.4 1337.8 ± 8.9 14.7 1.81 0.000498 0.001982 0.141300 0.9 0 1822.4 ± 89 35.1 3.98 0.001188 0.000949 0.31320 0.8 0 1632 ± 135 45.3 7.56 0.001536 0.000948 0.59
TOTAL GAS AGE = 771.1 ± 6.6 Ma J = .002556 ± 2.556E-05 37Ar/39Ar, 36Ar/40Ar AND 39Ar/40Ar ARE CORRECTED FOR MASS SPECTROMETERDISCRIMINATION, INTERFERING ISOTOPES AND SYSTEM BLANKS % IIC - INTERFERING ISOTOPES CORRECTION

Appendix D.5 FELSIC CONCENTRATE ARGON SUMMARY T°C 39Ar(mV) 39Ar(%) AGE (Ma)±1σ % ATM 37Ar/39Ar 36Ar/40Ar 39Ar/40Ar % IIC 550 80.5 0.8 647.6 ± 2.8 0.6 0.14 0.00002 0.005901 0.01600 260.7 2.9 819.1 ± 3.3 0.4 0.25 0.000016 0.00444 0.02650 486.8 5.4 785.8 ± 3.3 0.3 0.17 0.000011 0.004681 0.01700 661.1 7.3 755 ± 3.2 2 0.04 0.000068 0.004834 0750 704.5 7.8 768.1 ± 3.2 0.2 0.03 0.000007 0.004821 0800 612.4 6.8 800.6 ± 3.3 0.2 0.03 0.000009 0.004578 0850 538 5.9 832.7 ± 3.6 0.2 0.03 0.000007 0.004361 0900 542.4 6 887.5 ± 3.7 0.2 0.02 0.000008 0.004024 0950 651.8 7.2 953.4 ± 3.9 0.2 0.02 0.000008 0.003672 01000 720.6 8 1047.7 ± 4.3 0.3 0.02 0.000011 0.003245 01050 804 8.9 1126.3 ± 4.4 0.3 0.03 0.000013 0.002946 01100 812.9 9 1262.8 ± 4.9 0.3 0.04 0.000013 0.002519 01150 1196.6 13.3 1349.8 ± 5.1 0.4 0.02 0.000015 0.002293 01200 740.4 8.2 1305.3 ± 4.9 0.4 0.01 0.000014 0.002404 01250 169.1 1.8 1650.9 ± 6.2 4.5 0.12 0.000153 0.001635 01300 0.6 0 3003.6 ± 92.1 19.8 0.58 0.000671 0.000479 0.041325 0.9 0 3502 ± 130 14.4 1.02 0.000489 0.000367 0.07
TOTAL GAS AGE = 1049.8 ± 8.3 Ma J = .002565 ± 2.565E-05 37Ar/39Ar, 36Ar/40Ar AND 39Ar/40Ar ARE CORRECTED FOR MASS SPECTROMETERDISCRIMINATION, INTERFERING ISOTOPES AND SYSTEM BLANKS % IIC - INTERFERING ISOTOPES CORRECTION

Appendix D.6 HORNBLENDE ARGON SUMMARY T°C 39Ar(mV) 39Ar(%) AGE (Ma)±1σ % ATM 37Ar/39Ar 36Ar/40Ar 39Ar/40Ar % IIC 600 32.6 2.2 1421.8 ± 5.4 4.2 0.91 0.000142 0.002053 0.07700 71.8 4.8 1076 ± 6.1 14.7 0.43 0.0005 0.002685 0.03750 60.4 4.1 1071.1 ± 4.6 1.7 0.13 0.000058 0.003115 0.01775 38.2 2.5 1056 ± 5.6 1.3 0.11 0.000046 0.003185 0.01800 29.8 2 1070.1 ± 4.6 1.4 0.11 0.000048 0.003128 0850 36.6 2.4 1090.1 ± 4.8 1.7 0.14 0.000057 0.003044 0.01900 50.7 3.4 1093.8 ± 4.7 1.6 0.46 0.000056 0.003031 0.04925 47.5 3.2 1088.9 ± 4.7 1.2 0.74 0.000041 0.003063 0.06950 84.1 5.7 1060.8 ± 4.6 0.5 1.52 0.000019 0.003192 0.13975 146.6 9.9 1033.2 ± 4.5 0.3 2.09 0.00001 0.003314 0.181000 205.8 13.9 1021.9 ± 4.5 0.1 2.33 0.000006 0.003366 0.211025 179.3 12.1 1025.5 ± 4.5 0.1 2.33 0.000004 0.003353 0.211050 255.9 17.3 1028.1 ± 4.5 0 2.5 0.000002 0.003344 0.221075 58.4 3.9 1077.4 ± 4.8 0.3 2.12 0.000011 0.003134 0.181100 49.8 3.3 1044.5 ± 44 0.4 2.26 0.000015 0.003262 0.21150 80.7 5.4 1097.5 ± 4.7 0.4 2.47 0.000015 0.003054 0.211200 23.4 1.5 1204.5 ± 6.6 1.7 1.84 0.00006 0.002658 0.151250 17.4 1.1 1197.4 ± 27.2 7.3 1.86 0.000247 0.002528 0.151300 1.4 0 2286.7 ± 73.8 13.8 1.99 0.000467 0.000867 0.141325 2.4 0.1 2337.2 ± 107 10.5 2.82 0.000357 0.000866 0.2
TOTAL GAS AGE = 1066.7 ± 9 Ma J = .002571 ± 2.571E-05 37Ar/39Ar, 36Ar/40Ar AND 39Ar/40Ar ARE CORRECTED FOR MASS SPECTROMETERDISCRIMINATION, INTERFERING ISOTOPES and SYSTEM BLANKS % IIC - INTERFERING ISOTOPES CORRECTION