Embed Size (px)
Citation preview

1
POLITECNICO DI TORINO
DIMEAS -Dipartimento di Ingegneria per l'Ambiente e il Territorio
Corso Di Laurea Magistrale
In Ingegneria del Petrolio (Petroleum Engineering)
Tesi di Laurea Magistrale
Structural Health Monitoring of Offshore Jacket Platforms
Supervisor
...........................
Prof. CECILIA SURACE
Candidate
...........................
MARIE BELLE GHSOUB

2
TABLE OF CONTENTS
TABLE OF CONTENTS ....................................................................................................... 2
1. INTRODUCTION ....................................................................................................... 3
2. SHM APPROACH IDENTIFICATION ........................................................................ 5
2.1. SHM PHASES ........................................................................................................ 6
2.2. EXPERTISE APPLIED IN A SHM SYSTEM ........................................................... 9
3. SHM TECHNIQUES ................................................................................................ 10
3.1. LOCAL DAMAGE DETECTION TECHNIQUES ................................................... 10
3.2. GLOBAL DAMAGE DETECTION TECHNIQUES ................................................ 11
3.3. ACTIVE AND PASSIVE SENSING ....................................................................... 14
4. OFFSHORE PLATFORM STRUCTURES ............................................................... 16
4.1. CODES AND STANDARDS ................................................................................. 16
4.2. OFFSHORE JACKET PLATFORM CATEGORIES .............................................. 23
4.3. OFFSHORE JACKET PLATFORM FAILURE MODES ........................................ 27
5. SHM APPROACH FOR AN OFFSHORE JACKET PLATFORM ............................ 39
5.1. PLANNING PHASE .............................................................................................. 41
5.2. DATA COLLECTION PHASE .............................................................................. 45
5.2.1. DATA COLLECTION TECHNOLOGIES 50
5.2.2. VIBRATION-BASED DAMAGE DETECTION TECHNIQUE 54
5.3. DATA PROCESSING PHASE .............................................................................. 58
5.3.1. NUMERICAL ANALYSIS AND STRATEGIES 61
5.4. EVALUATION PHASE ......................................................................................... 76
6. CONCLUSION ........................................................................................................ 79
I. ACKNOWLEDGMENT ............................................................................................ 80
II. REFERENCES ........................................................................................................ 81
3
1. INTRODUCTION
The existence of great amount of jacket platforms all around the world with estimated
30 years of operational lifetime is a fair reason to study new technologies for its life
extension. The prolongation lifetime studies are a consequence of factors like cost
saving and increased practices of the subsea connection between new oil and gas
discoveries and a present production facility.
SHM is an important utensil for assessing the structural integrity and its lifetime
endurance. Thus, it is a method applying strategies to detect damages for lots of
engineering fields. SHM installation will possibly affect cost installation, nonetheless it
will save operational money and maintenance in the long term. As a result,
improvements of sensors efficiencies and costs are done in the SHM field. On top of
the integrity evaluation, SHM also is a tool to enhance the designed criteria based on
historical data.
The aim of the thesis is to describe and investigate the SHM techniques and
strategies, in addition to developed monitoring applications of offshore jackets in cost-
effective approaches.
The thesis will include ideas about the knowledge of SHM fields and specially of
offshore structures, methods involving steps of monitor planning, data collection,
processing data and integrity evaluation, labeling and identifying failure modes types
and the parameters influencing them, citations of adequate sensors to detect the
influenced parameters and explanation of their procedure measurement techniques,
in addition to their suitability.
In the followed chapters, the introduction will be divided in five divisions, starting with
some existing general knowledge about SHM, in addition to explanation of prior
definitions of this field. Later on, information and facts will be detailed concerning the
design concept, parameters damage and failure modes of offshore jackets structures.
4
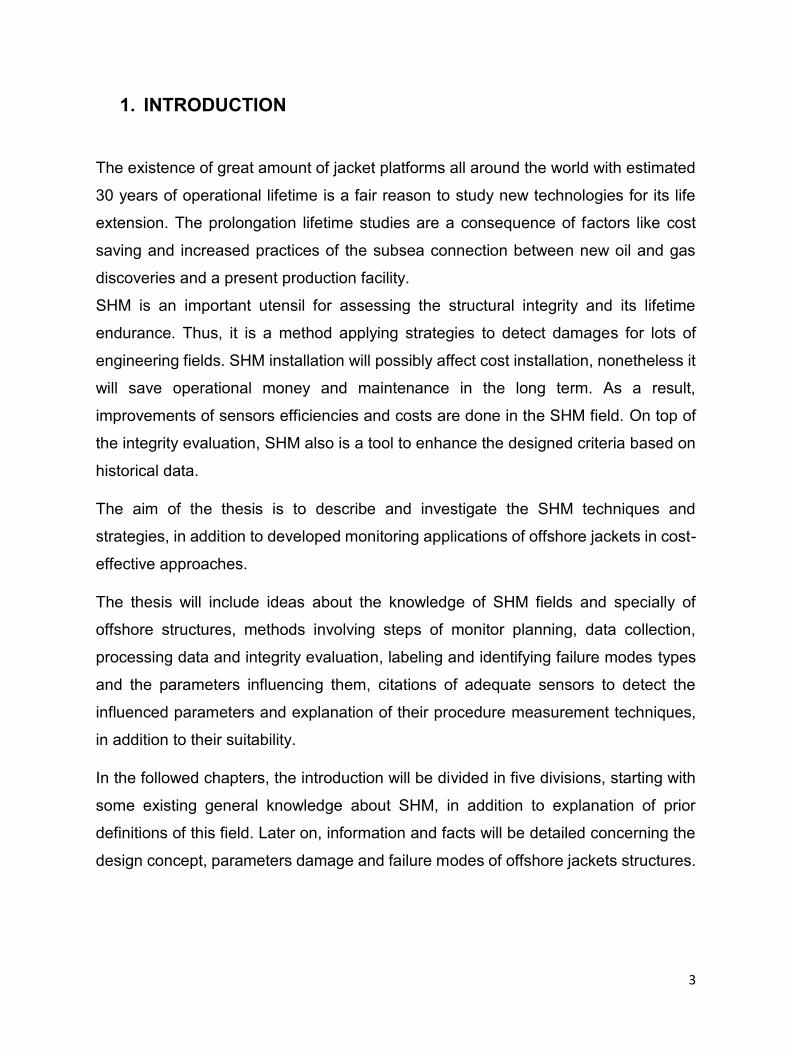
Figure 1: Model of jacket platform [94].
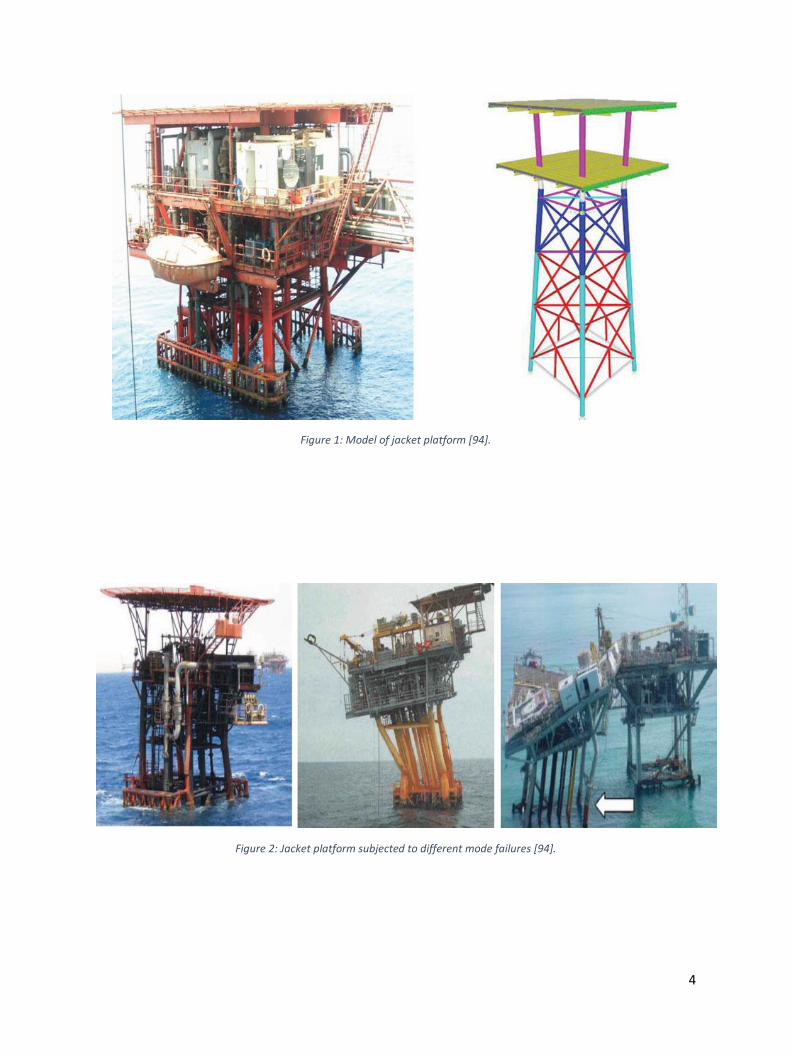
Figure 2: Jacket platform subjected to different mode failures [94].
5
2. SHM APPROACH IDENTIFICATION
Structural Health Monitoring methods describe the process of the application of
strategies and techniques for damage detection and damage classification of an
exposed structure to continuous changes. These variations are the cause of ageing
processes, environmental influences and also by unpredicted events such as
earthquakes or wind buffeting.
These methods have been significant in many different industries: the aerospace
industry, offshore industries, civil engineering and mechanical engineering. For
instance, bridge monitoring testing techniques are relevant to those techniques on
offshore structures. Yet offshore structure monitoring is more challenging than other
industries due to the surrounding rough environment.
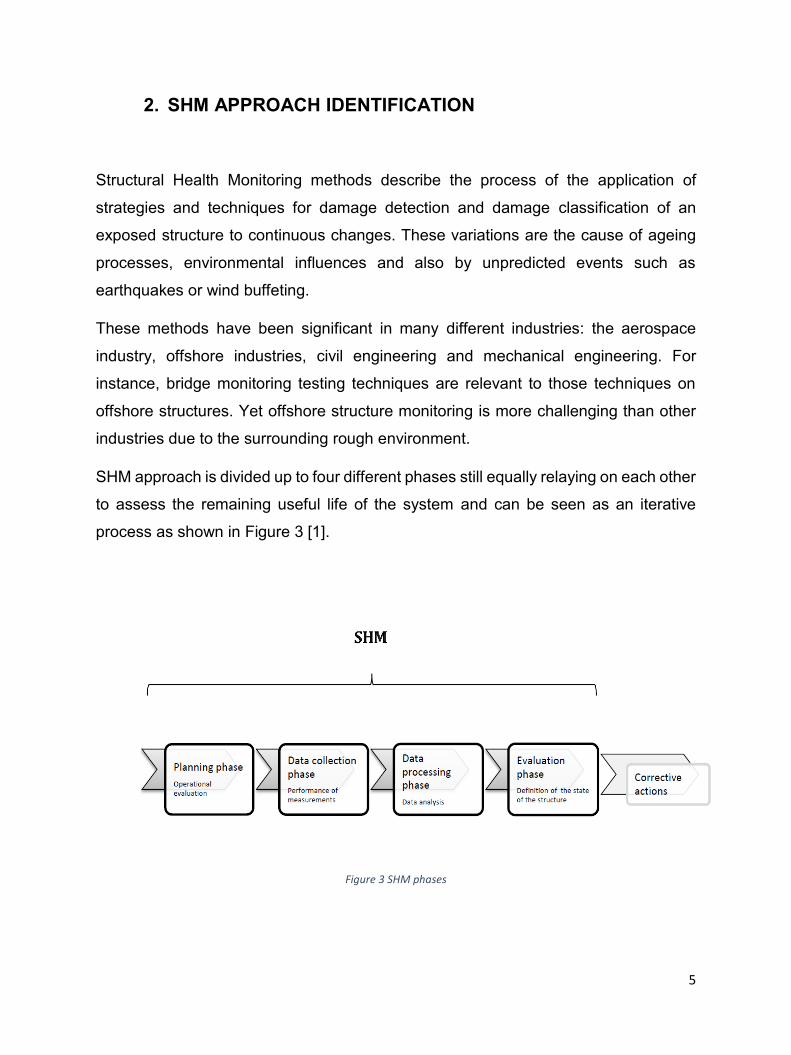
SHM approach is divided up to four different phases still equally relaying on each other
to assess the remaining useful life of the system and can be seen as an iterative
process as shown in Figure 3 [1].
Figure 3 SHM phases

6
2.1. SHM PHASES
Planning phase
The planning phase is the start of all the SHM phases, also the part that involves
developing a plan and setting a strategy once the scope is known and monitoring is
required.
The following key questions are substantial to achieve a coherent assessment
process:
- When do we need to monitor?
- Why do we want to monitor? (Reason)
- What do we want to monitor? (Set strategy)
- How do we want to monitor? (Develop a plan)
Installing a SHM system brings together all aspects of the planning cycle into a clear
and unified process. Thereby it will help to ensure that the plan is well focused,
resilient, practical, and most important cost-effective.
This implies the importance to acquire information about the motive, in order to
establish the failure modes and monitoring techniques, and mainly to reduce costs
and risks. Furthermore, costs and human risk can be reduced when using an
operational SHM system as a substitute to remote operating vehicles (ROV) and
human divers.
Data collection phase
Data collection phase is the process of gathering and measuring information. It is an
actual monitoring process establishes on facilitating answers. It involves selecting the
measuring methods, the sensor types, number and locations, and the data
acquisition/storage/transmittal hardware.
7
The data acquisition system digitalizes the analogue sensor signals, applies some
form of data filtering, transmits the data, records the data and stores the data for further
analysis. Frequently, the host processor that commands the hardware running these
functions will also be the processor that is used to analyses data in the following SHM
phases.
Data collection timing interval is a fundamental part to the acquisition process as well
as data storage capacity. It is dependent on the nature of the failure mode and
proportionally to the amount of data required as well. It means that the higher the
sampling data, the higher the capacity storage needed. Then again, sampling data
could be proceeded in a continuous or periodic interval. Periodic measurement will
decrease the amount of data collected and automatically will decrease the storage
capacity, nonetheless continuous measurement is sometimes needed.
As an example, if SHM operation is to measure fatigue crack growth, it may be
essential to monitor continuously the variations in the structural characteristics at
relatively short time intervals once the identification of some cracks is critical.
Also, an important manipulation is done by normalization of the data for the suitability
of analysis and assessments. As an example, when data are raw, no process can be
done for assessment. So, database is constructed to provide better processing
methods by collecting more data sources. Attention for problems producing misleading
results, thus, they are caused by the poor quality of data prepared.
Data Processing phase
Data processing phase is carried out to extract information from collected data and to
be able to evaluate them.
These data are subjected to several processing methods, but the most applied method
is based on Fourier Transform (FT), and it basically transforms data signals retrieved
from sensors from time domain to frequency domain.
On the other hand, the output needs to be interpreted so it can provide meaningful
information. Therefore, choosing the valuable data among a massive quantity of data

8
retrieved is a challenge toward identifying the damage indicator since its sensitivity
depends on the damage from vibration response.
Evaluation phase
The evaluation of the processed data is the last step in stating the situation of the
structure according to norms and standards, in addition to estimate the immediate
outcomes as well as the long-term impact upon the structure overall performance.
Numerical models may be applied to categorize and quantify the damage. Damage
identification methods can be sorted out in four levels [2].
Level 1: Determination that damage is present in the structure
Level 2: Level 1 plus determination of the geometric location of the damage
Level 3: Level 2 plus quantification of the severity of the damage
Level 4: Level 3 plus prediction of the remaining service life of the structure
9
2.2. EXPERTISE APPLIED IN A SHM SYSTEM
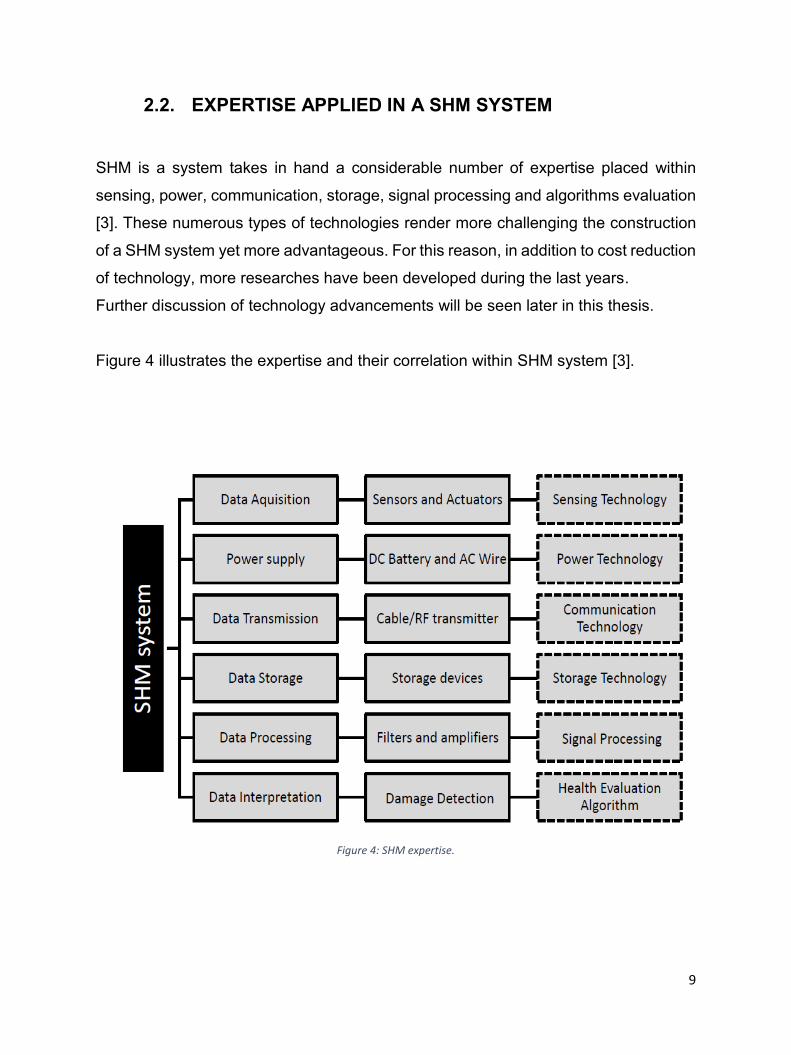
SHM is a system takes in hand a considerable number of expertise placed within
sensing, power, communication, storage, signal processing and algorithms evaluation
[3]. These numerous types of technologies render more challenging the construction
of a SHM system yet more advantageous. For this reason, in addition to cost reduction
of technology, more researches have been developed during the last years.
Further discussion of technology advancements will be seen later in this thesis.
Figure 4 illustrates the expertise and their correlation within SHM system [3].
Figure 4: SHM expertise.
10
3. SHM TECHNIQUES
3.1. LOCAL DAMAGE DETECTION TECHNIQUES
Local damage detection is obtained by non-destructive testing (NDT) techniques that
keep, in unaltered condition, the structure being inspected. It is the most used
measuring technique in the offshore industry today.
The most frequently used NDT tests are visual, acoustic, magnetic field, strain
measurement, eddy current etc.
Local damage techniques are subjected to restriction in detecting damage where the
sensor is fixed. The sensors only detect damage at their position or near the surface
and require the vicinity of a theoretically known damage and to be very accessible to
the examined element. Hence, the application of sensors or manual examination
points needs to be high.
However, surface measurements achieved by most NDT techniques cannot supply
facts concerning the condition of the internal parts without costly disassembling of the
structure.
Even though the damage detection is only on the component examined, they may still
be in some point effective in sort of localizing the damage when it is first detected
confronted to global damage techniques that requires additional analysis to pinpoint
any damage [2].
11
3.2. GLOBAL DAMAGE DETECTION TECHNIQUES Global damage detection techniques can identify damage that affects the overall
structure or large portions of the structure.
The utmost common global damage detection technique is vibration-based damage
detection. This technique uses the variation in dynamic characteristics between an
initial state (baseline) and experimental results to pinpoint and quantify damage.
Dynamic characteristics can for example be modal frequencies and mode shapes and
can provide information of mass, flexibility and damping of the structure.
Initial assumptions can be obtained from primary testing when structure is in an
undamaged condition otherwise they can be calculated in a Finite Element Model (FE-
model).
The experimental results are achieved from accelerometers placed on the disturbed
structure by either measurable excitation or natural/ambient excitation. On the other
hand, the vibration-based damage detection is not capable to enumerate and focalize
minor damage in an efficient manner in contrast to the local measuring techniques [4].
As per identifying on which ground the method of SHM should be based on, it is
documented that global damage is separated into two types of damages: linear and
non-linear.
Linear damage is distinguished from a non-linear one when the structure endures a
linear-elastic behavior even after the occurrence of change in the assembly. In this
case, the variation in dynamic characteristics is ascribed to the alterations of both the
material and the geometry of the assembly. The linear equation of motion is employed
to calculate the effect of the latter process. Furthermore, the approach applied in this
case play on the reduction in stiffness [5].
In the manner of alternatives, a non-linear behavior occurs after the experience of
change in the assembly at the time when the initial behavior was linear-elastic. For
instance, the aperture and the closure of fatigue cracks are samples of non-linear
damage.
Correspondently to the two types cited before, linear damage detection lay on two
additional sub-types: parametric and non-parametric [5].
12
Wherein the parametric is model fixed in which the shape of data is assumed, thus
only the coefficients of the model are to be estimated. Consequently, the non-
parametric is non-model fixed in which the shape of data is not assumed, therefore
the appropriate model in consort with the coefficients are to be estimated.
Referring to the four levels discussed earlier in section 2.1, which are basically termed
as a requisite for the global damage detection methodology, there are progressive
problem and the regressive problem. Fittingly, the progressive problem which stands
for detecting damage by the utilization of a damage indicant is linked to level 1.
Followed by the regressive problem where damage severity in addition to damage
location are evaluated. Thus, it resides in both level 2 and 3. In the last place comes
level 4, which is linked to fracture mechanics. It includes the study of the crack
propagation and the remaining life service of the damage structure [5].
Vibration-based damage detection appears to be a greater challenge to acquire the
top reliable damage indicant. According to some collected works, a number of damage
indicants are purported like mode shapes, natural frequencies, changes in modal
strain energy and adjustments to certain allowed standards.
As it has been clarified, detection technique based on vibrancy perturbations bring into
play the dynamic characteristics of the assembly. It is levelheaded when the vibration
as an input and the perturbation as an output could be measurable.
For example, it is difficult to determine the excitation measurement of an operational
bridge ascribable to constant traffic. Recording the dynamic perturbation of a bridge
structure is done with the use of accelerometers without the unknown input as ambient
loading. In such a way, the prospect to obtain the modes of the structure and to
compare the recorded dynamic characteristics with the prior measurements of the
bridge once it was new is possible.
13
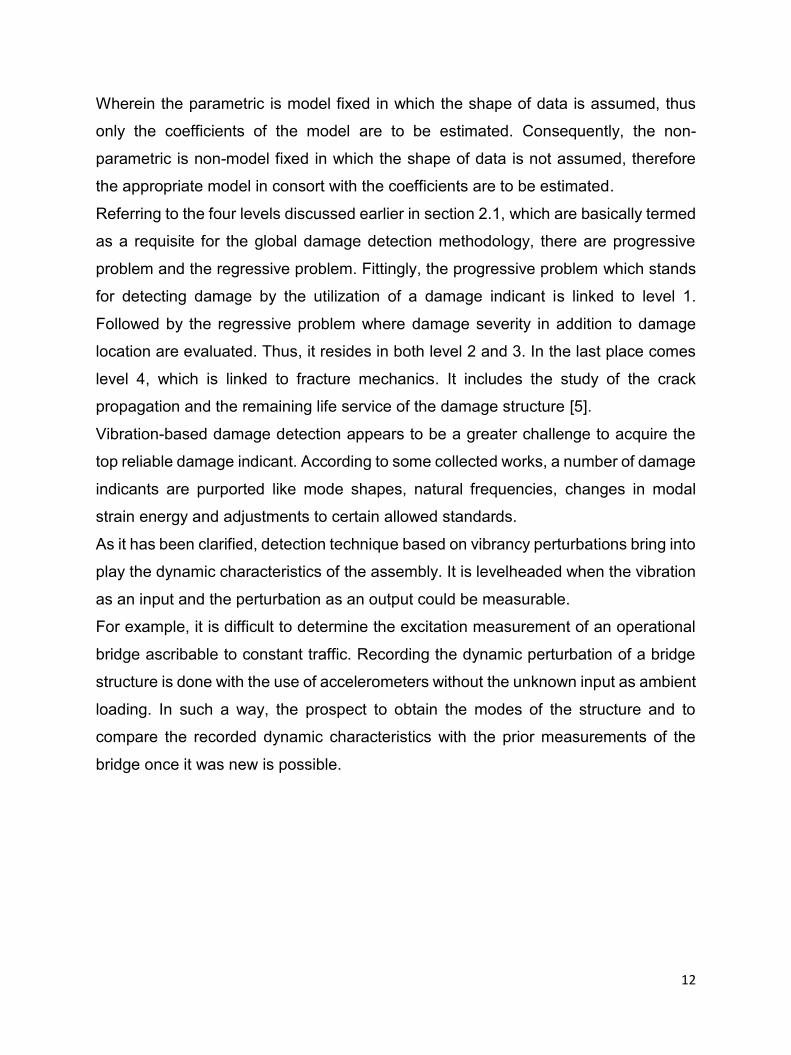
Despite the fact that
global damage technique
previously discussed has
been mostly operated in
civil structures, yet
engineers has not used it
unaided. It is frequently
associated with local
damage techniques.
This Global-local-
integrated damage
detection approach
consists of a regular
monitoring using NDT
techniques, such as
acoustic emission,
temperature and strain
measurements with the
support of developed
wireless sensing
networks (WSN).
Figure 5 shows the
integration of global and
local damage detection
technique [6].
Figure 5: Global-local-integrated damage detection method.
14
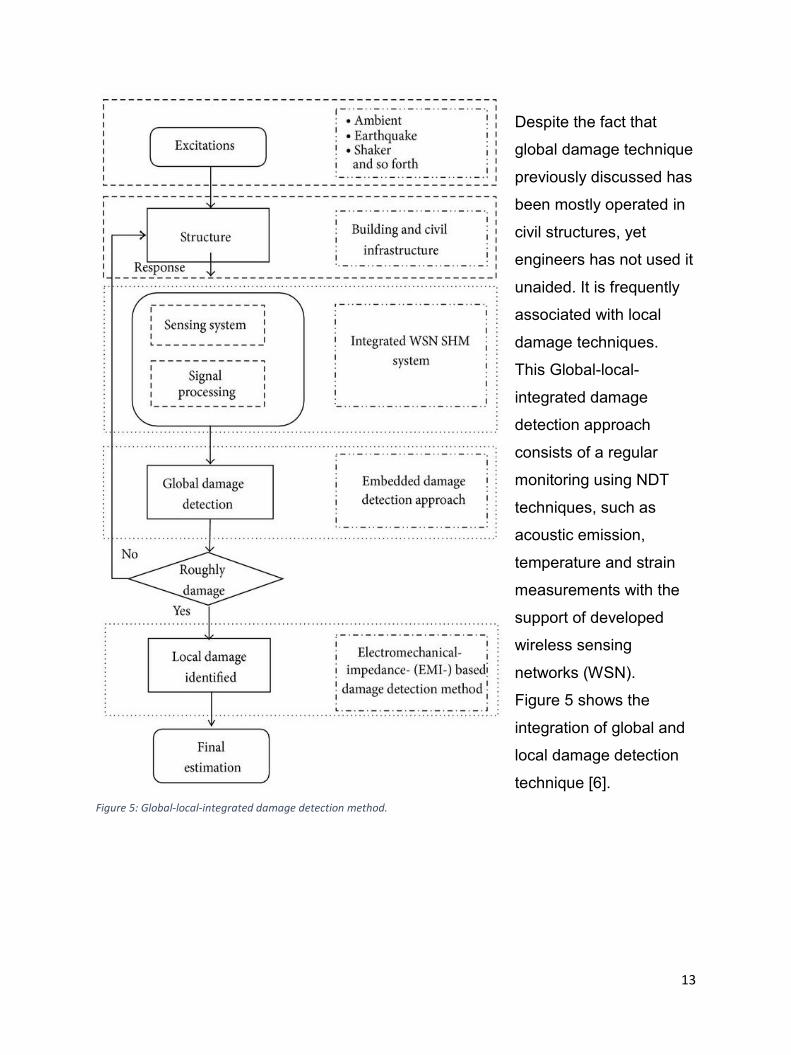
3.3. ACTIVE AND PASSIVE SENSING Active sensing is determined by means of transmitting energy that needs an external
source of power to function. Oppositely to active sensing, passive sensing transmits
energy from natural sources. It basically perceives and reacts to certain sort of input
from the physical environment.
Figure 6: Attitude of the experimenter in a) passive b) active monitoring.
The major dissimilarity between these sensing mechanisms is that active sensing
burdens a significant amount of energy measured up to passive sensing. This implies
that if the procedure of measurements depends on batteries, the passive sensors
would be more advantageous. Notwithstanding what has been said, the passive
sensing is considered a major drawback because it counts on getting energy from
natural sources. Thus, it brings out a significant amount of noise within the collected
data. To all appearances, Non-Destructive Testing (NDT) falls into an active and
passive SHM evaluation.
Figure 6 shows the distinct prospective of both passive and active monitoring,
involving the experimenter and the examined structure. The latter is fitted out with
15
sensors and linked up with nearby environment, in order that its physical parameter
and its state are progressing [7].
If passive monitoring is summoned, the experimentalist must monitor this evolvement
on the account of the implanted sensors. In this case, it comes across some SHM
techniques like acoustic emission.
On the other hand, if active monitoring is required, the experimentalist needs to
monitor the structure with both actuators and sensors. The actuator causes changes
in the structure and monitoring response using sensors embedded on the structure.
Some cases in point for passive monitoring, the extension of a loaded structure or the
presence of a destructive impact. At whatever time the examination becomes active,
the mentioned examples require the addition of an emitter of ultrasonic waves to the
acoustic emission detector. Here, damage detection signals are registered by the
receiver from the interaction of the emitted waves and the damage structure.
As for fiber-optic technique, the sensor and actuator can be naturally diverse or similar,
like excitation by a piezoelectric patch and detecting waves or adding another
piezoelectric patch.
On the other hand, a good observation is noted in the flexibility of piezoelectric
transducer techniques. Accordantly, these devices can alternate between emitting and
receiving.

16
4. OFFSHORE PLATFORM STRUCTURES This section concentrates more on offshore platform categories in addition to their
failure modes highlighted by codes and standards. Not to forget the important
information related to offshore structure selection and jackets design.
4.1. CODES AND STANDARDS
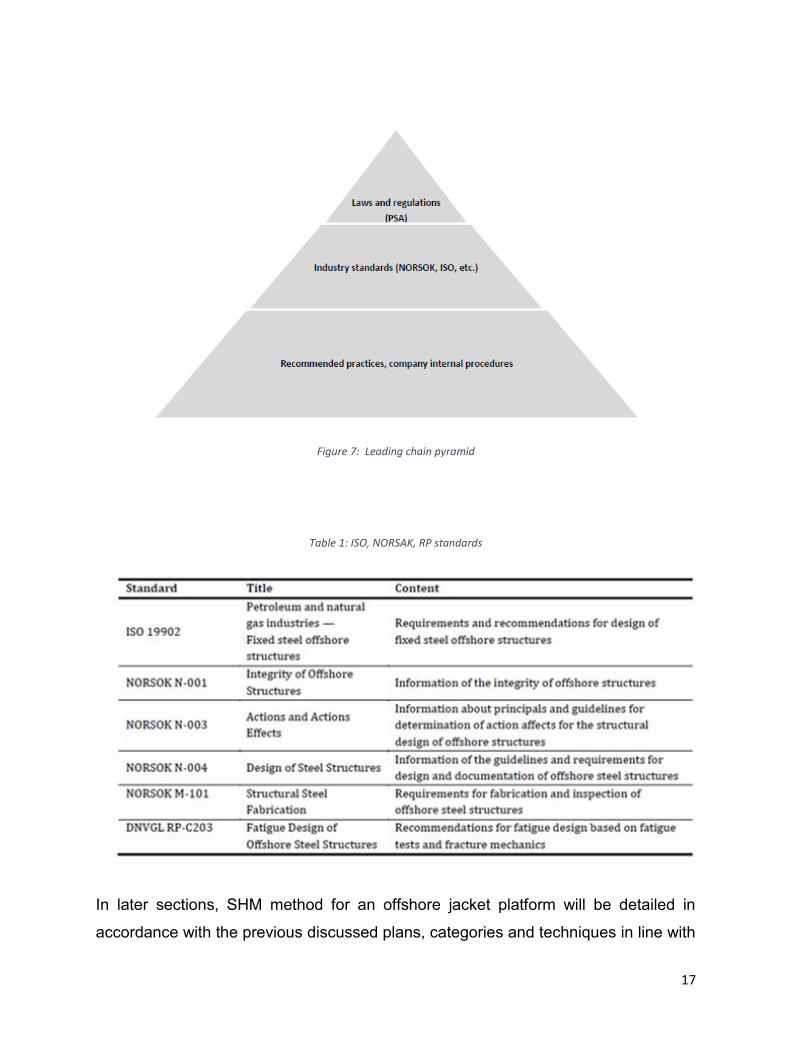
A leading chain of command pyramid outlooking the approved design according to
some recommended standards is represented in Figure 7.
On top of the pyramid comes laws and regulations responsible for the operational
fields, safety and emergency preparation in petroleum industries. For example, in
Norway, the Petroleum Safety Authority (PSA) is a governmental guiding authority that
provides industries standards with guidelines to achieve the necessary requirements
regarding health, safety and environment in petroleum activities.
In consequence, the industry standards put a set of norms followed by the members
of the oil industry concerning the effectiveness and the operational standards in the oil
field production. As a case in point, ISO standards is one of the organization with
international general standards. Whereas NORSOK organization is an exemplar on
guidelines established particularly for offshore structures in Norway.
In the last part of the pyramid, the company internal procedures assist the system with
clarifying the standards by the recommended practices.
Here are certain catalogued standards based on a combination of NORSOK and ISO
standards with DNV GL recommended practice, in which they are listed in Table 1
concerning design procedures and the integrity evaluation of jacket structures [8] [9]
[10] [11] [12] [13].
17
Figure 7: Leading chain pyramid
Table 1: ISO, NORSAK, RP standards
In later sections, SHM method for an offshore jacket platform will be detailed in
accordance with the previous discussed plans, categories and techniques in line with
18
the standards provided by the leading chain of command in oil and gas fields. But
firstly, besides these tactics, some examples on the existing monitoring situation and
some valuable SHM projects are revealed and recapped.
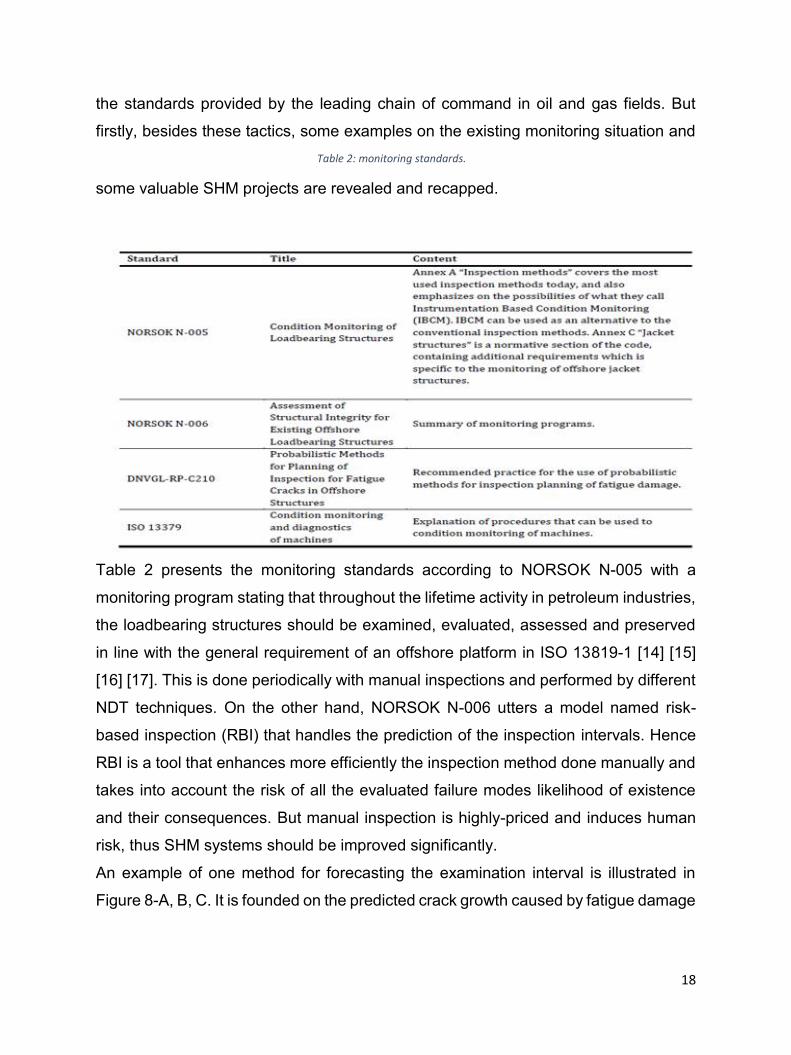
Table 2 presents the monitoring standards according to NORSOK N-005 with a
monitoring program stating that throughout the lifetime activity in petroleum industries,
the loadbearing structures should be examined, evaluated, assessed and preserved
in line with the general requirement of an offshore platform in ISO 13819-1 [14] [15]
[16] [17]. This is done periodically with manual inspections and performed by different
NDT techniques. On the other hand, NORSOK N-006 utters a model named risk-
based inspection (RBI) that handles the prediction of the inspection intervals. Hence
RBI is a tool that enhances more efficiently the inspection method done manually and
takes into account the risk of all the evaluated failure modes likelihood of existence
and their consequences. But manual inspection is highly-priced and induces human
risk, thus SHM systems should be improved significantly.
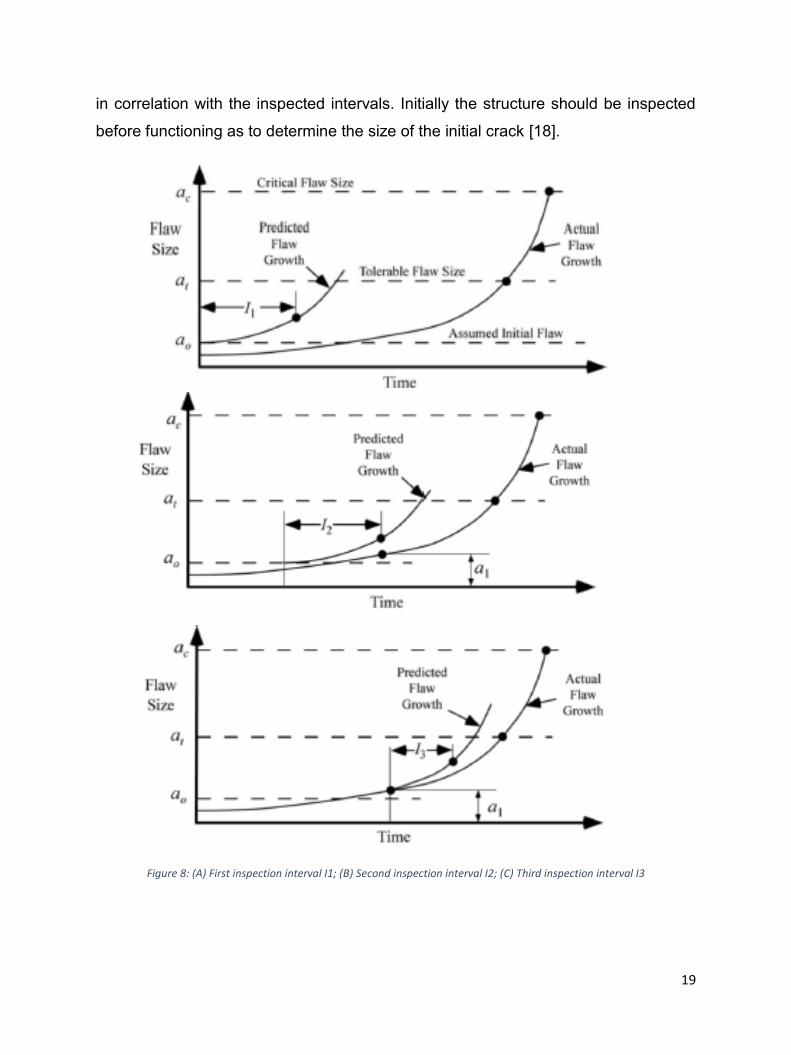
An example of one method for forecasting the examination interval is illustrated in
Figure 8-A, B, C. It is founded on the predicted crack growth caused by fatigue damage
Table 2: monitoring standards.
19
in correlation with the inspected intervals. Initially the structure should be inspected
before functioning as to determine the size of the initial crack [18].
Figure 8: (A) First inspection interval I1; (B) Second inspection interval I2; (C) Third inspection interval I3

20
The actual crack growth is represented by the lower curve whereas the other curve
determines the predicted crack growth. The allowable crack size range needs to be
within the largest crack size (a0) missed by NDT techniques and the acceptable crack
size (at) otherwise it enters the critical crack zone. Inspection time is calculated when
the crack size increases from (a0) to (at) and the first inspection time must be within
this time limit. If another crack size (a1) is detected, a new calculation should be
required to forecast the second inspecting time for the crack to propagate from (a1) to
(at) and therefore a new time limit is defined.
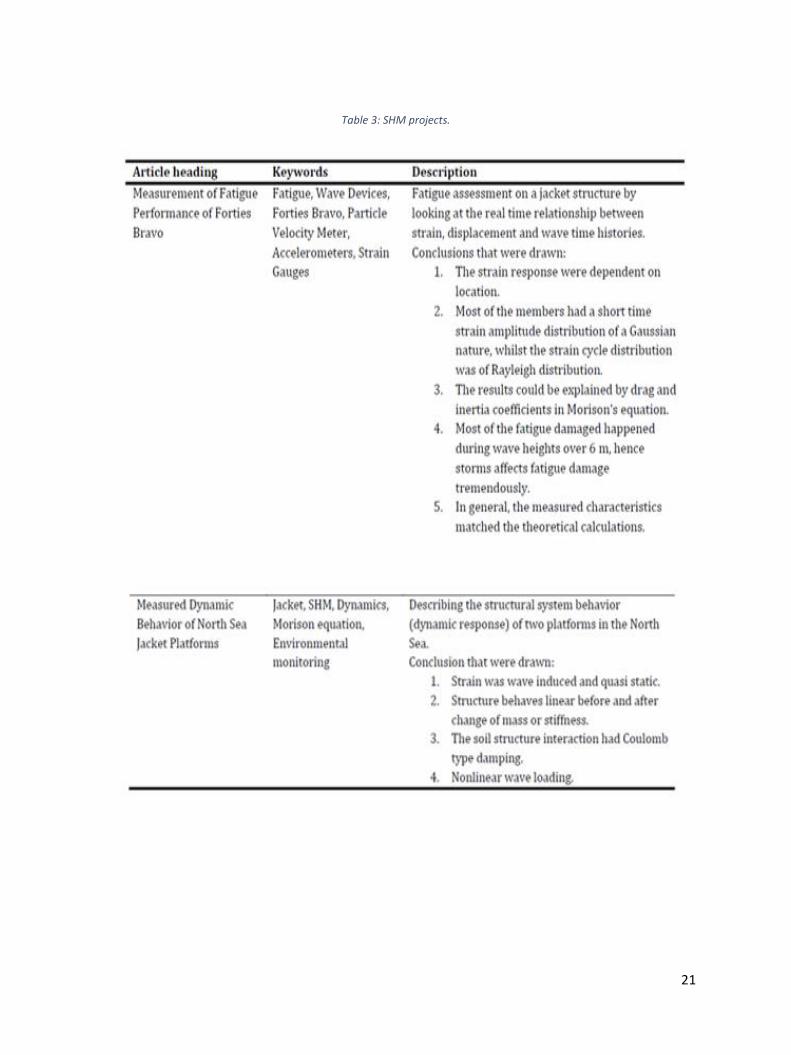
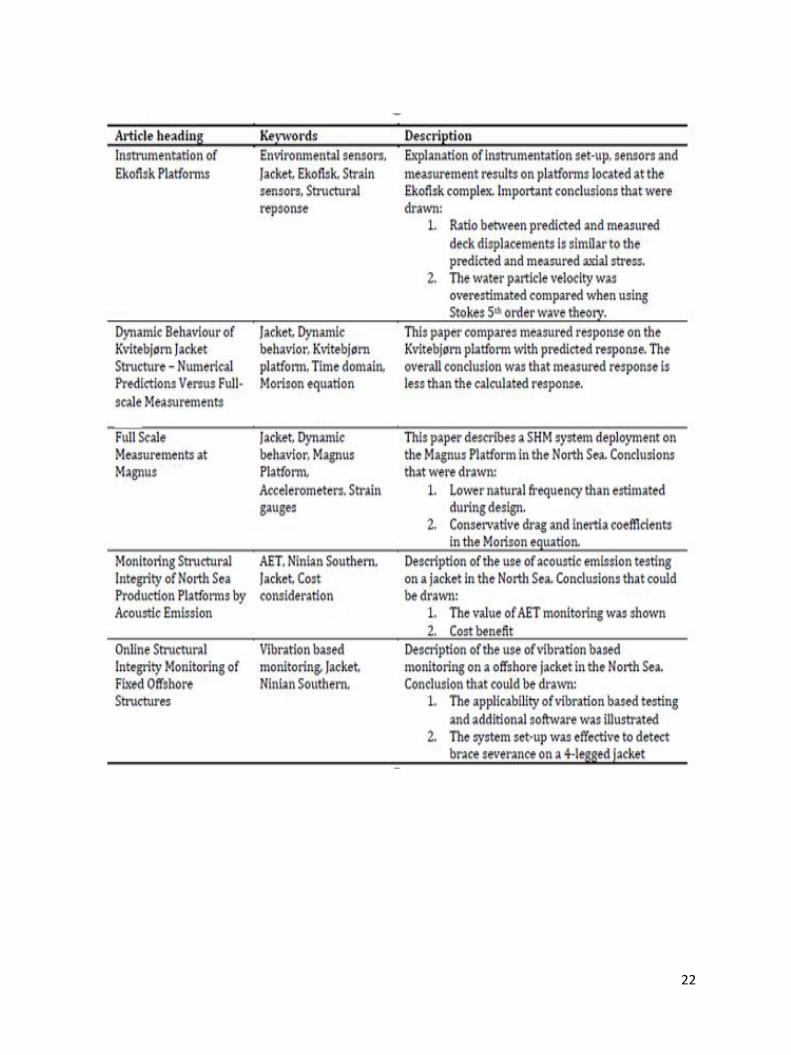
Along these deliberations, another table is presented with a summary on previous
SHM projects. Table 3 provides the conclusion of measurements done to each type of
failure and the used techniques [19] [21] [23] [24] [25] [43].
Taking notice that these measurements were intended to evaluate the precision of the
structural replicas used in design and not directly associated to identify the damage
on jacket structures when monitoring. Nevertheless, they contain important realities
about instrumentation set-up and monitoring practices.
21
Table 3: SHM projects.
22

23
4.2. OFFSHORE JACKET PLATFORM CATEGORIES
Several structures related to deep water has been designed with significant challenges
in petroleum industries.
As most of the times, offshore structures are divided into two groupings, specifically
bottom-supported and floating structures. Respectively, they can be distinct as fixed
or compliant and neutrally buoyant or positively buoyant.
The fixed structures without compliancy are jacket and tower-type fixed platforms,
jack-ups, gravity base structures and subsea production system. As for guyed tower,
delta tower and other sub-structures are called compliant structures. The latter
structures cause inertia forces because of their movements, which oppose the
excitation forces and in doing so the applied loads on the structure decrease.
One the other hand, the neutrally buoyant structures that float freely are FPSO, FPF
and SPARs. They have six degrees of freedoms divided into displacement and
rotational freedoms. Instead the positively buoyant structures like TBT and BLS have
five degrees of freedom but in some others like TLPs, ETLPs and TLWPs have three
degrees of freedom [26].
By design, the selected type of offshore structures relies on important factors like well
type, depth of water and size of the reservoir. But then again, it relies on selecting
between the appropriate offshore structure categories.
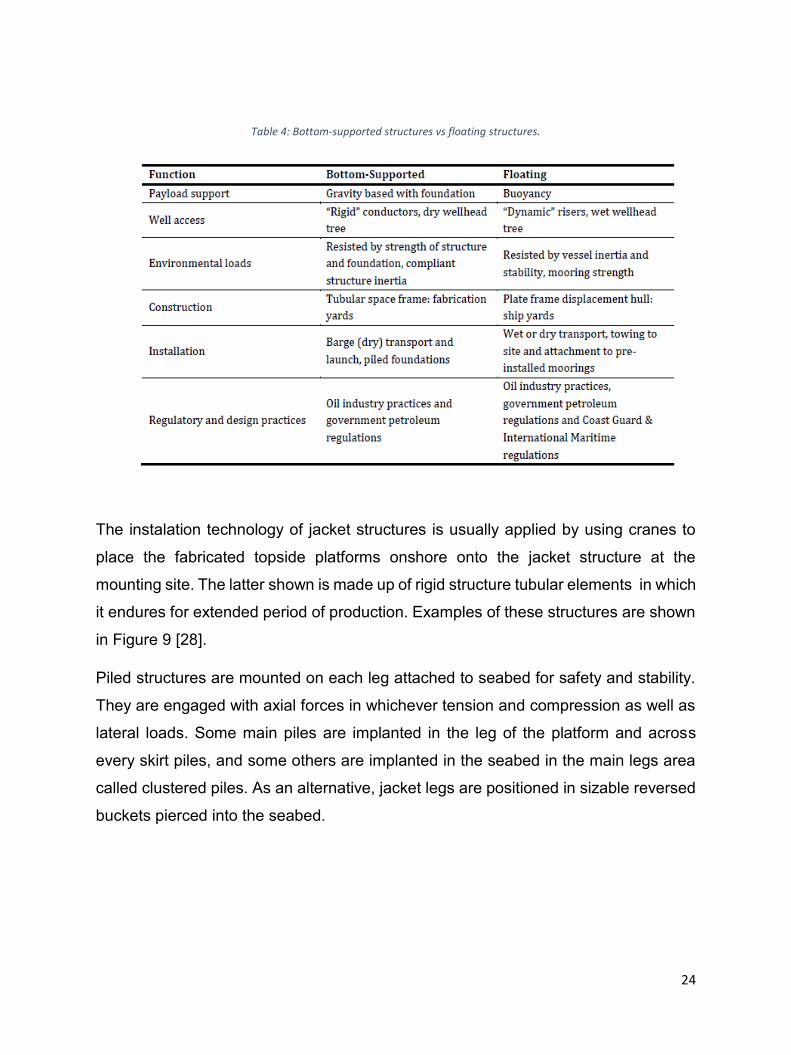
Table 4 shows the differences between both categories sited above [27]. The most
notable difference is that bottom-supported structures are enduringly mounted in
production site and can never be inspected manually after fixing it, e,g piles. On the
contrary, floating structures can be repaired by dragging it to shore [26].
24
Table 4: Bottom-supported structures vs floating structures.
The instalation technology of jacket structures is usually applied by using cranes to
place the fabricated topside platforms onshore onto the jacket structure at the
mounting site. The latter shown is made up of rigid structure tubular elements in which
it endures for extended period of production. Examples of these structures are shown
in Figure 9 [28].
Piled structures are mounted on each leg attached to seabed for safety and stability.
They are engaged with axial forces in whichever tension and compression as well as
lateral loads. Some main piles are implanted in the leg of the platform and across
every skirt piles, and some others are implanted in the seabed in the main legs area
called clustered piles. As an alternative, jacket legs are positioned in sizable reversed
buckets pierced into the seabed.

25
Figure 9: Structures Patterns
Usually, with shallow waters, jacket model is used to avoid resonance among periodic
waves and the structure. And it is familiar that the jacket will suffer from bending in the
horizontal plane. To understand more about the problem, Figure 10 explains more
about the natural periods of offshores structures concepts together with wave ranges

26
for diverse wave heights. Deeper the water, bigger the natural period of offshore
structures.
The natural period is minimal in the jacket structure since it is rigid and used in less
than 300 m depth of water. On the other hand, structures with less rigidity even with
similar concept like compliant tower experience an increase in natural period.
Natural period for bottom-supported structures is expressed in the following equation
[29]:
𝑇0=2𝜋√𝑚
𝑘 where stiffness is expressed: k =
𝐹
𝑥 =
3𝐸𝐼
ℎ3
𝐹: Force; 𝑥: displacement; 𝐸: Young’s modulus; 𝐼: Moment of inertia; ℎ: Height of the
jacket structure.
Figure 10: Wave range and natural period of structures.
27
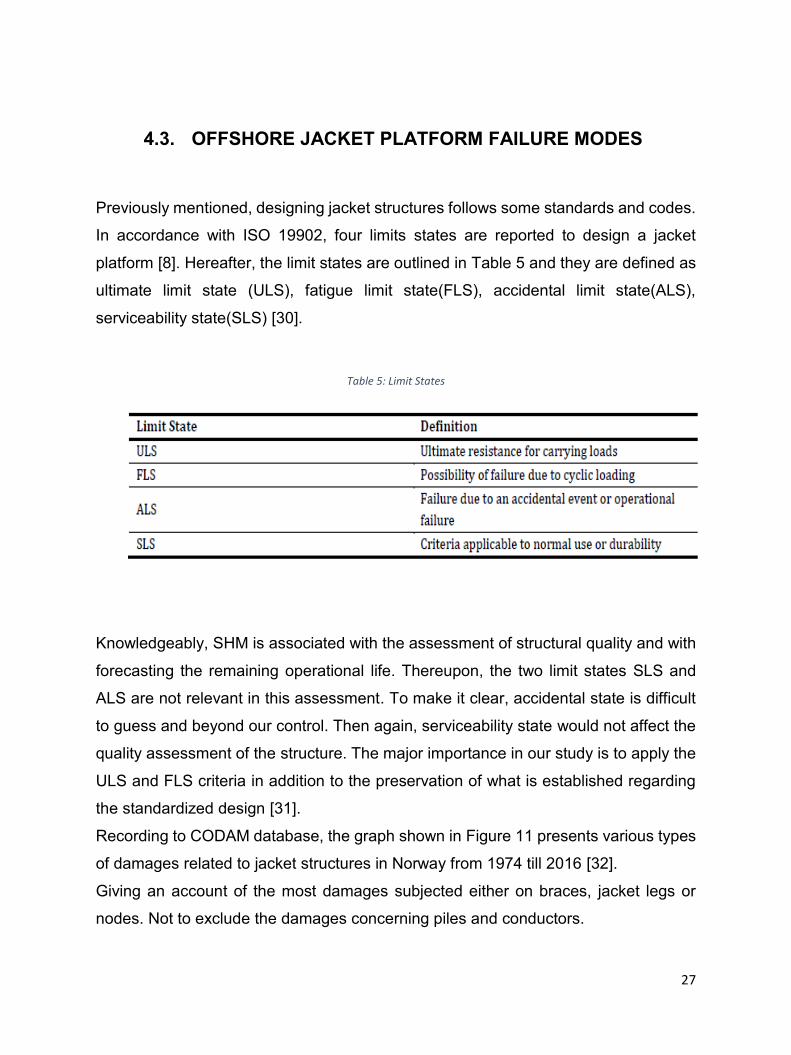
4.3. OFFSHORE JACKET PLATFORM FAILURE MODES Previously mentioned, designing jacket structures follows some standards and codes.
In accordance with ISO 19902, four limits states are reported to design a jacket
platform [8]. Hereafter, the limit states are outlined in Table 5 and they are defined as
ultimate limit state (ULS), fatigue limit state(FLS), accidental limit state(ALS),
serviceability state(SLS) [30].
Table 5: Limit States
Knowledgeably, SHM is associated with the assessment of structural quality and with
forecasting the remaining operational life. Thereupon, the two limit states SLS and
ALS are not relevant in this assessment. To make it clear, accidental state is difficult
to guess and beyond our control. Then again, serviceability state would not affect the
quality assessment of the structure. The major importance in our study is to apply the
ULS and FLS criteria in addition to the preservation of what is established regarding
the standardized design [31].
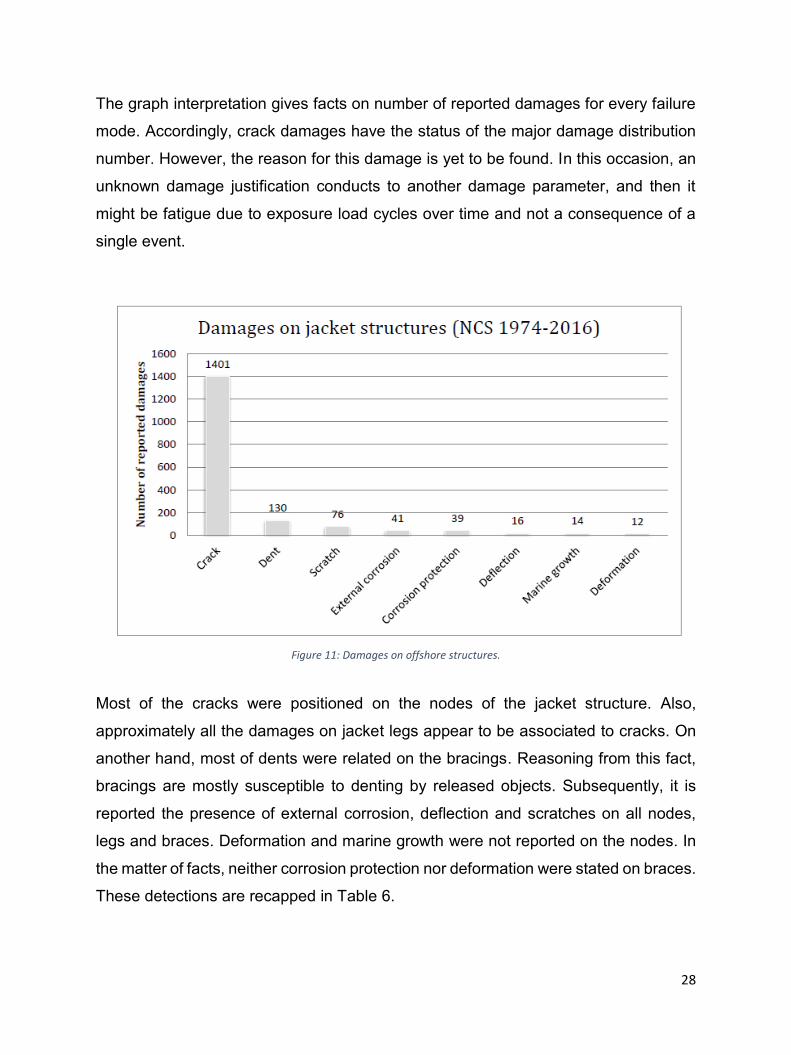
Recording to CODAM database, the graph shown in Figure 11 presents various types
of damages related to jacket structures in Norway from 1974 till 2016 [32].
Giving an account of the most damages subjected either on braces, jacket legs or
nodes. Not to exclude the damages concerning piles and conductors.
28
The graph interpretation gives facts on number of reported damages for every failure
mode. Accordingly, crack damages have the status of the major damage distribution
number. However, the reason for this damage is yet to be found. In this occasion, an
unknown damage justification conducts to another damage parameter, and then it
might be fatigue due to exposure load cycles over time and not a consequence of a
single event.
Figure 11: Damages on offshore structures.
Most of the cracks were positioned on the nodes of the jacket structure. Also,
approximately all the damages on jacket legs appear to be associated to cracks. On
another hand, most of dents were related on the bracings. Reasoning from this fact,
bracings are mostly susceptible to denting by released objects. Subsequently, it is
reported the presence of external corrosion, deflection and scratches on all nodes,
legs and braces. Deformation and marine growth were not reported on the nodes. In
the matter of facts, neither corrosion protection nor deformation were stated on braces.
These detections are recapped in Table 6.
29
Table 6: Damage locations
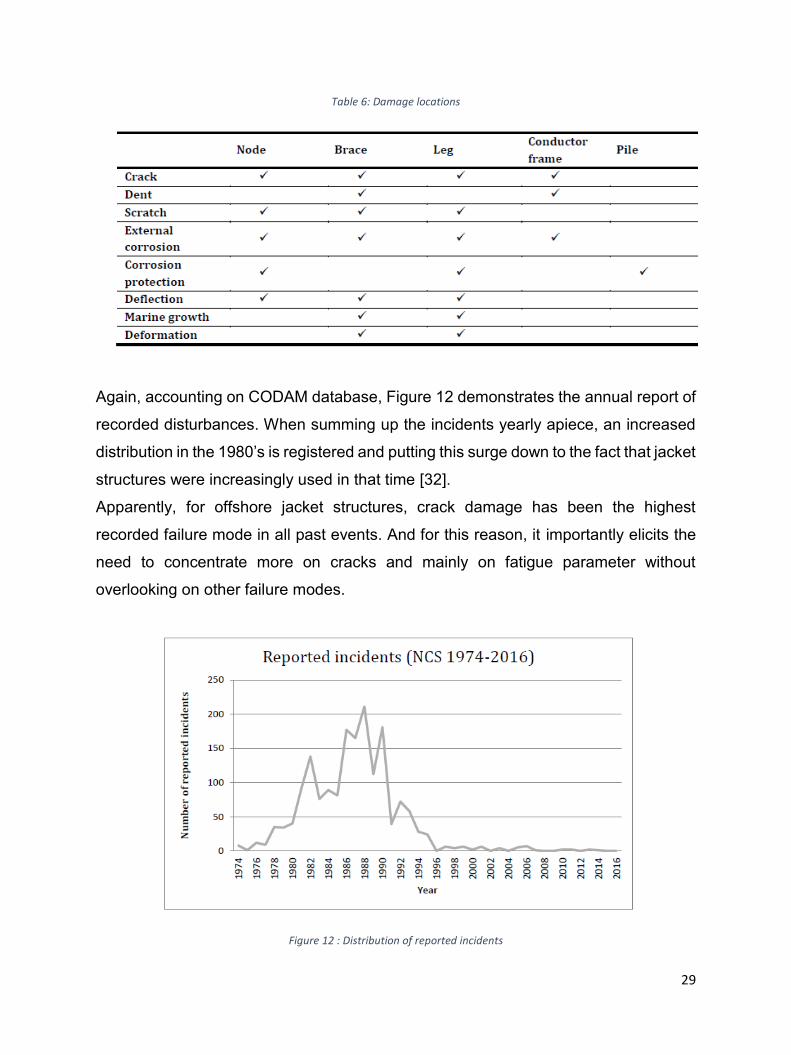
Again, accounting on CODAM database, Figure 12 demonstrates the annual report of
recorded disturbances. When summing up the incidents yearly apiece, an increased
distribution in the 1980’s is registered and putting this surge down to the fact that jacket
structures were increasingly used in that time [32].
Apparently, for offshore jacket structures, crack damage has been the highest
recorded failure mode in all past events. And for this reason, it importantly elicits the
need to concentrate more on cracks and mainly on fatigue parameter without
overlooking on other failure modes.
Figure 12 : Distribution of reported incidents
30
Likewise, NORSOK N-005 refers to the failures modes and damage parameters on
jacket structures, with Figure 11 also conferming the malfunctions forms.
NORSOK N-005 damage parameters are cited below:
- Corrosion,
- fatigue,
- overloading, accidental actions,
- other irregularities as (scouring, marine fouling).
As per NORSAK N-005 failure modes [14]:
- Corrosion damage.
- joint degradation.
- component failure and damage.
Backslinding to ISO 19902, taking into account the study of ultimate limit state, its
failures modes are [8]:
- Tensile and compressive material yielding of a member’s cross-section.
- Buckling of a member and the post-buckling redistribution of internal forces that
can involve local buckling (for open section this includes Euler and lateral
torsional buckling).
- Local buckling.
31
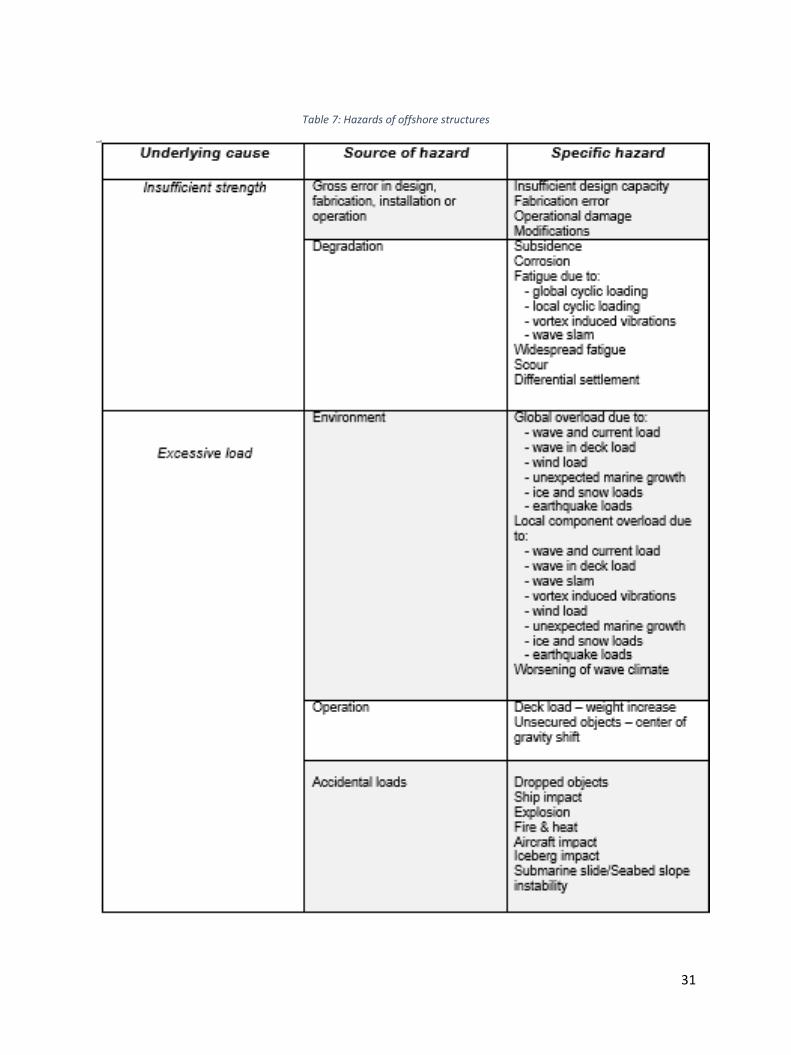
Table 7: Hazards of offshore structures
32
A study worked out an examination on the vulnerability and risk of these failures
modes as seen in Table 7 [34]. The latter points out the underlying cause to these
failures and their hazards affecting the structure. Note to mention the numerous
complexity hazards affecting the structure. Moving forward on NORSAK N-005
damage parameters comprehension, further explanation will be detailed afterwards:
Fatigue
Diminution in strength of an object triggered by cyclic loading leads to fatigue damage.
So is the case off offshore fields, where waves and wind causes the cyclic loadings.
In Norway for example waves are considerably high due to ocean existence in
comparison to Gulf of Mexico platforms exposure to calm seas. As mentioned in
previous chapter, crack spreading is a significant consequence on fatigue loading.
Improvement in fractures mechanics on offshore structures has led to anti-fatigue
damage design of offshore jackets, however improbabilities like environmental
conditions and actual loading generate difficulties in fatigue design. For this reason,
NORSAK N-001 criteria presents a design fatigue factor (DFF) ranging from 1 to 10 to
account for unprovabilities [9]. Meaning, higher the design factor, higher the difficulty
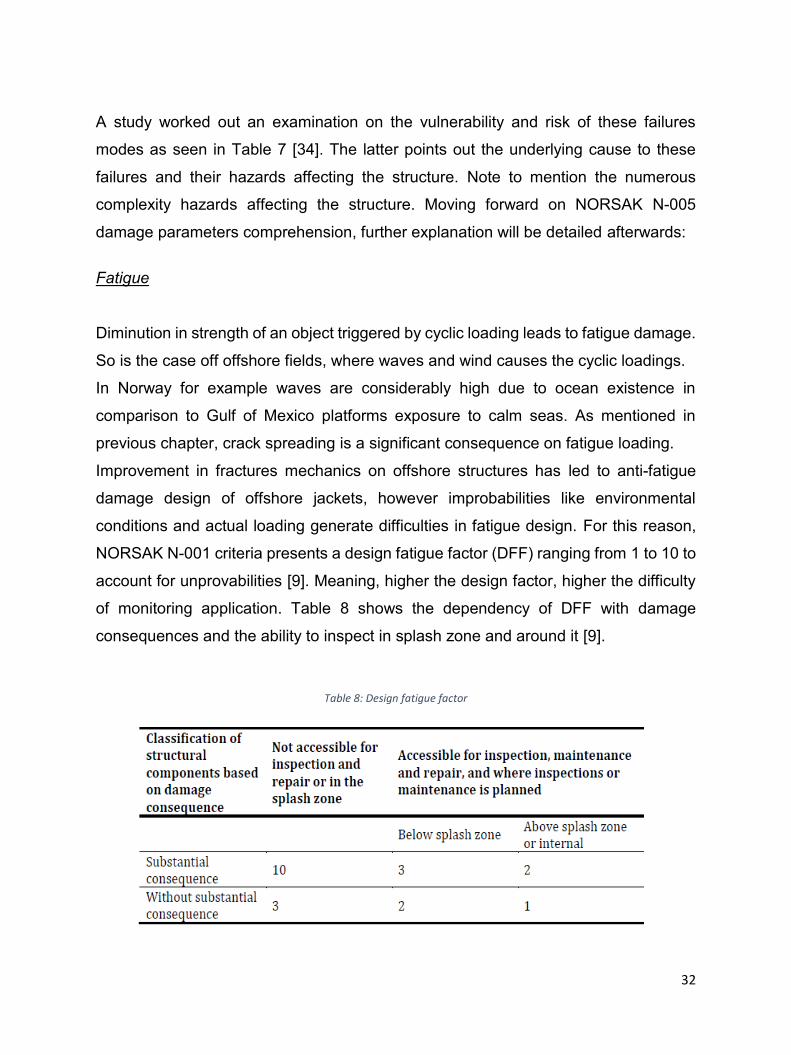
of monitoring application. Table 8 shows the dependency of DFF with damage
consequences and the ability to inspect in splash zone and around it [9].
Table 8: Design fatigue factor
33
According to DNVGL-RP-C203 criteria [13], S-N fatigue test is used all through the
design phase when analyzing fatigue. This test presents a plot of stress versus failure
cycle number. Here, collecting data for long periods is achieved by building up a
required stress history distribution for the exact location of the platform. Thus, it must
be very important for stress history to be on the stable side. However, if S-N data
wasn’t enough conducted to the appearance of failure, fatigue analysis could also be
done by fracture mechanics FM [13].
Fatigue analysis built on S-N curve applies Miner’s rule to estimate fatigue life. Failure
occurs when:
D=∑ ni𝑛1
Ni=1
Where:
𝑛𝑖: number of cycles; Ni: total number of
cycles.
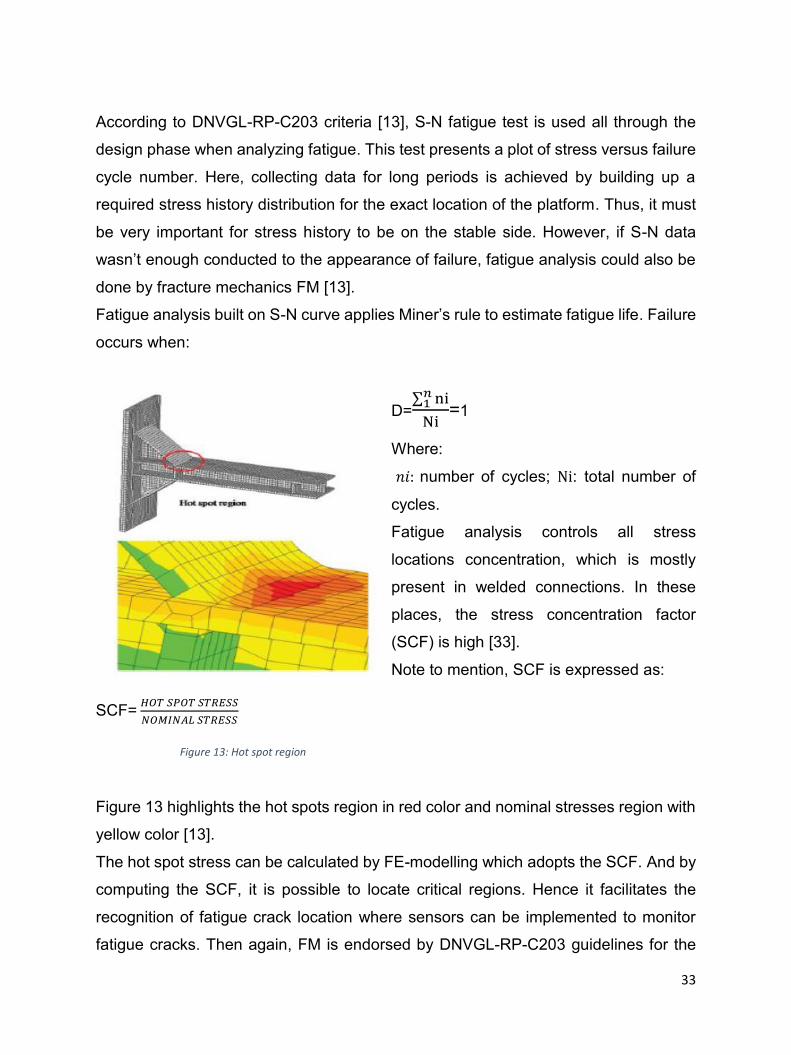
Fatigue analysis controls all stress
locations concentration, which is mostly
present in welded connections. In these
places, the stress concentration factor
(SCF) is high [33].
Note to mention, SCF is expressed as:
SCF= 𝐻𝑂𝑇 𝑆𝑃𝑂𝑇 𝑆𝑇𝑅𝐸𝑆𝑆𝑁𝑂𝑀𝐼𝑁𝐴𝐿 𝑆𝑇𝑅𝐸𝑆𝑆
Figure 13 highlights the hot spots region in red color and nominal stresses region with
yellow color [13].
The hot spot stress can be calculated by FE-modelling which adopts the SCF. And by
computing the SCF, it is possible to locate critical regions. Hence it facilitates the
recognition of fatigue crack location where sensors can be implemented to monitor
fatigue cracks. Then again, FM is endorsed by DNVGL-RP-C203 guidelines for the
Figure 13: Hot spot region

34
assessment of fatigue analysis and for the evaluation of the allowed criteria to design
and plan a workable inspection method [13]. In later sections, FM calculations will be
discussed in details about relationship of the exceeding cracks size and the fracture
stability.
Corrosion Aqueous corrosion is present in offshore platforms and it is due to electromechanical
process between a connected anode and cathode (metal) to an electrolyte (seawater)
where electrons move from the anode to cathode. Basically, this process is principled
on oxidation and reduction reactions thus leading to rusty and corroded elements. In
the matter of fact, corroded structures lose their strength and their integrity. Therefore,
the presence of oxygen and water in offshore platforms makes it the most destructive
environment for jacket platforms. Because of dissolved oxygen is greater near the
splash zone (near water surface), it inflicts a greater corrosion in the neighborhood of
this region comparing it to the metal existing under the surface. As a result, pitting
corrosion can be localized at metal surface of the platform where holes and cavities
are formed. Pits can be more dangerous than regular corrosion damage since it is
more difficult to predict. Corrosion inside these pits staged in joints or in the
imperfection of welding, indicates an irregular corrosion layer on the steel surface of a
platform. As time progresses, the increased stresses triggered by pits and other
irregularities resultant from electrochemical reactions will expose structures to
fractures and breaks within.
In association with corrosion, a new term in the field of fracture mechanics is
introduced as environmentally assisted cracking (EAC), and it is split into four types
[18]:
- Hydrogen embrittlement (HE) is a process induced by hydrogen atom when
presented in high amount around an alloy. Hydrogen atoms fit in metal
structure due to its small size. Therefore, a decrease in strength bond caused
between the metal atoms lead to occurrence of cracks.
- Corrosion fatigue (CF) is the acceleration of fatigue crack enlargement
attributable to the applied load in combination with the environment load.
35
This explains that when a structure is corroded, it will experience crack
growth with lower loads and shorter time.
- Stress corrosion cracking (SCC) is the growth of crack due to an anodic
reaction at the crack tip than on other locations wherein it is consumed by a
large corrosion mechanism.
- Liquid metal embrittlement (LME) is a process that initiates with a ductile
metal and ends up with brittle properties. Ductile to brittle metal
transformation experiences a severe loss in tensile ductileness or suffers
from brittle fracture when subjected to some kind of liquid metals. This
consequence is due either to the presence of tensile stresses internally either
externally applied. Aluminum is an exception to the rule where it becomes
brittle without any application of stress when in contact with gallium liquid.
To reduce the risk of corrosion and to prevent the structure from induced cracks in
offshore platform, some materials like zinc, magnesium, aluminum are used as anodes
layers in which they will rust instead of the structure [35].
Overloading
Overloading occurs on the topside of the structure when new updated facilities are in
progress. An example to accidental scenarios developing overloading damage:
Supply ship collision and other possible collisions from different structures offshore as
floating living quarters.
Wave and wind overloading
The sea current and surface waves effects on the dynamic behavior of an offshore
structures are important to offshore industry. Waves and current loads are indirectly
proportional to tides in designing the platform. Classification of tides are divided in two
categories: First, the tide triggered by the gravitational pull of the moon and sun, and
it is called astronomical tides. While the second category is called storm surges, and
it is due to wind combined with the differentials barometric pressures in a storm [73].

36
Continuously, waves create an orbital motion in water during their pathways.
Combining this effect with the wind surface, a current is subjected to the wave path
causing a wavelength stretches. As for the wind loading, it transforms kinetic energy
to potential energy when structure is blocking the wind pathway. Thus, this pressure
transformation results in forces damaging the structure. These overloading results in
deformation shapes of the platform, in addition to degradation of the structure due to
fatigue and corrosion in a non-linear response. In consequence of the latter damages,
the ability of the structures withstanding the overloads by waves and currents
decreases. This type of failure mode is crucial for the operational platform.
To calculate the forces applied on the platform by the wave loading, Morison’s
equation is used combined with stokes wave theory of the fifth order [73]. Other irregularities
Marine fouling and scouring are irregular damages with crucial consequence on the
health of a jacket platform.
Marine fouling or biofouling is a comprehensible term describing a wide range of
organisms appended on immersed surfaces present in the ocean. Consequently, it
causes a widespread layer along the jacket with increased loading comparing to wave
and current loads. Friction on legs and bracings will increase and similarly affecting
the drag force, as specified by Morison equation:
𝐹= 𝐶𝑚ρ
π
4D2𝑢̇ + 𝐶𝑑
1
2ρ𝐷𝑢̇|𝑢̇|
Where:
𝐶𝑚 and 𝐶𝑑 are respectively the inertia and drag forces;
𝞺 is the density of water;
𝐷 is the diameter of a cylindrical component;
𝑢̇ is the velocity of water;
𝐹 is the sum of two hydrodynamic forces (inertia and drag).

37
Marine scouring is a sort of erosion of sediment in seabed that leads to unstable
platform foundation. Scouring is the correlation linked to hydrodynamics and
geotechnical effects combined. Scouring mechanism happens when the water flow
interacts with the vicinity of the foundation sediment of the structure and changes the
shape of sediments resulting in compromising the structure stability.
In Figure 14, various damaged structures are illustrated. (A) illustrates a damage
tubular joint due to fatigue through crack. (B) illustrates an air gaped damage due to
corrosion. (C) illustrates a buckled damaged tubular member caused by overloading.
(D) illustrates an example of marine fouling on jacket legs [36] [37] [38] [39].
Figure 14: Damage on jacket

38
A briefed discussion to what have been said on the failure modes of jacket structures
is deliberated in this summary.
Corrosion is relatively controllable in comparison with cracks caused by fatigue.
Fatigue cracks is a dangerous mechanism and uncontrollable in case of sudden
accidents and environmental events [15]. NORSAK N-005 guidelines objectify some
monitoring conditions to endure an acceptable level of the structure integrity. it claims
the determination of the existence, the degree and the consequence of [14]:
- degradation or deterioration due to fatigue or other time dependent structural
damage
- corrosion damage
- fabrication or installation
- damage or component weakening due to strength overloading
- damage due to man-made hazards
- excessive deformations.

39
5. SHM APPROACH FOR AN OFFSHORE JACKET PLATFORM
In this section, a cost-effective SHM method for an offshore jacket platform will be
detailed in accordance with the previous discussed plans, categories and techniques
in line with the standards provided by the leading chain of command in oil and gas
fields. In accordance with NORSAK N-005 program, monitoring loadbearing structures
relies on [14]:
- Design and maintenance based on guided principles studies.
- Up-to-date condition
- Competence of the assessment approaches available
- Intentional utilization of the structure.
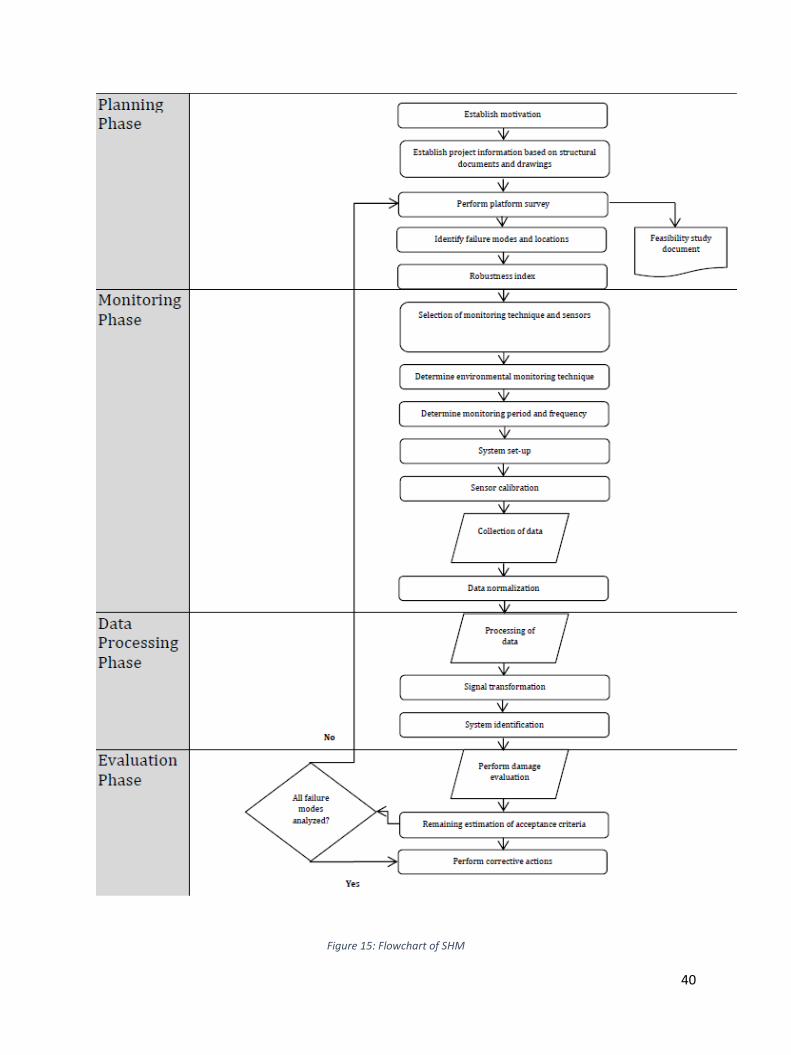
Consequently, a flowchart is presented in Figure 15 with an organized procedure of a
SHM system of a jacket structure. Reciprocally, it is followed by a clarification of the
steps for the design and the execution needs to achieve the method.
40
Figure 15: Flowchart of SHM
41
5.1. PLANNING PHASE
Establish motivation
Establishing motivation to be considered before taking into account any study
regarding the asset in occupation. In history, SHM of offshore structures have been
incredibly high-priced with relatively minor quantity of jacket equipped with SHM
system. Most of the jackets are manually monitored and based on RBI method.
Nonetheless, the capacity to long-lasting life of a jacket is as result of a SHM system.
ISO 19902 grants a table with various motives for examination on jacket structures,
and it covers [8]:
- Manufacture imperfections or installation damage.
- Degradation or weakening of the structure.
- Design uncertainties or miscalculation.
- Environmental or weight overload.
- Accidental events.
- Variations in stable actions.
- Monitoring of acknowledged defects or reparation success.
- Change of proprietorship.
- Legal requirements.
- Reuse.
Establish project information based on structural documents and drawings Before classifying the serious failure mode of the structure, gathering data is a
necessity to be carried out. In NORSOK N-006, a list of the information that shall be
available for assessment of offshore structures is given. The list is countable for all
offshore structures therefore the list below is modified to only include the information
needed for a steel jacket platform [16]:
- Built drawings of the structure.
42
- Updated info on environmental data, if important.
- Stable and variable actions.
- Previous well-designed requirements and future functional necessities.
- Design and construction specifications.
- Initial management study of corrosion.
- Design, construction, transport and assembling statements which provide
information about material properties (e.g. structure strength elongation
properties and structure toughness test values), welding techniques
qualifications, specifications and modifications, welding maintenances
during construction, non-destructive testing, archived pile driving action
impacts data.
- Design presumptions.
- Updated reports on weighs.
- Information on functional inspections on marine growth, corrosion, cracks,
dents and deflections, scour damages due to frost, impact, erosion/abrasion,
leakages.
- Measurements and observations data on dynamic response performance in
place.
- Information and prediction for seabed sediment.
- Info on adjustments and restoration for the structures during its service life.
- Consolidation, pore pressure and soils conditions.
- Instability of an incline, erosion at pile foundations, disparity settlement.
- Similar structures experiences.
In any case, and according to NORSOK N-006, the absence of any acknowledgment
is to be substituted with assumptions.
Perform platform survey
A platform survey is a method performing a prior assessment on any type of SHM
system before execution. In the courtesy of this survey, a comprehensible method is
43
followed up in dealing with the number of sensors needed and their positions. Make
to mention, pictures from platforms are collected helping with an achievable system
set-up [40].
Identify Failure Modes and Locations
As referred in previous sections, NORSOK N-005 recommends the identification
failures modes and their damage parameters through ULS analysis combined with FE-
model [14].
This implies the installation should be applied in critical locations as a new structure
design in addition to structures subjected to difficult environment. Stating some
accidental examples with major importance in monitoring systems: in Alexander
Kielland platform in the North Sea in 1980, a recent new installation of hydrophone
developed a fatigue crack that lead to a breakdown of the platform [43].
Also, according to NORSOK N-006, attention should be made from risking fatigue
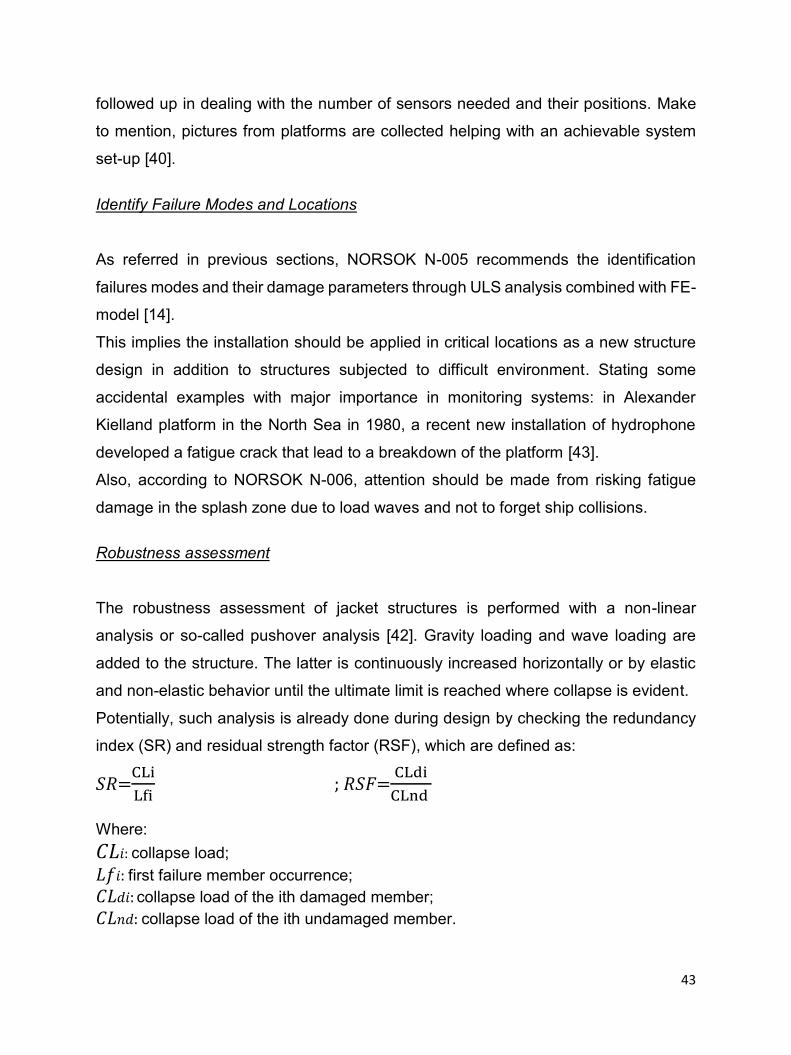
damage in the splash zone due to load waves and not to forget ship collisions. Robustness assessment
The robustness assessment of jacket structures is performed with a non-linear
analysis or so-called pushover analysis [42]. Gravity loading and wave loading are
added to the structure. The latter is continuously increased horizontally or by elastic
and non-elastic behavior until the ultimate limit is reached where collapse is evident.
Potentially, such analysis is already done during design by checking the redundancy
index (SR) and residual strength factor (RSF), which are defined as:
𝑆𝑅=CLi
Lfi ; 𝑅𝑆𝐹=
CLdi
CLnd
Where: 𝐶𝐿𝑖: collapse load; 𝐿𝑓𝑖: first failure member occurrence; 𝐶𝐿𝑑𝑖: collapse load of the ith damaged member;
𝐶𝐿𝑛𝑑: collapse load of the ith undamaged member.

44
The SR index represents the difference between the collapsed load and the
occurrence of the first failure member, and it is a helpful in measuring structure
robustness.
On the other hand, RSF designates the capacity reduction state for undamaged
member and damaged member. Put it differently, the damage tolerance and the
degree of redundancy increase proportionally with SR and RSF values.
45
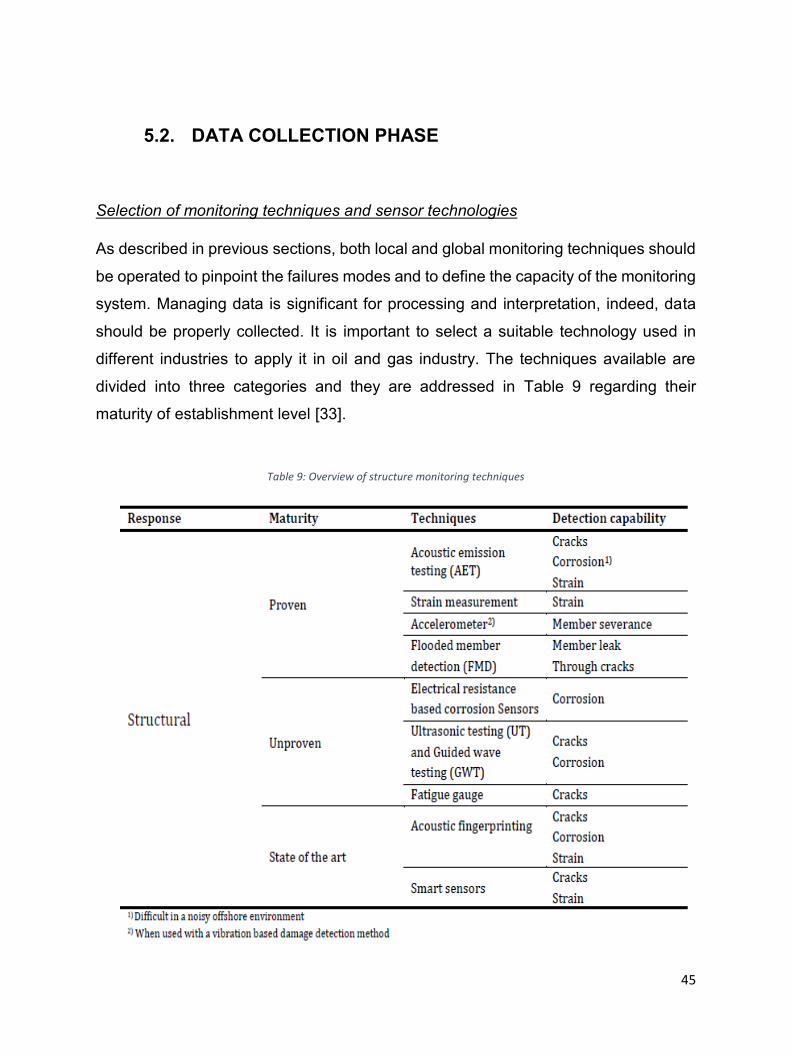
5.2. DATA COLLECTION PHASE
Selection of monitoring techniques and sensor technologies
As described in previous sections, both local and global monitoring techniques should
be operated to pinpoint the failures modes and to define the capacity of the monitoring
system. Managing data is significant for processing and interpretation, indeed, data
should be properly collected. It is important to select a suitable technology used in
different industries to apply it in oil and gas industry. The techniques available are
divided into three categories and they are addressed in Table 9 regarding their
maturity of establishment level [33].
Table 9: Overview of structure monitoring techniques

46
As a definition of maturity of use, the proven technologies are applied in SHM of
jackets while the unproven technologies are applied in other industries. As for the third
classification, the state of the art implies a technique not in comprehension of use in
any industry [33].
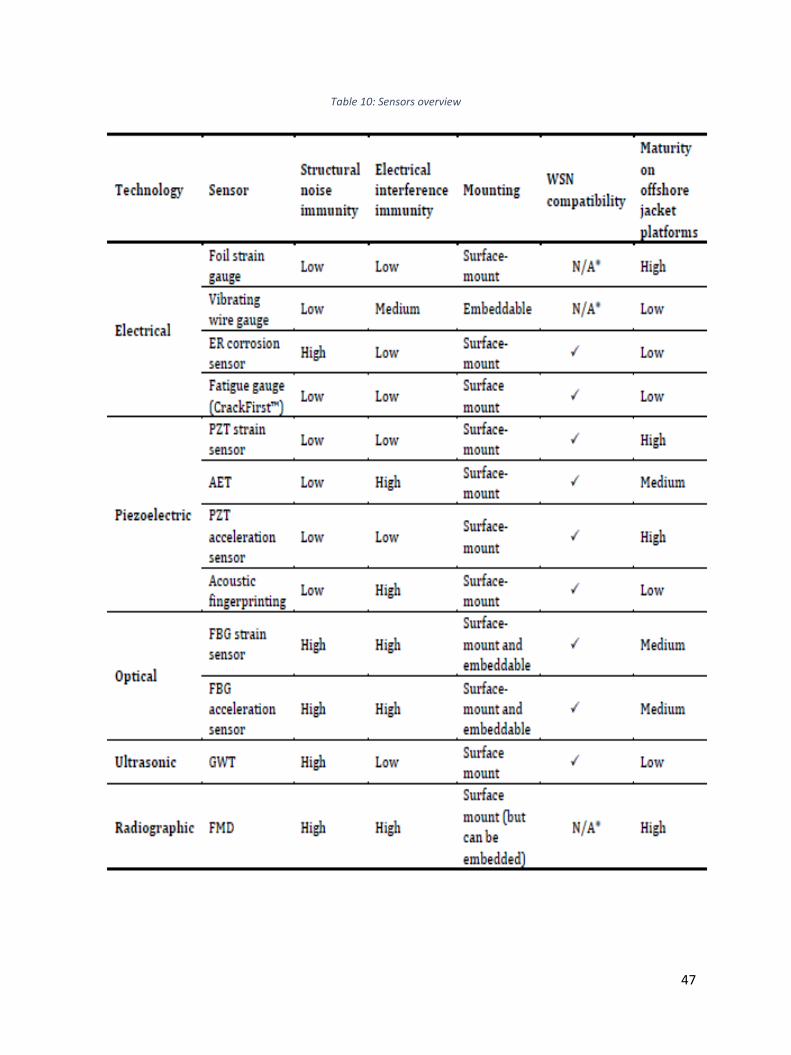
As a guide to select the right sensor, the summarized Table 10 is made to compare
the detection capabilities of each category of maturity of use and their parameters [55]
[43] [57] [59] [60] [61] [62]. Generally, sensors for offshore monitoring take into account
five parameters. Starting with two noise immunities defined as structural and
electromagnetic. Structural noise comes from vibration or sound like wave load on
jackets structure or disturbance near the platform by rotors of helicopters or process
equipment in use. The similar effect for electromagnetic noise, rather the vibration
comes from lightning or from northern light. These noises can have a low, medium or
high impact on the gathered data [43].
In order capabilities, mounting parameter is a helpful feature in determining sensors
and their mounting positions. It is possible to equip the structure with sensor on its
exterior surface or embedded into it. Surface mounted sensors is better in case on an
existing structure whilst the embedded technique is more practical to monitor in case
of an upbuilded structure and gives more protection to the sensor.
Continuously, wireless sensor network (WSN) parameter compatibility is an important
way to achieve an advanced SHM system with MEMS and smart dust.
Finally, and as mentioned above, maturity of use of all sensors comes with levels
either low usage, medium or high.
47
Table 10: Sensors overview

48
Determination of Monitoring Period and Frequency
Determination of monitoring period and frequency is an essential step and unique for
each sensor. Usually, low sampling frequency is required for long time failure and
oppositely for high sampling to identify short time failure. A balance is needed between
high frequency and low frequency samplings, thus, avoiding simultaneously aliasing
and needless computational effort. Also sampling periods must be determined and it
is either monitored continuously or periodically. Nevertheless, the capacity of
processing data should be planned without much of concern on the amount of data
storage.
System Set-up
System set-up points out the application of sensory installation, wiring and data
acquisition system. Note that the sensor location should be selected wisely to supply
information in monitoring damages and not to become a supplier of damage like crack
growth.
Perform System Calibration
After setting up the installation on the platform, an authorization of the system should
be made by a site acceptance test involved in the following inspections: sensor
reaction with the system, system reaction from a repeatable electronic source (AE-
sensor only), data transfer, remote control of the workstation, and software checks
together with alarm and warning purposes [23] [40].
Data Normalization
Data normalization must be applied before data processing to obtain data signals
deprived of noise and also justify sensor malfunctioning. For more understanding
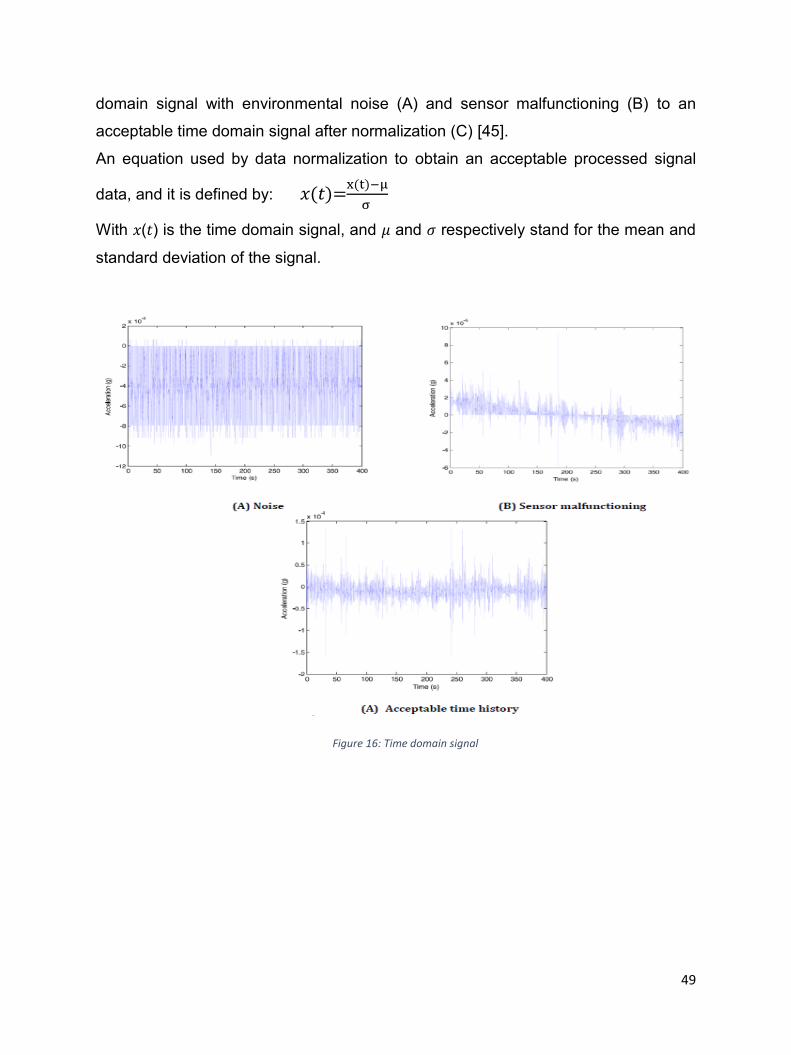
about this process, Figure 16-A, B, C exemplifies a comparison between a time
49
domain signal with environmental noise (A) and sensor malfunctioning (B) to an
acceptable time domain signal after normalization (C) [45].
An equation used by data normalization to obtain an acceptable processed signal
data, and it is defined by: 𝑥(𝑡)=x(t)−μ
σ
With 𝑥(𝑡) is the time domain signal, and 𝜇 and 𝜎 respectively stand for the mean and
standard deviation of the signal.
Figure 16: Time domain signal
50
5.2.1. DATA COLLECTION TECHNOLOGIES In this section combined with table 9, only proven technologies in monitoring
techniques will be further detailed respecting to the three categories of maturity of use.
Proven technologies
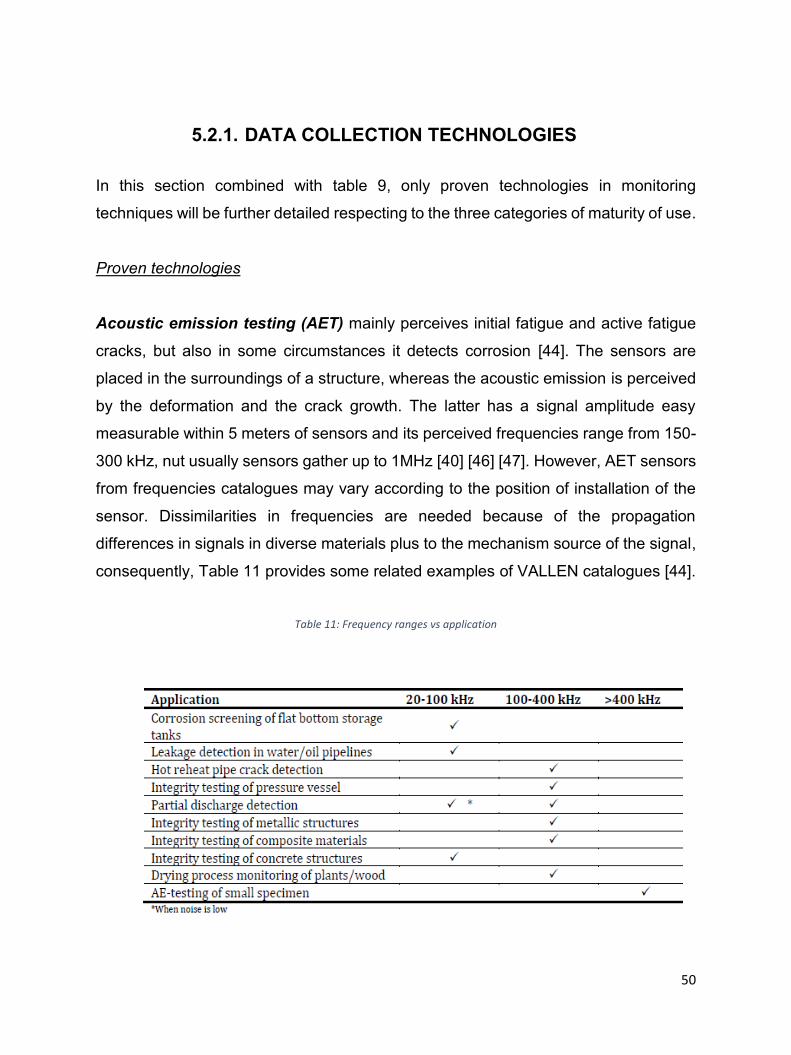
Acoustic emission testing (AET) mainly perceives initial fatigue and active fatigue
cracks, but also in some circumstances it detects corrosion [44]. The sensors are
placed in the surroundings of a structure, whereas the acoustic emission is perceived
by the deformation and the crack growth. The latter has a signal amplitude easy
measurable within 5 meters of sensors and its perceived frequencies range from 150-
300 kHz, nut usually sensors gather up to 1MHz [40] [46] [47]. However, AET sensors
from frequencies catalogues may vary according to the position of installation of the
sensor. Dissimilarities in frequencies are needed because of the propagation
differences in signals in diverse materials plus to the mechanism source of the signal,
consequently, Table 11 provides some related examples of VALLEN catalogues [44].
Table 11: Frequency ranges vs application
51
A report conducted by a European conference for non-destructive testing for the
investigation of the applicability of VALLEN product line of AE sensors, preamplifiers
and signal processor plus to VALLEN’s specified software [40]. This AE system (called
AMSY-6) satisfies the standards required to equip and verify the operational
characteristics AET [44]. Eventually, it required an acoustic emission expert in
incorporation with a viable study to retrieve data without the presence of noise. In
addition, it needed further scheme set up for positioning the sensors and directing the
cables, and also needed an authorized acceptance test after installation. This test
involved with the consecutive checks: remote control of the workstation, system
response from a repeatable electronic source, data transfer, and software function
checks including alarms, sensor response with the system.
The workstation contained warning systems and automated alarms labeled by the
accepted criteria. On the other hand, the warning system was positioned lower to
alarm systems and it was suggested the use of manual strain measurements to assess
the tip of the crack in case of warning resulting in a simple maintenance of the AET
system, thus, the possibility of logging to a processor even onshore. Furthermore,
VALLEN software provided a sensor with self-examination role. Thus, each sensor
sent out pulsations to be collected by the rest of the sensors. Yet, for the reason of its
high cost, this AET system is used in offshore industries only in crucial treatments. In
other ways, the surplus of wiring and the necessity of an engineer to interpret the
complex signals data combined with noise are the major reasons for cost issues.
Strain measurement is a technology for the evaluation of local loadings resulting in
bending (horizontal and vertical), torsion, longitudinal compression force and vertical
shear force. These deformations of a structure are triggered by an operational stress.
Strain monitoring has two forms either static or dynamic. Static strain monitoring tests
are concluded with a test specimen in a lab. By exerting a certain load on the sample,
data are collected. Then after new collected data are provided by increasing or
decreasing the load. On the other hand, dynamic strain monitoring tests are measured
continuously on the actual specimen and plotted in a time-strain diagram. Most of SHM
techniques requires the dynamic strain tests to evaluate the diagram time-strain. Note
52
that for dynamic measurements higher sampling frequencies are needed respect to
static measurement. Also, the stress-strain function is used in assessing the specimen
dynamically during its process.
Sensors detecting strain are: electrical gauge, piezoelectric and optic fiber [48].
Starting with the electrical strain gauges, two types are provided in the industry,
specifically metal foil and vibrating wire. Metal foil gauge measures the electrical
resistance variances when the metal foil is under strain and proportionally to its length
[48]. Instead, vibrating wire sensors measures the frequency changes in the vibrating
wire when subjected to a tension load [49]. This latter technique is widely known for
its extended time stability.
The piezoelectric strain sensors are applied when strained materials exert an
accumulation of electricity resulting from a mechanical stress. This phenomenon is
observed when piezoelectrical material like PZT produces electricity when its crystals
subject deformation [50].
Concerning the last type, optical fiber sensors are tools dealing with the transmission
of light within glass and plastic [51]. This technique employs the Fiber Bragg Grating
technology, when it is subjected to a light source, the screen will reflect precise
wavelength dependent on the screen properties. As a consequence, strain and
temperature will affect the gratings and will modify the space between them. Thus, this
change will also lead to a variation in the reflected wavelength that in return could be
transformed into a strain value [48]. It is found that FBG sensors are capable in
detecting strain and acceleration same as strain gauges, but as a disadvantage, FBG
sensors lack the source light that limits the range of flexibility of the fiber cables [52].
Accelerometer is composed of a piezoelectric substance that record the acceleration
of a moving structure. An FBG accelerometer is equally effective to piezoelectric
sensors, but it doesn’t provide information about damage though it defines the
dynamic characteristics [53]. In this respect, these characteristics can identify the
damage. Note that accelerometers are widely used in offshore jacket structures thus
it is based on vibration method to damage detection.

53
Flooded Member Detection is based on radiographic method. In other word,
radiographic technique depends on the transmission of light across a structure, in
return, the structure with its density and composition properties will absorb the light.
Thus, the detector will sense the passing light and will configurate the inspected
structure [43].
54
5.2.2. VIBRATION-BASED DAMAGE DETECTION TECHNIQUE
Vibration-based damage detection is the most advanced damage technique in
offshore jackets. Initially, the variation in frequency was supposed an indicator of
damage. Thus, most researches convinced that this change is effective in measuring
damage in the structure. Though, these frequencies changes are relatively dependent
on mass and stiffness changes. Naturally, accelerometers are installed on the topside
of the structure with continuous monitoring of wave loadings vibration response. Thus,
any damage detected will be echoed by a change in structural response. Due to this
method sensitivity to frequency change, detection can be accurate of 0.5% of
frequency alteration. Though, some requirements are needed for the vibration-based
damage method like [63]:
- Ambient excitation to obtain the resonant frequencies,
- Stability of vibration spectra for long periods of time,
- Persistence of the instruments in rough environments,
- Mode shapes identification from measurements taken above water level,
- Financial benefits of the system comparing to the use of divers.
However, this technique is used for global damages and cannot spot minor damages,
like small defects and local fatigue cracks.
In this context, examination of modal properties variation is based on modal damping,
resonant frequencies and mode shape vectors. Note that frequency shifts are harder
to detect or result in fake damage evaluation respect to the other parameters like mass
from marine growth, equipment noise and change of center of gravity.
To seize these difficulties, modal shapes are used as an alternative to frequency,
because of their excess sensitivity respect to eigen frequencies. Some examples were
provided concluding the reduction of frequency by 1-4% due to damage and value of
altered modal displacements by 30 to 100% [64].
55
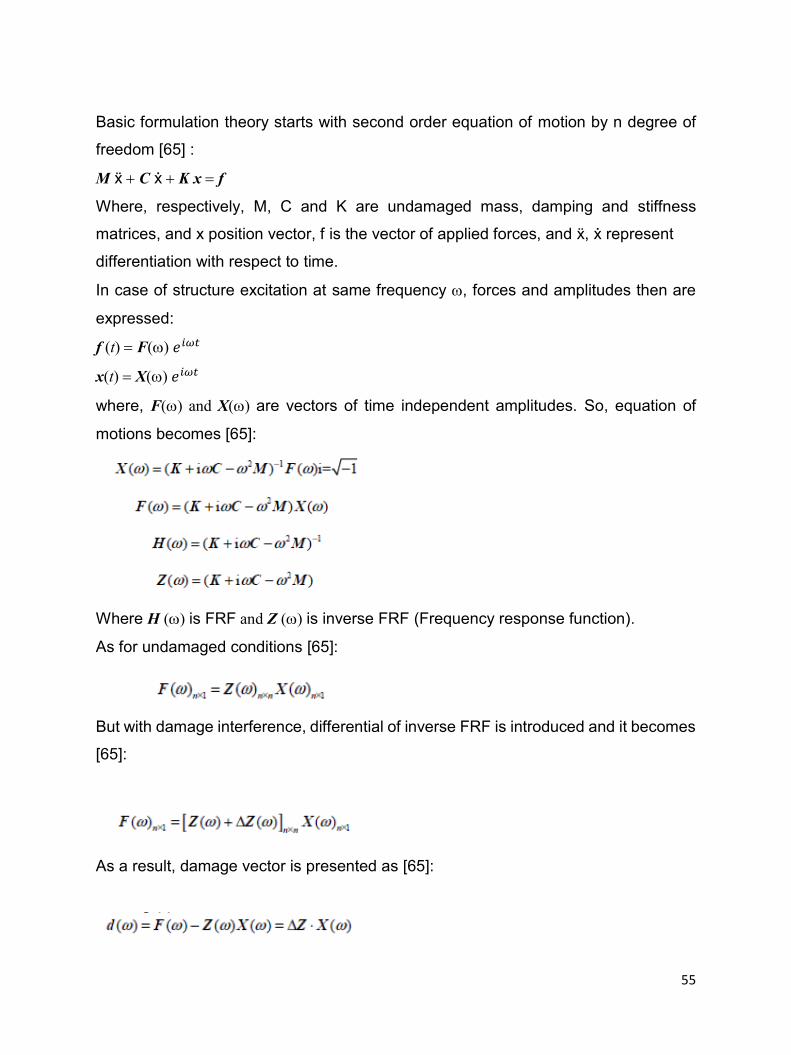
Basic formulation theory starts with second order equation of motion by n degree of
freedom [65] :
M ẍ + C ẋ + K x = f
Where, respectively, M, C and K are undamaged mass, damping and stiffness
matrices, and x position vector, f is the vector of applied forces, and ẍ, ẋ represent
differentiation with respect to time.
In case of structure excitation at same frequency , forces and amplitudes then are
expressed:
f (t) = F() 𝑒𝑖𝜔𝑡
x(t) = X() 𝑒𝑖𝜔𝑡
where, F() and X() are vectors of time independent amplitudes. So, equation of
motions becomes [65]:
Where H () is FRF and Z () is inverse FRF (Frequency response function).
As for undamaged conditions [65]:
But with damage interference, differential of inverse FRF is introduced and it becomes
[65]:
As a result, damage vector is presented as [65]:
56
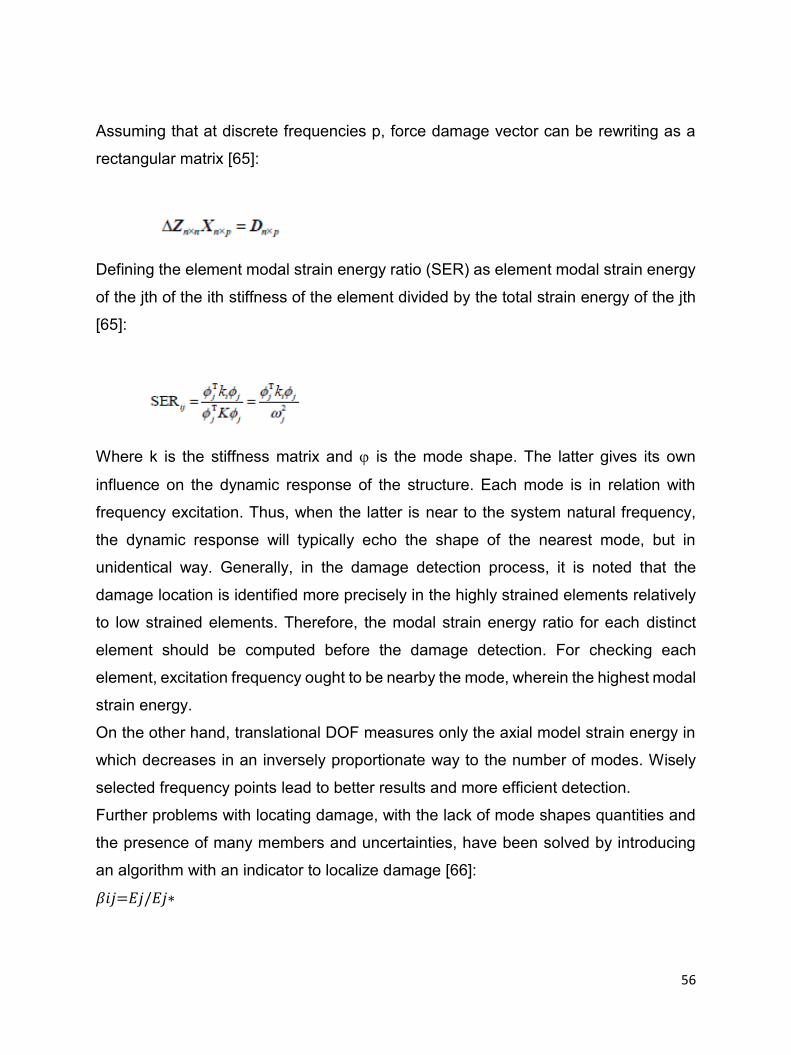
Assuming that at discrete frequencies p, force damage vector can be rewriting as a
rectangular matrix [65]:
Defining the element modal strain energy ratio (SER) as element modal strain energy
of the jth of the ith stiffness of the element divided by the total strain energy of the jth
[65]:
Where k is the stiffness matrix and is the mode shape. The latter gives its own
influence on the dynamic response of the structure. Each mode is in relation with
frequency excitation. Thus, when the latter is near to the system natural frequency,
the dynamic response will typically echo the shape of the nearest mode, but in
unidentical way. Generally, in the damage detection process, it is noted that the
damage location is identified more precisely in the highly strained elements relatively
to low strained elements. Therefore, the modal strain energy ratio for each distinct
element should be computed before the damage detection. For checking each
element, excitation frequency ought to be nearby the mode, wherein the highest modal
strain energy.
On the other hand, translational DOF measures only the axial model strain energy in
which decreases in an inversely proportionate way to the number of modes. Wisely
selected frequency points lead to better results and more efficient detection.
Further problems with locating damage, with the lack of mode shapes quantities and
the presence of many members and uncertainties, have been solved by introducing
an algorithm with an indicator to localize damage [66]:
𝛽𝑖𝑗=𝐸𝑗/𝐸𝑗∗
57
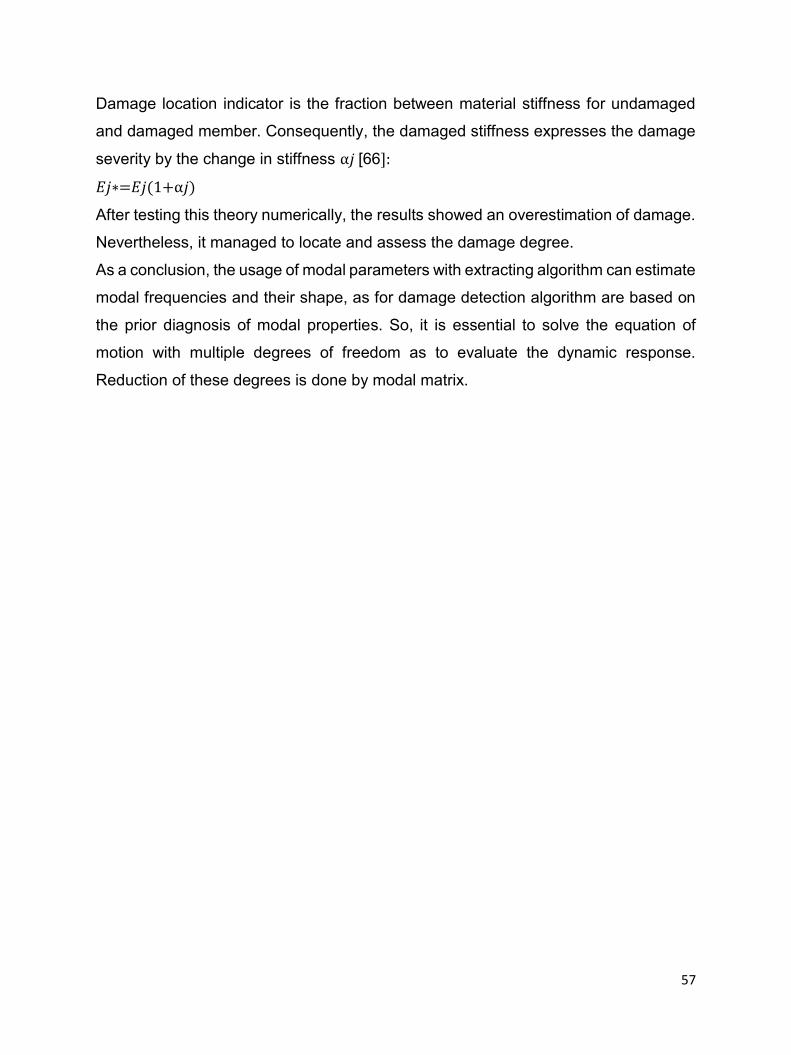
Damage location indicator is the fraction between material stiffness for undamaged
and damaged member. Consequently, the damaged stiffness expresses the damage
severity by the change in stiffness α𝑗 [66]:
𝐸𝑗∗=𝐸𝑗(1+α𝑗)
After testing this theory numerically, the results showed an overestimation of damage.
Nevertheless, it managed to locate and assess the damage degree.
As a conclusion, the usage of modal parameters with extracting algorithm can estimate
modal frequencies and their shape, as for damage detection algorithm are based on
the prior diagnosis of modal properties. So, it is essential to solve the equation of
motion with multiple degrees of freedom as to evaluate the dynamic response.
Reduction of these degrees is done by modal matrix.
58
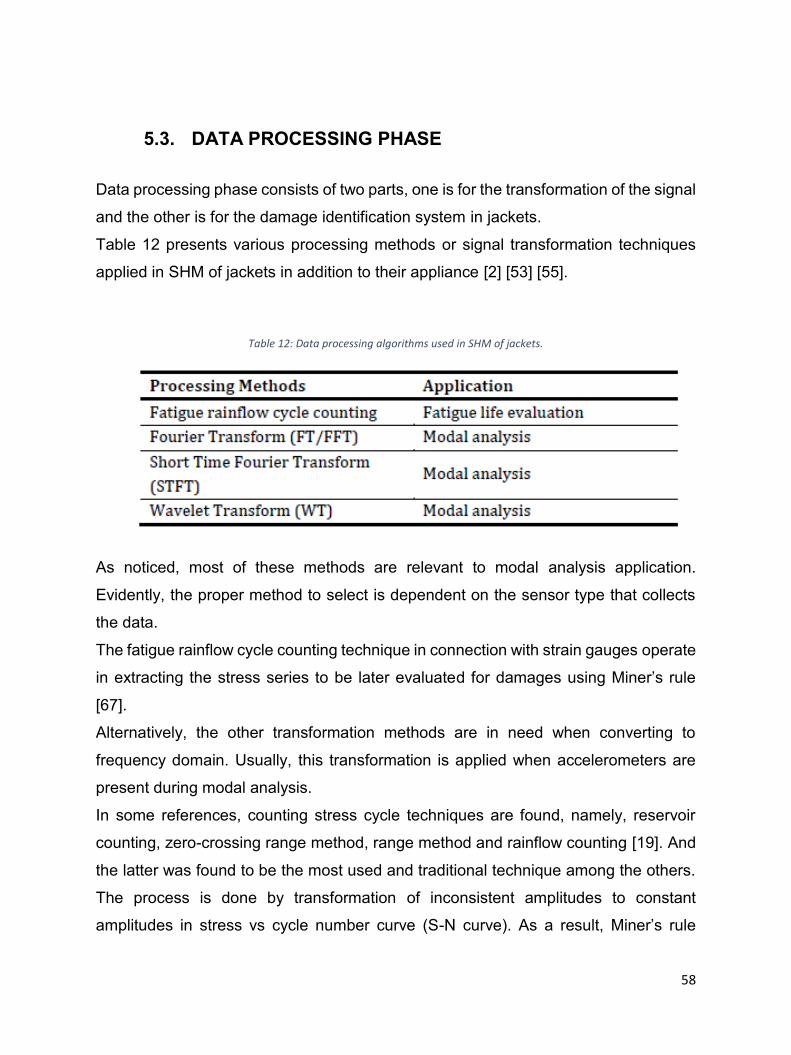
5.3. DATA PROCESSING PHASE Data processing phase consists of two parts, one is for the transformation of the signal
and the other is for the damage identification system in jackets.
Table 12 presents various processing methods or signal transformation techniques
applied in SHM of jackets in addition to their appliance [2] [53] [55].
Table 12: Data processing algorithms used in SHM of jackets.
As noticed, most of these methods are relevant to modal analysis application.
Evidently, the proper method to select is dependent on the sensor type that collects
the data.
The fatigue rainflow cycle counting technique in connection with strain gauges operate
in extracting the stress series to be later evaluated for damages using Miner’s rule
[67].
Alternatively, the other transformation methods are in need when converting to
frequency domain. Usually, this transformation is applied when accelerometers are
present during modal analysis.
In some references, counting stress cycle techniques are found, namely, reservoir
counting, zero-crossing range method, range method and rainflow counting [19]. And
the latter was found to be the most used and traditional technique among the others.
The process is done by transformation of inconsistent amplitudes to constant
amplitudes in stress vs cycle number curve (S-N curve). As a result, Miner’s rule
59
evaluates the remaining fatigue life by the input provided as the number of cycle per
day [67].
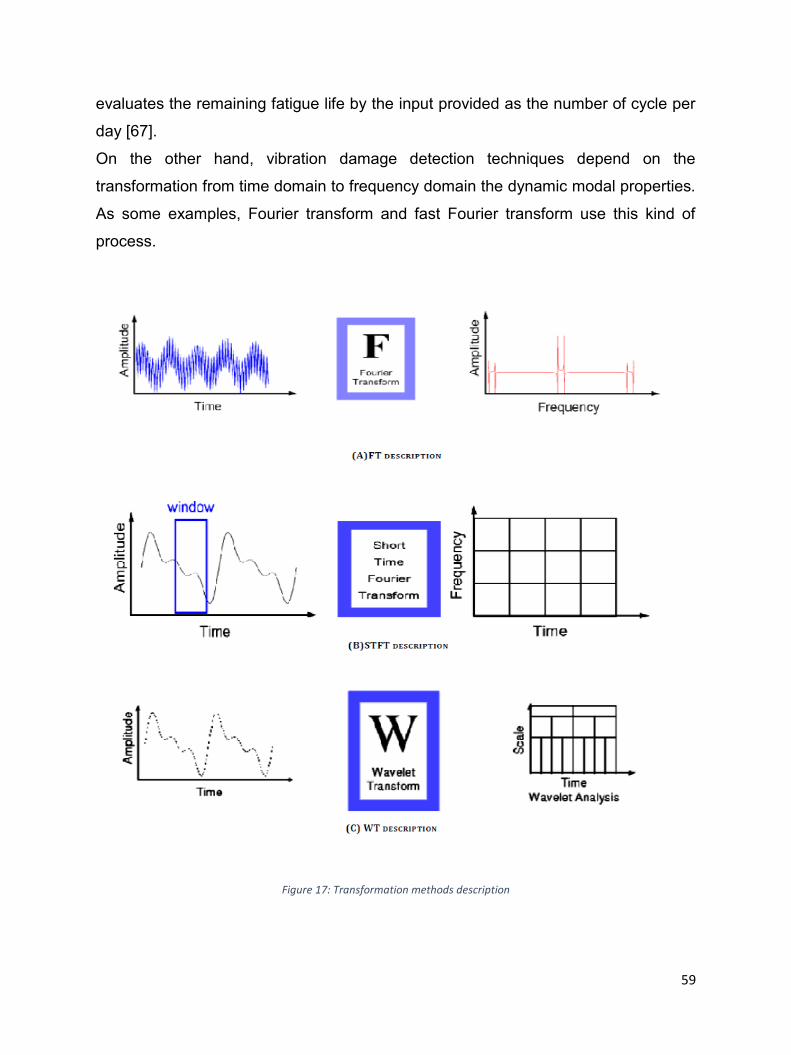
On the other hand, vibration damage detection techniques depend on the
transformation from time domain to frequency domain the dynamic modal properties.
As some examples, Fourier transform and fast Fourier transform use this kind of
process.
Figure 17: Transformation methods description

60
Knowingly, vibration-based damage method can detect cracks. To do so, high modes
needs to be monitored or in another way said high frequency signals. For that reason,
a more efficient method is introduced like short time Fourier transfer. Its algorithm
processes high frequency signals by separating the signal in windows and treats them
each one at a time. Note that STFT method does not take into account the high and
low signals instead it evaluates the signal in a constant resolution.
On the contrary, a new way in processing frequency signals, wavelet transform uses
irregular resolutions relatively dependent on high and low signals. Thus, it adjusts the
irregular resolution with the capability of detecting different signals.
All these transformations are illustrated in Figure 17 [2].
61
5.3.1. NUMERICAL ANALYSIS AND STRATEGIES Validation of numerical model is an important step to predict structural responses and
to accomplish a better cost effectiveness analysis. Usually, a system identification
domain based on inverse analysis of a structure, measures the input and output
signals by tracing the variation of key parameters such as stiffness.
In SHM, some traditional methods are used to extract information from measurements
based on mathematical principles like:
instrumental variable method, least squares methods, maximum likelihood method,
natural frequency-based method, gradient search methods, filter methods, and mode
shape-based methods.
These techniques, despite their success, need an initial good guess for unknown
parameters and noise sensitivity. However, input measurement is not always
achievable. Thus, only methods with output measurements are chosen. In some
experiments aim to identify forces with a known system. While in others measures
variations over time of the structure parameters. These measurements mostly include
iterative least-squares procedures.
On the other hand, Non-traditional methods based on experimental principles and
relies on computational resources and make no assumptions. Some of these non-
traditional techniques are: simulated annealing (SA) method, artificial neural networks
(ANN) method, particle swarm optimization (PSO) method and genetic algorithms
(GA).
SA is a global optimization method [62] but its accuracy of estimating the severity of
the damage is influenced by unfinished measurements and noise.
PSO algorithm was widely applied to structural problems but many obvious
parameters effected the union of the optimization search.
ANN method, as discussed in the above section, is used for damage detection
problems. However, it is very dependent on the guided outlines, thus it is restricted to
the number of unknown parameters.

62
Particularly, GA was successful in many optimization and discovering problems like
identification of parameters in non-linear system, damage detection with non-perfect
analytical model and detection change with frequency-based and mode shapes-
based.
Nevertheless, with large systems with several unknown parameters, it becomes hard
to convert using GA methods. Some researchers developed a sub-division method to
make it easier to identify the large structural systems. It is done by measuring
acceleration between substructures with no approximation of interface forces. A new
method is recently termed “search space reduction method” (SSRM), and it applies
some improvements on migration and artificial selection by using some local search
to adjust the space of global search.
As a matter of fact, the previous researches are mostly applied to land structures. In
addition to these developments, offshore structures are more challenging and based
on stiffness identification by measuring ambient forces. Some goes with the traditional
method, thus requiring assumptions of initial parameters, and some others adjusted
to recognize the natural frequencies of offshore structures and comparing them to the
measured vibration signals in order to detect damage locations. Nevertheless, this
approach is challenging because not every change in stiffness of a member leads to
a variation of frequency.
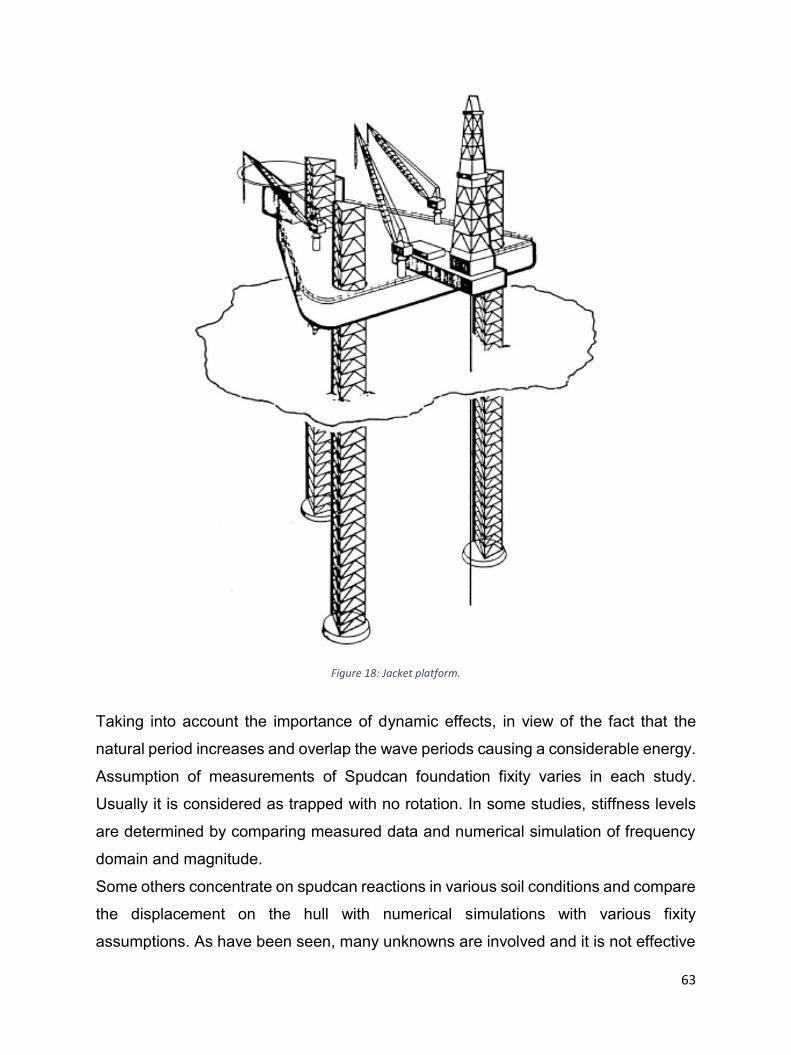
In this section, the identification of sub-division structures in a large platform will be
discussed on a jack-up platform with three legs supported and founded in the seabed
by spudcan as in Figure 18.
63
Figure 18: Jacket platform.
Taking into account the importance of dynamic effects, in view of the fact that the
natural period increases and overlap the wave periods causing a considerable energy.
Assumption of measurements of Spudcan foundation fixity varies in each study.
Usually it is considered as trapped with no rotation. In some studies, stiffness levels
are determined by comparing measured data and numerical simulation of frequency
domain and magnitude.
Some others concentrate on spudcan reactions in various soil conditions and compare
the displacement on the hull with numerical simulations with various fixity
assumptions. As have been seen, many unknowns are involved and it is not effective
64
for optimization. Furthermore, leg flexibility is very significant for dynamic analysis. In
other words, it is important to consider stiffness and spudcan fixity parameters. Also,
it is necessary to include the unknown parameters like hydrodynamic effects into the
identification of jacket platform.
As a matter of fact, strategies in time domain and frequency domain are proposed to
overcome the difficulties with many degrees of freedom and unknows like initial
conditions, wave loading, hydrodynamic effects [68].
Forward analysis
First, forward analysis should be taken into account in the study of structural
identification. The calculated dynamic response can be manipulated into the numerical
simulation as measurements.
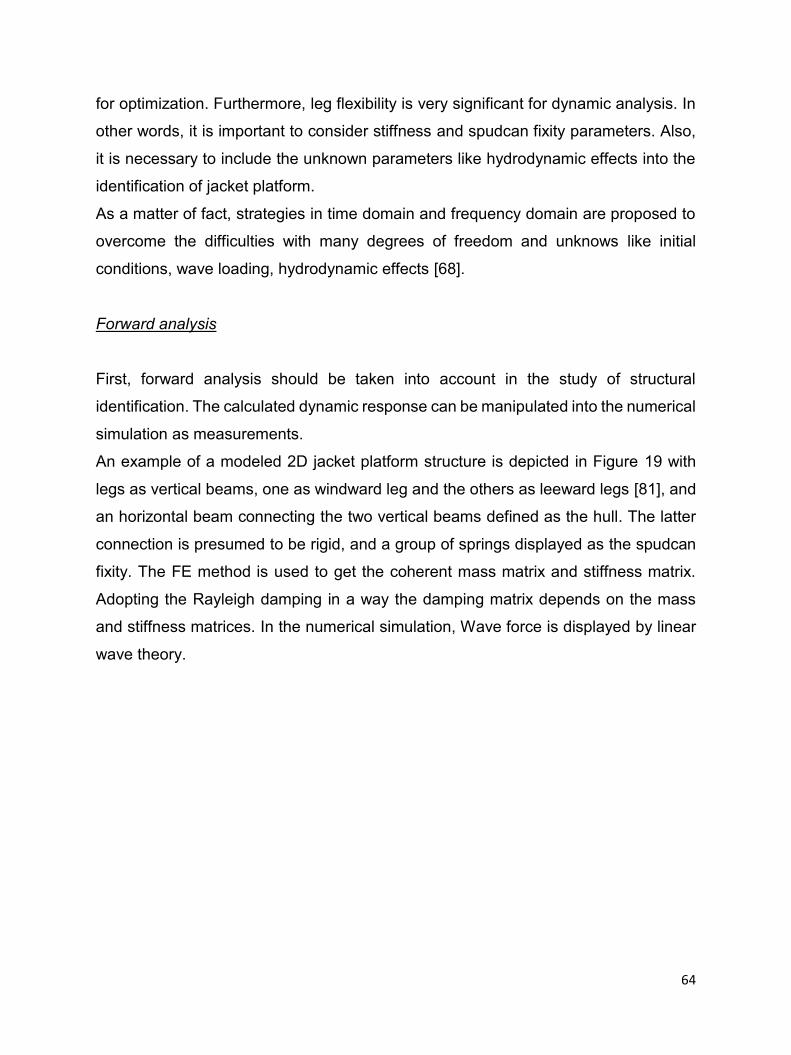
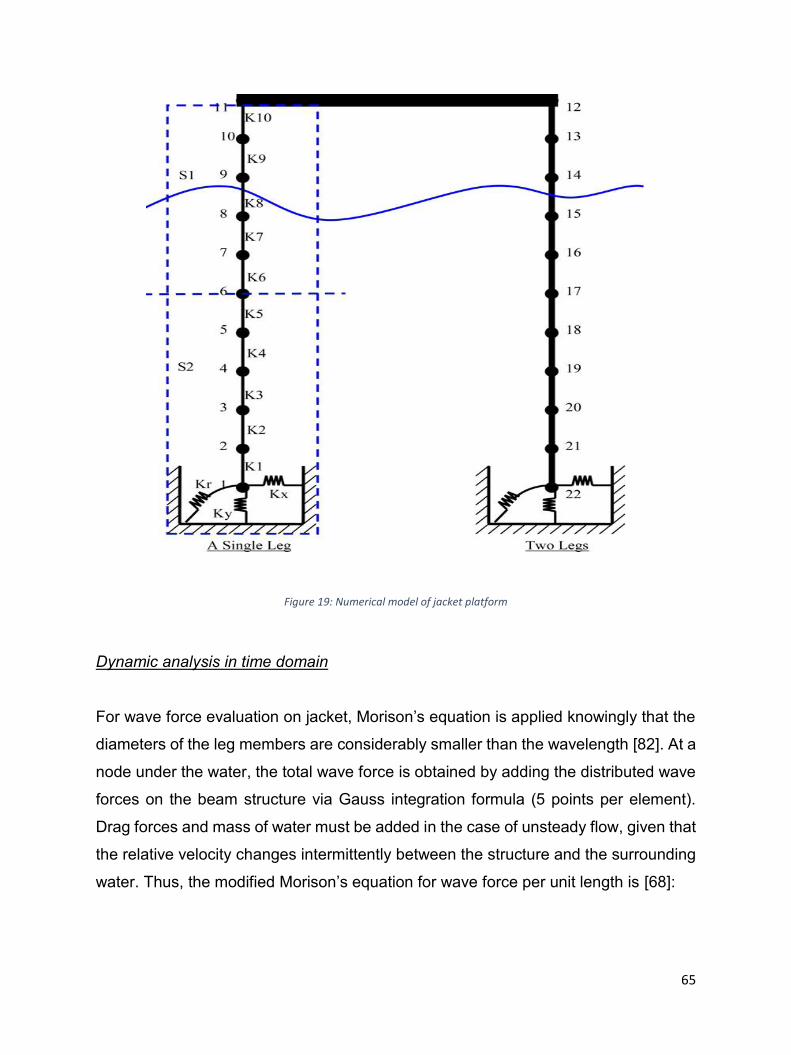
An example of a modeled 2D jacket platform structure is depicted in Figure 19 with
legs as vertical beams, one as windward leg and the others as leeward legs [81], and
an horizontal beam connecting the two vertical beams defined as the hull. The latter
connection is presumed to be rigid, and a group of springs displayed as the spudcan
fixity. The FE method is used to get the coherent mass matrix and stiffness matrix.
Adopting the Rayleigh damping in a way the damping matrix depends on the mass
and stiffness matrices. In the numerical simulation, Wave force is displayed by linear
wave theory.
65
Figure 19: Numerical model of jacket platform
Dynamic analysis in time domain
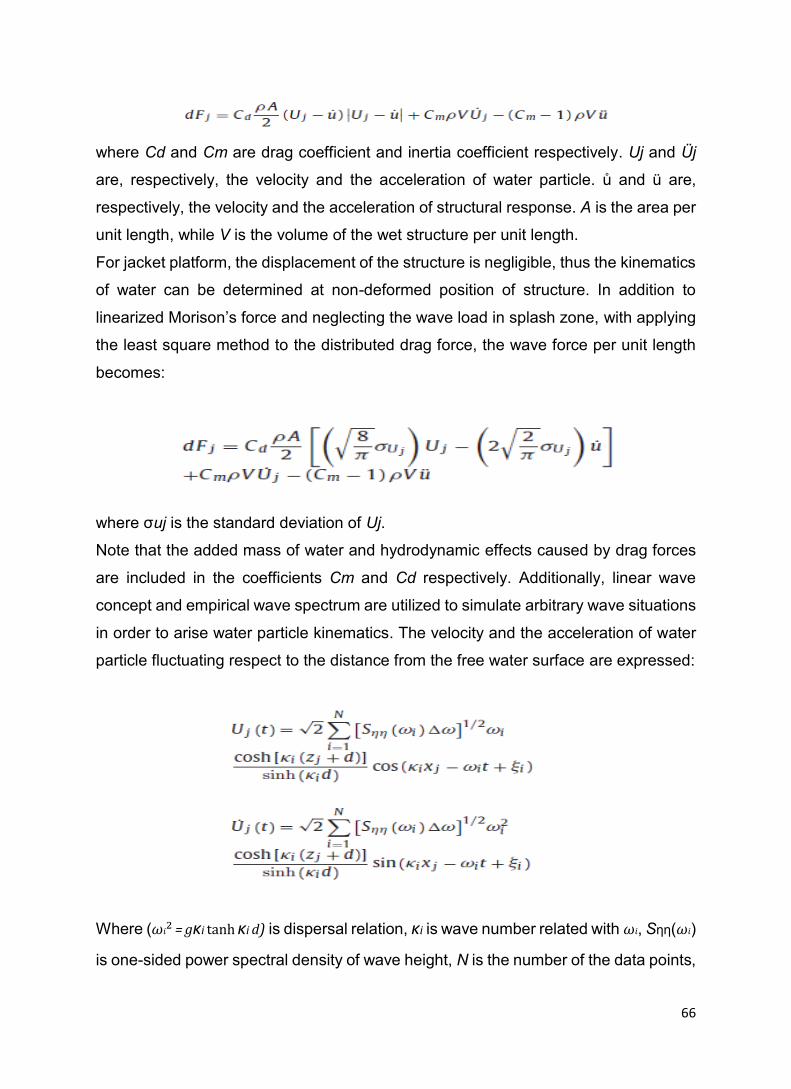
For wave force evaluation on jacket, Morison’s equation is applied knowingly that the
diameters of the leg members are considerably smaller than the wavelength [82]. At a
node under the water, the total wave force is obtained by adding the distributed wave
forces on the beam structure via Gauss integration formula (5 points per element).
Drag forces and mass of water must be added in the case of unsteady flow, given that
the relative velocity changes intermittently between the structure and the surrounding
water. Thus, the modified Morison’s equation for wave force per unit length is [68]:
66
where Cd and Cm are drag coefficient and inertia coefficient respectively. Uj and Üj
are, respectively, the velocity and the acceleration of water particle. ů and ü are,
respectively, the velocity and the acceleration of structural response. A is the area per
unit length, while V is the volume of the wet structure per unit length.
For jacket platform, the displacement of the structure is negligible, thus the kinematics
of water can be determined at non-deformed position of structure. In addition to
linearized Morison’s force and neglecting the wave load in splash zone, with applying
the least square method to the distributed drag force, the wave force per unit length
becomes:
where σuj is the standard deviation of Uj.
Note that the added mass of water and hydrodynamic effects caused by drag forces
are included in the coefficients Cm and Cd respectively. Additionally, linear wave
concept and empirical wave spectrum are utilized to simulate arbitrary wave situations
in order to arise water particle kinematics. The velocity and the acceleration of water
particle fluctuating respect to the distance from the free water surface are expressed:
Where (𝜔𝑖2 = gκi tanh κi d) is dispersal relation, κi is wave number related with 𝜔𝑖, Sηη(𝜔𝑖)
is one-sided power spectral density of wave height, N is the number of the data points,

67
zj is the vertical coordinate of node j (assuming the coordinate system is placed on the
free water surface), 𝜔𝑖 =iΔω is the frequency of the ith wave component, xj is the
coordinate along wave direction, and ξi is statistically independent random phase
angle uniformly distributed between 0 and 2π.
Making a note of not using the input (wave loading) in the projected identification
strategies since it is dependent on the output. Hence, the simulation of kinematics of
water particle is founded on deterministic spectral amplitude and is suitable in the
forward analysis to calculate dynamic response as simulated measurements. Besides,
Rayleigh damping matrix is applied in the numerical model with the Rayleigh damping
coefficients α, β in which they are valued by cracking two equations concerning the
damping ratios for two specific modes.
Finally, re-representing equation of motion for dynamic analysis by:
The added mass and drag induced damping are in the mass matrix M and damping
matrix C respectively. K is the global stiffness matrix and P is the effective wave
force.
Dynamic analysis in frequency domain
Equation of motion for structural analysis can be converted into frequency domain by
Fourier transform resulting in the following equation [68]:
where ω is circular frequency (rad / s) and over hat symbol “ˆ” designates Fourier
transform. Then, structural response vector in frequency domain can be calculated
as:

68
where G (iω) is frequency response matrix. Consequently, spectral density matrix of
structural response designed for spectral analysis can be attained by the following
equation:
Proposed identification strategies
Sub-structural identification is a strategy to reduce the size of the system instead of
struggling with the quasi-impossible detection interpretation in big structures. This
strategy is also called divide-and-conquer strategy. As an advantage, this method
simplifies the condition by subtracting the complex connections from the sub-structure
like the connection leg-hull. Figure 20 illustrates the sub-divisions of the single leg of
the structure in the figure above into two divisions: S1 represents the top-half of the
leg, S2 represents the bottom-half of the leg with the spudcan fixity. Note that analysis
in two-dimensional frame is more efficient than three-dimensional model [68].
As for the selection of the direction of the leg, it is done according to the corresponding
measurement plane. Whereas parameters in the other plane are to be documented.
As for similar procedure in the new plane, the selection is repeated. Also, damping
coefficients (α, β) are considered as unknown parameters in the identification
procedure besides the main unknown parameters like stiffness and spudcan fixity.
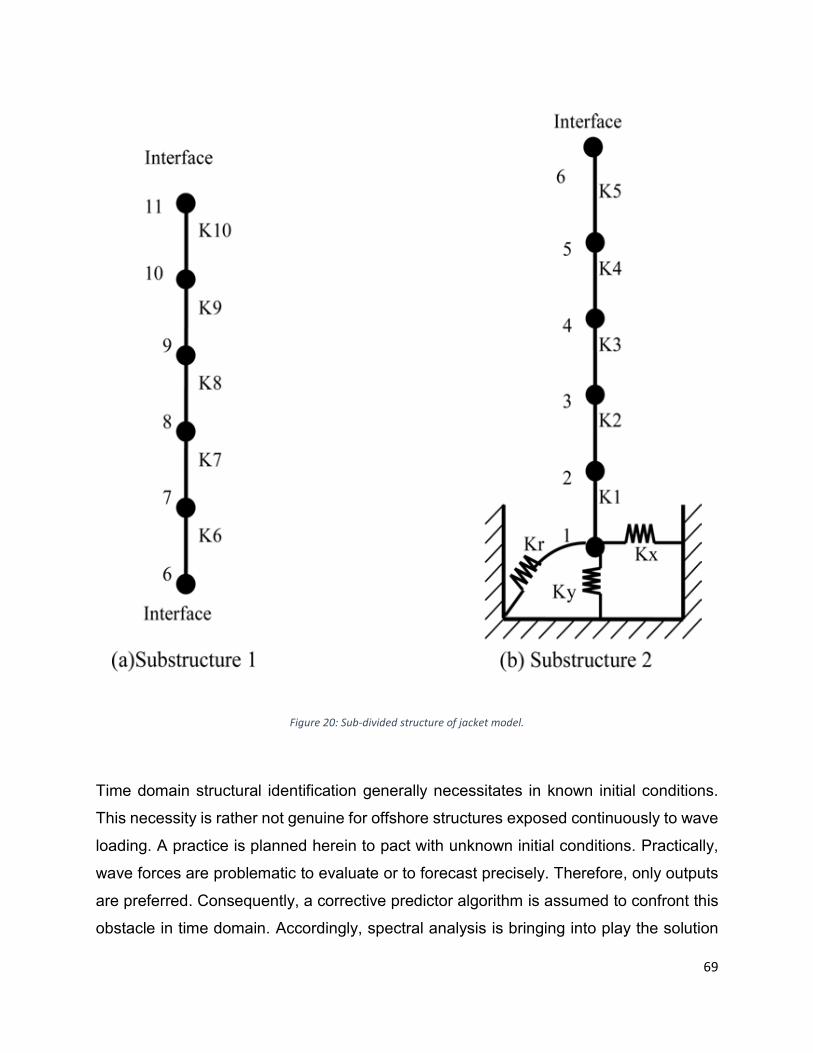
69
Figure 20: Sub-divided structure of jacket model.
Time domain structural identification generally necessitates in known initial conditions.
This necessity is rather not genuine for offshore structures exposed continuously to wave
loading. A practice is planned herein to pact with unknown initial conditions. Practically,
wave forces are problematic to evaluate or to forecast precisely. Therefore, only outputs
are preferred. Consequently, a corrective predictor algorithm is assumed to confront this
obstacle in time domain. Accordingly, spectral analysis is bringing into play the solution
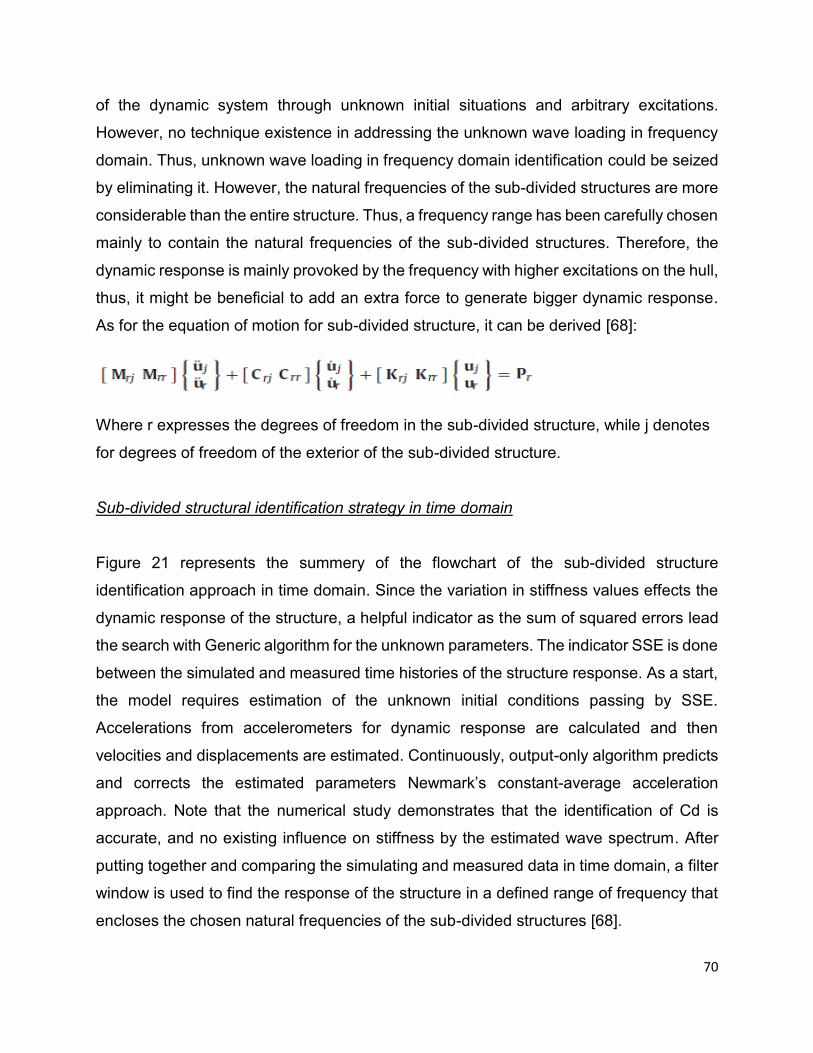
70
of the dynamic system through unknown initial situations and arbitrary excitations.
However, no technique existence in addressing the unknown wave loading in frequency
domain. Thus, unknown wave loading in frequency domain identification could be seized
by eliminating it. However, the natural frequencies of the sub-divided structures are more
considerable than the entire structure. Thus, a frequency range has been carefully chosen
mainly to contain the natural frequencies of the sub-divided structures. Therefore, the
dynamic response is mainly provoked by the frequency with higher excitations on the hull,
thus, it might be beneficial to add an extra force to generate bigger dynamic response.
As for the equation of motion for sub-divided structure, it can be derived [68]:
Where r expresses the degrees of freedom in the sub-divided structure, while j denotes
for degrees of freedom of the exterior of the sub-divided structure.
Sub-divided structural identification strategy in time domain
Figure 21 represents the summery of the flowchart of the sub-divided structure
identification approach in time domain. Since the variation in stiffness values effects the
dynamic response of the structure, a helpful indicator as the sum of squared errors lead
the search with Generic algorithm for the unknown parameters. The indicator SSE is done
between the simulated and measured time histories of the structure response. As a start,
the model requires estimation of the unknown initial conditions passing by SSE.
Accelerations from accelerometers for dynamic response are calculated and then
velocities and displacements are estimated. Continuously, output-only algorithm predicts
and corrects the estimated parameters Newmark’s constant-average acceleration
approach. Note that the numerical study demonstrates that the identification of Cd is
accurate, and no existing influence on stiffness by the estimated wave spectrum. After
putting together and comparing the simulating and measured data in time domain, a filter
window is used to find the response of the structure in a defined range of frequency that
encloses the chosen natural frequencies of the sub-divided structures [68].
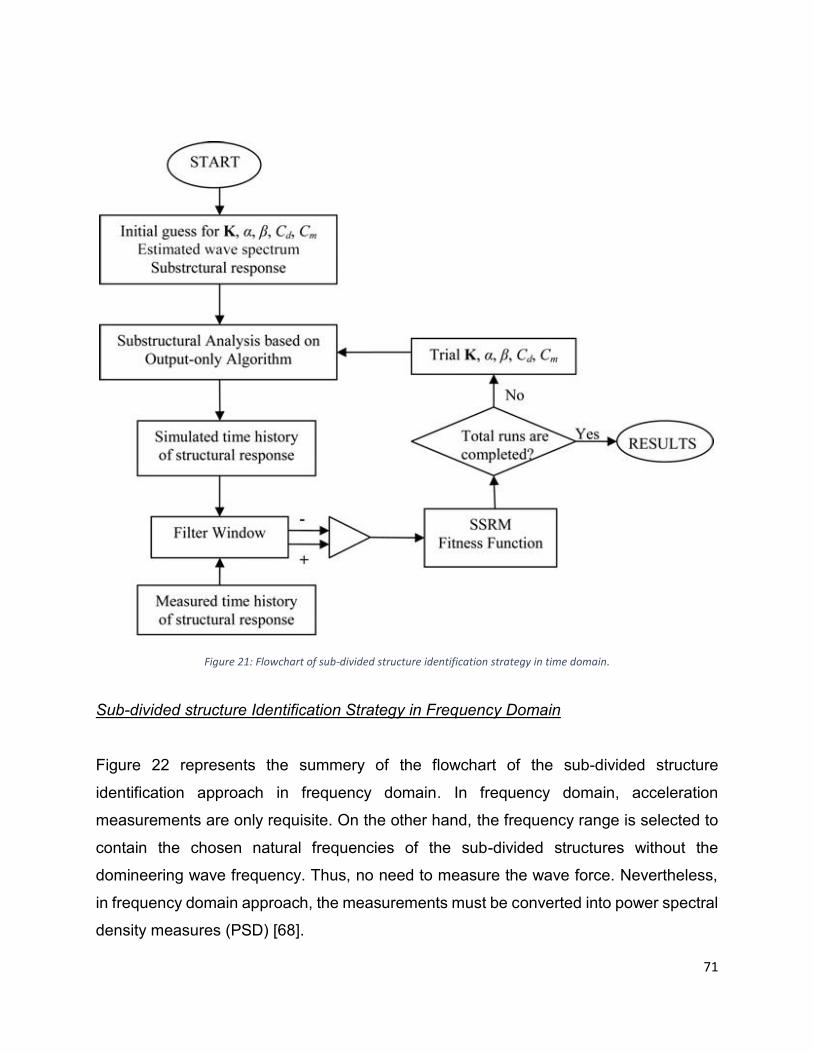
71
Figure 21: Flowchart of sub-divided structure identification strategy in time domain.
Sub-divided structure Identification Strategy in Frequency Domain
Figure 22 represents the summery of the flowchart of the sub-divided structure
identification approach in frequency domain. In frequency domain, acceleration
measurements are only requisite. On the other hand, the frequency range is selected to
contain the chosen natural frequencies of the sub-divided structures without the
domineering wave frequency. Thus, no need to measure the wave force. Nevertheless,
in frequency domain approach, the measurements must be converted into power spectral
density measures (PSD) [68].
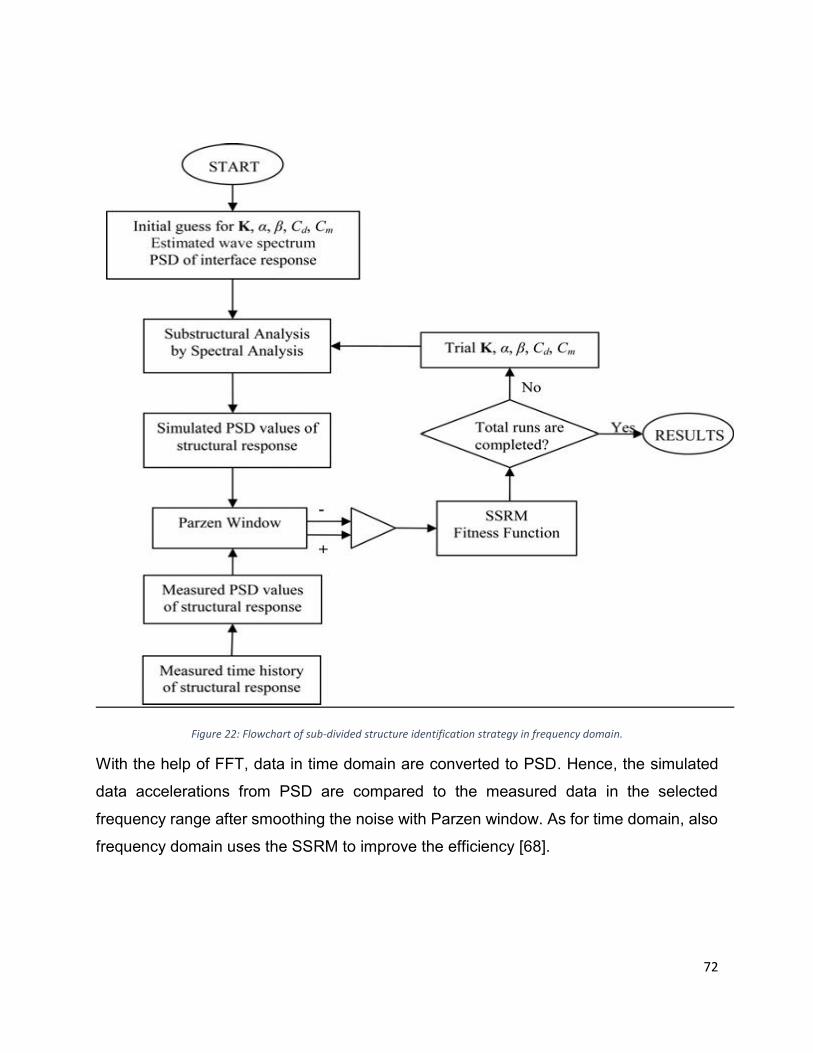
72
Figure 22: Flowchart of sub-divided structure identification strategy in frequency domain.
With the help of FFT, data in time domain are converted to PSD. Hence, the simulated
data accelerations from PSD are compared to the measured data in the selected
frequency range after smoothing the noise with Parzen window. As for time domain, also
frequency domain uses the SSRM to improve the efficiency [68].
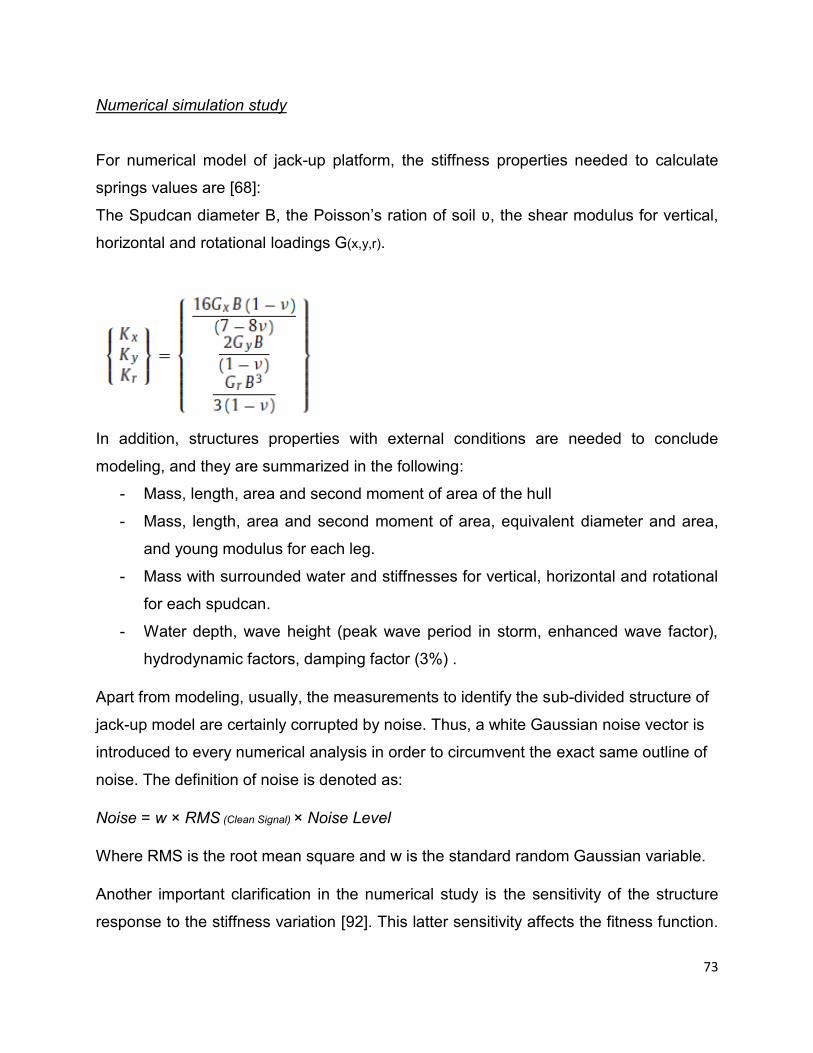
73
Numerical simulation study
For numerical model of jack-up platform, the stiffness properties needed to calculate
springs values are [68]:
The Spudcan diameter B, the Poisson’s ration of soil ʋ, the shear modulus for vertical,
horizontal and rotational loadings G(x,y,r).
In addition, structures properties with external conditions are needed to conclude
modeling, and they are summarized in the following:
- Mass, length, area and second moment of area of the hull
- Mass, length, area and second moment of area, equivalent diameter and area,
and young modulus for each leg.
- Mass with surrounded water and stiffnesses for vertical, horizontal and rotational
for each spudcan.
- Water depth, wave height (peak wave period in storm, enhanced wave factor),
hydrodynamic factors, damping factor (3%) .
Apart from modeling, usually, the measurements to identify the sub-divided structure of
jack-up model are certainly corrupted by noise. Thus, a white Gaussian noise vector is
introduced to every numerical analysis in order to circumvent the exact same outline of
noise. The definition of noise is denoted as:
Noise = w × RMS (Clean Signal) × Noise Level
Where RMS is the root mean square and w is the standard random Gaussian variable.
Another important clarification in the numerical study is the sensitivity of the structure
response to the stiffness variation [92]. This latter sensitivity affects the fitness function.
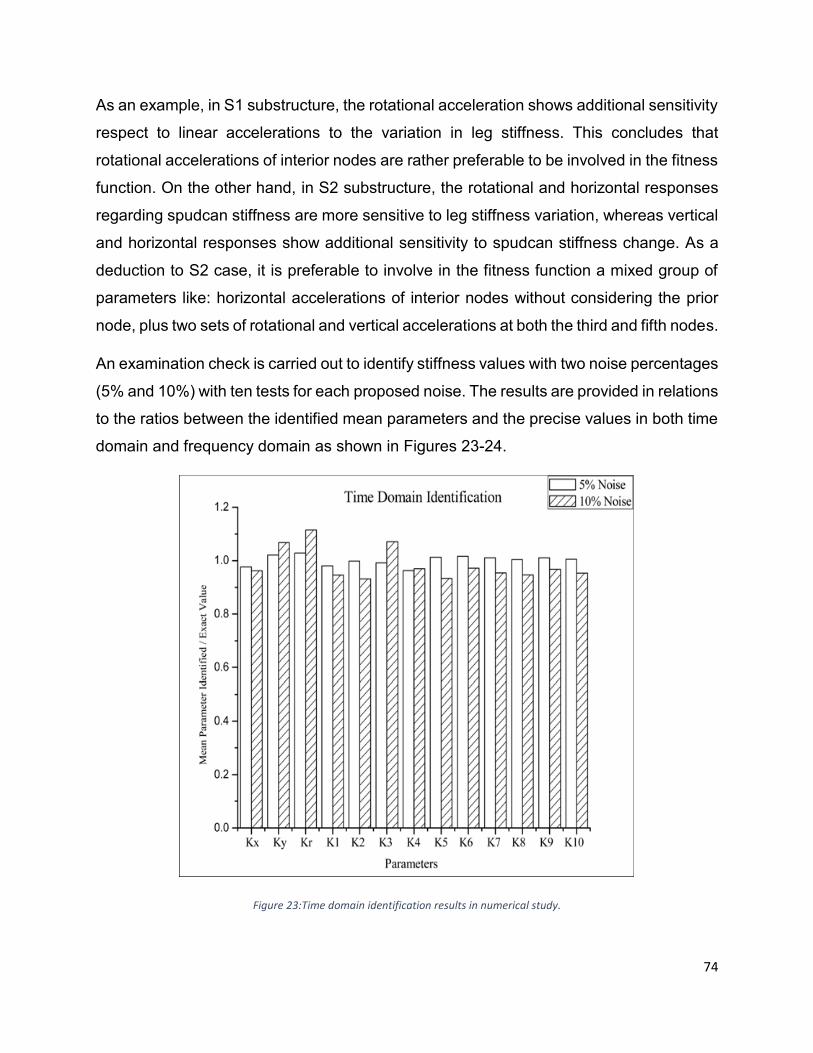
74
As an example, in S1 substructure, the rotational acceleration shows additional sensitivity
respect to linear accelerations to the variation in leg stiffness. This concludes that
rotational accelerations of interior nodes are rather preferable to be involved in the fitness
function. On the other hand, in S2 substructure, the rotational and horizontal responses
regarding spudcan stiffness are more sensitive to leg stiffness variation, whereas vertical
and horizontal responses show additional sensitivity to spudcan stiffness change. As a
deduction to S2 case, it is preferable to involve in the fitness function a mixed group of
parameters like: horizontal accelerations of interior nodes without considering the prior
node, plus two sets of rotational and vertical accelerations at both the third and fifth nodes.
An examination check is carried out to identify stiffness values with two noise percentages
(5% and 10%) with ten tests for each proposed noise. The results are provided in relations
to the ratios between the identified mean parameters and the precise values in both time
domain and frequency domain as shown in Figures 23-24.
Figure 23:Time domain identification results in numerical study.
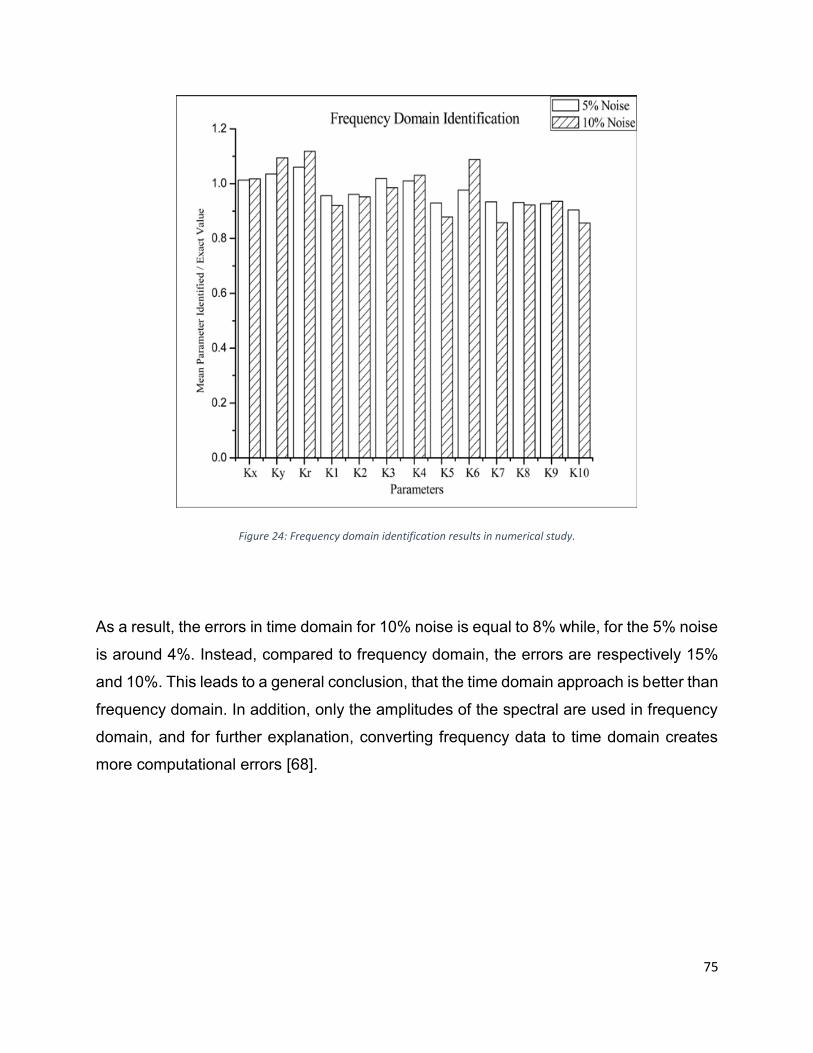
75
Figure 24: Frequency domain identification results in numerical study.
As a result, the errors in time domain for 10% noise is equal to 8% while, for the 5% noise
is around 4%. Instead, compared to frequency domain, the errors are respectively 15%
and 10%. This leads to a general conclusion, that the time domain approach is better than
frequency domain. In addition, only the amplitudes of the spectral are used in frequency
domain, and for further explanation, converting frequency data to time domain creates
more computational errors [68].
76
5.4. EVALUATION PHASE
The evaluation phase consists of three parts: damage evaluation, Identification of
acceptance criteria and the required corrective actions needed.
Damage evaluation
Damage evaluation involves an assessment of the processed data to be able to justify
the concerning motives in mind.
As introduced in earlier sections, damage detection based on vibration is parted into four
levels, where [2]:
- Level 1: Determination that damage is present in the structure
- Level 2: Level 1 plus determination of the geometric location of the damage
- Level 3: Level 2 plus quantification of the severity of the damage
- Level 4: Level 3 plus prediction of the remaining service life of the structure
Typically, a quantifiable valuation is achieved with models neglecting noises from signals.
Table 13 cites some familiar model techniques with their advantages and disadvantages
[69] [70] [71].
FLS is a method with no adoption of the binary value instead it makes decision grounded
on full detailed knowledge [69] [71]. In contrast, AIS model depends on human immune
system based on memory capacity and learning skills to expand its detection. Thus, it
requires a complete training of the model and existing scenarios in order to provide, in
the future analysis, a quick answer to recognizable situations. Comparing FLS and AIS
models in detecting damage on operational jackets, it is remarked that both have high
success grade even with the presence of environmental noises.
ANN as named is dependent on artificial neurons to transmit information. It is activated
with the increase of weight that respectively induces a rise in the signal intensity.
Mathematical functions simulate the activation process afterwards the other functions
calculate the real output [72].
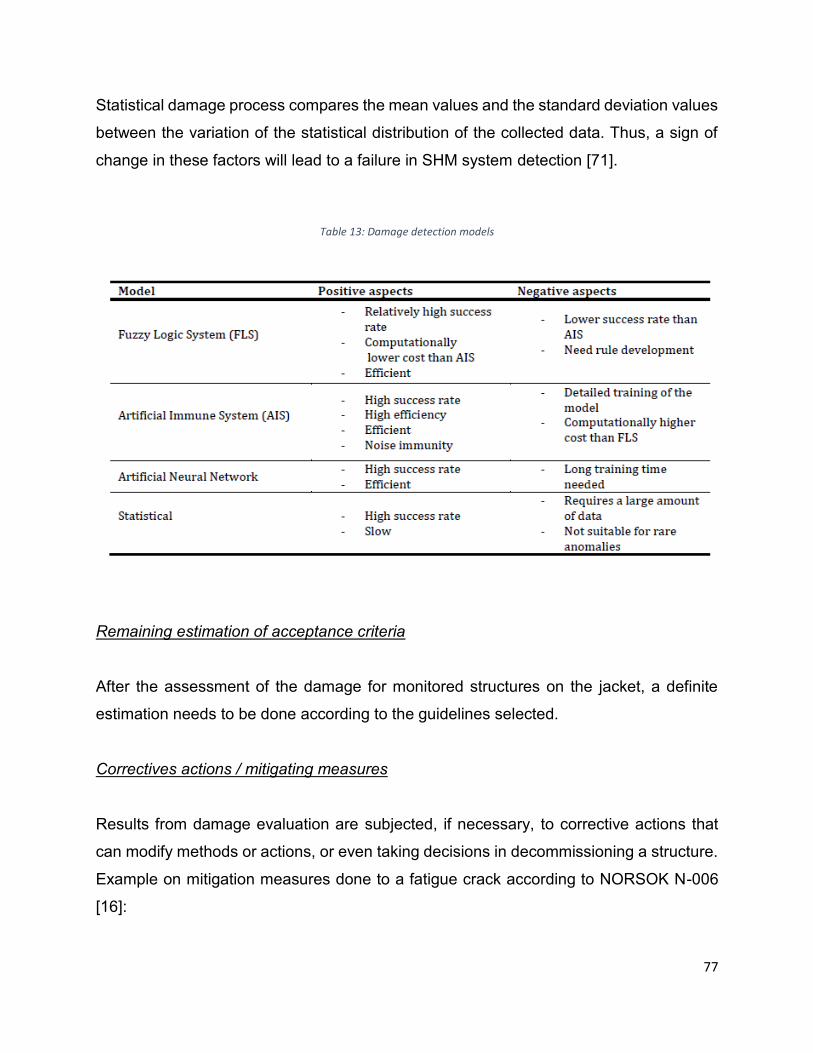
77
Statistical damage process compares the mean values and the standard deviation values
between the variation of the statistical distribution of the collected data. Thus, a sign of
change in these factors will lead to a failure in SHM system detection [71].
Table 13: Damage detection models
Remaining estimation of acceptance criteria
After the assessment of the damage for monitored structures on the jacket, a definite
estimation needs to be done according to the guidelines selected.
Correctives actions / mitigating measures
Results from damage evaluation are subjected, if necessary, to corrective actions that
can modify methods or actions, or even taking decisions in decommissioning a structure.
Example on mitigation measures done to a fatigue crack according to NORSOK N-006
[16]:

78
- reduction in loadings (substitute members, eliminate inactive conductors,
appurtenances, marine growth)
- reduction in stress level by strengthening (put new members, clamps)
- reduction in stress concentrations (by internal grouting of tubular joint)
- improvement in fatigue capacity by correcting methods.
- make in-service inspections controls in a way cracks are detected before they are
within the wall thickness and in such a way they can be confiscated by grind repair
methodology.
79
6. CONCLUSION
After defining SHM methods and their performances in different fields, and specially in
offshore platforms, a detailed description of phases is introduced to identify the steps
required to assess the state of the structure. Planning SHM system acquires motivation
establishment based on history and specified objectives with identification of failure
modes. Afterward, data normalization is a valuable step in data collection phase to be
applied in order to reduce noise for better processing phase. The latter comes in
transforming the signal into damage identification. Usually, the most used method is FFT.
At last, damage evaluation phase involves an assessment of the processed data to be
able to justify the concerning motives in mind and estimating the remaining operational
lifetime of the structure.
Bring to a close a briefing into the comparison made in this thesis, local damage technique
based on non-destructive techniques is effective in localizing the damage only on the
component examined but rather expensive while global damage pinpoints any damage
on the structure with the help of additional analyses. Nevertheless, it is noted that global
technique is frequently associated with local damage techniques. Along damage
identification methods, numerous failures modes and their parameters are compared. It
is concluded that crack propagation triggered by fatigue failure is the most common
parameter affecting the structure integrity of the jacket platform. On the other hand,
sensors selection and their characteristics plays an important role in detecting damage.
Thus, they are dependent on types of failure modes chosen to be spotted and assessed.
As proven, crack detection is preferably executed by AET sensing. The latter is more
efficient in detecting crack than corrosion. While electrical gauges and piezoelectric are
applied to strain detection. In addition, most of the data processing techniques are
relevant to modal analysis application. The dynamic characteristics are the best fitting
parameters for damage detection, but in case of noise, acoustic fingerprinting method is
best fitting.

80
I. ACKNOWLEDGMENT
I would first like to thank my thesis advisor Prof. Cecilia SURACE of DISEG department
at Politecnico di Torino. The door to Prof. SURACE office was always open whenever I
ran into a trouble spot or had a question about my research or writing. She consistently
allowed this paper to be my own work but directed me in the right the direction whenever
she thought I needed it.
I would also express my very profound gratitude to my family and friends and specially to
my brother Rabih and to my dearest Silvio for providing me with unfailing support and
continuous encouragement throughout my years of study and through the process of
researching and writing this thesis. This accomplishment would not have been possible
without them.
Thank you.
MARIEBELLE GHSOUB
81
II. REFERENCES [1] J. Ihn. SHM Definition. ME/MSE 568: Active and Sensing Materials and Their Devices.
2006.
[2] M. A. Lotfollahi-Yaghin, S. Shahverdi, R. Tarinejad, and B. Asgarian. Structural Health
Monitoring (SHM) of Offshore Jacket Platforms. ASME 2011 30th International
Conference on Ocean, Offshore and Arctic Engineering, Rotterdam, The Netherlands.
2011.
[3] O. Büyüköztürk and T.-Y. Yu. Structural Health Monitoring and Seismic Impact
Assessment. Fifth National Conference on Earthquake Engineering, Bucharest,
Romania. 2003.
[4] A. Mal, S. Banerjee, and F. Ricci. An Automated Damage Identification Technique
Based on Vibration and Wave Propagation Data. Philosophical Transactions of the Royal
Society of London A: Mathematical, Physical and Engineering Sciences, vol. 365, pp.
479-491, 2007.
[5] S. W. Doebling, C. R. Farrar, and M. B. Prime. A summary review of vibration-based
damage identification methods. Shock and vibration digest. vol. 30, pp. 91-105.1998.
[6] Lin T-H, Lu Y-C, Hung S-L. Locating Damage Using Integrated Global-Local Approach
with Wireless Sensing System and Single-Chip Impedance Measurement Device. The
Scientific World Journal. 2014; 2014:729027. doi:10.1155/2014/729027.
[7] Daniel BALAGEAS. Introduction to Structural Health Monitoring 1.1. Definition of
Structural Health Monitoring. Sementic Scholar.
[8] ISO Standardization. Petroleum and Natural Gas Industries–Fixed steel offshore
structures. vol. 19902. 2007. pp. 182-202.
[9] NORSOK. Integrity of Offshore Structures. vol. N-001. 2012.
[10] NORSOK. Actions and Action Effects.vol. N-003. 2007.
82
[11] NORSOK. Design of Steel Structures. vol. N-004. 2004.
[12] NORSOK. Structural Steel Fabrication. vol. M-101. 2011.
[13] DNV GL. Fatigue Design of Offshore Steel Structures. vol. C203. 2010.
[14] NORSOK. Condition Monitoring of Loadbearing Structures. vol. N-005.1997.
[15] DNV GL. Probabilistic Methods for Planning of Inspection for Fatigue Cracks in
Offshore Structures. vol. C210. 2016.
[16] NORSOK. Assessment of Structural Integrity for Existing Offshore Load-bearing
Structures. vol. N-006.2015.
[17] ISO Standardization. Condition Monitoring and Diagnostics of Machines - Data
Interpretation and Diagnostics techniques. vol. ISO 13379-1. 2012.
[18] T. L. Anderson, Fracture Mechanics Boca Raton, Florida: Taylor and Francis Group
2005.
[19] R. M. Kenley. Measurement of Fatigue Performance of Forties Bravo. Offshore
Technology Conference, Houston, USA. 1982.
[21] P. A. Kanter, I. Scherf, B. Pettersen, J. Osnes, H. Grigorian, W. C. Yu, et al.
Instrumentation of Ekofisk Platforms. Offshore Technology Conference, Houston, Texas.
2001.
[23] R. M. Webb and R. B. Corr. Full Scale Measurements at Magnus. Marine Structures.
vol. 4, pp. 533-569. 1991/01/01 1991.
[24] J. S. Mitchell and L. M. Rogers. Monitoring Structural Integrity of North Sea
Production Platforms by Acoustic Emission. Offshore Technology Conference, Houston,
USA.
[25] M. Manzocchi, L. Wang, and M. Wilson. Online Structural Integrity Monitoring of
Fixed Offshore Structures. Offshore Technology Conference, Houston, USA.
83
[26] Subrata K. Chakrabarti. Handbook of Offshore Engineering, Volume 2. Elsevier
Ocean Engineering Series. Elsevier, 2005. ISBN 0080443818, 9780080443812. Chapter
2.
[27] S. Chakrabarti, J. Halkyard, and C. Capanoglu. Chapter 1 - Historical Development
of Offshore Structures. Handbook of Offshore Engineering, ed London: Elsevier, 2005,
pp. 1-38.
[28] I. K. Demir. Chapter 6 - Fixed Offshore Platform Design A2 - CHAKRABARTI,
SUBRATA K. Handbook of Offshore Engineering, ed London: Elsevier, 2005. pp. 279-
417.
[29] J. Odland, Offshore Field Development.
[30] DNV GL. Determination of Structural Capacity by Non-linear FE analysis Methods.
DNV GL vol. C208. 2013.
[31] R. G. Bea, S. F. Pawsey, and R. W. Litton. Measured and Predicted Wave Forces
on Offshore Platforms. Offshore Technology Conference Houston, Texas, 1988.
[32] CODAM. Damage and incidents involving load-bearing structures and pipeline
systems. Petroleumstilsynet. 2016.
[33] NORSOK. Condition Monitoring of Loadbearing Structures. vol. N-005. 1997.
[34] G. Ersdal and I. Langen. On Assessment of Existing Offshore Structures.The Twelfth
International Offshore and Polar Engineering Conference, Kitakyushu, Japan, 2002.
[35] Cathodic protection. Wikipedia.
[36] Y. Garbatov, M. Tekgoz, C. Guedes Soares. (2017). Experimental and numerical
strength assessment of stiffened plates subjected to severe non-uniform corrosion
degradation and compressive load. Ships and Offshore Structures 12:4, pages 461-473.
[37] Axiom. Close visual inspection.
[38] Repairing and Strengthening of Ageing Offshore Structures Available:
http://www.engineerlive.com/content/21403

84
[39] FoundOcean. Expands its Subsea and Offshore Services with the Introduction of
MGC Products. 2016.
[40] D. B. D. F. Gabriels. Remote Monitoring of Offshore Structures Using Acoustic
Emission. ECNDT, Prague, Czehc Republic. 2014.
[42] M. Betti, M. Rizzo, O. Spadaccini, and A. Vignoli, "Offshore platform structural
damage identification versus robustness," in IABSE Symposium Report, 2015, pp. 86-93.
[43] VESTLI. Structure health monitoring of offshore jackets. Stavanger university. 2016.
[44] VALLEN systeme. AMSY-6 System Description. V. systeme. 2015.
[45] A. Cheung, C. Cabrera, P. Sarabandi, K. K. Nair, A. Kiremidjan, and H. Wenzel. The
application of Statistical Pattern Recognition Methods for Damage Detection to Field
Data. Smart Materials and Structures. 2008.
[46] C. J. Hellier. Acoustic Emission Testing. Handbook of Nondestructive Evaluation. ed:
Springer. 2001.
[47] NDT Resource Center. Acoustic Emission. Data display. 2016.
[48] N. Instruments. FBG Optical Sensing: A New Alternative for Challenging Strain
Measurements. 2016
[49] E. Di Biagio. A Case Study of Vibrating-wire Sensors That Have Vibrated
Continuously for 27 Years. The 6th International Symposium on Field Measurements in
Geomechanics, Oslo, Norway. 2003.
[50] Piezoelectricity. Wikipedia.
[51] Optic fiber. Wikipedia.
[52] B. Liu, J. Chen, H. Zhang, and X. Dong. Research on Fiber-grating-based Wireless
Sensor Networks. Photonic Sensors. vol. 2, pp. 166-172. 2012.
[53] L. Sun, H.-N. Li, L. Ren, and Q. Jin. Dynamic Response Measurement of Offshore
Platform Model by FBG Sensors. Sensors and Actuators A: Physical, vol. 136, pp. 572-
579. 5/16 2007.

85
[55] Metal Samples. 2016. Electrical Resistance (ER) Monitoring.
[57] M. J. S. Lowe and P. Cawley. Long Range Guided Wave Inspection Usage – Current
Commercial Capabilities and Research Directions. Department of Mechanical
Engineering Imperial College London03/29/2006 2006.
[59] Mecon Ltd. Cost Effective Structural Monitoring - An Acoustic Method, Phase 2.
Health and Safety Executive 325. 2005.
[60] Mecon Ltd. Cost effective Structural Monitoring - An Acoustic Method, Phase 2b.
Health and Safety Executive 326. 2005.
[61] T. Nagayama and B. F. Spencer Jr. Structural Health Monitoring Using Smart
Sensors. Newmark Structural Engineering Laboratory. University of Illinois at Urbana-
Champaign 1940-9826. 2007.
[62] M. Sun, W. J. Staszewski, and R. N. Swamy. Smart Sensing Technologies for
Structural Health Monitoring of Civil Engineering Structures. Advances in Civil
Engineering. vol. 2010, p. 13. 2010.
[63] Charles R. Farrar, Keith Worden. STRUCTURAL HEALTH MONITORING
AMACHINE LEARNING PERSPECTIVE. 2013 John Wiley & Sons, Ltd. ISBN 978-1-119-
99433-6.
[64] S. Rubin and R. N. Coppolino. Flexibility Monitoring of Offshore Jacket Platforms.
Offshore Technology Conference, Houston, USA.
[65] M. Kianian1, A.A. Golafshani1 and E. Ghodrati2. Damage Detection of Offshore
Jacket Structures Using Frequency Domain Selective Measurements. J. Marine Sci. Appl.
(2013) 12: 193-199.
[66] J.-T. Kim and N. Stubbs. Damage Detection In Offshore Jacket Structures From
Limited Modal Information. International Journal of Offshore and Polar Engineering. vol.
5, 1995/3/1/ 1995.
[67] P. Faulkner, P. Cutter, and A. Owens. Structural Health Monitoring Systems in
Difficult Environments—Offshore Wind Turbines. 6th European Workshop on Structural
Health Monitoring, Dresden, Germany. 2012.
86
[68] X.M. Wang a, C.G. Koh b, J. Zhang b. Substructural identification of jack-up platform
in time and frequency domains. Applied Ocean Research 44 (2014) 53–62.
[69] A. Mojtahedi, M. A. L. Yaghin, F. Abbasidoust, and M. M. Ettefagh. Developing a
Robust Structural Health Monitoring Method for Offshore Jacket Platform Using Modified
AIS Algorithm. Twenty-first International Offshore and Polar Engineering Conference,
Hawaii, USA. 2011. pp. 210-218.
[70] P. M. Pawar and R. Ganguli. Genetic Fuzzy System for Online Structural Health
Monitoring of Composite Helicopter Rotor Blades. Mechanical Systems and Signal
Processing. vol. 21, pp. 2212-2236, 7. 2007.
[71] A. Cheung, C. Cabrera, P. Sarabandi, K. K. Nair, A. Kiremidjan, and H. Wenzel. The
application of Statistical Pattern Recognition Methods for Damage Detection to Field
Data. Smart Materials and Structures. 2008.
[72] C. Gershenson. 05/29/2016). Artificial Neural Networks for Beginners. 8. Available:
https://arxiv.org/ftp/cs/papers/0308/0308031.pdf
[73] Shehata E. Abdel Raheem (2016) Nonlinear behaviour of steel fixed
offshore platform under environmental loads, Ships and Offshore Structures, 11:1, 1-15,
DOI:10.1080/17445302.2014.954301.