Embed Size (px)
Citation preview
Structural Holes vs. Network Closure, May 2000, Page 1
Pre-print for a chapter in Social Capital: Theory and Research,edited by Nan Lin, Karen S. Cook, and R. S. Burt. Aldine de Gruyter, 2001.
Structural Holes versus Network Closureas Social Capital
May 2000
© Ronald S. BurtUniversity of Chicago and Institute Européen d’Administration d”Affaires (INSEAD)[773-702-0848; [email protected]]
This chapter is about two network structures that have been argued to create social
capital. The closure argument is that social capital is created by a network of
strongly interconnected elements. The structural hole argument is that social
capital is created by a network in which people can broker connections between
otherwise disconnected segments. I draw from a comprehensive review elsewhere
(Burt, 2000) to support two points in this chapter: there is replicated empirical
evidence on the social capital of structural holes, and the contradiction between
network closure and structural holes can be resolved in a more general network
model of social capital. Brokerage across structural holes is the source of value
added, but closure can be critical to realizing the value buried in structural holes.
SOCIAL CAPITAL METAPHOR
The two arguments are grounded in the same social capital metaphor, so it is
useful to begin with the metaphor as a frame of reference. Cast in diverse styles of
argument (e.g., Coleman, 1990; Bourdieu and Wacquant, 1992; Burt 1992;
Putnam, 1993), social capital is a metaphor about advantage. Society can be

Structural Holes vs. Network Closure, May 2000, Page 2
viewed as a market in which people exchange all variety of goods and ideas in
pursuit of their interests. Certain people, or certain groups of people, do better in
the sense of receiving higher returns to their efforts. Some people enjoy higher
incomes. Some more quickly become prominent. Some lead more important
projects. The interests of some are better served than the interests of others. The
human capital explanation of the inequality is that the people who do better are
more able individuals; they are more intelligent, more attractive, more articulate,
more skilled.
Social capital is the contextual complement to human capital. The social
capital metaphor is that the people who do better are somehow better connected.
Certain people or certain groups are connected to certain others, trusting certain
others, obligated to support certain others, dependent on exchange with certain
others. Holding a certain position in the structure of these exchanges can be an
asset in its own right. That asset is social capital, in essence, a concept of location
effects in differentiated markets. For example, Bourdieu is often quoted in defining
social capital as the resources that result from social structure (Bourdieu and
Wacquant, 1992, 119, expanded from Bourdieu, 1980); “social capital is the sum of
the resources, actual or virtual, that accrue to an individual or group by virtue of
possessing a durable network of more or less institutionalized relationships of
mutual acquaintance and recognition.” Coleman, another often-cited source,
defines social capital as a function of social structure producing advantage
(Coleman, 1990, 302; from Coleman 1988, S98); “Social capital is defined by its
function. It is not a single entity but a variety of different entities having two
characteristics in common: They all consist of some aspect of a social structure,
and they facilitate certain actions of individuals who are within the structure. Like
other forms of capital, social capital is productive, making possible the achievement
of certain ends that would not be attainable in its absence.” Putnam (1993, 167)
grounds his influential work in Coleman’s metaphor, preserving the focus on action
facilitated by social structure: “Social capital here refers to features of social
organization, such as trust, norms, and networks, that can improve the efficiency of
society by facilitating coordinated action.” I echo the above with a social capital

Structural Holes vs. Network Closure, May 2000, Page 3
metaphor to begin my argument about the competitive advantage of structural
holes (Burt, 1992, 8, 45).
So there is a point of general agreement from which to begin a discussion of
social capital. The cited perspectives on social capital are diverse in origin and
style of accompanying evidence, but they agree on a social capital metaphor in
which social structure is a kind of capital that can create for certain individuals or
groups a competitive advantage in pursuing their ends. Better connected people
enjoy higher returns.
TWO NETWORK MECHANISMS
Disagreements begin when social capital as a metaphor is made concrete with
network models of what it means to be “better” connected. Connections are
grounded in the history of a market. Certain people have met frequently. Certain
people have sought one another out. Certain people have completed exchanges
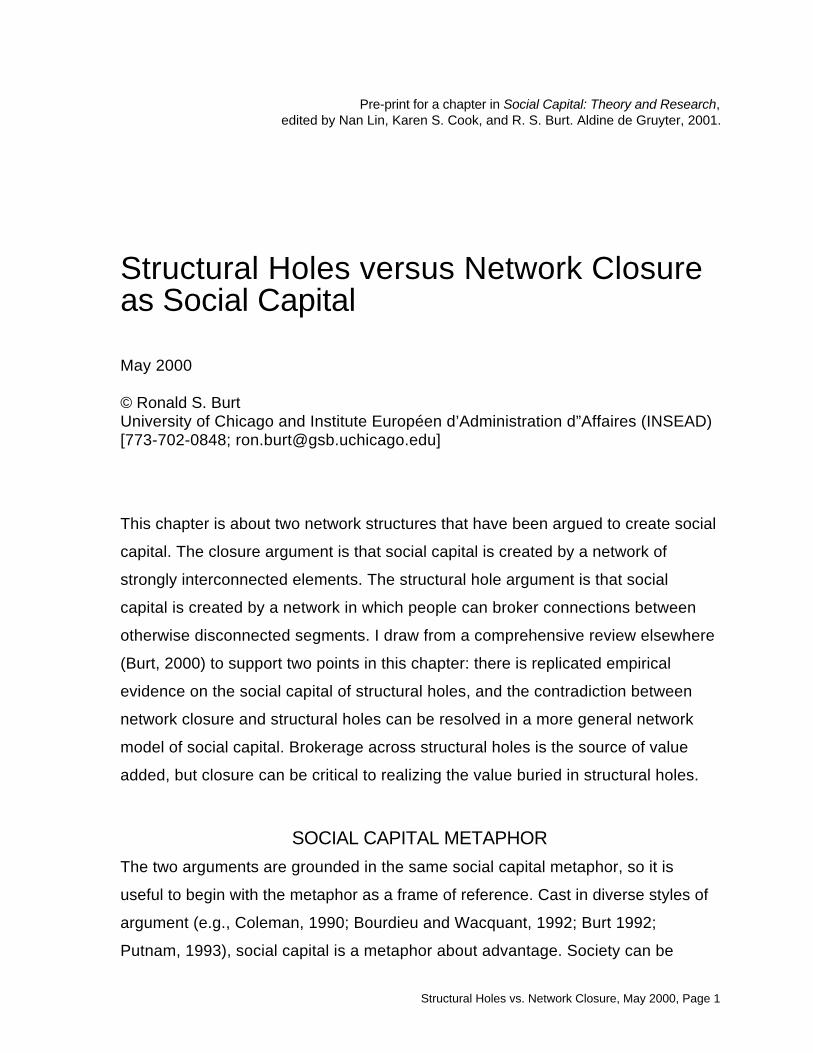
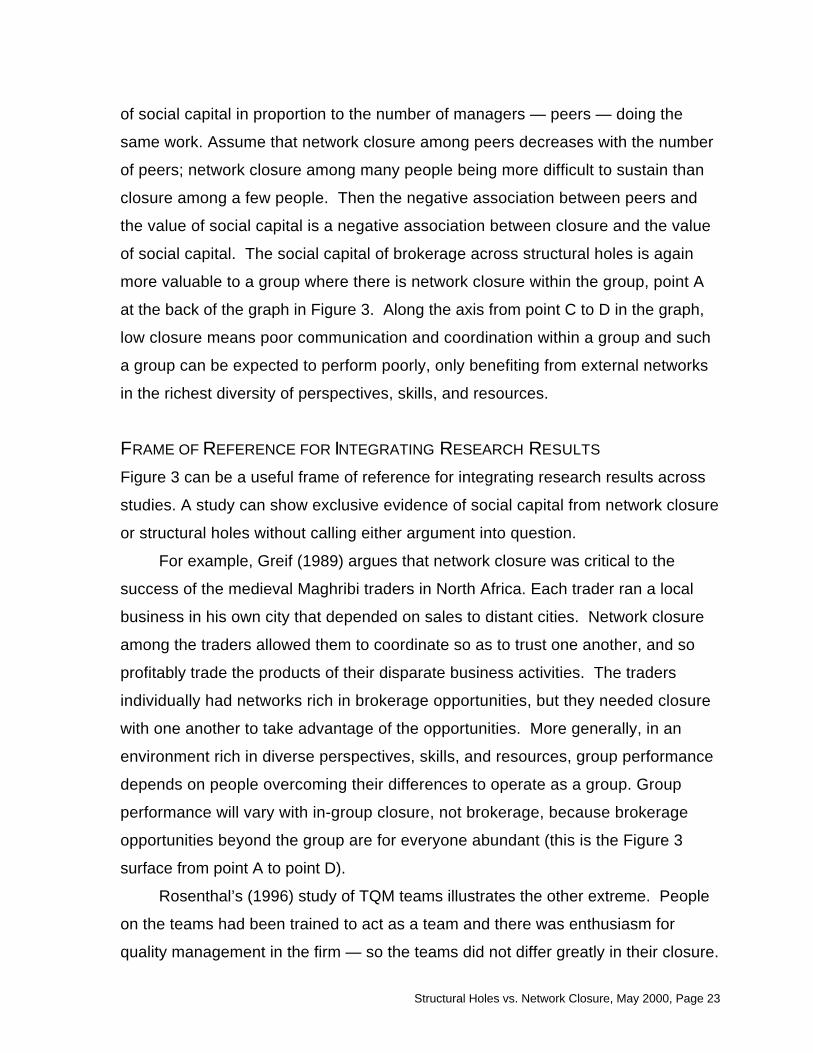
with one another. There is at any moment a network, as illustrated in Figure 1, in
which individuals are variably connected to one another as a function of prior
contact, exchange, and attendant emotions. Figure 1 is a generic sociogram and
density table description of a network. People are dots. Relationships are lines.
Solid (dashed) lines connect pairs of people who have a strong (weak)
relationship.
——— Figure 1 About Here ———
In theory, the network residue from yesterday should be irrelevant to market
behavior tomorrow. I buy from the seller with the most attractive offer. That seller
may or may not be the seller I often see at the market, or the seller from whom I
bought yesterday. So viewed, the network in Figure 1 would recur tomorrow only if
buyers and sellers come together as they have in the past. The recurrence of the
network would have nothing to do with the prior network as a casual factor.
Continuity would be a by-product of buyers and sellers seeking one another out as
a function of supply and demand.

Structural Holes vs. Network Closure, May 2000, Page 4
Selecting the best exchange, however, requires that I have information on
available goods, sellers, buyers, and prices. Information can be expected to spread
across the people in a market, but it will circulate within groups before it circulates
between groups. A generic research finding in sociology and social psychology is
that information circulates more within than between groups — within a work group
more than between groups, within a division more than between divisions, within
an industry more than between industries. For example, the sociogram in Figure 1
and the density table at the bottom of the figure show three groups (A,B,C), and the
generic pattern of in-group relations stronger than relations between groups
(diagonal elements of the density table are higher than the off-diagonals, each cell
of the density table is the average of relations between individuals in the row and
individuals in the column). The result is that people are not simultaneously aware
of opportunities in all groups. Even if information is of high quality, and eventually
reaches everyone, the fact that diffusion occurs over an interval of time means that
individuals informed early or more broadly have an advantage.
STRUCTURAL HOLES AS SOCIAL CAPITAL
Participation in, and control of, information diffusion underlies the social capital of
structural holes (Burt, 1992). The argument describes social capital as a function of
brokerage opportunities, and draws on network concepts that emerged in
sociology during the 1970s; most notably Granovetter (1973) on the strength of
weak ties, Freeman (1977) on betweenness centrality, Cook and Emerson (1978)
on the benefits of having exclusive exchange partners, and Burt (1980) on the
structural autonomy created by complex networks. More generally, sociological
ideas elaborated by Simmel (1955 [1922]) and Merton (1968 [1957]) on the
autonomy generated by conflicting affiliations are mixed in the hole argument with
traditional economic ideas of monopoly power and oligopoly to produce network
models of competitive advantage.
The weaker connections between groups in Figure 1 are holes in the social
structure of the market. These holes in social structure — or more simply, structural
holes — create a competitive advantage for an individual whose relationships span

Structural Holes vs. Network Closure, May 2000, Page 5
the holes. The structural hole between two groups does not mean that people in
the groups are unaware of one another. It only means that the people are focused
on their own activities such that they do not attend to the activities of people in the
other group. Holes are buffers, like an insulator in an electric circuit. People on
either side of a structural hole circulate in different flows of information. Structural
holes are thus an opportunity to broker the flow of information between people, and
control the projects that bring together people from opposite sides of the hole.
Structural holes separate nonredundant sources of information, sources that
are more additive than overlapping. There are two indicators of redundancy:
cohesion and equivalence. Cohesive contacts (contacts strongly connected to
each other) are likely to have similar information and therefore provide redundant
information benefits. Structurally equivalent contacts (contacts who link a manager
to the same third parties) have the same sources of information and therefore
provide redundant information benefits.
Robert and James in Figure 1 have the same volume of connections, six
strong ties and one weak tie, but Robert has something more. James is tied to
people within group B, and through them to friends of friends all within group B, so
James is well informed about cluster B activities. Robert is also tied through friends
of friends to everyone within group B, but in addition, his strong relationship with
person “7” is a conduit for information on group A, and his strong relationship with
“6” is a conduit for information on group C. His relationship with 7 is for Robert a
network bridge in that the relationship is his only direct connection with group A.
His relationship with contact 6 meets the graph-theoretic definition of a network
bridge. Break that relationship and there is no connection between groups B and
C. More generally, Robert is a broker in the network. Network constraint is an
index that measures the extent to which a person‘s contacts are redundant (Burt,
1992). James has a constraint score twice Robert’s (30.9 versus 14.8) and Robert
is the least constrained of the people in Figure 1 (-1.4 z-score). Network
betweenness, proposed by Freeman (1977), is an index that measures the extent
to which a person brokers indirect connections between all other people in a
network. Robert’s betweenness score of 47.0 shows that almost half of indirect

Structural Holes vs. Network Closure, May 2000, Page 6
connections run through him. His score is the highest score in Figure 1, well-above
average (47.0 is a 4.0 z-score), and much higher than James’ 5.2 score, which is
below average.
Robert’s bridge connections to other groups give him an advantage with
respect to information access. He reaches a higher volume of information because
he reaches more people indirectly. Further, the diversity of his contacts across the
three separate groups means that his higher volume of information contains fewer
redundant bits of information. Further still, Robert is positioned at the cross-roads of
social organization so he is early to learn about activities in the three groups. He
corresponds to the “opinion leaders” proposed in the early diffusion literature as
the individuals responsible for the spread of new ideas and behaviors (Burt, 1999).
More, Robert’s more diverse contacts mean that he is more likely to be a candidate
discussed for inclusion in new opportunities. These benefits are compounded by
the fact that having a network that yields such benefits makes Robert more
attractive to other people as a contact in their own networks.
There is also a control advantage. Robert is in a position to bring together
otherwise disconnected contacts, which gives him disproportionate say in whose
interests are served when the contacts come together. More, the holes between his
contacts mean that he can broker communication while displaying different beliefs
and identities to each contact (“robust action” in Padgett and Ansell, 1993; see
Brieger, 1995, on the connection with structural holes). Simmel and Merton
introduced the sociology of people who derive control benefits from structural
holes: The ideal type is the tertius gaudens (literally, “the third who benefits”), a
person who benefits from brokering the connection between others (see Burt,
1992, 30-32, for review). Robert in Figure 1 is an entrepreneur in the literal sense of
the word — a person who adds value by brokering the connection between others
(Burt, 1992, 34-36; see also Aldrich, 1999, Chap. 4; Thornton, 1999). There is a
tension here, but not the hostility of combatants. It is merely uncertainty. In the
swirling mix of preferences characteristic of social networks, where no demands
have absolute authority, the tertius negotiates for favorable terms. Structural holes
are the setting for tertius strategies, and information is the substance. Accurate,

Structural Holes vs. Network Closure, May 2000, Page 7
ambiguous, or distorted information is strategically moved between contacts by the
tertius . The information and control benefits reinforce one another at any moment in
time and cumulate together over time.
Thus, individuals with contact networks rich in structural holes are the
individuals who know about, have a hand in, and exercise control over, more
rewarding opportunities. The behaviors by which they develop the opportunities
are many and varied, but the opportunity itself is at all times defined by a hole in
social structure. In terms of the argument, networks rich in the entrepreneurial
opportunities of structural holes are entrepreneurial networks, and entrepreneurs
are people skilled in building the interpersonal bridges that span structural holes.
They monitor information more effectively than bureaucratic control. They move
information faster, and to more people, than memos. They are more responsive
than a bureaucracy, easily shifting network time and energy from one solution to
another (vividly illustrated in networks of drug traffic, Williams, 1998; Morselli, 2000;
or health insurance fraud, Tillman and Indergaard, 1999). More in control of their
surroundings, brokers like Robert in Figure 1 can tailor solutions to the specific
individuals being coordinated, replacing the boiler-plate solutions of formal
bureaucracy. To these benefits of faster, better solutions, add cost reductions;
entrepreneurial managers offer inexpensive coordination relative to the
bureaucratic alternative. Speeding the process toward equilibrium, individuals with
networks rich in structural holes operate somewhere between the force of
corporate authority and the dexterity of markets, building bridges between
disconnected parts of a market where it is valuable to do so.
In sum, the hole prediction is that in comparisons between otherwise similar
people like James and Robert in Figure 1, it is Robert who has more social capital.
His network across structural holes is argued to give him broad, early access to,
and entrepreneurial control over, information.
NETWORK CLOSURE AS SOCIAL CAPITAL
Coleman’s (1988, 1990) view of social capital focuses on the risks associated with
being a broker. I will refer to Coleman’s view as a closure argument. The key idea
Structural Holes vs. Network Closure, May 2000, Page 8
is that networks with closure — that is to say networks in which everyone is
connected such that no one can escape the notice of others, which in operational
terms usually means a dense network — are the source of social capital.
Network closure is argued to do two things for people in the closed network.
First, it affects access to information (Coleman,1990:310; cf. 1988:S104): “An
important form of social capital is the potential for information the inheres in social
relations. . . . a person who is not greatly interested in current events but who is
interested in being informed about important developments can save the time
required to read a newspaper if he can get the information he wants from a friend
who pays attention to such matters.” For example, noting that information quality
deteriorates as it moves from one person to the next in a chain of intermediaries,
Baker (1984; Baker and Iyer, 1992) argues that markets with networks of more
direct connections improve communication between producers, which stabilizes
prices, the central finding in Baker’s (1984) analysis of a securities exchange.
Second, and this is the benefit more emphasized by Coleman, network
closure facilitates sanctions that make it less risky for people in the network to trust
one another. Illustrating the trust advantage with rotating-credit associations,
Coleman (1988:S103; 1990:306-307; see Biggart, 2000, for a closer look at how
such associations operate) notes; “But without a high degree of trustworthiness
among the members of the group, the institution could not exist — for a person who
receives a payout early in the sequence of meetings could abscond and leave the
others with a loss. For example, one could not imagine a rotating-credit association
operating successfully in urban areas marked by a high degree of social
disorganization — or, in other words, by a lack of social capital.” With respect to
norms and effective sanctions, Coleman (1990:310-311; cf. 1988:S104) says;
“When an effective norm does exist, it constitutes a powerful, but sometimes fragile,
form of social capital. . . .Norms in a community that support and provide effective
rewards for high achievement in school greatly facilitate the school’s task.”
Coleman (1988:S107-S108) summarizes; “The consequence of this closure is, as
in the case of the wholesale diamond market or in other similar communities, a set
of effective sanctions that can monitor and guide behavior. Reputation cannot arise
Structural Holes vs. Network Closure, May 2000, Page 9
in an open structure, and collective sanctions that would ensure trustworthiness
cannot be applied.” He continues (Coleman, 1990:318); “The effect of closure can
be seen especially well by considering a system involving parents and children. In
a community where there is an extensive set of expectations and obligations
connecting the adults, each adult can use his drawing account with other adults to
help supervise and control his children.”
Coleman’s closure argument is prominent with respect to social capital, but it
is not alone in predicting that dense networks facilitate trust and norms by
facilitating effective sanctions. In sociology, Granovetter (1985, 1992:44) argues
that the threat of sanctions makes trust more likely between people who have
mutual friends (mutual friends being a condition of “structural embeddedness”): “My
mortification at cheating a friend of long standing may be substantial even when
undiscovered. It may increase when the friend becomes aware of it. But it may
become even more unbearable when our mutual friends uncover the deceit and
tell one another.” There is an analogous argument in economics (the threat of
sanctions creating a “reputation” effect, e.g., Tullock, 1985; Greif, 1989): Mutual
acquaintances observing two people (a) make behavior between the two people
public, which (b) increases the salience of reputation for entry to future relations
with the mutual acquaintances, (c) making the two people more careful about the
cooperative image they display, which (d) increases the confidence with which
each can trust the other to cooperate. This chapter is about social capital, so I focus
on Coleman’s prediction that network closure creates social capital. I have
elsewhere discussed the network structures that facilitate trust, showing that
closure’s association with distrust and character assassination is as strong as its
association with trust (Burt, 1999a; 2001).
The closure prediction, in sum, is that in comparisons between otherwise
similar people like James and Robert in Figure 1, it is James who has more social
capital. Strong relations among his contacts are argued to give James more
reliable communication channels, and protect him from exploitation because he
and his contacts are more able to act in concert against someone who violates their
norms of conduct.
Structural Holes vs. Network Closure, May 2000, Page 10
NETWORK EVIDENCE
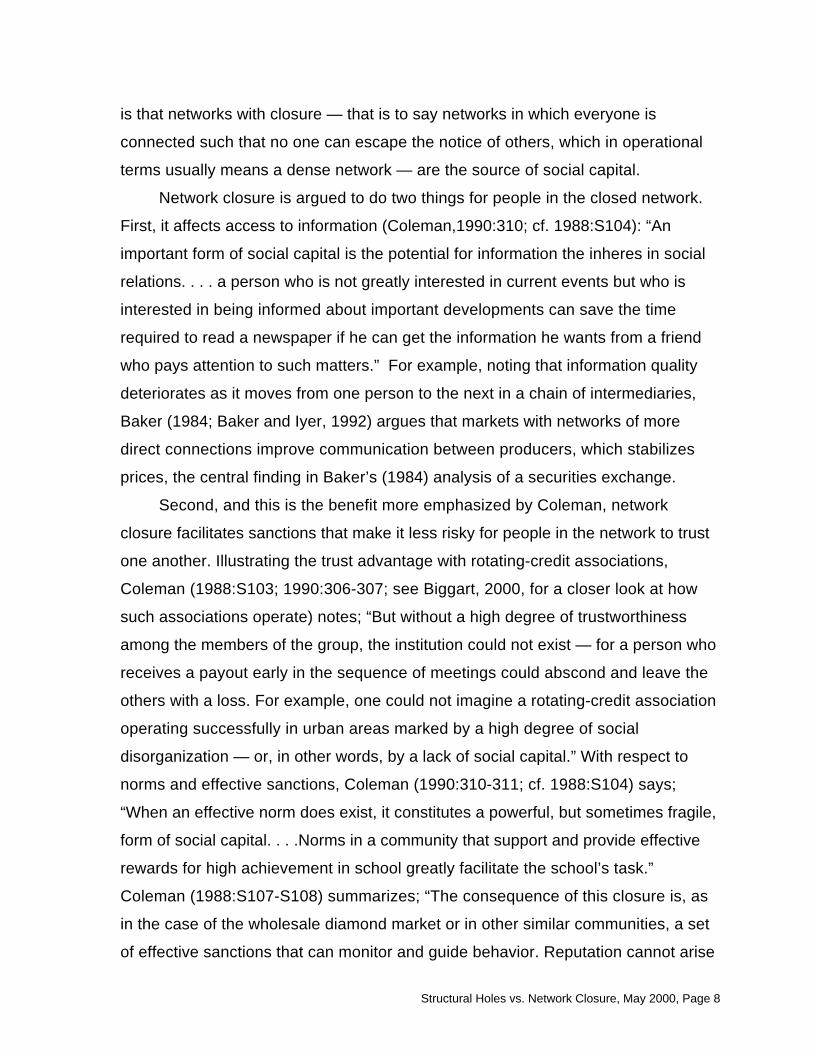
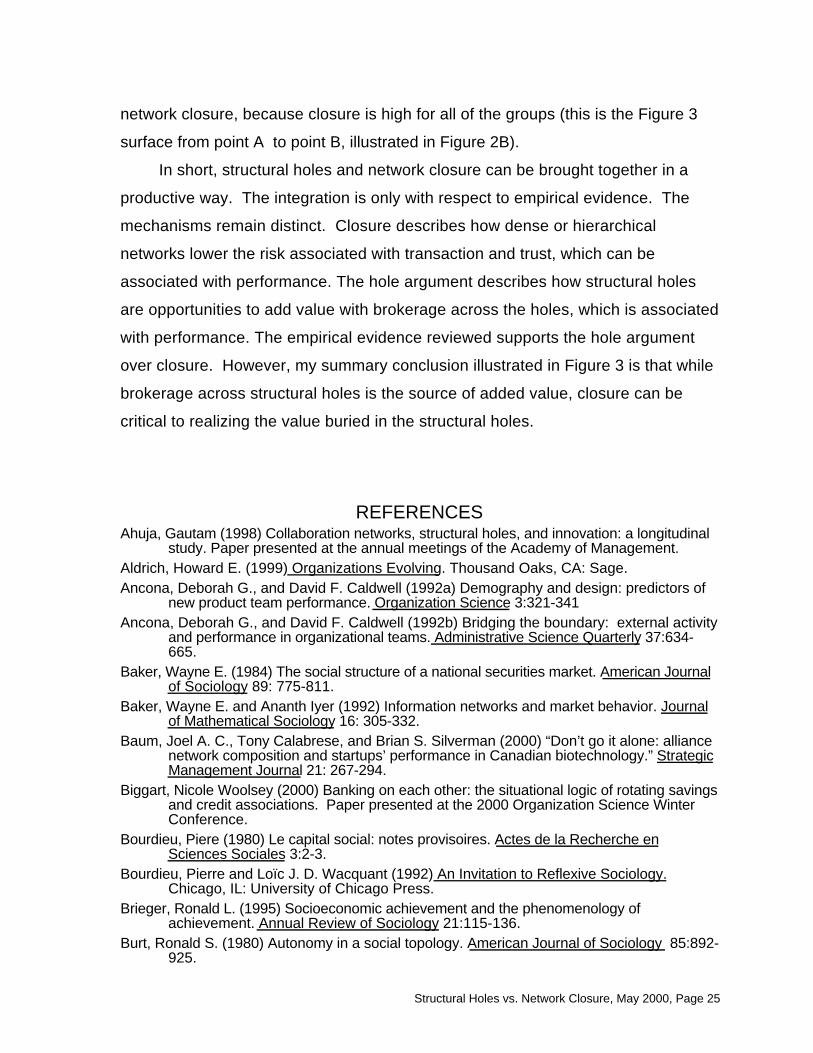
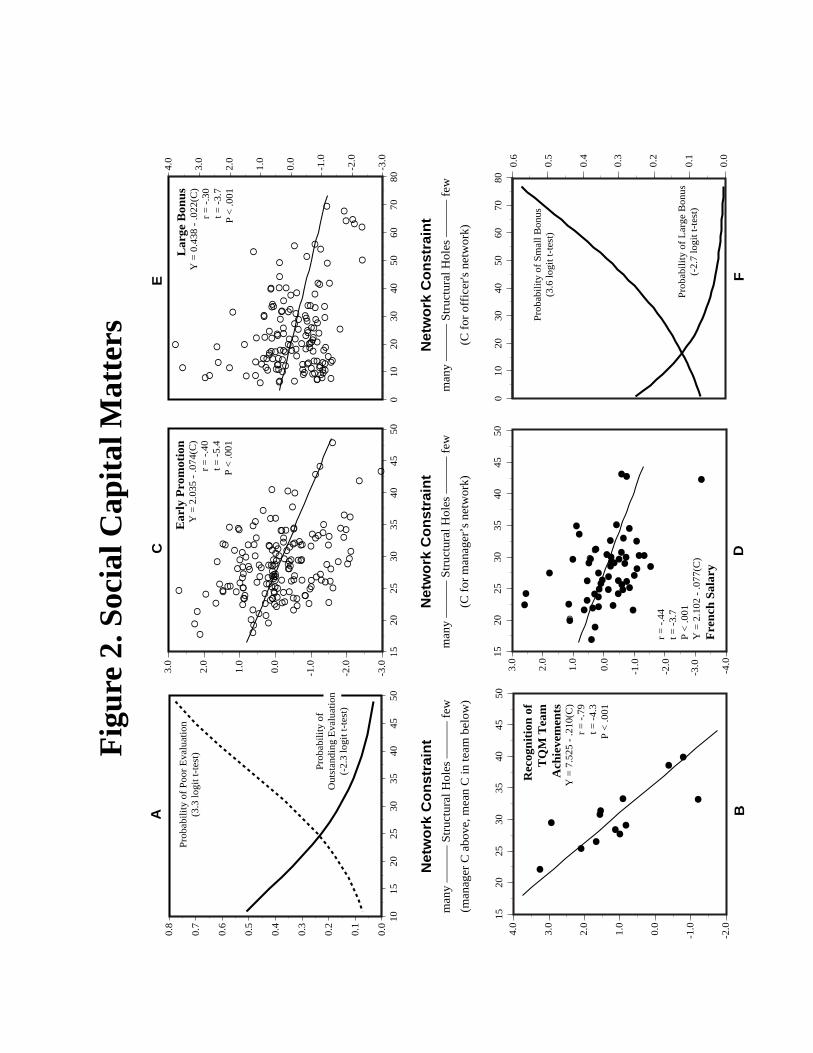
Figure 2 contains graphs describing five study populations of managers. I focus on
these managers because on them I have detailed and comparable network data.
Managers in four of the Figure 2 populations completed network questionnaires in
which they were asked to name (a) people with whom they most often discussed
important personal matters, (b) the people with whom they most often spent free
time, (c) the person to whom they report in the firm, (d) their most promising
subordinate, (e) their most valued contacts in the firm, (f) essential sources of buy-
in (g) the contact most important for their continued success in the firm, (h) their
most difficult contact, and (i) the people with whom they would discuss moving to a
new job in another firm. After naming contacts, respondents were asked about their
relation with each contact, and the strength of relations between contacts (see Burt,
1992: 121-125; 1997b; Burt, Hogarth, and Michaud, 2000, for item wording and
scaling).
The horizontal axis of each graph in Figure 2 is a network constraint index, C,
that measures social capital. Network constraint measures the extent to which a
network is directly or indirectly concentrated in a single contact. Constraint varies
with three dimensions of a network: size, density, and hierarchy (see Burt, 1992:
50ff., 1995, 1998; 2000). Constraint is low in large networks of disconnected
contacts. Constraint is high in a small network of contacts who are close to one
another (density), or strongly tied to one central contact (hierarchy). The index
begins with a measure of the extent to which manager i’s network is directly or
indirectly invested in his or her relationship with contact j: cij = (pij + Σqpiqpqj)2, for q
≠ i,j, where p ij is the proportion of i’s relations invested in contact j. The total in
parentheses is the proportion of i’s relations that are directly or indirectly invested
in connection with contact j. The sum of squared proportions, Σ jcij, is the network
constraint index C. I multiply scores by 100.
As a frame of reference, network constraint is 27.9 on average across the 841
observations in Figure 2, with a 10.5 standard deviation. The network around

Structural Holes vs. Network Closure, May 2000, Page 11
Robert in Figure 1 is less constrained than average (C = 15). Robert would appear
to the far left in each Figure 2 graph. The network around James is slightly more
constrained than average (C = 31).
——— Figure 2 About Here ———
Association between performance and network constraint is a critical test for
the two leading network mechanisms argued to provide social capital. More
constrained networks span fewer structural holes, which means less social capital
according to the hole argument. If networks that span structural holes are the
source of social capital, then performance should have a negative association with
network constraint. More constraint means more network closure, and so more
social capital according to the closure argument. If network closure is the source of
social capital, then performance should have a positive association with constraint.
The vertical axes in Figure 2 measure performance (explained below for each
study population). Each graph in Figure 2 shows a strong negative association,
supporting the argument that structural holes are the source of social capital.
PERFORMANCE EVALUATIONS
Graphs A and B show a negative association between network constraint and
performance evaluations. Figure 2A is based on a representative sample of staff
officers within the several divisions of a large financial organization in 1996 (Burt,
Jannotta, and Mahoney, 1998). The dependent variable is job performance
evaluation, taken from company personnel records. Employees are evaluated at
the end of each year on an A, B, C scale of “outstanding” to “poor” with plus and
minus used to distinguish higher from lower performances within categories. The
evaluations stay with an employee over time to affect future compensation and
promotion. Women are the majority of the several hundred employees in the staff
function (76% of all officers within the function). Of 160 staff officers who returned
network questionnaires, the majority are women (69%). The results in Figure 2 are
for the women (see Burt, 2000:Table 2, for the men). Graph A in Figure 2 shows
how the probability of an “outstanding” and a “poor” evaluation changes with
network constraint. The graph is based on a logit regression predicting the two
Structural Holes vs. Network Closure, May 2000, Page 12
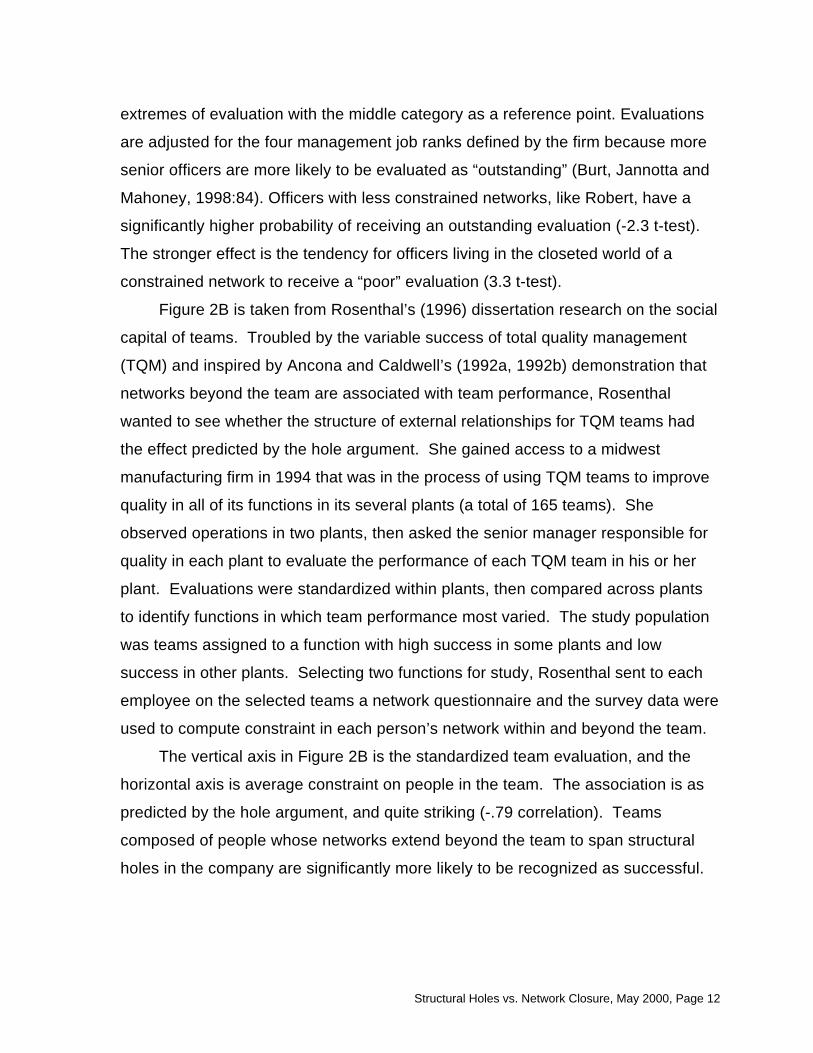
extremes of evaluation with the middle category as a reference point. Evaluations
are adjusted for the four management job ranks defined by the firm because more
senior officers are more likely to be evaluated as “outstanding” (Burt, Jannotta and
Mahoney, 1998:84). Officers with less constrained networks, like Robert, have a
significantly higher probability of receiving an outstanding evaluation (-2.3 t-test).
The stronger effect is the tendency for officers living in the closeted world of a
constrained network to receive a “poor” evaluation (3.3 t-test).
Figure 2B is taken from Rosenthal’s (1996) dissertation research on the social
capital of teams. Troubled by the variable success of total quality management
(TQM) and inspired by Ancona and Caldwell’s (1992a, 1992b) demonstration that
networks beyond the team are associated with team performance, Rosenthal
wanted to see whether the structure of external relationships for TQM teams had
the effect predicted by the hole argument. She gained access to a midwest
manufacturing firm in 1994 that was in the process of using TQM teams to improve
quality in all of its functions in its several plants (a total of 165 teams). She
observed operations in two plants, then asked the senior manager responsible for
quality in each plant to evaluate the performance of each TQM team in his or her
plant. Evaluations were standardized within plants, then compared across plants
to identify functions in which team performance most varied. The study population
was teams assigned to a function with high success in some plants and low
success in other plants. Selecting two functions for study, Rosenthal sent to each
employee on the selected teams a network questionnaire and the survey data were
used to compute constraint in each person’s network within and beyond the team.
The vertical axis in Figure 2B is the standardized team evaluation, and the
horizontal axis is average constraint on people in the team. The association is as
predicted by the hole argument, and quite striking (-.79 correlation). Teams
composed of people whose networks extend beyond the team to span structural
holes in the company are significantly more likely to be recognized as successful.

Structural Holes vs. Network Closure, May 2000, Page 13
PROMOTIONS
Figure 2C shows a negative association between promotion and network
constraint. The data are taken from a probability sample of senior managers in a
large electronics manufacturer in 1989. Performance and network data on these
managers have been discussed in detail elsewhere (Burt, 1992; 1995; 1997a;
1997b; 1998). Survey network data were obtained on diverse relationships using
the questions described above. Performance and background data on each
manager were taken from company personnel records. Company personnel
records provided each manager’s rank (four levels defined by the firm), date
promoted to current rank, date entered the firm, functional area of responsibility
(defined by the firm as sales, service, manufacturing, information systems,
engineering, marketing, finance, and human resources),and the usual personnel-
file variables such as gender, family, income, and so on.
Income in the study population was too closely tied to job rank to measure the
relative success of individual managers. Time to rank was a better performance
variable (Burt, 1992: 196-197). Whether promoted internally or hired from the
outside, people promoted to senior rank in large organizations have several years
of experience preceding their promotion. A period of time is expected to pass
before people are ready for promotion to senior rank (see Merton, 1984, on socially
expected durations). How much time is an empirical question, the answer to which
differs between individual managers. Some managers are promoted early. Early
promotion is the difference between when a manager was promoted to his current
rank and a human capital baseline model predicting the age at which similar
managers are promoted to the same rank to do the same work: E(age) - age.
Expected age at promotion E(age), is the average age at which managers with
specific personal backgrounds (education, race, gender, and seniority) have been
promoted to a specific rank within a specific function (rank, function, and plant
location). Expected age at promotion is 12% of the population variance in
promotion age, and residuals are distributed in a bell curve around expected
promotion age (Burt, 1992: 126-131; 1995). The criterion variable in Figure 2C is
the early promotion variable standardized to zero mean and unit variance.
Structural Holes vs. Network Closure, May 2000, Page 14
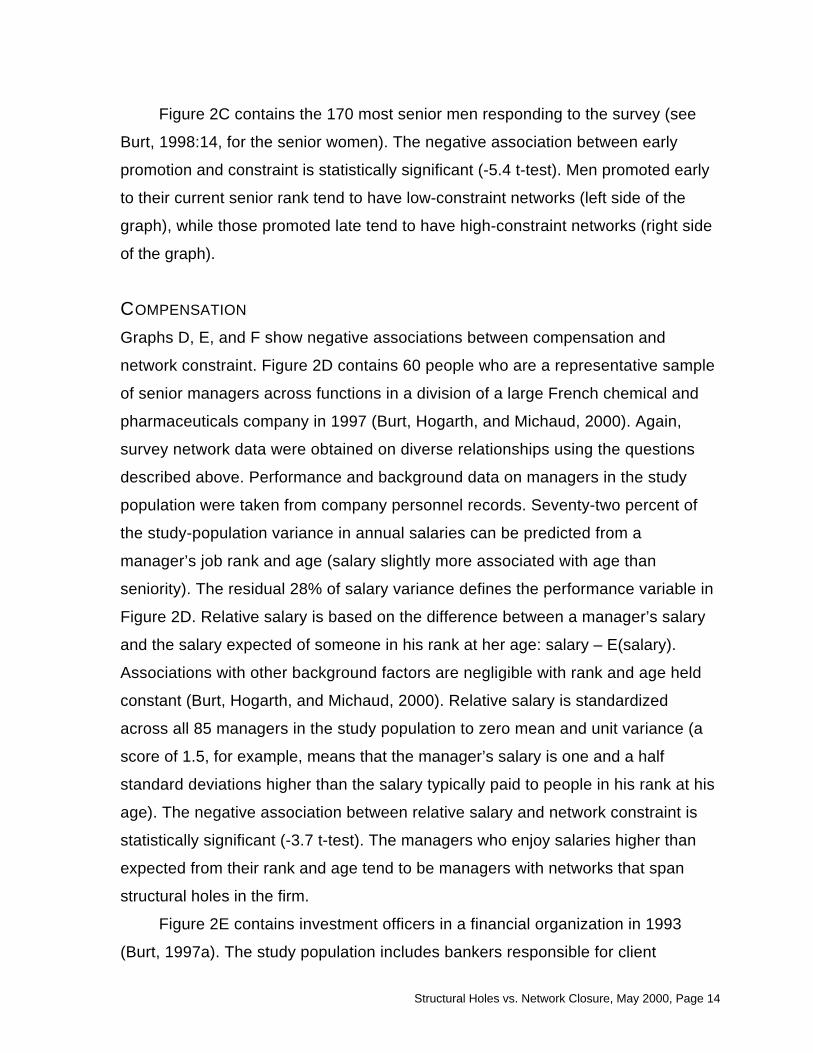
Figure 2C contains the 170 most senior men responding to the survey (see
Burt, 1998:14, for the senior women). The negative association between early
promotion and constraint is statistically significant (-5.4 t-test). Men promoted early
to their current senior rank tend to have low-constraint networks (left side of the
graph), while those promoted late tend to have high-constraint networks (right side
of the graph).
COMPENSATION
Graphs D, E, and F show negative associations between compensation and
network constraint. Figure 2D contains 60 people who are a representative sample
of senior managers across functions in a division of a large French chemical and
pharmaceuticals company in 1997 (Burt, Hogarth, and Michaud, 2000). Again,
survey network data were obtained on diverse relationships using the questions
described above. Performance and background data on managers in the study
population were taken from company personnel records. Seventy-two percent of
the study-population variance in annual salaries can be predicted from a
manager’s job rank and age (salary slightly more associated with age than
seniority). The residual 28% of salary variance defines the performance variable in
Figure 2D. Relative salary is based on the difference between a manager’s salary
and the salary expected of someone in his rank at her age: salary – E(salary).
Associations with other background factors are negligible with rank and age held
constant (Burt, Hogarth, and Michaud, 2000). Relative salary is standardized
across all 85 managers in the study population to zero mean and unit variance (a
score of 1.5, for example, means that the manager’s salary is one and a half
standard deviations higher than the salary typically paid to people in his rank at his
age). The negative association between relative salary and network constraint is
statistically significant (-3.7 t-test). The managers who enjoy salaries higher than
expected from their rank and age tend to be managers with networks that span
structural holes in the firm.
Figure 2E contains investment officers in a financial organization in 1993
(Burt, 1997a). The study population includes bankers responsible for client

Structural Holes vs. Network Closure, May 2000, Page 15
relations, but also includes a large number of administrative and support people
who participate in the bonus pool. Performance, background, and network data on
the study population are taken from company records. Seventy-three percent of the
variance in annual bonus compensation, which varies from zero to millions of
dollars, can be predicted from job rank (dummy variables distinguishing ranks
defined by the organization), and seniority with the firm (years with the firm, and
years in current job). Salary is almost completed predictable from the same
variables (95% of salary variance). With rank and seniority held constant, there are
no significant bonus differences by officer gender, race, or other background
factors on which the firm has data. The residual 27% of bonus variance defines the
performance variable in Figure 2E. Relative bonus is based on the difference
between the bonus an officer was paid and the bonus typical for someone in his
rank, at her age, with his years of seniority at the firm: bonus – E(bonus). I
standardized relative bonus across all officers in the study population to zero mean
and unit variance (so a score of 1.5, for example, means that an officer’s bonus is
one and a half standard deviations higher that the bonus typically paid to people at
his rank or her rank, age, and seniority). Figure 2E contains a random sample of
147 men analyzed for social capital (see Burt, 2000:Table 2, for results on female
bankers).
The work of this population requires flexible cooperation between colleagues.
It is impossible to monitor their cooperation through bureaucratic chains of
command because much of their interpersonal behavior is unknown to their
immediate supervisor. The firm is typical of the industry in using peer evaluations to
monitor employee cooperation. Each year, officers are asked to identify the people
with whom they had substantial or frequent business dealings during the year and
to indicate how productive it was to work with each person. The firm uses the
average of these peer evaluations in bonus and promotion deliberations. The firm
does not look beyond the average evaluations. However, there is a network
structure in the evaluations that, according to social capital theory, has implications
for an officer’s performance, which in turn should affect his bonus (see Eccles and
Crane, 1988: Chap. 8). From peer evaluations by the investment officers and

Structural Holes vs. Network Closure, May 2000, Page 16
colleagues in other divisions of the firm, I identified the people cited as productive
contacts by each of the officers, and looked at evaluations by each contact to see
how contacts evaluated one another. I then computed network constraint from the
network around each officer.
What makes the study population analytically valuable is the time order
between the network and performance data. Social capital theory gives a causal
role to social structure. Consistent with the argument, I assume the primacy of
social structure for theoretical and heuristic purposes. I am limited to assuming the
primacy of social structure because the data collected in the other Figure 2 study
populations are cross-sectional and so offer no evidence of causation (see Burt,
1992: 173-180, for discussion). It is difficult to gather survey network data, wait for
the relative success of managers to emerge over time, then gather performance
data. The network data on the investment officers were obtained in the routine of
gathering peer evaluations to affect bonus compensation five months later.
There is a negative association in Figure 2E between bonus compensation
and network constraint (-3.7 t-test). The managers who received bonuses higher
than expected from their rank and seniority tend to have networks that span
structural holes in the firm. The logit results in Figure 2F show that the association
is even stronger than implied by the results in Figure 2E. There is a triangular
pattern to the data in Figure 2E. On the right side of the graph, officers with the most
constrained networks receive low bonuses. On the left, officers receiving larger
bonuses than their peers tend to have low-constraint networks, but many officers
with equally unconstrained networks receive small bonuses. I attribute this to
annual data. The low-constraint networks that span structural holes provide better
access to rewarding opportunities, but that is no guarantee of exceptional gains
every year. There is a .47 partial correlation between bonus in the current year and
bonus in the previous year (after rank and seniority are held constant). Even the
most productive officers can see a lucrative year followed by a year of routine
business. So, the logit results in Figure 2F more accurately describe the social
capital effect for the investment officers. I divided the officers into three bonus
categories: large (bonus more than a standard deviation larger than expected from

Structural Holes vs. Network Closure, May 2000, Page 17
rank and seniority) medium, and small (bonus more than a standard deviation
larger than expected from rank and seniority). Network constraint this year
significantly decreases the probability of a large bonus next year (-2.7 t-test), but
the stronger effect is the increased probability of receiving a low bonus next year
(3.6 t-test).
OTHER EVIDENCE
Across the five study populations in Figure 2, social capital results from brokerage
across structural holes, not from network closure. Elsewhere, I review research
based on less detailed network data, but research on a broader diversity of
substantive questions on a broader diversity of study populations (Burt, 2000). The
conclusion of the review is the same as here: closed networks — more specifically,
networks of densely interconnected contacts — are systematically associated with
substandard performance. For individuals and groups, networks that span
structural holes are associated with creativity and innovation, positive evaluations,
early promotion, high compensation and profits.
RE-THINKING COLEMAN’S EVIDENCE
The most authoritative evidence in Coleman’s argument for closure as a form of
social capital comes from his studies of high-school students. He argues that
closure explains why certain students are more likely to drop out of high school.
When the adults in a child’s life are more connected with one another, the closure
argument predicts trust, norms and effective sanctions more likely among the
adults, which means that the adults can more effectively enforce their interest in
having the child complete his or her education.
Coleman (1988; 1990: 590-597) offers three bits of evidence to show that
children living within closed networks of adults are less likely to drop out of high
school: First, children in families with two parents and few children are less likely to
drop out of high school (two parents living together can more effectively than two
parents living apart collaborate in the supervision of a child). Second, children who

Structural Holes vs. Network Closure, May 2000, Page 18
have lived in the same neighborhood all their lives are less likely to drop out of
high school (parents, teachers, and other people in the neighborhood are more
likely to know one another and collaborate in the supervision of a child than can
parents new to the neighborhood). Third, children in Catholic and other religious
private schools are less likely to drop out (parent, teachers, and parents of the
child’s friends at the private schools are more likely, relative to adults in the same
roles in a public school, to know one another and collaborate in the supervision of
a child).
Two questions: First, is “not dropping out of school” a productive performance
criterion for estimating social capital effects? Performance variation around “drop
out” is probably driven by factors different from those that determine variation at the
other end of the performance continuum, the “stay-in-school-and-do-well” end of
the continuum. For example, analyzing data on mathematics achievement from the
National Education Longitudinal Study survey of 9,241 students in 898 high
schools, Morgan and Sørensen (1999:674) raise questions about the value of
network closure [brackets inserted]: “In contrast to his [Coleman’s] basic
hypotheses, our findings lead us to conclude that the benefits offered by the typical
network configurations of horizon-expanding schools outweigh those of norm-
enforcing schools.” Like Coleman before them, Morgan and Sørensen have
limited network data available for their analysis,1 but their two network variables do
1For example, the “density of student friendship networks” to which they refer in their
conclusion is not a network density measure; it is a count of a student’s closest friends named in aninterview with the student’s parent (0 to 5, “friends in school” variable in Morgan and Sørensen,1999a: 666-667). “Friends in school” is an indicator of intergenerational network closure, andconsistent with the closure argument, has a positive association with a student’s gain in math scores to12th grade (primarily for students averaged across schools, Morgan and Sørensen, 1999a:669;Morgan and Sørensen, 1999b:698; Carbonaro, 1999:684-685). The “density of parental networks” inMorgan and Sørensen’s conclusion is also a count. It is the number of the named close friends forwhom the interviewed parent claims to know one or both of the friend’s parents (“parents knowparents” variable). “Parents know parents” is another measure of intergenerational network closure,but in contradiction to the closure argument, has a negative association with a student’s gain in mathscores (again primarily for students averaged across schools, Morgan and Sørensen, 1999a:669;Morgan and Sørensen, 1999b:698). Inferences are complicated by the fact that “friends in school” isof course strongly correlated (.58) with “parents know parents.” More consequential, Morgan andSørensen’s network variables are enumerations by the parent, not the student. The student need notagree with the parent’s selection of best friends, and the student’s network can extend well beyond

Structural Holes vs. Network Closure, May 2000, Page 19
measure closure of a kind, so the negative association between math scores and
“parents know parents” raises questions for scholars committed to the closure
argument.
Second, the accumulating evidence of brokerage as social capital invites
speculation about the role that brokerage could be playing in Coleman’s evidence.
Grant that children are less likely to drop out of school if they have a constrained
network in which friends, teachers, and parents are all strongly connected to one
another so as to eliminate opportunities for the child to play contacts against one
another. Constraint from parents and teachers has positive long-term
consequences for children, forcing them to focus on their education. But is this
social capital of the child or its parents? The evidence reviewed in this chapter is
about the social capital of the person at the center of the network. The social capital
associated with higher performance by adults comes from a network of
disconnected contacts. At some point on the way to adulthood, the child shaped by
the environment takes responsibility for shaping the environment, and is rewarded
in proportion to the value he or she adds to the environment. Constraint, positive for
the child, is detrimental to adults, particularly adults charged with managerial tasks
at the top of their firm. Moreover, the parent network around their child defines only
part of the social-capital effect on educational achievement. The complete story is
about effective adult supervision (closure argument) combined with parent ability to
wrestle resources out of society to support the child (hole argument). Whatever the
effect of closure providing adult control over the child, how much greater is the
effect of a parent network that spans structural holes at work such that the parents
bring home earlier promotions and higher compensation as illustrated in Figure 2?
A POINT OF INTEGRATION
There remains an important role for closure. It can be critical to realizing the value
buried in structural holes. the view of his or her parents (recall that these are high school students; see Hirschi, 1972, on thesignificance for delinquent behavior of a boy’s friends unknown to his father).
Structural Holes vs. Network Closure, May 2000, Page 20
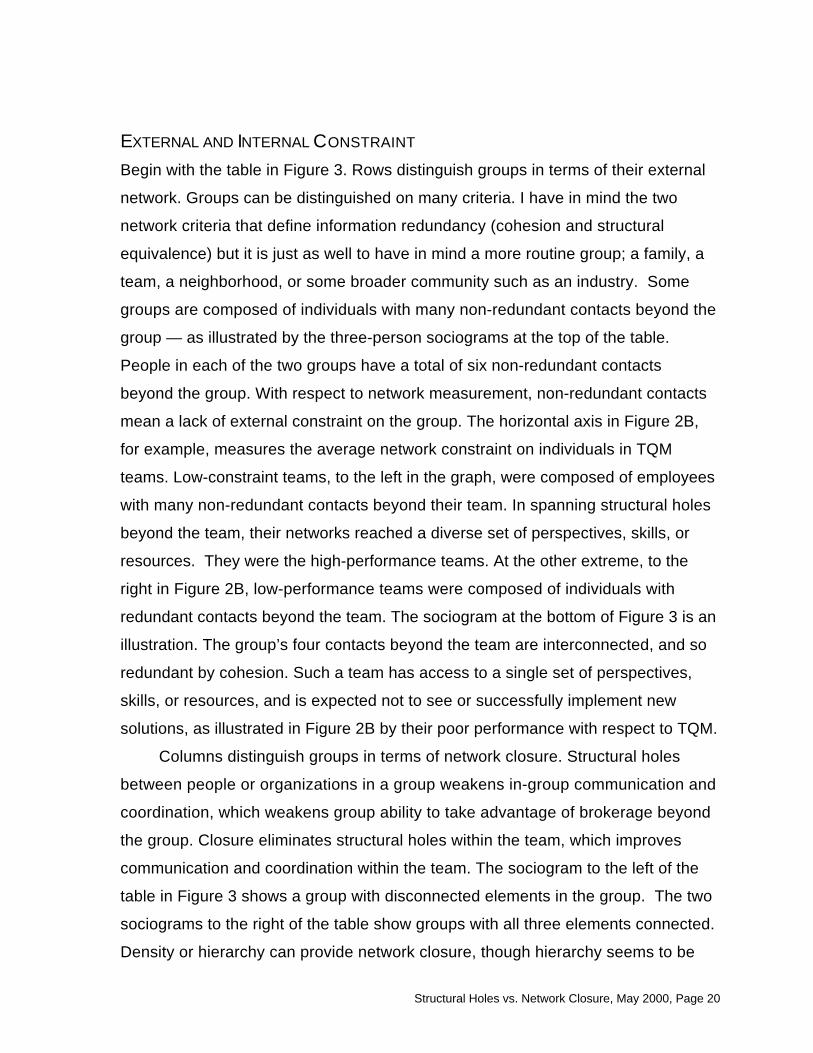
EXTERNAL AND INTERNAL CONSTRAINT
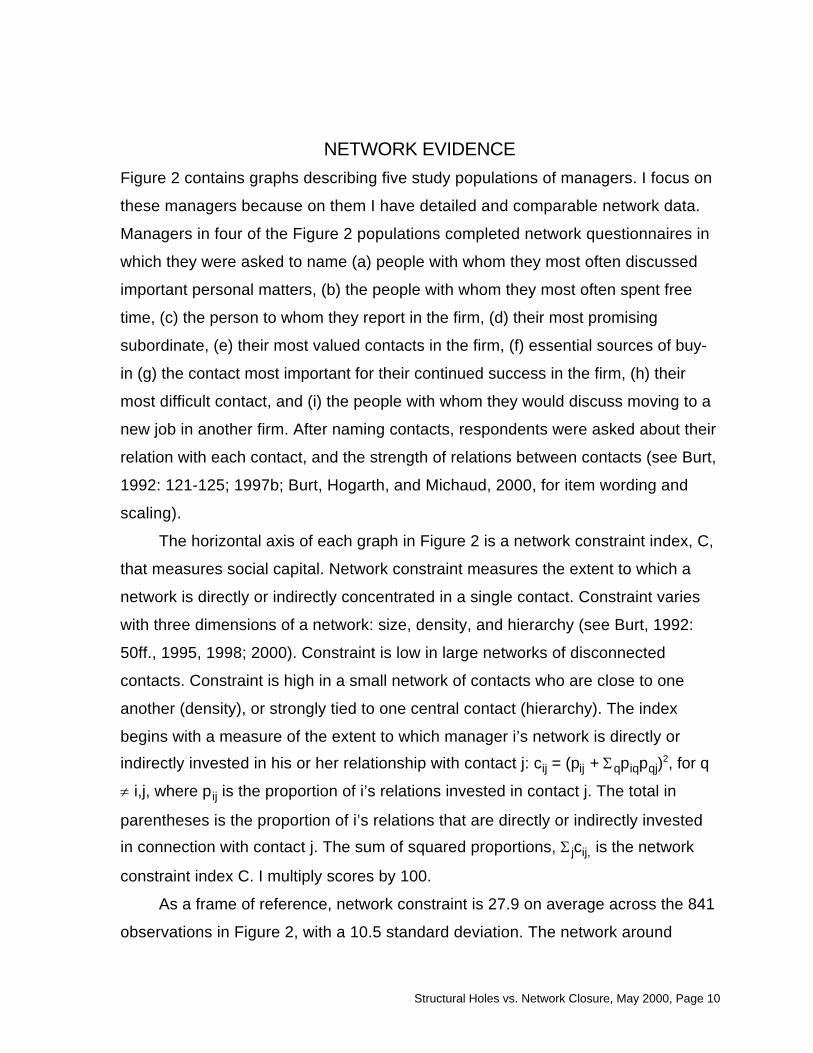
Begin with the table in Figure 3. Rows distinguish groups in terms of their external
network. Groups can be distinguished on many criteria. I have in mind the two
network criteria that define information redundancy (cohesion and structural
equivalence) but it is just as well to have in mind a more routine group; a family, a
team, a neighborhood, or some broader community such as an industry. Some
groups are composed of individuals with many non-redundant contacts beyond the
group — as illustrated by the three-person sociograms at the top of the table.
People in each of the two groups have a total of six non-redundant contacts
beyond the group. With respect to network measurement, non-redundant contacts
mean a lack of external constraint on the group. The horizontal axis in Figure 2B,
for example, measures the average network constraint on individuals in TQM
teams. Low-constraint teams, to the left in the graph, were composed of employees
with many non-redundant contacts beyond their team. In spanning structural holes
beyond the team, their networks reached a diverse set of perspectives, skills, or
resources. They were the high-performance teams. At the other extreme, to the
right in Figure 2B, low-performance teams were composed of individuals with
redundant contacts beyond the team. The sociogram at the bottom of Figure 3 is an
illustration. The group’s four contacts beyond the team are interconnected, and so
redundant by cohesion. Such a team has access to a single set of perspectives,
skills, or resources, and is expected not to see or successfully implement new
solutions, as illustrated in Figure 2B by their poor performance with respect to TQM.
Columns distinguish groups in terms of network closure. Structural holes
between people or organizations in a group weakens in-group communication and
coordination, which weakens group ability to take advantage of brokerage beyond
the group. Closure eliminates structural holes within the team, which improves
communication and coordination within the team. The sociogram to the left of the
table in Figure 3 shows a group with disconnected elements in the group. The two
sociograms to the right of the table show groups with all three elements connected.
Density or hierarchy can provide network closure, though hierarchy seems to be
Structural Holes vs. Network Closure, May 2000, Page 21
the more potent form of closure (Burt, 2000). A leader with strong relations to all
members of the team improves communication and coordination despite coalitions
or factions separated by holes within the team.
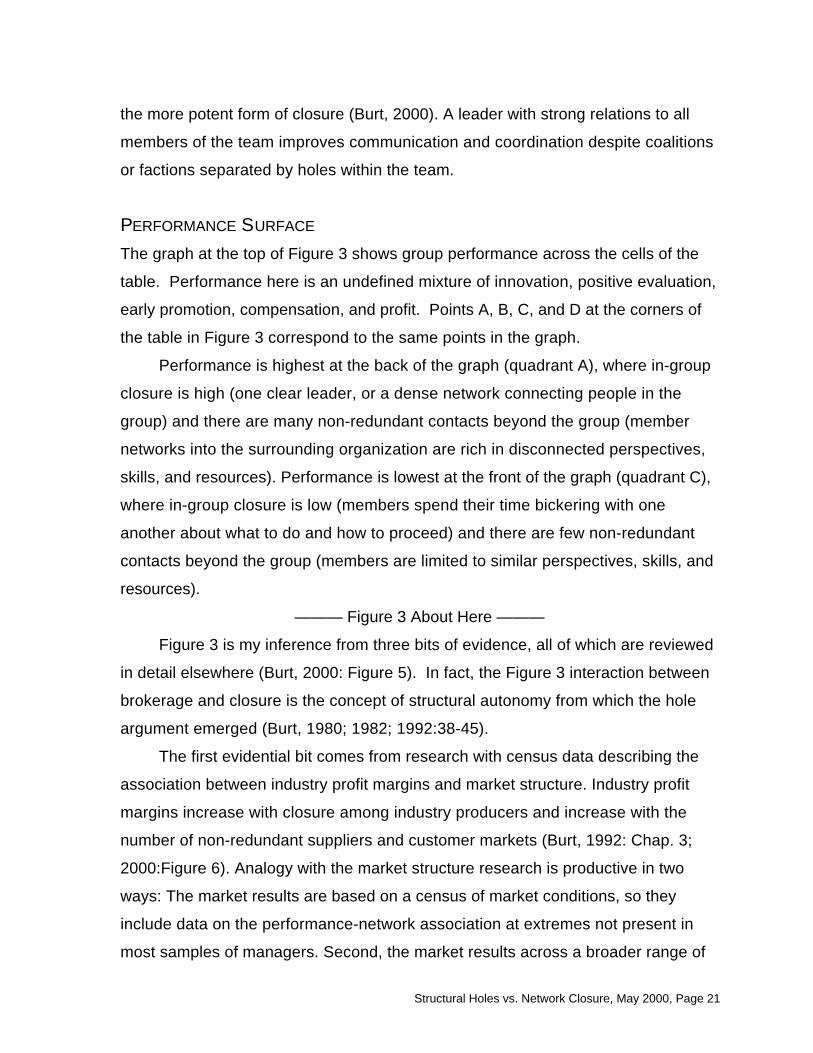
PERFORMANCE SURFACE
The graph at the top of Figure 3 shows group performance across the cells of the
table. Performance here is an undefined mixture of innovation, positive evaluation,
early promotion, compensation, and profit. Points A, B, C, and D at the corners of
the table in Figure 3 correspond to the same points in the graph.
Performance is highest at the back of the graph (quadrant A), where in-group
closure is high (one clear leader, or a dense network connecting people in the
group) and there are many non-redundant contacts beyond the group (member
networks into the surrounding organization are rich in disconnected perspectives,
skills, and resources). Performance is lowest at the front of the graph (quadrant C),
where in-group closure is low (members spend their time bickering with one
another about what to do and how to proceed) and there are few non-redundant
contacts beyond the group (members are limited to similar perspectives, skills, and
resources).
——— Figure 3 About Here ———
Figure 3 is my inference from three bits of evidence, all of which are reviewed
in detail elsewhere (Burt, 2000: Figure 5). In fact, the Figure 3 interaction between
brokerage and closure is the concept of structural autonomy from which the hole
argument emerged (Burt, 1980; 1982; 1992:38-45).
The first evidential bit comes from research with census data describing the
association between industry profit margins and market structure. Industry profit
margins increase with closure among industry producers and increase with the
number of non-redundant suppliers and customer markets (Burt, 1992: Chap. 3;
2000:Figure 6). Analogy with the market structure research is productive in two
ways: The market results are based on a census of market conditions, so they
include data on the performance-network association at extremes not present in
most samples of managers. Second, the market results across a broader range of

Structural Holes vs. Network Closure, May 2000, Page 22
network conditions show a nonlinear form of returns to network structure. The
strongest network effects occur with deviations from minimum network constraint.
With respect to network structure within a group, in other words, performance
should be weakened more by the first significant disconnection in the group than
by one more disconnection within an already disorganized group. With respect to
external structure, performance should be weakened more by the entry of one
strong perspective, or skill, or resource in the surrounding organization than it is by
the entry of another external pressure on a group already frozen by external
pressures.
A second bit of evidence for the integration is Reagans and Zuckerman’s
(1999) study of performance in 223 corporate R&D units within 29 major American
firms in eight industries. They report higher levels of output from units in which
scientists were drawn from widely separate employee cohorts (implying that their
networks reached diverse perspectives, skills and resources outside the team) and
there is a dense communication network within the unit. Tenure diversity (or other
kinds of diversity, see Williams and O’Reilly, 1998) can be disruptive because of
the difficulties associated with communicating and coordinating across different
perspectives, but when communication is successful (as implied by a dense
communication network within the team), team performance is enhanced by the
brokerage advantages of the team having access to more diverse information.
Reagans and Zuckerman’s finding is a segment somewhere between points A and
C on the performance surface at the top of Figure 3.
A third bit of evidence for the integration comes from the contingent value of
social capital to managers (Burt, 1997a; 2000:Figure 6). Social capital is most
valuable to managers who hold relatively unique jobs (such as CEO, divisional
vice-president, or people managing ventures of a kind new for their organization).
These are people who have the most to gain from the information and control
benefits of social capital. The contingency argument is that numerous peers define
a competitive frame of reference against which any one manager’s performance
can be calibrated so managers doing similar work come to resemble one another
in their efforts. Burt (1997a; 2000:Figure 6) shows a nonlinear decline in the value
Structural Holes vs. Network Closure, May 2000, Page 23
of social capital in proportion to the number of managers — peers — doing the
same work. Assume that network closure among peers decreases with the number
of peers; network closure among many people being more difficult to sustain than
closure among a few people. Then the negative association between peers and
the value of social capital is a negative association between closure and the value
of social capital. The social capital of brokerage across structural holes is again
more valuable to a group where there is network closure within the group, point A
at the back of the graph in Figure 3. Along the axis from point C to D in the graph,
low closure means poor communication and coordination within a group and such
a group can be expected to perform poorly, only benefiting from external networks
in the richest diversity of perspectives, skills, and resources.
FRAME OF REFERENCE FOR INTEGRATING RESEARCH RESULTS
Figure 3 can be a useful frame of reference for integrating research results across
studies. A study can show exclusive evidence of social capital from network closure
or structural holes without calling either argument into question.
For example, Greif (1989) argues that network closure was critical to the
success of the medieval Maghribi traders in North Africa. Each trader ran a local
business in his own city that depended on sales to distant cities. Network closure
among the traders allowed them to coordinate so as to trust one another, and so
profitably trade the products of their disparate business activities. The traders
individually had networks rich in brokerage opportunities, but they needed closure
with one another to take advantage of the opportunities. More generally, in an
environment rich in diverse perspectives, skills, and resources, group performance
depends on people overcoming their differences to operate as a group. Group
performance will vary with in-group closure, not brokerage, because brokerage
opportunities beyond the group are for everyone abundant (this is the Figure 3
surface from point A to point D).
Rosenthal’s (1996) study of TQM teams illustrates the other extreme. People
on the teams had been trained to act as a team and there was enthusiasm for
quality management in the firm — so the teams did not differ greatly in their closure.

Structural Holes vs. Network Closure, May 2000, Page 24
Closure was high in all of them. Therefore, team performance varied as illustrated
in Figure 2B with a team‘s external network. If a cohesive team can see a good
idea, it can act on it. With all teams cohesive, those with numerous non-redundant
contacts beyond the team had the advantage of access to a broader diversity of
perspectives, skills, and resources. Several recent studies report high performance
from groups with external networks that span structural holes (see Burt, 2000, for
review): Geletkanycz and Hambrick (1997) on higher company performance when
top managers have boundary-spanning relationships beyond their firm and beyond
their industry, Ahuja (1998) on the higher patent output of organizations that hold
broker positions in the network of joint ventures or alliances at the top of their
industry, Pennings, Lee, and Witteloostuijn (1998) on the survival of accounting
firms as a function of strong partner ties to client sectors, Stuart and Podolny (1999)
on the higher probability of innovation from semiconductor firms that establish
alliances with firms outside their own technological area, McEvily and Zaheer
(1999) on the greater access to competitive ideas enjoyed by small job
manufacturers with more non-redundant sources of advice beyond the firm,
Sørensen (1999) on the negative effect on firm growth of redundant networks
beyond the firm, Hansen, Podolny and Pfeffer (2000) on computer new-product
teams more quickly completing their task when the team is composed of people
with more non-redundant contacts beyond the team, Baum, Calabrese, and
Silverman (2000) on the faster revenue growth and more patents granted to
biotechnology companies that have multiple kinds of alliance partners at start-up,
Koput and Powell (2000) on the higher earnings and survival chances of
biotechnology firms with more kinds of activities in alliances with more kinds of
partner firms, and Podolny (2000) on the higher probability of early-stage
investments surviving to IPO for venture-capital firms with joint-investment networks
of otherwise disconnected partners. With Figure 3 in mind, these studies tell me
not that the closure argument is in error so much as they tell me that closure within
business groups is less often problematic than brokerage beyond the group. More
generally, the relative performance of cohesive groups will vary with the extent to
which a group is composed of people with networks rich in structural holes, not
Structural Holes vs. Network Closure, May 2000, Page 25
network closure, because closure is high for all of the groups (this is the Figure 3
surface from point A to point B, illustrated in Figure 2B).
In short, structural holes and network closure can be brought together in a
productive way. The integration is only with respect to empirical evidence. The
mechanisms remain distinct. Closure describes how dense or hierarchical
networks lower the risk associated with transaction and trust, which can be
associated with performance. The hole argument describes how structural holes
are opportunities to add value with brokerage across the holes, which is associated
with performance. The empirical evidence reviewed supports the hole argument
over closure. However, my summary conclusion illustrated in Figure 3 is that while
brokerage across structural holes is the source of added value, closure can be
critical to realizing the value buried in the structural holes.
REFERENCESAhuja, Gautam (1998) Collaboration networks, structural holes, and innovation: a longitudinal
study. Paper presented at the annual meetings of the Academy of Management.Aldrich, Howard E. (1999) Organizations Evolving. Thousand Oaks, CA: Sage.Ancona, Deborah G., and David F. Caldwell (1992a) Demography and design: predictors of
new product team performance. Organization Science 3:321-341Ancona, Deborah G., and David F. Caldwell (1992b) Bridging the boundary: external activity
and performance in organizational teams. Administrative Science Quarterly 37:634-665.
Baker, Wayne E. (1984) The social structure of a national securities market. American Journalof Sociology 89: 775-811.
Baker, Wayne E. and Ananth Iyer (1992) Information networks and market behavior. Journalof Mathematical Sociology 16: 305-332.
Baum, Joel A. C., Tony Calabrese, and Brian S. Silverman (2000) “Don’t go it alone: alliancenetwork composition and startups’ performance in Canadian biotechnology.” StrategicManagement Journal 21: 267-294.
Biggart, Nicole Woolsey (2000) Banking on each other: the situational logic of rotating savingsand credit associations. Paper presented at the 2000 Organization Science WinterConference.
Bourdieu, Piere (1980) Le capital social: notes provisoires. Actes de la Recherche enSciences Sociales 3:2-3.
Bourdieu, Pierre and Loïc J. D. Wacquant (1992) An Invitation to Reflexive Sociology.Chicago, IL: University of Chicago Press.
Brieger, Ronald L. (1995) Socioeconomic achievement and the phenomenology ofachievement. Annual Review of Sociology 21:115-136.
Burt, Ronald S. (1980) Autonomy in a social topology. American Journal of Sociology 85:892-925.

Structural Holes vs. Network Closure, May 2000, Page 26
Burt, Ronald S. (1982) Toward a Structural Theory of Action. New York: Academic Press.Burt, Ronald S. (1992) Structural Holes. Cambridge, MA: Harvard University Press.Burt, Ronald S. (1995) Le capital social, les trous structuraux, et l’entrepreneur (translated by
Emmanuel Lazega). Revue Française de Sociologie 36:599-628.Burt, Ronald S. (1997a) The contingent value of social capital. Administrative Science
Quarterly 42:339-365.Burt, Ronald S. (1997b) A note on social capital and network content. Social Networks
19:355-373.Burt, Ronald S. (1998) The gender of social capital. Rationality and Society 10:5-46.Burt, Ronald S. (1999a) Entrepreneurs, distrust, and third parties. Pp. 213-243 in Shared
Cognition in Organizations, edited by Leigh L. Thompson, John M. Levine, and DavidM. Messick. Hillsdale, NJ: Lawrence Erlbaum.
Burt, Ronald S. (1999b) The social capital of opinion leaders. Annals 566:37-54.Burt, Ronald S. (2000) The network structure of social capital. Pp. 345-423 in Research in
Organizational Behavior, edited by Robert I. Sutton and Barry M. Staw. Greenwich,CT: JAI Press.
Burt, Ronald S. (2001) Bandwidth and echo: trust, information, and gossip in social networks.In Integrating the Study of Networks and Markets, edited by Alessandra Casella andJames E. Rauch. New York: Russell Sage Foundation.
Burt, Ronald S., Joseph E. Jannotta, and James T. Mahoney (1998) Personality correlates ofstructural holes. Social Networks 20:63-87.
Burt, Ronald S., Robin M. Hogarth, and Claude Michaud (2000) The social capital of Frenchand American managers. Organization Science 11:123-147.
Carbonaro, William J. (1999) “Openning the debate on closure and schooling outcomes.”American Sociological Review 64:682-686.
Coleman, James S. (1988) Social capital in the creation of human capital. American Journal ofSociology 94:S95-S120.
Coleman, James S. (1990) Foundations of Social Theory. Cambridge, MA: HarvardUniversity Press.
Cook, Karen S. and Richard M. Emerson (1978) Power, equity and commitment in exchangenetworks. American Sociological Review 43:712-739.
Eccles, Robert G. and Dwight B. Crane (1988) Doing Deals. Boston, MA: Harvard BusinessSchool Press.
Freeman, Linton C. (1977) A set of measures of centrality based on betweenness.Sociometry 40:35-40.
Geletkanycz, Marta A. and Donald C. Hambrick (1997) The external ties of top executives:implications for strategic choice and performance. Administrative Science Quarterly42:654-681.
Granovetter, Mark S. (1973) The strength of weak ties. American Journal of Sociology78:1360-1380.
Granovetter, Mark S. (1985) Economic action, social structure, and embeddedness. AmericanJournal of Sociology 91:481-510.
Granovetter, Mark S. (1992) Problems of explanation in economic sociology. Pp. 29-56 inNetworks and Organization, edited by Nitin Nohria and Robert G. Eccles. Boston:Harvard Business School Press.
Greif, Avner (1989) Reputation and coalition in medieval trade: evidence on the Maghribitraders. Journal of Economic History 49:857-882.
Hansen, Morten T., Joel M. Podolny and Jeffrey Pfeffer (2000) So many ties, so little time: atask contingency perspective on the value of social capital in organizations. Paperpresented at the 2000 Organization Science Winter Conference.

Structural Holes vs. Network Closure, May 2000, Page 27
Hirschi, Travis (1972) Causes of Delinquency. Berkeley, CA: University of California Press.Koput, Kenneth and Walter W. Powell (2000) Not your stepping stone: collaboration and the
dynamics of industry evolution in biotechnology. Paper presented at the 2000Organization Science Winter Conference.
McEvily, Bill and Akbar Zaheer (1999) Bridging ties: a source of firm heterogeneity incompetitive capabilities. Strategic Management Journal 20: 1133-1156.
Merton, Robert K. ([1957] 1968) Continuities in the theory of reference group behavior. Pp.335-440 in Social Theory and Social Structure. New York: Free Press.
Merton, Robert K. (1984) Socially expected durations: a case study of concept formation insociology. Pp. 262-283 in Conflict and Consensus edited by Walter W. Powell andRichard Robbins. New York: Free Press.
Morgan, Stephen L. and Aage B. Sørensen (1999a) “A test of Coleman’s social capitalexplanation of school effects.” American Sociological Review 64:661-681.
Morgan, Stephen L. and Aage B. Sørensen (1999b) “Theory, measurement, and specificationissues in models of network effects on learning.” American Sociological Review64:694-700.
Morselli, Carlo (2000) “Structuring Mr. Nice: entrepreneurial opportunities and brokeragepositioning in the cannabis trade.” Crime, Law and Social Change 33: In Press.
Padgett, John F. and Christopher K. Ansell (1993) Robust action and the rise of the Medici,1400-1434. American Journal of Sociology 98:1259-1319.
Pennings, Johannes M., Kyungmook Lee and Arjen van Witteloostuijn (1998) Human capital,social capital, and firm dissolution. Academy of Management Journal 41:425-440.
Podolny, Joel M. (2000) “Networks as the pipes and prisms of the market.” Graduate Schoolof Business, Stanford University.
Putnam, Robert D (1993) Making Democracy Work. Princeton, NJ: Princeton University Press.Reagans, Ray and Ezra W. Zuckerman (1999) Networks, diversity, and performance: the
social capital of corporate R&D units. Graduate School of Industrial Administration,Carnegie Mellon University.
Rosenthal, Elizabeth A. (1996) Social Networks and Team Performance. Ph.D. Dissertation,Graduate School of Business, University of Chicago.
Simmel, Georg ([1922] 1955) Conflict and the Web of Group Affiliations, (translated by Kurt H.Wolff and Reinhard Bendix). New York: Free Press.
Sørensen, Jesper B. (1999) Executive migration and interorganizational competition. SocialScience Research 28: 289-315.
Stuart, Toby E. and Joel M. Podolny (1999) Positional causes and correlates of strategicalliances in the semiconductor industry. Pp. 161-182 in Research in the Sociology ofOrganizations, edited by Steven Andrews and David Knoke. Greenwich, CT: JAIPress.
Thornton, Patricia H. (1999) The sociology of entrepreneurship. Annual Review of Sociology,25:19-46.
Tillman, Robert and Michael Indergaard (1999) Field of schemes: health insurance fraud in thesmall business sector. Social Problems 46: 572-590.
Tullock, Gordon (1985) Adam Smith and the prisoners’ dilemma. Quarterly Journal ofEconomics, 100:1073-1081.
Williams, Katherine Y. and Charles A. O’Reilly III (1998) Demography and diversity inorganizations: a review of 40 years of research. Pp. 77-140 in Research inOrganizational Behavior, edited by Barry M. Staw and L. L. Cummings. Greenwich,CT: JAI Press.
Williams, Phil (1998) The nature of drug-trafficking networks. Current History, 97:154-159.
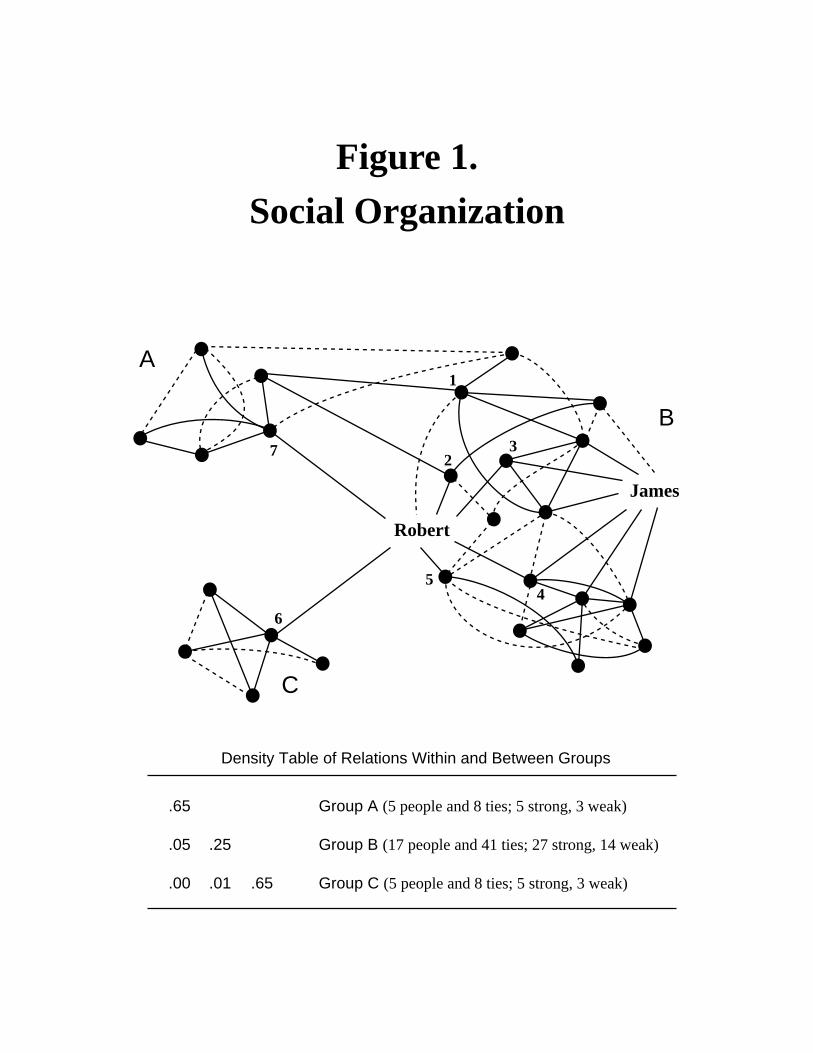
Figure 1.
Social Organization
James
Robert
1
23
54
6
7
.65
.05
.00
.25
.01 .65
Group A (5 people and 8 ties; 5 strong, 3 weak)
Group B (17 people and 41 ties; 27 strong, 14 weak)
Group C (5 people and 8 ties; 5 strong, 3 weak)
Density Table of Relations Within and Between Groups
A
B
C
Fig
ure
2. S
ocia
l Cap
ital M
atte
rs
J
J
J J
JJ
J J
JJ
J
J
J
-2.0
-1.00.0
1.0
2.0
3.0
4.0
1520
2530
3540
4550
Net
wo
rk C
on
stra
int
man
y —
——
Str
uctu
ral H
oles
——
— f
ew
(man
ager
C a
bove
, mea
n C
in te
am b
elow
)
Rec
ogn
itio
n o
fT
QM
Tea
mA
chie
vem
ents
Y =
7.5
25 -
.210
(C)
r =
-.7
9t =
-4.
3P
< .0
01
B
0.0
0.1
0.2
0.3
0.4
0.5
0.6
0.7
0.8
1015
2025
3035
4045
50
Pro
babi
lity
of
Poo
r E
valu
atio
n(3
.3 lo
git t
-tes
t)
Pro
babi
lity
of
Out
stan
ding
Eva
luat
ion
(-2.
3 lo
git t
-tes
t)
A
1520
2530
3540
4550
Net
wo
rk C
on
stra
int
man
y —
——
Str
uctu
ral H
oles
——
— f
ew
(C f
or m
anag
er’s
net
wor
k)
Pro
babi
lity
of
Sm
all B
onus
(3.6
logi
t t-t
est)
Pro
babi
lity
of
Lar
ge B
onus
(-2.
7 lo
git t
-tes
t)
-3.0
-2.0
-1.0
0.0
1.0
2.0
3.0
4.0
010
2030
4050
6070
80
0.0
0.1
0.2
0.3
0.4
0.5
0.6
010
2030
4050
6070
80
Net
wo
rk C
on
stra
int
man
y —
——
Str
uctu
ral H
oles
——
— f
ew
(C f
or o
ffic
er's
net
wor
k)
Lar
ge B
onu
sY
= 0
.438
- .0
22(C
)r
= -
.30
t = -
3.7
P <
.001
E F
C D
1520
2530
3540
4550
-3.0
-2.0
-1.00.0
1.0
2.0
3.0
-4.0
r =
-.4
4t =
-3.
7P
< .0
01Y
= 2
.102
- .0
77(C
)
Fre
nch
Sal
ary
J
J
JJ
JJ
JJ J
J J
J
J
JE
E J J
J
J
E
J
J
JJ
J
J
J
J
J
JJ
J
J
J
E
J J
JJ
J
J
J
J
JJ
J
J
J
JJ
J
JJ
J
J
JJ
J J
E
E
E
E
E
E
E
EE E
E
E
EE
E
E
E
E
E
EEE
E
EE
E
E
E
EE
EE
E
E
E
E
E
E
EE
E
E
EE
E
E
E
E
E
E
E
E
E
E
E
EE
E E
EE
E
EE
E
E
E
E
E
EE
E
E
E
EE
E E
E
E EE
EE
E
E
E
E
E
EE
E
EE E
E
E
E
E
E
E
EEE
E
E
E
E
E
E
EE
E
E
E
E
E
E
E E
E
E
E
E
E
E
E
EE
E
E
EE
E
E
E
E
E
EE E
E
EE
EEE
E
E
E
E
E
EE
E
E
E
E
E E
E
E
E
E
E
E
E
E
E
E
-3.0
-2.0
-1.00.0
1.0
2.0
3.0
Ear
ly P
rom
otio
nY
= 2
.035
- .0
74(C
)r
= -
.40
t = -
5.4
P <
.001
E
E
E
E E E
EE
EE
E
E E
E
E
E
E
EE
E
E
E
E
E
EE
E
EE
EE
E
E
EE
EE
EEE
EE
E
EE
EE
E
E
EE
E
E
E
E
E
E
E
E
E
E
EE E
EEE
E
E
EE
EE
EE
E
E
E
E
E
E
E
E
E
E
E
E
E
E
EE
E
E
E
E
E
E
EE
EE
E
E
EE
E
E
E
E
E
E
E
EE
EE
EE
E
E E
E
E
EE
E
E
E
E
E
E
E
E
E
E
E
E
E
EE
E
E
E
E
E
E
E

Internal
Figure 3.
GroupPerformance
Surface,across
StructuralHolesand
NetworkClosure.
A
B
C
D
————>
Internal
Lack of Constraint
<——
——
External
Lack of Constraint
Per
form
ance
——
——
>
disintegratedgroup of diverse
perspectives,skills, resources
minimumperformance
Low
maximumperformance
cohesive groupcontaining only
one perspective,skill, resource
High
Internal Lack of Constraintnetwork closure within group
High
LowExte
rnal L
ack o
fC
on
str
ain
tnon-r
edundant conta
cts
beyond g
roup
AD
BC