Embed Size (px)
Citation preview
Natural Science, 2009, 1, 2-9 NS http://dx.doi.org/10.4236/ns.2009.11002
Copyright © 2009 SciRes. OPEN ACCESS
Structural mapping of coastal plain sands using engineering geophysical technique: Lagos Nigeria case study
A. A. Adepelumi1, M. O. Olorunfemi2, D. E. Falebita3, O.G. Bayowa4 1,2,3Department of Geology, Obafemi Awolowo University, Ile-Ife, Nigeria; 4Department of Earth Sciences, Ladoke Akintola Univer-sity, Ogbomoso, Nigeria. 1Phone: +234-8067163658. Corresponding author: [email protected] Received 20 May 2009; revised 1 June 2009; accepted 2 May 2009.
ABSTRACT
An engineering geological survey using the cone penetrometer and finite element method was carried out to characterize sand-fill thick- nesses in a reclaimed area of Lagos, SW Nigeria. A previously developed finite element program was modified in order to allow for predicting the sand-fill thicknesses, and have an unders- tanding of the geomorphic shallow structures existing pre-sand-fill. The program was tested using the obtained cone penetrometer test re-sults from the Lekki-Peninsula area. The finite element predicted thicknesses show good cor-relation with the penetrometer obtained thick-nesses. Six zones with thick sand-fill thick-nesses varying from 1.25 to 6.0m were identified from the isopach maps, these zones correlate with major/minor depression associated with river/stream channels and creeks. These are the main shallow geomorphic structural features present in the area pre-sand fill. The structural trends of the depressions are largely influenced by the oceanic fracture pattern. Keywords: Sand-Fill; Finite Element; Nigeria; Penetrometer; Depression
1. INTRODUCTION
Engineering site investigation requires determination of thicknesses either to competent bedrock in foundation works or of sand-fill columns in a reclaimed site. Accu-rate mapping of bedrock topography or reliable estima-tion of sand-fill in a reclaimed site requires that thick-nesses are known at several test points. The more the number of test points, the better the bedrock topography definition and the more accurate is the estimation of spa-tial volume. However, the more the number of test points, the higher is the cost of investigation and the longer is the survey duration, most especially where the survey
area runs into tens of square kilometers [1]. Geophysical methods, cone penetrometer tests, and di-
rect borehole drilling are some of the various means of determining thicknesses or depths to a particular bedrock [2,3,4]. Of the three methods outlined above, geophysical methods remain the cheapest. But geophysical data inter-pretation requires some level of control usually in terms of subsurface information (e.g. lithological logs) obtained from drilling. Hence geophysical investigation is often complemented by borehole investigation with a conse-quently increasing cost. Survey cost and duration can be reduced if a predictive technique, with significant level of accuracy, can be developed that utilises few initial accu-rately determined thicknesses to predict thicknesses at other location where tests have not been carried out.
Finite element automated approach to the prediction of heads have been utilised by a number of authors. These include Fenner [5], Agbede [6] and Wang and Anderson [7]. These methods are iterative procedures that utilise various elemental geometries such as poly-gons, rectangles and triangles. The Finite element pro-gram, developed by Wang and Anderson [7] was slightly modified and used to predict formation thicknesses. The viability of the technique was tested using cone pene-trometer test results from a reclaimed Lekki Peninsula area of Lagos. In the present study, the main objective is to determine the thicknesses of sand-fill using the cone penetrometer tests and finite element methods. And, to have an understanding of the geomorphic shallow struc-tures existing pre sand-fill in the reclaimed Lekki Pen-insula area of Lagos Nigeria.
2. THE STUDY AREA
The Lekki-Peninsula area of Lagos was reclaimed by hydraulic sand-fill. It is located within the western coastal zone which consists largely of coastal creeks and lagoons developed by barrier beaches associated with sand deposition [8,9]. The study area can be found in the south eastern part of Lagos State, southwest, Nigeria, lying between latitude 6o 25’44.62” and 6o 27’38.16’’ N
A. A. Adepelumi et al. / Natural Science 1 (2009) 2-9 3
Copyright © 2009 SciRes. OPEN ACCESS
and longitudes 3o 27’16.70” and 3o 28’ 55.80 E (Fig. 1). The surface geology of the study area is made up of
the Benin Formation (Miocene to Recent), recent littoral alluvial, lagoons and coastal plain sand deposits. The sand range in size from coarse to medium grained clean white loose sandy soil which graded into one another towards the lagoons and near the mouth of the larger rivers. The low-lying beach ridges of sand called berm and barrier beach ridges of sand are ubiquitous in the area and are said to be derived from one or more of the following, sand brought in along the coast and reworked alluvial sands originally deposited by the south flowing rivers drawing the Dahomey basement of the western Nigerian during the late Pleistocene, Wurm-Wisconsn
[10]. The superficial deposit in the pre-sand fill is com-posed mainly of the clay/peat deposits. The recent litto-ral and alluvium deposits, the continental Benin sands and the Ilaro Formations were identified as the major aquifers. The water bearing aquifers consist of sands, gravels or a mixture of the two [11]. Within Lagos me-tropolis, three major aquifer zones at depths shallower than 200 m were delineated. The first is a water table aquifer that is prone to pollution. The second and third aquifers are confined aquifers made up of an alternating sequence of sand and clay. They are harnessed through boreholes and are the basis of mini-water works in La-gos area. The third aquifer is the most productive and most exploited.
Figure 1. Location map of Lekki-Peninsula, Lagos, Southwestern Nigeria.
4 A. A. Adepelumi et al. / Natural Science 1 (2009) 2-9
Copyright © 2009 SciRes. OPEN ACCESS
Cone penetrometer tests were first carried out in the study area in order to determine the hydraulic sand-fill thicknesses. For the computation of the unknown thick-nesses using the finite element program, the survey area was broken into 191 triangular meshes with 147 test points. The input data are the, number of nodes, the number of elements and the nodal coordinates for each node.
3. METHODOLOGY
3.1. Cone Penetrometer
Cone penetrometer test is one of the most widely used
direct methods in soil testing. The application of the method in geotechnical practice has been reviewed by Sanglerat [12] and de Ruiter [13]. It was designed as a control for the indirect geophysical method [14] and to determine the properties of the insitu soil like its se-quence or profile. The penetrometer test was carried at one hundred stations with stations coinciding with the nodes of the finite element triangular meshes.
The force required to drive the probe into the ground (that is, penetration resistance) and the depth of penetra-tion were recorded at each station. The penetration
A. A. Adepelumi et al. / Natural Science 1 (2009) 2-9 5
Copyright © 2009 SciRes. OPEN ACCESS
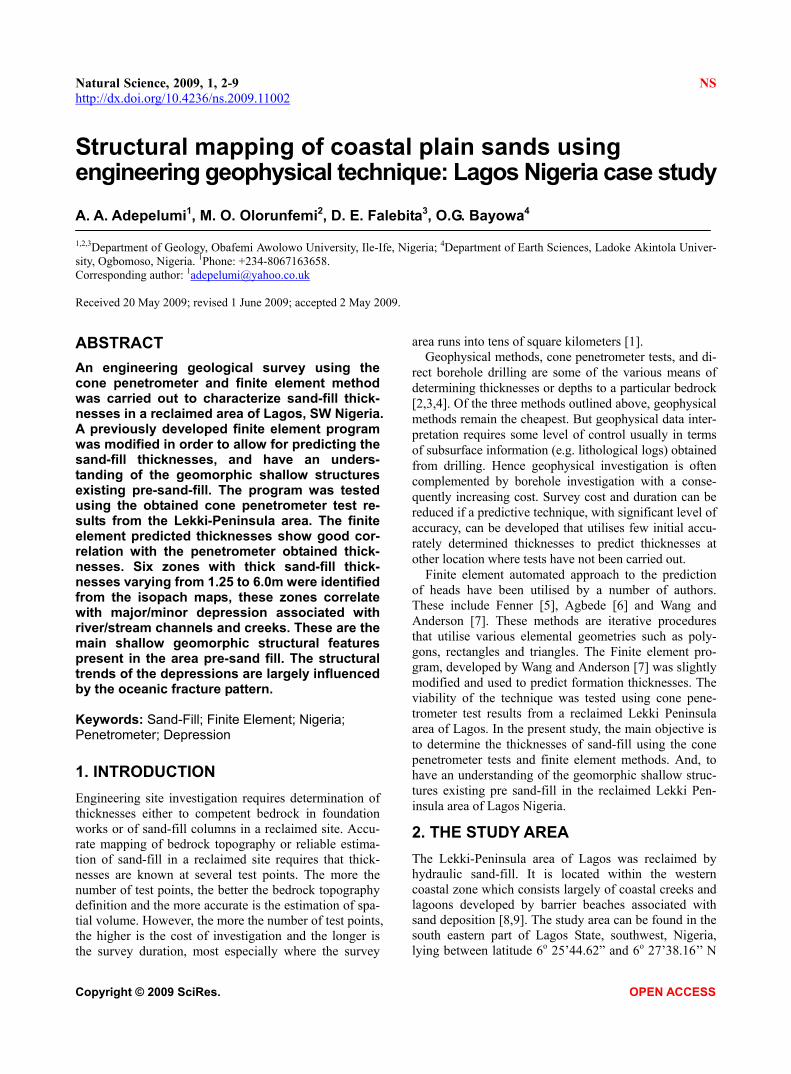
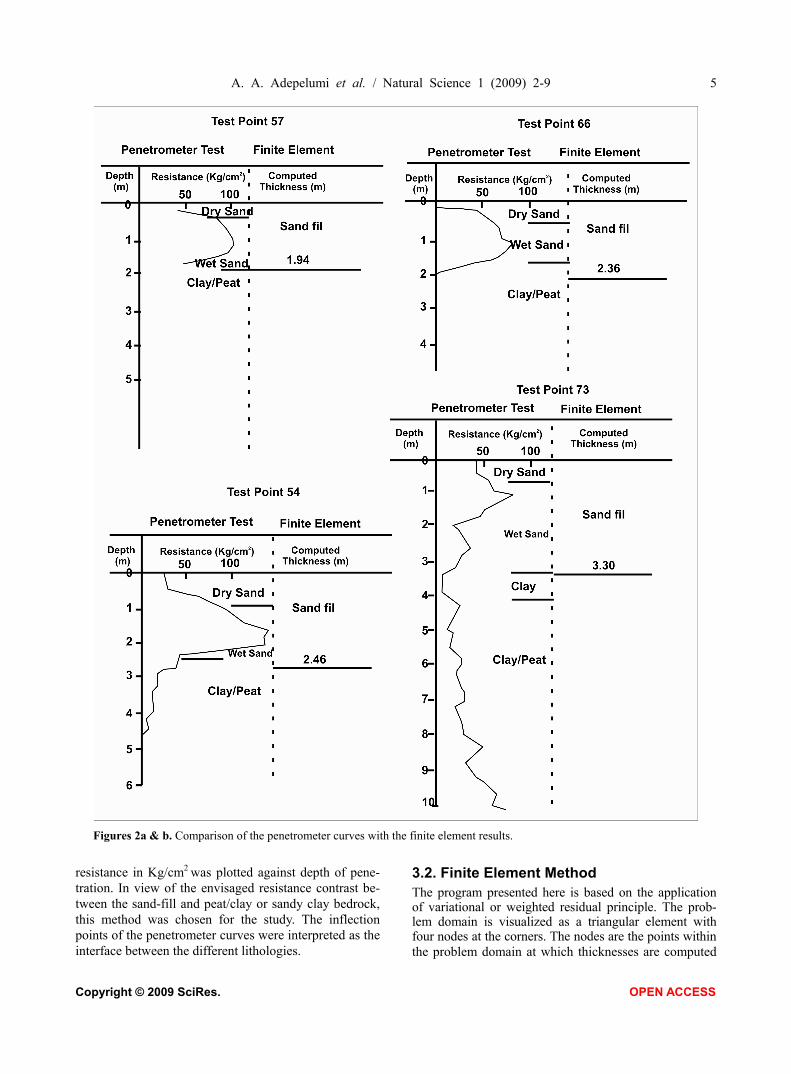
Figures 2a & b. Comparison of the penetrometer curves with the finite element results.
resistance in Kg/cm2 was plotted against depth of pene-tration. In view of the envisaged resistance contrast be-tween the sand-fill and peat/clay or sandy clay bedrock, this method was chosen for the study. The inflection points of the penetrometer curves were interpreted as the interface between the different lithologies.
3.2. Finite Element Method The program presented here is based on the application of variational or weighted residual principle. The prob-lem domain is visualized as a triangular element with four nodes at the corners. The nodes are the points within the problem domain at which thicknesses are computed
6 A. A. Adepelumi et al. / Natural Science 1 (2009) 2-9
Copyright © 2009 SciRes. OPEN ACCESS
Fenner [5]. The residual at each point in the problem domain is a measure of the degree to which the thickness
does not satisfy the governing equation. A trial solution t(x,y) is built up as a continuation of the basis function
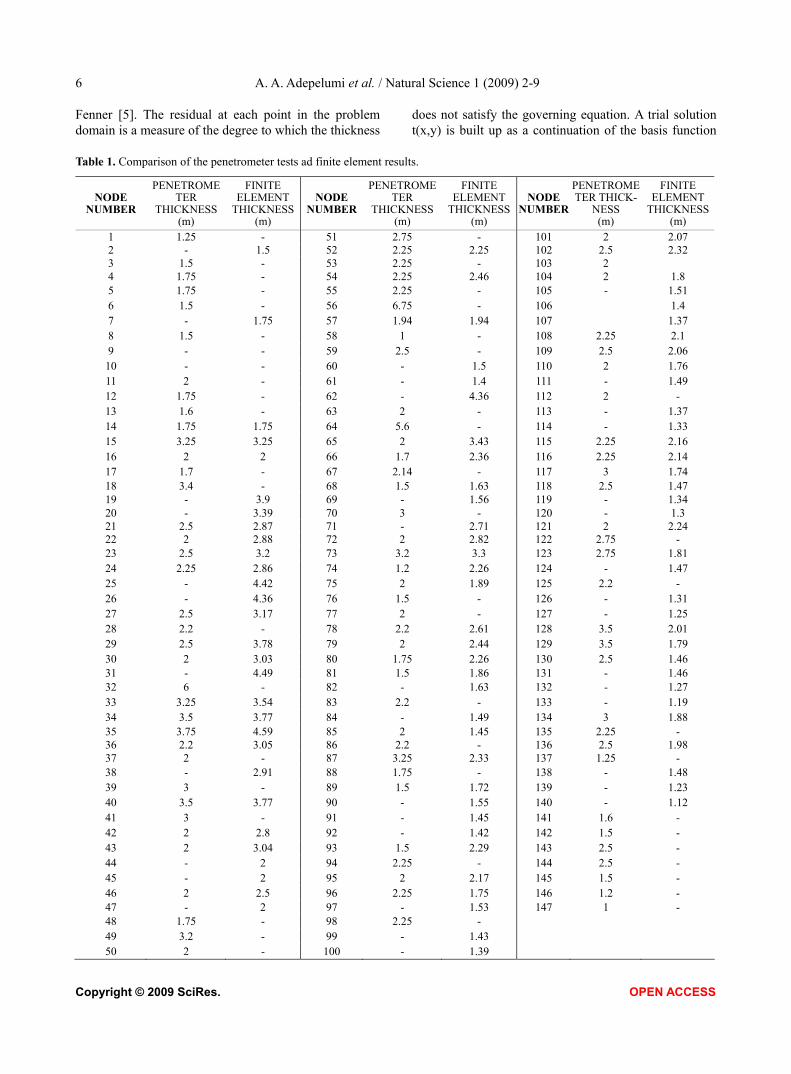
Table 1. Comparison of the penetrometer tests ad finite element results.
NODE NUMBER
PENETROME TER
THICKNESS (m)
FINITE ELEMENT
THICKNESS (m)
NODE NUMBER
PENETROME TER
THICKNESS(m)
FINITE ELEMENT
THICKNESS(m)
NODE NUMBER
PENETROME TER THICK-
NESS (m)
FINITE ELEMENT
THICKNESS(m)
1 1.25 - 51 2.75 - 101 2 2.07 2 - 1.5 52 2.25 2.25 102 2.5 2.32 3 1.5 - 53 2.25 - 103 2 4 1.75 - 54 2.25 2.46 104 2 1.8 5 1.75 - 55 2.25 - 105 - 1.51 6 1.5 - 56 6.75 - 106 1.4 7 - 1.75 57 1.94 1.94 107 1.37 8 1.5 - 58 1 - 108 2.25 2.1 9 - - 59 2.5 - 109 2.5 2.06
10 - - 60 - 1.5 110 2 1.76 11 2 - 61 - 1.4 111 - 1.49 12 1.75 - 62 - 4.36 112 2 - 13 1.6 - 63 2 - 113 - 1.37 14 1.75 1.75 64 5.6 - 114 - 1.33 15 3.25 3.25 65 2 3.43 115 2.25 2.16 16 2 2 66 1.7 2.36 116 2.25 2.14 17 1.7 - 67 2.14 - 117 3 1.74 18 3.4 - 68 1.5 1.63 118 2.5 1.47 19 - 3.9 69 - 1.56 119 - 1.34 20 - 3.39 70 3 - 120 - 1.3 21 2.5 2.87 71 - 2.71 121 2 2.24 22 2 2.88 72 2 2.82 122 2.75 - 23 2.5 3.2 73 3.2 3.3 123 2.75 1.81 24 2.25 2.86 74 1.2 2.26 124 - 1.47 25 - 4.42 75 2 1.89 125 2.2 - 26 - 4.36 76 1.5 - 126 - 1.31 27 2.5 3.17 77 2 - 127 - 1.25 28 2.2 - 78 2.2 2.61 128 3.5 2.01 29 2.5 3.78 79 2 2.44 129 3.5 1.79 30 2 3.03 80 1.75 2.26 130 2.5 1.46 31 - 4.49 81 1.5 1.86 131 - 1.46 32 6 - 82 - 1.63 132 - 1.27 33 3.25 3.54 83 2.2 - 133 - 1.19 34 3.5 3.77 84 - 1.49 134 3 1.88 35 3.75 4.59 85 2 1.45 135 2.25 - 36 2.2 3.05 86 2.2 - 136 2.5 1.98 37 2 - 87 3.25 2.33 137 1.25 - 38 - 2.91 88 1.75 - 138 - 1.48 39 3 - 89 1.5 1.72 139 - 1.23 40 3.5 3.77 90 - 1.55 140 - 1.12 41 3 - 91 - 1.45 141 1.6 - 42 2 2.8 92 - 1.42 142 1.5 - 43 2 3.04 93 1.5 2.29 143 2.5 - 44 - 2 94 2.25 - 144 2.5 - 45 - 2 95 2 2.17 145 1.5 - 46 2 2.5 96 2.25 1.75 146 1.2 - 47 - 2 97 - 1.53 147 1 - 48 1.75 - 98 2.25 - 49 3.2 - 99 - 1.43 50 2 - 100 - 1.39
A. A. Adepelumi et al. / Natural Science 1 (2009) 2-9 7
Copyright © 2009 SciRes. OPEN ACCESS
expressed as a series summation.
),(),(1
yxLNtyxtNNODE
LL
(1)
L = The nodal number t = An approximate or trial solution For the computation of the unknown thicknesses by
the program, the triangular mesh was digitized at equal intervals of 500m. The accuracy of the predicted thick-nesses is strongly dependent on the accuracy of the ini-tial guess or starting thicknesses and the size of the nodal spacing. The thicknesses were predicted for stations (nodes) at which penetrometer tests have been carried out and at which no penetrometer tests were carried so as to cover the entire survey site.
4. RESULTS AND DISCUSSION
The typical cone penetration curves obtained in the study area are shown in Fig. 2. As can be seen from the figures, the curves generally show relatively low resistance (0-60 Kg/cm2) within the uppermost layer of loose/ uncom-pacted dry sand. This increases to some 60–150 Kg/cm2 in the wet compacted sand, dropping sharply to between 5 and 45 Kg/cm2 in the underlying clay peat and sandy clay horizons. The penetrometer tests delineated three
to four lithologic units. The topsoil of dry and loose sand, wet sand, sand clay/clay or peat bedrock. It was ob-served in general that, the first two layers constitute the sand-fill (Fig. 2) whose thicknesses vary from 1.25 to 6.00 m (Table 1).
The finite element predicted thicknesses are presented in Table 1. The results were compared with the pene-trometer obtained sand-fill thicknesses. It is observed that the finite element derived thicknesses are in good agreement with the penetrometer test thicknesses with a few exceptions at stations 29, 30, 35, 65, 74 and 93, where very high percentage deviation of between 51 to 88% were obtained; these fairly large deviation may be due to insufficient input data to act as control around these stations.
The good correlation between the finite element pre-dicted thicknesses and that obtained from the penetrome-ter test results imply that, given a limited accurate thick-nesses as input data, the finite element program would predict the thicknesses at unknown stations to within a reasonable level of accuracy. The close agreement also indicates that the finite element predicted thicknesses could be reliably used for formation thickness estimation in the absence of sufficient penetrometer test results.
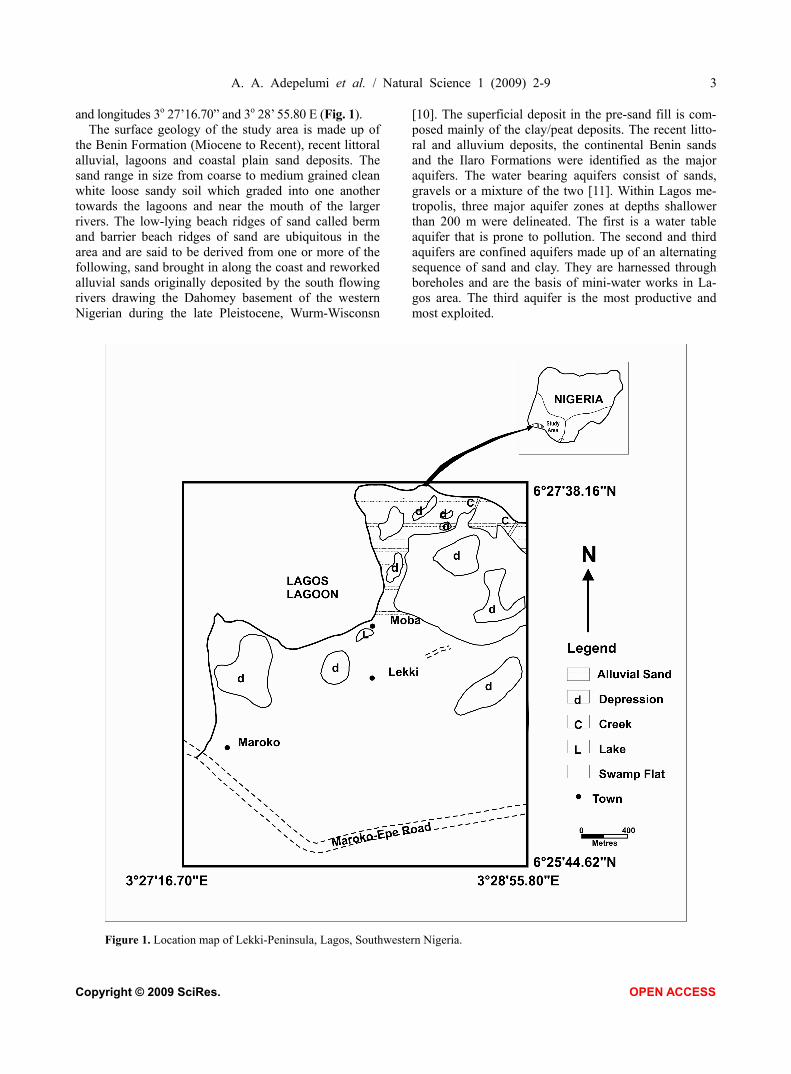
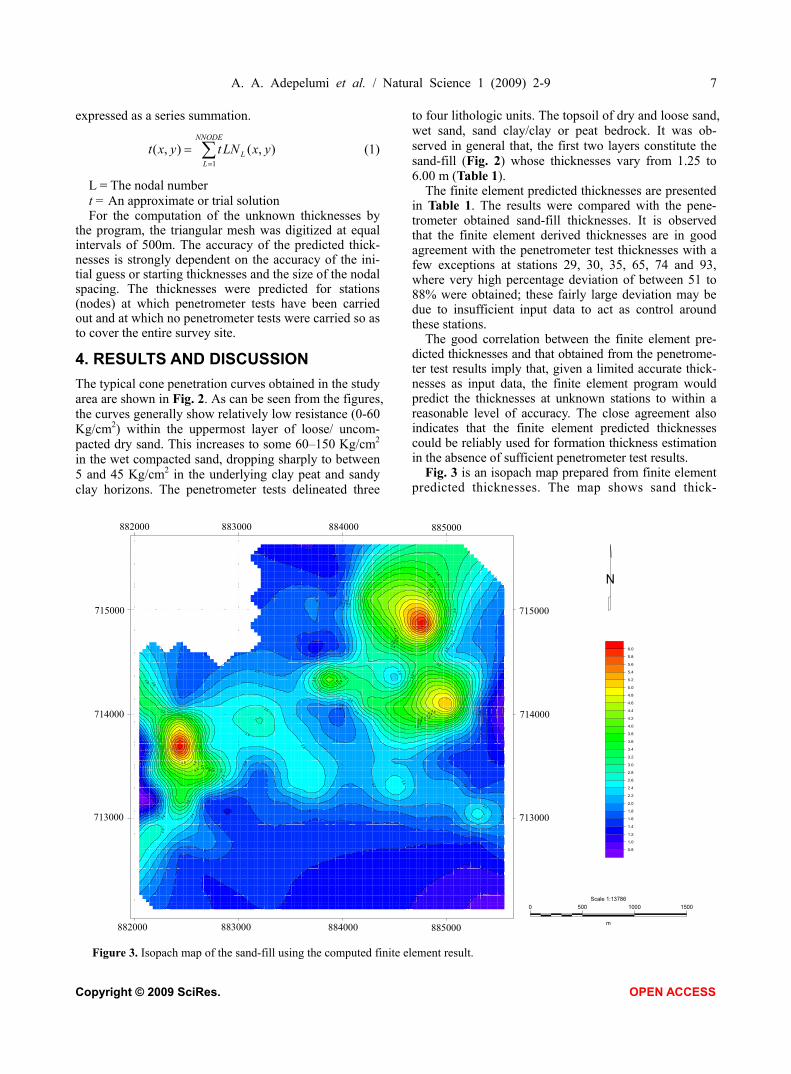
Fig. 3 is an isopach map prepared from finite element predicted thicknesses. The map shows sand thick-
Figure 3. Isopach map of the sand-fill using the computed finite element result.
0.8
1.0
1.0
1.0
1.2
1.2
1.2
1.2
1.4
1.4
1.4
1.4
1.4
1.4
1.4
1.4
1.4
1.6
1.6
1.6
1.6
1.6
1.6
1.6
1.8
1.8
1.8
1.8
1.8
1.8
1. 8
1.8
2.0
2.0
2.0
2.0
2.0
2.0
2.0
2.2
2.2
2.2
2.2
2.2
2.2
2.4
2.4
2.4
2.4
2.4
2.4
2.6
2.6
2.6
2.6
2.6
2.6
2.6
2.6
2.8
2.8 2.8
2.8
3. 0
3.0
3.0
3.2
3.2
3.2
3.2
3.2
3.4
3.4
3.4
3.4
3.4
3.6
3.6
3.6
3.6
3.6
3.8
3.8
3.8
3.8
4.0 4.0
4.0
4.0
4.2
4.2
4.2
4.2
4.4
4.4 4.6
4.8
882000 883000 884000 885000
882000 883000 884000 885000
715000
714000
713000
715000
714000
713000
6.0
5.8
5.6
5.4
5.2
5.0
4.8
4.6
4.4
4.2
4.0
3.8
3.6
3.4
3.2
3.0
2.8
2.6
2.4
2.2
2.0
1.8
1.6
1.4
1.2
1.0
0.8
Scale 1:13786
m
0 500 1000 1500
N
882000 883000 884000 885000
715000
714000
713000
715000
714000
713000
882000 883000 884000 885000
8 A. A. Adepelumi et al. / Natural Science 1 (2009) 2-9
Copyright © 2009 SciRes. OPEN ACCESS
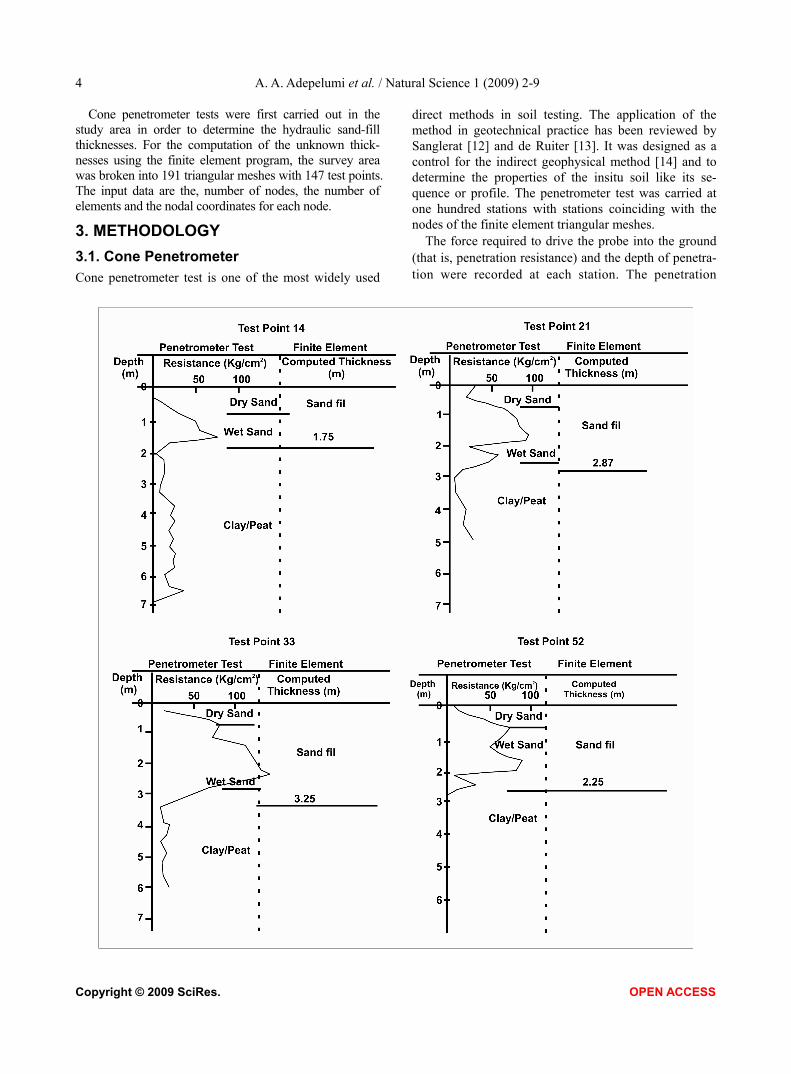
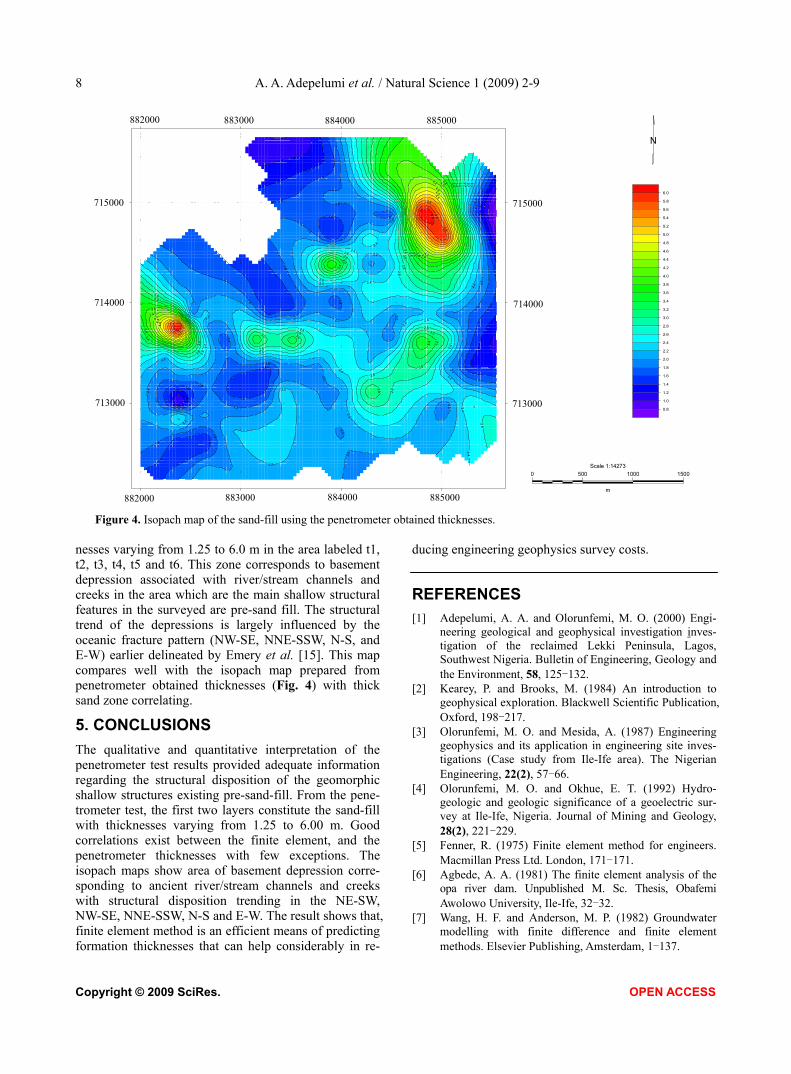
Figure 4. Isopach map of the sand-fill using the penetrometer obtained thicknesses. nesses varying from 1.25 to 6.0 m in the area labeled t1, t2, t3, t4, t5 and t6. This zone corresponds to basement depression associated with river/stream channels and creeks in the area which are the main shallow structural features in the surveyed are pre-sand fill. The structural trend of the depressions is largely influenced by the oceanic fracture pattern (NW-SE, NNE-SSW, N-S, and E-W) earlier delineated by Emery et al. [15]. This map compares well with the isopach map prepared from penetrometer obtained thicknesses (Fig. 4) with thick sand zone correlating.
5. CONCLUSIONS
The qualitative and quantitative interpretation of the penetrometer test results provided adequate information regarding the structural disposition of the geomorphic shallow structures existing pre-sand-fill. From the pene-trometer test, the first two layers constitute the sand-fill with thicknesses varying from 1.25 to 6.00 m. Good correlations exist between the finite element, and the penetrometer thicknesses with few exceptions. The isopach maps show area of basement depression corre-sponding to ancient river/stream channels and creeks with structural disposition trending in the NE-SW, NW-SE, NNE-SSW, N-S and E-W. The result shows that, finite element method is an efficient means of predicting formation thicknesses that can help considerably in re-
ducing engineering geophysics survey costs.
REFERENCES
[1] Adepelumi, A. A. and Olorunfemi, M. O. (2000) Engi-neering geological and geophysical investigation inves-tigation of the reclaimed Lekki Peninsula, Lagos, Southwest Nigeria. Bulletin of Engineering, Geology and the Environment, 58, 125-132.
[2] Kearey, P. and Brooks, M. (1984) An introduction to geophysical exploration. Blackwell Scientific Publication, Oxford, 198-217.
[3] Olorunfemi, M. O. and Mesida, A. (1987) Engineering geophysics and its application in engineering site inves-tigations (Case study from Ile-Ife area). The Nigerian Engineering, 22(2), 57-66.
[4] Olorunfemi, M. O. and Okhue, E. T. (1992) Hydro-geologic and geologic significance of a geoelectric sur-vey at Ile-Ife, Nigeria. Journal of Mining and Geology, 28(2), 221-229.
[5] Fenner, R. (1975) Finite element method for engineers. Macmillan Press Ltd. London, 171-171.
[6] Agbede, A. A. (1981) The finite element analysis of the opa river dam. Unpublished M. Sc. Thesis, Obafemi Awolowo University, Ile-Ife, 32-32.
[7] Wang, H. F. and Anderson, M. P. (1982) Groundwater modelling with finite difference and finite element methods. Elsevier Publishing, Amsterdam, 1-137.
0 .8 1 .0
1.2
1.2
1.2
1.4
1.4
1.4
1.4
1.6
1.6
1.6
1.6
1.6
1.6
1.6
1.6
1.6
1.6
1.6
1.6
1.8
1.8
1.8
1.8
1.8
1.8
1.8
1.8
1.8
1.8
1.8
1.8
1.8
1.8
1
.8
2.0
2.0
2.0
2.0
2.0
2.0
2. 0
2 .0
2.0
2.0
2.2
2.2
2.2
2.2
2.2
2.2
2.2
2.2
2.2
2.2
2 .4
2.4
2.4
2.4
2.4 2.4
2.4
2.4
2.4
2 .4
2.6
2.6
2.6
2.6
2.6
2.6
2.6
2.6
2.6
2.6
2.8
2.8
2.8
2.8
2.8
2.8
2.8
2. 8
3.0
3.0
3.0 3.0
3.0
3.0
3.0
3. 0 3.0
3.0
3.2
3.2
3.2
3.2
3.4
3.4
3.4
3.4
3.4
3.6
3.6
3.8
3.8
3.8
4.0
4.0
4.0
4.2
4.2
4.2
4.4
4.4
4.6
4.6 4.8
5.4
5.6
5.8
6.0
882000 883000 884000 885000
882000 883000 884000 885000
715000
714000
713000
715000
714000
713000
6.0
5.8
5.6
5.4
5.2
5.0
4.8
4.6
4.4
4.2
4.0
3.8
3.6
3.4
3.2
3.0
2.8
2.6
2.4
2.2
2.0
1.8
1.6
1.4
1.2
1.0
0.8
Scale 1:14273
m
0 500 1000 1500
N
882000 883000 884000 885000
715000
714000
713000
715000
714000
713000
882000 883000 884000 885000

A. A. Adepelumi et al. / Natural Science 1 (2009) 2-9 9
Copyright © 2009 SciRes. OPEN ACCESS
[8] Buchanan K. M. and Pugh J. C. (1955) Land and people in Nigeria: The human geography of Nigeria and its en-vironmental background. London, University of London Press.
[9] Webb J. E. and Hill M. B. (1958) Ecology of Lagos la-goons (II): The topography and physical features of La-gos harbor & Lagos lagoons. Philosophical Transaction of Royal Society, London, B24, 319-333.
[10] Durotoye, A. B. (1975) Quaternary sediments in Nigeria. Geology of Nigeria, Elizabeth Press, Lagos, 431-451.
[11] Bureau de Recherches Geologiques et Minieres (1979) Pre-drilling hydrogeological report area 18 and 19 sub-mitted to the Federal Department of Water Resources, Lagos, Nigera, 1-60.
[12] Sanglerat, G. (1972) The penetration and soil exploration. Development in geotechnical engineering, Elsevier Sci-entific Publishing, New York, 52-80.
[13] De Rutter, J. (1981) Current penetrometer practice. American Society of Civil Engineers Convention, St. Louis, State of the Art report, Session 35, 64-64.
[14] Scott, C. R. (1969) An introduction to soil mechanics and foundations. Applied Science Publishers Ltd, London, 379-399.
[15] Emery, K. O. E., Uchupi, J. P., Bowin, C. and Mascle, J. (1975) Continental margin off western Africa-Angola to Sierra Leone. American Association of Petroleum Ge-ologist Bulletin, 59, 2209-2265.