Embed Size (px)
Citation preview

42 TRANSPORTATION RESEARCH RECORD 1133
Structural Optimization of Strong-Post W-Beam Guardrail
DEAN L. SICKING AND HAYES E. Ross, JR.
The design of W-beam guardrail was analyzed with the GUARD computer program to determine the feasibility of reducing guardrail costs without sacrificing barrier performance. Fifteen full-scale crash tests were simulated to validate the GUARD program for use with W-beam guardrails. Simulated crash tests involved full-size and mini-size sedans, small and large pickups, and a full-size van. The GUARD program was found to adequately simulate vehicle motions and predict wheel snag. Alternative barrier designs were then evaluated through GUARD simulation. Design variables included post spacing, post strength, rail height, and blockout depth. These simulations indicated that a W-beam guardrail with 8.33-ft post spacings and 10-in. blockouts could perform as well as or better than existing W-beam barrier designs.
W-beam guardrails have been used as roadside barriers in the United States for many years. Early barrier designs were not carefully analyzed and a wide variety of designs were used around the country. Some of the first documented testing of W-beam guardrails was conducted at General Motors Proving Grounds (1 ), the primary objective of which was to determine the proper height and the necessary post spacing for W-beam guardrails. Researchers found that W-beam barriers mounted 24 in. above the ground on relatively strong posts spaced on 12.5-ft centers could be pushed down by a full-size automobile striking at a high speed and angle. Therefore, a similar barrier with post spacings of 6.25 ft and 6-in. blockouts was tested and found to give acceptable performance. As a result, most W-beam barriers constructed for the next decade conformed. to these general design guidelines.
Automobile designs evolved over the next several years, and by the late 1960s full-size sedans were larger and had drastically different front bumpers than the vehicles used in the GM testing. Analysis of California accidents involving W-beam guardrails revealed that a significant number of these larger vehicle.<; penetrated the barriers. Therefore, in 1967 Beaton (2) undertook to repeat the testing conducted by GM. A preliminary test revealed that automobiles with high wedged-shaped bumpers, popular at that time, could push down and override a 24-in.-high guardrail mounted with 8-in. blockouts on posts spaced 12.5 ft. The barrier was thought to lack sufficient height and lateral strength. The response to this initial failure was to cut the post spacing in half and raise the guardrail height to 27 in. This design was then tested successfully. Further research efforts were directed toward determining an optimum barrier height. After guardrails were tested with 24-in. and 30-in. mounting heights, it was concluded that barriers with a 27-in.
Texas Transportation Institute, Texas A&M University System, College Station, Tex. 77843-3135.
rail height performed best. Researchers were unable to further optimize guardrail design because of insufficient funding. On the basis of this study, a 27-in.-high W-beam guardrail mounted on strong posts spaced 6.25 ft apart with 6-in. blockouts has gained nationwide acceptance. Thereafter, most strong-post W-beam guardrail designs tested conformed to these general characteristics.
Any structural optimization program requires a method of evaluating the performance of each design alternative considered. Until recently, full-scale crash testing has been the only accepted method for analyzing the performance of roadside barriers. Although researchers have recognized that potential benefits from optimizing the design of strong-post W-beam barriers are very large, they have been unable to undertake a comprehensive optimization effort because of the relatively high cost of full-scale crash testing.
Supplier estimates of new barrier construction show that approximately 2 million ft of new strong-post W-beam guardrail are constructed annually across the United States (W. P. Humble, Syro Steel Corporation, Girard, Ohio). If optimization of design standards can reduce barrier costs by only $1.00/ft, or approximately 8 percent, highway agencies could save as much as $2 million annually in construction costs. Further, recent tests by the Texas Transportation Institute (TTI) have revealed that mini-size vehicles striking at angles of 20 degrees can snag on standard steel-post W-beam guardrail, G4(1S) (3). Optimized barrier designs may be capable of preventing this undesirable behavior. Therefore, a study was undertaken to evaluate the potential for reducing the cost and improving the performance of strong-post W-beam guardrail through structural optimization of its design.
RESEARCH APPROACH
The basic goal of a structural optimization program is to maximize the efficiency of every element in a design. In simple terms, reduction of the number and size of elements to a minimum is desired. The general approach to optimizing a design involves (a) identifying all design variables that can be changed to improve efficiency, (b) identifying critical loading conditions for measuring design performance, (c) analyzing every possible design configuration for each critical loading condition, and (d) selecting the design that exhibits the best performance at the lowest construction cost.
Design Variables
The design of a strong-post W-beam guardrail is specified by four basic variables: post spacing, rail height, post size and

Sicking and Ross
embedment, and blackout size. Variations in any of these variables can significantly change both the impact performance and the cost of W-beam guardrail. A truly comprehensive optimization program should consider many variations in each of these variables as well as variations in the cross-sectional shapes of the W-beam and posts. However, in order to maintain compatibility with existing roadside barrier hardware inventories, no variations in basic beam and post shapes were considered. Further, in an effort to reduce the number of designs to be analyzed, only a few variations were considered for each of the variables listed.
The barrier design variations considered were as follows:
Variable
Post spacings (ft) Blockout depth (in.) Maximum post moments
(kip-in.) Rail height (in.)
Alternative Values
8.33, 12.5 10, 14
263, 525 24, 30
Note that an effort was made to maintain compatibility with existing standard guardrail lengths; the alternative post spacings selected represent two and three posts per 25 ft of guardrail. Finally, the two variations in post strength studied represent standard-strength posts and twice the strength of standard posts.
Critical Loading Conditions
The performance of strong-post W-beam guardrail is measured in terms of the range of vehicular impact conditions under which the barrier can exhibit acceptable safety performance. Nationally recognized performance standards, established by NCHRP Report 230 (4), require that roadside barriers must be capable of redirecting full-size automobiles weighing 4,500 lb striking at 60 mph and an angle of 25 degrees and mini-size vehicles weighing 1,800 lb striking at 60 mph and an angle of 15 degrees. An optimized barrier must demonstrate this minimum level of performance. However, there is some concern over the inability of standard guardrails to safely redirect a mini-size vehicle striking at 60 mph and 20 degrees (3). It should be possible to design an optimized barrier that can do this. Therefore, it was decided to select 4,500 lb, 60 mph, and 25 degrees and 1,800 lb, 60 mph, and 20 degrees as the two limiting impact conditions for the optimized barrier design.
Analysis Procedure
The best method of analyzing the safety performance of a roadside barrier is through full-scale crash testing. However, the high cost of such testing precludes its use in an optimization study in which many barrier designs must be studied. The best alternative to full-scale testing is to use computer simulation programs to analyze guardrail safety performance. For these purposes, a simulation program must be capable of accurately predicting the potential for vehicle underride and override and wheel snag. BARRIER VII, HVOSM, GUARD, and CRUNCH are the only sophisticated computer programs that can be used to simulate flexible-barrier impacts. Of these four, only GUARD has been shown capable of accurately predicting
43
vehicle underride and override and wheel snag (3, 5). Therefore, GUARD was selected for this study.
The GUARD computer program is a three-dimensional computer simulation model of vehicle-barrier impacts. The program utilizes a 6-degree-of-freedom (di) vehicle model and deformable panels to simulate vehicle motion and sheet-metal crush. Deformable barriers, such as W-beam guardrail, are modeled with a beam and column finite-element formulation that allows for the input of soil-post interaction forces. The model formulation has been shown to be capable of accurately predicting both vehicle override and wheel snagging.
Past experience with the GUARD program has not been particularly favorable. The computer code contains a persistent problem that leads to an attempt to take the square root of a negative number. However, when this instability has been avoided, the program has correlated relatively well with crash testing. Most of the successful simulations conducted to date have involved strong-post W-beam barrier impacts; program instability appears to arise when simulations involve large barrier and vehicle sheet-metal deflections. As a result, many of these simulations could not be carried to the end of vehiclebarrier contact. However, most important simulation data were collected before program termination, and these problems were not considered insurmountable.
The research approach undertaken involved using results of full-scale crash tests to validate guardrail impact simulation techniques with the GUARD computer program. The GUARD program could then be used to extrapolate test results to evaluate alternative barrier designs. Validation crash tests were selected to include adverse vehicle behavior that could be expected during impacts with optimized guardrails. Wheel snag, rollover, and vaulting are of special concern for optimized guardrails that have fewer barrier elements and a somewhat reduced lateral strength.
PROGRAM VALIDATION
A series of tests were recently conducted at TTI to determine the limits of performance of strong-post W-beam barrier designs (3 ). These tests involved both full-size and mini-size automobiles and several different W-beam barriers. A number of the tests involved wheel snagging, which is typical of standard W-beam barrier performance with mini-size vehicles striking at relatively wide angles. A second study conducted at TTI evaluated the performance of strong-post guardrails when installed on roadside slopes (5 ). Several of these tests involved full-size sedans vaulting over G4(1S) barriers. Finally, the strength of W-beam barriers was examined in a study by Southwest Research Institute in which G4(1S) barriers were tested four times under severe impact conditions (6). Fifteen tests were selected from these three studies for validation of the GUARD computer program. All tests selected involved W-beam guardrail mounted on W6X9 steel posts. Results of these tests virtually covered the spectrum of potential vehicle performance, including wheel snag, vaulting, and rollover. Selected crash test conditions and results are summarized in Table 1.
Seven crash tests from the report by Buth et al. (3) were selected for the GUARD validation study. As shown in Table 1, three of those tests involved mini-size automobiles, one test

44 TRANSPORTATION RESEARCH RECORD 1133
TABLE 1 SUMMARY OF CRASH TESTS SELECTED FOR GUARD VALIDATION
Vehicle Impact Conditions
Weight Speed Angle Test No. Study (lb) (mph) (degree)
4798-4 Buth et al. (3) 2,192 59.9 21.5 4798-5 Buth et al. (3) 2,100 59.5 15.0 4798-6 Buth et al. (3) 3,260 60.0 22.0 4798-7 Buth et al. (3) 4,324 59.2 24.0 4798-8 Buth et al. (3) 4,179 56.9 23.5 4798-9 Buth et al. (3) 2,129 60.3 19.0 4798-10 Buth et al. (3) 4,644 59.5 15.0 3659-1 Michie et al. (6) 4,500 60.0 25.0 3659-2 Michie et al. (6) 4,500 60.0 15.0 3659-3 Michie et al. (6) 4,500 60.0 25.0 3659-4 Michie et al. (6) 2,250 60.0 15.0 119 Michie et al. ( 4) 4,169 53.4 30.2 120 Michie et al. (4) 3,813 56.8 28.4 121 Michie et al. ( 4) 4,478 56.2 27.4 120 Michie et al. ( 4) 4,570 62.9 25.3
involved a full-size sedan, two tests were conducted with pickup trucks, and one test involved a van. All tests involved either vehicle rollover or wheel snagging. Therefore, overall vehicle trajectory and wheel position were selected as primary measures of simulation validity. Vehicle trajectory was measured in terms of roll, pitch, and yaw angles as a function of time; wheel position was measured in terms of location relative to guardrail posts. Other simulation evaluation criteria included barrier dynamic deflection, length of vehicle-barrier contact, and peak 50-msec average accelerations.
Four crash tests involving full-size and subcompact vehicles striking G4(1S) barriers on nonlevel terrain were selected from the report by Ross and Sicking (5). Two these tests involved full-size vehicles overriding the strong-post W-beam guardrail. Overall vehicle trajectory and bumper movement were selected as primary measures of validity for these tests. Vehicle accelerations and barrier deflections were also used as simulation evaluation criteria. Finally, four crash tests from NCHRP Report 115 (6) were simulated. These tests involved full-size vehicles striking G4(1S) barriers at wide impact angles and high spt>.eds. Detailed documentation of these tests is not available; therefore program evaluation was limited to peak vehicle accelerations and maximum barrier deflections.
Vehicle Trajectory
The simulation program accurately predicted overall vehicle trajectories for most of the crash tests simulated. Many of the simulations gave excellent correlation with test vehicle trajectory up to the time when the wheel of the test vehicle snagged on a guardrail post. Thereafter, the correlation between simulation and crash tests began to deteriorate. This result is not surprising because GUARD cannot simulate the forces generated by a wheel snagging on a guardrail post. These forces can impart large yaw and roll impulses to the test vehicle. Figures 1 through 7 show plots of predicted and measured roll, pitch, and yaw angle versus time for each of the first seven tests (3 ). Note that although correlation between crash test and simulation for Test 4798-7 was less than desirable, the program was able to predict vehicle rollover as observed in the test.
Barrier Type Comments
G4(1S) Wheel snag (mini-size vehicle) G4(1S) Smooth redirection (mini-size vehicle) G4(1S) Wheel snag (small pickup) G4(1S) Rollover (large van) G4(1S) Severe wheel snag (full-size pickup) Modified G4(2W) Wheel snag (mini-size vehicle) Modified G4(1S) Minor wheel sn11g (full-size sed11n) G4(1S) Vehicle vaulting (full-size sedan) G4(1S) Redirection (full-size sedan) G4(1S) Vehicle vaulting (full-size sedan) G4(1S) Redirection (subcompact) Modified G4(1S) Redirection G4(1S) Redirection G4(1S) Redirection Modified G4(1S) Redirection
Figures 8 through 11 show vehicle center-of-gravity (cg) motion versus time for the next four crash tests (5). The program was able to accurately predict overall vehicle motion, including vehicle override, observed in Tests 3659-1 and 3659-3. Figures 12 through 15 show front bumper motions for these same tests. The program was able to accurately predict bumper positions for each of these tests.
25.0
Yaw
20.0
Vl LU LU a: 15.0 <.:: LU Cl
>-;;: LU :r: LU
~ 10 .0 • Simulat1on _j
"- • Test Vl
Cl
5.0
0.00 0.05 0.10 0.15 0.20
TIME (SECONDS)
FIGURE 1 Yaw, pitch, and roll versus time for simulation and Test 4798-4.

25.0
Yaw
20.0
Yaw
V1 15.0 w w 0:: <!l w Cl
I- 10.0 •Simulation ~ • Test ::E w u .. --' "'-V1 5.a Ci
a . a Pitch Pitch P.oll Uoll
-5.0 a .au 0 .05 0. 1ll 0 . 15 o . 2a
TIME (SECONDS)
FIGURE 2 Yaw, pitch, and roll versus time for simulation and Test 4798-5.
25.0 Yaw
20.0
Yaw
V1 15.0 w ... , "' <!l w Cl
t-iO. • Simulation :z
w • Test ::E w u .. --' "'-VI
c; 5.0
Roll
Roll 0.0 Pitch
Pitch
-5.0 0.00 0 .05 0 . 10 0 . 15 0. 20
Tlt1E (SECOUOS)
FIGURE 3 Yaw, pitch, and roll versus time for simulation and Test 4798-6.
Vl w w
"' '-" w Cl
t-:z: ~ w u .. --' c. Vl
Ci
50.0 A Simulation • Test
Ya~1
40.a
Roll Yaw
3a.o
2a.o Roll
Pitch
ia.a Pitch
o. o.i-::::;;;o:o~::.:...-..--::::::::=--~-o. oo 0. 10 a.20 o.3a o .4a o.5a
THIE (SECONDS)
FIGURE 4 Yaw, pitch, and roll versus time for simulation and Test 4798-7.
20.0 A Simulation • Test
15.0
Yaw
VI w w
"' 10.0 "' w Cl
;--z w
"" w u G.0 Yaw c:: --' "'-Vl
0
0.0 ~m~ Roll
- 5.0
0 .00 0.-15 0 . :o U. lf. 0.20
TIME (SECONDS)
FIGURES Yaw, pitch, and roll versus time for simulation and Test 4798-8.

Vl w w D'.
"' w Cl
,__ :z: w ::: w l.J < __, 0.. .,, Cl
25.a
2a.a
15.a
la.a
5.a
a .a -
-5 . (J
-10.0
-15.a
... Simulation • Test
Yaw
Pl tch Pitch
Roll
-2a.o +-------~--~---If' Roll
a.2a a.ao a.05 0.10 0.15
Tll1E (SECONDS)
FIGURE 6 Yaw, pitch, and roll versus time for simulation and Test 4798-9.
lo: ~ l.J < __, Cl.. V1
Ci
25.a & Simulation • Test
Yaw
Yaw
Roll
Roll
Pitch P1 tch
-5.o---~---~--~--~
·J.ao 0.11) o.2a 0.30 a.4a
Tll1E . (SE Corms)
FIGURE 7 Yaw, pitch, and roll versus time for simulation and Test 4798-10.
100
50
~ 0 ., .,
.c 0 -50
~ N
-100
-150
-200 - 100 100 200 JOO
X (inches)
•-•Test •-•Guard
FIGURE 8 XZ-plot of vehicle center of gravity, Test 3659-1.
~
"' ., .c 0 -50
~ N -100
•- •Test •- •Guard
-200 -1---+----.---,..----.----.---,..----l -100 100 200 300
X (inches)
FIGURE 9 XZ-plot of vehicle center of gravity, Test 3659-2.
100
50
~ 0
OJ ., .c 0 -50
~ N
-100
•-- •Test -150 •--•Guard
-200 -100 100 200 JOO 400 500 600
X (inches)
FIGURE 10 XZ-plot of vehicle center of gravity, Test 3659-3.
~
"' ., .c 0 -50 c
0
N -100
-150
Face o rail
•-•Test ·-·Guard
-200 +----4----.---..---~---.---,..----l -100 100 200
X (inches)
FIGURE 11 XZ-plot of vehicle center of gravity, Test 3659-4.

Sicking and Ross
llO
50
40 ,...... "' "' .<: 0 30
6 >- 20
•- •Test 10 ·-- •Guard
0 +---~----t---~---..,--------1 -200 -100 0 100 200 JOO
Z (inches)
FIGURE 12 YZ-plQt of vehicle right front bumper, Test 3659-1.
llO
50
40 ,...... "' "' .<: 0 30
2, >- 20
•- •Test 10 • - •Guard
O +---~----t---~---~-----1 -200 -100 0 100 200 JOO
Z (inches)
FIGURE 13 YZ-plot of vehicle right front bumper, Test 3659-2.
>- 20
•- •Test 10 • - •Guard
O+---~----t---~---~----4 -200 -100 0 100 200 JOO
Z (inches)
FIGURE 14 YZ-plot of vehicle right front bumper, Test 3659-3.
llO
50
,...... 40
"' "' .<: 0 30
2, >- 20
-•Test 10 -- •Guard
0 -200 -100 0 100 200 JOO
Z (inches)
FIGURE 15 YZ-plot of vehicle right front bumper, Test 3659-4.
47
Wheel Position
GUARD can be used to determine the motion of a striking vehicle's wheels relative to the guardrail posts. Figure 16 shows a plan view of the motion of a vehicle's right front tire relative to the guardrail from a simulation of Test 4798-6 (3 ). Figure 17 shows the predicted interference between the test vehicle's right front tire and post from Test 4798-8 (3). As shown in Figures 16 and 17, although the program does not model wheel snagging, GUARD can be used to predict its occurrence. The program accurately predicted wheel snagging for every test in which it was observed. For some impact conditions the simulation tended to predict a greater degree of wheel snag than was observed during testing. This may be caused by an unrepresentatively low effective vehicle sheetmetal stiffness for a few of the vehicles included in the study.
It should be noted that the tendency for a vehicle's wheel to snag on a guardrail post is related to the point of barrier impact.
WHE"EL
I \ I I I
FIGURE 16 Right front wheel motion, Test 3659-6.
POST 8
WHEEL~
r I
FIGURE 17 Predicted wheel snag, Test 3659-8.
48
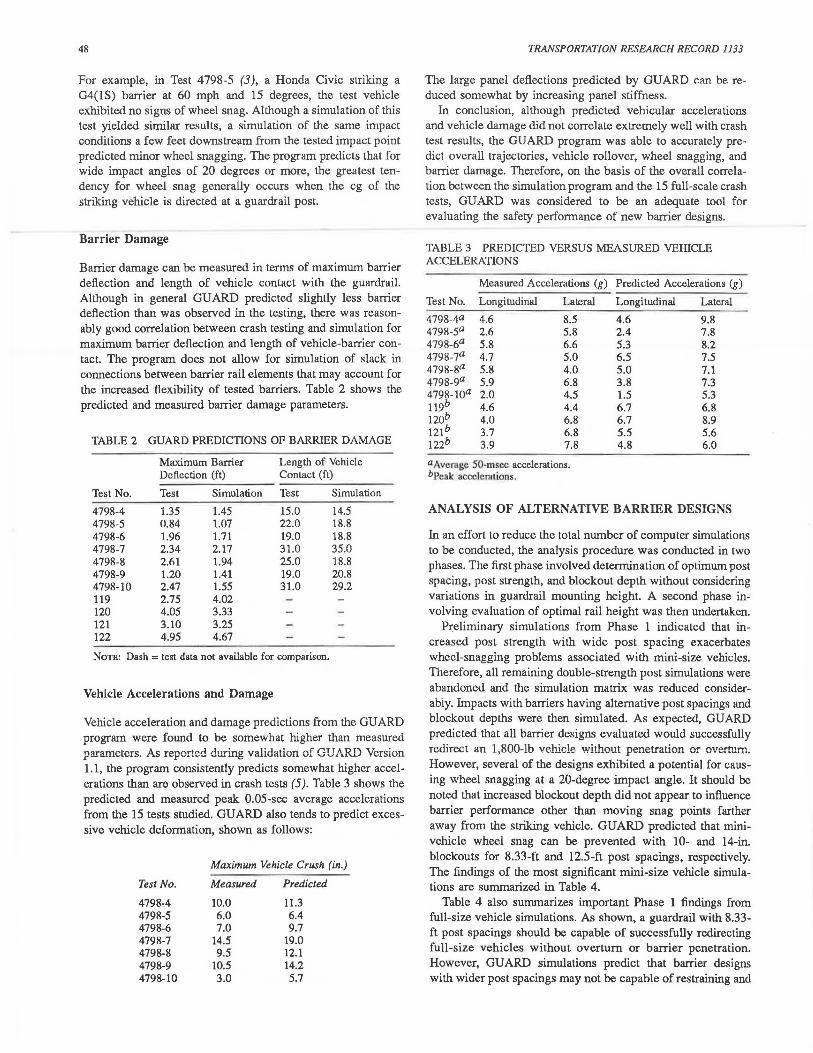
For example, in Test 4798-5 (3), a Honda Civic striking a G4(1S) barrier at 60 mph and 15 degrees, the test vehicle exhibited no signs of wheel snag. Although a simulation of this test yielded similar results, a simulation of the same impact conditions a few feet downstream from the tested impact point predicted minor wheel snagging. The program predicts that for wide impact angles of 20 degrees or more, the greatest tendency for wheel snag generally occurs when the cg of the striking vehicle is directed at a guardrail post.
Barrier Damage
Barrier damage can be measured in terms of maximum barrier deflection and length of vehicle contact with the guardrail. Although in general GUARD predicted slightly less barrier deflection than was observed in the testing, there was reasonably good correlation between crash testing and simulation for maximum barrier deflection and length of vehicle-barrier contact. The program does not allow for simulation of slack in connections between barrier rail elements that may account for the increased flexibility of tested barriers. Table 2 shows the predicted and measured barrier damage parameters.
TABLE 2 GUARD PREDICTIONS OF BARRIER DAMAGE
Test No.
4798-4 4798-5 4798-6 4798-7 4798-8 4798-9 4798-10 119 120 121 122
Maximum Barrier Deflection (ft)
Test Simulalion
1.35 1.45 0.84 1.07 1.96 1.71 2.34 2.17 2.61 1.94 1.20 1.41 2.47 1.55 2.75 4.02 4.05 3.33 3.10 3.25 4.95 4.67
Length of Vehicle Contact (ft)
Test Simulation
15.0 14.5 22.0 18.8 19.0 18.8 31.0 35.0 25.0 18.8 19.0 20.8 31.0 29.2
NoTE: Dash = test data not available for comparison.
Vehicle Accelerations and Damage
Vehicle acceleration and damage predictions from the GU ARD program were found to be somewhat higher than measured parameters. As reported duri.'1g validation of GUARD Version 1.1, the program consistently predicts somewhat higher accelerations than are observed in crash tests (5). Table 3 shows the predicted and measured peak 0.05-sec average accelerations from the 15 tests studied. GUARD also tends to predict excessive vehicle deformation, shown as follows:
Maximum Vehicle Crush (in.)
Test No. Measured Predicted
4798-4 10.0 11.3 4798-5 6.0 6.4 4798-6 7.0 9.7 4798-7 14.5 19.0 4798-8 9.5 12.1 4798-9 10.5 14.2 4798-10 3.0 5.7
TRANSPORTATION RESEARCH RECORD 1133
The large panel deflections predicted by GUARD can be reduced somewhat by increasing panel stiffness.
In conclusion, although predicted vehicular accelerations and vehicle damage did not correlate extremely well with crash test results, the GUARD program was able to accurately predict overall trajectories, vehicle rollover, wheel snagging, and barrier damage. Therefore, on the basis of the overall correlation between the simulation program and the 15 full-scale crash tests, GUARD was considered to be an adequate tool for evaluating the safety performance of new barrier designs.
TABLE 3 PREDICTED VERSUS MEASURED VEHICLE ACCELERATIONS
Measured Acceleralions (g)
Test No. Longitudinal Lateral
'1798-'1a 4.6 8.5 4798-5a 2.6 5.8 4798-6a 5.8 6.6 4798-7a 4.7 5.0 4798-8a 5.8 4.0 4798-9a 5.9 6.8 4798-lOa 2.0 4.5 119b 4.6 4.4 12ob 4.0 6.8 121b 3.7 6.8 122b 3.9 7.8
a Average 50-msec accelerations. bPeak accelerations.
Predicted Acceleralions (g)
Longitudinal Lateral
4.6 9.8 2.4 7.8 5.3 8.2 6.5 7.5 5.0 7.1 3.8 7.3 1.5 5.3 6.7 6.8 6.7 8.9 5.5 5.6 4.8 6.0
ANALYSIS OF ALTERNATIVE BARRIER DESIGNS
In an effort to reduce the total number of computer simulations to be conducted, the analysis procedure was conducted in two phases. The first phase involved determination of optimum post spacing, post strength, and blockout depth without considering variations in guardrail mounting height. A second phase involving evaluation of optimal rail height was then undertaken.
Preliminary simulations from Phase 1 indicated that increased post strength with wide post spacing exacerbates wheel-snagging problems associated with mini-size vehicles. Therefore, all remaining double-strength post simulations were abandoned and the simulation matrix was reduced considerabiy. Impacts with barriers having alternative post spacings and blockout depths were then simulated. As expected, GUARD predicted that all barrier designs evaluated would successfully redirect an 1,800-lb vehicle without penetration or overturn. However, several of the designs exhibited a potential for causing wheel snagging at a 20-degree impact angle. It should be noted that increased blockout depth did not appear to influence barrier performance other than moving snag points farther away from the striking vehicle. GUARD predicted that minivehicle wheel snag can be prevented with 10- and 14-in. blockouts for 8.33-ft and 12.5-ft post spacings, respectively. The findings of the most significant mini-size vehicle simulations are summarized in Table 4.
Table 4 also summarizes important Phase 1 findings from full-size vehicle simulations. As shown, a guardrail with 8.33-ft post spacings should be capable of successfully redirecting full-size vehicles without overturn or barrier penetration. However, GUARD simulations predict that barrier designs with wider post spacings may not be capable of restraining and

Sicking and Ross 49
TABLE 4 COMPARISON OF SIMULATIONS OF VEHICLE IMPACTS WITH STANDARD BARRIER AND ALTERNATIVE BARRIER DESIGNS
Mini-Size Vehicle Full-Size Vehicle
G4(1S) Option 1 Option 2 G4(1S) Option 1 Option 2
Post spacing (ft) 6.25 8.33 12.5 6.25 8.33 12.5 Blackout size (in.) 6 10 14 6 10 14 Vehicle weight (lb) 1,960 1,960 1,960 4,500 4,500 4,500 Impact speed (mph) 60 60 60 60 60 60 Impact angle (degrees) 20 20 20 25 25 25 Maximum barrier deflection (in.) 17.5 18.5 20.l 44.0 47.5 79.0 Maximum vehicle crush (in.) 11.3 11.1 11.0 18.3 16.8 16.0 Wheel snag Yes No No No No No Barrier penetration No No No No No Yes Maximum 50-msec avg acceleration Lateral (g) 9.8 8.9 8.4 8.4 6.0 5.9 Longitudinal (g) 4.6 4.6 4.6 6.0 4.9 5.6
Vehicle exit angle (degrees) 4.4 4.8 4.9 10.0 12.2 12.5
TABLE 5 SUMMARY OF SIMULATIONS OF VEHICLE IMPACTS WITH ALTERNATIVE BARRIER DESIGNS
Mini-Size Vehicle by Rail Height (in.) Full-Size Vehicle by Rail Height (in.)
24 27
Post spacing (ft) 8.3 8.3 Blackout size (in.) 10 10 Vehicle weight (lb) 1,960 1,960 Impact speed (mph) 60 60 Impact angle (degrees) 20 20 Maximum barrier deflection (in.) 18.0 18.5 Maximum vehicle crush (in.) 8.6 11.1 Wheel snag No No Barrier penetration No No Maximum 50-msec avg acceleration
Lateral (g) 8.9 8.9 Longitudinal (g) 4.4 4.6
Vehicle exit angle (degrees) 5.6 4.8 Maximum cg climb (in.) 3.7 3.6 Maximum roll angle (degrees) 1.9 -2.0
redirecting full-size vehicles striking at high speeds and wide angles.
Finally, the barrier design predicted to have the best impact performance, 8.33-ft post spacing with 10-in. blockouts and standard-strength posts, was then used in Phase 2 to evaluate optimal guardrail heights. Simulation of impacts by full-size automobiles on guardrails with a 30-in. rail height revealed that raising the height of the rail did not significantly improve its redirective capability. Although maximum vehicle roll angle and vehicle climb for this simulation were somewhat lower than those from simulations of a 27-in. rail mounting height, performance differences have to be considered in.significant. However, simulations of mini-size vehicle impacts on a guardrail with a 30-in. mounting height indicated that the potential for small vehicles to wedge under the barrier and snag on guardrail posts was greatly increased. It was therefore concluded that improvements in large-car impact performance associated with raising the barrier mounting height were not as great as potential problems involving mini-size vehicle impacts.
Likewise, simulations of reduced mounting heights revealed that potential performance improvements during impacts by mini-size vehicles were outweighed by additional problems associated with impacts by full-size automobiles. Reduced rail heights and associated reductions in the space below the rail
30
8.3 10 1,960 60 20 16.0 14.0 Yes No
8.6 5.3 3.0 -2.0 -10.6
24 27 30
8.3 8.3 8.3 10 10 10 4,500 4,500 4,500 60 60 60 25 25 25 54.0 47.5 47.0 18.8 16.8 16.5 No No No No No No
5.8 6.0 6.1 4.9 4.9 4.8 15.0 12.2 11.5 8.5 3.5 2.1 8.3 5.4 -2.7
element tended to minimize the potential for mini-size vehicle wheel snag, thereby reducing required blockout size. However, simulation of a full-size sedan revealed that both the maximum vehicle roll angle and vehicle climb increase significantly when the rail height is reduced.
These findings are not surprising when the height of the center of the barrier rail is compared with the cg of the vehicles it is required to redirect. Ideally, the center of a barrier's lateral resistance should be as close as possible to a vehicle's cg location. Automobile cg heights range from 19 to 24 in.:
Vehicle
Full-size sedan Mini-size sedan
CG Height (in.)
12-24 19-22
The standard W-beam mounting height of 27 in. places the center of the rail element 21 in. above the ground. Thus the standard guardrail mounting height places the center of barrier resistance approximately in the middle of the range of expected vehicle cg heights. Raising or lowering the rail element moves the barrier's center of resistance near one end of the range of expected cg locations. As a result, the safety performance of the barrier for automobiles with cg locations at the other end of the spectrum is adversely affected. Table 5 summarizes findings of simulations with alternative barrier heights.

so
CONCLUSIONS AND RECOMMENDATIONS
Based on simulation results shown in Table 4, it can be concluded that a W-beam guardrail with an 8-ft 4-in. post spacing and 10-in. blockouts, standard steel posts, and 27-in. rail mounting height should perform as well as a standard G4(1S) guardrail. As shown in Table 4, GUARD predicted that the optimized barrier would produce somewhat lower accelerations on striking vehicles and that it could eliminate tire-snagging problems associated with the G4(1S) barrier. Predicted maximum harrier cleftections for the optimize.(! barrie.r are less than 10 percent more than similar predictions for standard G4(1S) . Although the new design would allow slightly larger barrier deflections and slightly larger vehicle exit angles than the standard barrier, its overall safety performance should be better than that for G4(1S) guardrail.
The optimized barrier contains 13 percent less steel than the standard design and requires 25 percent fewer posts. Manufacturer's estimates indicate that materials for G4(1S) guardrail cost approximately $7.50/ft or $0.46/lb of steel (W. P. Humble, Syro Steel Corporation). At these rates, materials for the proposed new design would cost approximately $6.56/ft. Material and productivity cost standards indicate that labor and equipment costs for construction of standard guardrail are approximately $5.00/ft (7). If elimination of every fourth post allows the proposed new design to be installed with 15 percent less labor, the labor costs associated with this barrier would be approximately $4.25. The optimized barrier design could then be installed for a total cost of approximately $10.81/ft compared to $12.50/ft for standard G4(1S). Thus, the optimized barrier design could save highway agencies $1.69/ft of new guardrail, or a total of more than $3.4 million annually (W. P. Humble, Syro Steel Corporation).
TRANSPORTATION RESEARCH RECORD 1133
Therefore, in view of the potential for large savings in construction costs and improved barrier performance, it is recommended that further efforts be undertaken to optimize the design of strong-post guardrails. Subsequent studies should include additional design parameters such as post configuration and material as well as W-beam gauge thickness. The new optimized design should then be crash tested to verify simulation results.
Finally, as shown earlier, optimization of the common traffic barrier designs could result in tremendous reductions in highway barrier construcLion costs as well as improve barrier impact performance. It is recommended that further efforts be taken to optimize designs of all widely used barriers.
REFERENCES
1. L. C. Lund strum and P. C. Skeels. Full-Sculc Appraisals of Guardrail Installations by Car Impact Tests. HRB Proc., Vol. 38, 1959.
2. J. L. Beaton et al. Dynamic Tests of Corrugated Metal Beam Guardrail. Research Report M&R 636392. Division of Highways, California Department of Public Works, Sacramento, Jan. 1967.
3. C. E. Buth et al. Performance Limits of Longitudinal Barrier Systems. Final Report. Texas Transportation Institute, Texas A&M University System, College Station, May 1985.
4. J. D. Michie et al. NCHRP Report 230: Recommended Procedures for the Safety Performance Evaluation of Highway Appurtenances. TRB, National Research Council, Washington, D.C., 1981.
5. H. E. Ross and D. L. Sicking. Development of Guidelines for Placement of Longitudinal Barriers on Slopes. Final Report. Texas Transportation Institute, Texas A&M University System, College Station, May 1983.
6. J. D. Michie et al. NCHRP Report 115: Guardrail Performance and Design. TRB, National Research Council, Washington, D.C., 1971.
7. C. Engelsman. 1985 Heavy Construction Cost File. Van Nostrand Reinhold Company, New York, 1985.