Embed Size (px)
Citation preview

INTERNATIONAL MONETARY FUND
Structural Reforms and Economic Performance in Advanced and Developing Countries
Prepared by the Research Department
Approved by Simon Johnson
June 10, 2008
Contents Page Executive Summary...................................................................................................................3
I. Introduction ......................................................................................................................4
II. Structural Reforms: Measurement and Trends.................................................................6 A. Measuring Structural Reforms.................................................................................7 B. Trends in Structural Reform Since the 1970s..........................................................9
III. Determinants of Structural Reforms...............................................................................12
IV. Structural Reforms and Economic Growth ....................................................................16 A. Financial Sector Reforms ......................................................................................17 B. Real Sector Reforms ..............................................................................................24
V. Sequencing Real and Financial Sector Reforms ............................................................32
VI. Financial Sector Reforms and Resilience.......................................................................37
VII. Conclusions ....................................................................................................................42 References ...............................................................................................................................47 Box: Structural Reform Dataset ...............................................................................................8 Tables 1. Determinants of Reforms ...............................................................................................15 2. Growth Regression Results: Financial Sector Reforms .................................................20 3. Effects of Financial Sector Reforms on Financial Depth...............................................22 4. FDI Inflows and Financial Sector Reforms....................................................................22 5. The Differential Effects of Financial Reforms in Manufacturing Industries .................23 6. Financial Sector Reforms and Foreign-Currency Bond Ratings....................................25

2
7. Growth Regression Results: Real Sector Reforms .........................................................27 8. Trade Reforms and Export- and Import-to-GDP Share..................................................29 9. The Differential Effects of Trade Liberalization in Manufacturing Industries...............30 10. Real Sector Reforms and Foreign-Currency Bond Ratings............................................31 11. Effects of Trade Reforms on Financial Depth ................................................................32 12. FDI Inflows and Real Sector Reforms............................................................................32 13. Sequencing of Structural Reforms ..................................................................................34 14. Growth Effects of Alternative Reform Sequencing Strategies .......................................37 15. Financial Sector Reforms, Output Volatility, and Capital Account Crises ....................38 16. Financial Sector Reforms and Resilience to Terms-of-Trade Shocks ............................41 Figures 1. Economic Liberalization Indices ....................................................................................10 2. Economic Liberalization Indices by Income Group .......................................................11 3. Institutional Quality and Timing of Major Reforms.......................................................13 4. Financial Sector Reform and Growth .............................................................................17 5. Growth Breaks and Financial Sector Reforms................................................................18 6. Financial Depth and Domestic Financial Sector Liberalization .....................................21 7. Growth Breaks and Real Sector Reforms .......................................................................26 8. Growth Breaks and Sequencing of Reforms...................................................................35 9. Financial Sector Reforms, Output Volatility, and Capital Account Crises ....................39 10. Terms-of-Trade Shocks and the Financial Sector...........................................................40 Appendix Tables 1. List of Economies in the Sample ....................................................................................44 2. Description of Reform Indices........................................................................................45

3
Executive Summary
Economic policy agendas in member countries—even as they have been dominated over the past year by the response to the global financial crisis—will, going forward, increasingly need to refocus on core issues related to strengthening medium-run economic performance, including both average growth and resilience to shocks. This paper examines the contribution of structural policies—that is, policies that increase the role of market forces and competition in the economy, while maintaining appropriate regulatory frameworks to deal with market failures—to economic performance. The results are based on a new dataset covering reforms of domestic product markets, international trade, the domestic financial sector, and the external capital account, in 91 developed and developing countries. The key results are:
• There has been a broad tendency to pursue structural reforms across all segments of the Fund’s membership over the past three decades. Reforms have been driven by a number of factors, including the quality of broad political institutions in advanced economies early in the sample, and a catch-up effect spurring reform in developing countries subsequently, as sizeable cross-country reform gaps—with respect either to reform “leaders” or reformist “neighbors”—emerged. There is also evidence that IMF-supported programs and, in the case of some sectors, economic crises, have helped to catalyze structural reforms.
• Real and financial sector reforms have boosted per capita income growth in all segments of the Fund’s membership, with domestic financial sector liberalization, trade liberalization, and farm sector liberalization exerting particularly large effects.
• Financial sector reforms have raised growth through a number of channels, including a reduction in domestic credit constraints and larger inflows of foreign direct investment. Structural reforms have exerted (statistically and economically) meaningful effects on allocative efficiency, as firms across different sectors react to the shifts in comparative advantage brought about by deregulation. The growth effects of financial and real sector reforms also reflect a more favorable assessment of the future profitability and solvency of domestic firms as embodied in their credit ratings.
• Growth effects differ significantly across alternative reform sequencing strategies. A trade-before-capital-account strategy achieves better outcomes than the reverse sequence, or even than a “big bang” where reforms are pursued together. Liberalizing the domestic financial sector together with the external capital account is also growth-enhancing provided the economy is relatively open to international trade. While the data do not speak loudly on the relative growth benefits of pursuing domestic financial reform versus external capital account liberalization early in the reform process, the stability benefits of early domestic financial sector liberalization dominate those of early capital account liberalization.
• The stability benefits flowing from domestic financial sector reform are also evident in the way in which economies respond to real and financial shocks, with relatively liberalized domestic financial sectors reducing the output costs from adverse terms-of-trade and interest-rate shocks. A variety of mechanisms—especially improvements in credit availability—play a key role in enhancing the economy’s resilience to shocks.

4
I. INTRODUCTION
1. The economic policy agenda in both developed and developing countries—even as it has been dominated for much of the past year by the response to the global financial crisis—will, going forward, increasingly need to refocus on issues related to strengthening medium-term economic performance, including economic growth and resilience. The Fund has a key role to play, through its surveillance activities, in advising country authorities on these issues, including leveraging the lessons from cross-country experience for policy formulation at the national level, and drawing implications about the kind of policies that lead to more favorable “real-financial” linkages in response to country and global shocks. The Fund’s role is tied to its responsibilities under Article IV of the Articles of Agreement to ensure that members’ economic policies foster sound medium-term economic growth and stability. 2. The stability-cum-growth objective, while very broad, is linked to policies geared to: strengthening market incentives and raising economic efficiency; boosting the sustainable rate of potential growth; and enhancing the economy’s ability to absorb shocks. This, of course, is the traditional purview of structural policies, that is, policies that increase the role of market forces and competition in the economy, including by fostering both domestic and international trade and financial flows, while maintaining appropriate regulatory frameworks in the case of market failures or identified externalities. While progress has been made in understanding the role of such policies, empirical evidence based on a consistent global dataset is lacking, with previous studies focused mainly either on the experience of industrial countries or of the transition economies. The paucity of comparable data on indicators of structural reform across the full gamut of different income groups and regions has undoubtedly been a factor behind the lack of global reach of past empirical studies.
3. This paper examines the effects of structural reforms on two aspects of economic performance—medium-run growth and macroeconomic stability/resilience—from a global standpoint, and in so doing improves the analytical basis of Fund policy advice by drawing on the lessons from broad cross-country experience. Underpinning the results is a significant data collection effort, involving the compilation of indicators of structural reform for a large sample of 91 developing and developed countries over the past three decades. Not only is the resulting dataset unique in its country and time coverage, it also is much broader in terms of the sectoral coverage of reforms—including indicators of liberalization in domestic product markets; international trade; several indicators of liberalization of the domestic financial sector; and measures of the external capital account liberalization. The dataset’s breadth along the sectoral dimension is essential to address issues of reform sequencing, an area that has generated much thought from a theoretical standpoint, but where systematic cross-country evidence—as opposed to smaller-scale case studies—is sorely lacking.

5
4. The analysis in the paper yields a number of significant results:
• There has been a broad tendency to pursue structural reforms across all segments of the Fund’s membership over the past three decades. Low- and middle-income countries have on average reached the degree of liberalization achieved by the industrial countries in the early 1990s in the areas of product market and domestic financial sector liberalization, with larger, but shrinking, reform gaps in trade and external capital account liberalization.
• Reforms across the Fund’s membership appear to have been driven by a number of factors, including the quality of broad political institutions in advanced economies early in the sample, and a significant catch-up effect spurring reform in developing countries subsequently, as sizeable cross-country reform gaps—with respect either to reform “leaders” or reformist “neighbors”—emerged. There is also evidence that IMF-supported programs and, for some sectors, economic crises, have helped to catalyze structural reforms.
• Real and financial sector reforms have exerted an economically significant impact on per capita income growth in all segments of the Fund’s membership, with domestic financial sector liberalization, trade liberalization, and liberalization of the agricultural sector exerting particularly favorable effects. A number of channels are in evidence, including a reduction in credit constraints to, and borrowing costs for, capital accumulation, and larger inflows of foreign direct investment (FDI) that seem to result from external capital account liberalization. There is also evidence that structural reforms help to raise allocative efficiency, as firms across different sectors react to the shifts in comparative advantage brought about by deregulation. Firms that are highly dependent on imported intermediate inputs in production, for example, see large growth benefits from trade liberalization, while firms with a high dependence on external finance for their investments see particular growth benefits from financial sector liberalization. The impact of financial and real sector reform on economic growth also seems to reflect a more favorable assessment of the future profitability and solvency of domestic firms as embodied in their credit ratings.
• Growth effects differ significantly across alternative structural reform sequencing strategies. There is strong evidence supporting the view that economies that liberalize trade before the external capital account grow more rapidly than those that follow the reverse sequence. There is also evidence that a parallel pursuit of both domestic financial sector reform and external capital account liberalization—provided that the trade regime is relatively open—is a growth-friendly reform strategy. While the data do not speak loudly on the relative growth benefits of pursuing domestic financial sector reform versus external capital account liberalization early in the reform process, the stability benefits—both in terms of macroeconomic volatility and crisis
6
propensity—are found to be more favorable when the domestic financial sector is liberalized ahead of the external capital account.
• The stability benefits flowing from domestic financial sector reform are also evident in the way in which economies respond to various real and financial shocks, with resilience—the bounce-back of the economy following a shock—enhanced in economies with relatively liberalized domestic financial sectors. Financial reforms tend to reduce the output costs from adverse terms of trade and foreign interest rate shocks, with a variety of mechanisms—especially improvements in credit availability—playing a key role. The greater resilience to real shocks in economies with more liberalized financial sectors is evidence of how such reforms can strengthen economy-wide real-financial linkages.
5. The remainder of the paper is organized as follows. Section II presents the main features of the dataset and key trends in structural reform over the past three decades. Section III examines a range of factors that may serve to spur, or retard, the process of structural reform. The subsequent sections present empirical evidence on the impact of reforms, including their effects on economic growth (Section IV), related sequencing issues (Section V), and macroeconomic volatility and resilience (Section VI). Section VII concludes.
II. STRUCTURAL REFORMS: MEASUREMENT AND TRENDS
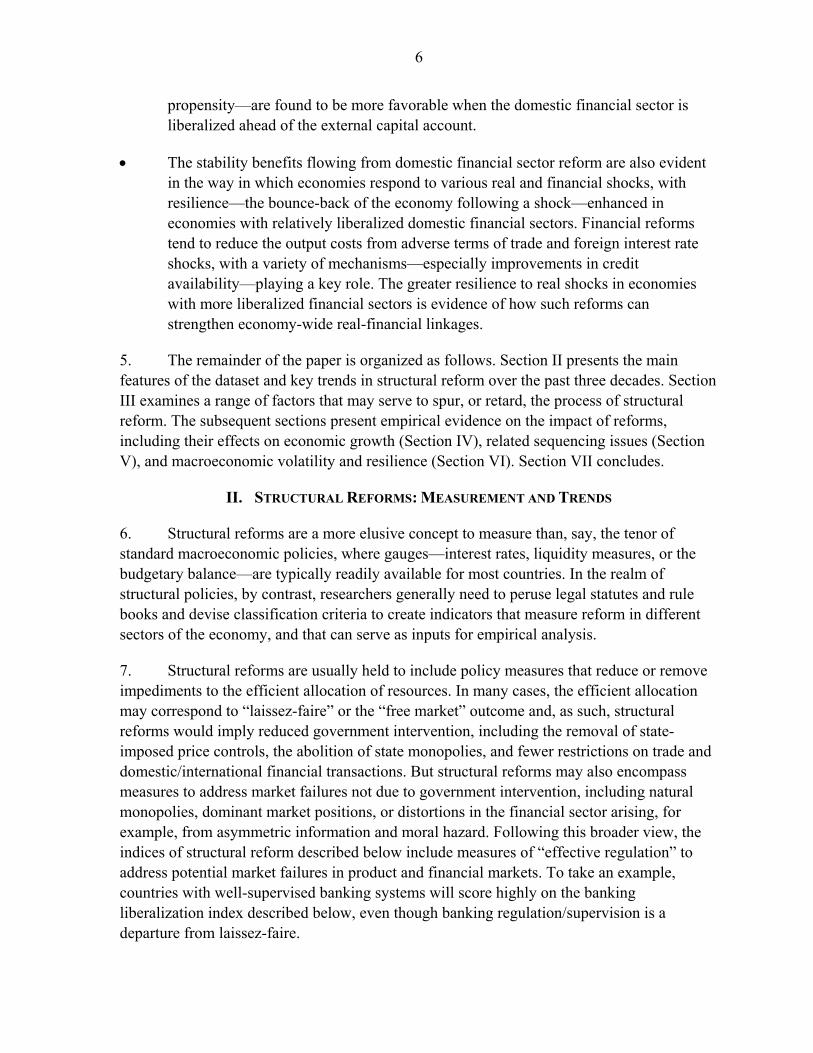
6. Structural reforms are a more elusive concept to measure than, say, the tenor of standard macroeconomic policies, where gauges—interest rates, liquidity measures, or the budgetary balance—are typically readily available for most countries. In the realm of structural policies, by contrast, researchers generally need to peruse legal statutes and rule books and devise classification criteria to create indicators that measure reform in different sectors of the economy, and that can serve as inputs for empirical analysis.
7. Structural reforms are usually held to include policy measures that reduce or remove impediments to the efficient allocation of resources. In many cases, the efficient allocation may correspond to “laissez-faire” or the “free market” outcome and, as such, structural reforms would imply reduced government intervention, including the removal of state-imposed price controls, the abolition of state monopolies, and fewer restrictions on trade and domestic/international financial transactions. But structural reforms may also encompass measures to address market failures not due to government intervention, including natural monopolies, dominant market positions, or distortions in the financial sector arising, for example, from asymmetric information and moral hazard. Following this broader view, the indices of structural reform described below include measures of “effective regulation” to address potential market failures in product and financial markets. To take an example, countries with well-supervised banking systems will score highly on the banking liberalization index described below, even though banking regulation/supervision is a departure from laissez-faire.

7
A. Measuring Structural Reforms
8. This paper draws on an extensive dataset, compiled by the Research Department, that brings together information on a variety of structural reforms in different sectors over roughly the past thirty years, and which covers a cross-section of both industrial and developing countries. The new dataset thus has significant advantages over existing data sources which cover a narrower set of reforms and countries, and is likely to be useful not only for the analysis carried out below, but also more broadly for Fund surveillance activities (see Box and Appendix Tables 1 and 2 for further details).
9. Reform indicators cover both the realm of the “financial sector” and the “real sector,” though, as will be evident in subsequent sections, financial sector reforms have important effects on real sector outcomes, and vice-versa, given the significance of macro-financial linkages inherent in economic performance. Financial sector reform indicators include reforms pertaining to domestic financial markets, including banking and securities markets, as well as the external capital account, while real sector structural reform indicators include measures of product market and trade reforms.1
10. All indicators are scaled to vary between zero and unity, with higher values representing greater liberalization. Differences in the values of each index across countries and over time provide information on the variation in the absolute degree of economic reform within each sector. However, indices are not strictly comparable across sectors, so a higher value of, say, the trade reform index than the banking reform index does not imply that an economy is “more liberal” with respect to international trade than domestic finance.
11. Turning first to financial reforms, the domestic financial sector liberalization indicator includes measures of securities markets and banking sector reform. The securities markets subindex assesses the quality of the market framework, including the existence of an independent regulator and the extent of legal restrictions on the development of domestic bond and equity markets. The banking subindex captures reductions or removal of interest rate controls (floors or ceilings), credit controls (directed credit and subsidized lending), competition restrictions (limits on branches and entry barriers in the banking market, including licensing requirements or limits on foreign banks), and public ownership of banks. As foreshadowed above, the banking index also captures a measure of the quality of banking supervision and regulation, including the power and independence of bank supervisors, the adoption of Basel capital standards, and the presence of a framework for bank inspections.
12. Regarding the extent of external capital account liberalization, the data collected cover a broad set of restrictions including, for example, controls on external borrowing
1 Data on labor market and fiscal reforms is being gathered, but cross-country coverage, especially for emerging market and developing countries, remains insufficient for inclusion in the analysis.

8
Box: Structural Reform Dataset
The main features of the dataset used in this paper are described below, with further technical details provided in Appendix Tables 1 and 2.
Domestic financial sector reforms. This indicator extends the country and time coverage of the domestic financial sector components in Abiad and Mody (2005) and also adds a component on credit controls: see Abiad, Detragiache, and Tressel (2008). The index thus covers six broad areas: interest rate controls; entry barriers; privatization; supervision and regulation; securities markets; and credit controls. Other relevant work includes Williamson, and Mahar (1998), who record financial reforms in 34 countries over 1973–96 along the same dimensions as Abiad and Mody (2005); Bekaert, Harvey and Lundblad (2005), who date equity market liberalizations in 95 countries during 1980–95; and the EBRD’s dataset of transition indicators for 29 non-industrialized countries over 1989-2007 (published annually in the EBRD’s Transition Report), which includes variables that measure banking and securities market reform gaps with industrialized market economies .
Capital account reforms. The data collected cover controls on external borrowing and lending as well as other restrictions on financial transactions between residents and non-residents, including approval requirements for foreign direct investment (FDI). The sources are Abiad and others (2008) and Quinn (1997), extended to include additional countries and years. Other relevant work includes Schindler (2008), who constructs a disaggregated capital controls index for 91 countries over 1995–2005 and also reviews other related indices.
Product market reforms. The product market reform index covers the agricultural sector and the telecommunications and electricity sectors, and comprises simplified versions of existing indices produced by the OECD, extended to include non-OECD countries. Relevant data by the OECD include an index of regulatory reform in the telecommunications, electricity, gas, post, rail, air passenger transport, and road freight sectors (Conway and Nicoletti, 2006), and the OECD’s Producer and Consumer Support Estimates of agricultural policies during 1986–2006 (published as a complement to the OECD report Agricultural Policies in OECD Countries : Monitoring and Evaluation 2007). Other relevant work includes the World Bank Doing Business database (http://www.doingbusiness.org/), which provides measures of business regulations for a large number of countries during 2004–07; and the EBRD’s transition indicators database, containing variables pertaining to telecommunications and electricity liberalization in transition countries.
Trade reforms. There are two indices: the first is an extension of the database on average tariff rates in IMF (2004) to include non-OECD countries and a broader time coverage; the second is based on Quinn (1997), and captures the degree to which proceeds from international trade in goods and services are free from restrictions as defined under Article VIII, extended to include additional countries and years. Other relevant work includes Sachs and Warner (1995), who provide a binary measure of trade liberalization based on a mix of regulatory and outcomes-based information; and the EBRD’s transition indicators database, which contains variables pertaining to liberalization of trade and the foreign exchange system in transition economies.

9
between residents and non-residents, as well as approval requirements for foreign direct investment (FDI).
13. Turning to structural reforms in the real sector, the first indicator measures reductions in public intervention in the agricultural sector, including removal of export marketing boards and reductions in the incidence of administered prices. The second indicator covers the degree of liberalization in the telecommunications and electricity markets, including the extent of competition in the provision of these services and the presence of an independent regulator. The third index captures liberalization of international trade along two dimensions: tariff liberalization, which measures average tariff rates; and a broader indicator of current account liberalization, which captures surrender requirements for export proceeds, and other items under Article VIII of the Articles of Agreement.
B. Trends in Structural Reform Since the 1970s
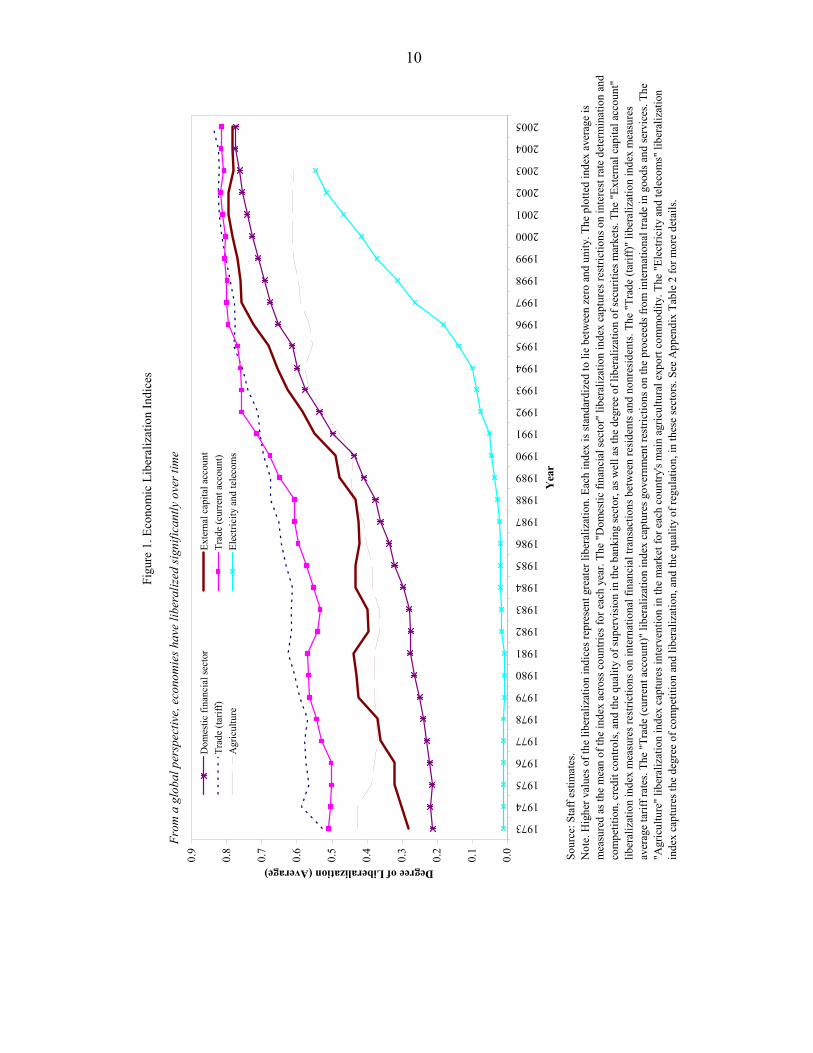
14. Figures 1 and 2 portray the broad global trend toward greater structural reform and liberalization over the past three decades across different segments of the Fund’s membership. Some key points follow from the figures:
• Domestic financial sector reforms and the opening of the capital account accelerated sharply in the early 1990s, reflecting inter alia the expansion of the European Union (which involved harmonization of financial legislation and regulation across member countries), the accession of a number of emerging market countries to the OECD, and the economic transition of Central and Eastern Europe.
• Both measures of trade liberalization follow a gradual upward trend with a noticeable pickup since the late 1980s, reflecting the pursuit by developing countries of greater trade liberalization in the aftermath of the debt crisis, and more generally the demise of import substitution policies pursued earlier. The global context of several rounds of multilateral and regional trade negotiations also contributed.
• Liberalization of the agricultural sector gathered speed during the 1990s, with the adoption of more market-friendly policies in the developing world. This partly reflected an emphasis on such policies in World Bank structural adjustment lending, as well as falling agricultural prices which made marketing boards less sustainable.
• In the telecommunications and electricity sectors, deregulation began in earnest in the second half of the 1990s, reflecting to a large degree innovations in communications technology—such as cellular phones and the diffusion of the internet—which exposed public telecommunications monopolies to competition.
10
Figu
re 1
. Eco
nom
ic L
iber
aliz
atio
n In
dice
s
0.0
0.1
0.2
0.3
0.4
0.5
0.6
0.7
0.8
0.9
1973
1974
1975
1976
1977
1978
1979
1980
1981
1982
1983
1984
1985
1986
1987
1988
1989
1990
1991
1992
1993
1994
1995
1996
1997
1998
1999
2000
2001
2002
2003
2004
2005
Yea
r
Degree of Liberalization (Average)
Dom
estic
fina
ncia
l sec
tor
Exte
rnal
cap
ital a
ccou
ntTr
ade
(tarif
f)Tr
ade
(cur
rent
acc
ount
)A
gric
ultu
reEl
ectri
city
and
tele
com
s
From
a g
loba
l per
spec
tive,
eco
nom
ies h
ave
liber
aliz
ed si
gnifi
cant
ly o
ver t
ime
Sour
ce: S
taff
estim
ates
.N
ote.
Hig
her v
alue
s of t
he li
bera
lizat
ion
indi
ces r
epre
sent
gre
ater
libe
raliz
atio
n. E
ach
inde
x is
stan
dard
ized
to li
e be
twee
n ze
ro a
nd u
nity
. The
plo
tted
inde
x av
erag
e is
m
easu
red
as th
e m
ean
of th
e in
dex
acro
ss c
ount
ries f
or e
ach
year
. The
"Dom
estic
fina
ncia
l sec
tor"
libe
raliz
atio
n in
dex
capt
ures
rest
rictio
ns o
n in
tere
st ra
te d
eter
min
atio
n an
dco
mpe
titio
n, c
redi
t con
trols
, and
the
qual
ity o
f sup
ervi
sion
in th
e ba
nkin
g se
ctor
, as w
ell a
s the
deg
ree
of li
bera
lizat
ion
of se
curit
ies m
arke
ts. T
he "E
xter
nal c
apita
l acc
ount
" lib
eral
izat
ion
inde
x m
easu
res r
estri
ctio
ns o
n in
tern
atio
nal f
inan
cial
tran
sact
ions
bet
wee
n re
side
nts a
nd n
onre
side
nts.
The
"Tra
de (t
ariff
)" li
bera
lizat
ion
inde
x m
easu
res
aver
age
tarif
f rat
es. T
he "T
rade
(cur
rent
acc
ount
)" li
bera
lizat
ion
inde
x ca
ptur
es g
over
nmen
t res
trict
ions
on
the
proc
eeds
from
inte
rnat
iona
l tra
de in
goo
ds a
nd se
rvic
es. T
he
"Agr
icul
ture
" lib
eral
izat
ion
inde
x ca
ptur
es in
terv
entio
n in
the
mar
ket f
or e
ach
coun
try's
mai
n ag
ricul
tura
l exp
ort c
omm
odity
. The
"Ele
ctric
ity a
nd te
leco
ms"
libe
raliz
atio
n in
dex
capt
ures
the
degr
ee o
f com
petit
ion
and
liber
aliz
atio
n, a
nd th
e qu
ality
of r
egul
atio
n, in
thes
e se
ctor
s. Se
e A
ppen
dix
Tabl
e 2
for m
ore
deta
ils.

11
Figure 2. Economic Liberalization Indices by Income Group
Source: Staff estimates.Note: Each index is standardized to lie between zero and unity. Higher values of the liberalization indices represent greater liberalization. This figure shows the evolution of liberalization indices over time. See Appendix Table 2 for more details.
Trade (tariff)
0.0
0.1
0.2
0.3
0.4
0.5
0.60.7
0.80.9
1.0
1973
1976
1979
1982
1985
1988
1991
1994
1997
2000
2003
Year
Deg
ree
of L
iber
aliz
atio
n
Trade liberalization, as measured by either tariff levels...
Trade (current account)
0.00.10.20.30.40.50.60.70.80.91.0
1973
1976
1979
1982
1985
1988
1991
1994
1997
2000
2003
Year
Deg
ree
of L
iber
aliz
atio
n
...or current account restrictions, has increased steadily among low- and middle-income countries.
Telecoms and electricity
0.0
0.1
0.2
0.3
0.4
0.5
0.6
0.7
0.8
0.9
1.0
1973
1976
1979
1982
1985
1988
1991
1994
1997
2000
2003
Year
Deg
ree
of L
iber
aliz
atio
n
Liberalization of telecoms and electricity started in the 1990s for most income groups.
Agriculture
0.0
0.1
0.2
0.3
0.4
0.5
0.6
0.7
0.8
0.9
1.0
1973
1976
1979
1982
1985
1988
1991
1994
1997
2000
2003
Year
Deg
ree
of L
iber
aliz
atio
n
Agricultural liberalization is converging rapidly across income groups.
External capital account
0.0
0.1
0.2
0.3
0.4
0.5
0.6
0.7
0.8
0.9
1.0
1973
1976
1979
1982
1985
1988
1991
1994
1997
2000
2003
Year
Deg
ree
of L
iber
aliz
atio
n
Still, there remains significant variation in external capital account liberalization across income groups.
Domestic financial sector
0.0
0.1
0.2
0.3
0.4
0.5
0.6
0.7
0.8
0.9
1.019
73
1976
1979
1982
1985
1988
1991
1994
1997
2000
2003
Year
Deg
ree
of L
iber
aliz
atio
nIn low- and middle-income countries, the domestic financial sector is now as liberalized as it was in high-income countries in the early 1990s.
High-income countries Middle-income countries Low-income countries

12
• Regarding trends in structural reform across different income groups, advanced economies began implementing reforms relatively early, and these “first movers” have also progressed the farthest with structural reform. This being said, emerging-market and developing countries are catching up with advanced economies in the level of liberalization achieved, with a substantial narrowing of the reform gap in evidence for all sectors since the mid-1980s. To take an example, the average level of domestic financial sector reform in low- and middle-income countries is now comparable to that of high-income countries in the early 1990s.
III. DETERMINANTS OF STRUCTURAL REFORMS
15. The political-economy literature has tended to emphasize that special interests, motivated by a desire to protect rents, may act to block the introduction of reforms that are beneficial for society at large. Previous work, including for example IMF (2004) and Høj and others (2006), has highlighted a number of factors that can affect the balance of power between pro- and anti-reform groups. Such factors include: the quality of broad political institutions, which may favor an early adoption of reforms; international factors, including the size of “reform gaps” vis-à-vis either countries at the “frontier” of the reform process or geographical neighbors that may spur reform through “peer pressure” channels; the presence of an IMF-supported program, which may serve to underpin the reform process; and the occurrence of economic crisis, which is often argued to be a catalyst of reform. This section presents evidence on the role of these factors in both developed and developing countries.
Institutional quality
16. Institutions define the broad rules of the game within which economic agents influence the outcome of the reform process. How does the quality of broad political institutions affect progress with implementing structural reforms? Figure 3 sheds light on the issue by portraying the relationship between the timing of major reforms and the level of the institutional quality index. It shows that, on average for most sectors, countries with stronger institutions (proxied by the strength of property rights and the rule of law as measured by Kaufman and others, 2002) have introduced major reforms earlier, i.e., there is a negative relationship between the year of major liberalizations and institutional quality. The results appear to be strongest for trade liberalization (as measured by the tariff-based indicator), and for the domestic financial sector and external capital account liberalization indicators.
17. As foreshadowed earlier, a range of other factors may also play a role in determining the pace of structural reform. A regression framework is useful to disentangle the various

13
Figure 3. Institutional Quality and Timing of Major Reforms
Source: Staff estimates based on Kaufmann, Kraay, and Zoido-Lobaton (2002).Notes. The year of liberalization portrayed on the x-axis is the year of major reform—as measured by a one standard deviation or higher increase in the liberalization index over the preceding three years. The y-axis measures institutional quality, which is taken from Kaufmann, Kraay, and Zoido-Lobaton (2002), and captures the protection afforded to property rights as well as the strength of the rule of law, circa mid-1990s. This figure shows that major reforms occur earlier in countries where the quality of broad political institutions is higher, i.e., the relationship between institutional quality and the year of liberalization is negative.
-2
-1
0
1
219
73
1978
1983
1988
1993
1998
2003
Year of Liberalization
Inst
itutio
nal Q
ualit
yExternal Capital Account Liberalization
-2
-1
0
1
2
1973
1978
1983
1988
1993
1998
2003
Year of Liberalization
Inst
itutio
nal Q
ualit
y
Trade Liberalization (tariff)
-2
-1
0
1
2
1973
1978
1983
1988
1993
1998
2003
Year of Liberalization
Inst
itutio
nal Q
ualit
y
Trade Liberalization (current account)
-2
-1
0
1
2
1973
1978
1983
1988
1993
1998
2003
Year of Liberalization
Inst
itutio
nal Q
ualit
y
Agriculture Liberalization
-2
-1
0
1
2
1973
1978
1983
1988
1993
1998
2003
Year of Liberalization
Inst
itutio
nal Q
ualit
y
Telecoms and Electricity Liberalization
-2
-1
0
1
2
1973
1978
1983
1988
1993
1998
2003
Year of Liberalization
Inst
itutio
nal Q
ualit
y
Stronger broad institutions encourage earlier liberalizationDomestic Financial Sector Liberalization

14
effects, recognizing of course that a number of possible determinants—including, for example, the level of per capita income or educational attainment—are, like the quality of broad institutions, highly persistent, and therefore likely to be captured by the “fixed” or country-effects in the regression framework.2
International factors
18. Table 1 considers first the effect of the “reform gap,” defined as the (lagged) difference between the level of liberalization in a particular country and the reform level achieved in a country near the reform “frontier” (proxied here by the United States). The results suggest that a larger reform gap is associated with faster reforms in all sectors, as indicated by the positive and statistically significant coefficient in the first line of Table 1. Beyond liberalization gaps with respect to reform leaders, the proximity of reformist neighbors may also provide a stimulus for liberalization. Table 1 indicates that such “neighborhood effects” operate unevenly across sectors, with statistically significant effects in evidence only in the cases of the domestic financial sector and the telecommunications and electricity sectors (second line of the Table).
IMF-supported programs
19. Previous studies (e.g., Ghosh and others, 2005) have suggested that structural conditionality in IMF-supported programs may play a role in spurring structural reform. The regression framework in Table 1 investigates this issue by including an indicator variable for the presence of an IMF-supported program. The results suggest that programs do seem to play a catalytic role in accelerating reforms across most of the sectors. The finding that IMF-supported programs accelerate the pace of liberalization of the external capital account, however, should be interpreted alongside the evidence presented in IEO (2005), which stresses the role of domestic ownership of capital account liberalization policies rather than IMF conditionality per se in the pursuit of such policies.
Economic crises
20. While there is considerable anecdotal evidence to suggest a catalytic role of economic/financial crises in driving the reform process, whether this constitutes an empirical regularity is an issue that needs to be decided by recourse to the data. What, then, is the evidence on the role of economic crises in the reform process? The results in Table 1 indicate
2 In practice, given the inclusion of fixed effects, the results in Table 1 focus on variables with a sufficient variability over time. The model without fixed effects (not reported) shows a statistically significant impact on the pace of structural reform of a number of the persistent factors mentioned in the text, including a positive effect of institutional quality on trade, domestic financial sector, and external capital account reforms, consistent with the evidence in Figure 3.

Dep
ende
nt v
aria
ble:
(1)
(2)
(3)
(4)
(5)
(6)
Cha
nge
in li
bera
lizat
ion
inde
x (t)
Dom
estic
fina
ncia
lEx
tern
al c
apita
l Tr
ade
liber
aliz
atio
nTr
ade
liber
aliz
atio
nAg
ricul
ture
Tele
com
s an
dse
ctor
libe
raliz
atio
nac
coun
t lib
eral
izat
ion
(tarif
f)(c
urre
nt a
ccou
nt)
liber
aliz
atio
nel
ectri
city
libe
raliz
atio
n
Inte
rnat
iona
l fac
tors
Ref
orm
gap
(t-1
)0.
041*
**0.
155*
**0.
195*
**0.
074*
**0.
105*
**0.
055*
**(0
.010
)(0
.014
)(0
.016
)(0
.012
)(0
.013
)(0
.016
)
Ref
orm
in n
eigh
bors
(t-1
)0.
179*
**0.
143
0.10
80.
114
0.06
30.
327*
**(0
.061
)(0
.094
)(0
.067
)(0
.092
)(0
.059
)(0
.074
)
IMF-
supp
orte
d pr
ogra
m (t
-1)
0.04
9***
0.09
1**
0.09
2*0.
060*
0.00
20.
082*
**(0
.015
)(0
.039
)(0
.052
)(0
.031
)(0
.03)
(0.0
27)
Econ
omic
cris
is (t
-1)
0.02
4***
-0.0
2-0
.022
***
0.00
40.
008
-0.0
05(0
.005
)(0
.013
)(0
.007
)(0
.009
)(0
.009
)(0
.007
)
Obs
erva
tions
1565
1565
2100
1130
1676
1678
Num
ber o
f cou
ntrie
s64
6410
238
7576
Sour
ces :
Sta
ff es
timat
es b
ased
on
Inte
rnat
iona
l Fin
anci
al S
tatis
tics.
Tabl
e 1.
Det
erm
inan
ts o
f Ref
orm
s
Not
es: T
he ta
ble
show
s re
gres
sion
s of
the
annu
al c
hang
e in
eac
h lib
eral
izat
ion
inde
x on
a n
umbe
r of c
ovar
iate
s. T
hese
incl
ude
inte
rnat
iona
l fac
tors
(a m
easu
re o
f ref
orm
gap
s vi
s-à-
vis
the
Uni
ted
Stat
es a
nd a
mea
sure
of t
he le
vel o
f lib
eral
izat
ion
in n
eigh
borin
g co
untri
es w
here
the
neig
hbor
hood
is b
ased
on
geog
raph
ical
dis
tanc
e);
the
pres
ence
of a
n IM
F-su
ppor
ted
prog
ram
; and
a m
easu
re
of e
cono
mic
cris
is d
efin
ed a
s ep
isod
es o
f hig
h in
flatio
n. T
he m
easu
re o
f ref
orm
gap
s is
def
ined
as
the
diffe
renc
e be
twee
n th
e re
form
leve
l ach
ieve
d in
a c
ount
ry n
ear t
he re
form
"fro
ntie
r" (p
roxi
ed b
y th
e U
nite
d St
ates
) and
the
leve
l of l
iber
aliz
atio
n in
a p
artic
ular
cou
ntry
. The
mea
sure
of r
efor
m in
nei
ghbo
rs is
cal
cula
ted
for e
ach
coun
try a
s th
e w
eigh
ted
aver
age
of a
ll ot
her c
ount
ries'
libe
raliz
atio
n in
dice
s, w
ith th
e w
eigh
ts p
ropo
rtion
al to
the
inve
rse
of th
eir d
ista
nce
to th
e co
untry
und
er c
onsi
dera
tion.
The
var
iabl
e "IM
F-su
ppor
ted
prog
ram
" tak
es a
val
ue o
f uni
ty in
cou
ntry
-yea
rs w
hen
such
a
prog
ram
is in
pla
ce. T
he v
aria
ble
"Eco
nom
ic c
risis
" is
an in
dica
tor v
aria
ble
that
take
s a
valu
e of
uni
ty in
cou
ntry
-yea
rs w
hen
infla
tion
is a
bove
40
perc
ent;
the
resu
lts a
re ro
bust
to a
ltern
ativ
e m
easu
res
of c
risis
use
d in
the
liter
atur
e, in
clud
ing
shar
p dr
ops
in o
utpu
t, la
rge
term
s-of
-trad
e sh
ocks
, and
siz
eabl
e re
al d
eval
uatio
ns.
Rob
ust s
tand
ard
erro
rs a
re p
rovi
ded
in p
aren
thes
es. *
**, *
* and
* d
enot
e st
atis
tical
sig
nific
ance
at t
he 1
, 5 a
nd 1
0 pe
rcen
t lev
el, r
espe
ctiv
ely.
Rob
ustn
ess :
To
addr
ess
poss
ible
end
ogen
eity
, the
indi
cato
r var
iabl
e fo
r an
IMF-
supp
orte
d pr
ogra
m is
inst
rum
ente
d us
ing
a m
easu
re o
f pol
itica
l pro
xim
ity to
, and
trad
e in
tens
ity w
ith, t
he U
nite
d St
ates
and
Eur
ope,
as
in B
arro
and
Lee
, 200
5. A
ll sp
ecifi
catio
ns a
re e
stim
ated
by
pane
l ins
trum
enta
l var
iabl
e re
gres
sion
s w
ith c
ount
ry fi
xed
effe
cts,
usi
ng a
nnua
l dat
a ov
er 1
973-
2004
. The
cou
ntry
fix
ed e
ffect
s ca
ptur
e th
e im
pact
on
the
refo
rm p
roce
ss o
f all
time-
inva
riant
cou
ntry
-spe
cific
fact
ors,
incl
udin
g pe
rsis
tent
diff
eren
ces
in in
com
e pe
r cap
ita a
cros
s co
untri
es. T
he re
sults
are
robu
st to
us
ing
five-
year
cha
nges
in e
ach
liber
aliz
atio
n in
dex
as th
e de
pend
ent v
aria
ble
(inst
ead
of th
e an
nual
cha
nges
repo
rted
in th
e ta
ble)
. The
est
imat
es a
re b
road
ly s
imila
r whe
n ad
ditio
nal i
nter
natio
nal
fact
ors
are
incl
uded
. For
exa
mpl
e, a
ddin
g in
dica
tor v
aria
bles
for W
TO a
nd O
ECD
mem
bers
hips
—w
hich
affe
ct p
ositi
vely
trad
e an
d fin
anci
al s
ecto
r ref
orm
s—le
aves
key
resu
lts u
ncha
nged
.
15

16
that the effect of crises on the pace of reform is mixed, with the data suggesting that crises play little systematic role in a preponderance of the sectors. Crises do appear to spur domestic financial sector reform, but actually seem to delay opening to international trade—possibly reflecting the need to secure additional sources of fiscal revenue in crises periods, including by recourse to higher tariffs.
21. Overall, the results in Table 1 and Figure 3 suggest that, while institutional quality served to underpin structural reforms among the industrial countries in the early years of the sample, the emergence of sizeable cross-country reform gaps contributed to an acceleration of reform among the developing countries in the sample, especially since the early 1990s. Peer pressure effects associated with neighboring reformers supported the reform process in some areas, including domestic financial sector liberalization. Among the other factors driving reform, the presence of an IMF-supported program appears to have played a role in accelerating reforms in a number of sectors, while the occurrence of crises has tended to spur domestic financial sector reform while retarding trade reform.
IV. STRUCTURAL REFORMS AND ECONOMIC GROWTH
22. There is a broad consensus in the literature that structural reforms, and in particular measures aimed at promoting domestic financial development and trade liberalization, can be important components of a strategy to invigorate economic growth.3 Structural reforms may serve to boost aggregate income by promoting both faster capital accumulation and a more efficient allocation of resources. These benefits are typically spread over time, but forward-looking financial markets may anticipate the future benefits of reform, which would then be reflected in such forward-looking variables as credit ratings and borrowing costs.
23. While existing empirical studies generally support this line of reasoning, in a number of respects they fall short of providing a firm basis for policy. First, a global perspective based on a consistent data source spanning different segments of the Fund’s membership has thus far been lacking. Second, existing studies have not tackled empirically key issues related to the interactions among reforms and sequencing, which have a critical bearing on growth. Third, previous studies have paid insufficient attention to the channels through which reforms affect growth. Evidence on such channels is needed to underpin confidence in the robustness of the observed empirical linkages. The remainder of this section considers, in turn, the impact of financial- (subsection A) and real sector (subsection B) reforms on growth, focusing both on the aggregate effects and some key channels through which they may operate. The analysis focuses on the ceteris-paribus effects of one reform at a time, with sequencing issues taken up in Section V.
3 McKinnon (1973), Krueger (1997), and Henry (2007) are among the seminal studies supporting this view. The literature is not, of course, all to one side on the role of reforms in the growth process: see, for example, Easterly (2005) and Rodrik (2006) for an alternative viewpoint.
17
A. Financial Sector Reforms
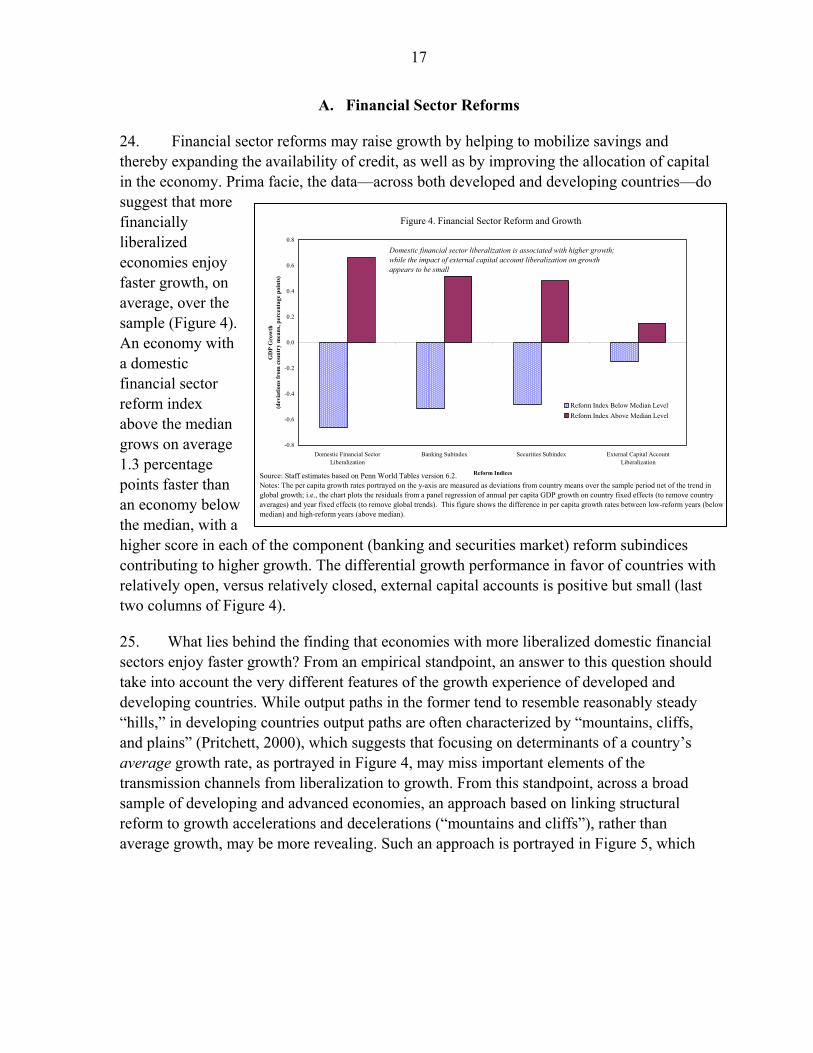
24. Financial sector reforms may raise growth by helping to mobilize savings and thereby expanding the availability of credit, as well as by improving the allocation of capital in the economy. Prima facie, the data—across both developed and developing countries—do suggest that more financially liberalized economies enjoy faster growth, on average, over the sample (Figure 4). An economy with a domestic financial sector reform index above the median grows on average 1.3 percentage points faster than an economy below the median, with a higher score in each of the component (banking and securities market) reform subindices contributing to higher growth. The differential growth performance in favor of countries with relatively open, versus relatively closed, external capital accounts is positive but small (last two columns of Figure 4).
Figure 4. Financial Sector Reform and Growth
-0.8
-0.6
-0.4
-0.2
0.0
0.2
0.4
0.6
0.8
Domestic Financial SectorLiberalization
Banking Subindex Securities Subindex External Capital AccountLiberalization
Reform Indices
GD
P G
row
th(d
evia
tions
from
cou
ntry
mea
ns, p
erce
ntag
e po
ints
)
Reform Index Below Median LevelReform Index Above Median Level
Source: Staff estimates based on Penn World Tables version 6.2.Notes: The per capita growth rates portrayed on the y-axis are measured as deviations from country means over the sample period net of the trend in global growth; i.e., the chart plots the residuals from a panel regression of annual per capita GDP growth on country fixed effects (to remove country averages) and year fixed effects (to remove global trends). This figure shows the difference in per capita growth rates between low-reform years (below median) and high-reform years (above median).
Domestic financial sector liberalization is associated with higher growth; while the impact of external capital account liberalization on growth appears to be small
25. What lies behind the finding that economies with more liberalized domestic financial sectors enjoy faster growth? From an empirical standpoint, an answer to this question should take into account the very different features of the growth experience of developed and developing countries. While output paths in the former tend to resemble reasonably steady “hills,” in developing countries output paths are often characterized by “mountains, cliffs, and plains” (Pritchett, 2000), which suggests that focusing on determinants of a country’s average growth rate, as portrayed in Figure 4, may miss important elements of the transmission channels from liberalization to growth. From this standpoint, across a broad sample of developing and advanced economies, an approach based on linking structural reform to growth accelerations and decelerations (“mountains and cliffs”), rather than average growth, may be more revealing. Such an approach is portrayed in Figure 5, which

18
Figure 5. Growth Breaks and Financial Sector Reforms
Source: Staff estimates based on Penn World Tables version 6.2.Notes: The figures plot average liberalization indices for the period beginning five years before a growth break (year 0 on the horizontal axis) and ending five years after the growth break. The plots capture the within-country evolution of the liberalization indices obtained from a panel regression of each index on country fixed effects (toremove country averages) and year fixed effects (to remove global trends). As a result, the zero value on the vertical axis corresponds to the sample average of the liberalization indices for the countries considered. The number of countries used to compute each average varies across indices in line with data availability.
External capital account liberalization
-0.02
-0.01
0.00
0.01
0.02
0.03
0.04
-5 -4 -3 -2 -1 0 1 2 3 4 5Years before and after growth breaks
Lib
eral
izat
ion
inde
x(d
evia
tions
from
cou
ntry
mea
ns)
-0.06
-0.03
0.00
0.03
0.06
0.09
0.12
Average liberalization index around upbreaks Average liberalization index around downbreaks
More liberalization
Lessliberalizationleft scale
Domestic financial sector liberalization
-0.06
-0.04
-0.02
0.00
0.02
0.04
-5 -4 -3 -2 -1 0 1 2 3 4 5
Years before and after growth breaks
Lib
eral
izat
ion
inde
x(d
evia
tions
from
cou
ntry
mea
ns)
Banking subindex
-0.06
-0.05
-0.04
-0.03
-0.02
-0.01
0.00
0.01
0.02
0.03
0.04
-5 -4 -3 -2 -1 0 1 2 3 4 5
Years before and after growth breaks
Lib
eral
izat
ion
inde
x(d
evia
tions
from
cou
ntry
mea
ns)
The pattern for domestic financial sector liberalization is in line with that of banking sector liberalization.
More liberalization
Less liberalization
Reform of the domestic financial sector begins before growth upbreaks and reform reversals seem to follow growth downbreaks.
Liberalization of the external capital account starts before upbreaks and is reversed after downbreaks.
More liberalization
Less liberalization
right scale

19
plots the behavior of financial reforms in the period leading up to, and following, growth upbreaks and downbreaks.4
26. Two patterns emerge from Figure 5. First, both domestic financial/banking sector liberalization, as well as external capital account liberalization, increase in the run-up to growth accelerations. Second, the data suggest that growth downbreaks are associated with a high initial degree of external capital account liberalization; this result, however, needs to be interpreted with caution because, as discussed in the next subsection, external capital account liberalization appears to be detrimental for growth only if such liberalization precedes the opening of the trade account. The data do not suggest a strong effect of trends in domestic financial sector liberalization ahead of growth downbreaks.
27. Econometric evidence presented in Table 2 corroborates the finding of a favorable impact of financial reforms on growth accelerations. Controlling for a set of standard growth determinants, including lagged income per capita, educational attainment, a terms of trade index, and a measure of political institutions (democracy), an increase in the (lagged value) of each of the four main financial sector reform indicators has a positive, and statistically significant, effect on growth.5 There are, however, important differences in the magnitude of the effects of each reform. Specifically, domestic financial sector reforms have a long-run impact on income per capita which is three to four times larger than that of external capital account liberalization. For example, an increase in the indices from the 25th to the 75th percentile of the distribution is associated with a rise in long-run per capita income of about 50 percent in the case of domestic financial sector reform compared to 15 percent for external capital account liberalization.6 While liberalizations of such a magnitude are large, they have occurred in the sample, including, for example, during New Zealand’s domestic financial sector reforms over 1983–86 and Chile’s external capital account liberalization over 1997–2000. Finally, the second panel in Table 2 investigates whether there are significant differences in the impact of financial sector reforms across income groups. While the general tenor of the full-sample results holds across different income groups, the impact of banking sector reform on growth is much larger for the developing country group, possibly reflecting the greater importance of bank intermediation at lower income levels.
4 See Berg, Ostry, and Zettelmeyer (2008) and Antoshin, Berg, and Souto (2008) for a discussion of the statistical procedures used to identify upbreaks and downbreaks.
5 The presence of a convergence term (lagged income per capita) in the regressions implies that a change in the level of reforms has a transitional effect on growth and a permanent effect on income. During the transition to the new post-reform steady state, growth rates will be higher than before, but will eventually return to their steady-state level (see, relatedly, Henry, 2007). This is in line with the graphical event study presented in Figure 5, which links reform to growth accelerations and decelerations. In practice, transitions across steady states last for many years, resulting in persistent increases in growth rates during the transition.
6 About two- thirds of these effects occur within a two-decade horizon of the policy shock, while the impact (one-year) effects are about 5 percent of the long-run impact.

Dep
ende
nt v
aria
ble:
(1)
(2)
(3)
(4)
logG
DP(
t) - l
ogG
DP(
t-1)
Dom
estic
fina
ncia
l se
ctor
libe
raliz
atio
nBa
nkin
g su
bind
exSe
curit
ies
subi
ndex
Exte
rnal
cap
ital a
ccou
nt
liber
aliz
atio
n
Entir
e sa
mpl
e:
Lib
eral
izat
ion
inde
x (t-
1)0.
060*
*0.
046*
**0.
035*
**0.
015*
**(0
.012
)(0
.011
)(0
.007
)(0
.005
)
L
ong-
run
inco
me
effe
ct: 2
5-75
per
cent
ile im
prov
emen
t 0.
507*
**0.
364*
**0.
354*
**0.
154*
**(0
.102
)(0
.088
)(0
.066
)(0
.057
)
Obs
erva
tions
2114
2114
2114
2114
Num
ber o
f cou
ntrie
s88
8888
88A
djus
ted
R-s
quar
ed0.
130.
130.
130.
12
Low
-Mid
dle
Inco
me
grou
p:
Lib
eral
izat
ion
inde
x (t-
1)0.
084*
**0.
066*
**0.
039*
**0.
018*
*(0
.019
)(0
.017
)(0
.039
)(0
.008
)
L
ong-
run
inco
me
effe
ct: 2
5-75
per
cent
ile im
prov
emen
t 0.
557*
**0.
394*
**0.
171*
**0.
160*
**(0
.130
)(0
.105
)(0
.046
)(0
.071
)
Obs
erva
tions
1398
1398
1398
1398
Num
ber o
f cou
ntrie
s68
6868
68A
djus
ted
R-s
quar
ed0.
130.
120.
120.
12
Tabl
e 2.
Gro
wth
Reg
ress
ion
Res
ults
: Fin
anci
al S
ecto
r Ref
orm
s
Sour
ces:
Sta
ff es
timat
es b
ased
on
Inte
rnat
iona
l Fin
anci
al S
tatis
tics,
Pen
n W
orld
Tab
les
vers
ion
6.2,
and
Wor
ld D
evel
opm
ent I
ndic
ator
s.N
otes
: The
tabl
e sh
ows
regr
essi
ons
of a
nnua
l gro
wth
in re
al G
DP
per c
apita
on
finan
cial
sec
tor l
iber
aliz
atio
n in
dica
tors
. The
regr
essi
ons
are
estim
ated
fo
r the
ent
ire c
ount
ry s
ampl
e an
d fo
r the
gro
up o
f low
er-m
iddl
e in
com
e co
untri
es (s
ee A
ppen
dix
Tabl
e 1)
. Eac
h re
gres
sion
incl
udes
as
cont
rols
the
lagg
ed le
vel o
f rea
l GD
P p
er c
apita
, an
indi
cato
r var
iabl
e fo
r dem
ocra
tic re
gim
es, t
he le
vel o
f ter
ms
of tr
ade,
and
the
leve
l of t
ertia
ry s
choo
l enr
ollm
ent.
The
long
-run
inco
me
effe
ct c
aptu
res
the
estim
ated
cha
nge
in th
e st
eady
-sta
te le
vel o
f GD
P pe
r cap
ita re
sulti
ng fr
om a
n im
prov
emen
t in
the
liber
aliz
atio
n in
dex
from
the
25th
to th
e 75
th p
erce
ntile
. All
spec
ifica
tions
wer
e es
timat
ed b
y pa
nel O
LS w
ith c
ount
ry- a
nd y
ear-
fixed
effe
cts,
usi
ng
annu
al d
ata
over
196
0-20
05. R
obus
t sta
ndar
d er
rors
are
in p
aren
thes
es. T
he s
tand
ard
erro
rs o
n th
e lo
ng-ru
n ef
fect
s ar
e ca
lcul
ated
with
the
delta
m
etho
d. **
*, **
, and
* d
enot
e st
atis
tical
sig
nific
ance
at 1
, 5, a
nd 1
0 pe
rcen
t lev
el, r
espe
ctiv
ely.
Rob
ustn
ess:
To
addr
ess
poss
ible
end
ogen
eity
, all
spec
ifica
tions
wer
e al
so e
stim
ated
by
pane
l 2SL
S w
ith c
ount
ry fi
xed
effe
cts
and
five-
year
lags
of
the
liber
aliz
atio
n in
dex
as in
stru
men
t. Th
e re
sults
are
robu
st to
this
alte
rnat
ive
spec
ifica
tion.
Mos
t res
ults
hol
d al
so in
regr
essi
ons
estim
ated
on
five-
year
non
-ove
rlapp
ing
inte
rval
s w
ith g
row
th ra
tes
over
a fi
ve-y
ear p
erio
d re
gres
sed
on fi
ve-y
ear l
ags
of e
ach
liber
aliz
atio
n in
dex.
20

21
28. What are the key channels through which domestic and external financial liberalization contribute to an acceleration in growth? One established channel is the positive association between domestic financial sector liberalization and financial depth (the latter is strongly correlated with growth: see, e.g., Levine, 2005), as portrayed in Figure 6. Regression analysis (Table 3) corroborates the favorable impact of domestic financial sector/banking reform on the credit-to-GDP ratio. However, not all subcomponents of the financial liberalization index serve to boost credit growth: specifically, as foreshadowed earlier, improvements in the supervisory and regulatory practices subindex tend to reduce the credit-to-GDP ratio (column 3), likely reflecting the role of such policies in improving credit allocation and reducing risks of excessive credit growth/booms. Turning to the role of external capital account liberalization, econometric results highlight a positive relationship between opening to external capital flows and the credit-to-GDP ratio (penultimate row of Table 3). In addition, fewer restrictions on capital movements seem to be associated with significantly higher FDI inflows (Table 4) which, as argued in IMF (2007), tend to be growth enhancing.
Figure 6. Financial Depth and Domestic Financial Sector Liberalization
Source: Staff estimates based on Abiad, Detragiache and Tressel (2007) and World Bank Database on Financial Development and Structure, 2007. Notes: This figure plots the ratio of private credit to GDP against the index of domestic financial sector liberalization in 2005. The solid line shows the regression line of the ratio of private credit to GDP on the index of domestic financial sector liberalization.
0
0.2
0.4
0.6
0.8
1
1.2
1.4
1.6
1.8
1.0 1.2 1.4 1.6 1.8 2.0 2.2 2.4 2.6 2.8 3.0
Domestic financial sector liberalization index
Priv
ate
cred
it-to
-GD
P ra
tio
More domestic financial sector liberalization is associated with greater financial depth.
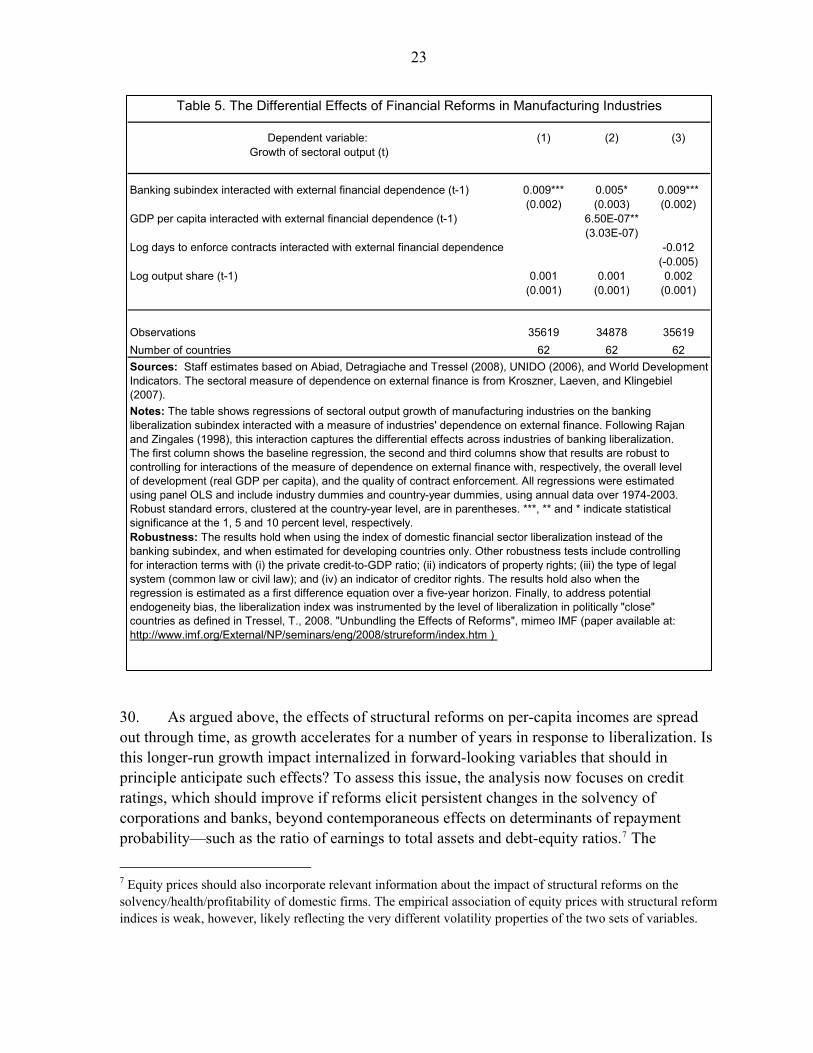
29. To gain further perspective on the channels through which domestic financial sector reform underpins growth, Table 5 considers the nature of possible allocative effects across different manufacturing industries. The results suggest that banking sector liberalization has particularly favorable effects on those sectors that rely relatively heavily on external finance for their investment and growth, as argued in Rajan and Zingales (1998). The estimated effects, moreover, are large: a one standard deviation increase in the banking liberalization subindex raises the annual growth rate of sectors with a high dependence on external finance (top 75th percentile of the distribution), relative to the growth rate of sectors with a low dependence on external finance (bottom 25th percentile of the distribution), by nearly 1 percentage point.

22
Dependent variable: (1) (2) (3)Change in log of private credit to GDP (t)
Change in domestic financial sector liberalization index(t-1) 0.272***[0.063]
Change in banking subindex (t-1) 0.233***[0.058]
Change in banking subindex excluding supervision (t-1) 0.240***[0.052]
Change in banking supervision subindex (t-1) -0.046*[0.026]
Change in securities subindex (t-1) 0.036 0.032[0.032] [0.032]
Change in external capital account liberalization index (t-1) 0.030* 0.031* 0.028[0.018] [0.018] [0.018]
Change in log of private credit to GDP (t-1) 0.463*** 0.463*** 0.461***[0.039] [0.039] [0.039]
Observations 2102 2102 2102R-squared 0.34 0.34 0.34Sources: Staff estimates and Abiad, Detragiache, and Tressel (2008); International Financial Statistics; and World Development Indicators.
Table 3. Effects of Financial Sector Reforms on Financial Depth
Notes: The table shows regressions of the change in financial depth, measured as the change in the private-credit-to-GDP ratio, on changes of financial sector liberalization indicators. The banking subindex excluding supervision is a simple average of the credit control, interest rate control, privatization and competition subindices. All specifications were estimated by panel OLS with year fixed effects, using annual data over 1975-2006. Robust standard errors are in parentheses. ***, **, and * denote statistical significance at 1, 5, and 10 percent level, respectively. Robustness: Results are robust to the inclusion of the rate of inflation, GDP per capita, real GDP growth, and a dummy for hyperinflation as control variables.The results hold also when the regressions are estimated on the sub-sample of developing countries.
Dependent variable: (1) (2) (3) (4)
log FDI/GDP (t)Domestic financial sector liberalization
Banking subindex
Securities subindex
External capital account liberalization
Liberalization index (t-1) 0.462 0.261 0.471* 0.534***(0.432) (0.379) (0.254) (0.144)
Observations 1844 1844 1844 1844Number of countries 81 81 81 81Adjusted R-squared 0.63 0.63 0.63 0.64
Table 4. FDI Inflows and Financial Sector Reforms
Sources: Staff estimates based on International Financial Statistics, Penn World Tables version 6.2, and World Development Indicators.Notes: The table shows regressions of inward FDI, measured as the log of FDI to GDP, on financial sector liberalization indicators. Each regression includes controls for the growth of real per-capita GDP, the level of development (proxied by the lagged level of real GDP per capita), market size (proxied by the lagged level of real GDP), and inflation. All regressions were estimated by panel OLS and include country and year fixed effects, using annual data over 1961-2006. Robust standard errors, clustered at the country-year level, are in parentheses. ***, **, and * denote significance at the 1, 5, and 10 percent level, respectively.
23
Dependent variable: (1) (2) (3)Growth of sectoral output (t)
Banking subindex interacted with external financial dependence (t-1) 0.009*** 0.005* 0.009***(0.002) (0.003) (0.002)
GDP per capita interacted with external financial dependence (t-1) 6.50E-07**(3.03E-07)
Log days to enforce contracts interacted with external financial dependence -0.012(-0.005)
Log output share (t-1) 0.001 0.001 0.002(0.001) (0.001) (0.001)
Observations 35619 34878 35619Number of countries 62 62 62Sources: Staff estimates based on Abiad, Detragiache and Tressel (2008), UNIDO (2006), and World Development Indicators. The sectoral measure of dependence on external finance is from Kroszner, Laeven, and Klingebiel (2007).
Table 5. The Differential Effects of Financial Reforms in Manufacturing Industries
Notes: The table shows regressions of sectoral output growth of manufacturing industries on the banking liberalization subindex interacted with a measure of industries' dependence on external finance. Following Rajan and Zingales (1998), this interaction captures the differential effects across industries of banking liberalization. The first column shows the baseline regression, the second and third columns show that results are robust to controlling for interactions of the measure of dependence on external finance with, respectively, the overall level of development (real GDP per capita), and the quality of contract enforcement. All regressions were estimated using panel OLS and include industry dummies and country-year dummies, using annual data over 1974-2003. Robust standard errors, clustered at the country-year level, are in parentheses. ***, ** and * indicate statistical significance at the 1, 5 and 10 percent level, respectively.Robustness: The results hold when using the index of domestic financial sector liberalization instead of the banking subindex, and when estimated for developing countries only. Other robustness tests include controlling for interaction terms with (i) the private credit-to-GDP ratio; (ii) indicators of property rights; (iii) the type of legal system (common law or civil law); and (iv) an indicator of creditor rights. The results hold also when the regression is estimated as a first difference equation over a five-year horizon. Finally, to address potential endogeneity bias, the liberalization index was instrumented by the level of liberalization in politically "close" countries as defined in Tressel, T., 2008. "Unbundling the Effects of Reforms", mimeo IMF (paper available at: http://www.imf.org/External/NP/seminars/eng/2008/strureform/index.htm )
30. As argued above, the effects of structural reforms on per-capita incomes are spread out through time, as growth accelerates for a number of years in response to liberalization. Is this longer-run growth impact internalized in forward-looking variables that should in principle anticipate such effects? To assess this issue, the analysis now focuses on credit ratings, which should improve if reforms elicit persistent changes in the solvency of corporations and banks, beyond contemporaneous effects on determinants of repayment probability—such as the ratio of earnings to total assets and debt-equity ratios.7 The
7 Equity prices should also incorporate relevant information about the impact of structural reforms on the solvency/health/profitability of domestic firms. The empirical association of equity prices with structural reform indices is weak, however, likely reflecting the very different volatility properties of the two sets of variables.

24
empirical results are very much in line with the hypothesis that credit ratings anticipate the persistent beneficial effects of structural reforms on the corporate sector (Table 6). Specifically, an improvement in the domestic financial sector reform index from the 25th to the 75th percentile of the distribution raises corporate credit ratings by almost 1½ points and banks’ credit ratings by almost 4 points—equivalent to 40–80 percent of the sample difference in credit ratings between the average corporation/bank in high-income and middle-income countries. The impact of capital account liberalization on credit ratings is almost as large, reflecting also its positive effect on sovereign ratings, which lifts the sovereign ceiling on private ratings. Given that credit ratings are highly correlated with bond spreads, this evidence suggests that financial sector reforms reduce the cost of credit of banks and corporations, and improve their access to international credit markets.
B. Real Sector Reforms
31. This section examines how real sector reforms—those relating to international trade, agriculture, and the telecommunications and electricity sectors—affect growth. The conventional wisdom (based, for instance, on the studies by Krueger and others, 1992; Sachs and Warner, 1995; and Dollar and Kraay, 2004) is that there is a positive association between real sector reforms—especially trade liberalization—and income growth, but a broad examination of the cross-country evidence is still missing to underpin this conclusion.
32. The event study analysis based on growth accelerations/decelerations discussed in the previous subsection generally supports the view that real sector reforms anticipate growth spurts, while reversals foreshadow decelerations (Figure 7). Specifically, in the run-up to growth upbreaks, economies have already reduced tariff rates—with the tariff-based trade liberalization index above the country-specific average in the top panel of Figure 7. In addition, reductions in trade-related current account restrictions and in the pervasiveness of agricultural sector restrictions (e.g., export marketing boards) are in evidence about three years before a growth upbreak, and continue thereafter (middle and bottom panels of Figure 7). Conversely, growth downbreaks seem to be anticipated by an illiberal tariff regime and reversals of current account liberalization, but no significant change in agricultural liberalization (although reversals are apparent once the downturn is in train).
33. Econometric evidence corroborates the event-study analysis, with panel growth regressions indicating a statistically significant impact of real sector reforms on economic growth, after controlling for a standard set of growth covariates (Table 7). Agricultural liberalization and reductions in restrictions on trade-related current account transactions yield the largest growth benefits. An improvement in the corresponding indices from the 25th to the 75th percentile—consistent, for example, with the changes in agricultural liberalization achieved in Poland in the late 1980s and current account liberalization achieved in Peru

25
Dependent variable: (1) (2) (3) (4)Foreign-Currency Bond Ratings (t) Domestic financial Securities Banking External capital
sector liberalization subindex subindex account liberalization
Liberalization index (t) 13.370*** 9.878*** 11.817*** 4.535***(2.215) (2.929) (2.022) (1.187)
Sovereign Rating (t) 1.286*** 1.123*** 1.179*** 0.754***(0.132) (0.217) (0.112) (0.078)
Liberalization index interacted with -0.943*** -0.683*** -0.833*** -0.330*** Sovereign Rating (t) (0.149) (0.226) (0.129) (0.089)
Observations 2032 2032 2032 2032R-squared 0.69 0.68 0.69 0.67
Liberalization index (t) 12.027*** 8.209** 9.809*** 6.705***(3.392) (3.235) (3.109) (1.292)
Sovereign Rating (t) 0.950*** 0.942*** 0.886*** 0.896***(0.134) (0.224) (0.119) (0.088)
Liberalization index interacted with -0.403** -0.225 -0.325** -0.261** Sovereign Rating (t) (0.176) (0.236) (0.163) (0.110)
Observations 694 694 694 694R-squared 0.86 0.85 0.85 0.85
Reform (t-1) -0.193 -1.007*** 0.130 0.851***(0.308) (0.288) (0.269) (0.178)
Observations 887 887 887 887R-squared 0.97 0.98 0.97 0.98
Table 6. Financial Sector Reforms and Foreign-Currency Bond Ratings
Corporate Ratings
Bank Ratings
Sovereign Ratings
Sources: Staff estimates based on International Financial Statistics, World Development Indicators, and Standard & Poor's.Notes: The table shows regressions of foreign currency bond ratings on financial sector liberalization indicators. Bond ratings were mapped into numerical values ranging from 1 to 21, with 21 representing the highest (AAA) rating. Each regression also includes as control variables: time fixed effects, inflation, real per-capita GDP, and real per-capita GDP growth averaged over the previous 5 years. For corporate ratings, additional controls include sector fixed effects, current account balance, GDP growth volatility, and the ratios of Earnings before Interest and Taxes (EBIT) to Assets and to Interest Expense, Retained Earnings/Assets, Working Capital/Assets, Total Assets, and Equity/(Equity+Debt). For bank ratings, additional controls include sector fixed effects, current account balance, GDP growth volatility, Equity/Assets, Loan Growth, Operation Expenses/Assets, Net Interest Margin, Deposits/Assets, and Total Assets. For sovereign ratings, additional controls include country dummies, external balance, fiscal balance, default history, and external debt. All regressions were estimated by panel OLS, using annual data over 1995-2005. Robust standard errors, clustered by country-year in the corporate and bank rating regressions, are in parentheses. ***, ** and * denote statistical significance at the 1, 5 and 10 percent level, respectively.Robustness: The regressions in the table are estimated with contemporaneous control variables (except for the sovereign ratings regressions); results are broadly similar when controls are lagged one period. The results also hold when the sample is restricted to industrial countries or emerging markets, and, in the corporate ratings regressions, when liberalization firms in the tradable and nontradable sectors are considered separately. Results are also robust to using alternative external capital account liberalization indices, including those accounting for differences between restrictions on residents and nonresidents (Quinn, 1997) and those accounting for different asset categories and inflow versus outflow controls (Schindler, 2008).

26
Figure 7. Growth Breaks and Real Sector Reforms
Trade liberalization (tariff)
-0.06
-0.04
-0.02
0.00
0.02
0.04
0.06
0.08
-5 -4 -3 -2 -1 0 1 2 3 4 5
Years before and after growth breaks
Lib
eral
izat
ion
inde
x(d
evia
tions
from
cou
ntry
mea
ns)
Trade liberalization (current account)
-0.07-0.06-0.05-0.04-0.03-0.02-0.010.000.010.020.030.04
-5 -4 -3 -2 -1 0 1 2 3 4 5
Years before and after growth breaks
Lib
eral
izat
ion
inde
x(d
evia
tions
from
cou
ntry
mea
ns)
Trade-related current account transactions are being liberalized before upbreaks and restricted during downbreaks.
Agriculture liberalization
-0.05
-0.04
-0.03
-0.02
-0.01
0.00
0.01
0.02
0.03
-5 -4 -3 -2 -1 0 1 2 3 4 5Years before and after growth breaks
Lib
eral
izat
ion
inde
x(d
evia
tions
from
cou
ntry
mea
ns)
Agricultural reforms precede upbreaks and reform reversals accompany downbreaks.
More liberalization
Average liberalization index around downbreaks Average liberalization index around upbreaks
Source: Staff estimates based on Penn World Tables version 6.2.Notes: The figures plot average liberalization indices for the period beginning five years before a growth break (year 0 on the horizontal axis) and ending five years after the growth break. The plots capture the within-country evolution of the liberalization indices obtained from a panel regression of each index on country fixed effects (toremove country averages) and year fixed effects (to remove global trends). As a result, the zero value on the vertical axis corresponds to the sample average of the liberalization indices for the countries considered. The number of countries used to compute each average varies across indices and is in line with data availability. No chart is shown for the case of telecommunications and electricity reform, because there are not enough growth breaks after 1990, the year that liberalizations in this sector generally begin.
More liberalization
Less liberalization
More liberalization
Less liberalization
Less liberalization
Tariffs are relatively low before upbreaks, while an illiberal tariff regime precedes downbreaks.

Dep
ende
nt v
aria
ble:
(1)
(2)
(3)
(4)
logG
DP(
t) - l
ogG
DP(
t-1)
Trad
e lib
eral
izat
ion
(tarif
f)Tr
ade
liber
aliz
atio
n (c
urre
nt a
ccou
nt)
Ag
ricul
tura
l lib
eral
izat
ion
Tele
com
s an
d el
ectri
city
lib
eral
izat
ion
Entir
e sa
mpl
e:
Lib
eral
izat
ion
inde
x (t-
1)0.
022*
**0.
034*
**0.
028*
**-0
.001
(0.0
09)
(0.0
07)
(0.0
07)
(0.0
08)
L
ong-
run
inco
me
effe
ct: 2
5-75
per
cent
ile im
prov
emen
t 0.
135*
**
0.42
5***
0.51
9***
-0.0
01(0
.054
)(0
.094
)(0
.132
)(0
.019
)
Obs
erva
tions
2616
1719
2310
2411
Num
ber o
f cou
ntrie
s11
858
9492
Adj
uste
d R
-squ
ared
0.13
0.16
0.13
0.13
Low
-Mid
dle
Inco
me
grou
p:
Lib
eral
izat
ion
inde
x (t-
1)0.
024*
**0.
042*
**0.
034*
**-0
.009
(0.0
10)
(0.0
10)
(0.0
08)
(0.0
13)
L
ong-
run
inco
me
effe
ct: 2
5-75
per
cent
ile im
prov
emen
t 0.
131*
**0.
438*
**0.
581*
**0.
000
(0.0
55)
(0.1
07)
(0.1
39)
(0.0
00)
Obs
erva
tions
1802
1026
1653
1618
Num
ber o
f cou
ntrie
s97
4172
72A
djus
ted
R-s
quar
ed0.
110.
140.
130.
12
Tabl
e 7.
Gro
wth
Reg
ress
ion
Res
ults
: Rea
l Sec
tor R
efor
ms
Sour
ces:
Sta
ff es
timat
es b
ased
on
Inte
rnat
iona
l Fin
anci
al S
tatis
tics,
Pen
n W
orld
Tab
les
vers
ion
6.2,
and
Wor
ld D
evel
opm
ent I
ndic
ator
s.N
otes
: The
tabl
e sh
ows
regr
essi
ons
of a
nnua
l gro
wth
in re
al G
DP
per c
apita
on
real
sec
tor l
iber
aliz
atio
n in
dica
tors
. The
regr
essi
ons
are
estim
ated
for t
he
entir
e co
untry
sam
ple
and
for t
he g
roup
of l
ower
-mid
dle
inco
me
coun
tries
(see
App
endi
x Ta
ble
1). E
ach
regr
essi
on in
clud
es a
s co
ntro
ls th
e la
gged
leve
l of r
eal
GD
P pe
r cap
ita, a
n in
dica
tor v
aria
ble
for d
emoc
ratic
regi
mes
, the
leve
l of t
erm
s of
trad
e, a
nd th
e le
vel o
f ter
tiary
sch
ool e
nrol
lmen
t. Th
e lo
ng-r
un in
com
e ef
fect
ca
ptur
es th
e es
timat
ed c
hang
e in
the
stea
dy-s
tate
leve
l of G
DP
per c
apita
resu
lting
from
an
impr
ovem
ent i
n th
e lib
eral
izat
ion
inde
x fro
m th
e 25
th to
the
75th
pe
rcen
tile.
All
spec
ifica
tions
wer
e es
timat
ed b
y pa
nel O
LS w
ith c
ount
ry- a
nd y
ear-
fixed
effe
cts,
usi
ng a
nnua
l dat
a ov
er 1
960-
2005
. Rob
ust s
tand
ard
erro
rs a
re
in p
aren
thes
es. T
he s
tand
ard
erro
rs o
n th
e lo
ng-r
un e
ffect
s ar
e ca
lcul
ated
with
the
delta
met
hod.
***,
**, a
nd *
deno
te s
tatis
tical
sig
nific
ance
at 1
, 5, a
nd 1
0 pe
rcen
t lev
el, r
espe
ctiv
ely.
Rob
ustn
ess:
To
addr
ess
poss
ible
end
ogen
eity
, all
spec
ifica
tions
wer
e al
so e
stim
ated
by
pane
l 2SL
S w
ith c
ount
ry fi
xed
effe
cts
and
five-
year
lags
of t
he
liber
aliz
atio
n in
dex
as in
stru
men
t. Th
e re
sults
are
robu
st to
this
alte
rnat
ive
spec
ifica
tion.
Mos
t res
ults
hol
d al
so in
regr
essi
ons
estim
ated
on
five-
year
non
-ov
erla
ppin
g in
terv
als
with
gro
wth
rate
s ov
er a
five
-yea
r per
iod
regr
esse
d on
five
-yea
r lag
s of
eac
h lib
eral
izat
ion
inde
x.
27

28
at roughly the same time—is estimated to increase long-run income per capita by about 40-50 percent.8 The effects are somewhat stronger over the sample of low- and middle-income countries, in line with the greater weight of the farm sector in such economies, and the role of exports in the development strategies of a number of non-industrial countries. Finally, with respect to telecommunications and electricity deregulation, while previous studies for industrial countries have found significant effects on productivity growth (Nicoletti and Scarpetta, 2003), the broad cross-country evidence fails to uncover much impact, likely reflecting the late adoption of these reforms in developing countries.
34. What can be said about the channels through which real sector reforms affect growth? A starting point, given the established linkage between growth and trade (e.g., Frankel and Romer, 1999), is to examine the association between trade liberalization and de facto trade openness (import- and export-to-GDP shares), which indeed is robustly positive (Table 8). In line with the results in Table 7, the index based on current account liberalization has a larger effect on trade flows than the index based on tariffs, with an increase in the current account reform index from the 25th to the 75th percentile of the sample distribution yielding an increase in trade shares of 10–15 percentage points of GDP (last row of Table 8).
35. Apart from the trade channel, resource reallocation in response to a move to a more market-based relative price structure is likely to be a key driver of growth following real sector reforms. As an example, trade liberalization—which lowers the cost of imported inputs faced by domestic firms—is likely to benefit sectors relying relatively more on such imports in production; as shown in Table 9, this effect is statistically significant. The coefficient capturing the differential effect across sectors of tariff reductions (first row in the table) implies that a one standard deviation improvement in the index (i.e., a reduction in average tariff rates of about 15 percentage points) raises relative annual growth in sectors using imported inputs intensively by about 0.1 percentage point.
36. Like financial sector reforms, real sector reforms also have persistent effects which are anticipated in such forward-looking variables as credit ratings. Results reported in Table 10 suggest that both measures of trade liberalization significantly improve the credit ratings of domestic firms, controlling for other potential determinants of repayment probability. A reform, for example, that increases the index of current account liberalization from the 25th to the 75th percentile of the sample distribution is associated with an increase in average corporate credit ratings equivalent to about 20 percent of the sample difference in credit ratings between high- and middle-income countries. Moreover, the total effect approximately doubles if one takes into account that corporate ratings are capped by sovereign ratings, and that the latter are also improved by current account liberalization.
8 About half the long-run effects are achieved within twenty years, and 20 percent in the first five years.

Dep
ende
nt v
aria
ble:
Annu
al ra
tio o
f exp
orts
(im
ports
) to
GD
P (t
)(1
)(2
)(3
)(4
)Tr
ade
liber
aliz
atio
nTr
ade
liber
aliz
atio
nTr
ade
liber
aliz
atio
nTr
ade
liber
aliz
atio
n(ta
riff)
(cur
rent
acc
ount
)(ta
riff)
(cur
rent
acc
ount
)
Trad
e lib
eral
izat
ion
inde
x (t-
1)1.
754*
**2.
349*
**1.
397*
**2.
659*
**(0
.556
)(0
.452
)(0
.487
)(0
.423
)
Expo
rts/G
DP
(t-1)
0.83
5***
0.88
1***
(0.0
22)
(0.0
16)
Impo
rts/G
DP
(t-1)
0.85
5***
0.89
7***
(0.0
14)
(0.0
14)
Trad
ing
partn
ers'
inco
me
grow
th (t
-1)
0.10
4**
0.19
3***
(0.0
49)
(0.0
57)
Dom
estic
inco
me
grow
th (t
-1)
0.06
8**
0.07
8***
(0.0
28)
(0.0
25)
L
ong-
run
effe
ct: 2
5-75
per
cent
ile im
prov
emen
t in
the
trade
libe
raliz
atio
n in
dex
2.91
1***
11.1
06**
*2.
637*
**14
.510
***
(0
.741
)(2
.043
)(0
.905
)(2
.321
)
Obs
erva
tions
3618
2091
3777
2290
Num
ber o
f cou
ntrie
s14
058
140
58A
djus
ted
R-s
quar
ed0.
700.
800.
740.
83
Tabl
e 8.
Tra
de R
efor
ms
and
Exp
ort-
and
Impo
rt-to
-GD
P S
hare
Exp
orts
/GD
PIm
ports
/GD
P
Sour
ces:
Sta
ff es
timat
es b
ased
on
Inte
rnat
iona
l Fin
anci
al S
tatis
tics
and
Wor
ld D
evel
opm
ent I
ndic
ator
s.N
otes
: The
tabl
e sh
ows
regr
essi
ons
of th
e sh
are
of e
xpor
ts a
nd im
ports
of g
oods
and
ser
vice
s in
GD
P on
indi
ces
of tr
ade
refo
rm, s
epar
atel
y fo
r the
inde
x ba
sed
on ta
riffs
and
the
inde
x ba
sed
on c
urre
nt a
ccou
nt re
stric
tions
. The
con
trol v
aria
bles
incl
ude
dom
estic
GD
P gr
owth
(for
impo
rts) a
nd tr
adin
g pa
rtner
s'
GD
P g
row
th (f
or e
xpor
ts);
all v
aria
bles
are
lagg
ed o
ne y
ear t
o av
oid
pote
ntia
l pro
blem
s of
end
ogen
eity
. In
addi
tion,
all
regr
essi
ons
incl
ude
the
lagg
ed
depe
nden
t var
iabl
e to
con
trol f
or p
ersi
sten
ce in
exp
ort-
and
impo
rt-to
-GD
P sh
ares
. The
long
-run
effe
ct is
the
long
-term
cha
nge
in te
rms
of G
DP
shar
es
resu
lting
from
an
incr
ease
in th
e op
enne
ss in
dex
from
the
25th
to th
e 75
th p
erce
ntile
of t
he in
-sam
ple
dist
ribut
ion.
All
spec
ifica
tions
are
est
imat
ed b
y or
dina
ry
leas
t squ
ared
regr
essi
on w
ith c
ount
ry fi
xed
effe
cts,
usi
ng a
nnua
l dat
a ov
er 1
968-
2006
. Rob
ust s
tand
ard
erro
rs a
re in
par
enth
eses
. The
sta
ndar
d er
rors
on
the
long
term
effe
cts
are
calc
ulat
ed w
ith th
e de
lta m
etho
d. *
**, *
* an
d * d
enot
e st
atis
tical
sig
nific
ance
at t
he 1
, 5 a
nd 1
0 pe
rcen
t lev
el, r
espe
ctiv
ely.
Rob
ustn
ess :
The
resu
lts a
re ro
bust
to a
dditi
onal
con
trols
use
d in
the
rela
ted
liter
atur
e, in
clud
ing
term
s-of
-trad
e sh
ocks
and
fisc
al b
alan
ce a
s a
shar
e of
GD
P;
how
ever
, the
incl
usio
n of
thes
e va
riabl
es re
duce
s co
nsid
erab
ly th
e sa
mpl
e si
ze.
29

Dep
ende
nt v
aria
ble:
(1
)(2
)G
row
th o
f sec
tora
l out
put (
t)Tr
ade
liber
aliz
atio
nTr
ade
liber
aliz
atio
n(ta
riff)
(cur
rent
acc
ount
)
Trad
e lib
eral
izat
ion
inde
x in
tera
cted
with
a m
easu
re o
f im
porte
d in
put i
nten
sity
(t-1
)0.
033*
**0.
027*
**
(0
.006
)(0
.005
)Ba
nkin
g lib
eral
izat
ion
subi
ndex
inte
ract
ed w
ith a
mea
sure
of e
xter
nal f
inan
cial
dep
ende
nce
(t-1)
0.01
3***
0.00
8***
(0.0
03)
(0.0
023)
Log
outp
ut s
hare
(t-1
)0.
001
-0.0
0004
(0.0
01)
(0.0
014)
Obs
erva
tions
3277
030
715
Num
ber o
f cou
ntrie
s60
52
Sour
ces:
Sta
ff es
timat
es b
ased
on
the
GTA
P da
taba
se, a
nd A
biad
, Det
ragi
ache
and
Tre
ssel
(200
8), U
NID
O 2
006,
and
Wor
ld D
evel
opm
ent
Indi
cato
rs. T
he s
ecto
ral m
easu
re o
f dep
ende
nce
on e
xter
nal f
inan
ce is
from
Kro
szne
r, La
even
, and
Klin
gebi
el (2
007)
.
Tabl
e 9.
The
Diff
eren
tial E
ffect
s of
Tra
de L
iber
aliz
atio
n in
Man
ufac
turin
g In
dust
ries
Not
es: T
he ta
ble
show
s re
gres
sion
s of
sec
tora
l out
put g
row
th o
f man
ufac
turin
g in
dust
ries
on tr
ade
liber
aliz
atio
n in
dica
tors
inte
ract
ed w
ith a
m
easu
re o
f int
ensi
ty o
f use
of i
mpo
rted
inpu
ts in
exp
ort s
ecto
rs. T
his
inte
ract
ion
capt
ures
diff
eren
tial e
ffect
s ac
ross
indu
strie
s ar
isin
g fro
m tr
ade
liber
aliz
atio
n. T
he fi
rst a
nd s
econ
d co
lum
ns c
onsi
der,
resp
ectiv
ely,
the
aver
age
tarif
f and
cur
rent
acc
ount
bas
ed m
easu
res
of tr
ade
liber
aliz
atio
n. A
ll re
gres
sion
s w
ere
estim
ated
usi
ng p
anel
OLS
and
incl
ude
indu
stry
dum
mie
s an
d co
untry
-yea
r dum
mie
s, u
sing
ann
ual d
ata
over
197
4-20
03. R
obus
t st
anda
rd e
rror
s, c
lust
ered
at t
he c
ount
ry-le
vel,
are
in p
aren
thes
es. *
**, *
* and
* in
dica
te s
tatis
tical
sig
nific
ance
at t
he 1
, 5, a
nd 1
0 pe
rcen
t lev
el,
resp
ectiv
ely.
Rob
ustn
ess:
The
resu
lts a
re b
road
ly s
imila
r whe
n es
timat
ed fo
r dev
elop
ing
coun
tries
onl
y, a
nd w
hen
estim
ated
usi
ng o
ther
mea
sure
s of
trad
e lib
eral
izat
ion
such
as
Wac
ziar
g an
d W
elsh
's (2
008)
inde
x an
d a
dum
my
varia
ble
for W
TO m
embe
rshi
p. O
ther
robu
stne
ss te
sts
incl
ude
cont
rollin
g fo
r int
erac
tion
term
s w
ith (i
) the
priv
ate
cred
it to
GD
P ra
tio; (
ii) in
dica
tors
of p
rope
rty ri
ghts
; (iii)
an
indi
cato
r var
iabl
e fo
r the
type
of l
egal
sys
tem
(c
omm
on la
w o
r civ
il la
w);
(iv) a
n in
dica
tor o
f cre
dito
r rig
hts.
Sim
ilar r
esul
ts a
re o
btai
ned
whe
n th
e re
gres
sion
is e
stim
ated
in fi
rst d
iffer
ence
s ov
er a
fiv
e-ye
ar h
oriz
on. T
o ad
dres
s po
tent
ial e
ndog
enei
ty b
ias,
the
liber
aliz
atio
n in
dex
was
inst
rum
ente
d us
ing
liber
aliz
atio
n le
vels
of p
oliti
cally
"clo
se"
coun
tries
as
defin
ed in
Tre
ssel
, T.,
2008
. "U
nbun
dlin
g th
e Ef
fect
s of
Ref
orm
s", m
imeo
IMF
(pap
er a
vaila
ble
at:
http
://w
ww
.imf.o
rg/E
xter
nal/N
P/se
min
ars/
eng/
2008
/stru
refo
rm/in
dex.
htm
)
30

31
Dependent variable: (1) (2)Foreign-Currency Bond Ratings (t) Trade liberalization Trade liberalization
(tariff) (current account)
Liberalization index (t) 9.017* 8.874***(5.426) (1.468)
Sovereign Rating (t) 1.463*** 1.044***(0.377) (0.100)
Liberalization index interacted with Sovereign Rating (t) -1.087** -0.678***(0.443) (0.112)
Observations 2032 2010R-squared 0.68 0.68
Liberalization index (t) 32.004*** 2.442(6.611) (1.503)
Sovereign Rating (t) 2.647*** 0.588***(0.458) (0.105)
Liberalization index interacted with Sovereign Rating (t) -2.227*** 0.129(0.521) (0.127)
Observations 707 674R-squared 0.84 0.86
Reform (t-1) -2.339*** 1.336***(0.830) (0.367)
Observations 963 736R-squared 0.98 0.98
Table 10. Real Sector Reforms and Foreign-Currency Bond Ratings
Corporate Ratings
Bank Ratings
Sovereign Ratings
Sources: Staff estimates based on International Financial Statistics, World Development Indicators, and Standard & Poor's.Notes: The table shows regressions of foreign currency bond ratings on trade liberalization indicators. Bond ratings were mapped into numerical values ranging from 1 to 21, with 21 representing the highest (AAA) rating. Each regression also includes as control variables: time fixed effects, inflation, real per-capita GDP, and real per-capita GDP growth averaged over the previous 5 years. For corporate ratings, additional controls include sector fixed effects, current account balance, GDP growth volatility, and the ratios of Earnings before Interest and Taxes (EBIT) to Assets and to Interest Expense, Retained Earnings/Assets, Working Capital/Assets, Total Assets, and Equity/(Equity+Debt). For bank ratings, additional controls include sector fixed effects, current account balance, GDP growth volatility, Equity/Assets, Loan Growth, Operation Expenses/Assets, Net Interest Margin, Deposits/Assets, and Total Assets. For sovereign ratings, additional controls include country dummies, external balance, fiscal balance, default history, and external debt. All regressions were estimated by panel OLS, using annual data over 1995-2005. Robust standard errors, clustered by country-year in the corporate and bank rating regressions, are in parentheses. ***, ** and * denote statistical significance at the 1, 5 and 10 percent level, respectively.Robustness: The regressions in the table are estimated with contemporaneous control variables (except for the sovereign ratings regressions); results are broadly similar when controls are lagged one period. The results also hold when the sample is restricted to industrial or emerging markets, and, in the corporate ratings regressions, when firms in the tradable and nontradable sectors are considered separately.

32
37. The positive impact of trade reforms on credit ratings is an important example of a favorable real-financial linkage following structural reform, with the increased efficiency brought about by real sector reforms fostering improved access to credit/investment financing for domestic firms. Such favorable real-financial linkages are also apparent from the impact of current account reform on financial depth (Table 11, second row/second column), and the effects of telecommunications and electricity reforms on FDI (Table 12, fourth column).
Dependent variable: (1) (2)Change in log private credit to GDP (t)
Change in index of average tariff (t-1) -0.087[0.077]
Change in index of current account restrictions (t-1) 0.154**[0.072]
Change in domestic financial sector liberalization (t-1) 0.211*** 0.172***[0.061] [0.056]
Change in external capital account liberalization (t-1) 0.037* 0.020[0.021] [0.021]
Change in log of private credit to GDP (t-1) 0.460*** 0.470***[0.044] [0.032]
Observations 1671 1622R-squared 0.36 0.37
Table 11. Effects of Trade Reforms on Financial Depth
Sources: Staff estimates based on Abiad, Detragiache and Tressel (2008); International Financial Statistics; and World Development Indicators.Notes: The table shows regressions of the change in financial depth, measured as the change in the private credit to GDP ratio, on lagged changes in financial, trade, and external capital account liberalization indices. All specifications were estimated by panel OLS with year fixed effects, using annual data over 1975-2006. Robust standard errors in parentheses. ***, **, and * denote statistical significance at 1, 5, and 10 percent level, respectively.Robustness: Results are robust to the inclusion of the rate of inflation, GDP per capita, real GDP growth, and a dummy for hyperinflation as control variables. The effect of reforms is also robust when estimated on the sub-sample of developing countries.
Dependent variable: (1) (2) (3) (4)
log FDI/GDP (t)Trade liberalization
(tariff)Trade liberalization (current account)
Agricultural liberalizationTelecoms and electricity
liberalization
Liberalization index (t-1) 0.406 0.094 0.231 0.636**(0.357) (0.411) (0.369) (0.295)
Observations 2418 1550 1810 1956Number of countries 119 59 92 94Adjusted R-squared 0.62 0.61 0.59 0.58
Table 12. FDI Inflows and Real Sector Reforms
Sources: Staff estimates based on International Financial Statistics, Penn World Tables version 6.2, and World Development Indicators.Notes: The table shows regressions of inward FDI, measured as the log of FDI to GDP, on real sector liberalization indices. Each regression includes controls for the growth of real per-capita GDP, the level of development (proxied by the lagged level of real GDP per capita), market size (proxied by the lagged level of real GDP), and inflation. All regressions were estimated by panel OLS and include country and year fixed effects, using annual data over 1961-2006. Robust standard errors, clustered at the country-year level, are in parentheses. ***, **, and * denote significance at the 1, 5, and 10 percent level, respectively.
V. SEQUENCING REAL AND FINANCIAL SECTOR REFORMS
38. The analysis so far has considered the impact of individual reforms, rather than packages of multiple reforms, on economic growth. In practice, policy makers will wish to act on the basis of a reform strategy that takes into account sequencing issues as well as possible complementarities among reforms on expected growth outcomes. While political

33
constraints may often be paramount in determining what can be achieved and when, policy makers will opt for reform strategies that are likely to have the most favorable impact on economic welfare or growth subject to the other constraints. Although there is a large literature on the design and sequencing of reform packages, including, for example, whether “big bang” or piecemeal approaches to reform yield greater economic returns, the empirical evidence on the growth benefits of alternative sequencing strategies, and indeed, as a prior matter, the “stylized facts” of reform sequencing strategies—what countries have actually pursued in practice—is relatively scarce.9 This section examines the cross-country evidence on sequencing strategies and their growth effects, linking it where appropriate to the existing theoretical/normative work on these issues, which holds that:
• International trade should be liberalized before the external capital account. McKinnon (1973) argued that liberalizing capital inflows before trade was likely to amplify the distortions caused by tariffs and reduce the competitiveness of domestic firms through real appreciation. Liberalizing capital outflows before trade would be equally undesirable if trade restrictions misallocate resources and depress domestic returns to the point that domestic capital would leave the economy. For both reasons, McKinnon, and others following him, have advocated a “trade reform first” strategy, contending that the growth benefits of reform would be higher under such a strategy than under alternative sequencing strategies.
• The domestic financial sector should be liberalized before the external capital account. In the presence of regulated interest rates and other financial system distortions, capital mobility is likely to be destabilizing: capital inflows could lead to overborrowing in foreign currency, which a dysfunctional domestic financial sector would misallocate, and capital outflows could erode the domestic deposit base (McKinnon, 1973). There is some evidence that capital account liberalization may increase volatility and crisis risk in the absence of a sufficiently reformed domestic financial sector (IMF, 2007). If such volatility leads to an inefficient allocation of resources, growth should be higher when the domestic financial sector is reformed before the external capital account than under the reverse sequencing strategy.
• Trade should be liberalized before the domestic financial sector. Opening the economy to international trade first has been argued to make subsequent reform of the domestic financial sector more likely because greater competition in product markets (through trade) is likely to weaken the influence of monopolistic incumbents who
9 Bhattacharya (1997) provides a review of the theoretical literature. Previous empirical work has focused on the sequencing of product and labor market reforms for OECD countries (Fiori and others, 2007), but has generally ignored the broader sequencing issues among the different sectors covered in this paper. A related issue, well outside the remit of this paper, concerns the appropriate sequencing between macroeconomic stabilization and structural reforms: see Zalduendo (2005) for an analysis.

34
may oppose financial development (Rajan and Zingales, 2003). While this argument may explain why trade reform is more likely to precede domestic financial sector reform than vice-versa, it does not necessarily imply that growth should be higher under the first sequence than the second.
39. To what extent do countries actually follow the sequencing prescriptions advocated in the normative literature? Table 13 presents evidence on actual sequencing practices, by testing whether some reform indicators are leading indicators of—i.e., generally precede—changes in other reform indicators. Specifically, five-year changes in the indicators of domestic financial sector liberalization (column 1), external capital account liberalization (column 2), and the tariff-based trade liberalization index (column 3) are regressed on five-year lags of all other reform indicators, controlling for a variety of other determinants of liberalization. The results suggest that trade liberalization does indeed help to predict future reform of both the domestic financial sector and the external capital account (first row), while it is not itself predicted by either of the other reforms (last column), consistent with the “trade-first” strategy advocated in the normative literature. The data, however, do not speak loudly on whether domestic financial sector liberalization leads or lags external capital account liberalization. The estimated coefficient on domestic financial sector liberalization in the external capital account reform regression (second column/second row) is borderline significant, providing only weak evidence that countries tend to reform the domestic financial sector before opening up to foreign capital.
Dependent variable: (1) (2) (3)Reform index (t) - Reform index (t-5) Domestic financial External capital Trade liberalization
sector liberalization account liberalization (tariff)
Trade liberalization (tariff) (t-5) 0.107*** 0.235** -0.578***[0.04] [0.10] [0.08]
Domestic financial sector liberalization (t-5) -0.694*** 0.189 -0.030[0.07] [0.13] [0.06]
External capital account liberalization (t-5) -0.031 -0.839*** 0.034[0.03] [0.08] [0.03]
Observations 353 353 352Number of countries 74 74 74Adj. R-squared 0.44 0.43 0.32Sources: Staff estimates.
Table 13. Sequencing of Structural Reforms
Notes: The table shows regressions of five-year changes in the indicators of domestic financial sector liberalization (column 1), external capital account liberalization (column 2) and trade (tariff) liberalization (column 3) on five-year lags of all other liberalization indices. Explanatory variables include indices of liberalization in agriculture and in the telecommunications and electricity industries, the own lagged levels of the index considered, country and year fixed effects, and a measure of the level of liberalization in neighboring countries. All specifications were estimated by panel OLS on non-overlapping five-year intervals over the period 1975-2000. Robust standard errors are reported in parentheses. ***, **, and * denote statistical significance at 1, 5, and 10 percent levels, respectively.Robustness: The trade liberalization index based on current account restrictions has leading indicator properties similar to those of the reported tariff-based index. Broadly similar results are obtained including, as additional controls, five-year lags of GDP per capita, a terms-of-trade index, and an indicator variable for democratic regimes.
40. What about the growth effects of alternative sequencing strategies? Figure 8 illustrates the evolution of the indices of domestic financial sector and external capital account liberalization, as well as the tariff-based index of trade liberalization, before and

35
Figure 8. Growth Breaks and Sequencing of Reforms
Source: Staff estimates based on Penn World Tables version 6.2.Notes: These figures plot average liberalization indices for the period starting five years before a growth break (year 0 on the horizontal axis) and ending five years after the growth break. The plots capture the within-country evolution of the liberalization indices obtained from a panel regression of each index on country fixed effects (to remove country averages) and year fixed effects (to remove global trends). As a result, the zero value on the vertical axis corresponds to the sample average of the liberalization indices for the countries considered. The number of countries used to compute each average is the same across the three indices.
Upbreaks
-0.04
-0.03
-0.02
-0.01
0.00
0.01
0.02
0.03
0.04
0.05
-5 -4 -3 -2 -1 0 1 2 3 4 5
Years before and after growth breaks
Lib
eral
izat
ion
inde
x (d
evia
tions
from
cou
ntry
mea
ns)
Upbreaks are associated with relatively high levels of trade liberalization and rising trends in both external capital account liberalization and domestic financial sector liberalization.
Downbreaks
-0.08
-0.06
-0.04
-0.02
0.00
0.02
0.04
0.06
0.08
0.10
0.12
-5 -4 -3 -2 -1 0 1 2 3 4 5
Lib
eral
izat
ion
inde
x(d
evia
tions
from
cou
ntry
mea
ns)
Downbreaks are associated with relatively low levels of trade liberalization and high levels of external capital account liberalization, with domestic financial sector liberalization about equal to country averages.
More liberalization
Lessliberalization
Trade liberalization (tariff)
External capital account liberalization
Domestic financial sector liberalization
More liberalization
Lessliberalization
Years before and after growth breaks

36
after growth breaks. Overall, the trade-first sequence seems to be associated with growth upbreaks, while a trade-last sequence seems to characterize growth downbreaks. Specifically:
• In the run-up to growth upbreaks, economies have generally already introduced trade reforms, with the trade liberalization index above the country average (top panel of Figure 8). In contrast, in the run-up to downbreaks, economies have yet to open to trade (bottom panel). This suggests that a liberal trade regime is involved both in igniting growth and in sustaining it—the latter result is also strongly supported by the analysis of growth duration in Berg, Ostry, and Zettelmeyer (2008).
• During acceleration episodes, the top panel of Figure 8 shows that the index of domestic financial sector liberalization and that of external capital account liberalization are on a rising trend three to four years before the upbreak. Thus, an open trade regime, together with a process of increasingly liberalized domestic financial sector and external capital account, appear to be an integral part of acceleration episodes, with the latter two reforms mostly progressing together. In contrast, a relatively open external capital account, combined with a relatively closed trade account and domestic financial sector reform about equal to country averages, seems to be a common feature of growth decelerations.
41. Econometric evidence corroborates the main results from Figure 8 on the growth effects of alternative sequencing strategies. Controlling for standard growth determinants and the direct effects of reforms, Table 14 presents results on the growth effects of alternative reform sequencing strategies. The positive and statistically significant coefficient on the trade-before-external-capital-account liberalization sequencing term (first row/second column) indicates that liberalizing trade before the capital account yields a more favorable growth outcome than the reverse sequence.10 By contrast, no clear ranking—in terms of growth outcomes—emerges between domestic financial sector liberalization and the opening of the external capital account (column 3), or between trade and domestic financial sector liberalization (the sequence with trade first is only borderline significant in column 1). The results in Table 14 can be used to simulate the cumulative growth effects of alternative reform sequencing strategies: not surprisingly, the results indicate larger cumulative growth benefits (about ⅓ percent per year over 15 years) of a trade-before-external-capital-account reform strategy than the reverse strategy; a big bang approach where both reforms are pursued simultaneously is also less favorable in terms of cumulative growth performance.
10 To make the level of liberalization comparable across sectors, the indices were transformed into percentiles of the distribution of each index. Estimating the regressions with the raw indices yields similar results.

Dep
ende
nt v
aria
ble:
(1)
(2)
(3)
Annu
al p
er-c
apita
GD
P gr
owth
(t)
Trad
e lib
eral
izat
ion
(tarif
f)Tr
ade
liber
aliz
atio
n (ta
riff)
Dom
. fin
anci
al s
ecto
r lib
.vs
.vs
.vs
.D
omes
tic fi
nanc
ial s
ecto
r lib
eral
izat
ion
Exte
rnal
cap
ital a
ccou
nt li
bera
lizat
ion
Exte
rnal
cap
ital a
ccou
nt li
bera
lizat
ion
Ref
orm
seq
uenc
e (fi
rst r
efor
m b
efor
e se
cond
) (t-1
)0.
030.
043*
*0.
052
(0.0
19)
(0.0
18)
(0.0
46)
Dire
ct e
ffect
(firs
t ref
orm
) (t-1
)0.
019*
0.02
6**
0.07
1***
(0.0
10)
(0.0
11)
(0.0
16)
Dire
ct e
ffect
(sec
ond
refo
rm) (
t-1)
0.06
2***
0.05
8***
0.03
4**
(0.0
23)
(0.0
17)
(0.0
14)
Ref
orm
com
plem
enta
rity
(t-1)
-0.0
18-0
.051
**-0
.054
**(0
.024
)(0
.020
)(0
.021
)
Obs
erva
tions
1991
1991
2114
Num
ber o
f cou
ntrie
s88
8888
Adju
sted
R-s
quar
ed0.
060.
060.
08
Rob
ustn
ess:
Res
ults
are
robu
st to
mea
surin
g th
e re
form
seq
uenc
e te
rm u
sing
act
ual l
iber
aliz
atio
n in
dice
s ra
ther
than
thei
r per
cent
iles.
Tabl
e 14
. Gro
wth
Effe
cts
of A
ltern
ativ
e R
efor
m S
eque
ncin
g S
trate
gies
Sour
ces:
Sta
ff es
timat
es b
ased
on
Inte
rnat
iona
l Fin
anci
al S
tatis
tics,
Pen
n W
orld
Tab
les
vers
ion
6.2,
and
Wor
ld D
evel
opm
ent I
ndic
ator
s.N
otes
: Thi
s ta
ble
show
s re
gres
sion
s of
ann
ual p
er-c
apita
GD
P gr
owth
on
vario
us (p
airw
ise)
com
bina
tions
of r
efor
m. T
he e
ffect
s of
refo
rms
are
disa
ggre
gate
d in
to a
dire
ct e
ffect
; a re
form
co
mpl
emen
tarit
y ef
fect
cap
ture
d by
a m
ultip
licat
ive
inte
ract
ion
of th
e tw
o lib
eral
izat
ion
indi
ces;
and
a s
eque
ncin
g ef
fect
. The
latte
r is
cons
truct
ed b
y fir
st c
alcu
latin
g, fo
r eac
h re
form
, the
pe
rcen
tile
of a
cou
ntry
’s li
bera
lizat
ion
inde
x in
a g
iven
yea
r (ba
sed
on th
e re
spec
tive
regr
essi
on s
ampl
e), a
nd th
en in
tera
ctin
g th
e di
ffere
nce
in th
e pe
rcen
tiles
with
the
com
plem
enta
rity
term
. Th
e se
quen
cing
term
thus
cap
ture
s th
e di
ffere
nce
betw
een
the
exte
nt o
f lib
eral
izat
ion
acro
ss th
e tw
o se
ctor
s. C
ontro
l var
iabl
es in
clud
e: th
e le
vel o
f GD
P pe
r-ca
pita
(in
logs
), th
e le
vel o
f te
rms
of tr
ade,
an
indi
cato
r var
iabl
e fo
r dem
ocra
tic re
gim
es, t
he le
vel o
f ter
tiary
edu
catio
n, a
ll la
gged
one
yea
r. Al
l reg
ress
ions
wer
e es
timat
ed b
y pa
nel O
LS in
clud
ing
coun
try a
nd ti
me
fixed
ef
fect
s. R
obus
t sta
ndar
d er
rors
are
pro
vide
d in
par
enth
eses
. ***
, **,
and
* den
ote
stat
istic
al s
igni
fican
ce a
t the
1, 5
, and
10
perc
ent l
evel
, res
pect
ivel
y.
37

38
VI. FINANCIAL SECTOR REFORMS AND RESILIENCE
42. How do structural reforms—and, in particular, financial sector reforms, which should in principle help to buffer economies against the effects of adverse shocks and thereby foster greater risk sharing at the economy-wide level—affect macroeconomic volatility and resilience?
To address what is in essence an empirical issue, Figure 9 shows how output volatility (top panel) and the frequency of “sudden stops” (bottom panel) vary with the level of financial liberalization.11 The results suggest that countries with a relatively liberalized domestic financial sector seem to enjoy lower macroeconomic volatility and experience a lower incidence of sudden stops, while the association between external capital account liberalization and macroeconomic volatility/crisis propensity appears to be weak. Of course, just as the growth effects of structural reforms depend critically on the sequencing strategy pursued, so too the above volatility/crisis risk results also reflect reform
Figure 9. Financial Sector Reforms, Output Volatility, and Capital Account Crises
Source: Staff estimates based on Penn World Tables version 6.2 and World Economic Outlook Database.Notes: Upper panel. The output volatilty portrayed on the y-axis is the standard deviation of within-country growth rates measured as deviations from country means over the sample period net of a global growth trend. These growth rates have been obtained from a panel regression of annual GDP growth on country fixed effects (to remove country averages) and year fixed effects (to remove global trends). The panel shows the difference in output volatility between low-reform (below median) years and high-reform (above median) years within countries. Lower panel. The panel shows the difference in the frequency of capital account crises (i.e., sudden stops in capital flows) between low-reform (below median) years and high-reform (above median) years within countries. The crises episodes were selected following the methodology in Chamon, Manasse, and Prati (2007).
0
1
2
3
4
5
Domestic financial sectorliberalization
Banking subindex Securities subindex External capital accountliberalizationLiberalization Indices
Out
put v
olat
ility
(sam
ple
std.
dev
. in
perc
enta
ge)
Domestic financial sector reforms are associated with lower output volatility.
0
1
2
3
4
5
6
Domestic financial sectorliberalization
Banking subindex Securities subindex External capital accountliberalizationLiberalization Indices
Cap
ital a
ccou
nt c
rise
s (s
ampl
e fr
eque
ncy
in p
erce
ntag
e)
Domestic financial sector reforms are associated with a lower incidence of capital account crises.
Liberalization Index Below Median Level Liberalization Index Above Median Level
11 In principle, while there may be a connection between real sector reforms and output volatility, the data do not speak loudly on such a linkage, hence the focus in this section on the association between financial sector liberalization and resilience to shocks.
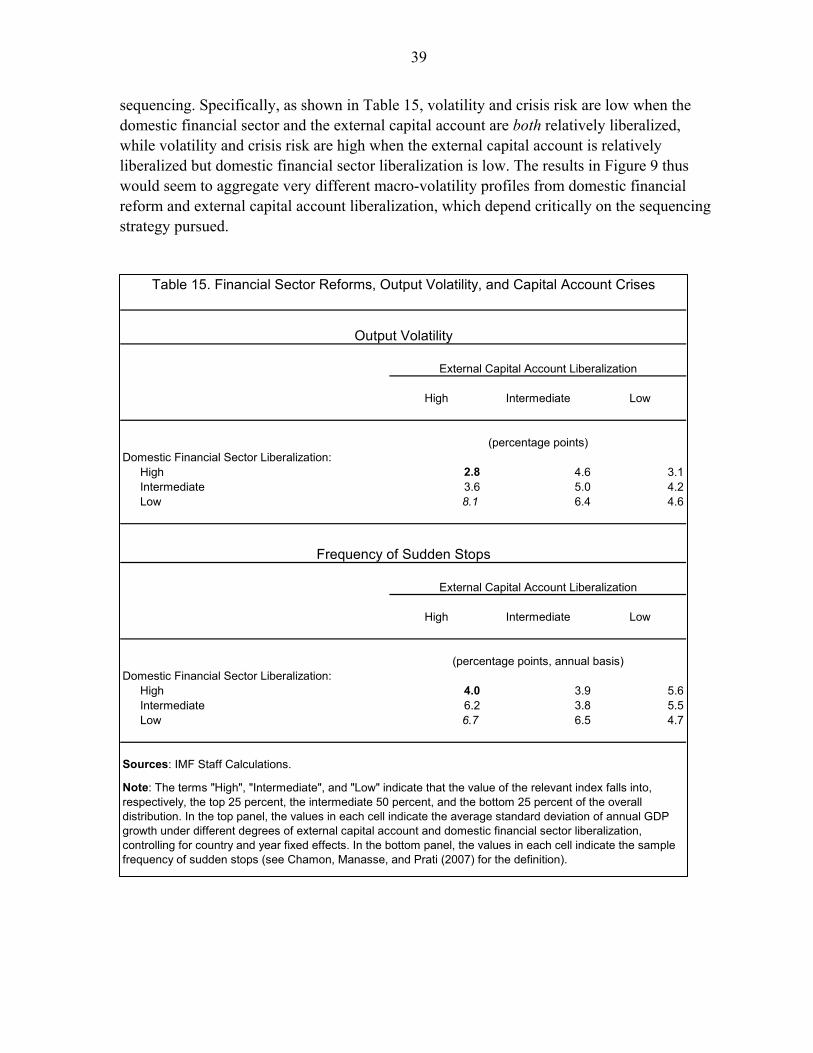
39
sequencing. Specifically, as shown in Table 15, volatility and crisis risk are low when the domestic financial sector and the external capital account are both relatively liberalized, while volatility and crisis risk are high when the external capital account is relatively liberalized but domestic financial sector liberalization is low. The results in Figure 9 thus would seem to aggregate very different macro-volatility profiles from domestic financial reform and external capital account liberalization, which depend critically on the sequencing strategy pursued.
High Intermediate Low
Domestic Financial Sector Liberalization:High 2.8 4.6 3.1Intermediate 3.6 5.0 4.2Low 8.1 6.4 4.6
High Intermediate Low
Domestic Financial Sector Liberalization:High 4.0 3.9 5.6Intermediate 6.2 3.8 5.5Low 6.7 6.5 4.7
Sources: IMF Staff Calculations.
Note: The terms "High", "Intermediate", and "Low" indicate that the value of the relevant index falls into, respectively, the top 25 percent, the intermediate 50 percent, and the bottom 25 percent of the overall distribution. In the top panel, the values in each cell indicate the average standard deviation of annual GDP growth under different degrees of external capital account and domestic financial sector liberalization, controlling for country and year fixed effects. In the bottom panel, the values in each cell indicate the sample frequency of sudden stops (see Chamon, Manasse, and Prati (2007) for the definition).
Table 15. Financial Sector Reforms, Output Volatility, and Capital Account Crises
External Capital Account Liberalization
(percentage points, annual basis)
Frequency of Sudden Stops
Output Volatility
External Capital Account Liberalization
(percentage points)

40
43. Figure 10 comes to the volatility issue from a different angle, by examining whether liberalization of the domestic financial sector helps to buffer economies against terms of trade shocks, a key source of volatility in low- and middle-income countries. Results suggest that, in countries with more liberalized domestic financial sectors, growth rebounds faster after a negative terms-of-trade shock (Figure 10). Results reported in Ramcharan (2008) suggest that the magnitude of the benefit from reform is substantial: after a decline in the terms of trade of 10 percentage points, a one standard deviation difference in the domestic financial sector liberalization index is associated with a cumulative income per capita growth that is 1.3 percentage points higher over a five year period. Sectoral evidence also suggests that, in countries with more liberalized domestic financial sectors, industries more exposed to terms of trade shocks—specifically those that use relatively more imported intermediate inputs in production—experience relatively smaller growth decelerations after a negative shock (Table 16). The enhanced resilience provided by domestic financial sector liberalization extends to a variety of other real shocks—such as windstorms, floods, and earthquakes (Ramcharan, 2007)—where greater credit availability provides a key channel buffering the aggregate output effects from such shocks. Domestic financial sector liberalization also enhances the resilience of the economy to financial shocks: after a 1 percentage point increase in foreign interest rates, economies that score at the 75th percentile on the banking sector competition subindex have a cumulative income per capita growth that is 3 percentage points higher over a five year period than economies at the median level of banking competition (Ramcharan, 2008). This buffering role of banking sector competition is likely to reflect risk diversification benefits from fewer restrictions on the number and geographical location of bank branches.
Figure 10. Terms-of-Trade Shocks and the Financial Sector
Source: IMF staff calculations. Notes: This figure plots median growth rates in the three years following a negative terms-of-trade shock. A negative terms-of-trade shock for each country is defined as a decline of one or more standard deviations in the growth in the terms of trade. The figure shows separately the growth rates for country-year pairs above and below the median level of banking sector liberalization. These growth rates have been obtained from a panel regression of annual GDP growth on country fixed effects (to remove country averages) and year fixed effects (to remove global trends).
0
0.5
1
1.5
2
2.5
T+1 T+2 T+3
GD
P pe
r cap
ita g
row
th (
perc
ent)
Countries Below Median Level of Banking Liberalization
Countries Above Median Level of Banking Liberalization
With a more liberalized domestic financial system, adverse terms of trade shocks are less costly in terms of foregone output.

Dep
ende
nt v
aria
ble:
cha
nge
in s
ecto
ral o
utpu
t gro
wth
in th
e th
ree
year
s fo
llow
ing
(1)
(2)
(3)
a te
rms-
of-tr
ade
shoc
k
Dom
estic
fina
ncia
l lib
. ind
ex in
tera
cted
with
a m
easu
re o
f im
porte
d in
put i
nten
sity
(t-3
)0.
181*
**0.
229*
**0.
183*
**(0
.056
)(0
.052
)(0
.059
)Pr
ivat
e cr
edit/
GD
P in
tera
cted
with
a m
easu
re o
f im
porte
d in
put i
nten
sity
(t-3
)-0
.068
(0.0
44)
Gro
wth
rate
of t
erm
s of
trad
e in
tera
cted
with
a m
easu
re o
f im
porte
d in
put i
nten
sity
(t)
-0.1
85(0
.56)
Log
outp
ut s
hare
(t-3
)-0
.006
-0.0
06-0
.006
(0.0
09)
(0.0
09)
(0.0
09)
Obs
erva
tions
995
978
995
R-s
quar
ed0.
130.
140.
13
Tabl
e 16
. Fin
anci
al S
ecto
r Ref
orm
s an
d R
esili
ence
to T
erm
s-of
-Tra
de S
hock
s
Sour
ces:
Sta
ff es
timat
es b
ased
on
the
GTA
P da
taba
se, a
nd A
biad
, Det
ragi
ache
and
Tre
ssel
(200
8); 2
006
UN
IDO
Indu
stria
l Sta
tistic
s D
atab
ase;
and
Wor
ld D
evel
opm
ent I
ndic
ator
s.
Not
es: T
he ta
ble
show
s re
gres
sion
s of
the
chan
ge in
sec
tora
l out
put g
row
th o
f man
ufac
turin
g in
dust
ries
in th
e th
ree
year
s fo
llow
ing
a te
rms-
of-tr
ade
shoc
k on
the
dom
estic
fina
ncia
l sec
tor l
iber
aliz
atio
n in
dex
inte
ract
ed w
ith a
mea
sure
of i
mpo
rted
inpu
t int
ensi
ty a
nd a
nu
mbe
r of c
ontro
ls. T
he in
tera
ctio
n te
rm c
aptu
res
the
diffe
rent
ial e
ffect
of d
omes
tic fi
nanc
ial s
ecto
r lib
eral
izat
ion
on th
e re
silie
nce
of
indu
strie
s th
at a
re re
lativ
ely
mor
e ex
pose
d to
sho
cks.
Ter
ms-
of-tr
ade
shoc
k ep
isod
es a
re d
efin
ed a
s ye
ars
with
a 1
0 pe
rcen
tage
poi
nt
or g
reat
er a
nnua
l dro
p in
the
term
s of
trad
e. T
he fi
rst c
olum
n sh
ows
the
base
line
regr
essi
on, t
he s
econ
d an
d th
ird c
olum
ns s
how
that
re
sults
are
robu
st w
hen
cont
rollin
g fo
r int
erac
tions
of t
he m
easu
re o
f im
porte
d in
put i
nten
sity
with
, res
pect
ivel
y, th
e pr
ivat
e cr
edit-
to-
GD
P ra
tio a
nd th
e in
tens
ity o
f the
term
s-of
-trad
e sh
ock.
All
regr
essi
ons
wer
e es
timat
ed u
sing
OLS
and
incl
ude
coun
try, i
ndus
try, a
nd
year
dum
mie
s. R
obus
t sta
ndar
d er
rors
, clu
ster
ed a
t the
cou
ntry
-yea
r lev
el, a
re in
par
enth
eses
. ***
, ** a
nd *
indi
cate
sta
tistic
al
sign
ifica
nce
at th
e 1,
5, a
nd 1
0 pe
rcen
t lev
el, r
espe
ctiv
ely.
Rob
ustn
ess:
Rob
ustn
ess
chec
ks in
clud
ed c
ontro
lling
for a
n in
tera
ctio
n te
rm b
etw
een
the
mea
sure
of i
mpo
rted
inpu
t int
ensi
ty a
nd (i
) in
dica
tors
of t
rade
libe
raliz
atio
n; (i
i) th
e ov
eral
l lev
el o
f dev
elop
men
t (re
al G
DP
per c
apita
); (ii
i) an
indi
cato
r var
iabl
e fo
r the
type
of l
egal
sy
stem
(com
mon
law
or c
ivil
law
); (iv
) an
indi
cato
r of c
ontra
ct e
nfor
cem
ent;
and
(v) i
ndic
ator
s of
pro
perty
righ
ts. A
com
plet
e se
t of
resu
lts is
repo
rted
in T
ress
el, T
., 20
08. "
Unb
undl
ing
the
Effe
cts
of R
efor
ms"
, mim
eo IM
F (p
aper
ava
ilabl
e at
: ht
tp://
ww
w.im
f.org
/Ext
erna
l/NP/
sem
inar
s/en
g/20
08/s
trure
form
/inde
x.ht
m )
41

42
VII. CONCLUSIONS
44. Maintaining sound economic growth, together with broad financial stability, is a perennial challenge for policymakers in developed and developing countries alike, and understanding the role that structural reforms may play in meeting this challenge remains a central element of surveillance for all segments of the Fund’s membership. This paper has sought to draw lessons from the cross-country experience on structural reform, so as to strengthen the underpinnings of Fund policy advice and surveillance across the membership.
45. Past analyses of structural reforms have mainly focused on industrial countries, for which indicators of structural reform liberalization are readily available, or on selected groups of countries or regions of the world. In contrast, the present study rests on a new dataset, which includes comparable indicators of structural reforms for 91 developing, emerging-market, and advanced economies over the past three decades, as well as an extensive coverage of different economic sectors. The broad cross-country and cross-sectoral approach is essential for drawing policy lessons across different segments of the Fund’s membership, and for addressing empirically issues related to policy sequencing.
46. With respect to the causes of structural reform, the empirical analysis suggests that the quality of broad institutions initially spurred liberalization among advanced economies, but that, as cross-country reform gaps—either with respect to reform “leaders” or with respect to reformist “neighbors”— emerged, a catch-up effect led to subsequent reform in developing countries. There is also evidence that IMF-supported programs and, for some sectors, economic crises, have been a catalyst for reform.
47. Real and financial sector reforms have helped to boost economic growth in both developed and developing countries, with domestic financial sector liberalization, trade liberalization, and liberalization of the agricultural sector exerting particularly favorable effects. The channels through which growth effects operate include greater availability of credit and FDI inflows; and improvements in allocative efficiency, which have acted to boost growth particularly in firms and sectors heavily dependent on imported intermediate inputs and external sources of financing. The implementation of structural reforms has also tended to enhance the assessment of the future profitability and solvency of domestic firms, as reflected in credit ratings, with a corresponding reduction in borrowing costs for domestic firms and banks following liberalization.
48. The nature of the reform sequencing strategy pursued affects the size of the ensuing growth benefits. The cross-country evidence strongly suggests that economies that liberalize trade before the external capital account grow more rapidly than those that follow the reverse sequence, and that a “trade-first” strategy yields better growth results than a “big bang” approach under which liberalization is pursued simultaneously across all sectors. While there is no evidence that the sequencing of domestic financial sector and external capital account liberalization has a significant impact on growth outcomes, the stability benefits—both in

43
terms of macroeconomic volatility and crisis propensity—are more favorable when the domestic financial sector is liberalized before the external capital account.
49. Domestic financial sector reforms also enhance the way in which economies respond to various real and financial shocks, as financial reforms reduce the output costs from adverse terms of trade and foreign interest rate shocks, with a variety of mechanisms—especially improvements in credit availability—playing a key role. The greater resilience to real shocks in economies with more liberalized financial sectors is evidence of how such reforms can strengthen economy-wide real-financial linkages.
50. The evidence presented in this paper—given its broad country, time, and sectoral coverage—should help to strengthen the cross-country perspective in bilateral surveillance on the role of structural policies in fostering sound medium-run growth-cum-stability in member countries. The results highlight the growth benefits of a reform strategy that relies on early trade liberalization and, in the context of a relatively open trade regime, accelerates the process of liberalizing both the domestic financial sector and the external capital account. The paper also highlights that, as long as the domestic financial sector is reformed before opening the capital account, structural reform can enhance growth opportunities without raising macroeconomic volatility or crisis risks. Appropriately sequenced structural reforms, thus, seem to improve the growth-volatility frontier for the economy, rather than simply engendering a move along the existing frontier.

44
Low Income Middle Income High Income Bangladesh Albania AustraliaBurkina Faso Algeria AustriaCôte d'Ivoire Argentina BelgiumEthiopia Azerbaijan CanadaGhana Belarus Czech RepublicIndia Bolivia DenmarkKenya Brazil EstoniaMadagascar Bulgaria FinlandMozambique Cameroon FranceNepal Chile GermanyNigeria China GreecePakistan Colombia Hong Kong SARSenegal Costa Rica IrelandTanzania Dominican Republic IsraelUganda Ecuador ItalyUzbekistan Egypt, Arab Rep. JapanVietnam El Salvador Korea, Rep.Zimbabwe Georgia Netherlands
Guatemala New ZealandHungary NorwayIndonesia PortugalJamaica SingaporeJordan SpainKazakhstan SwedenLatvia SwitzerlandLithuania Taiwan Province of ChinaMalaysia United KingdomMexico United StatesMoroccoNicaraguaParaguayPeruPhilippinesPolandRomaniaRussian FederationSouth AfricaSri LankaThailandTunisiaTurkeyUkraineUruguayVenezuela, Rep. Bolivariana
Source: World Bank
Appendix Table 1: List of Economies in the Sample

Star
t Yea
rEn
d Ye
ar
MIN
# o
f C
ount
ries
in
any
Year
MA
X #
of
Cou
ntrie
s in
an
y Ye
ar
Fina
ncia
l Sec
tor
The
inde
x of
dom
estic
fina
ncia
l lib
eral
izat
ion
is a
n av
erag
e of
six
su
bind
ices
. Fiv
e of
them
rela
te to
ban
king
: (i)
inte
rest
rate
con
trols
, suc
h as
floo
rs o
r cei
lings
; (ii)
cre
dit c
ontro
ls, s
uch
as d
irect
ed c
redi
t and
su
bsid
ized
lend
ing;
(iii)
com
petit
ion
rest
rictio
ns, s
uch
as li
mits
on
bran
ches
an
d en
try b
arrie
rs in
the
bank
ing
sect
or, i
nclu
ding
lice
nsin
g re
quire
men
ts
or li
mits
on
fore
ign
bank
s; (i
v) th
e de
gree
of s
tate
ow
ners
hip;
and
(v) t
he
qual
ity o
f ban
king
sup
ervi
sion
and
regu
latio
n, in
clud
ing
pow
er o
f in
depe
nden
ce o
f ban
k su
perv
isor
s, a
dopt
ion
of B
asel
cap
ital s
tand
ards
, an
d a
fram
ewor
k fo
r ban
k in
spec
tions
.
Abia
d an
d ot
hers
(200
8), f
ollo
win
g th
e m
etho
dolo
gy in
Abi
ad a
nd M
ody
(200
5), b
ased
on
vario
us IM
F re
ports
an
d w
orki
ng p
aper
s, c
entra
l ban
k w
ebsi
tes,
and
oth
ers.
1973
2005
7291
The
sixt
h su
bind
ex re
late
s to
sec
uriti
es m
arke
tsan
d co
vers
pol
icie
s to
de
velo
p do
mes
tic b
ond
and
equi
ty m
arke
ts, i
nclu
ding
(i) t
he c
reat
ion
of
basi
c fra
mew
orks
suc
h as
the
auct
ioni
ng o
f T-b
ills,
or t
he e
stab
lishm
ent o
f a
secu
rity
com
mis
sion
; (ii)
pol
icie
s to
furth
er e
stab
lish
secu
ritie
s m
arke
ts
such
as
tax
exem
ptio
ns, i
ntro
duct
ion
of m
ediu
m a
nd lo
ng-te
rm g
over
nmen
t bo
nds
to e
stab
lish
a be
nchm
ark
for t
he y
ield
cur
ve, o
r the
intro
duct
ion
of a
pr
imar
y de
aler
sys
tem
; (iii
) pol
icie
s to
dev
elop
der
ivat
ive
mar
kets
or t
o cr
eate
an
inst
itutio
nal i
nves
tor's
bas
e; a
nd (d
) pol
icie
s to
per
mit
acce
ss to
th
e do
mes
tic s
tock
mar
ket b
y no
nres
iden
ts. T
he s
ubin
dice
s ar
e ag
greg
ated
with
equ
al w
eigh
ts. E
ach
subi
ndex
is c
oded
from
zer
o (fu
lly
repr
esse
d) to
thre
e (fu
lly li
bera
lized
).
Ext
erna
l Cap
ital A
ccou
nt L
iber
aliz
atio
n:
Agg
rega
teQ
ualit
ativ
e in
dica
tors
of r
estri
ctio
ns o
n fin
anci
al c
redi
ts a
nd p
erso
nal
capi
tal t
rans
actio
ns o
f res
iden
ts a
nd fi
nanc
ial c
redi
ts to
non
resi
dent
s, a
s w
ell a
s th
e us
e of
mul
tiple
exc
hang
e ra
tes.
Inde
x co
ded
from
zer
o (fu
lly
repr
esse
d) to
thre
e (fu
lly li
bera
lized
).
Abia
d an
d ot
hers
(200
8), f
ollo
win
g th
e m
etho
dolo
gy in
Abi
ad a
nd M
ody
(200
5), b
ased
on
vario
us IM
F re
ports
an
d w
orki
ng p
aper
s, c
entra
l ban
k w
ebsi
tes,
and
oth
ers.
1973
2005
7291
Ext
erna
l Cap
ital A
ccou
nt L
iber
aliz
atio
n:
Res
iden
ts v
s. N
onre
side
nts
Indi
cato
rs m
easu
ring
the
inte
nsity
of l
egal
rest
rictio
ns o
n re
side
nts'
re
spec
tivel
y no
nres
iden
ts' a
bilit
y to
mov
e ca
pita
l int
o an
d ou
t of a
cou
ntry
. In
dex
orig
inal
ly c
oded
from
zer
o (fu
lly re
pres
sed)
to 5
0 (fu
lly li
bera
lized
).
Base
d on
the
met
hodo
logy
in Q
uinn
(1
997)
and
Qui
nn a
nd T
oyod
a (2
007)
, dra
win
g on
info
rmat
ion
cont
aine
d in
the
Fund
's A
RE
AER
.
1960
2005
5065
Appe
ndix
Tab
le 2
: Des
crip
tion
of R
efor
m In
dice
s
Ref
orm
Indi
ces
Des
crip
tion
Sour
ce
Cov
erag
e
Dom
estic
Fin
anci
al S
ecto
r Lib
eral
izat
ion
45

Star
t Yea
rEn
d Ye
ar
MIN
# o
f C
ount
ries
in
any
Year
MA
X #
of
Cou
ntrie
s in
an
y Ye
arR
eal S
ecto
rTr
ade
Libe
raliz
atio
nTa
riff R
ates
Ave
rage
tarif
f rat
es, w
ith m
issi
ng v
alue
s ex
trapo
late
d us
ing
impl
icit
wei
ghte
d ta
riff r
ates
. Ind
ex n
orm
aliz
ed to
be
betw
een
zero
and
uni
ty: z
ero
mea
ns th
e ta
riff r
ates
are
60
perc
ent o
r hig
her,
whi
le u
nity
mea
ns th
e ta
riff
rate
s ar
e ze
ro.
Vario
us s
ourc
es, i
nclu
ding
IMF,
W
orld
Ban
k, W
TO, U
N, a
nd th
e ac
adem
ic li
tera
ture
(par
ticul
arly
C
lem
ens
and
Will
amso
n, 2
004)
.
1960
2005
4714
2
Cur
rent
-Acc
ount
Res
trict
ions
An
indi
cato
r of h
ow c
ompl
iant
a g
over
nmen
t is
with
its
oblig
atio
ns u
nder
th
e IM
F’s
Artic
le V
III to
free
from
gov
ernm
ent r
estri
ctio
n th
e pr
ocee
ds fr
om
inte
rnat
iona
l tra
de in
goo
ds a
nd s
ervi
ces.
The
inde
x re
pres
ents
the
sum
of
two
sub-
com
pone
nts,
dea
ling
with
rest
rictio
ns o
n tra
de in
vis
ible
s, a
s w
ell
as in
invi
sibl
es (f
inan
cial
and
oth
er s
ervi
ces)
. It d
istin
guis
hes
betw
een
rest
rictio
ns o
n re
side
nts
(rece
ipts
for e
xpor
ts) a
nd o
n no
n-re
side
nts
(pay
men
ts fo
r im
ports
). Al
thou
gh th
e in
dex
mea
sure
s re
stric
tions
on
the
proc
eeds
from
tran
sact
ions
, rat
her t
han
on th
e un
derly
ing
trans
actio
ns,
man
y co
untri
es in
pra
ctic
e us
e re
stric
tions
on
trade
pro
ceed
s as
a ty
pe o
f tra
de re
stric
tion.
The
inde
x is
sco
red
betw
een
zero
and
8 in
hal
f-int
eger
un
its, w
ith 8
indi
catin
g fu
ll co
mpl
ianc
e.
Base
d on
the
met
hodo
logy
in Q
uinn
(1
997)
and
Qui
nn a
nd T
oyod
a (2
007)
, dra
win
g on
info
rmat
ion
cont
aine
d in
the
Fund
's A
RE
AER
.
1960
2005
5065
Pro
duct
Mar
kets
Tele
com
s an
d El
ectri
city
Indu
strie
sS
impl
e av
erag
e of
the
elec
trici
ty a
nd te
leco
m m
arke
ts s
ub-in
dice
s, w
hich
ar
e co
nstru
cted
, in
turn
, fro
m s
core
s al
ong
thre
e di
men
sion
s. F
or
elec
trici
ty, t
hey
capt
ure:
(i) t
he d
egre
e of
unb
undl
ing
of g
ener
atio
n,
trans
mis
sion
, and
dis
tribu
tion;
(ii)
whe
ther
a re
gula
tor o
ther
than
go
vern
men
t has
bee
n es
tabl
ishe
d; a
nd (i
ii) w
heth
er th
e w
hole
sale
mar
ket
has
been
libe
raliz
ed.
For t
elec
om, t
hey
capt
ure:
(i) t
he d
egre
e of
co
mpe
titio
n in
loca
l ser
vice
s; (i
i) w
heth
er a
regu
lato
r oth
er th
an
gove
rnm
ent h
as b
een
esta
blis
hed;
and
(iii)
the
degr
ee o
f lib
eral
izat
ion
of
inte
rcon
nect
ion
chan
ges.
Ind
ices
are
cod
ed w
ith v
alue
s ra
ngin
g fro
m z
ero
(not
libe
raliz
ed) t
o tw
o (c
ompl
etel
y lib
eral
ized
).
Base
d on
var
ious
exi
stin
g st
udie
s an
d da
tase
ts a
s w
ell a
s na
tiona
l le
gisl
atio
n an
d ot
her o
ffici
al
docu
men
ts.
1960
2003
106
108
Agric
ultu
reTh
e in
dex
capt
ures
inte
rven
tion
in th
e m
arke
t for
the
mai
n ag
ricul
tura
l ex
port
com
mod
ity in
eac
h co
untry
. As
data
lim
itatio
ns p
recl
ude
codi
ng
sepa
rate
dim
ensi
ons
of in
terv
entio
n, th
e in
dex
prov
ides
a s
umm
ary
mea
sure
. Eac
h co
untry
-yea
r pai
r can
take
four
val
ues:
(i) z
ero
(pub
lic
mon
opol
y or
mon
opso
ny in
pro
duct
ion,
tran
spor
tatio
n, o
r mar
ketin
g, e
.g.,
expo
rt m
arke
ting
boar
ds);
(ii) o
ne-th
ird (a
dmin
iste
red
pric
es);
(iii)
two-
third
s (p
ublic
ow
ners
hip
of re
leva
nt p
rodu
cers
or c
once
ssio
n re
quire
men
ts);
and
(iv) o
ne (n
o pu
blic
inte
rven
tion)
.
Base
d on
IMF
com
mod
ities
dat
a,
vario
us e
xist
ing
stud
ies
and
data
sets
, and
nat
iona
l leg
isla
tion
and
othe
r offi
cial
doc
umen
ts.
1960
2003
9610
4
Appe
ndix
Tab
le 2
(con
clud
ed):
Des
crip
tion
of R
efor
m In
dice
s
Ref
orm
Indi
ces
Des
crip
tion
Sour
ce
Cov
erag
e
46

47
REFERENCES
Abiad, Abdul, Enrica Detragiache, and Thierry Tressel, 2008, “Do Financial Reforms Boost the Development of Financial Systems? Evidence from a New Database on Financial Reforms,” forthcoming IMF working paper.
Abiad, Abdul, and Ashoka Mody, 2005, “Financial Reform: What Shakes it? What Shapes
it?” American Economic Review, Vol. 95, No.1, pp. 66–88(23). Antoshin, Sergei, Andrew Berg, and Marcos Souto, 2008, “Testing for Structural Breaks in
Small Samples,” IMF Working Paper 08/75 (Washington: International Monetary Fund).
Barro, Robert J., and Jong-Wha Lee, 2005, “IMF Programs: Who Is Chosen and What Are
the Effects?” Journal of Monetary Economics, Vol. 7, pp. 1245–69.
Bekaert, Geert, Campbell R. Harvey, and Christian Lundblad, 2005, “Does Financial Liberalization Spur Growth?” Journal of Financial Economics, Vol. 77, No. 1, pp. 3-55.
Bhattacharya, Rina, 1997, “Pace, Sequencing and Credibility of Structural Reforms,” World
Development, Vol. 25, No.7, pp.1045–61.
Berg, Andrew, Jonathan D. Ostry, and Jeromin Zettelmeyer, “What Makes Growth Sustained,” IMF Working Paper 08/59 (Washington: International Monetary Fund).
Chamon, Marcos Paolo Manasse, and Alessandro Prati, 2007, “Can We Predict the Next
Capital Account Crisis?” IMF Staff Papers, Vol. 54, No. 2, pp. 270–305. Clemens, Michael A., and Jeffrey G. Williamson, 2004, "Why Did the Tariff-Growth
Correlation Reverse after 1950?" Journal of Economic Growth, Vol. 9, No. 1, pp. 5-46
Conway, Paul, and Giuseppe Nicoletti, 2006, “Product Market Regulation in the Non-Manufacturing Sectors of OECD Countries: Measurement and Highlights,” OECD Economics Department Working Papers No. 530.
Dollar, David, and Aart Kraay, 2004, “Trade, Growth, and Poverty,” Economic Journal, Vol. 114, pp. F22–F49.
Easterly, W., 2005, "National Policies and Economic Growth: A Reappraisal," in P. Aghion and S. Durlauf, eds., Handbook of Economic Growth Ch.15, Elsevier, Amsterdam.

48
Fiori, Giuseppe, Giuseppe Nicoletti, Stefano Scarpetta and Fabio Schiantarelli, 2007, “Employment Outcomes and the Interaction Between Product and Labor Market Deregulation: Are They Substitutes or Complements?” IZA DP No. 2770.
Frankel, Jeffrey and David Romer, 1999, "Does Trade Cause Growth?" American Economic
Review Vol. 89, no. 3, June, pp. 379–99. Ghosh, Atish, Charis Christofides, Jun Kim, Laura Papi, Uma Ramakrishnan, Alun Thomas,
and Juan Zalduendo, 2005, “The Design of IMF-Supported Programs,” IMF Occasional Paper No. 241 (Washington: International Monetary Fund).
Henry, Peter Blair, 2007, “Capital Account Liberalization: Theory, Evidence, and
Speculation,” Journal of Economic Literature, Vol. 45, pp. 887–935. Høj, Jens, and others, 2006, “The Political Economy of Structural Reform: Empirical
Evidence from OECD Countries,” Economic Department Working Paper No. 501 (Paris: OECD).
International Monetary Fund, 2004, World Economic Outlook, April 2004: Advancing Structural Reforms.
———, 2007, “Reaping the Benefits of Financial Globalization,” (Washington: International Monetary Fund). http://www.imf.org/external/np/res/docs/2007/0607.htm
Kaufmann, Daniel, Aart Kraay, and Pablo Zoido-Lobatón, 2002, “Governance Matters II—
Updated Indicators for 2000/01,” World Bank Policy Research Department Working Paper No. 2772, Washington D.C.
Kroszner, Randall, Luc Laeven and Daniela Klingebiel, 2007, “Banking Crises, Financial Dependence, and Growth,” Journal of Financial Economics, Vol. 84, No. 1, pp. 187–228.
Krueger, Anne O., Maurice W. Schiff, Alberto Valdès, (eds.), 1992, “The Political Economy of Agricultural Pricing Policy,” (Baltimore: Johns Hopkins University Press).
Krueger, Anne O., 1997, “Trade Policy and Economic Development: How We Learn” The
American Economic Review, Vol. 87, No. 1 (Mar., 1997), pp. 1–22. Levine, Ross, 2005, “Law, Endowments, and Property Rights,” Journal of Economic
Perspectives, Vol. 19, No. 3 (Summer), pp. 61–88. McKinnon, Ronald I., 1973, Money and Capital in Economic Development (Washington:
Brookings Institution).

49
Nicoletti, Giuseppe, and Stefano Scarpetta, 2003, “Regulation, Productivity and Growth: OECD Evidence,” Economic Policy, Vol. 18, pp. 19–72.
Pritchett, Lant, 2000, “Understanding Patterns of Economic Growth: Searching for Hills
Amongst Plateaus, Mountains, and Plains.” World Bank Economic Review, Vol. 14, pp. 221–50.
Quinn, Dennis P., 1997, “The Correlates of Change in International Financial Regulation,”
American Political Science Review, Vol. 91, pp. 531–51. Quinn, Dennis P., and A. Maria Toyoda, “Does Capital Account Liberalization Lead to
Economic Growth?” Forthcoming. Review of Financial Studies.
Rajan, Raghuram, and Luigi Zingales, 1998, “Financial Dependence and Growth,” American Economic Review, Vol.88, No. 3, pp. 559–86.
———, 2003, “The Great Reversals: The Politics of Financial Development in the Twentieth
Century,” Journal of Financial Economics, Vol. 69, pp. 5–50.
Ramcharan, Rodney, 2007, “Does the Exchange Rate Regime Matter for Real Shocks? Evidence from Windstorms and Earthquakes,” Journal of International Economics, Vol. 73, pp. 31–47.
———, 2008, “Bank Competition and the Real Cost of Interest Rate Movements,” forthcoming IMF working paper.
Rodrik, D., 2006, “Goodbye Washington Consensus, Hello Washington Confusion,” Journal of Economic Literature, Vol. 44, No. 4, December 2006 , pp. 973–87.
Sachs, J.D., and A. M. Warner, 1995, “Economic Convergence and Economic Policies,” Brookings Papers in Economic Activity, Vol. 1, pp. 1–95.
Schindler, Martin, 2008, “Measuring Financial Integration: A New Dataset,” IMF Staff Papers, forthcoming.
Wacziarg, Romain, and Karen Horn Welch, 2008, “Trade Liberalization and Growth: New Evidence" forthcoming, World Bank Economic Review.
Williamson, John, and Molly Mahar, 1998,"A Survey of Financial Liberalization", Essays in International Finance, International Finance Section, Department of Economics, Princeton University.
Zalduendo, Juan, 2005, “Pace and Sequencing of Economic Policies,” IMF Working Paper 05/118 (Washington: International Monetary Fund).