Embed Size (px)
Citation preview
5 Amino Acids, Peptides, and Proteins6 The Three-Dimensional Structure of Proteins7 Protein Function8 Enzymes9 Carbohydrates and Glycobiology
10 Nucleotides and Nucleic Acids11 Lipids12 Biological Membranes and Transport13 Biosignaling
In Part I we contrasted the complex structure and function of living cellswith the relative simplicity of the monomeric units from which the macro-molecules, supramolecular complexes, and organelles of the cells are con-structed. Part II is devoted to the structure and function of the majorclasses of cellular constituents: amino acids and proteins (Chapters 5through 8), sugars and polysaccharides (Chapter 9), nucleotides and nu-cleic acids (Chapter 10), fatty acids and lipids (Chapter 11), and, finally,membranes and membrane signaling proteins (Chapters 12 and 13). Webegin in each case by considering the covalent structure of the simplesubunits (amino acids, monosaccharides, nucleotides, and fatty acids).These subunits are a major part of the language of biochemistry; familiaritywith them is a prerequisite for understanding more advanced topics cov-ered in this book, as well as the rapidly growing and exciting literature ofbiochemistry.
After describing the covalent chemistry of the monomeric units, weconsider the structure of the macromolecules and supramolecular com-plexes derived from them. An overriding theme is that the polymericmacromolecules in living systems, though large, are highly ordered chemi-cal entities, with specific sequences of monomeric subunits giving rise todiscrete structures and functions. This fundamental theme can be brokendown into three interrelated principles: (1) the unique structure of eachmacromolecule determines its function; (2) noncovalent interactions play acritical role in the structure and thus the function of macromolecules; and(3) the monomeric subunits in polymeric macromolecules occur in specificsequences, representing a form of information upon which the orderedliving state depends.
The relationship between structure and function is especially evident inproteins, which exhibit an extraordinary diversity of functions. One partic-ular polymeric sequence of amino acids produces a strong, fibrous structure
113
Structure and Catalysis
part
II
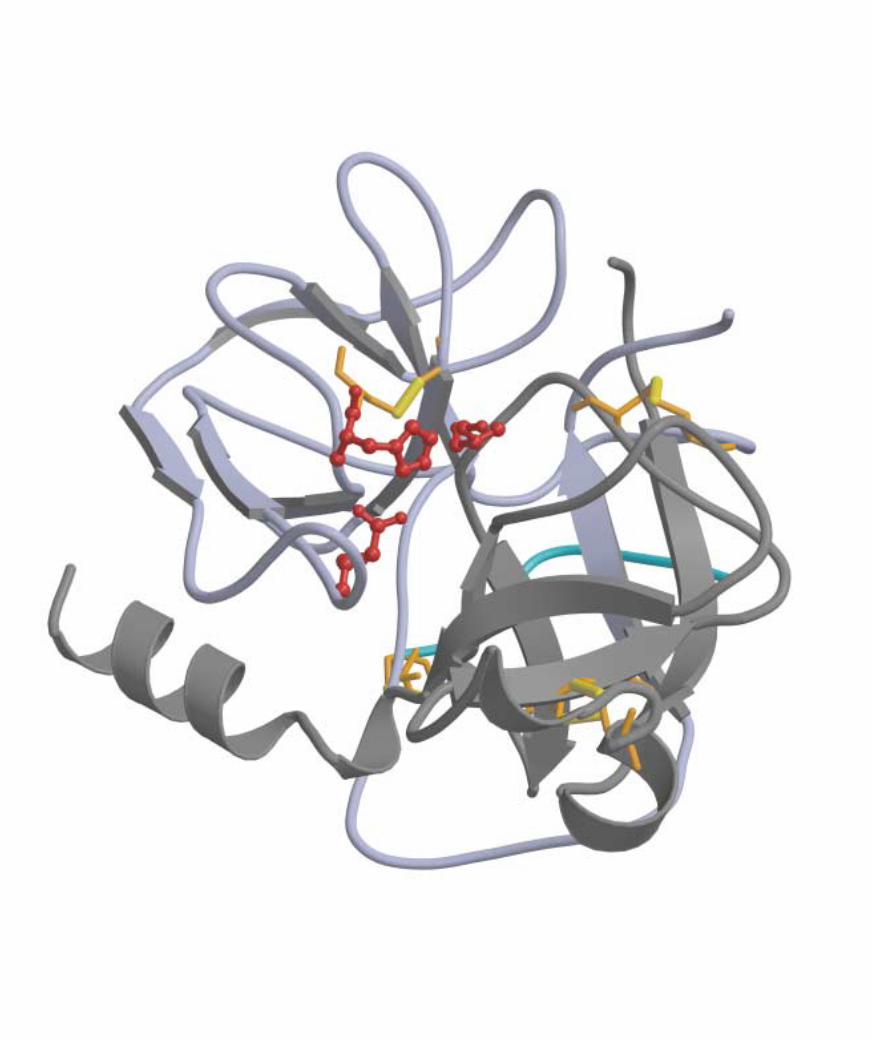
facing pageA view of the enzyme chymotrypsin, one of the best-understood biological catalysts.
114 Part II Structure and Catalysis
found in hair and wool; another produces a protein that transports oxygenin the blood; a third binds other proteins and catalyzes the cleavage of thebonds between their amino acids. Similarly, the special functions of poly-saccharides, nucleic acids, and lipids can be understood as a direct mani-festation of their chemical structure, with their characteristic monomericsubunits linked in precise functional polymers. Sugars linked together be-come energy stores and structural fibers; nucleotides strung together inDNA or RNA provide the blueprint for an entire organism; and aggregatedlipids form membrane bilayers. Chapter 13 unifies the discussion of biomol-ecule function, describing how specific signaling systems regulate the ac-tivities of biomolecules within a cell and between organs to keep an organ-ism in homeostasis.
As we move from monomeric units to larger and larger polymers, thechemical focus shifts from covalent bonds to noncovalent interactions. Theproperties of covalent bonds, both in the monomeric units and in the bondsthat connect them in polymers, place constraints on the shapes assumed bylarge molecules. It is the numerous noncovalent interactions, however, thatdictate the stable native conformations of large molecules while permittingthe flexibility necessary for their biological function. We will see that non-covalent interactions are essential to the catalytic power of enzymes, thecritical interaction of complementary base pairs in nucleic acids, thearrangement and properties of lipids in membranes, and the interaction ofa hormone or growth factor with its membrane receptor.
The principle that sequences of monomeric subunits are information-rich emerges fully in the discussion of nucleic acids in Chapter 10. However,proteins and some short polymers of sugars (oligosaccharides) are also information-rich molecules. The amino acid sequence is a form of informa-tion that directs the folding of the protein into its unique three-dimensionalstructure, and ultimately determines the function of the protein. Someoligosaccharides also have unique sequences and three-dimensional struc-tures that are recognized by other macromolecules.
For each class of molecules we find a similar structural hierarchy, inwhich subunits of fixed structure are connected by bonds of limited flexi-bility to form macromolecules with three-dimensional structures deter-mined by noncovalent interactions. These macromolecules then interact toform the supramolecular structures and organelles that allow a cell to carryout its many metabolic functions. Together, the molecules described in PartII are the “stuff” of life. We begin with the amino acids and proteins.
115
Amino Acids, Peptides, and Proteins
Proteins are the most abundant biological macromolecules, occurring in allcells and all parts of cells. Proteins also occur in great variety; thousands ofdifferent kinds, ranging in size from relatively small peptides to huge poly-mers with molecular weights in the millions, may be found in a single cell.Moreover, proteins exhibit enormous diversity of biological function and arethe most important final products of the information pathways discussed inPart IV of this book. Proteins are the molecular instruments through whichgenetic information is expressed. It is appropriate to begin our study of biological macromolecules with the proteins, whose name derives from theGreek protos, meaning “first” or “foremost.”
Relatively simple monomeric subunits provide the key to the structureof the thousands of different proteins. All proteins, whether from the mostancient lines of bacteria or from the most complex forms of life, are con-structed from the same ubiquitous set of 20 amino acids, covalently linkedin characteristic linear sequences. Because each of these amino acids has aside chain with distinctive chemical properties, this group of 20 precursormolecules may be regarded as the alphabet in which the language of proteinstructure is written.
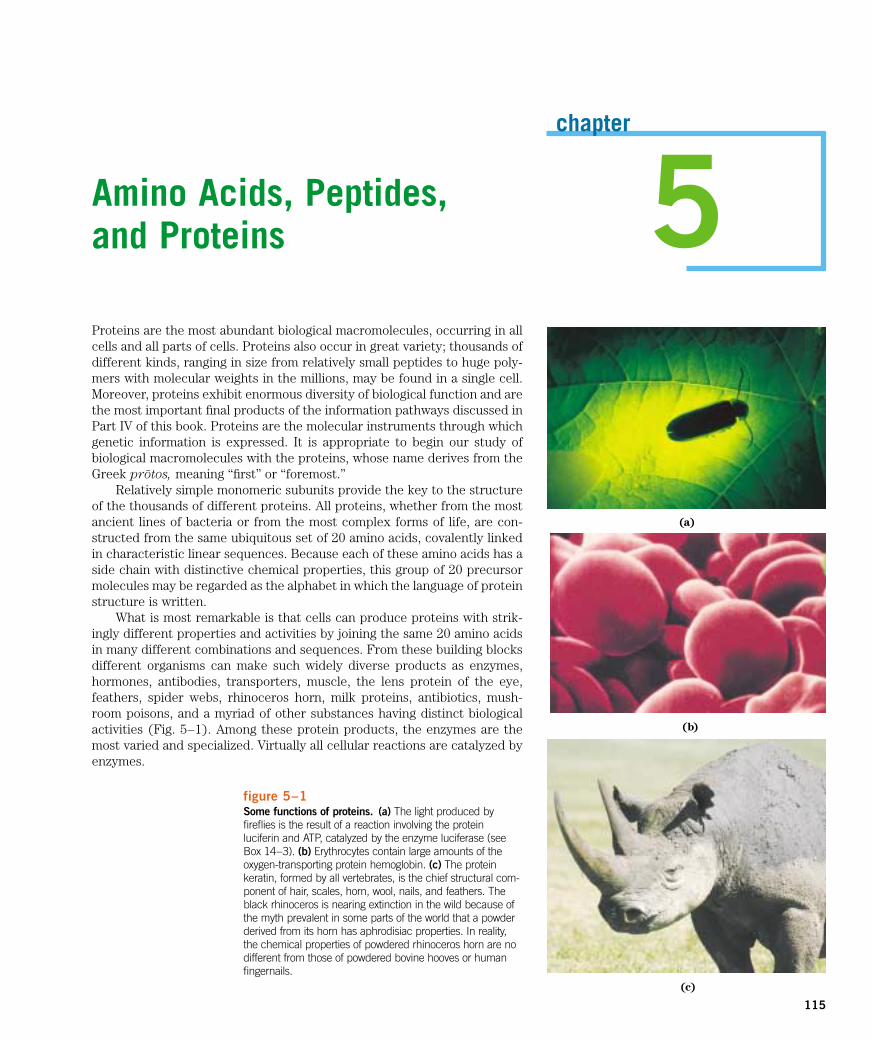
What is most remarkable is that cells can produce proteins with strik-ingly different properties and activities by joining the same 20 amino acidsin many different combinations and sequences. From these building blocksdifferent organisms can make such widely diverse products as enzymes,hormones, antibodies, transporters, muscle, the lens protein of the eye,feathers, spider webs, rhinoceros horn, milk proteins, antibiotics, mush-room poisons, and a myriad of other substances having distinct biologicalactivities (Fig. 5–1). Among these protein products, the enzymes are themost varied and specialized. Virtually all cellular reactions are catalyzed byenzymes.
chapter
5
(a)
(b)
(c)
figure 5–1Some functions of proteins. (a) The light produced by fireflies is the result of a reaction involving the proteinluciferin and ATP, catalyzed by the enzyme luciferase (seeBox 14–3). (b) Erythrocytes contain large amounts of theoxygen-transporting protein hemoglobin. (c) The proteinkeratin, formed by all vertebrates, is the chief structural com-ponent of hair, scales, horn, wool, nails, and feathers. Theblack rhinoceros is nearing extinction in the wild because ofthe myth prevalent in some parts of the world that a powderderived from its horn has aphrodisiac properties. In reality,the chemical properties of powdered rhinoceros horn are nodifferent from those of powdered bovine hooves or humanfingernails.
(b)
(c)
(a)
116 Part II Structure and Catalysis
Protein structure and function are the topics of this and the next threechapters. We begin with a description of the fundamental chemical proper-ties of amino acids, peptides, and proteins.
Amino AcidsProteins are dehydration polymers of amino acids, with each amino acid
residue joined to its neighbor by a specific type of covalent bond. (Theterm “residue” reflects the loss of the elements of water when one aminoacid is joined to another.) Proteins can be broken down (hydrolyzed) totheir constituent amino acids by a variety of methods, and the earliest stud-ies of proteins naturally focused on the free amino acids derived from them.The first to be discovered was asparagine, in 1806. The last of the 20 to befound, threonine, was not identified until 1938. All the amino acids havetrivial or common names, in some cases derived from the source from whichthey were first isolated. Asparagine was first found in asparagus, and gluta-mate in wheat gluten; tyrosine was first isolated from cheese (its name isderived from the Greek tyros, “cheese”); and glycine (Greek glykos,
“sweet”) was so named because of its sweet taste.
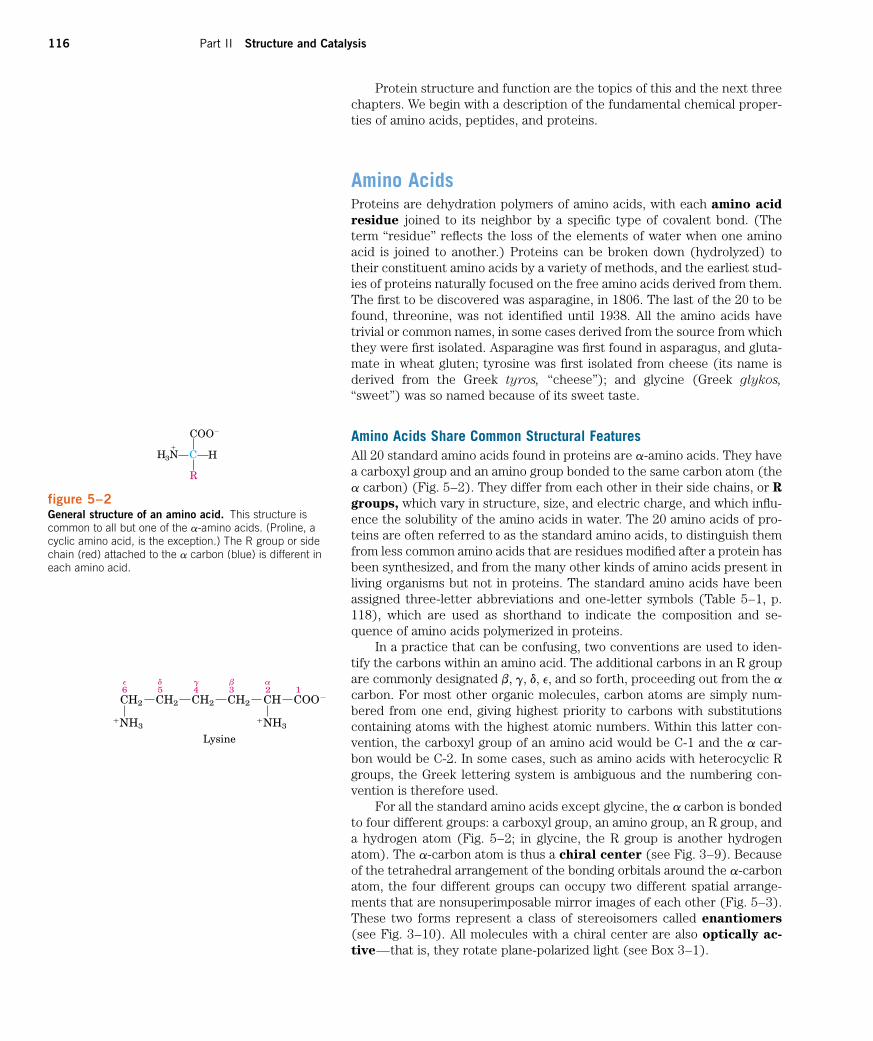
Amino Acids Share Common Structural FeaturesAll 20 standard amino acids found in proteins are a-amino acids. They havea carboxyl group and an amino group bonded to the same carbon atom (thea carbon) (Fig. 5–2). They differ from each other in their side chains, or Rgroups, which vary in structure, size, and electric charge, and which influ-ence the solubility of the amino acids in water. The 20 amino acids of pro-teins are often referred to as the standard amino acids, to distinguish themfrom less common amino acids that are residues modified after a protein hasbeen synthesized, and from the many other kinds of amino acids present inliving organisms but not in proteins. The standard amino acids have beenassigned three-letter abbreviations and one-letter symbols (Table 5–1, p.118), which are used as shorthand to indicate the composition and se-quence of amino acids polymerized in proteins.
In a practice that can be confusing, two conventions are used to iden-tify the carbons within an amino acid. The additional carbons in an R groupare commonly designated b, g, d, e, and so forth, proceeding out from the acarbon. For most other organic molecules, carbon atoms are simply num-bered from one end, giving highest priority to carbons with substitutionscontaining atoms with the highest atomic numbers. Within this latter con-vention, the carboxyl group of an amino acid would be C-1 and the a car-bon would be C-2. In some cases, such as amino acids with heterocyclic Rgroups, the Greek lettering system is ambiguous and the numbering con-vention is therefore used.
For all the standard amino acids except glycine, the a carbon is bondedto four different groups: a carboxyl group, an amino group, an R group, anda hydrogen atom (Fig. 5–2; in glycine, the R group is another hydrogenatom). The a-carbon atom is thus a chiral center (see Fig. 3–9). Becauseof the tetrahedral arrangement of the bonding orbitals around the a-carbonatom, the four different groups can occupy two different spatial arrange-ments that are nonsuperimposable mirror images of each other (Fig. 5–3).These two forms represent a class of stereoisomers called enantiomers
(see Fig. 3–10). All molecules with a chiral center are also optically ac-
tive—that is, they rotate plane-polarized light (see Box 3–1).
H3N�
C
COO�
R
H
figure 5–2General structure of an amino acid. This structure iscommon to all but one of the a-amino acids. (Proline, acyclic amino acid, is the exception.) The R group or sidechain (red) attached to the a carbon (blue) is different ineach amino acid.
CH2
�NH3
COO�
�NH3
CH2 CH2 CH2 CH
Lysine
23456 1e d g b a
Chapter 5 Amino Acids, Peptides, and Proteins 117
Special nomenclature has been developed to specify the absolute con-
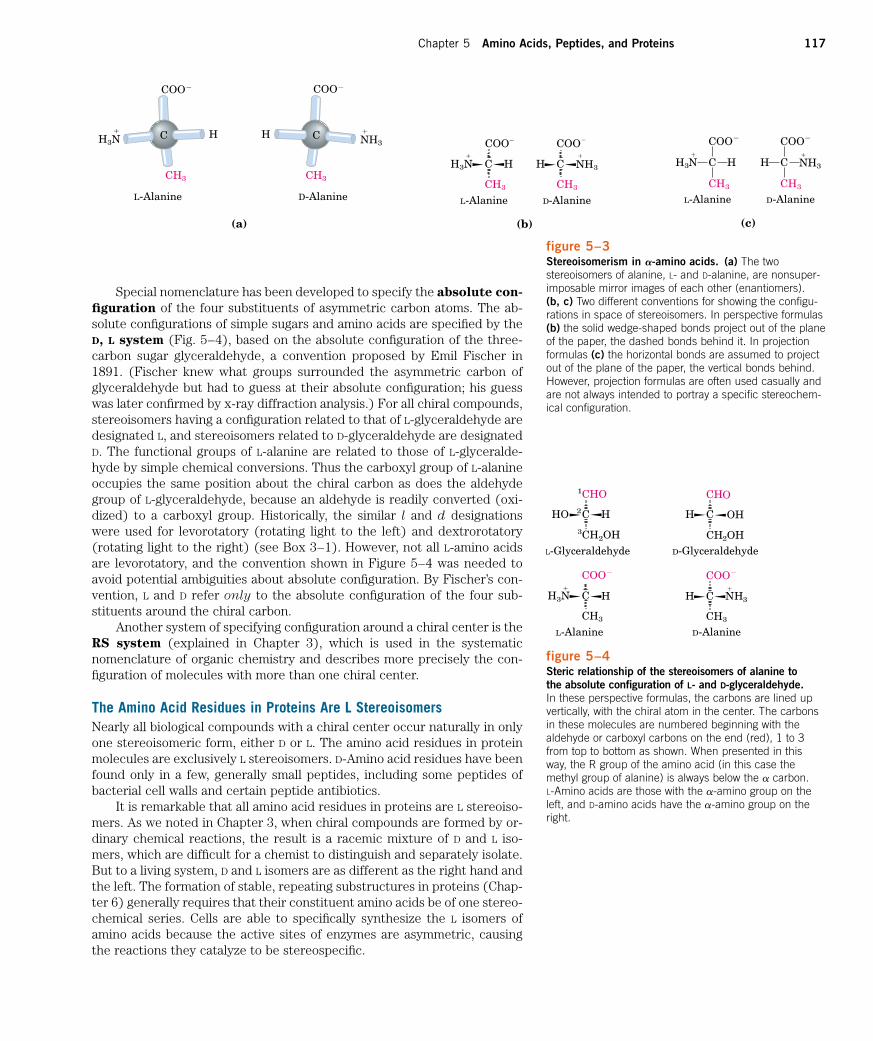
figuration of the four substituents of asymmetric carbon atoms. The ab-solute configurations of simple sugars and amino acids are specified by theD, L system (Fig. 5–4), based on the absolute configuration of the three-carbon sugar glyceraldehyde, a convention proposed by Emil Fischer in1891. (Fischer knew what groups surrounded the asymmetric carbon ofglyceraldehyde but had to guess at their absolute configuration; his guesswas later confirmed by x-ray diffraction analysis.) For all chiral compounds,stereoisomers having a configuration related to that of L-glyceraldehyde aredesignated L, and stereoisomers related to D-glyceraldehyde are designatedD. The functional groups of L-alanine are related to those of L-glyceralde-hyde by simple chemical conversions. Thus the carboxyl group of L-alanineoccupies the same position about the chiral carbon as does the aldehydegroup of L-glyceraldehyde, because an aldehyde is readily converted (oxi-dized) to a carboxyl group. Historically, the similar l and d designationswere used for levorotatory (rotating light to the left) and dextrorotatory(rotating light to the right) (see Box 3–1). However, not all L-amino acidsare levorotatory, and the convention shown in Figure 5–4 was needed toavoid potential ambiguities about absolute configuration. By Fischer’s con-vention, L and D refer only to the absolute configuration of the four sub-stituents around the chiral carbon.
Another system of specifying configuration around a chiral center is theRS system (explained in Chapter 3), which is used in the systematicnomenclature of organic chemistry and describes more precisely the con-figuration of molecules with more than one chiral center.
The Amino Acid Residues in Proteins Are L StereoisomersNearly all biological compounds with a chiral center occur naturally in onlyone stereoisomeric form, either D or L. The amino acid residues in proteinmolecules are exclusively L stereoisomers. D-Amino acid residues have beenfound only in a few, generally small peptides, including some peptides ofbacterial cell walls and certain peptide antibiotics.
It is remarkable that all amino acid residues in proteins are L stereoiso-mers. As we noted in Chapter 3, when chiral compounds are formed by or-dinary chemical reactions, the result is a racemic mixture of D and L iso-mers, which are difficult for a chemist to distinguish and separately isolate.But to a living system, D and L isomers are as different as the right hand andthe left. The formation of stable, repeating substructures in proteins (Chap-ter 6) generally requires that their constituent amino acids be of one stereo-chemical series. Cells are able to specifically synthesize the L isomers ofamino acids because the active sites of enzymes are asymmetric, causingthe reactions they catalyze to be stereospecific.
HO C
1CHO
3CH2OH
H H C
CHO
CH2OH
OH
H3N�
C
COO�
CH3
H H C
COO�
CH3
N�
H3
L-Glyceraldehyde
D-Alanine
2
D-Glyceraldehyde
L-Alanine
figure 5–4Steric relationship of the stereoisomers of alanine to the absolute configuration of L- and D-glyceraldehyde.In these perspective formulas, the carbons are lined upvertically, with the chiral atom in the center. The carbonsin these molecules are numbered beginning with thealdehyde or carboxyl carbons on the end (red), 1 to 3from top to bottom as shown. When presented in this way, the R group of the amino acid (in this case themethyl group of alanine) is always below the a carbon.L-Amino acids are those with the a-amino group on theleft, and D-amino acids have the a-amino group on theright.
(a)
COO�
H3N
CH3 CH3
H CC H
COO�
L-Alanine D-Alanine
�
NH3
�
H3N�
COO�
CH3
H H C
COO�
CH3
N�
H3
L-Alanine D-Alanine
C
(c)
H3N�
C
COO�
CH3
H H C
COO�
CH3
N�
H3
(b)
L-Alanine D-Alanine
figure 5–3Stereoisomerism in a-amino acids. (a) The twostereoisomers of alanine, L- and D-alanine, are nonsuper-imposable mirror images of each other (enantiomers). (b, c) Two different conventions for showing the configu-rations in space of stereoisomers. In perspective formulas(b) the solid wedge-shaped bonds project out of the planeof the paper, the dashed bonds behind it. In projectionformulas (c) the horizontal bonds are assumed to projectout of the plane of the paper, the vertical bonds behind.However, projection formulas are often used casually andare not always intended to portray a specific stereochem-ical configuration.
118 Part II Structure and Catalysis
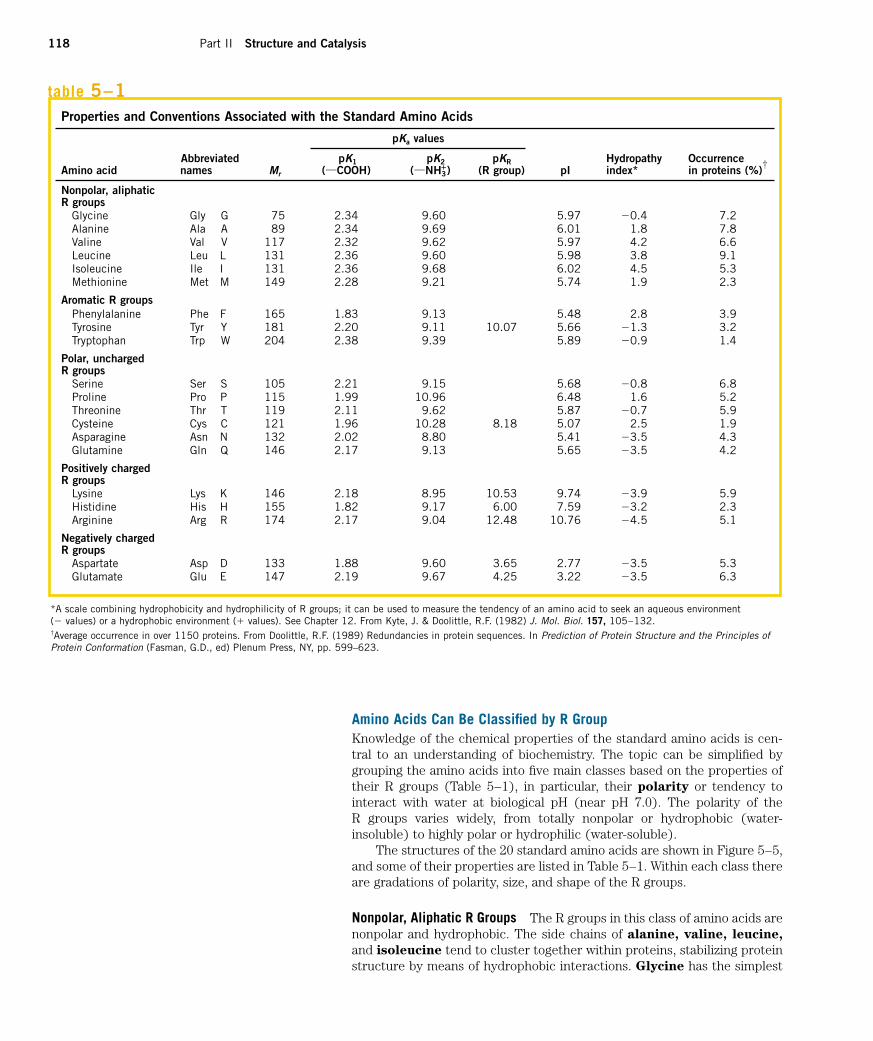
Amino Acids Can Be Classified by R GroupKnowledge of the chemical properties of the standard amino acids is cen-tral to an understanding of biochemistry. The topic can be simplified bygrouping the amino acids into five main classes based on the properties oftheir R groups (Table 5–1), in particular, their polarity or tendency to interact with water at biological pH (near pH 7.0). The polarity of the R groups varies widely, from totally nonpolar or hydrophobic (water-insoluble) to highly polar or hydrophilic (water-soluble).
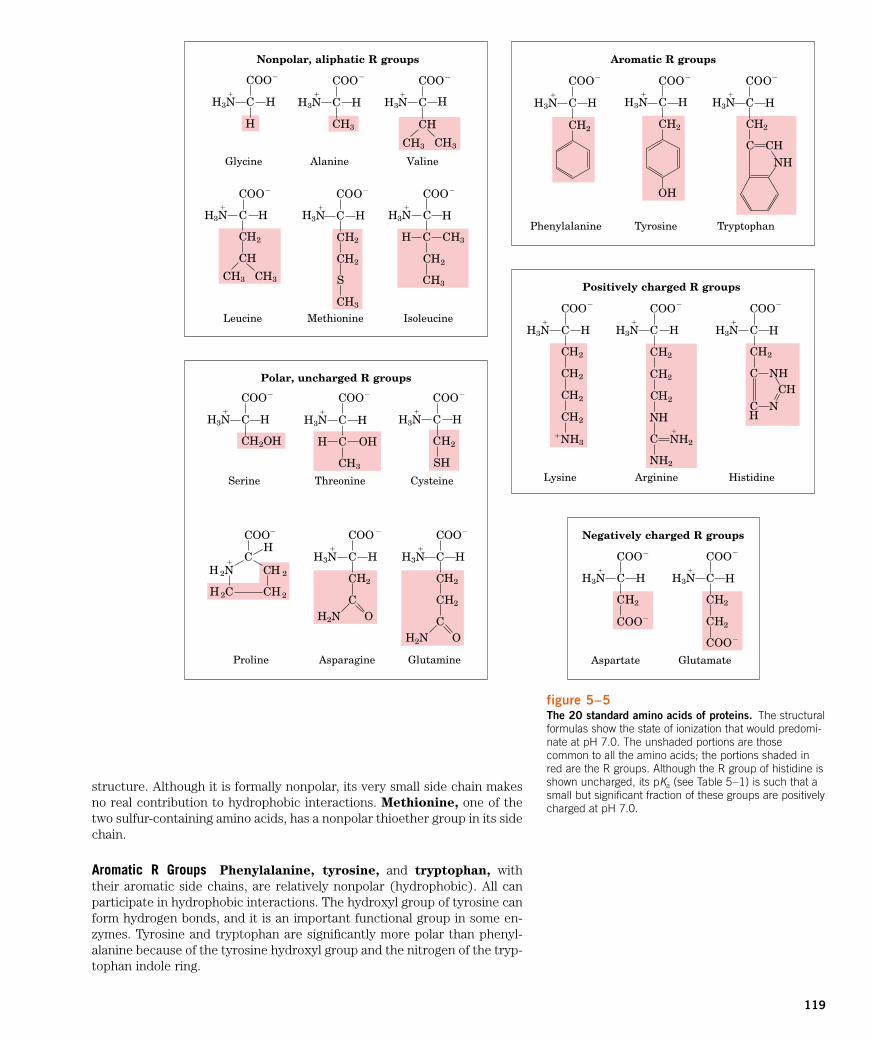
The structures of the 20 standard amino acids are shown in Figure 5–5,and some of their properties are listed in Table 5–1. Within each class thereare gradations of polarity, size, and shape of the R groups.
Nonpolar, Aliphatic R Groups The R groups in this class of amino acids arenonpolar and hydrophobic. The side chains of alanine, valine, leucine,
and isoleucine tend to cluster together within proteins, stabilizing proteinstructure by means of hydrophobic interactions. Glycine has the simplest
Properties and Conventions Associated with the Standard Amino Acids
pKa values
Abbreviated pK1 pK2 pKR Hydropathy OccurrenceAmino acid names Mr (XCOOH) (XNH3
�) (R group) pI index* in proteins (%)
Nonpolar, aliphaticR groups
Glycine Gly G 75 2.34 9.60 5.97 �0.4 7.2Alanine Ala A 89 2.34 9.69 6.01 1.8 7.8Valine Val V 117 2.32 9.62 5.97 4.2 6.6Leucine Leu L 131 2.36 9.60 5.98 3.8 9.1Isoleucine Ile I 131 2.36 9.68 6.02 4.5 5.3Methionine Met M 149 2.28 9.21 5.74 1.9 2.3
Aromatic R groupsPhenylalanine Phe F 165 1.83 9.13 5.48 2.8 3.9Tyrosine Tyr Y 181 2.20 9.11 10.07 5.66 �1.3 3.2Tryptophan Trp W 204 2.38 9.39 5.89 �0.9 1.4
Polar, unchargedR groups
Serine Ser S 105 2.21 9.15 5.68 �0.8 6.8Proline Pro P 115 1.99 10.96 6.48 1.6 5.2Threonine Thr T 119 2.11 9.62 5.87 �0.7 5.9Cysteine Cys C 121 1.96 10.28 8.18 5.07 2.5 1.9Asparagine Asn N 132 2.02 8.80 5.41 �3.5 4.3Glutamine Gln Q 146 2.17 9.13 5.65 �3.5 4.2
Positively chargedR groups
Lysine Lys K 146 2.18 8.95 10.53 9.74 �3.9 5.9Histidine His H 155 1.82 9.17 6.00 7.59 �3.2 2.3Arginine Arg R 174 2.17 9.04 12.48 10.76 �4.5 5.1
Negatively chargedR groups
Aspartate Asp D 133 1.88 9.60 3.65 2.77 �3.5 5.3Glutamate Glu E 147 2.19 9.67 4.25 3.22 �3.5 6.3
†
*A scale combining hydrophobicity and hydrophilicity of R groups; it can be used to measure the tendency of an amino acid to seek an aqueous environment (� values) or a hydrophobic environment (� values). See Chapter 12. From Kyte, J. & Doolittle, R.F. (1982) J. Mol. Biol. 157, 105–132.†Average occurrence in over 1150 proteins. From Doolittle, R.F. (1989) Redundancies in protein sequences. In Prediction of Protein Structure and the Principles ofProtein Conformation (Fasman, G.D., ed) Plenum Press, NY, pp. 599–623.
table 5–1
119
structure. Although it is formally nonpolar, its very small side chain makesno real contribution to hydrophobic interactions. Methionine, one of thetwo sulfur-containing amino acids, has a nonpolar thioether group in its sidechain.
Aromatic R Groups Phenylalanine, tyrosine, and tryptophan, withtheir aromatic side chains, are relatively nonpolar (hydrophobic). All canparticipate in hydrophobic interactions. The hydroxyl group of tyrosine canform hydrogen bonds, and it is an important functional group in some en-zymes. Tyrosine and tryptophan are significantly more polar than phenyl-alanine because of the tyrosine hydroxyl group and the nitrogen of the tryp-tophan indole ring.
figure 5–5The 20 standard amino acids of proteins. The structuralformulas show the state of ionization that would predomi-nate at pH 7.0. The unshaded portions are thosecommon to all the amino acids; the portions shaded inred are the R groups. Although the R group of histidine isshown uncharged, its pKa (see Table 5–1) is such that asmall but significant fraction of these groups are positivelycharged at pH 7.0.
Nonpolar, aliphatic R groups
H3N�
C
COO�
H
H H3N�
C
COO�
CH3
H H3N�
C
COO�
C
CH3 CH3
H
H
Glycine Alanine Valine
Aromatic R groups
H3N�
C
COO�
CH2
H H3N�
C
COO�
CH2
H
OH
Phenylalanine Tyrosine
H 2N�
H 2C
C
COO�
H
C
CH2
H 2
Proline
H3N�
C
COO�
C
C CH
H2
H
NH
Tryptophan
Polar, uncharged R groups
H3N�
C
COO�
CH2OH
H H3N�
C
COO�
H C
CH3
OH
H H3N�
C
COO�
C
SH
H2
H
Serine Threonine
H3N�
C
COO �
C
CH2N O
H2
H H3N�
C
COO�
C
C
CH2N O
H2
H2
H
Positively charged R groups
�N
C
C
C
C
H3N�
C
COO�
H
H2
H2
H2
H2
H3 C
N
C
C
C
H3N�
C
COO�
H
H2
H2
H2
H
NH2
N�
H2
H3N�
C
COO�
CC NH
H
2
H
CH
N
Lysine Arginine Histidine
Negatively charged R groups
H3N�
C
COO�
C
COO�
H2
H H3N�
C
COO�
C
C
COO�
H2
H2
H
Aspartate GlutamateGlutamineAsparagine
Cysteine
CH
H3N�
C
COO�
C
C
CH3 CH3
H
H2
H
Leucine
H3N�
C
COO�
C
C
S
CH3
H2
H2
H
Methionine
H3
�
C
COO�
H C
C
CH3
H2
H
H
Isoleucine
N
C 3
120 Part II Structure and Catalysis
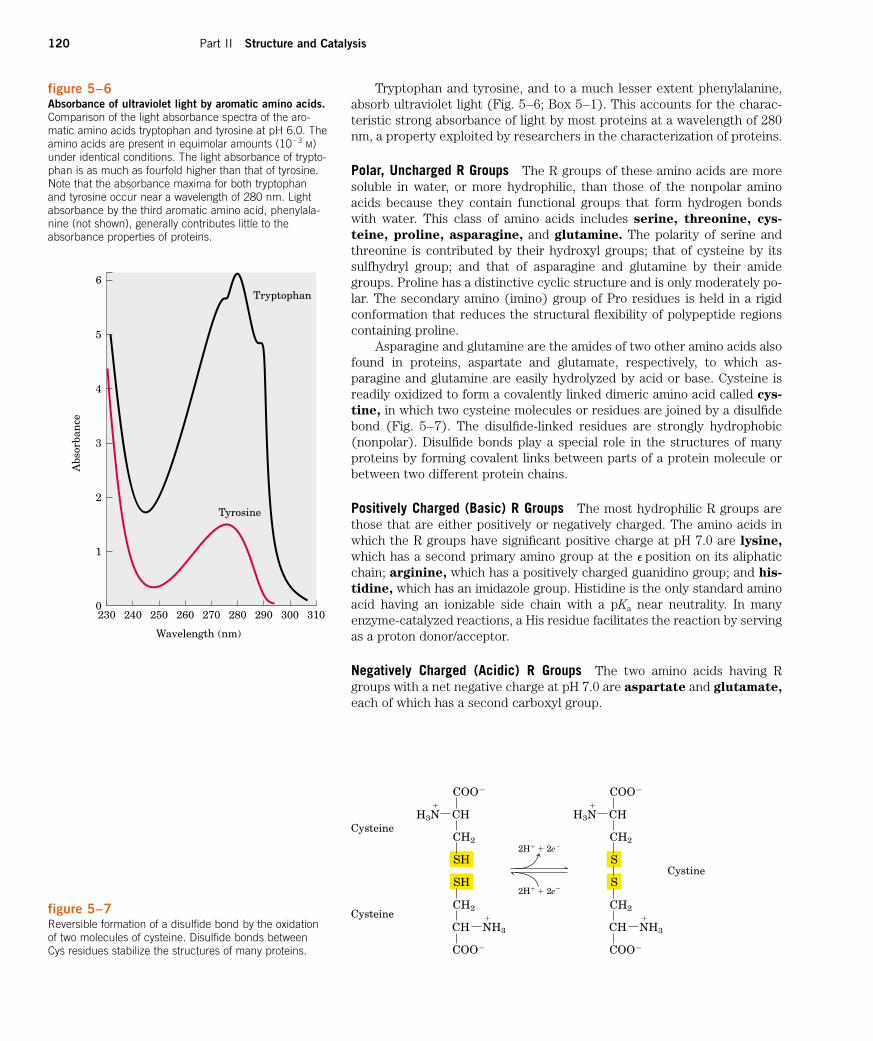
figure 5–6Absorbance of ultraviolet light by aromatic amino acids.Comparison of the light absorbance spectra of the aro-matic amino acids tryptophan and tyrosine at pH 6.0. Theamino acids are present in equimolar amounts (10�3 M)under identical conditions. The light absorbance of trypto-phan is as much as fourfold higher than that of tyrosine.Note that the absorbance maxima for both tryptophanand tyrosine occur near a wavelength of 280 nm. Lightabsorbance by the third aromatic amino acid, phenylala-nine (not shown), generally contributes little to theabsorbance properties of proteins.
Tryptophan
Wavelength (nm)
Abs
orba
nce
5
4
3
2
1
0
6
230 240 250 260 270 280 290 300 310
Tyrosine
Tryptophan and tyrosine, and to a much lesser extent phenylalanine,absorb ultraviolet light (Fig. 5–6; Box 5–1). This accounts for the charac-teristic strong absorbance of light by most proteins at a wavelength of 280nm, a property exploited by researchers in the characterization of proteins.
Polar, Uncharged R Groups The R groups of these amino acids are moresoluble in water, or more hydrophilic, than those of the nonpolar aminoacids because they contain functional groups that form hydrogen bondswith water. This class of amino acids includes serine, threonine, cys-
teine, proline, asparagine, and glutamine. The polarity of serine andthreonine is contributed by their hydroxyl groups; that of cysteine by itssulfhydryl group; and that of asparagine and glutamine by their amidegroups. Proline has a distinctive cyclic structure and is only moderately po-lar. The secondary amino (imino) group of Pro residues is held in a rigidconformation that reduces the structural flexibility of polypeptide regionscontaining proline.
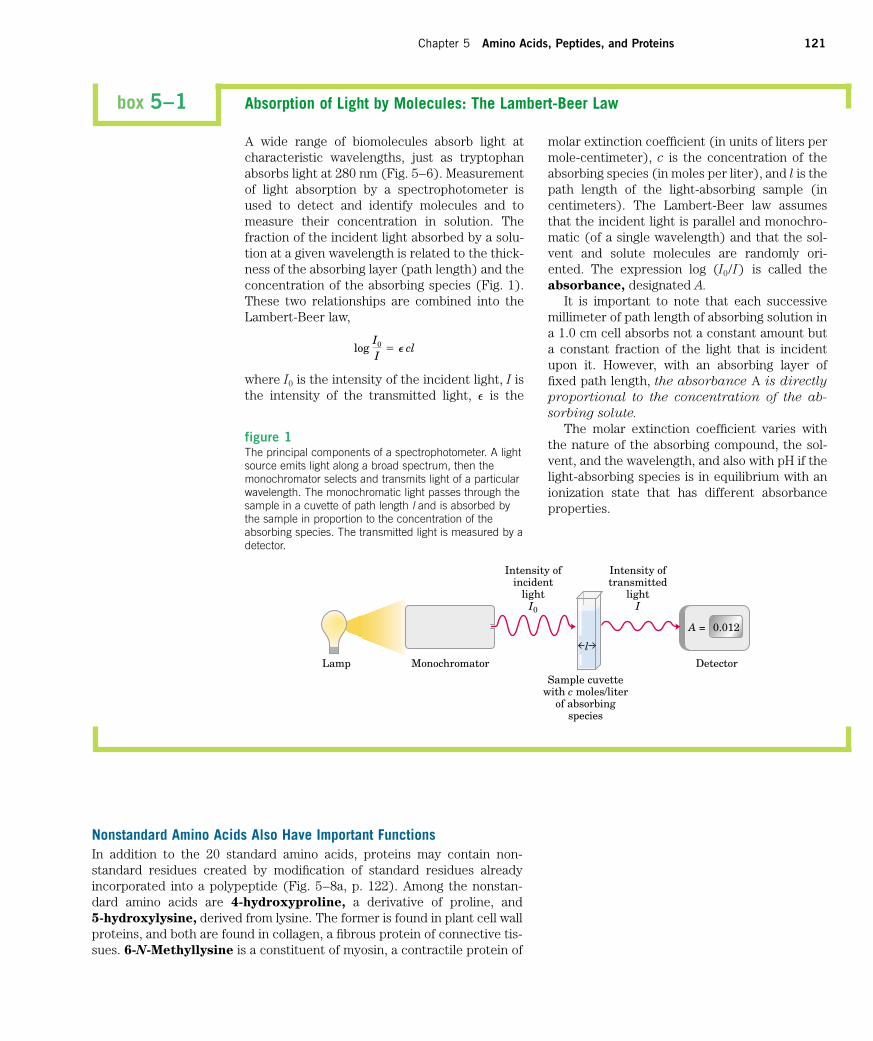
Asparagine and glutamine are the amides of two other amino acids alsofound in proteins, aspartate and glutamate, respectively, to which as-paragine and glutamine are easily hydrolyzed by acid or base. Cysteine isreadily oxidized to form a covalently linked dimeric amino acid called cys-
tine, in which two cysteine molecules or residues are joined by a disulfidebond (Fig. 5–7). The disulfide-linked residues are strongly hydrophobic(nonpolar). Disulfide bonds play a special role in the structures of manyproteins by forming covalent links between parts of a protein molecule orbetween two different protein chains.
Positively Charged (Basic) R Groups The most hydrophilic R groups arethose that are either positively or negatively charged. The amino acids inwhich the R groups have significant positive charge at pH 7.0 are lysine,
which has a second primary amino group at the e position on its aliphaticchain; arginine, which has a positively charged guanidino group; and his-
tidine, which has an imidazole group. Histidine is the only standard aminoacid having an ionizable side chain with a pKa near neutrality. In many enzyme-catalyzed reactions, a His residue facilitates the reaction by servingas a proton donor/acceptor.
Negatively Charged (Acidic) R Groups The two amino acids having Rgroups with a net negative charge at pH 7.0 are aspartate and glutamate,
each of which has a second carboxyl group.
figure 5–7Reversible formation of a disulfide bond by the oxidationof two molecules of cysteine. Disulfide bonds betweenCys residues stabilize the structures of many proteins.
CH
2H� � 2e�
2H� � 2e�
COO�
COO�
H3N
CH2
CH
CH2
SH
SH
Cysteine
Cystine
Cysteine
�
NH3
�
CH
COO�
COO�
H3N
CH2
CH
CH2
S
S
�
NH3
�
Chapter 5 Amino Acids, Peptides, and Proteins 121
box 5–1 Absorption of Light by Molecules: The Lambert-Beer Law
A wide range of biomolecules absorb light atcharacteristic wavelengths, just as tryptophanabsorbs light at 280 nm (Fig. 5–6). Measurementof light absorption by a spectrophotometer isused to detect and identify molecules and tomeasure their concentration in solution. Thefraction of the incident light absorbed by a solu-tion at a given wavelength is related to the thick-ness of the absorbing layer (path length) and theconcentration of the absorbing species (Fig. 1).These two relationships are combined into theLambert-Beer law,
where I0 is the intensity of the incident light, I isthe intensity of the transmitted light, e is the
log I0
I� � cl
molar extinction coefficient (in units of liters permole-centimeter), c is the concentration of theabsorbing species (in moles per liter), and l is thepath length of the light-absorbing sample (incentimeters). The Lambert-Beer law assumesthat the incident light is parallel and monochro-matic (of a single wavelength) and that the sol-vent and solute molecules are randomly ori-ented. The expression log (I0/I) is called theabsorbance, designated A.
It is important to note that each successivemillimeter of path length of absorbing solution ina 1.0 cm cell absorbs not a constant amount buta constant fraction of the light that is incidentupon it. However, with an absorbing layer offixed path length, the absorbance A is directly
proportional to the concentration of the ab-
sorbing solute.
The molar extinction coefficient varies withthe nature of the absorbing compound, the sol-vent, and the wavelength, and also with pH if thelight-absorbing species is in equilibrium with anionization state that has different absorbanceproperties.
figure 1The principal components of a spectrophotometer. A lightsource emits light along a broad spectrum, then themonochromator selects and transmits light of a particularwavelength. The monochromatic light passes through thesample in a cuvette of path length l and is absorbed bythe sample in proportion to the concentration of theabsorbing species. The transmitted light is measured by adetector.
Intensity oftransmitted
lightI
DetectorMonochromatorLamp
Intensity ofincident
lightI0
Sample cuvettewith c moles/liter
of absorbingspecies
0.012A =
l
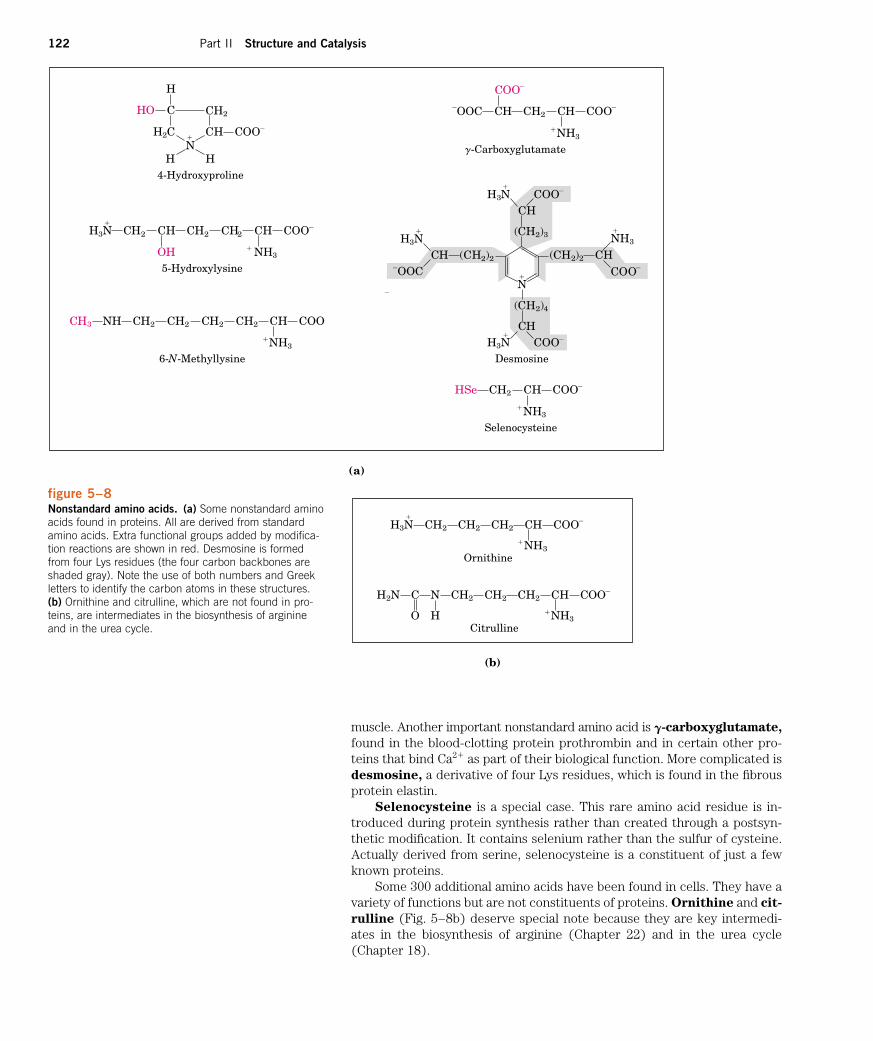
Nonstandard Amino Acids Also Have Important FunctionsIn addition to the 20 standard amino acids, proteins may contain non-standard residues created by modification of standard residues already incorporated into a polypeptide (Fig. 5–8a, p. 122). Among the nonstan-dard amino acids are 4-hydroxyproline, a derivative of proline, and 5-hydroxylysine, derived from lysine. The former is found in plant cell wallproteins, and both are found in collagen, a fibrous protein of connective tis-sues. 6-N-Methyllysine is a constituent of myosin, a contractile protein of
122 Part II Structure and Catalysis
muscle. Another important nonstandard amino acid is g-carboxyglutamate,
found in the blood-clotting protein prothrombin and in certain other pro-teins that bind Ca2� as part of their biological function. More complicated isdesmosine, a derivative of four Lys residues, which is found in the fibrousprotein elastin.
Selenocysteine is a special case. This rare amino acid residue is in-troduced during protein synthesis rather than created through a postsyn-thetic modification. It contains selenium rather than the sulfur of cysteine.Actually derived from serine, selenocysteine is a constituent of just a fewknown proteins.
Some 300 additional amino acids have been found in cells. They have avariety of functions but are not constituents of proteins. Ornithine and cit-
rulline (Fig. 5–8b) deserve special note because they are key intermedi-ates in the biosynthesis of arginine (Chapter 22) and in the urea cycle(Chapter 18).
HO C
H
H2CN�
H H
C
CH2
H COO�
4-Hydroxyproline
H3N�
CH2 C
OH
H CH2 CH2 C� NH3
H COO�
5-Hydroxylysine
CH3 NH CH2 CH2 CH2 CH2 CH COO
�
6-N-Methyllysine
�OOC C
COO�
H CH2 C�NH3
H COO�
�-Carboxyglutamate
CH3N
�
�OOCH (CH2)2
CH3N
�COO�
H
(CH2)3
CN�
H3
COOH
C
(C
N�
H2)4
H3N�
COO�
H
Desmosine
HSe CH2 C�NH3
H COO�
Selenocysteine
a( )
(CH2)2�
�NH3
figure 5–8Nonstandard amino acids. (a) Some nonstandard aminoacids found in proteins. All are derived from standardamino acids. Extra functional groups added by modifica-tion reactions are shown in red. Desmosine is formedfrom four Lys residues (the four carbon backbones areshaded gray). Note the use of both numbers and Greekletters to identify the carbon atoms in these structures.(b) Ornithine and citrulline, which are not found in pro-teins, are intermediates in the biosynthesis of arginineand in the urea cycle.
H3N CH2 CH2 CH2 C�
�
NH3
H COO�
Ornithine
H2N C
O
N
H
CH2 CH2 CH2 C�NH3
H COO�
Citrulline
(b)
Chapter 5 Amino Acids, Peptides, and Proteins 123
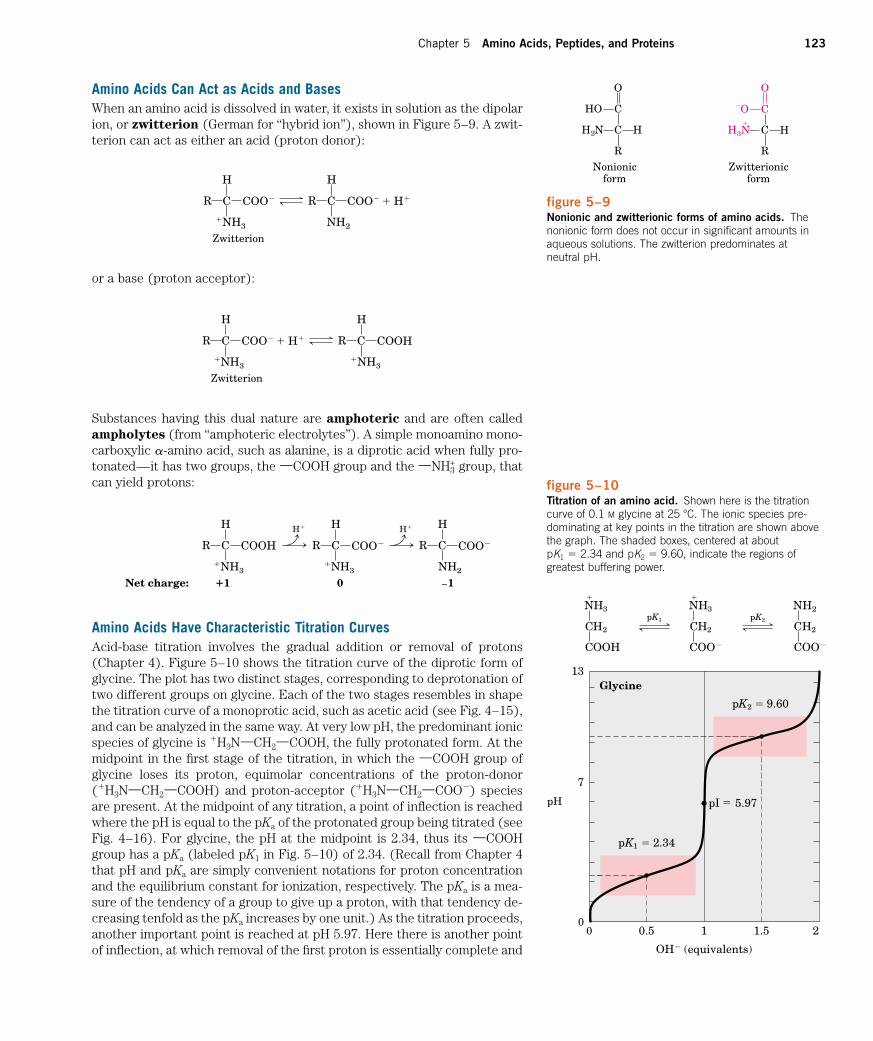
Amino Acids Have Characteristic Titration CurvesAcid-base titration involves the gradual addition or removal of protons(Chapter 4). Figure 5–10 shows the titration curve of the diprotic form ofglycine. The plot has two distinct stages, corresponding to deprotonation oftwo different groups on glycine. Each of the two stages resembles in shapethe titration curve of a monoprotic acid, such as acetic acid (see Fig. 4–15),and can be analyzed in the same way. At very low pH, the predominant ionicspecies of glycine is �H3NXCH2XCOOH, the fully protonated form. At themidpoint in the first stage of the titration, in which the XCOOH group ofglycine loses its proton, equimolar concentrations of the proton-donor(�H3NXCH2XCOOH) and proton-acceptor (�H3NXCH2XCOO�) speciesare present. At the midpoint of any titration, a point of inflection is reachedwhere the pH is equal to the pKa of the protonated group being titrated (seeFig. 4–16). For glycine, the pH at the midpoint is 2.34, thus its XCOOHgroup has a pKa (labeled pK1 in Fig. 5–10) of 2.34. (Recall from Chapter 4that pH and pKa are simply convenient notations for proton concentrationand the equilibrium constant for ionization, respectively. The pKa is a mea-sure of the tendency of a group to give up a proton, with that tendency de-creasing tenfold as the pKa increases by one unit.) As the titration proceeds,another important point is reached at pH 5.97. Here there is another pointof inflection, at which removal of the first proton is essentially complete and
H
C COO�R
�NH3
H
C COO�R
NH2
� H�
Zwitterion
H
C COOHR
H
C COO�R
�NH3
� H�
�NH3
Zwitterion
H
C COO�R
H
C COOHR
�NH3�NH3
Net charge: �1 0 �1
H� H
C COO�R
NH2
H�
Amino Acids Can Act as Acids and BasesWhen an amino acid is dissolved in water, it exists in solution as the dipolarion, or zwitterion (German for “hybrid ion”), shown in Figure 5–9. A zwit-terion can act as either an acid (proton donor):
or a base (proton acceptor):
Substances having this dual nature are amphoteric and are often calledampholytes (from “amphoteric electrolytes”). A simple monoamino mono-carboxylic a-amino acid, such as alanine, is a diprotic acid when fully pro-tonated—it has two groups, the XCOOH group and the XNH3
+ group, thatcan yield protons:
H2N C
C
R
H H3N�
�
C
C
R
H
Nonionicform
Zwitterionicform
O
HO
O
O
figure 5–10Titration of an amino acid. Shown here is the titrationcurve of 0.1 M glycine at 25 �C. The ionic species pre-dominating at key points in the titration are shown abovethe graph. The shaded boxes, centered at about pK1 � 2.34 and pK2 � 9.60, indicate the regions ofgreatest buffering power.
N�
N�
�
�
�
C
COOH
H2
H3
C
COO�
H2
H3 N
C
COO�
H2
H2
13
0.5
OH� (equivalents)
pI 5.97pH
00
7
21.51
pK2pK1
pK2 9.60
pK1 2.34
Glycine
figure 5–9Nonionic and zwitterionic forms of amino acids. Thenonionic form does not occur in significant amounts inaqueous solutions. The zwitterion predominates at neutral pH.
removal of the second has just begun. At this pH glycine is present largelyas the dipolar ion �H3NXCH2XCOO�. We shall return to the significance ofthis inflection point in the titration curve (pI in Fig. 5–10) shortly.
The second stage of the titration corresponds to the removal of a pro-ton from the XNH3
� group of glycine. The pH at the midpoint of this stageis 9.60, equal to the pKa (labeled pK2 in Fig. 5–10) for the XNH3
� group. Thetitration is essentially complete at a pH of about 12, at which point the pre-dominant form of glycine is H2NXCH2XCOO�.
From the titration curve of glycine we can derive several importantpieces of information. First, it gives a quantitative measure of the pKa ofeach of the two ionizing groups: 2.34 for the XCOOH group and 9.60 for theXNH3
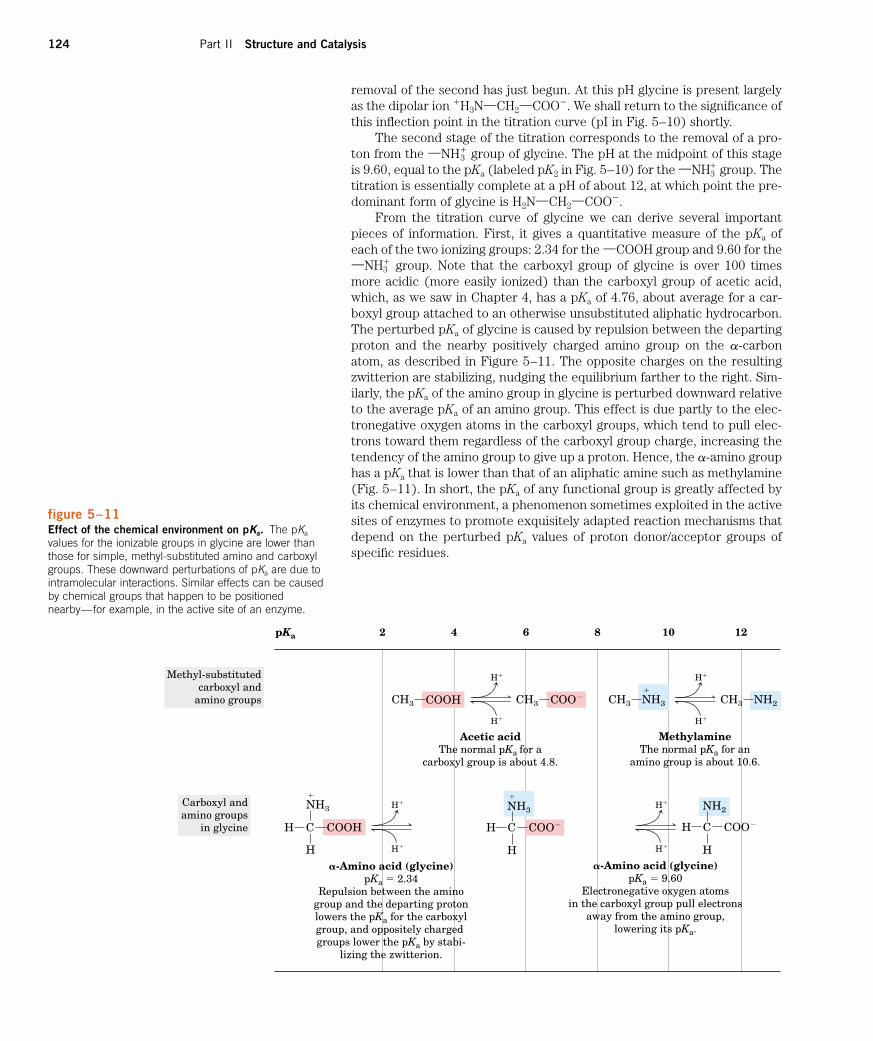
� group. Note that the carboxyl group of glycine is over 100 timesmore acidic (more easily ionized) than the carboxyl group of acetic acid,which, as we saw in Chapter 4, has a pKa of 4.76, about average for a car-boxyl group attached to an otherwise unsubstituted aliphatic hydrocarbon.The perturbed pKa of glycine is caused by repulsion between the departingproton and the nearby positively charged amino group on the a-carbonatom, as described in Figure 5–11. The opposite charges on the resultingzwitterion are stabilizing, nudging the equilibrium farther to the right. Sim-ilarly, the pKa of the amino group in glycine is perturbed downward relativeto the average pKa of an amino group. This effect is due partly to the elec-tronegative oxygen atoms in the carboxyl groups, which tend to pull elec-trons toward them regardless of the carboxyl group charge, increasing thetendency of the amino group to give up a proton. Hence, the a-amino grouphas a pKa that is lower than that of an aliphatic amine such as methylamine(Fig. 5–11). In short, the pKa of any functional group is greatly affected byits chemical environment, a phenomenon sometimes exploited in the activesites of enzymes to promote exquisitely adapted reaction mechanisms thatdepend on the perturbed pKa values of proton donor/acceptor groups ofspecific residues.
figure 5–11Effect of the chemical environment on pKa. The pKa
values for the ionizable groups in glycine are lower thanthose for simple, methyl-substituted amino and carboxylgroups. These downward perturbations of pKa are due tointramolecular interactions. Similar effects can be causedby chemical groups that happen to be positionednearby—for example, in the active site of an enzyme.
NH3
�
Methyl-substitutedcarboxyl and
amino groups
Acetic acidThe normal pKa for a
carboxyl group is about 4.8.
pKa 2 4 6 8 10 12
MethylamineThe normal pKa for an
amino group is about 10.6.
Carboxyl andamino groups
in glycine
�-Amino acid (glycine)pKa � 2.34
Repulsion between the aminogroup and the departing protonlowers the pKa for the carboxylgroup, and oppositely charged groups lower the pKa by stabi-
lizing the zwitterion.
�-Amino acid (glycine)pKa � 9.60
Electronegative oxygen atomsin the carboxyl group pull electrons
away from the amino group,lowering its pKa.
CH3 COOH CH3 CH3COO�
COO�CH
H
NH2
COO�CH
H
CH3 NH3 NH2
H�
H�
�
COOHH C
H
NH3
�
H�
H�
H�
H�
H�
H�
124 Part II Structure and Catalysis
Chapter 5 Amino Acids, Peptides, and Proteins 125
The second piece of information provided by the titration curve ofglycine (Fig. 5–10) is that this amino acid has two regions of bufferingpower (see Fig. 4–17). One of these is the relatively flat portion of thecurve, extending for approximately one pH unit on either side of the firstpKa of 2.34, indicating that glycine is a good buffer near this pH. The otherbuffering zone is centered around pH 9.60. Note that glycine is not a goodbuffer at the pH of intracellular fluid or blood, about 7.4. Within the buffer-ing ranges of glycine, the Henderson-Hasselbalch equation (Chapter 4) canbe used to calculate the proportions of proton-donor and proton-acceptorspecies of glycine required to make a buffer at a given pH.
Titration Curves Predict the Electric Charge of Amino AcidsAnother important piece of information derived from the titration curve ofan amino acid is the relationship between its net electric charge and the pHof the solution. At pH 5.97, the point of inflection between the two stages inits titration curve, glycine is present predominantly as its dipolar form, fullyionized but with no net electric charge (Fig. 5–10). The characteristic pHat which the net electric charge is zero is called the isoelectric point orisoelectric pH, designated pI. For glycine, which has no ionizable group inits side chain, the isoelectric point is simply the arithmetic mean of the twopKa values:
As is evident in Figure 5–10, glycine has a net negative charge at any pHabove its pI and will thus move toward the positive electrode (the anode)when placed in an electric field. At any pH below its pI, glycine has a netpositive charge and will move toward the negative electrode (the cathode).The farther the pH of a glycine solution is from its isoelectric point, thegreater the net electric charge of the population of glycine molecules. At pH 1.0, for example, glycine exists almost entirely as the form�H3NXCH2XCOOH, with a net positive charge of 1.0. At pH 2.34, wherethere is an equal mixture of �H3NXCH2XCOOH and �H3NXCH2XCOO�,the average or net positive charge is 0.5. The sign and the magnitude of thenet charge of any amino acid at any pH can be predicted in the same way.
Amino Acids Differ in Their Acid-Base PropertiesThe shared properties of many amino acids permit some simplifying gener-alizations about their acid-base behaviors.
All amino acids with a single a-amino group, a single a-carboxyl group,and an R group that does not ionize have titration curves resembling that ofglycine (Fig. 5–10). These amino acids have very similar, although not iden-tical, pKa values: pKa of the XCOOH group in the range of 1.8 to 2.4, andpKa of the XNH3
� group in the range of 8.8 to 11.0 (Table 5–1).Amino acids with an ionizable R group have more complex titration
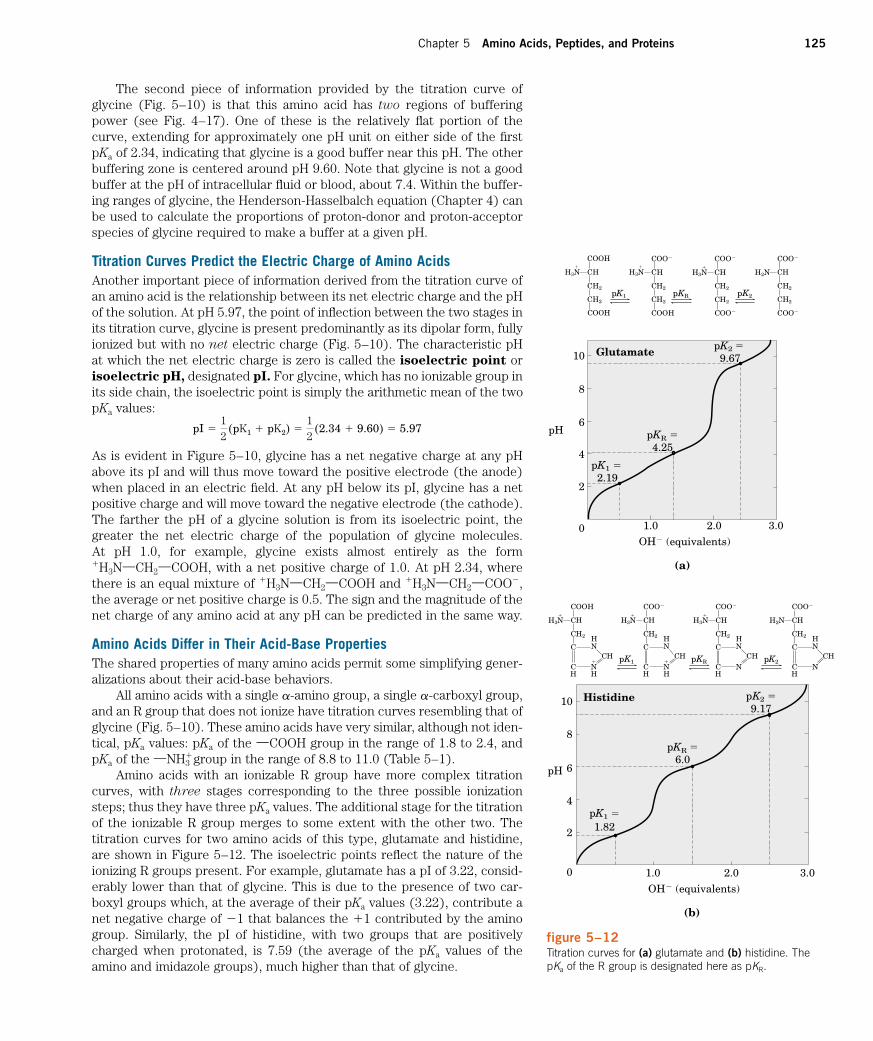
curves, with three stages corresponding to the three possible ionizationsteps; thus they have three pKa values. The additional stage for the titrationof the ionizable R group merges to some extent with the other two. Thetitration curves for two amino acids of this type, glutamate and histidine,are shown in Figure 5–12. The isoelectric points reflect the nature of theionizing R groups present. For example, glutamate has a pI of 3.22, consid-erably lower than that of glycine. This is due to the presence of two car-boxyl groups which, at the average of their pKa values (3.22), contribute anet negative charge of �1 that balances the �1 contributed by the aminogroup. Similarly, the pI of histidine, with two groups that are positivelycharged when protonated, is 7.59 (the average of the pKa values of theamino and imidazole groups), much higher than that of glycine.
pI �12
(pK1 � pK2) �12
(2.34 � 9.60) � 5.97
figure 5–12Titration curves for (a) glutamate and (b) histidine. ThepKa of the R group is designated here as pKR.
10
8
6
4
2
0
Glutamate
H3N�
N�
N�
C
COOH
C
C
COOH
H2
H2
H
pK1
H3 C
COO�
C
C
COOH
H2
H2
H
pKR
H3 C
COO�
C
C
COO�
H2
H2
H
pK2
H2N C
COO�
C
C
COO�
H2
H2
H
pK2 �9.67
pKR �4.25
pK1 �2.19
1.0 2.0 3.0
pH
OH� (equivalents)
(a)
C
H3N�
C
COOH
C
CHCH
N
H2
H H3N�
C
COO�
CH2
H H3N�
C
COO�
CH2
H H2N C
CH2
H
pK1 �
1.82
pKR �6.0
pK2 �9.17
CHN
CHCH
N�
H
CHN
CHCH
N�
H
CHN
CHCH
N
10
8
6
4
2
0 1.0 2.0 3.0
pH
OH� (equivalents)
(b)
COO�
HN
Histidine
pK2pKRpK1
126 Part II Structure and Catalysis
Another important generalization can be made about the acid-base be-havior of the 20 standard amino acids. As pointed out earlier, under the gen-eral condition of free and open exposure to the aqueous environment, onlyhistidine has an R group (pKa � 6.0) providing significant buffering powernear the neutral pH usually found in the intracellular and intercellular flu-ids of most animals and bacteria. No other amino acid has an ionizable sidechain with a pKa value near enough to pH 7.0 to be an effective physiologi-cal buffer (Table 5–1).
Peptides and ProteinsWe now turn to polymers of amino acids, the peptides and proteins. Bio-logically occurring peptides range in size from small to very large, consist-ing of two or three to thousands of linked amino acid residues. The focushere is on the fundamental chemical properties of these polymers.
Peptides Are Chains of Amino AcidsTwo amino acid molecules can be covalently joined through a substitutedamide linkage, termed a peptide bond, to yield a dipeptide. Such a linkageis formed by removal of the elements of water (dehydration) from the a-carboxyl group of one amino acid and the a-amino group of another (Fig. 5–13). Peptide bond formation is an example of a condensation reac-tion, a common class of reaction in living cells. Under standard biochemicalconditions the reaction shown in Figure 5–13 has an equilibrium that favorsreactants rather than products. To make the reaction thermodynamicallymore favorable, the carboxyl group must be chemically modified or acti-vated so that the hydroxyl group can be more readily eliminated. A chemi-cal approach to this problem is outlined later in this chapter. The biologicalapproach to peptide bond formation is a major topic of Chapter 27.
Three amino acids can be joined by two peptide bonds to form a tripep-tide; similarly, amino acids can be linked to form tetrapeptides and pen-tapeptides. When a few amino acids are joined in this fashion, the structureis called an oligopeptide. When many amino acids are joined, the productis called a polypeptide. Proteins may have thousands of amino acidresidues. Although the terms “protein” and “polypeptide” are sometimesused interchangeably, molecules referred to as polypeptides generally havemolecular weights below 10,000.
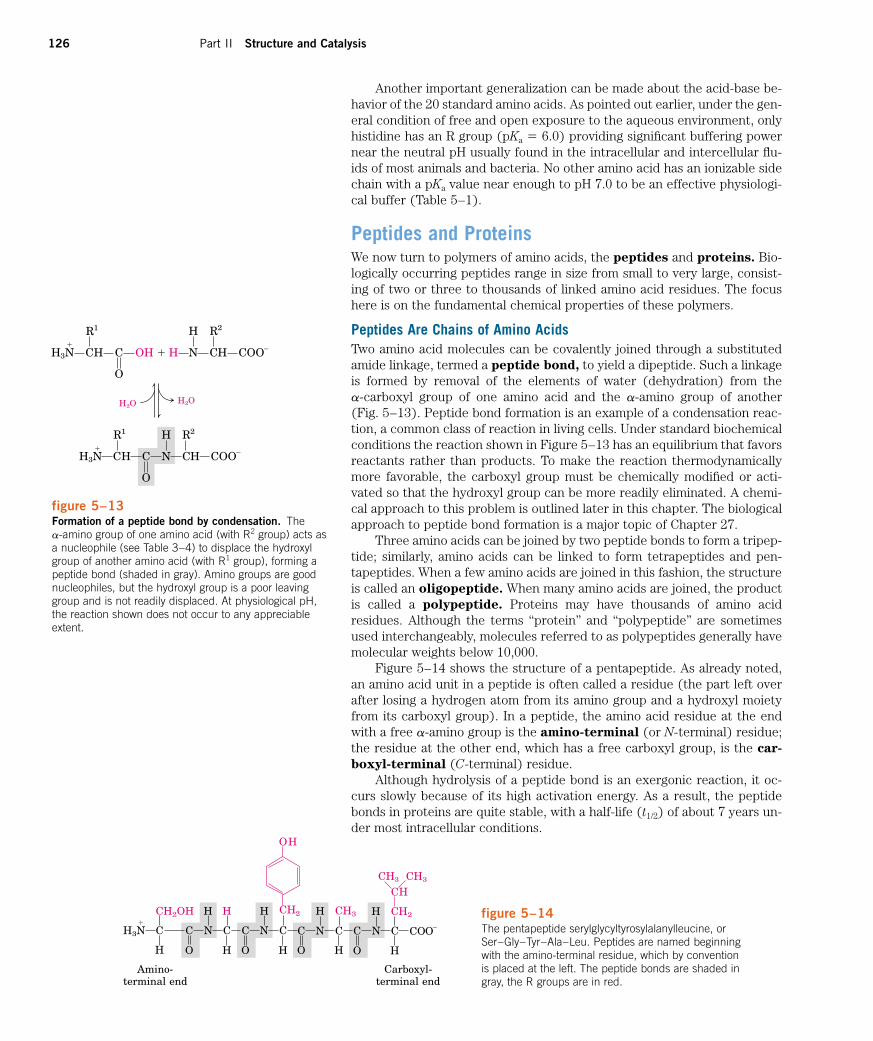
Figure 5–14 shows the structure of a pentapeptide. As already noted,an amino acid unit in a peptide is often called a residue (the part left overafter losing a hydrogen atom from its amino group and a hydroxyl moietyfrom its carboxyl group). In a peptide, the amino acid residue at the endwith a free a-amino group is the amino-terminal (or N-terminal) residue;the residue at the other end, which has a free carboxyl group, is the car-
boxyl-terminal (C-terminal) residue.Although hydrolysis of a peptide bond is an exergonic reaction, it oc-
curs slowly because of its high activation energy. As a result, the peptidebonds in proteins are quite stable, with a half-life (t1/2) of about 7 years un-der most intracellular conditions.
figure 5–13Formation of a peptide bond by condensation. The a-amino group of one amino acid (with R2 group) acts asa nucleophile (see Table 3–4) to displace the hydroxylgroup of another amino acid (with R1 group), forming apeptide bond (shaded in gray). Amino groups are goodnucleophiles, but the hydroxyl group is a poor leavinggroup and is not readily displaced. At physiological pH,the reaction shown does not occur to any appreciableextent.
H3N�
C
R1
H C
O
OH � H N
H
C
R2
H COO�
H2OH2O
H3N�
C
R1
H C
O
N
H
C
R2
H COO�
H3N�
C
CH2OH
H
C
O
N
H
C
H
H
C
O
N
H
C
CH2
H
C
O
N
H
C
CH3
H
C
O
N
H
C
C
CCH3 CH3
H
H2
H
COO�
Amino- Carboxyl-terminal end terminal end
O H
figure 5–14The pentapeptide serylglycyltyrosylalanylleucine, or Ser–Gly–Tyr–Ala–Leu. Peptides are named beginningwith the amino-terminal residue, which by convention is placed at the left. The peptide bonds are shaded ingray, the R groups are in red.
Chapter 5 Amino Acids, Peptides, and Proteins 127
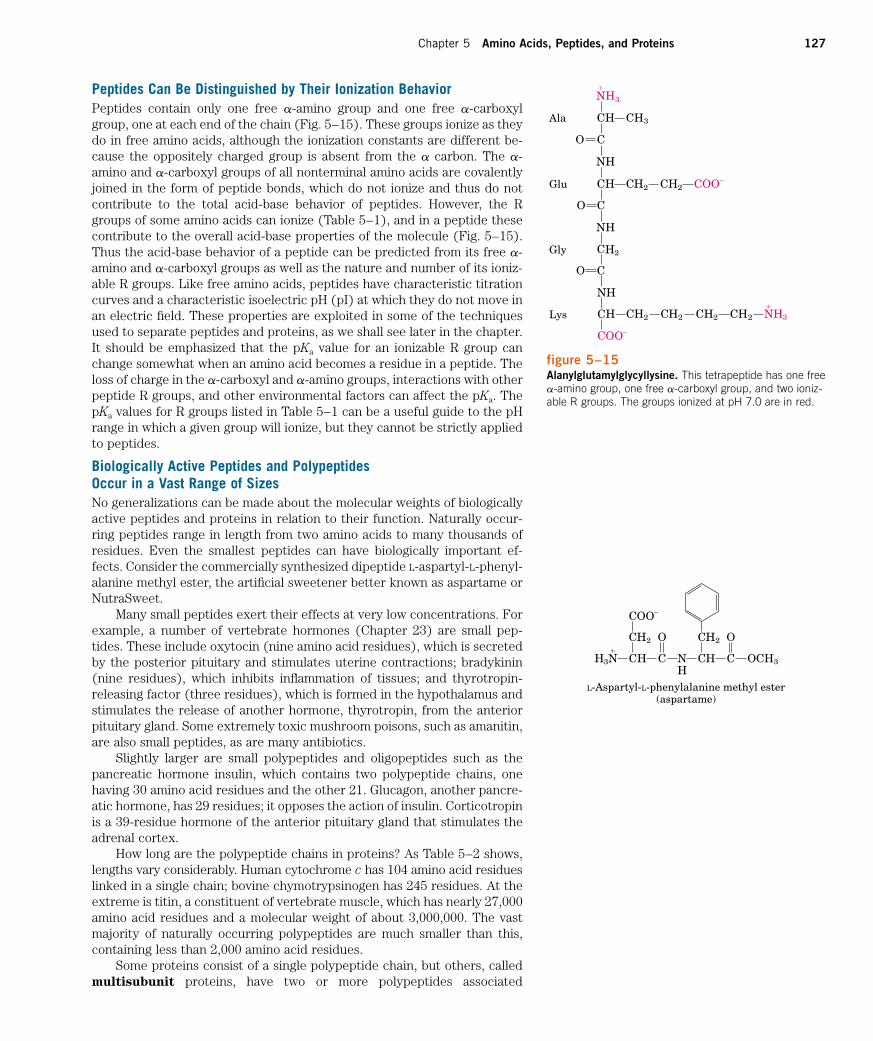
Peptides Can Be Distinguished by Their Ionization BehaviorPeptides contain only one free a-amino group and one free a-carboxylgroup, one at each end of the chain (Fig. 5–15). These groups ionize as theydo in free amino acids, although the ionization constants are different be-cause the oppositely charged group is absent from the a carbon. The a-amino and a-carboxyl groups of all nonterminal amino acids are covalentlyjoined in the form of peptide bonds, which do not ionize and thus do notcontribute to the total acid-base behavior of peptides. However, the Rgroups of some amino acids can ionize (Table 5–1), and in a peptide thesecontribute to the overall acid-base properties of the molecule (Fig. 5–15).Thus the acid-base behavior of a peptide can be predicted from its free a-amino and a-carboxyl groups as well as the nature and number of its ioniz-able R groups. Like free amino acids, peptides have characteristic titrationcurves and a characteristic isoelectric pH (pI) at which they do not move inan electric field. These properties are exploited in some of the techniquesused to separate peptides and proteins, as we shall see later in the chapter.It should be emphasized that the pKa value for an ionizable R group canchange somewhat when an amino acid becomes a residue in a peptide. Theloss of charge in the a-carboxyl and a-amino groups, interactions with otherpeptide R groups, and other environmental factors can affect the pKa. ThepKa values for R groups listed in Table 5–1 can be a useful guide to the pHrange in which a given group will ionize, but they cannot be strictly appliedto peptides.
Biologically Active Peptides and Polypeptides Occur in a Vast Range of SizesNo generalizations can be made about the molecular weights of biologicallyactive peptides and proteins in relation to their function. Naturally occur-ring peptides range in length from two amino acids to many thousands ofresidues. Even the smallest peptides can have biologically important ef-fects. Consider the commercially synthesized dipeptide L-aspartyl-L-phenyl-alanine methyl ester, the artificial sweetener better known as aspartame orNutraSweet.
Many small peptides exert their effects at very low concentrations. Forexample, a number of vertebrate hormones (Chapter 23) are small pep-tides. These include oxytocin (nine amino acid residues), which is secretedby the posterior pituitary and stimulates uterine contractions; bradykinin(nine residues), which inhibits inflammation of tissues; and thyrotropin-releasing factor (three residues), which is formed in the hypothalamus andstimulates the release of another hormone, thyrotropin, from the anteriorpituitary gland. Some extremely toxic mushroom poisons, such as amanitin,are also small peptides, as are many antibiotics.
Slightly larger are small polypeptides and oligopeptides such as thepancreatic hormone insulin, which contains two polypeptide chains, onehaving 30 amino acid residues and the other 21. Glucagon, another pancre-atic hormone, has 29 residues; it opposes the action of insulin. Corticotropinis a 39-residue hormone of the anterior pituitary gland that stimulates theadrenal cortex.
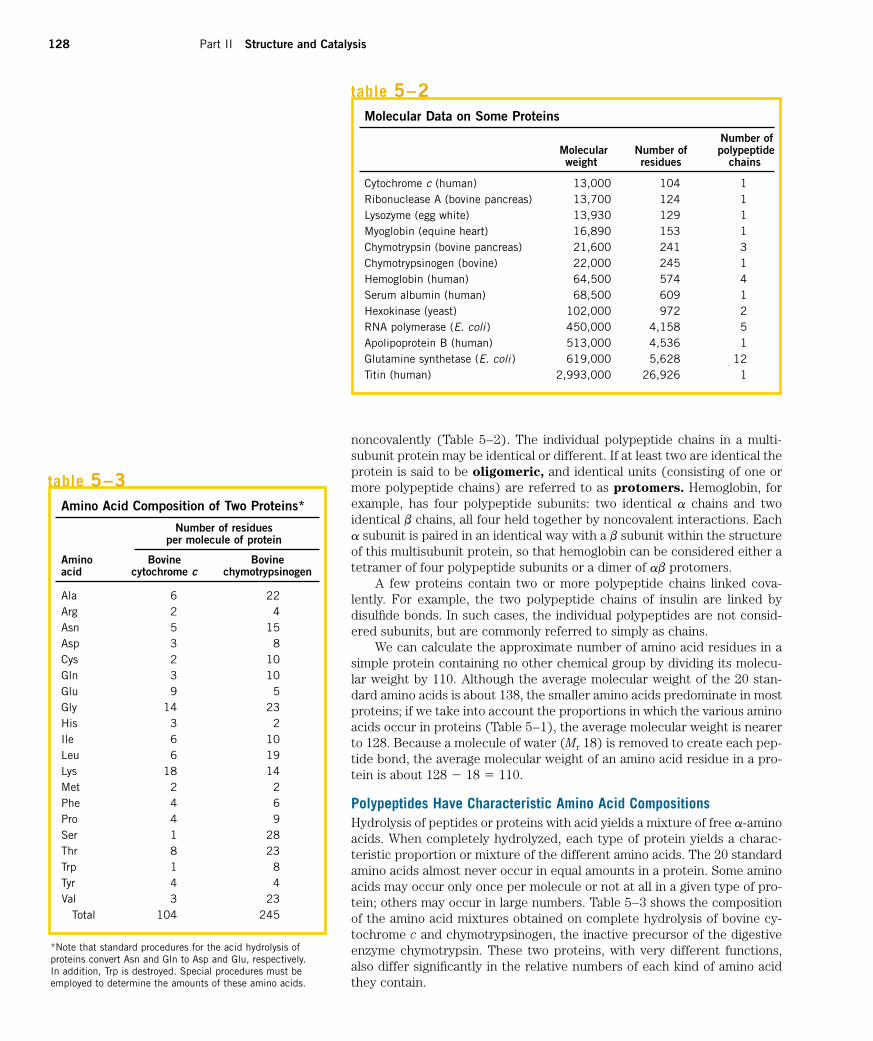
How long are the polypeptide chains in proteins? As Table 5–2 shows,lengths vary considerably. Human cytochrome c has 104 amino acid residueslinked in a single chain; bovine chymotrypsinogen has 245 residues. At theextreme is titin, a constituent of vertebrate muscle, which has nearly 27,000amino acid residues and a molecular weight of about 3,000,000. The vastmajority of naturally occurring polypeptides are much smaller than this,containing less than 2,000 amino acid residues.
Some proteins consist of a single polypeptide chain, but others, calledmultisubunit proteins, have two or more polypeptides associated
Ala
C
COO�
NH
O C
C
NH
O C
C
NH
O C
C
N�
H3
H CH3
H CH2 CH2 COO�
H2
H CH2 CH2 CH2 CH2 N�
H3Lys
Gly
Glu
figure 5–15Alanylglutamylglycyllysine. This tetrapeptide has one freea-amino group, one free a-carboxyl group, and two ioniz-able R groups. The groups ionized at pH 7.0 are in red.
H3N�
C
C
COO�
H2
H C
O
NH
C
CH2
H C
O
OCH3
L-Aspartyl-L-phenylalanine methyl ester(aspartame)
128 Part II Structure and Catalysis
noncovalently (Table 5–2). The individual polypeptide chains in a multi-subunit protein may be identical or different. If at least two are identical theprotein is said to be oligomeric, and identical units (consisting of one ormore polypeptide chains) are referred to as protomers. Hemoglobin, forexample, has four polypeptide subunits: two identical a chains and twoidentical b chains, all four held together by noncovalent interactions. Eacha subunit is paired in an identical way with a b subunit within the structureof this multisubunit protein, so that hemoglobin can be considered either atetramer of four polypeptide subunits or a dimer of ab protomers.
A few proteins contain two or more polypeptide chains linked cova-lently. For example, the two polypeptide chains of insulin are linked bydisulfide bonds. In such cases, the individual polypeptides are not consid-ered subunits, but are commonly referred to simply as chains.
We can calculate the approximate number of amino acid residues in asimple protein containing no other chemical group by dividing its molecu-lar weight by 110. Although the average molecular weight of the 20 stan-dard amino acids is about 138, the smaller amino acids predominate in mostproteins; if we take into account the proportions in which the various aminoacids occur in proteins (Table 5–1), the average molecular weight is nearerto 128. Because a molecule of water (Mr 18) is removed to create each pep-tide bond, the average molecular weight of an amino acid residue in a pro-tein is about 128 � 18 � 110.
Polypeptides Have Characteristic Amino Acid CompositionsHydrolysis of peptides or proteins with acid yields a mixture of free a-aminoacids. When completely hydrolyzed, each type of protein yields a charac-teristic proportion or mixture of the different amino acids. The 20 standardamino acids almost never occur in equal amounts in a protein. Some aminoacids may occur only once per molecule or not at all in a given type of pro-tein; others may occur in large numbers. Table 5–3 shows the compositionof the amino acid mixtures obtained on complete hydrolysis of bovine cy-tochrome c and chymotrypsinogen, the inactive precursor of the digestiveenzyme chymotrypsin. These two proteins, with very different functions,also differ significantly in the relative numbers of each kind of amino acidthey contain.
Molecular Data on Some Proteins
Number ofMolecular Number of polypeptideweight residues chains
Cytochrome c (human) 13,000 104 1Ribonuclease A (bovine pancreas) 13,700 124 1Lysozyme (egg white) 13,930 129 1Myoglobin (equine heart) 16,890 153 1Chymotrypsin (bovine pancreas) 21,600 241 3Chymotrypsinogen (bovine) 22,000 245 1Hemoglobin (human) 64,500 574 4Serum albumin (human) 68,500 609 1Hexokinase (yeast) 102,000 972 2RNA polymerase (E. coli ) 450,000 4,158 5Apolipoprotein B (human) 513,000 4,536 1Glutamine synthetase (E. coli ) 619,000 5,628 12Titin (human) 2,993,000 26,926 1
table 5–2
Amino Acid Composition of Two Proteins*
Number of residuesper molecule of protein
Amino Bovine Bovineacid cytochrome c chymotrypsinogen
Ala 6 22Arg 2 4Asn 5 15Asp 3 8Cys 2 10Gln 3 10Glu 9 5Gly 14 23His 3 2Ile 6 10Leu 6 19Lys 18 14Met 2 2Phe 4 6Pro 4 9Ser 1 28Thr 8 23Trp 1 8Tyr 4 4Val 3 23
Total 104 245
*Note that standard procedures for the acid hydrolysis ofproteins convert Asn and Gln to Asp and Glu, respectively. In addition, Trp is destroyed. Special procedures must beemployed to determine the amounts of these amino acids.
table 5–3
Chapter 5 Amino Acids, Peptides, and Proteins 129
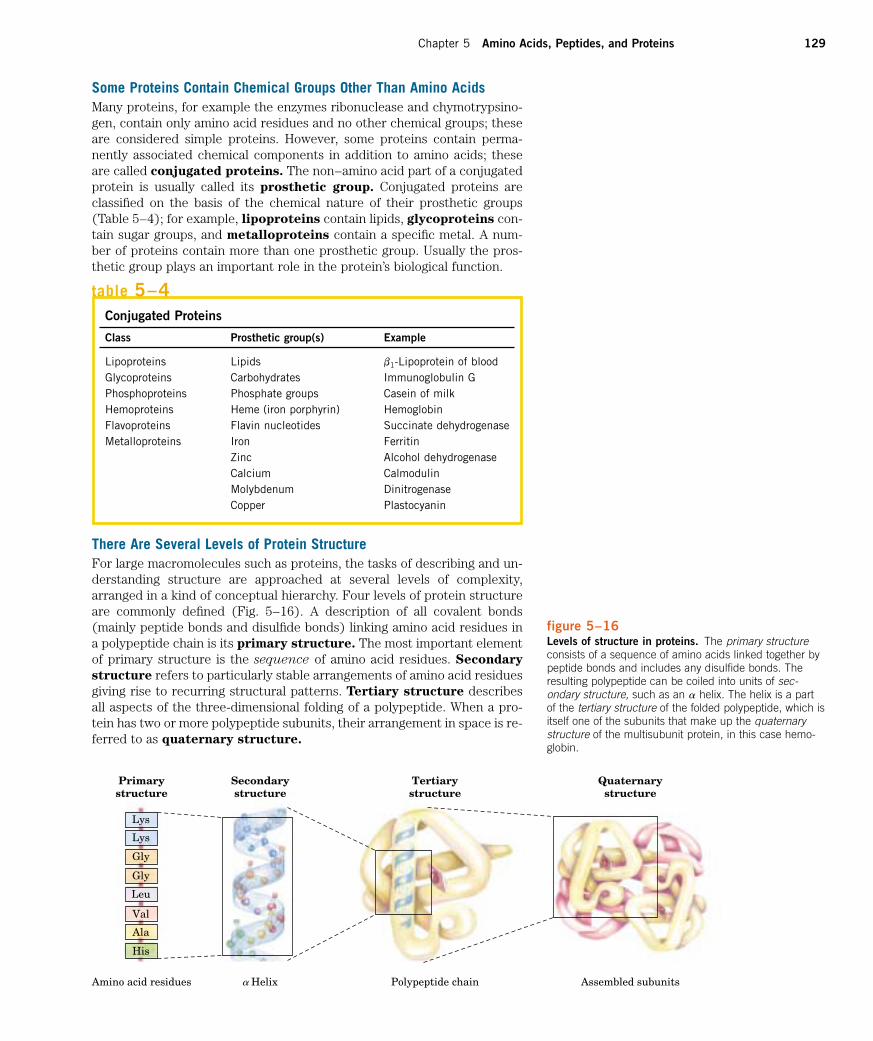
Some Proteins Contain Chemical Groups Other Than Amino AcidsMany proteins, for example the enzymes ribonuclease and chymotrypsino-gen, contain only amino acid residues and no other chemical groups; theseare considered simple proteins. However, some proteins contain perma-nently associated chemical components in addition to amino acids; theseare called conjugated proteins. The non–amino acid part of a conjugatedprotein is usually called its prosthetic group. Conjugated proteins areclassified on the basis of the chemical nature of their prosthetic groups(Table 5–4); for example, lipoproteins contain lipids, glycoproteins con-tain sugar groups, and metalloproteins contain a specific metal. A num-ber of proteins contain more than one prosthetic group. Usually the pros-thetic group plays an important role in the protein’s biological function.
Conjugated Proteins
Class Prosthetic group(s) Example
Lipoproteins Lipids b1-Lipoprotein of bloodGlycoproteins Carbohydrates Immunoglobulin GPhosphoproteins Phosphate groups Casein of milkHemoproteins Heme (iron porphyrin) HemoglobinFlavoproteins Flavin nucleotides Succinate dehydrogenaseMetalloproteins Iron Ferritin
Zinc Alcohol dehydrogenaseCalcium CalmodulinMolybdenum DinitrogenaseCopper Plastocyanin
table 5–4
There Are Several Levels of Protein StructureFor large macromolecules such as proteins, the tasks of describing and un-derstanding structure are approached at several levels of complexity,arranged in a kind of conceptual hierarchy. Four levels of protein structureare commonly defined (Fig. 5–16). A description of all covalent bonds(mainly peptide bonds and disulfide bonds) linking amino acid residues ina polypeptide chain is its primary structure. The most important elementof primary structure is the sequence of amino acid residues. Secondary
structure refers to particularly stable arrangements of amino acid residuesgiving rise to recurring structural patterns. Tertiary structure describesall aspects of the three-dimensional folding of a polypeptide. When a pro-tein has two or more polypeptide subunits, their arrangement in space is re-ferred to as quaternary structure.
Primarystructure
Secondarystructure
Tertiarystructure
Quaternarystructure
Amino acid residues
Lys
Lys
Gly
Gly
Leu
Val
Ala
His
Helix Polypeptide chain Assembled subunits�
figure 5–16Levels of structure in proteins. The primary structureconsists of a sequence of amino acids linked together bypeptide bonds and includes any disulfide bonds. Theresulting polypeptide can be coiled into units of sec-ondary structure, such as an helix. The helix is a partof the tertiary structure of the folded polypeptide, which isitself one of the subunits that make up the quaternarystructure of the multisubunit protein, in this case hemo-globin.
�
130 Part II Structure and Catalysis
Working with ProteinsOur understanding of protein structure and function has been derived fromthe study of many individual proteins. To study a protein in any detail itmust be separated from all other proteins, and techniques must be availableto determine its properties. The necessary methods come from proteinchemistry, a discipline as old as biochemistry itself and one that retains acentral position in biochemical research.
Proteins Can Be Separated and PurifiedA pure preparation of a protein is essential before its properties, amino acidcomposition, and sequence can be determined. Given that cells containthousands of different kinds of proteins, how can one protein be purified?Methods for separating proteins take advantage of properties that vary fromone protein to the next. For example, many proteins bind to other biomol-ecules with great specificity, and such proteins can be separated on the ba-sis of their binding properties.
The source of a protein is generally tissue or microbial cells. The firststep in any protein purification procedure is to break open these cells, re-leasing their proteins into a solution called a crude extract. If necessary,differential centrifugation can be used to prepare subcellular fractions or toisolate specific organelles (see Fig. 2–20).
Once the extract or organelle preparation is ready, various methods areavailable for purifying one or more of the proteins it contains. Commonly,the extract is subjected to treatments that separate the proteins into dif-ferent fractions based on some property such as size or charge, a processreferred to as fractionation. Early fractionation steps in a purification uti-lize differences in protein solubility, which is a complex function of pH, tem-perature, salt concentration, and other factors. The solubility of proteins isgenerally lowered at high salt concentrations, an effect called “salting out.”The addition of a salt in the right amounts can selectively precipitate someproteins, while others remain in solution. Ammonium sulfate ((NH4)2SO4)is often used for this purpose because of its high solubility in water.
A solution containing the protein of interest often must be further al-tered before subsequent purification steps are possible. For example, dial-
ysis is a procedure that separates proteins from solvents by taking advan-tage of the proteins’ larger size. The partially purified extract is placed in abag or tube made of a semipermeable membrane. When this is suspendedin a larger volume of buffered solution of appropriate ionic strength, themembrane allows the exchange of salt and buffer but not proteins. Thusdialysis retains large proteins within the membranous bag or tube while al-lowing the concentration of other solutes in the protein preparation tochange until they come into equilibrium with the solution outside the mem-brane. Dialysis might be used, for example, to remove ammonium sulfatefrom the protein preparation.
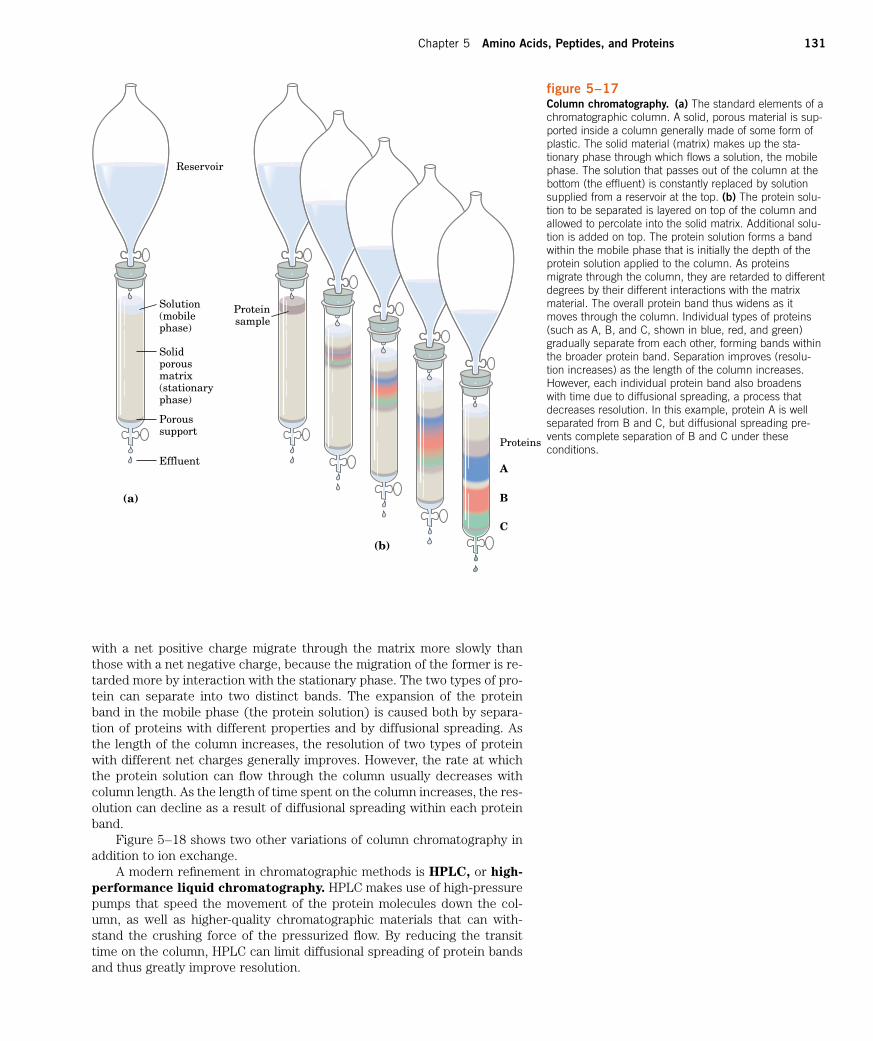
The most powerful methods for fractionating proteins make use of col-
umn chromatography, which takes advantage of differences in proteincharge, size, binding affinity, and other properties (Fig. 5–17). A poroussolid material with appropriate chemical properties (the stationary phase)is held in a column, and a buffered solution (the mobile phase) percolatesthrough it. The protein-containing solution is layered on the top of the col-umn, then also percolates through the solid matrix as an ever-expandingband within the larger mobile phase (Fig. 5–17b). Individual proteins mi-grate faster or more slowly through the column depending on their proper-ties. For example, in cation-exchange chromatography (Fig. 5–18a), thesolid matrix has negatively charged groups. In the mobile phase, proteins
Chapter 5 Amino Acids, Peptides, and Proteins 131
Solution(mobilephase)
Solidporousmatrix(stationaryphase)
Poroussupport
Effluent
(a)
(b)
Reservoir
Proteinsample
Proteins
A
B
C
figure 5–17Column chromatography. (a) The standard elements of achromatographic column. A solid, porous material is sup-ported inside a column generally made of some form ofplastic. The solid material (matrix) makes up the sta-tionary phase through which flows a solution, the mobilephase. The solution that passes out of the column at thebottom (the effluent) is constantly replaced by solutionsupplied from a reservoir at the top. (b) The protein solu-tion to be separated is layered on top of the column andallowed to percolate into the solid matrix. Additional solu-tion is added on top. The protein solution forms a bandwithin the mobile phase that is initially the depth of theprotein solution applied to the column. As proteinsmigrate through the column, they are retarded to differentdegrees by their different interactions with the matrixmaterial. The overall protein band thus widens as itmoves through the column. Individual types of proteins(such as A, B, and C, shown in blue, red, and green)gradually separate from each other, forming bands withinthe broader protein band. Separation improves (resolu-tion increases) as the length of the column increases.However, each individual protein band also broadens with time due to diffusional spreading, a process thatdecreases resolution. In this example, protein A is wellseparated from B and C, but diffusional spreading pre-vents complete separation of B and C under these conditions.
with a net positive charge migrate through the matrix more slowly thanthose with a net negative charge, because the migration of the former is re-tarded more by interaction with the stationary phase. The two types of pro-tein can separate into two distinct bands. The expansion of the proteinband in the mobile phase (the protein solution) is caused both by separa-tion of proteins with different properties and by diffusional spreading. Asthe length of the column increases, the resolution of two types of proteinwith different net charges generally improves. However, the rate at whichthe protein solution can flow through the column usually decreases withcolumn length. As the length of time spent on the column increases, the res-olution can decline as a result of diffusional spreading within each proteinband.
Figure 5–18 shows two other variations of column chromatography inaddition to ion exchange.
A modern refinement in chromatographic methods is HPLC, or high-
performance liquid chromatography. HPLC makes use of high-pressurepumps that speed the movement of the protein molecules down the col-umn, as well as higher-quality chromatographic materials that can with-stand the crushing force of the pressurized flow. By reducing the transittime on the column, HPLC can limit diffusional spreading of protein bandsand thus greatly improve resolution.
132 Part II Structure and Catalysis
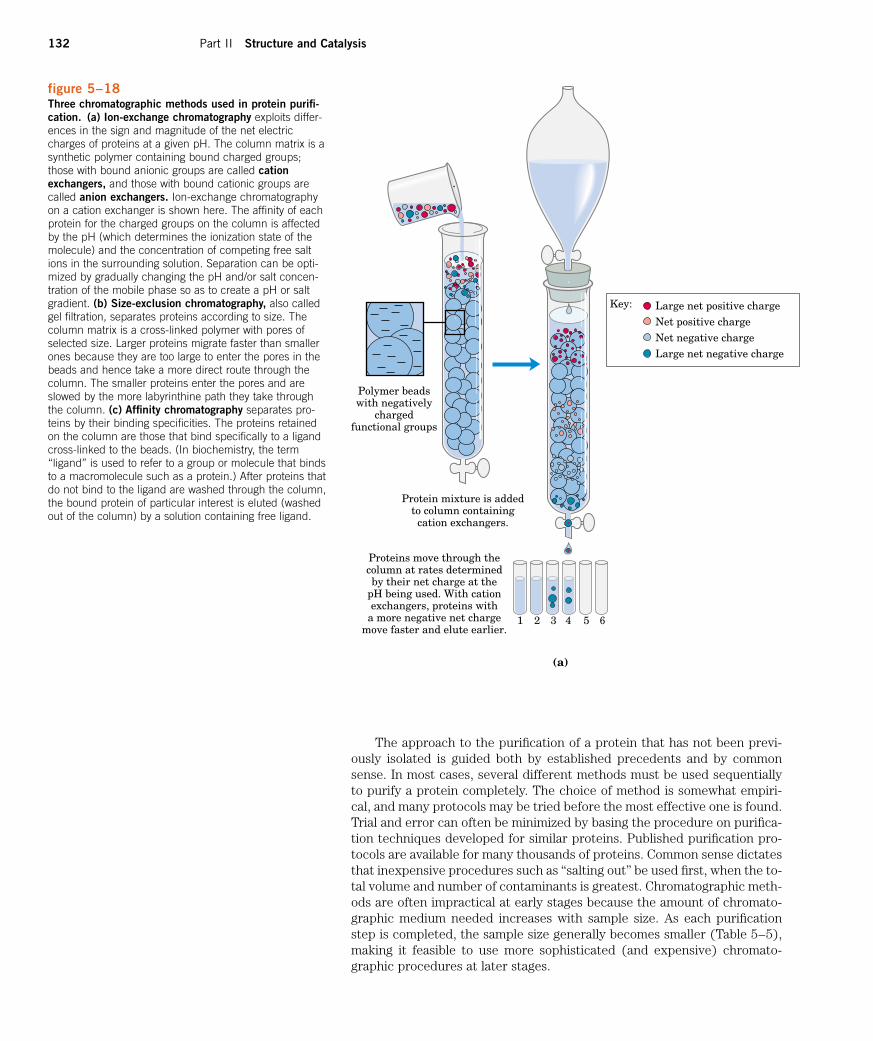
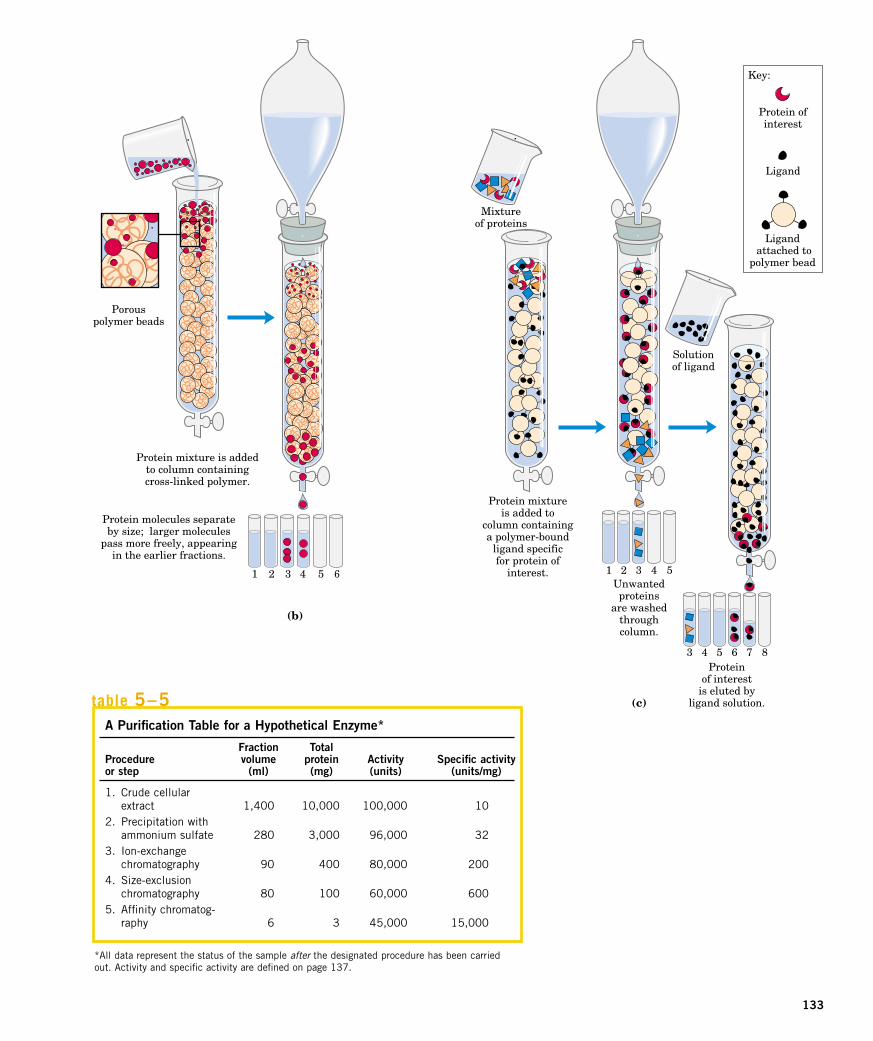
figure 5–18Three chromatographic methods used in protein purifi-cation. (a) Ion-exchange chromatography exploits differ-ences in the sign and magnitude of the net electriccharges of proteins at a given pH. The column matrix is asynthetic polymer containing bound charged groups;those with bound anionic groups are called cationexchangers, and those with bound cationic groups arecalled anion exchangers. Ion-exchange chromatographyon a cation exchanger is shown here. The affinity of eachprotein for the charged groups on the column is affectedby the pH (which determines the ionization state of themolecule) and the concentration of competing free saltions in the surrounding solution. Separation can be opti-mized by gradually changing the pH and/or salt concen-tration of the mobile phase so as to create a pH or saltgradient. (b) Size-exclusion chromatography, also calledgel filtration, separates proteins according to size. Thecolumn matrix is a cross-linked polymer with pores ofselected size. Larger proteins migrate faster than smallerones because they are too large to enter the pores in thebeads and hence take a more direct route through thecolumn. The smaller proteins enter the pores and areslowed by the more labyrinthine path they take throughthe column. (c) Affinity chromatography separates pro-teins by their binding specificities. The proteins retainedon the column are those that bind specifically to a ligandcross-linked to the beads. (In biochemistry, the term“ligand” is used to refer to a group or molecule that bindsto a macromolecule such as a protein.) After proteins thatdo not bind to the ligand are washed through the column,the bound protein of particular interest is eluted (washedout of the column) by a solution containing free ligand.
Proteins move through thecolumn at rates determinedby their net charge at the
pH being used. With cationexchangers, proteins with
a more negative net chargemove faster and elute earlier.
1 2 3 4 5 6
Protein mixture is addedto column containing
cation exchangers.
Polymer beadswith negatively
chargedfunctional groups
(a)
Key: Large net positive chargeNet positive chargeNet negative chargeLarge net negative charge
The approach to the purification of a protein that has not been previ-ously isolated is guided both by established precedents and by commonsense. In most cases, several different methods must be used sequentiallyto purify a protein completely. The choice of method is somewhat empiri-cal, and many protocols may be tried before the most effective one is found.Trial and error can often be minimized by basing the procedure on purifica-tion techniques developed for similar proteins. Published purification pro-tocols are available for many thousands of proteins. Common sense dictatesthat inexpensive procedures such as “salting out” be used first, when the to-tal volume and number of contaminants is greatest. Chromatographic meth-ods are often impractical at early stages because the amount of chromato-graphic medium needed increases with sample size. As each purificationstep is completed, the sample size generally becomes smaller (Table 5–5),making it feasible to use more sophisticated (and expensive) chromato-graphic procedures at later stages.
133
Protein molecules separateby size; larger molecules
pass more freely, appearingin the earlier fractions.
1 2 3 4 5 6
Protein mixture is addedto column containingcross-linked polymer.
Porouspolymer beads
(b)
Unwantedproteins
are washedthroughcolumn.
Proteinof interest
is eluted byligand solution.
Key:
Protein ofinterest
Ligand
Protein mixtureis added to
column containinga polymer-bound
ligand specificfor protein of
interest.
Mixtureof proteins
7 86543
Solutionof ligand
3 421 5
(c)
Ligand attached to
polymer bead
A Purification Table for a Hypothetical Enzyme*
Fraction TotalProcedure volume protein Activity Specific activityor step (ml) (mg) (units) (units/mg)
1. Crude cellular1. extract 1,400 10,000 100,000 102. Precipitation with2. ammonium sulfate 280 3,000 96,000 323. Ion-exchange 3. chromatography 90 400 80,000 2004. Size-exclusion4. chromatography 80 100 60,000 6005. Affinity chromatog-5. raphy 6 3 45,000 15,000
*All data represent the status of the sample after the designated procedure has been carriedout. Activity and specific activity are defined on page 137.
table 5–5
134 Part II Structure and Catalysis
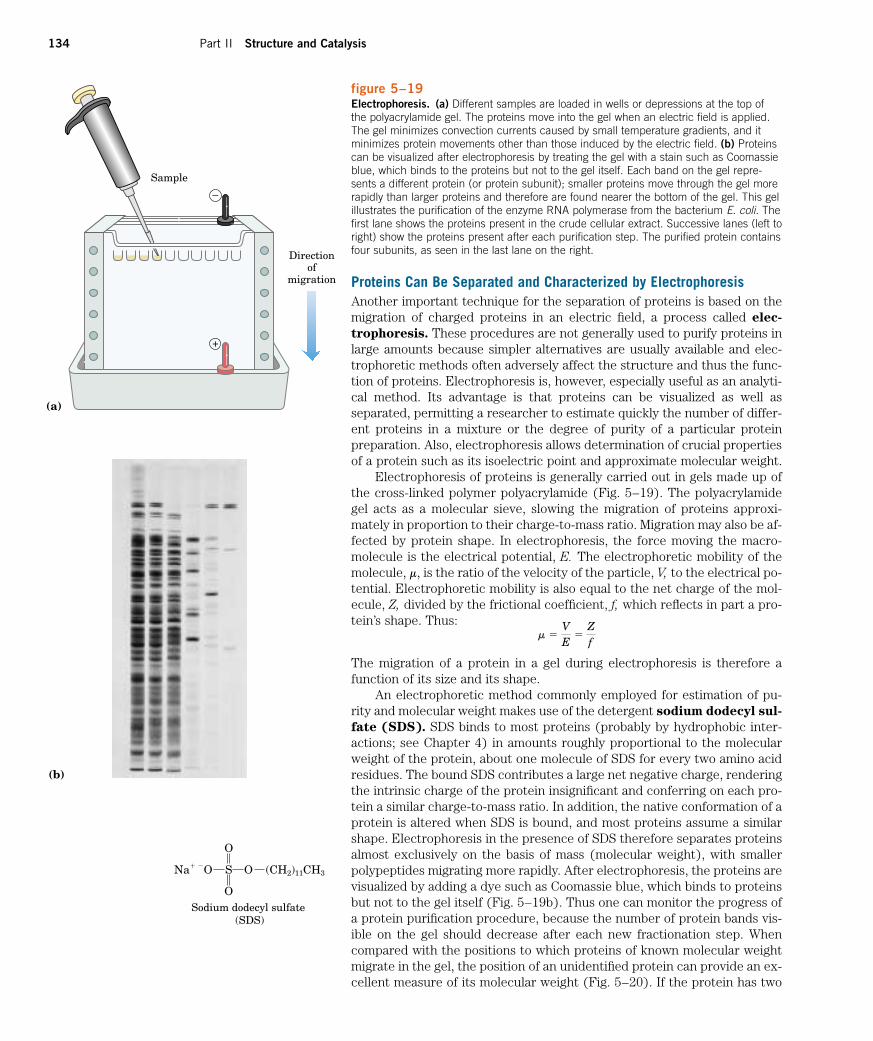
Proteins Can Be Separated and Characterized by ElectrophoresisAnother important technique for the separation of proteins is based on themigration of charged proteins in an electric field, a process called elec-
trophoresis. These procedures are not generally used to purify proteins inlarge amounts because simpler alternatives are usually available and elec-trophoretic methods often adversely affect the structure and thus the func-tion of proteins. Electrophoresis is, however, especially useful as an analyti-cal method. Its advantage is that proteins can be visualized as well asseparated, permitting a researcher to estimate quickly the number of differ-ent proteins in a mixture or the degree of purity of a particular proteinpreparation. Also, electrophoresis allows determination of crucial propertiesof a protein such as its isoelectric point and approximate molecular weight.
Electrophoresis of proteins is generally carried out in gels made up ofthe cross-linked polymer polyacrylamide (Fig. 5–19). The polyacrylamidegel acts as a molecular sieve, slowing the migration of proteins approxi-mately in proportion to their charge-to-mass ratio. Migration may also be af-fected by protein shape. In electrophoresis, the force moving the macro-molecule is the electrical potential, E. The electrophoretic mobility of themolecule, m, is the ratio of the velocity of the particle, V, to the electrical po-tential. Electrophoretic mobility is also equal to the net charge of the mol-ecule, Z, divided by the frictional coefficient, f, which reflects in part a pro-tein’s shape. Thus:
The migration of a protein in a gel during electrophoresis is therefore afunction of its size and its shape.
An electrophoretic method commonly employed for estimation of pu-rity and molecular weight makes use of the detergent sodium dodecyl sul-
fate (SDS). SDS binds to most proteins (probably by hydrophobic inter-actions; see Chapter 4) in amounts roughly proportional to the molecularweight of the protein, about one molecule of SDS for every two amino acidresidues. The bound SDS contributes a large net negative charge, renderingthe intrinsic charge of the protein insignificant and conferring on each pro-tein a similar charge-to-mass ratio. In addition, the native conformation of aprotein is altered when SDS is bound, and most proteins assume a similarshape. Electrophoresis in the presence of SDS therefore separates proteinsalmost exclusively on the basis of mass (molecular weight), with smallerpolypeptides migrating more rapidly. After electrophoresis, the proteins arevisualized by adding a dye such as Coomassie blue, which binds to proteinsbut not to the gel itself (Fig. 5–19b). Thus one can monitor the progress ofa protein purification procedure, because the number of protein bands vis-ible on the gel should decrease after each new fractionation step. Whencompared with the positions to which proteins of known molecular weightmigrate in the gel, the position of an unidentified protein can provide an ex-cellent measure of its molecular weight (Fig. 5–20). If the protein has two
�VE
�Zf
(CH2)11CH3
O
SNa� �O O
O
Sodium dodecyl sulfate (SDS)
Sample
Directionof
migration
+
–
(a)
(b)
figure 5–19Electrophoresis. (a) Different samples are loaded in wells or depressions at the top ofthe polyacrylamide gel. The proteins move into the gel when an electric field is applied.The gel minimizes convection currents caused by small temperature gradients, and itminimizes protein movements other than those induced by the electric field. (b) Proteinscan be visualized after electrophoresis by treating the gel with a stain such as Coomassieblue, which binds to the proteins but not to the gel itself. Each band on the gel repre-sents a different protein (or protein subunit); smaller proteins move through the gel morerapidly than larger proteins and therefore are found nearer the bottom of the gel. This gelillustrates the purification of the enzyme RNA polymerase from the bacterium E. coli. Thefirst lane shows the proteins present in the crude cellular extract. Successive lanes (left toright) show the proteins present after each purification step. The purified protein containsfour subunits, as seen in the last lane on the right.
Chapter 5 Amino Acids, Peptides, and Proteins 135
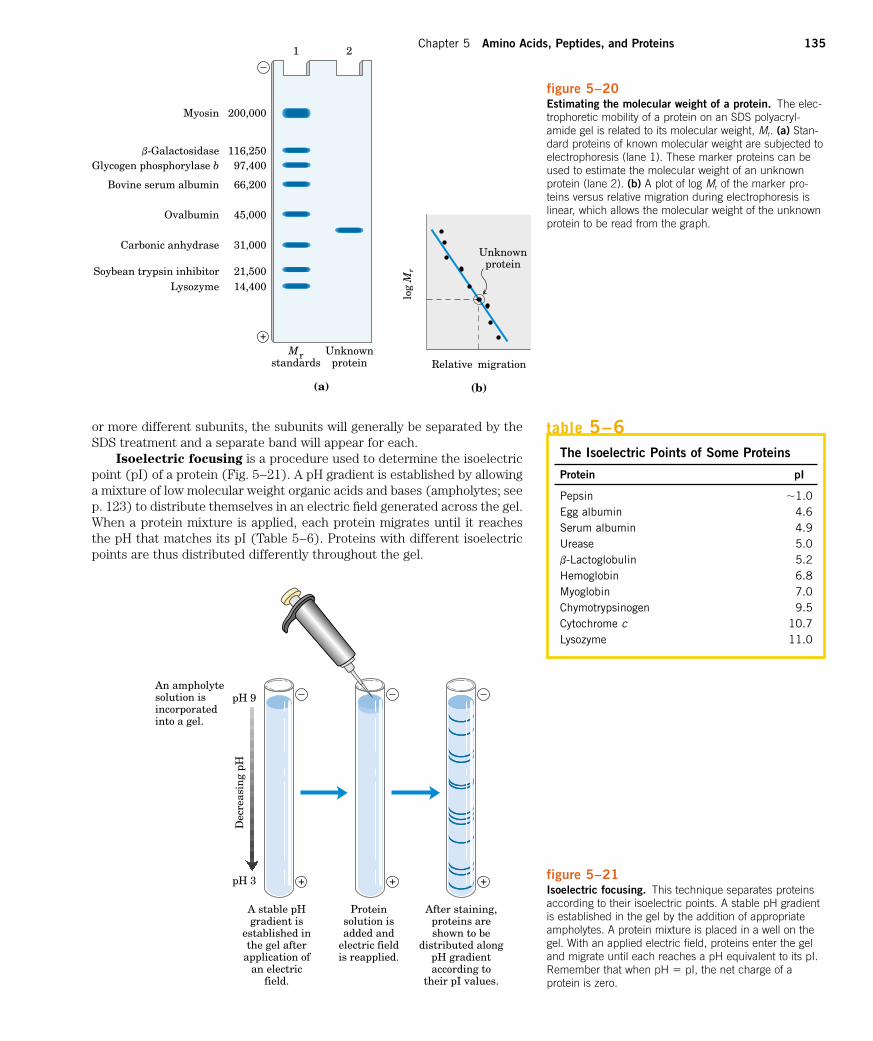
or more different subunits, the subunits will generally be separated by theSDS treatment and a separate band will appear for each.
Isoelectric focusing is a procedure used to determine the isoelectricpoint (pI) of a protein (Fig. 5–21). A pH gradient is established by allowinga mixture of low molecular weight organic acids and bases (ampholytes; seep. 123) to distribute themselves in an electric field generated across the gel.When a protein mixture is applied, each protein migrates until it reachesthe pH that matches its pI (Table 5–6). Proteins with different isoelectricpoints are thus distributed differently throughout the gel.
200,000
116,25097,400
66,200
45,000
31,000
21,50014,400
Mrstandards
Unknownprotein
Myosin
b-GalactosidaseGlycogen phosphorylase b
Bovine serum albumin
Ovalbumin
Carbonic anhydrase
Soybean trypsin inhibitorLysozyme
–
+
1 2
(a)
log
Mr
Relative migration
Unknownprotein
(b)
figure 5–20Estimating the molecular weight of a protein. The elec-trophoretic mobility of a protein on an SDS polyacryl-amide gel is related to its molecular weight, Mr. (a) Stan-dard proteins of known molecular weight are subjected toelectrophoresis (lane 1). These marker proteins can beused to estimate the molecular weight of an unknownprotein (lane 2). (b) A plot of log Mr of the marker pro-teins versus relative migration during electrophoresis islinear, which allows the molecular weight of the unknownprotein to be read from the graph.
figure 5–21Isoelectric focusing. This technique separates proteinsaccording to their isoelectric points. A stable pH gradientis established in the gel by the addition of appropriateampholytes. A protein mixture is placed in a well on thegel. With an applied electric field, proteins enter the geland migrate until each reaches a pH equivalent to its pI.Remember that when pH � pI, the net charge of aprotein is zero.
A stable pH gradient is
established in the gel after
application of an electric
field.
Protein solution is added and
electric field is reapplied.
After staining, proteins are shown to be
distributed along pH gradient according to
their pI values.
pH 9
pH 3
–
+
–
+
–
+
An ampholytesolution isincorporatedinto a gel.
Dec
reas
ing
pH
The Isoelectric Points of Some Proteins
Protein pI
Pepsin �1.0Egg albumin 4.6Serum albumin 4.9Urease 5.0b-Lactoglobulin 5.2Hemoglobin 6.8Myoglobin 7.0Chymotrypsinogen 9.5Cytochrome c 10.7Lysozyme 11.0
table 5–6
136 Part II Structure and Catalysis
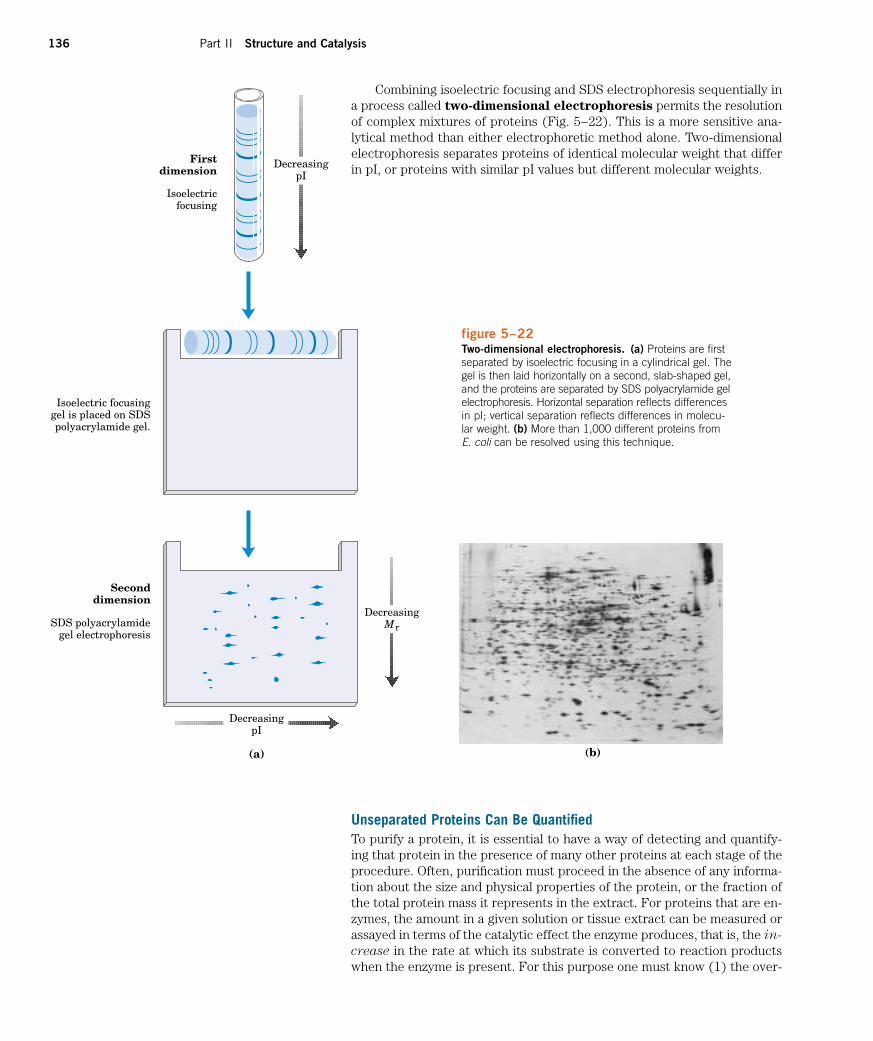
Combining isoelectric focusing and SDS electrophoresis sequentially ina process called two-dimensional electrophoresis permits the resolutionof complex mixtures of proteins (Fig. 5–22). This is a more sensitive ana-lytical method than either electrophoretic method alone. Two-dimensionalelectrophoresis separates proteins of identical molecular weight that differin pI, or proteins with similar pI values but different molecular weights.Decreasing
pI
Seconddimension
Firstdimension
Isoelectricfocusing
DecreasingMr
DecreasingpI
(a)
Isoelectric focusing gel is placed on SDS polyacrylamide gel.
SDS polyacrylamidegel electrophoresis
(b)
figure 5–22Two-dimensional electrophoresis. (a) Proteins are firstseparated by isoelectric focusing in a cylindrical gel. Thegel is then laid horizontally on a second, slab-shaped gel,and the proteins are separated by SDS polyacrylamide gelelectrophoresis. Horizontal separation reflects differencesin pI; vertical separation reflects differences in molecu-lar weight. (b) More than 1,000 different proteins fromE. coli can be resolved using this technique.
Unseparated Proteins Can Be QuantifiedTo purify a protein, it is essential to have a way of detecting and quantify-ing that protein in the presence of many other proteins at each stage of theprocedure. Often, purification must proceed in the absence of any informa-tion about the size and physical properties of the protein, or the fraction ofthe total protein mass it represents in the extract. For proteins that are en-zymes, the amount in a given solution or tissue extract can be measured orassayed in terms of the catalytic effect the enzyme produces, that is, the in-
crease in the rate at which its substrate is converted to reaction productswhen the enzyme is present. For this purpose one must know (1) the over-
Chapter 5 Amino Acids, Peptides, and Proteins 137
all equation of the reaction catalyzed, (2) an analytical procedure for de-termining the disappearance of the substrate or the appearance of a reac-tion product, (3) whether the enzyme requires cofactors such as metal ionsor coenzymes, (4) the dependence of the enzyme activity on substrate con-centration, (5) the optimum pH, and (6) a temperature zone in which theenzyme is stable and has high activity. Enzymes are usually assayed at theiroptimum pH and at some convenient temperature within the range 25 to 38 �C. Also, very high substrate concentrations are generally required sothat the initial reaction rate, measured experimentally, is proportional toenzyme concentration (Chapter 8).
By international agreement, 1.0 unit of enzyme activity is defined as theamount of enzyme causing transformation of 1.0 mmol of substrate perminute at 25 �C under optimal conditions of measurement. The term activ-
ity refers to the total units of enzyme in a solution. The specific activity
is the number of enzyme units per milligram of total protein (Fig. 5–23).The specific activity is a measure of enzyme purity: it increases during pu-rification of an enzyme and becomes maximal and constant when the en-zyme is pure (Table 5–5).
After each purification step, the activity of the preparation (in units) isassayed, the total amount of protein is determined independently, and theirratio gives the specific activity. Activity and total protein generally decreasewith each step. Activity decreases because some loss always occurs due toinactivation or nonideal interactions with chromatographic materials orother molecules in the solution. Total protein decreases because the objec-tive is to remove as much unwanted or nonspecific protein as possible. In asuccessful step, the loss of nonspecific protein is much greater than the lossof activity; therefore, specific activity increases even as total activity falls.The data are then assembled in a purification table similar to Table 5–5. Aprotein is generally considered pure when further purification steps fail toincrease specific activity and when only a single protein species can be de-tected (for example, by electrophoresis).
For proteins that are not enzymes, other quantification methods are required. Transport proteins can be assayed by their binding to the mole-cule they transport, and hormones and toxins by the biological effect theyproduce; for example, growth hormones will stimulate the growth of certaincultured cells. Some structural proteins represent such a large fraction of atissue mass that they can be readily extracted and purified without a func-tional assay. The approaches are as varied as the proteins themselves.
The Covalent Structure of ProteinsPurification of a protein is usually only a prelude to a detailed biochemicaldissection of its structure and function. What is it that makes one proteinan enzyme, another a hormone, another a structural protein, and still an-other an antibody? How do they differ chemically? The most obvious dis-tinctions are structural, and these distinctions can be approached at everylevel of structure defined in Figure 5–16.
The differences in primary structure can be especially informative.Each protein has a distinctive number and sequence of amino acid residues.As we shall see in Chapter 6, the primary structure of a protein determineshow it folds up into a unique three-dimensional structure, and this in turndetermines the function of the protein. Primary structure now becomes thefocus of the remainder of the chapter. We first consider empirical clues thatamino acid sequence and protein function are closely linked, then describehow amino acid sequence is determined, and finally outline the many usesto which this information can be put.
figure 5–23Activity versus specific activity. The difference betweenthese two terms can be illustrated by considering twobeakers of marbles. The beakers contain the samenumber of red marbles, but different numbers of marblesof other colors. If the marbles represent proteins, bothbeakers contain the same activity of the protein repre-sented by the red marbles. The second beaker, however,has the higher specific activity because here the redmarbles represent a much higher fraction of the total.
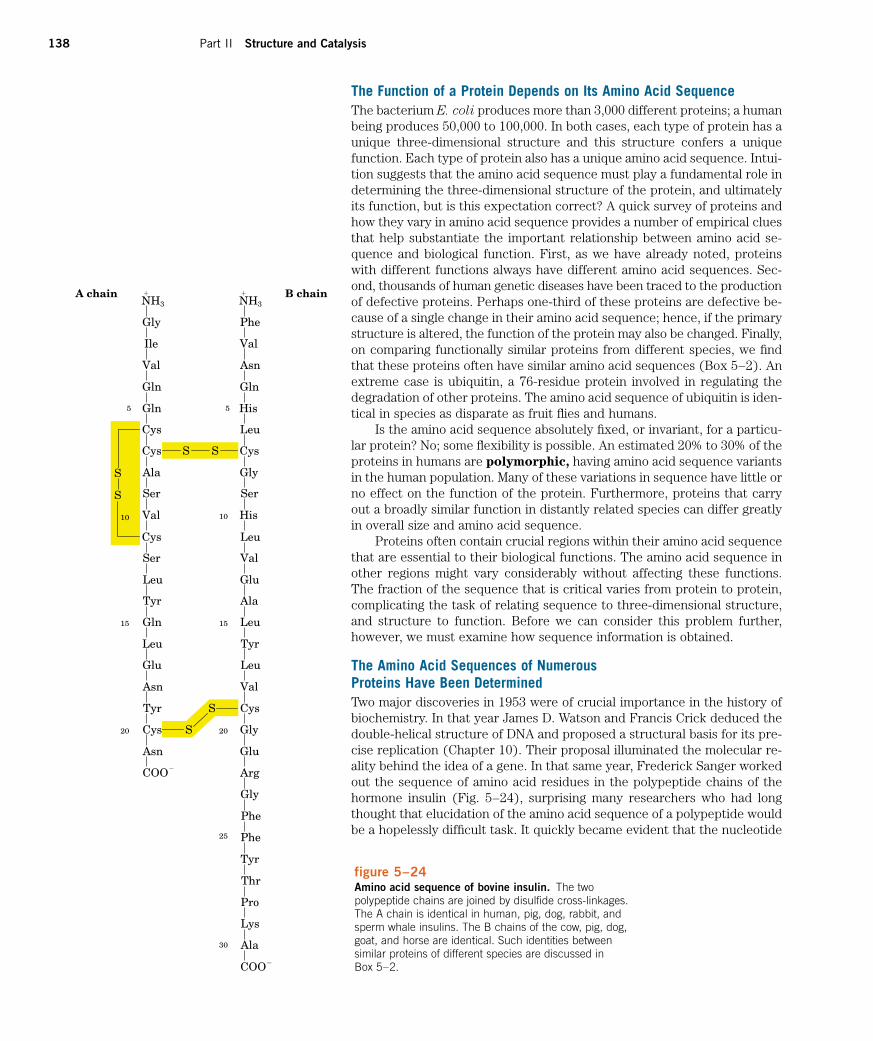
138 Part II Structure and Catalysis
figure 5–24Amino acid sequence of bovine insulin. The twopolypeptide chains are joined by disulfide cross-linkages.The A chain is identical in human, pig, dog, rabbit, andsperm whale insulins. The B chains of the cow, pig, dog,goat, and horse are identical. Such identities betweensimilar proteins of different species are discussed in Box 5–2.
Gly
Ile
Val
Gln
Gln
Cys
Cys
Ala
Val
Cys
Ser Val
Ser
Gly
Phe
Phe
Tyr
Thr
Pro
Lys
B chain
S S
S
S
S
5
10
20
25
20
15
30
5
10
15
S
�NH3
Ala
COO�
A chain
Phe
Val
Asn
His
Gln
Leu
Cys
Gly
Ser
�NH3
His
Leu
Glu
Ala
Leu
Tyr
Leu
Val
Cys
Gly
Glu
Arg
Leu
Tyr
Gln
Leu
Glu
Asn
Tyr
Cys
Asn
COO�
The Function of a Protein Depends on Its Amino Acid SequenceThe bacterium E. coli produces more than 3,000 different proteins; a humanbeing produces 50,000 to 100,000. In both cases, each type of protein has aunique three-dimensional structure and this structure confers a uniquefunction. Each type of protein also has a unique amino acid sequence. Intui-tion suggests that the amino acid sequence must play a fundamental role indetermining the three-dimensional structure of the protein, and ultimatelyits function, but is this expectation correct? A quick survey of proteins andhow they vary in amino acid sequence provides a number of empirical cluesthat help substantiate the important relationship between amino acid se-quence and biological function. First, as we have already noted, proteinswith different functions always have different amino acid sequences. Sec-ond, thousands of human genetic diseases have been traced to the productionof defective proteins. Perhaps one-third of these proteins are defective be-cause of a single change in their amino acid sequence; hence, if the primarystructure is altered, the function of the protein may also be changed. Finally,on comparing functionally similar proteins from different species, we findthat these proteins often have similar amino acid sequences (Box 5–2). Anextreme case is ubiquitin, a 76-residue protein involved in regulating thedegradation of other proteins. The amino acid sequence of ubiquitin is iden-tical in species as disparate as fruit flies and humans.
Is the amino acid sequence absolutely fixed, or invariant, for a particu-lar protein? No; some flexibility is possible. An estimated 20% to 30% of theproteins in humans are polymorphic, having amino acid sequence variantsin the human population. Many of these variations in sequence have little orno effect on the function of the protein. Furthermore, proteins that carryout a broadly similar function in distantly related species can differ greatlyin overall size and amino acid sequence.
Proteins often contain crucial regions within their amino acid sequencethat are essential to their biological functions. The amino acid sequence inother regions might vary considerably without affecting these functions.The fraction of the sequence that is critical varies from protein to protein,complicating the task of relating sequence to three-dimensional structure,and structure to function. Before we can consider this problem further,however, we must examine how sequence information is obtained.
The Amino Acid Sequences of Numerous Proteins Have Been DeterminedTwo major discoveries in 1953 were of crucial importance in the history ofbiochemistry. In that year James D. Watson and Francis Crick deduced thedouble-helical structure of DNA and proposed a structural basis for its pre-cise replication (Chapter 10). Their proposal illuminated the molecular re-ality behind the idea of a gene. In that same year, Frederick Sanger workedout the sequence of amino acid residues in the polypeptide chains of thehormone insulin (Fig. 5–24), surprising many researchers who had longthought that elucidation of the amino acid sequence of a polypeptide wouldbe a hopelessly difficult task. It quickly became evident that the nucleotide
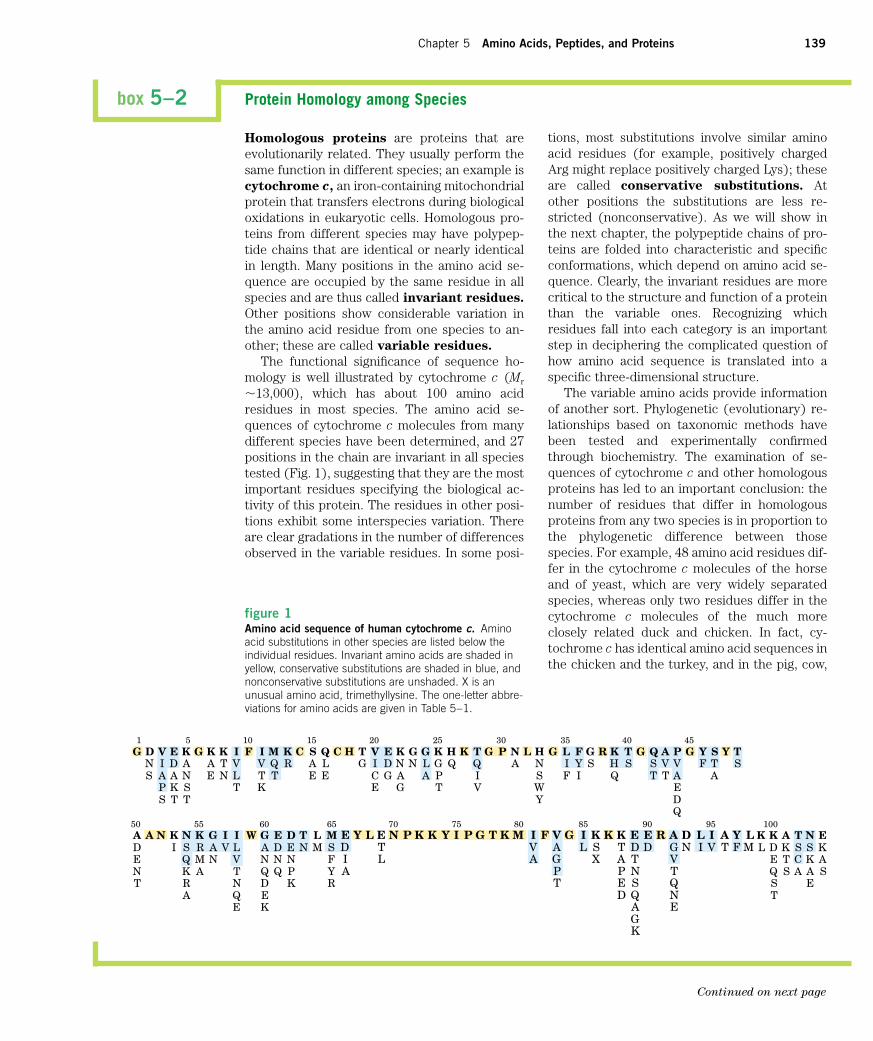
Chapter 5 Amino Acids, Peptides, and Proteins 139
box 5–2 Protein Homology among Species
Homologous proteins are proteins that areevolutionarily related. They usually perform thesame function in different species; an example iscytochrome c, an iron-containing mitochondrialprotein that transfers electrons during biologicaloxidations in eukaryotic cells. Homologous pro-teins from different species may have polypep-tide chains that are identical or nearly identicalin length. Many positions in the amino acid se-quence are occupied by the same residue in allspecies and are thus called invariant residues.
Other positions show considerable variation inthe amino acid residue from one species to an-other; these are called variable residues.
The functional significance of sequence ho-mology is well illustrated by cytochrome c (Mr
�13,000), which has about 100 amino acidresidues in most species. The amino acid se-quences of cytochrome c molecules from manydifferent species have been determined, and 27positions in the chain are invariant in all speciestested (Fig. 1), suggesting that they are the mostimportant residues specifying the biological ac-tivity of this protein. The residues in other posi-tions exhibit some interspecies variation. Thereare clear gradations in the number of differencesobserved in the variable residues. In some posi-
tions, most substitutions involve similar aminoacid residues (for example, positively chargedArg might replace positively charged Lys); theseare called conservative substitutions. Atother positions the substitutions are less re-stricted (nonconservative). As we will show inthe next chapter, the polypeptide chains of pro-teins are folded into characteristic and specificconformations, which depend on amino acid se-quence. Clearly, the invariant residues are morecritical to the structure and function of a proteinthan the variable ones. Recognizing whichresidues fall into each category is an importantstep in deciphering the complicated question ofhow amino acid sequence is translated into aspecific three-dimensional structure.
The variable amino acids provide informationof another sort. Phylogenetic (evolutionary) re-lationships based on taxonomic methods havebeen tested and experimentally confirmedthrough biochemistry. The examination of se-quences of cytochrome c and other homologousproteins has led to an important conclusion: thenumber of residues that differ in homologousproteins from any two species is in proportion tothe phylogenetic difference between thosespecies. For example, 48 amino acid residues dif-fer in the cytochrome c molecules of the horseand of yeast, which are very widely separatedspecies, whereas only two residues differ in thecytochrome c molecules of the much moreclosely related duck and chicken. In fact, cy-tochrome c has identical amino acid sequences inthe chicken and the turkey, and in the pig, cow,
figure 1Amino acid sequence of human cytochrome c. Aminoacid substitutions in other species are listed below theindividual residues. Invariant amino acids are shaded inyellow, conservative substitutions are shaded in blue, andnonconservative substitutions are unshaded. X is anunusual amino acid, trimethyllysine. The one-letter abbre-viations for amino acids are given in Table 5–1.
1 5 10 15 20 25 30G D V E K G K K I F I M K C S Q C H T V E K G G K H K T G P N L H
N I D A A T V V Q R A L G I D N N L G Q Q A NS A A N E N L T T E E C G A A P I S
P K S T K E G T V WS T T Y
35 40 45
50 55 60 65
G L F G R K T G Q A P G Y S Y T
A K N K G I I W G E D T L M
I Y S H S S V V F T S
D I S R A V L A D E N M S
F I Q T A A
E Q M N V N N N F
E
N K A T Q Q P Y
D
T R N D K R
Q
A Q EE K
70 75 80 85 90 95E Y L E N P K K Y I P G T K M I F V G I K K K E E R A D L I A Y LD T V A L S T D D G N I V T F MI L A G X A T VA P P N T
T E S QD Q N
A EGK
100K K A T N EL D K S S K
E T C K AQ S A A SS ET
T
A N
Continued on next page
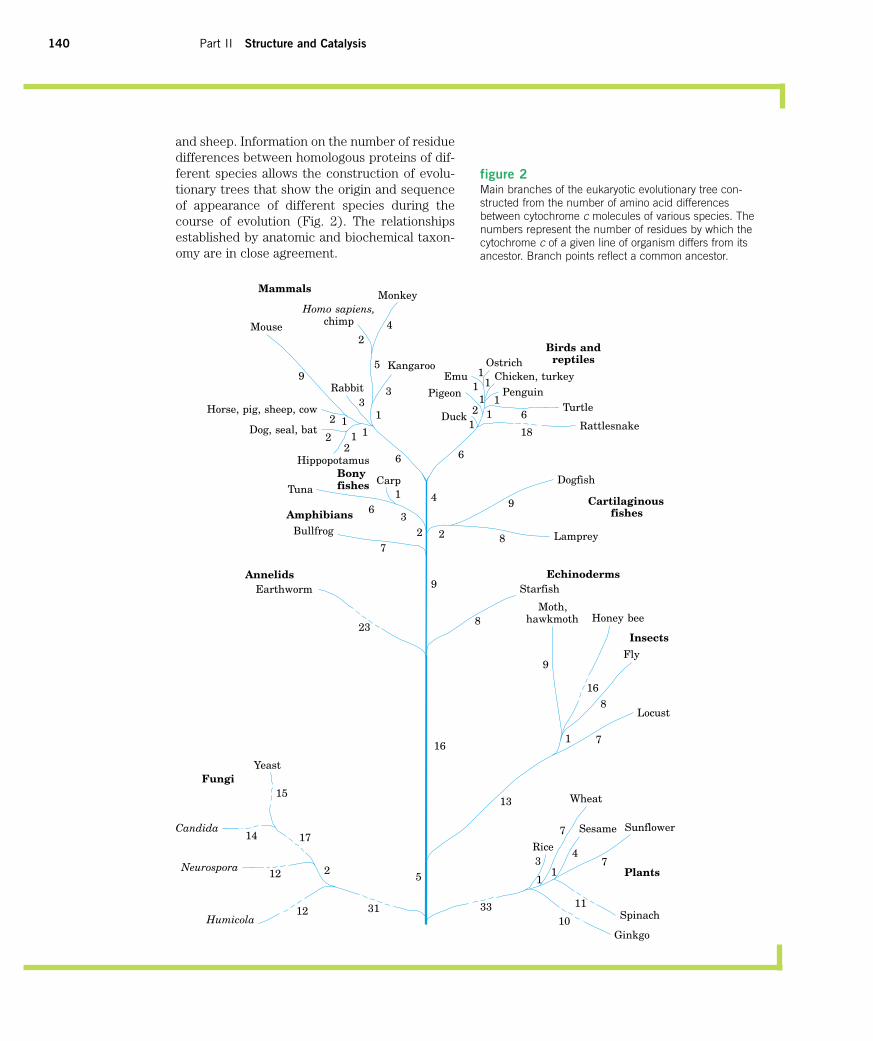
140 Part II Structure and Catalysis
and sheep. Information on the number of residuedifferences between homologous proteins of dif-ferent species allows the construction of evolu-tionary trees that show the origin and sequenceof appearance of different species during thecourse of evolution (Fig. 2). The relationshipsestablished by anatomic and biochemical taxon-omy are in close agreement.
figure 2Main branches of the eukaryotic evolutionary tree con-structed from the number of amino acid differencesbetween cytochrome c molecules of various species. Thenumbers represent the number of residues by which thecytochrome c of a given line of organism differs from itsancestor. Branch points reflect a common ancestor.
Homo sapiens,
Birds and
Kangaroo
chimp
reptiles
Emu Chicken, turkeyPenguin
Turtle
Rattlesnake
Rabbit
Horse, pig, sheep, cow
Dog, seal, bat
Hippopotamus
TunaCarp
Bony
Amphibians
Annelids Echinoderms
fishes
Bullfrog
Earthworm
Dogfish
Cartilaginous
Moth,Honey bee
Insects
fishes
hawkmoth
Fly
Locust
FungiYeast
Candida
Neurospora
Humicola
Rice
Wheat
Sesame Sunflower
Plants
Spinach
Ginkgo
1
Mammals
Ostrich
Duck
Pigeon
Mouse
Monkey
3331
23
18
17
16
15
14
13
1211
10
9
8
7
6
5
4
3
2
Starfish
Lamprey
2
4
5
39
2
6
6
6
3
1
1
1
2
2
1
2
11
11
11
1
1
4
2
23
8
7
9
9
16
71
8
12
7
1
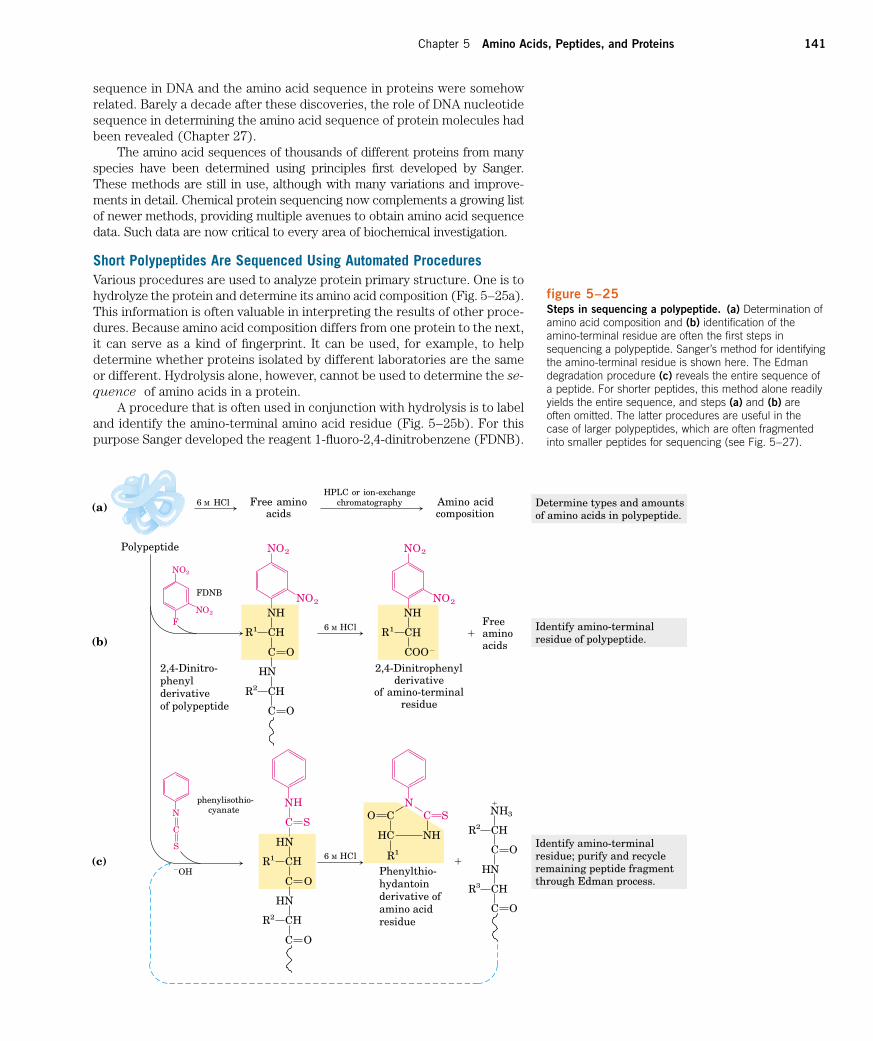
sequence in DNA and the amino acid sequence in proteins were somehowrelated. Barely a decade after these discoveries, the role of DNA nucleotidesequence in determining the amino acid sequence of protein molecules hadbeen revealed (Chapter 27).
The amino acid sequences of thousands of different proteins from manyspecies have been determined using principles first developed by Sanger.These methods are still in use, although with many variations and improve-ments in detail. Chemical protein sequencing now complements a growing listof newer methods, providing multiple avenues to obtain amino acid sequencedata. Such data are now critical to every area of biochemical investigation.
Short Polypeptides Are Sequenced Using Automated ProceduresVarious procedures are used to analyze protein primary structure. One is tohydrolyze the protein and determine its amino acid composition (Fig. 5–25a).This information is often valuable in interpreting the results of other proce-dures. Because amino acid composition differs from one protein to the next,it can serve as a kind of fingerprint. It can be used, for example, to help determine whether proteins isolated by different laboratories are the sameor different. Hydrolysis alone, however, cannot be used to determine the se-
quence of amino acids in a protein.A procedure that is often used in conjunction with hydrolysis is to label
and identify the amino-terminal amino acid residue (Fig. 5–25b). For thispurpose Sanger developed the reagent 1-fluoro-2,4-dinitrobenzene (FDNB).
figure 5–25Steps in sequencing a polypeptide. (a) Determination ofamino acid composition and (b) identification of theamino-terminal residue are often the first steps insequencing a polypeptide. Sanger’s method for identifyingthe amino-terminal residue is shown here. The Edmandegradation procedure (c) reveals the entire sequence ofa peptide. For shorter peptides, this method alone readilyyields the entire sequence, and steps (a) and (b) areoften omitted. The latter procedures are useful in thecase of larger polypeptides, which are often fragmentedinto smaller peptides for sequencing (see Fig. 5–27).
(a) 6 M HCl Free amino chromatographyHPLC or ion-exchange
Amino acidacids composition
Polypeptide
Determine types and amountsof amino acids in polypeptide.
(c)
� aminoacids
R1 C
NH
C
HN
R2 C
C O
H
O
H R1 C
NH
COO�
H
2,4-Dinitro-phenylderivativeof polypeptide
2,4-Dinitrophenylderivative
of amino-terminalresidue
N
C
S
cyanatephenylisothio-
�OH
N
C
HN
R1 C
O
HN
R2 C
C O
H
H
S
HC
NC
NH
S
HC
R1
Phenylthio-hydantoinderivative ofamino acid residue
R3 C
HN
C
R
�
C
NO2
H
O
C O
H
Identify amino-terminalresidue of polypeptide.
Identify amino-terminalresidue; purify and recycleremaining peptide fragmentthrough Edman process.
NO2
F
FDNB
NO2
NH3
NO2
NO2
NO2
(b)
�
Free
O
6 M HCl
2C
6 M HCl
Chapter 5 Amino Acids, Peptides, and Proteins 141
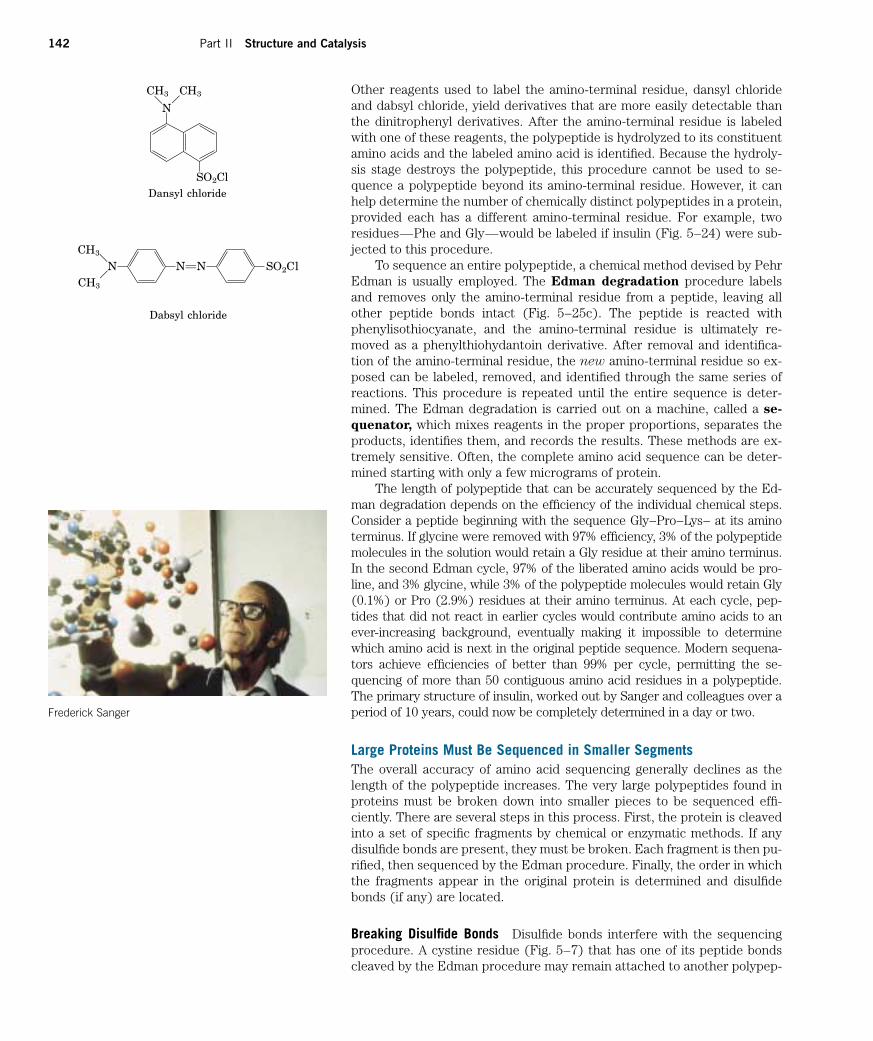
142 Part II Structure and Catalysis
Other reagents used to label the amino-terminal residue, dansyl chlorideand dabsyl chloride, yield derivatives that are more easily detectable thanthe dinitrophenyl derivatives. After the amino-terminal residue is labeledwith one of these reagents, the polypeptide is hydrolyzed to its constituentamino acids and the labeled amino acid is identified. Because the hydroly-sis stage destroys the polypeptide, this procedure cannot be used to se-quence a polypeptide beyond its amino-terminal residue. However, it canhelp determine the number of chemically distinct polypeptides in a protein,provided each has a different amino-terminal residue. For example, tworesidues—Phe and Gly—would be labeled if insulin (Fig. 5–24) were sub-jected to this procedure.
To sequence an entire polypeptide, a chemical method devised by PehrEdman is usually employed. The Edman degradation procedure labelsand removes only the amino-terminal residue from a peptide, leaving allother peptide bonds intact (Fig. 5–25c). The peptide is reacted withphenylisothiocyanate, and the amino-terminal residue is ultimately re-moved as a phenylthiohydantoin derivative. After removal and identifica-tion of the amino-terminal residue, the new amino-terminal residue so ex-posed can be labeled, removed, and identified through the same series ofreactions. This procedure is repeated until the entire sequence is deter-mined. The Edman degradation is carried out on a machine, called a se-
quenator, which mixes reagents in the proper proportions, separates theproducts, identifies them, and records the results. These methods are ex-tremely sensitive. Often, the complete amino acid sequence can be deter-mined starting with only a few micrograms of protein.
The length of polypeptide that can be accurately sequenced by the Ed-man degradation depends on the efficiency of the individual chemical steps.Consider a peptide beginning with the sequence Gly–Pro–Lys– at its aminoterminus. If glycine were removed with 97% efficiency, 3% of the polypeptidemolecules in the solution would retain a Gly residue at their amino terminus.In the second Edman cycle, 97% of the liberated amino acids would be pro-line, and 3% glycine, while 3% of the polypeptide molecules would retain Gly(0.1%) or Pro (2.9%) residues at their amino terminus. At each cycle, pep-tides that did not react in earlier cycles would contribute amino acids to anever-increasing background, eventually making it impossible to determinewhich amino acid is next in the original peptide sequence. Modern sequena-tors achieve efficiencies of better than 99% per cycle, permitting the se-quencing of more than 50 contiguous amino acid residues in a polypeptide.The primary structure of insulin, worked out by Sanger and colleagues over aperiod of 10 years, could now be completely determined in a day or two.
Large Proteins Must Be Sequenced in Smaller SegmentsThe overall accuracy of amino acid sequencing generally declines as thelength of the polypeptide increases. The very large polypeptides found inproteins must be broken down into smaller pieces to be sequenced effi-ciently. There are several steps in this process. First, the protein is cleavedinto a set of specific fragments by chemical or enzymatic methods. If anydisulfide bonds are present, they must be broken. Each fragment is then pu-rified, then sequenced by the Edman procedure. Finally, the order in whichthe fragments appear in the original protein is determined and disulfidebonds (if any) are located.
Breaking Disulfide Bonds Disulfide bonds interfere with the sequencingprocedure. A cystine residue (Fig. 5–7) that has one of its peptide bondscleaved by the Edman procedure may remain attached to another polypep-
O2ClNG
CH3
DCH3
NPN
Dabsyl chloride
S
NG
CH3D
CH3
Dansyl chlorideO2ClS
Frederick Sanger
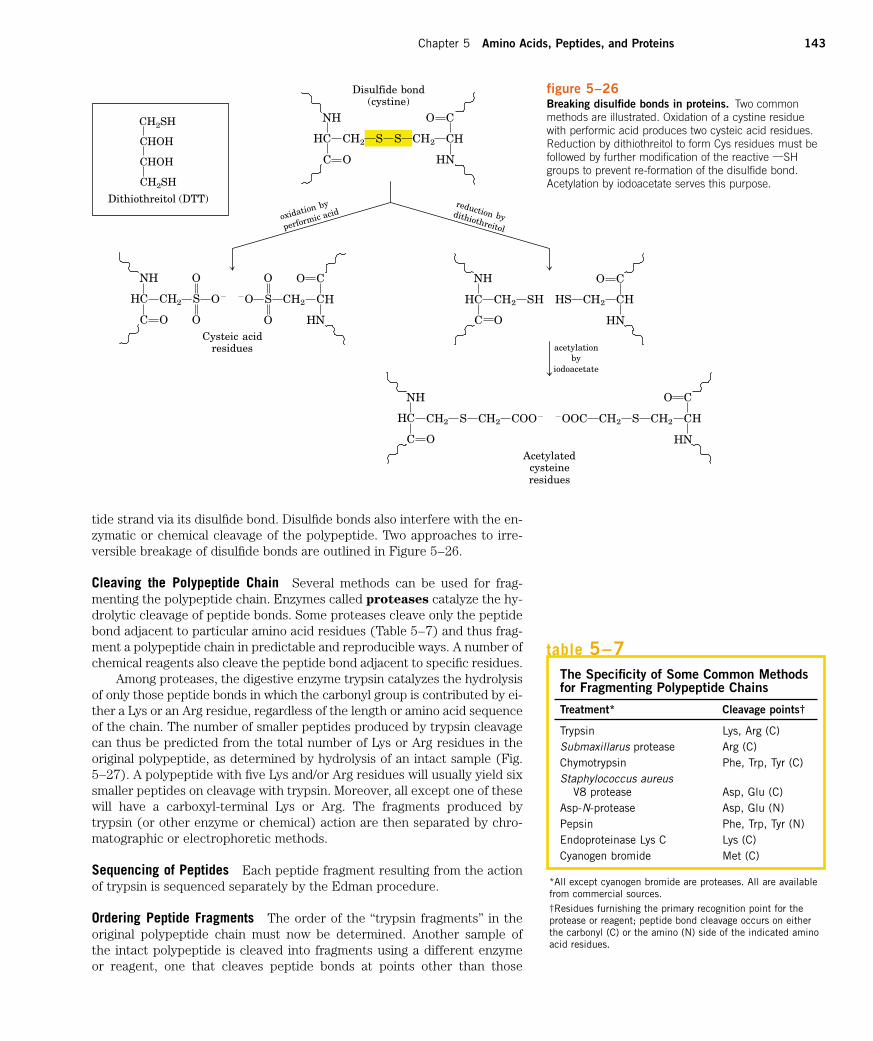
Disulfide bond(cystine)
HC
NH
C O
CH2 S S CH2 C
O C
HN
H
oxidation by reduction byperformic acid dithiothreitol
HC
NH
C O
CH2 S
O
O
O� �O S
O
O
CH2 C
O C
HN
H HC
NH
C O
CH2 SH HS CH2 C
O C
HN
H
Cysteic acidresidues acetylation
byiodoacetate
HC
NH
C O
CH2 S CH2 COO� �OOC CH2 S CH2 C
O C
HN
H
Acetylatedcysteineresidues
CH2SH
CHOH
CHOH
CH2SH
Dithiothreitol (DTT)
Chapter 5 Amino Acids, Peptides, and Proteins 143
figure 5–26Breaking disulfide bonds in proteins. Two commonmethods are illustrated. Oxidation of a cystine residuewith performic acid produces two cysteic acid residues.Reduction by dithiothreitol to form Cys residues must befollowed by further modification of the reactive XSHgroups to prevent re-formation of the disulfide bond.Acetylation by iodoacetate serves this purpose.
tide strand via its disulfide bond. Disulfide bonds also interfere with the en-zymatic or chemical cleavage of the polypeptide. Two approaches to irre-versible breakage of disulfide bonds are outlined in Figure 5–26.
Cleaving the Polypeptide Chain Several methods can be used for frag-menting the polypeptide chain. Enzymes called proteases catalyze the hy-drolytic cleavage of peptide bonds. Some proteases cleave only the peptidebond adjacent to particular amino acid residues (Table 5–7) and thus frag-ment a polypeptide chain in predictable and reproducible ways. A number ofchemical reagents also cleave the peptide bond adjacent to specific residues.
Among proteases, the digestive enzyme trypsin catalyzes the hydrolysisof only those peptide bonds in which the carbonyl group is contributed by ei-ther a Lys or an Arg residue, regardless of the length or amino acid sequenceof the chain. The number of smaller peptides produced by trypsin cleavagecan thus be predicted from the total number of Lys or Arg residues in theoriginal polypeptide, as determined by hydrolysis of an intact sample (Fig.5–27). A polypeptide with five Lys and/or Arg residues will usually yield sixsmaller peptides on cleavage with trypsin. Moreover, all except one of thesewill have a carboxyl-terminal Lys or Arg. The fragments produced bytrypsin (or other enzyme or chemical) action are then separated by chro-matographic or electrophoretic methods.
Sequencing of Peptides Each peptide fragment resulting from the actionof trypsin is sequenced separately by the Edman procedure.
Ordering Peptide Fragments The order of the “trypsin fragments” in theoriginal polypeptide chain must now be determined. Another sample ofthe intact polypeptide is cleaved into fragments using a different enzymeor reagent, one that cleaves peptide bonds at points other than those
The Specificity of Some Common Methodsfor Fragmenting Polypeptide Chains
Treatment* Cleavage points†
Trypsin Lys, Arg (C)Submaxillarus protease Arg (C)Chymotrypsin Phe, Trp, Tyr (C)Staphylococcus aureus
V8 protease Asp, Glu (C)Asp-N-protease Asp, Glu (N)Pepsin Phe, Trp, Tyr (N)Endoproteinase Lys C Lys (C)Cyanogen bromide Met (C)
*All except cyanogen bromide are proteases. All are availablefrom commercial sources.†Residues furnishing the primary recognition point for theprotease or reagent; peptide bond cleavage occurs on eitherthe carbonyl (C) or the amino (N) side of the indicated aminoacid residues.
table 5–7
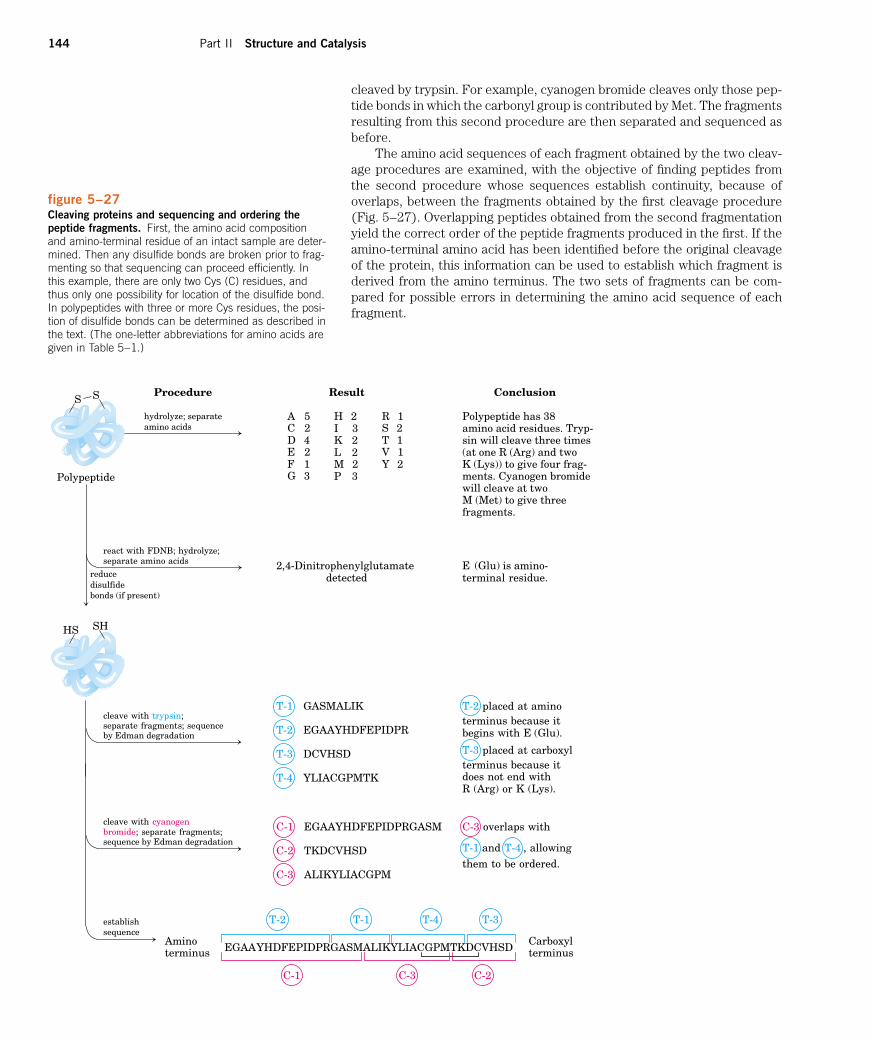
144 Part II Structure and Catalysis
hydrolyze; separateamino acids
Result
A 5I 3
R 1C 2
K 2S 2
D 4L 2
T 1E 2
M 2F 1G 3 P 3
Y 2
H 2
Conclusion
Polypeptide has 38amino acid residues. Tryp-sin will cleave three times(at one R (Arg) and twoK (Lys)) to give four frag-ments. Cyanogen bromidewill cleave at twoM (Met) to give threefragments.
Polypeptide
react with FDNB; hydrolyze;separate amino acids 2,4-Dinitrophenylglutamate
detectedE (Glu) is amino-terminal residue.reduce
disulfidebonds (if present)
by Edman degradationseparate fragments; sequencecleave with trypsin;
T-1 GASMALIK
T-2 EGAAYHDFEPIDPR
T-3 DCVHSD
T-4 YLIACGPMTK
T-2
begins with E (Glu).
T-3terminus because itdoes not end withR (Arg) or K (Lys).
sequence by Edman degradationbromide; separate fragments;cleave with cyanogen C-1 EGAAYHDFEPIDPRGASM
C-3 ALIKYLIACGPM
C-3
them to be ordered.
sequenceestablish
Amino Carboxylterminus terminus
T-2
EGAAYHDFEPIDPRGASMALIKYLIACGPMTKDCVHSD
C-1
Procedure
C-2 TKDCVHSD
T-3T-4T-1
C-3 C-2
SH
V 1
terminus because it
T-1
HS
placed at amino
placed at carboxyl
and T-4 , allowing
overlaps with
SS
figure 5–27Cleaving proteins and sequencing and ordering thepeptide fragments. First, the amino acid compositionand amino-terminal residue of an intact sample are deter-mined. Then any disulfide bonds are broken prior to frag-menting so that sequencing can proceed efficiently. Inthis example, there are only two Cys (C) residues, andthus only one possibility for location of the disulfide bond.In polypeptides with three or more Cys residues, the posi-tion of disulfide bonds can be determined as described inthe text. (The one-letter abbreviations for amino acids aregiven in Table 5–1.)
cleaved by trypsin. For example, cyanogen bromide cleaves only those pep-tide bonds in which the carbonyl group is contributed by Met. The fragmentsresulting from this second procedure are then separated and sequenced asbefore.
The amino acid sequences of each fragment obtained by the two cleav-age procedures are examined, with the objective of finding peptides fromthe second procedure whose sequences establish continuity, because ofoverlaps, between the fragments obtained by the first cleavage procedure(Fig. 5–27). Overlapping peptides obtained from the second fragmentationyield the correct order of the peptide fragments produced in the first. If theamino-terminal amino acid has been identified before the original cleavageof the protein, this information can be used to establish which fragment isderived from the amino terminus. The two sets of fragments can be com-pared for possible errors in determining the amino acid sequence of eachfragment.
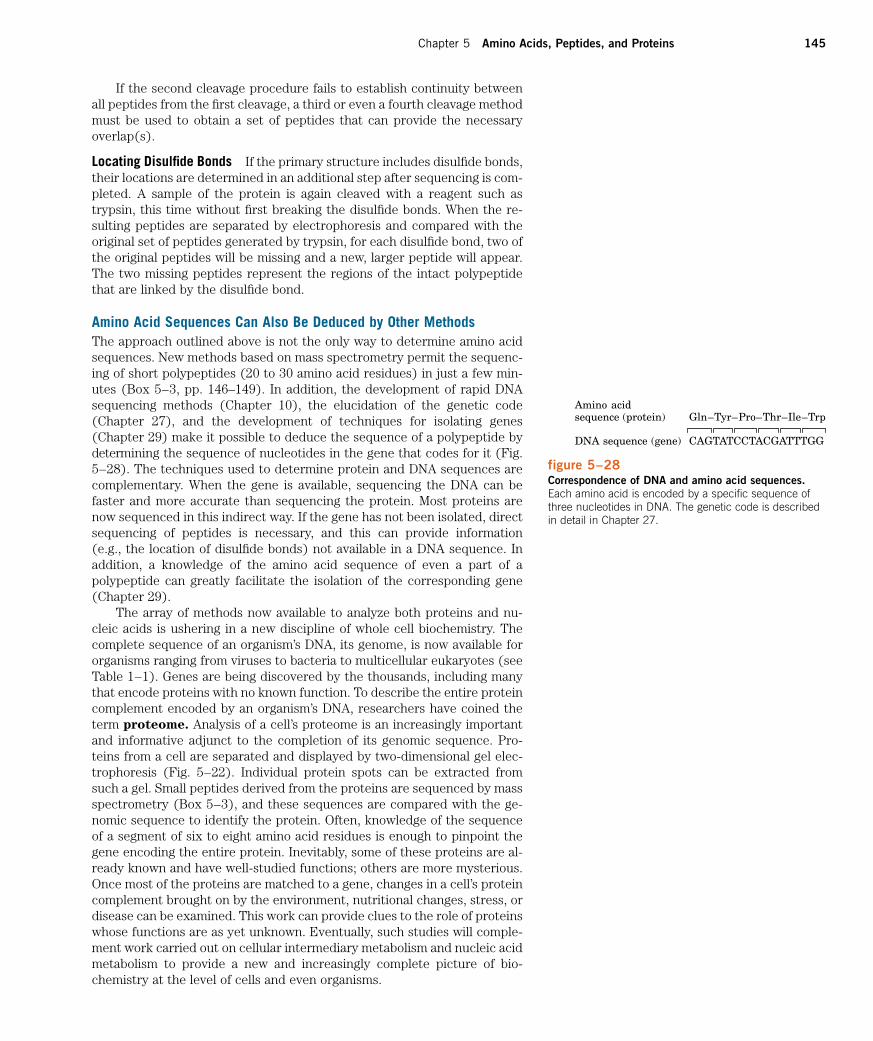
Chapter 5 Amino Acids, Peptides, and Proteins 145
If the second cleavage procedure fails to establish continuity betweenall peptides from the first cleavage, a third or even a fourth cleavage methodmust be used to obtain a set of peptides that can provide the necessaryoverlap(s).
Locating Disulfide Bonds If the primary structure includes disulfide bonds,their locations are determined in an additional step after sequencing is com-pleted. A sample of the protein is again cleaved with a reagent such astrypsin, this time without first breaking the disulfide bonds. When the re-sulting peptides are separated by electrophoresis and compared with theoriginal set of peptides generated by trypsin, for each disulfide bond, two ofthe original peptides will be missing and a new, larger peptide will appear.The two missing peptides represent the regions of the intact polypeptidethat are linked by the disulfide bond.
Amino Acid Sequences Can Also Be Deduced by Other MethodsThe approach outlined above is not the only way to determine amino acidsequences. New methods based on mass spectrometry permit the sequenc-ing of short polypeptides (20 to 30 amino acid residues) in just a few min-utes (Box 5–3, pp. 146–149). In addition, the development of rapid DNAsequencing methods (Chapter 10), the elucidation of the genetic code(Chapter 27), and the development of techniques for isolating genes (Chapter 29) make it possible to deduce the sequence of a polypeptide by determining the sequence of nucleotides in the gene that codes for it (Fig.5–28). The techniques used to determine protein and DNA sequences arecomplementary. When the gene is available, sequencing the DNA can befaster and more accurate than sequencing the protein. Most proteins arenow sequenced in this indirect way. If the gene has not been isolated, directsequencing of peptides is necessary, and this can provide information (e.g., the location of disulfide bonds) not available in a DNA sequence. Inaddition, a knowledge of the amino acid sequence of even a part of apolypeptide can greatly facilitate the isolation of the corresponding gene(Chapter 29).
The array of methods now available to analyze both proteins and nu-cleic acids is ushering in a new discipline of whole cell biochemistry. Thecomplete sequence of an organism’s DNA, its genome, is now available fororganisms ranging from viruses to bacteria to multicellular eukaryotes (seeTable 1–1). Genes are being discovered by the thousands, including manythat encode proteins with no known function. To describe the entire proteincomplement encoded by an organism’s DNA, researchers have coined theterm proteome. Analysis of a cell’s proteome is an increasingly importantand informative adjunct to the completion of its genomic sequence. Pro-teins from a cell are separated and displayed by two-dimensional gel elec-trophoresis (Fig. 5–22). Individual protein spots can be extracted fromsuch a gel. Small peptides derived from the proteins are sequenced by massspectrometry (Box 5–3), and these sequences are compared with the ge-nomic sequence to identify the protein. Often, knowledge of the sequenceof a segment of six to eight amino acid residues is enough to pinpoint thegene encoding the entire protein. Inevitably, some of these proteins are al-ready known and have well-studied functions; others are more mysterious.Once most of the proteins are matched to a gene, changes in a cell’s proteincomplement brought on by the environment, nutritional changes, stress, ordisease can be examined. This work can provide clues to the role of proteinswhose functions are as yet unknown. Eventually, such studies will comple-ment work carried out on cellular intermediary metabolism and nucleic acidmetabolism to provide a new and increasingly complete picture of bio-chemistry at the level of cells and even organisms.
figure 5–28Correspondence of DNA and amino acid sequences.Each amino acid is encoded by a specific sequence ofthree nucleotides in DNA. The genetic code is describedin detail in Chapter 27.
sequence (protein) Gln–Tyr–Pro–Thr–Ile–Trp
DNA sequence (gene) CAGTATCCTACGATTTGG
Amino acid
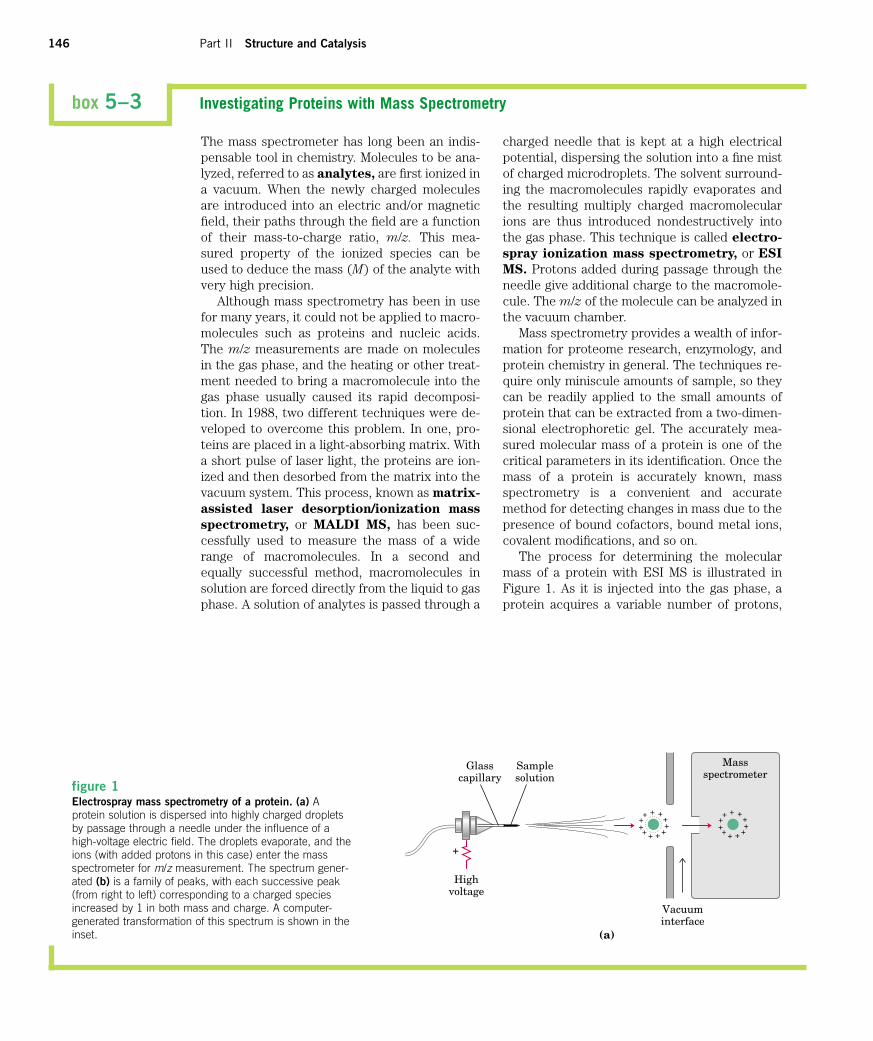
146 Part II Structure and Catalysis
box 5–3 Investigating Proteins with Mass Spectrometry
The mass spectrometer has long been an indis-pensable tool in chemistry. Molecules to be ana-lyzed, referred to as analytes, are first ionized ina vacuum. When the newly charged moleculesare introduced into an electric and/or magneticfield, their paths through the field are a functionof their mass-to-charge ratio, m/z. This mea-sured property of the ionized species can beused to deduce the mass (M) of the analyte withvery high precision.
Although mass spectrometry has been in usefor many years, it could not be applied to macro-molecules such as proteins and nucleic acids.The m/z measurements are made on moleculesin the gas phase, and the heating or other treat-ment needed to bring a macromolecule into thegas phase usually caused its rapid decomposi-tion. In 1988, two different techniques were de-veloped to overcome this problem. In one, pro-teins are placed in a light-absorbing matrix. Witha short pulse of laser light, the proteins are ion-ized and then desorbed from the matrix into thevacuum system. This process, known as matrix-
assisted laser desorption/ionization mass
spectrometry, or MALDI MS, has been suc-cessfully used to measure the mass of a widerange of macromolecules. In a second andequally successful method, macromolecules insolution are forced directly from the liquid to gasphase. A solution of analytes is passed through a
charged needle that is kept at a high electricalpotential, dispersing the solution into a fine mistof charged microdroplets. The solvent surround-ing the macromolecules rapidly evaporates andthe resulting multiply charged macromolecularions are thus introduced nondestructively intothe gas phase. This technique is called electro-
spray ionization mass spectrometry, or ESI
MS. Protons added during passage through theneedle give additional charge to the macromole-cule. The m/z of the molecule can be analyzed inthe vacuum chamber.
Mass spectrometry provides a wealth of infor-mation for proteome research, enzymology, andprotein chemistry in general. The techniques re-quire only miniscule amounts of sample, so theycan be readily applied to the small amounts ofprotein that can be extracted from a two-dimen-sional electrophoretic gel. The accurately mea-sured molecular mass of a protein is one of thecritical parameters in its identification. Once themass of a protein is accurately known, massspectrometry is a convenient and accuratemethod for detecting changes in mass due to thepresence of bound cofactors, bound metal ions,covalent modifications, and so on.
The process for determining the molecularmass of a protein with ESI MS is illustrated inFigure 1. As it is injected into the gas phase, aprotein acquires a variable number of protons,
Massspectrometer
Vacuuminterface
Glasscapillary
Samplesolution
Highvoltage
+
(a)
figure 1Electrospray mass spectrometry of a protein. (a) Aprotein solution is dispersed into highly charged dropletsby passage through a needle under the influence of ahigh-voltage electric field. The droplets evaporate, and theions (with added protons in this case) enter the massspectrometer for m/z measurement. The spectrum gener-ated (b) is a family of peaks, with each successive peak(from right to left) corresponding to a charged speciesincreased by 1 in both mass and charge. A computer-generated transformation of this spectrum is shown in theinset.
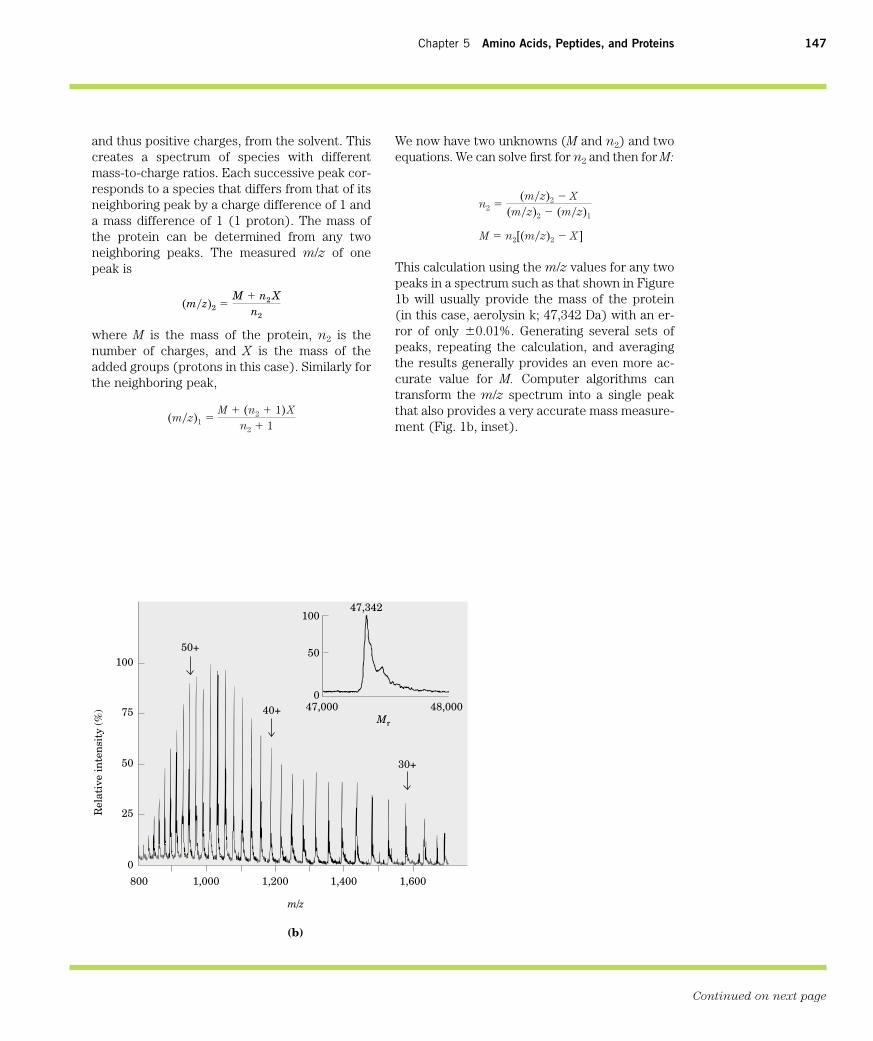
Chapter 5 Amino Acids, Peptides, and Proteins 147
and thus positive charges, from the solvent. Thiscreates a spectrum of species with differentmass-to-charge ratios. Each successive peak cor-responds to a species that differs from that of itsneighboring peak by a charge difference of 1 anda mass difference of 1 (1 proton). The mass ofthe protein can be determined from any twoneighboring peaks. The measured m/z of onepeak is
where M is the mass of the protein, n2 is thenumber of charges, and X is the mass of theadded groups (protons in this case). Similarly forthe neighboring peak,
(m�z)1 �M � (n2 � 1) X
n2 � 1
(m�z)2 �M � n2 X
n2
We now have two unknowns (M and n2) and twoequations. We can solve first for n2 and then for M:
This calculation using the m/z values for any twopeaks in a spectrum such as that shown in Figure1b will usually provide the mass of the protein(in this case, aerolysin k; 47,342 Da) with an er-ror of only 0.01%. Generating several sets ofpeaks, repeating the calculation, and averagingthe results generally provides an even more ac-curate value for M. Computer algorithms cantransform the m/z spectrum into a single peakthat also provides a very accurate mass measure-ment (Fig. 1b, inset).
M � n2[(m�z)2 � X ]
n2 �(m�z)2 � X
(m�z)2 � (m�z)1
10050+
75
50
Rel
ativ
e in
ten
sity
(%)
25
0
800 1,000 1,200
m/z
40+
100
50
047,000 48,000
47,342
30+
1,400 1,600
Mr
(b)
Continued on next page
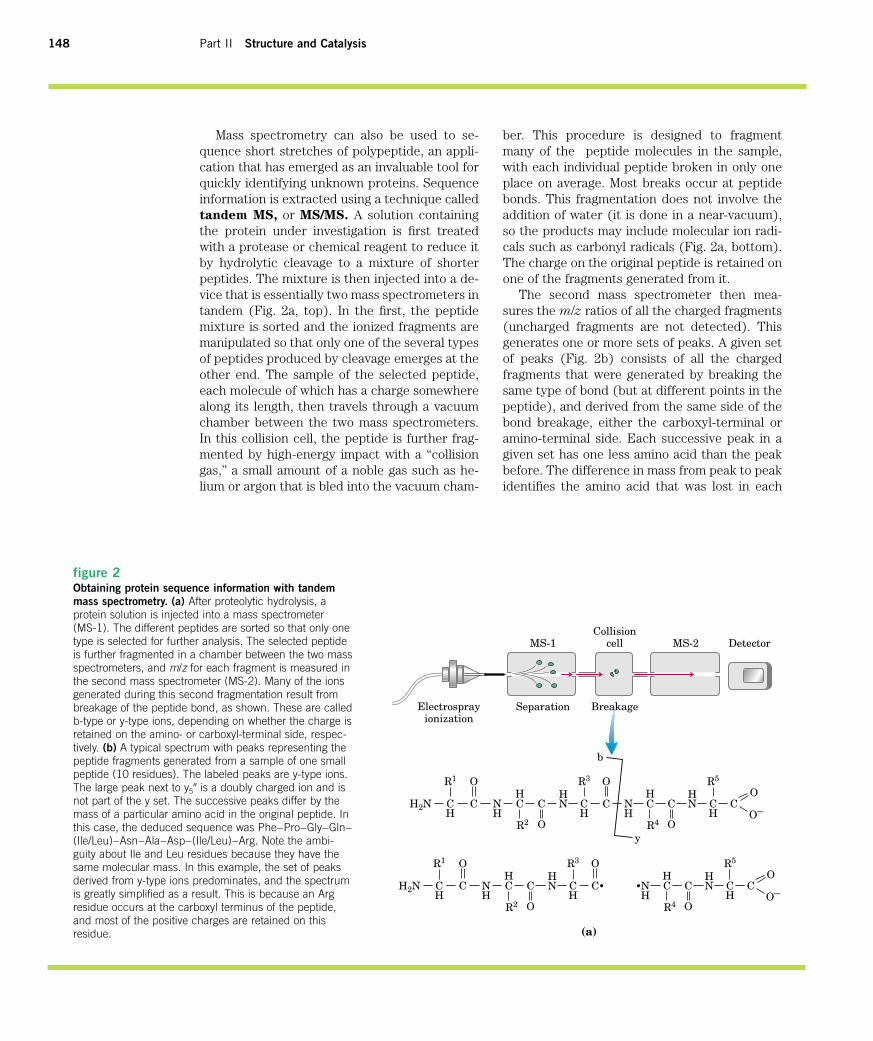
148 Part II Structure and Catalysis
figure 2Obtaining protein sequence information with tandemmass spectrometry. (a) After proteolytic hydrolysis, aprotein solution is injected into a mass spectrometer (MS-1). The different peptides are sorted so that only onetype is selected for further analysis. The selected peptideis further fragmented in a chamber between the two massspectrometers, and m/z for each fragment is measured inthe second mass spectrometer (MS-2). Many of the ionsgenerated during this second fragmentation result frombreakage of the peptide bond, as shown. These are calledb-type or y-type ions, depending on whether the charge isretained on the amino- or carboxyl-terminal side, respec-tively. (b) A typical spectrum with peaks representing thepeptide fragments generated from a sample of one smallpeptide (10 residues). The labeled peaks are y-type ions.The large peak next to y5� is a doubly charged ion and isnot part of the y set. The successive peaks differ by themass of a particular amino acid in the original peptide. Inthis case, the deduced sequence was Phe–Pro–Gly–Gln–(Ile/Leu)–Asn–Ala–Asp–(Ile/Leu)–Arg. Note the ambi-guity about Ile and Leu residues because they have thesame molecular mass. In this example, the set of peaksderived from y-type ions predominates, and the spectrumis greatly simplified as a result. This is because an Argresidue occurs at the carboxyl terminus of the peptide,and most of the positive charges are retained on thisresidue.
R1
R2
CH
H2N
R3
CH
O
O
C
O
b
y
CN CH
R4
CH
CH
NH
O
O
O–C CN
HR5
CH
NH
R1
R2
CH
H2N
R3
CH
O
O
C
O
CN CH
R4
CH
CH
NH
O
O
O–C CN
HR5
CH
NH
(a)
MS-2 DetectorMS-1Collision
cell
SeparationElectrosprayionization
Breakage
Mass spectrometry can also be used to se-quence short stretches of polypeptide, an appli-cation that has emerged as an invaluable tool forquickly identifying unknown proteins. Sequenceinformation is extracted using a technique calledtandem MS, or MS/MS. A solution containingthe protein under investigation is first treatedwith a protease or chemical reagent to reduce itby hydrolytic cleavage to a mixture of shorterpeptides. The mixture is then injected into a de-vice that is essentially two mass spectrometers intandem (Fig. 2a, top). In the first, the peptidemixture is sorted and the ionized fragments aremanipulated so that only one of the several typesof peptides produced by cleavage emerges at theother end. The sample of the selected peptide,each molecule of which has a charge somewherealong its length, then travels through a vacuumchamber between the two mass spectrometers.In this collision cell, the peptide is further frag-mented by high-energy impact with a “collisiongas,” a small amount of a noble gas such as he-lium or argon that is bled into the vacuum cham-
ber. This procedure is designed to fragmentmany of the peptide molecules in the sample,with each individual peptide broken in only oneplace on average. Most breaks occur at peptidebonds. This fragmentation does not involve theaddition of water (it is done in a near-vacuum),so the products may include molecular ion radi-cals such as carbonyl radicals (Fig. 2a, bottom).The charge on the original peptide is retained onone of the fragments generated from it.
The second mass spectrometer then mea-sures the m/z ratios of all the charged fragments(uncharged fragments are not detected). Thisgenerates one or more sets of peaks. A given setof peaks (Fig. 2b) consists of all the chargedfragments that were generated by breaking thesame type of bond (but at different points in thepeptide), and derived from the same side of thebond breakage, either the carboxyl-terminal oramino-terminal side. Each successive peak in agiven set has one less amino acid than the peakbefore. The difference in mass from peak to peakidentifies the amino acid that was lost in each
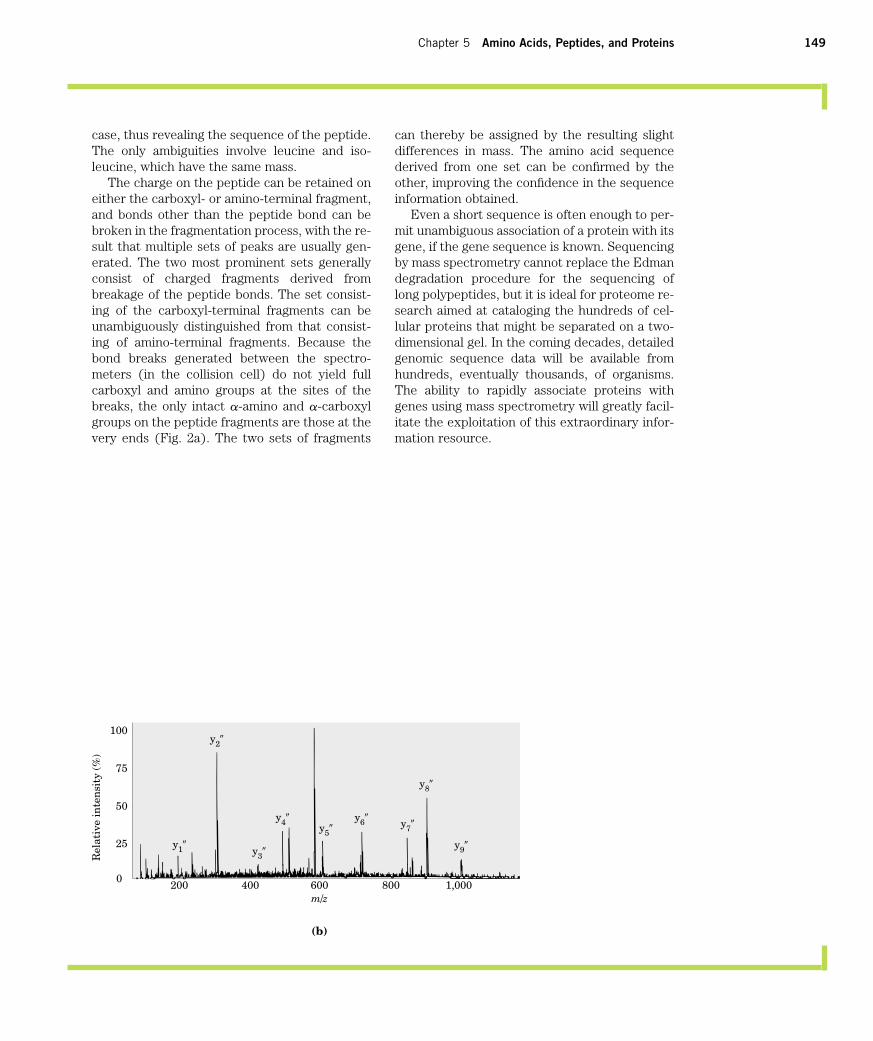
Chapter 5 Amino Acids, Peptides, and Proteins 149
case, thus revealing the sequence of the peptide.The only ambiguities involve leucine and iso-leucine, which have the same mass.
The charge on the peptide can be retained oneither the carboxyl- or amino-terminal fragment,and bonds other than the peptide bond can bebroken in the fragmentation process, with the re-sult that multiple sets of peaks are usually gen-erated. The two most prominent sets generallyconsist of charged fragments derived frombreakage of the peptide bonds. The set consist-ing of the carboxyl-terminal fragments can beunambiguously distinguished from that consist-ing of amino-terminal fragments. Because thebond breaks generated between the spectro-meters (in the collision cell) do not yield full carboxyl and amino groups at the sites of thebreaks, the only intact a-amino and a-carboxylgroups on the peptide fragments are those at thevery ends (Fig. 2a). The two sets of fragments
can thereby be assigned by the resulting slightdifferences in mass. The amino acid sequencederived from one set can be confirmed by theother, improving the confidence in the sequenceinformation obtained.
Even a short sequence is often enough to per-mit unambiguous association of a protein with itsgene, if the gene sequence is known. Sequencingby mass spectrometry cannot replace the Edmandegradation procedure for the sequencing oflong polypeptides, but it is ideal for proteome re-search aimed at cataloging the hundreds of cel-lular proteins that might be separated on a two-dimensional gel. In the coming decades, detailedgenomic sequence data will be available fromhundreds, eventually thousands, of organisms.The ability to rapidly associate proteins withgenes using mass spectrometry will greatly facil-itate the exploitation of this extraordinary infor-mation resource.
100
Rel
ativ
e in
ten
sity
(%
)
75
50
25
0200
y1�
y2�
y3�
y4�y5�
y6� y7�
y8�
y9�
400 600m/z
800 1,000
(b)
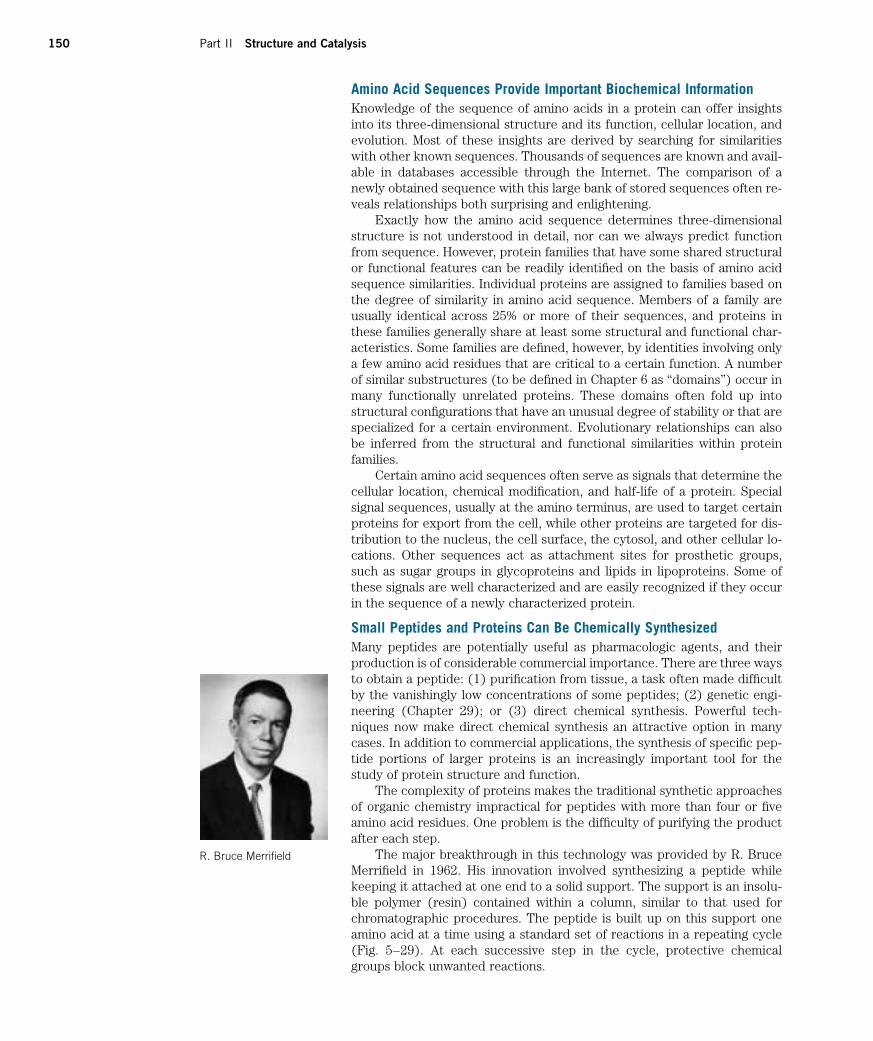
150 Part II Structure and Catalysis
Amino Acid Sequences Provide Important Biochemical InformationKnowledge of the sequence of amino acids in a protein can offer insightsinto its three-dimensional structure and its function, cellular location, andevolution. Most of these insights are derived by searching for similaritieswith other known sequences. Thousands of sequences are known and avail-able in databases accessible through the Internet. The comparison of anewly obtained sequence with this large bank of stored sequences often re-veals relationships both surprising and enlightening.
Exactly how the amino acid sequence determines three-dimensionalstructure is not understood in detail, nor can we always predict functionfrom sequence. However, protein families that have some shared structuralor functional features can be readily identified on the basis of amino acid sequence similarities. Individual proteins are assigned to families based onthe degree of similarity in amino acid sequence. Members of a family are usually identical across 25% or more of their sequences, and proteins inthese families generally share at least some structural and functional char-acteristics. Some families are defined, however, by identities involving onlya few amino acid residues that are critical to a certain function. A numberof similar substructures (to be defined in Chapter 6 as “domains”) occur inmany functionally unrelated proteins. These domains often fold up intostructural configurations that have an unusual degree of stability or that arespecialized for a certain environment. Evolutionary relationships can alsobe inferred from the structural and functional similarities within proteinfamilies.
Certain amino acid sequences often serve as signals that determine thecellular location, chemical modification, and half-life of a protein. Specialsignal sequences, usually at the amino terminus, are used to target certainproteins for export from the cell, while other proteins are targeted for dis-tribution to the nucleus, the cell surface, the cytosol, and other cellular lo-cations. Other sequences act as attachment sites for prosthetic groups,such as sugar groups in glycoproteins and lipids in lipoproteins. Some ofthese signals are well characterized and are easily recognized if they occurin the sequence of a newly characterized protein.
Small Peptides and Proteins Can Be Chemically SynthesizedMany peptides are potentially useful as pharmacologic agents, and theirproduction is of considerable commercial importance. There are three waysto obtain a peptide: (1) purification from tissue, a task often made difficultby the vanishingly low concentrations of some peptides; (2) genetic engi-neering (Chapter 29); or (3) direct chemical synthesis. Powerful tech-niques now make direct chemical synthesis an attractive option in manycases. In addition to commercial applications, the synthesis of specific pep-tide portions of larger proteins is an increasingly important tool for thestudy of protein structure and function.
The complexity of proteins makes the traditional synthetic approachesof organic chemistry impractical for peptides with more than four or fiveamino acid residues. One problem is the difficulty of purifying the productafter each step.
The major breakthrough in this technology was provided by R. BruceMerrifield in 1962. His innovation involved synthesizing a peptide whilekeeping it attached at one end to a solid support. The support is an insolu-ble polymer (resin) contained within a column, similar to that used forchromatographic procedures. The peptide is built up on this support oneamino acid at a time using a standard set of reactions in a repeating cycle(Fig. 5–29). At each successive step in the cycle, protective chemicalgroups block unwanted reactions.
R. Bruce Merrifield
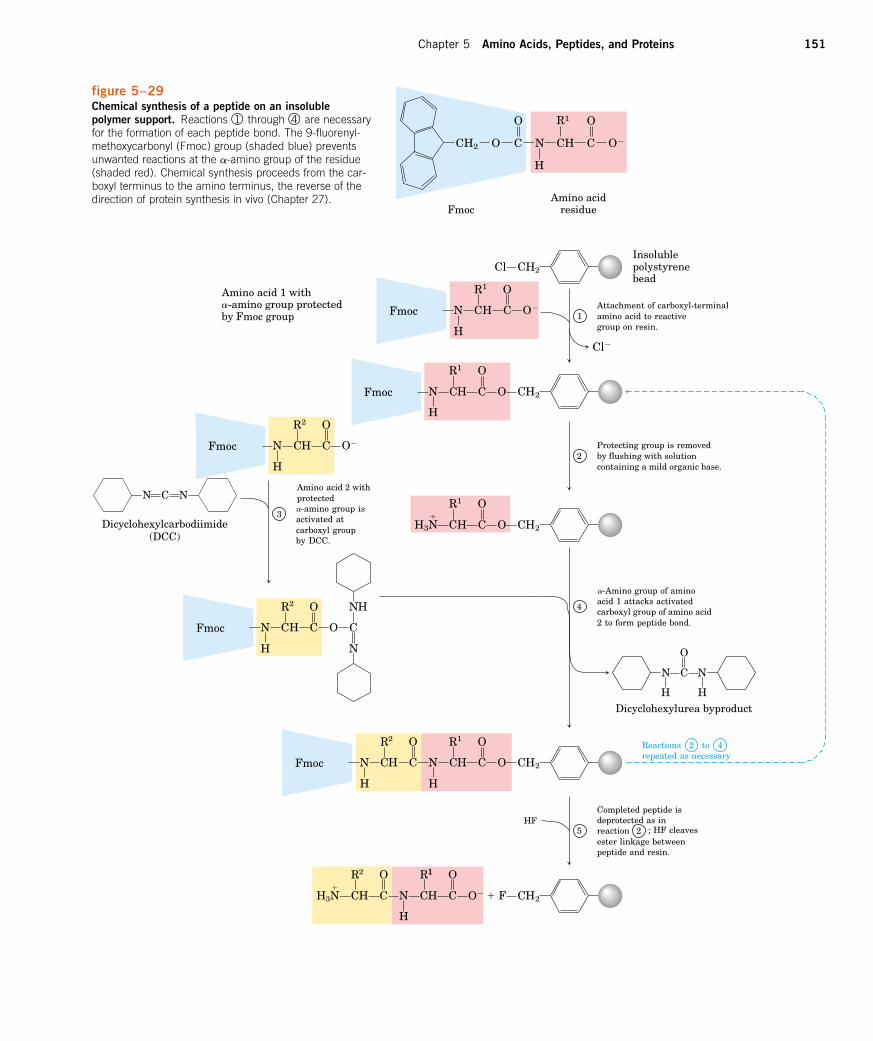
Chapter 5 Amino Acids, Peptides, and Proteins 151
O�
R1
CH2 CHO N
H
C
O
FmocAmino acid
residue
C
O
-amino group protectedAmino acid 1 with
by Fmoc group
Cl CH2
Insolublepolystyrenebead
N
H
C
R1
H C
Cl�
N
H
C
R1
H C
O
O CH2
3
amino acid to reactive
Protecting group is removedby flushing with solutioncontaining a mild organic base.
-Amino group of aminoacid 1 attacks activated
2 to form peptide bond.
N
H
C
O
N
HDicyclohexylurea byproduct
torepeated as necessary
Completed peptide isdeprotected as in
ester linkage betweenpeptide and resin.
N
H
C
R2
H C
O
O�
Amino acid 2 withprotected-amino group is
activated atcarboxyl groupby DCC.
H3 C
R1
H C
O
OOCH2
C
Dicyclohexylcarbodiimide(DCC)
N
H
C
R2
H C
O
O C
NH
N
N
H
C
R2
H C
O
N
H
C
R1
H C
O
O CH2
H3N�
N�
C
R
H C
O
N
H
C
R2
H C
O
O� � F CH2
HF
Attachment of carboxyl-terminal1
2
5
4
4
Reactions
carboxyl group of amino acid
group on resin.
reaction 2
2
; HF cleaves
11
O
O�
N N
Fmoc
Fmoc
Fmoc
Fmoc
Fmoc
�
�
�
figure 5–29Chemical synthesis of a peptide on an insolublepolymer support. Reactions through are necessaryfor the formation of each peptide bond. The 9-fluorenyl-methoxycarbonyl (Fmoc) group (shaded blue) preventsunwanted reactions at the a-amino group of the residue(shaded red). Chemical synthesis proceeds from the car-boxyl terminus to the amino terminus, the reverse of thedirection of protein synthesis in vivo (Chapter 27).
4� 1�
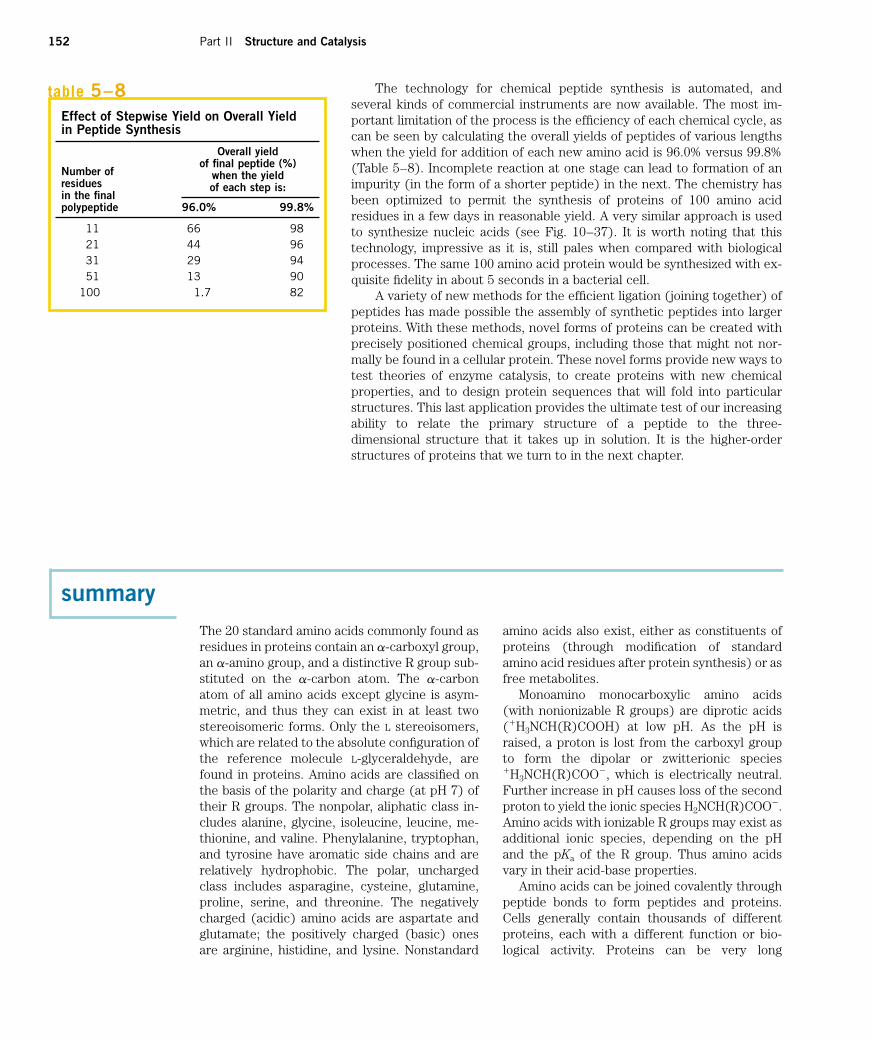
152 Part II Structure and Catalysis
The technology for chemical peptide synthesis is automated, and several kinds of commercial instruments are now available. The most im-portant limitation of the process is the efficiency of each chemical cycle, ascan be seen by calculating the overall yields of peptides of various lengthswhen the yield for addition of each new amino acid is 96.0% versus 99.8%(Table 5–8). Incomplete reaction at one stage can lead to formation of animpurity (in the form of a shorter peptide) in the next. The chemistry hasbeen optimized to permit the synthesis of proteins of 100 amino acidresidues in a few days in reasonable yield. A very similar approach is usedto synthesize nucleic acids (see Fig. 10–37). It is worth noting that thistechnology, impressive as it is, still pales when compared with biologicalprocesses. The same 100 amino acid protein would be synthesized with ex-quisite fidelity in about 5 seconds in a bacterial cell.
A variety of new methods for the efficient ligation (joining together) ofpeptides has made possible the assembly of synthetic peptides into largerproteins. With these methods, novel forms of proteins can be created withprecisely positioned chemical groups, including those that might not nor-mally be found in a cellular protein. These novel forms provide new ways totest theories of enzyme catalysis, to create proteins with new chemicalproperties, and to design protein sequences that will fold into particularstructures. This last application provides the ultimate test of our increasingability to relate the primary structure of a peptide to the three-dimensional structure that it takes up in solution. It is the higher-orderstructures of proteins that we turn to in the next chapter.
Effect of Stepwise Yield on Overall Yield in Peptide Synthesis
Overall yield
Number ofof final peptide (%)
residueswhen the yield
in the finalof each step is:
polypeptide 96.0% 99.8%
11 66 9821 44 9631 29 9451 13 90
100 1.7 82
table 5–8
summaryThe 20 standard amino acids commonly found asresidues in proteins contain an a-carboxyl group,an a-amino group, and a distinctive R group sub-stituted on the a-carbon atom. The a-carbonatom of all amino acids except glycine is asym-metric, and thus they can exist in at least twostereoisomeric forms. Only the L stereoisomers,which are related to the absolute configuration ofthe reference molecule L-glyceraldehyde, arefound in proteins. Amino acids are classified onthe basis of the polarity and charge (at pH 7) oftheir R groups. The nonpolar, aliphatic class in-cludes alanine, glycine, isoleucine, leucine, me-thionine, and valine. Phenylalanine, tryptophan,and tyrosine have aromatic side chains and arerelatively hydrophobic. The polar, unchargedclass includes asparagine, cysteine, glutamine,proline, serine, and threonine. The negativelycharged (acidic) amino acids are aspartate andglutamate; the positively charged (basic) onesare arginine, histidine, and lysine. Nonstandard
amino acids also exist, either as constituents ofproteins (through modification of standardamino acid residues after protein synthesis) or asfree metabolites.
Monoamino monocarboxylic amino acids(with nonionizable R groups) are diprotic acids(�H3NCH(R)COOH) at low pH. As the pH israised, a proton is lost from the carboxyl group to form the dipolar or zwitterionic species�H3NCH(R)COO�, which is electrically neutral.Further increase in pH causes loss of the secondproton to yield the ionic species H2NCH(R)COO�.Amino acids with ionizable R groups may exist asadditional ionic species, depending on the pHand the pKa of the R group. Thus amino acidsvary in their acid-base properties.
Amino acids can be joined covalently throughpeptide bonds to form peptides and proteins.Cells generally contain thousands of differentproteins, each with a different function or bio-logical activity. Proteins can be very long
Chapter 5 Amino Acids, Peptides, and Proteins 153
further readingGeneralCreighton, T.E. (1993) Proteins: Structures and
Molecular Properties, 2nd edn, W.H. Freeman andCompany, New York.
Very useful general source.
Sanger, F. (1988) Sequences, sequences, sequences.Annu. Rev. Biochem. 57, 1–28.
A nice historical account of the development of sequencing methods.
Amino AcidsGreenstein, J.P. & Winitz, M. (1961) Chemistry
of the Amino Acids, 3 Vols, John Wiley & Sons, NewYork.
Kreil, G. (1997) D-Amino acids in animal peptides.Annu. Rev. Biochem. 66, 337–345.
An update on the occurrence of these unusualstereoisomers of amino acids.
Meister, A. (1965) Biochemistry of the Amino
Acids, 2nd edn, Vols 1 and 2, Academic Press, Inc.,New York.
Encyclopedic treatment of the properties, occur-rence, and metabolism of amino acids.
Peptides and ProteinsDoolittle, R.F. (1985) Proteins. Sci. Am. 253
(October), 88–99.An overview that highlights evolutionary relation-ships.
Working with ProteinsDunn, M.J. (1997) Quantitative two-dimensional gelelectrophoresis: from proteins to proteomes.Biochem. Soc. Trans. 25, 248–254.
Dunn, M.J. & Corbett, J.M. (1996) Two-dimensionalpolyacrylamide gel electrophoresis. Methods Enzymol.
271, 177–203.A detailed description of the technology.
polypeptide chains of 100 to several thousandamino acid residues. However, some naturallyoccurring peptides have only a few amino acidresidues. Some proteins are composed of severalnoncovalently associated polypeptide chains,which are referred to as subunits. Simple pro-teins yield only amino acids on hydrolysis; conju-gated proteins contain in addition some othercomponent, such as a metal ion or organic pros-thetic group.
There are four generally recognized levels ofprotein structure. Primary structure refers tothe amino acid sequence and the location ofdisulfide bonds. Secondary structure is the spa-tial relationship of adjacent amino acids in local-ized stretches. Tertiary structure is the three-dimensional conformation of an entire polypep-tide chain. Quaternary structure involves thespatial relationship of multiple polypeptidechains (subunits) that are stably associated.
Proteins are purified by taking advantage ofvarious properties in which they differ. Proteinscan be selectively precipitated by the addition ofcertain salts. A wide range of chromatographicprocedures make use of differences in size, bind-ing affinities, charge, and other properties. Elec-
trophoresis can separate proteins on the basis ofmass or charge. All purification procedures re-quire a method for quantifying or assaying theprotein of interest in the presence of other pro-teins.
Differences in protein function result fromdifferences in amino acid composition and se-quence. Amino acid sequences are deduced byfragmenting polypeptides into smaller peptidesusing reagents known to cleave specific peptidebonds, determining the amino acid sequence ofeach fragment by the automated Edman degra-dation procedure, then ordering the peptidefragments by finding sequence overlaps betweenfragments generated by different reagents. Aprotein sequence can also be deduced from thenucleotide sequence of its corresponding genein DNA. Comparison of a protein’s amino acidsequence with the thousands of known se-quences often provides insights into the struc-ture, function, cellular location, and evolution ofthe protein.
Short proteins and peptides (up to about 100residues long) can be chemically synthesized. Thepeptide is built up, one amino acid residue at atime, while remaining tethered to a solid support.
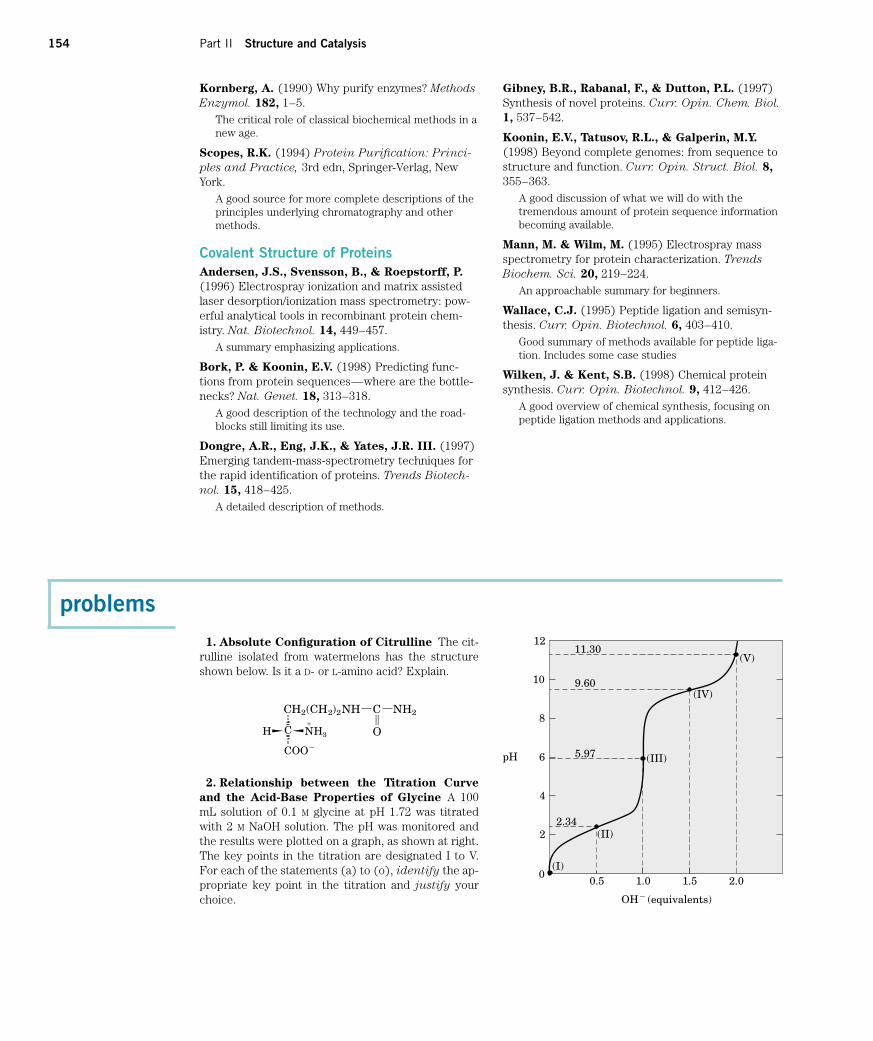
154 Part II Structure and Catalysis
problems1. Absolute Configuration of Citrulline The cit-
rulline isolated from watermelons has the structureshown below. Is it a D- or L-amino acid? Explain.
Kornberg, A. (1990) Why purify enzymes? Methods
Enzymol. 182, 1–5.The critical role of classical biochemical methods in anew age.
Scopes, R.K. (1994) Protein Purification: Princi-
ples and Practice, 3rd edn, Springer-Verlag, NewYork.
A good source for more complete descriptions of theprinciples underlying chromatography and othermethods.
Covalent Structure of ProteinsAndersen, J.S., Svensson, B., & Roepstorff, P.
(1996) Electrospray ionization and matrix assistedlaser desorption/ionization mass spectrometry: pow-erful analytical tools in recombinant protein chem-istry. Nat. Biotechnol. 14, 449–457.
A summary emphasizing applications.
Bork, P. & Koonin, E.V. (1998) Predicting func-tions from protein sequences—where are the bottle-necks? Nat. Genet. 18, 313–318.
A good description of the technology and the road-blocks still limiting its use.
Dongre, A.R., Eng, J.K., & Yates, J.R. III. (1997)Emerging tandem-mass-spectrometry techniques forthe rapid identification of proteins. Trends Biotech-
nol. 15, 418–425.A detailed description of methods.
Gibney, B.R., Rabanal, F., & Dutton, P.L. (1997)Synthesis of novel proteins. Curr. Opin. Chem. Biol.
1, 537–542.
Koonin, E.V., Tatusov, R.L., & Galperin, M.Y.
(1998) Beyond complete genomes: from sequence tostructure and function. Curr. Opin. Struct. Biol. 8,
355–363.A good discussion of what we will do with thetremendous amount of protein sequence informationbecoming available.
Mann, M. & Wilm, M. (1995) Electrospray massspectrometry for protein characterization. Trends
Biochem. Sci. 20, 219–224.An approachable summary for beginners.
Wallace, C.J. (1995) Peptide ligation and semisyn-thesis. Curr. Opin. Biotechnol. 6, 403–410.
Good summary of methods available for peptide liga-tion. Includes some case studies
Wilken, J. & Kent, S.B. (1998) Chemical proteinsynthesis. Curr. Opin. Biotechnol. 9, 412–426.
A good overview of chemical synthesis, focusing onpeptide ligation methods and applications.
C C
O
)H (CH NH2 NH22 2
P
H C N�
H3
COO�
2. Relationship between the Titration Curve
and the Acid-Base Properties of Glycine A 100mL solution of 0.1 M glycine at pH 1.72 was titratedwith 2 M NaOH solution. The pH was monitored andthe results were plotted on a graph, as shown at right.The key points in the titration are designated I to V.For each of the statements (a) to (o), identify the ap-propriate key point in the titration and justify yourchoice.
12
2
4
6
8
0
11.30
0.5
OH� (equivalents)
pH
1.0 1.5 2.0
(V)
9.60(IV)
(III)
2.34
(I)
(II)
5.97
10
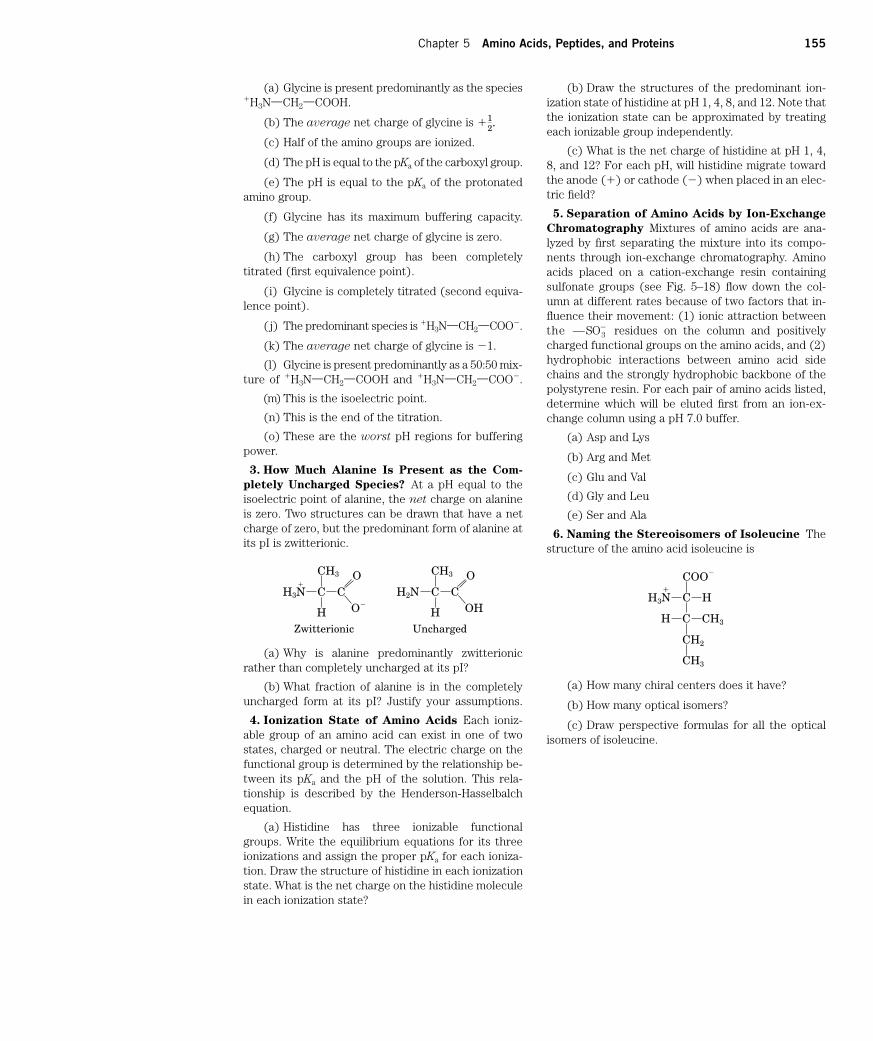
Chapter 5 Amino Acids, Peptides, and Proteins 155
(a) Glycine is present predominantly as the species�H3NXCH2XCOOH.
(b) The average net charge of glycine is
(c) Half of the amino groups are ionized.
(d) The pH is equal to the pKa of the carboxyl group.
(e) The pH is equal to the pKa of the protonatedamino group.
(f) Glycine has its maximum buffering capacity.
(g) The average net charge of glycine is zero.
(h) The carboxyl group has been completelytitrated (first equivalence point).
(i) Glycine is completely titrated (second equiva-lence point).
( j) The predominant species is �H3NXCH2XCOO�.
(k) The average net charge of glycine is �1.
(l) Glycine is present predominantly as a 50:50 mix-ture of �H3NXCH2XCOOH and �H3NXCH2XCOO�.
(m) This is the isoelectric point.
(n) This is the end of the titration.
(o) These are the worst pH regions for bufferingpower.
3. How Much Alanine Is Present as the Com-
pletely Uncharged Species? At a pH equal to theisoelectric point of alanine, the net charge on alanineis zero. Two structures can be drawn that have a netcharge of zero, but the predominant form of alanine atits pI is zwitterionic.
�12.
(a) Why is alanine predominantly zwitterionicrather than completely uncharged at its pI?
(b) What fraction of alanine is in the completelyuncharged form at its pI? Justify your assumptions.
4. Ionization State of Amino Acids Each ioniz-able group of an amino acid can exist in one of twostates, charged or neutral. The electric charge on thefunctional group is determined by the relationship be-tween its pKa and the pH of the solution. This rela-tionship is described by the Henderson-Hasselbalchequation.
(a) Histidine has three ionizable functionalgroups. Write the equilibrium equations for its threeionizations and assign the proper pKa for each ioniza-tion. Draw the structure of histidine in each ionizationstate. What is the net charge on the histidine moleculein each ionization state?
(b) Draw the structures of the predominant ion-ization state of histidine at pH 1, 4, 8, and 12. Note thatthe ionization state can be approximated by treatingeach ionizable group independently.
(c) What is the net charge of histidine at pH 1, 4,8, and 12? For each pH, will histidine migrate towardthe anode (�) or cathode (�) when placed in an elec-tric field?
5. Separation of Amino Acids by Ion-Exchange
Chromatography Mixtures of amino acids are ana-lyzed by first separating the mixture into its compo-nents through ion-exchange chromatography. Aminoacids placed on a cation-exchange resin containingsulfonate groups (see Fig. 5–18) flow down the col-umn at different rates because of two factors that in-fluence their movement: (1) ionic attraction betweenthe — residues on the column and positivelycharged functional groups on the amino acids, and (2)hydrophobic interactions between amino acid sidechains and the strongly hydrophobic backbone of thepolystyrene resin. For each pair of amino acids listed,determine which will be eluted first from an ion-ex-change column using a pH 7.0 buffer.
(a) Asp and Lys
(b) Arg and Met
(c) Glu and Val
(d) Gly and Leu
(e) Ser and Ala
6. Naming the Stereoisomers of Isoleucine Thestructure of the amino acid isoleucine is
SO3�
�C
CH3
H3N
H
CO
O�
Zwitterionic Uncharged
C
CH3
H2N
H
CO
OHH C
H3NH
C
COO�
H
CH2
CH3
CH3
(a) How many chiral centers does it have?
(b) How many optical isomers?
(c) Draw perspective formulas for all the opticalisomers of isoleucine.
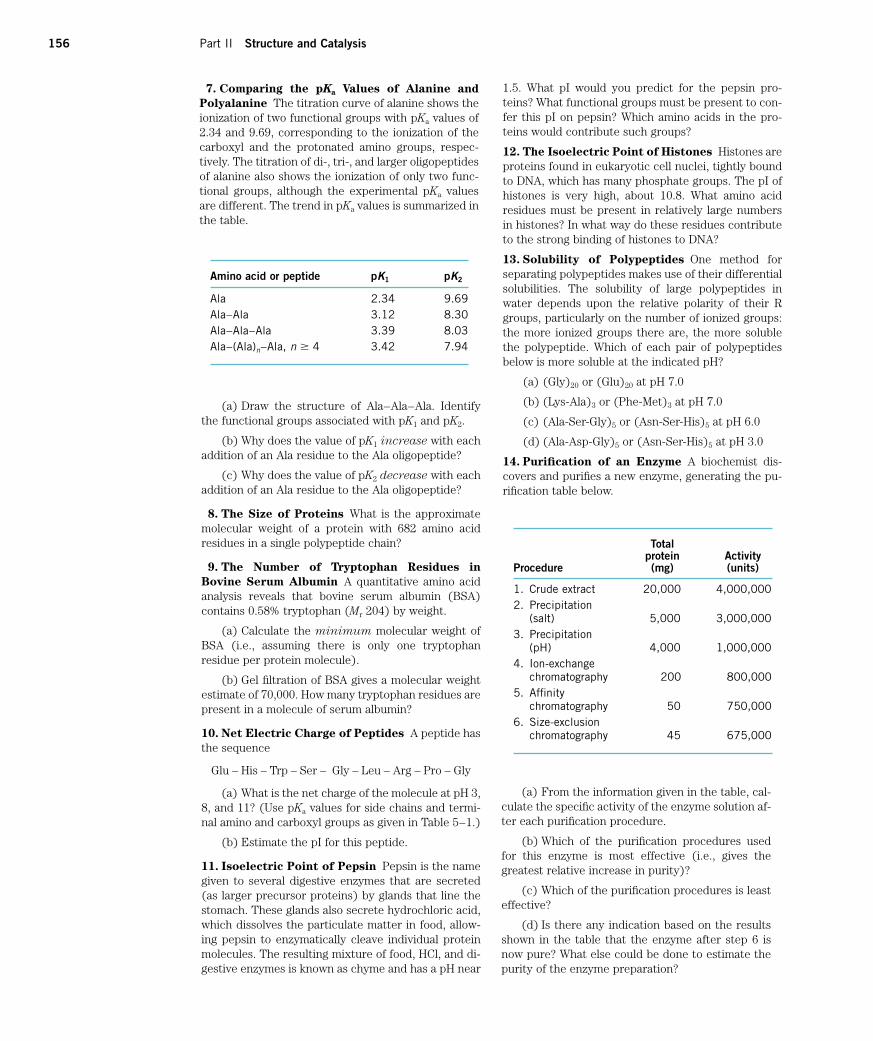
156 Part II Structure and Catalysis
7. Comparing the pKa Values of Alanine and
Polyalanine The titration curve of alanine shows theionization of two functional groups with pKa values of2.34 and 9.69, corresponding to the ionization of thecarboxyl and the protonated amino groups, respec-tively. The titration of di-, tri-, and larger oligopeptidesof alanine also shows the ionization of only two func-tional groups, although the experimental pKa valuesare different. The trend in pKa values is summarized inthe table.
(a) Draw the structure of Ala–Ala–Ala. Identifythe functional groups associated with pK1 and pK2.
(b) Why does the value of pK1 increase with eachaddition of an Ala residue to the Ala oligopeptide?
(c) Why does the value of pK2 decrease with eachaddition of an Ala residue to the Ala oligopeptide?
8. The Size of Proteins What is the approximatemolecular weight of a protein with 682 amino acidresidues in a single polypeptide chain?
9. The Number of Tryptophan Residues in
Bovine Serum Albumin A quantitative amino acidanalysis reveals that bovine serum albumin (BSA)contains 0.58% tryptophan (Mr 204) by weight.
(a) Calculate the minimum molecular weight ofBSA (i.e., assuming there is only one tryptophanresidue per protein molecule).
(b) Gel filtration of BSA gives a molecular weightestimate of 70,000. How many tryptophan residues arepresent in a molecule of serum albumin?
10. Net Electric Charge of Peptides A peptide hasthe sequence
Glu – His – Trp – Ser – Gly – Leu – Arg – Pro – Gly
(a) What is the net charge of the molecule at pH 3,8, and 11? (Use pKa values for side chains and termi-nal amino and carboxyl groups as given in Table 5–1.)
(b) Estimate the pI for this peptide.
11. Isoelectric Point of Pepsin Pepsin is the namegiven to several digestive enzymes that are secreted(as larger precursor proteins) by glands that line thestomach. These glands also secrete hydrochloric acid,which dissolves the particulate matter in food, allow-ing pepsin to enzymatically cleave individual proteinmolecules. The resulting mixture of food, HCl, and di-gestive enzymes is known as chyme and has a pH near
1.5. What pI would you predict for the pepsin pro-teins? What functional groups must be present to con-fer this pI on pepsin? Which amino acids in the pro-teins would contribute such groups?
12. The Isoelectric Point of Histones Histones areproteins found in eukaryotic cell nuclei, tightly boundto DNA, which has many phosphate groups. The pI ofhistones is very high, about 10.8. What amino acidresidues must be present in relatively large numbersin histones? In what way do these residues contributeto the strong binding of histones to DNA?
13. Solubility of Polypeptides One method forseparating polypeptides makes use of their differentialsolubilities. The solubility of large polypeptides in water depends upon the relative polarity of their Rgroups, particularly on the number of ionized groups:the more ionized groups there are, the more solublethe polypeptide. Which of each pair of polypeptidesbelow is more soluble at the indicated pH?
(a) (Gly)20 or (Glu)20 at pH 7.0
(b) (Lys-Ala)3 or (Phe-Met)3 at pH 7.0
(c) (Ala-Ser-Gly)5 or (Asn-Ser-His)5 at pH 6.0
(d) (Ala-Asp-Gly)5 or (Asn-Ser-His)5 at pH 3.0
14. Purification of an Enzyme A biochemist dis-covers and purifies a new enzyme, generating the pu-rification table below.
Amino acid or peptide pK1 pK2
Ala 2.34 9.69Ala–Ala 3.12 8.30Ala–Ala–Ala 3.39 8.03Ala–(Ala)n–Ala, n � 4 3.42 7.94
Totalprotein Activity
Procedure (mg) (units)
1. Crude extract 20,000 4,000,0002. Precipitation2. (salt) 5,000 3,000,0003. Precipitation3. (pH) 4,000 1,000,0004. Ion-exchange4. chromatography 200 800,0005. Affinity5. chromatography 50 750,0006. Size-exclusion6. chromatography 45 675,000
(a) From the information given in the table, cal-culate the specific activity of the enzyme solution af-ter each purification procedure.
(b) Which of the purification procedures usedfor this enzyme is most effective (i.e., gives thegreatest relative increase in purity)?
(c) Which of the purification procedures is leasteffective?
(d) Is there any indication based on the resultsshown in the table that the enzyme after step 6 isnow pure? What else could be done to estimate thepurity of the enzyme preparation?
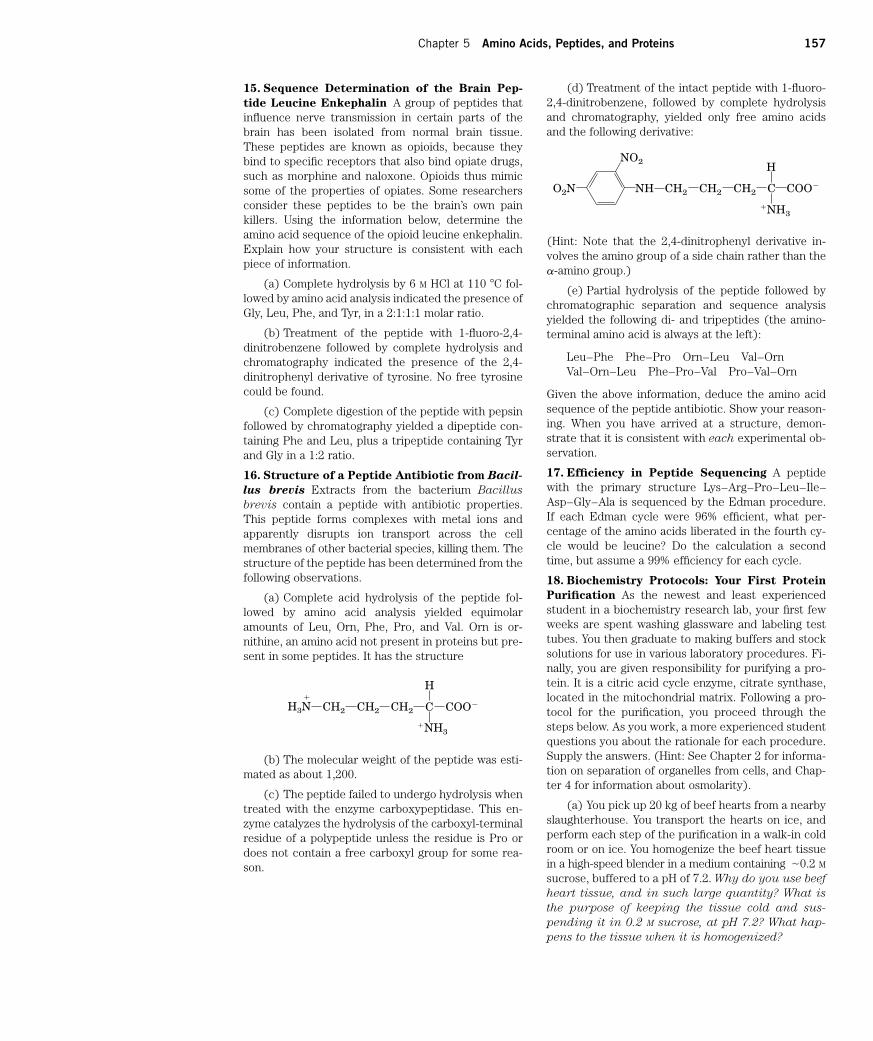
Chapter 5 Amino Acids, Peptides, and Proteins 157
15. Sequence Determination of the Brain Pep-
tide Leucine Enkephalin A group of peptides thatinfluence nerve transmission in certain parts of thebrain has been isolated from normal brain tissue.These peptides are known as opioids, because theybind to specific receptors that also bind opiate drugs,such as morphine and naloxone. Opioids thus mimicsome of the properties of opiates. Some researchersconsider these peptides to be the brain’s own painkillers. Using the information below, determine theamino acid sequence of the opioid leucine enkephalin.Explain how your structure is consistent with eachpiece of information.
(a) Complete hydrolysis by 6 M HCl at 110 �C fol-lowed by amino acid analysis indicated the presence ofGly, Leu, Phe, and Tyr, in a 2:1:1:1 molar ratio.
(b) Treatment of the peptide with 1-fluoro-2,4-dinitrobenzene followed by complete hydrolysis andchromatography indicated the presence of the 2,4-dinitrophenyl derivative of tyrosine. No free tyrosinecould be found.
(c) Complete digestion of the peptide with pepsinfollowed by chromatography yielded a dipeptide con-taining Phe and Leu, plus a tripeptide containing Tyrand Gly in a 1:2 ratio.
16. Structure of a Peptide Antibiotic from Bacil-
lus brevis Extracts from the bacterium Bacillus
brevis contain a peptide with antibiotic properties.This peptide forms complexes with metal ions and apparently disrupts ion transport across the cell membranes of other bacterial species, killing them. Thestructure of the peptide has been determined from thefollowing observations.
(a) Complete acid hydrolysis of the peptide fol-lowed by amino acid analysis yielded equimolaramounts of Leu, Orn, Phe, Pro, and Val. Orn is or-nithine, an amino acid not present in proteins but pre-sent in some peptides. It has the structure
(b) The molecular weight of the peptide was esti-mated as about 1,200.
(c) The peptide failed to undergo hydrolysis whentreated with the enzyme carboxypeptidase. This en-zyme catalyzes the hydrolysis of the carboxyl-terminalresidue of a polypeptide unless the residue is Pro ordoes not contain a free carboxyl group for some rea-son.
(d) Treatment of the intact peptide with 1-fluoro-2,4-dinitrobenzene, followed by complete hydrolysisand chromatography, yielded only free amino acidsand the following derivative:
CH2 CH2 CH2 C COO�H3N
H
�NH3
�
NO2
CH2 CH2
�NH3
O2N COO�CH2NH C
H
(Hint: Note that the 2,4-dinitrophenyl derivative in-volves the amino group of a side chain rather than thea-amino group.)
(e) Partial hydrolysis of the peptide followed bychromatographic separation and sequence analysisyielded the following di- and tripeptides (the amino-terminal amino acid is always at the left):
Leu–Phe Phe–Pro Orn–Leu Val–OrnVal–Orn–Leu Phe–Pro–Val Pro–Val–Orn
Given the above information, deduce the amino acidsequence of the peptide antibiotic. Show your reason-ing. When you have arrived at a structure, demon-strate that it is consistent with each experimental ob-servation.
17. Efficiency in Peptide Sequencing A peptidewith the primary structure Lys–Arg–Pro–Leu–Ile–Asp–Gly–Ala is sequenced by the Edman procedure.If each Edman cycle were 96% efficient, what per-centage of the amino acids liberated in the fourth cy-cle would be leucine? Do the calculation a secondtime, but assume a 99% efficiency for each cycle.
18. Biochemistry Protocols: Your First Protein
Purification As the newest and least experiencedstudent in a biochemistry research lab, your first fewweeks are spent washing glassware and labeling testtubes. You then graduate to making buffers and stocksolutions for use in various laboratory procedures. Fi-nally, you are given responsibility for purifying a pro-tein. It is a citric acid cycle enzyme, citrate synthase,located in the mitochondrial matrix. Following a pro-tocol for the purification, you proceed through thesteps below. As you work, a more experienced studentquestions you about the rationale for each procedure.Supply the answers. (Hint: See Chapter 2 for informa-tion on separation of organelles from cells, and Chap-ter 4 for information about osmolarity).
(a) You pick up 20 kg of beef hearts from a nearbyslaughterhouse. You transport the hearts on ice, andperform each step of the purification in a walk-in coldroom or on ice. You homogenize the beef heart tissuein a high-speed blender in a medium containing 0.2 Msucrose, buffered to a pH of 7.2. Why do you use beef
heart tissue, and in such large quantity? What is
the purpose of keeping the tissue cold and sus-
pending it in 0.2 M sucrose, at pH 7.2? What hap-
pens to the tissue when it is homogenized?
�
158 Part II Structure and Catalysis
(b) You subject the resulting heart homogenate,which is dense and opaque, to a series of differentialcentrifugation steps. What does this accomplish?
(c) You proceed with the purification using the su-pernatant fraction that contains mostly intact mito-chondria. Next you osmotically lyse the mitochondria.The lysate, which is less dense than the homogenate,but still opaque, consists primarily of mitochondrialmembranes and internal mitochondrial contents. Tothis lysate you add ammonium sulfate, a highly solublesalt, to a specific concentration. You centrifuge the so-lution, decant the supernatant, and discard the pellet.To the supernatant, which is clearer than the lysate,you add more ammonium sulfate. Once again, youcentrifuge the sample, but this time you save the pel-let because it contains the protein of interest. What is
the rationale for the two-step addition of the salt?
(d) You solubilize the ammonium sulfate pelletcontaining the mitochondrial proteins and dialyze itovernight against large volumes of buffered (pH 7.2)solution. Why isn’t ammonium sulfate included in
the dialysis buffer? Why do you use the buffer solu-
tion instead of water?
(e) You run the dialyzed solution over a size-exclusion chromatographic column. Following the pro-tocol, you collect the first protein fraction that exitsthe column, and discard the rest of the fractions thatelute from the column later. You detect the protein bymeasuring UV absorption (at 280 nm) in the fractions.What does the instruction to collect the first fraction
tell you about the protein? Why is UV absorption at
280 nm a good way to monitor for the presence of
protein in the eluted fractions?
(f) You place the fraction collected in (e) on acation-exchange chromatographic column. After dis-carding the initial solution that exits the column (theflowthrough), you add a washing solution of higher pHto the column and collect the protein fraction that im-mediately elutes. Explain what you are doing.
(g) You run a small sample of your fraction, nowvery reduced in volume and quite clear (though tingedpink) on an isoelectric focusing gel. When stained, thegel shows three sharp bands. According to the proto-col, the protein of interest is the one with the pI of 5.6,but you decide to do one more assay of the protein’spurity. You cut out the pI 5.6 band and subject it toSDS-polyacrylamide gel electrophoresis. The proteinresolves as a single band. Why were you uncon-
vinced of the purity of the “single” protein band on
your IEF gel? What did the results of the SDS gel tell
you? Why is it important to do the SDS gel elec-
trophoresis after the isoelectric focusing?