Embed Size (px)
Citation preview

This is a repository copy of Structure and dynamics of iron pentacarbonyl.
White Rose Research Online URL for this paper:https://eprints.whiterose.ac.uk/152140/
Version: Accepted Version
Article:
Portius, P. orcid.org/0000-0001-8133-8860, Bühl, M., George, M.W. et al. (2 more authors)(2019) Structure and dynamics of iron pentacarbonyl. Organometallics, 38 (21). pp. 4288-4297. ISSN 0276-7333
https://doi.org/10.1021/acs.organomet.9b00559
This document is the Accepted Manuscript version of a Published Work that appeared in final form in Organometallics, copyright © American Chemical Society after peer review and technical editing by the publisher. To access the final edited and published work see https://doi.org/10.1021/acs.organomet.9b00559
[email protected]://eprints.whiterose.ac.uk/
Reuse
Items deposited in White Rose Research Online are protected by copyright, with all rights reserved unless indicated otherwise. They may be downloaded and/or printed for private study, or other acts as permitted by national copyright laws. The publisher or other rights holders may allow further reproduction and re-use of the full text version. This is indicated by the licence information on the White Rose Research Online record for the item.
Takedown
If you consider content in White Rose Research Online to be in breach of UK law, please notify us by emailing [email protected] including the URL of the record and the reason for the withdrawal request.

Structure and Dynamics of Iron Pentacarbonyl
Peter Portius*,a,c Michael Bühl,b Michael W. George,c,d Friedrich-Wilhelm Grevels,e and James J. Turner*c
a Department of Chemistry, The University of Sheffield, Sheffield, S3 7HF, United Kingdom b School of Chemistry, University of St. Andrews, St. Andrews, Fife KY16 9ST, United Kingdom c School of Chemistry, University of Nottingham, University Park, Nottingham NG7 2RD, United Kingdom d Department of Chemical and Environmental Engineering, University of Nottingham Ningbo China, 199 Taikang East Road, Ningbo 315100, China e Max-Planck-Institut für Bioanorganische Chemie, Stiftstraße 34-36, D-45470 Mülheim an der Ruhr, Germany; deceased in 2016
metal carbonyls, Berry pseudorotation, supercritical xenon, infrared spectroscopy
ABSTRACT: The dynamics of CO ligand scrambling in Fe(CO)5 has been investigated by linear infrared spectroscopy in supercriti-cal xenon solution. The activation barrier for the Berry pseudorotation in Fe(CO)5 was determined experimentally as Ea = 2.5(±0.4) kcal mol−1 by quantitative analysis of the temperature-dependent spectral line-shape. This compares well with the range of Ea / (kcal mol−1) = 2.0 to 2.3 calculated by various DFT methods, and a value of 1.6(±0.3) previously obtained from 2D-IR measurements by Harris et al. (Science, 2008, 319, 1820). The involvement of Fe(CO)5· · ·Xe interactions in the ligand scrambling process was tested computationally at the BP86-D3/AE2 level and found to be negligible.
INTRODUCTION
Since the synthesis of Fe(CO)5 in 1891,1 there has been a great deal of interest in its chemistry, structure, bonding and, in particular, the dynamics of the scrambling of the ligands. Fe(CO)5 has a D3h-symmetric structure in the gas phase (cf. Figure 1).2
Figure 1. Ball-and-stick model of the D3h-symmetric structure of Fe(CO)5; Fe, lilac; C, grey; O, red.
In 1958, Cotton et al.3 observed that the 13C NMR spectra showed only one line at all available temperatures. Later work4 confirmed and extended this down to −170°C. Thus, the exchange among the CO groups must be very fast. In rather subtle NMR experiments, Sheline and Mahnke5 estimated that at room temperature, CO scrambling occurs at a rate of about 1.1×10¹⁰ s−1 and with an activation energy of ~1.13 kcal mol−1.
It is usually assumed that the mechanism involves the Berry pseudorotation6 (Figure 2). Attempts to resolve the structure have been carried out in the solid state at low temperature, and resulted in some disagreement,7,8 which is, however, of little relevance to under-standing the behavior in solution. That it was possible to freeze the scrambling was shown by Turner and colleagues9 using a combi-nation of polarized photolysis and IR spectroscopy in a CO matrix at 20 K.
Figure 2. Geometries relevant for the Berry pseudorotation model of Fe(CO)5 and for the DFT calculations in this paper.

A large number of DFT calculations on Fe(CO)5 (and other metal carbonyls) have been carried out. Most of them were concerned with structure, and particularly with the difference between the axial and equatorial Fe−C and C−O bond lengths, as well as the dissociation energy of the ligand de-coordination reaction, Fe(CO)5 → Fe(CO)4 + CO, and the vibrational frequencies. Several authors have considered the energy difference between the D3h-symmetric ground state and the top of the barrier in the Berry mech-anism (C4v). Schaefer and colleagues10 calculated the barrier height using various basis sets and obtained 2.25 kcal mol−1 (DZ B3LYP), 2.28 kcal mol−1 (DZP BP86), 2.33 kcal mol−1 (DZP B3LYP) with the stated methods. In an important paper, Harris and co-workers11 estimate the barrier height to be 2.13 kcal mol−1 (BP86 with the basis sets 6-31+g(d) for C and O, and LANL2DZ for Fe). More recently, Couzijn et al.12 obtained 2.0 kcal mol−1 at the B3PW91 / SDD(d) level of theory. The relevance of this data will be outlined shortly. We have calculated the barrier height at BP86, PBE and PBE0 levels of theory, to give values between 2.0 and 2.3 kcal mol−1; see the SI for details of the calculations. Thus, the calculation of barrier height is remarkably independent of the DFT method. How-ever, obtaining good experimental data for the barrier height and the kinetics of the Berry pseudorotation is a much more challenging problem.
The study of dynamics requires experiments to be conducted over a broad range of temperatures, and with very small barriers in particular, one needs to be able to extend this to very low ones. While there is no doubt that the structure of Fe(CO)5 in the gas phase has D3h symmetry, the complex can undergo considerable distortion in various solvents. Elegant experiments by Rose-Petruck and colleagues13 using IR spectroscopy probed the temperature-dependence of the spectrum in the region of the (CO) stretches. With the support of DFT calculations, they were able to show that, particularly in benzene and increasingly fluorinated derivatives, the structure of Fe(CO)5 distorts to C2v- or C4v-symmetric geometries. The authors also supply thermodynamic parameters connecting the D3h structure with the various distorted structures as shown in eq. 1.
Fe(CO)5 + solvent → Fe(CO)5∙∙∙(solvent) (eq. 1)
(D3h) (C2v / C4v)
In pentafluorobenzene, for instance, the parameters H = −3.59(±0.68) kcal mol−1, S = −8.43(±1.83) cal K−1 mol−1 and G = −1.08 kcal mol−1 can be used to describe the equilibrium between the two structures at room temperature. According to this data, it can be concluded that the equilibrium lies well to the right (10.6% D3h, 89.4% C2v) and that the (CO) IR spectrum is dominated by the distorted structure. However, as the temperature is raised, and assuming H remains roughly constant, a negative entropy change will cause a shift of the equilibrium to the left. If the interaction between Fe(CO)5 and cyclohexane is presumed to be weak, it is not surprising that the experimental evidence for a complex is weak, and the authors conclude that at room temperature, Fe(CO)5 is “nearly undisturbed D3h” in cyclohexane.13 With the negative entropy changes being involved, there will be an even lesser distortion of the structure at higher temperatures. However, since this paper is concerned with the dynamic behavior of Fe(CO)5, more infor-mation is needed about both structures and spectra in a variety of solvents. The following describes new experimental and computa-tional evidence for the barrier in this prototypical fluxional molecule.
RESULTS AND DISCUSSION
Figure 3 shows the (CO) region of the IR spectrum of Fe(CO)5 in 2-methylpentane at −140°C. The bands labelled 1 and 2 are assigned to the (CO) vibrations that transform as the a2’’ and e’ irreducible representations of D3h-symmetric Fe(12CO)5, respectively; those labelled 3, 4, 5, 6 arise from Fe(13CO)(12CO)4 (see the SI for a full force constant analysis) due to naturally occurring 13CO.14,15 The two fundamental a’ (CO) vibrations are not active in the IR under D3h symmetry, but become active if the symmetry is reduced slightly to C2v; the bands labelled 7 and 8 are assigned to these a’ vibrations. If the distortion is considerable, the degeneracy of the e’ vibrations is removed.
Figure 3. IR spectrum in the (CO) region of Fe(CO)5 in 2-methylcyclohexane at −140°C.
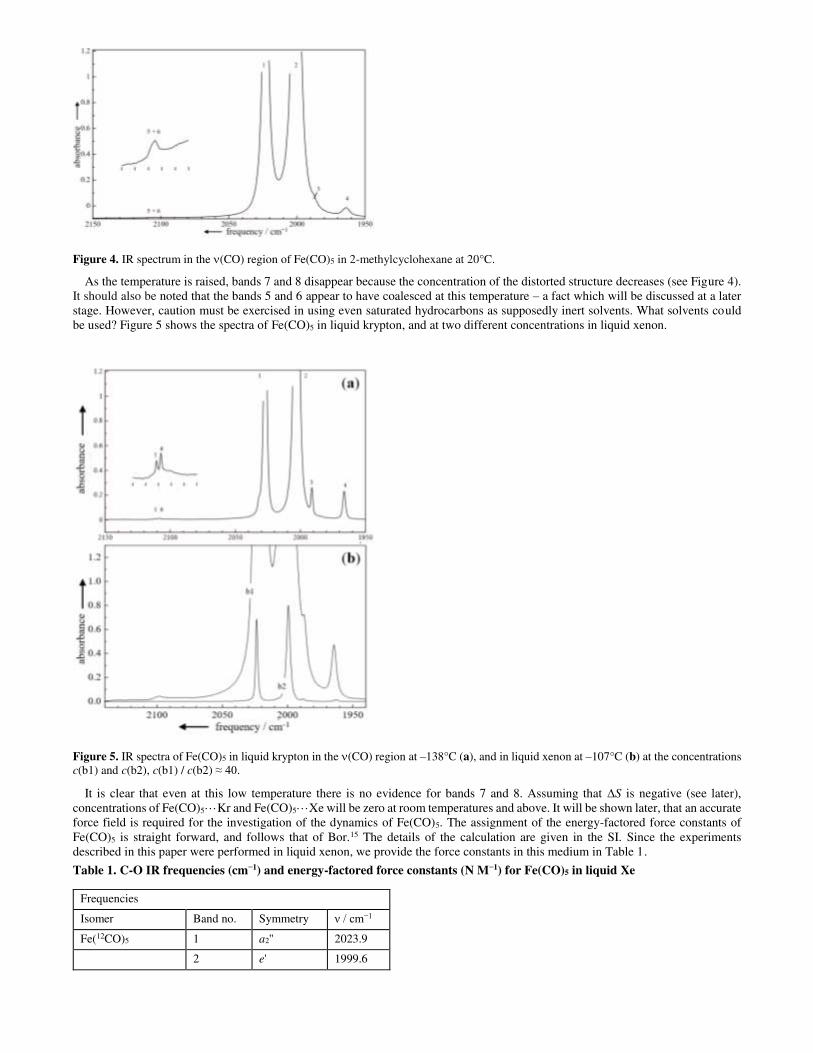
Figure 4. IR spectrum in the (CO) region of Fe(CO)5 in 2-methylcyclohexane at 20°C.
As the temperature is raised, bands 7 and 8 disappear because the concentration of the distorted structure decreases (see Figure 4). It should also be noted that the bands 5 and 6 appear to have coalesced at this temperature – a fact which will be discussed at a later stage. However, caution must be exercised in using even saturated hydrocarbons as supposedly inert solvents. What solvents could be used? Figure 5 shows the spectra of Fe(CO)5 in liquid krypton, and at two different concentrations in liquid xenon.
Figure 5. IR spectra of Fe(CO)5 in liquid krypton in the (CO) region at –138°C (a), and in liquid xenon at –107°C (b) at the concentrations c(b1) and c(b2), c(b1) / c(b2) ≈ 40.
It is clear that even at this low temperature there is no evidence for bands 7 and 8. Assuming that S is negative (see later), concentrations of Fe(CO)5· · ·Kr and Fe(CO)5· · ·Xe will be zero at room temperatures and above. It will be shown later, that an accurate force field is required for the investigation of the dynamics of Fe(CO)5. The assignment of the energy-factored force constants of Fe(CO)5 is straight forward, and follows that of Bor.15 The details of the calculation are given in the SI. Since the experiments described in this paper were performed in liquid xenon, we provide the force constants in this medium in Table 1.
Table 1. C-O IR frequencies (cm−1) and energy-factored force constants (N M−1) for Fe(CO)5 in liquid Xe
Frequencies
Isomer Band no. Symmetry ν / cm−1
Fe(12CO)5 1 a2'' 2023.9
2 e' 1999.6

ax-Fe(13CO)(12CO)4 3 a1 1988.5
6 a1 2106.1
eq-Fe(13CO)(12CO)4 4 a1 1963.2
5 a1 2109.4
Force constants
kax 1698.1
keq 1655.2
kax,ax 43.4
keq,eq 39.9
kax,eq 28.0
For technical and safety reasons, it is easier to study Fe(CO)5 at higher temperatures in liquid Xe rather than liquid Kr. In examining the dynamical behavior of Fe(CO)5 in liquid Xe, it is worth probing the possible interaction of Fe(CO)5 with Xe, particularly as the molecule distorts in the process of the Berry pseudorotation. As first step toward modeling the bulk liquid, we have investigated the interaction between Fe(CO)5 and a single Xe atom. The result of the DFT calculation (see SI for details) is displayed in Figure 6 and shows how the interaction energy depends on the distance between Xe and Fe(CO)5 and that the interaction is essentially caused by attractive van der Waals-type dispersion interactions. Furthermore, in agreement with the observation made by IR spectroscopy, the optimized geometries indicate no effective distortion of Fe(CO)5 (at least not until Xe···Fe(CO)5 distances are very small and below ca. 3.5 Å).
Figure 6. Energy profile for Fe(CO)5· · ·Xe as a function of the Fe(CO)5· · ·Xe distance (all other parameters optimized) calculated at the levels BP86/AE2 (○) (a purely repulsive potential) and BP86-D3/AE2 (●).
The important question, however, is how the interaction could affect the C4v-symmetric structure at the transition state of the Berry mechanism and, therefore, the D3h-C4v barrier height. Table 2 shows the results of our DFT calculations.
Table 2. Energy barriers for pseudorotation a in Fe(CO)5 and Fe(CO)5· · ·Xe at the BP86-D3/AE2 level of theory
Energy Fe(CO)5 Fe(CO)5∙∙∙Xe
E (0 K) b 2.2 2.0
H (298 K) b 1.6 1.4
G (298 K) b 2.9 3.2
a Evaluated as difference between D3h-symmetric minimum and C4v-symmetric transition states for Fe(CO)5, and between the Cs-symmet-ric minimum shown in Figure 6 and a C4v-symmetric transition state (not shown) for Fe(CO)5∙∙∙Xe; b in units of kcal mol−1.
It is clear that, within the limits of the calculations,16 the interaction between Fe(CO)5 and Xe is very similar in both the D3h and C4v structures. Even though this calculation refers to the gas phase, and given the nature of the Xe-Fe(CO)5 interaction, it is unlikely that the supercritical fluid Xe environment will make a large difference to the parameters. Moreover, because the entropy change for complex formation will be negative, the concentration of a Xe complex at room temperature and above will certainly be close to zero.
Obtaining good experimental data for the kinetics and barrier height for the Berry pseudorotation is challenging. The most direct method is to use two-dimensional infrared spectroscopy (2D-IR), and this is considered here first.

Two-Dimensional Infrared Spectroscopy (2D-IR)
There is an excellent book on 2D-IR by Hamm and Zanni17, and a summary by Thielges and colleagues.18 The application to metal carbonyls has been outlined by Kubarych and colleagues,19 and a very recent review20 summarizes the experiments on metal carbonyls that have been carried out over the past few years. The literature reveals that there is often a problem relating to difficulties on how to distinguish between the effects caused by chemical exchange and those caused by Intramolecular Vibrational Redistribution (IVR, see ref. 20 for a review discussing this). There is also a fundamental problem in the method with which 2D-IR monitors the exchange. 2D-IR requires excited vibrational states and records transitions between levels at v = 1 in mode 1 to v = 1 in mode 2 - a point emphasized by Harris.11 The Berry mechanism, however, assumes transfer between v = 0 states and this point will be elaborated at a later stage.
Harris and colleagues carried out elegant 2D-IR experiments on Fe(CO)5 in n-dodecane solution. Assuming the Berry mech-anism to be operational, they obtained time constants of 8.0(±0.6) ps at 18 °C, 6.3(±0.8) ps at 50°C, and 4.6(±0.4) ps at 90 °C, which translate into the rate constants 1.2×10¹¹ s−1, 1.6×10¹¹ s−1 and 2.2×10¹¹ s−1, respectively. From an Arrhenius plot, the activation energy was calculated to be 1.6(±0.3) kcal mol−1, which is reasonably close to the range of DFT values, 2.0 to 2.2 kcal mol−1, and including Harris’s value of 2.13. The calculations of barrier height, however, ignore zero point energies. The calculated zero point energies of D3h and C4v structures are 25.9 and 25.8 kcal mol−1, respectively (BP86-D3/AE2 level, this work), meaning that the inclusion of zero point energies would only reduce the barrier by approximately 0.1 kcal mol−1. In addition, Harris showed convincingly11 that the vibrational transfer was not caused by IVR.
Although 2D-IR is the most direct way of measuring the dynamics of exchange, there is, in principle, another method that probes the effect on band shapes in one-dimensional IR and Raman spectroscopy. This approach, analogous to the evaluation of peak behavior in NMR, is considered next.
One-dimensional infrared spectroscopy
Spectral line shapes are a question of timescale. In order to show the effect that temperature has on spectral line shape, it is most convenient to consider the effect on NMR first. If two spin = ½ nuclei (e.g. 1H) are uncoupled and give rise to bands with a separation of Hz and a Lorentzian half-width (1/2W) in the absence of exchange equal to 1/T2, then, employing the usual Bloch equations, the NMR spectrum is easily calculated as a function of the exchange rate. For the moment, just consider the extremes of “slow” (i.e. k → 0) and “fast” exchange (k → ): In slow exchange, the spectrum shows two Lorentzian bands, which are each centred at the original peak positions but with half-width (1/2W) increased by k/ according to 1/2W / Hz 1/T2 + k/. However, in fast exchange, the spectrum shows only a single peak with 1/2W given by 1/2W / Hz 1/T2 + (/2k)()2. If T2 = 0.5 s and = 20 Hz, then the linewidth can be estimated by 1/2W 0.64 + 630/k for the fast exchange. Thus, with values for k in the range 103 s−1 to 104 s−1, there is one band with a width of 1/2W 1.2 Hz to 0.7 Hz, which shows, and this is well known, that in this regime the single coalesced band narrows on increasing k.
For IR and Raman spectroscopies, the following can be stated: Suppose there are two bands, 10 cm−1 apart, and each of half-width (1/2W) 1.0 cm−1. Assuming (for the moment) that the Bloch equations apply, one can estimate from the above relationships the magnitude of k to produce coalescence. If k = 1010 s−1, then the “slow” regime applies and the spectrum shows two bands, each broadened by 0.1 cm−1. If k = 1013 s−1, the “fast” regime applies, and there is only a single Lorentzian profile of a width 1/2W 1.5 cm−1. In order to observe dynamic effects in IR and Raman spectra, a very fast exchange rate is required (on the NMR timescale, coalescence typically occurs at k = 104 s−1, for IR bands though, each would be broadened by a mere 10−7 cm−1 – an effect completely unobservable with current experimental apparatus).
An important point, however, which has been emphasized in several publications (see ref. 20, and literature cited therein), is that, as the rate increases, there is increasing intensity at the mid-point between two absorption bands, greater than that due to change of width in overlapping Lorentzian profiles. Indeed, in the early days of NMR spectroscopy, before the advent of dynamic NMR computer programs, this extra intensity build-up was used to estimate exchange rates.21
The coalescence effect in vibrational spectra is well-illustrated in experiments by Kim and Hochstrasser,22 who investigated the equilibrium between free CH3CN (C-N stretch 2254 cm−1) and H-bonded CH3CN (2263 cm−1) in methanol solution. These exper-iments are also significant because the authors compare the FTIR data with data from 2D-IR experiments; the kinetic results are similar. The first evidence for this type of behavior in metal carbonyls was obtained by Grevels and co-workers23,24 during studies of the (CO) absorption bands in the IR spectra of iron(tricarbonyl)diene complexes, Fe(CO)3(diene), see Figure 7.
Figure 7. Fe(CO)3(diene) complexes showing rapid CO ligand scrambling; diene refers to butadiene (BUT), norbornadiene (NBD), and cyclooctadiene (COD).

Based on 13C NMR data,25 the barrier to turnstile rotation in Fe(CO)3(BUT) was determined to be 8 kcal mol−1, which results in an exchange rate much too slow to have any effect on the vibrational spectrum. However, Fe(CO)3(NBD) and Fe(CO)3(COD) behave like Fe(CO)5 in that the 13C NMR spectra show only a single peak for the three carbonyl ligands at all accessible temperatures. Figure 8a displays the change26 of the IR spectrum of Fe(CO)3(COD) in 2-methylpentane in the (CO) region.
Figure 8. The (CO) bands of the variable-temperature spectra of Fe(CO)3(COD) in 2-methylpentane solution between 133 K and 293 K; observed (a); simulated (b) assuming rapid CO site exchange (reprinted with permission from reference 26, copyright American Chemical Society).
The two low-frequency bands, assigned to the symmetry species a’ and a’’ of the Cs point group, merge as the temperature is raised. Grevels reasoned that if the CO groups rotate very fast, then the complex adopts, effectively, C3v symmetry and the a’ and a’’ vibra-tions become e’. However, before extracting kinetic data from coalescing IR spectra, there are several problems to be resolved that are concerned with Bloch equations, line shapes, and the relationship between vibrations and torsional energy levels.
The Bloch equations
Considerable doubt, particularly by Strauss,27,28,29 has been cast on the use of the Bloch method for vibrational spectra. Grevels was well aware of this question in his first publications,23,24 but assumed that one could obtain reasonable values for rate constants and barrier height. This point has been much discussed and the details were summarized by us elsewhere.20 The general conclusion is that the method is applicable, but one must be cautious when trying to extract accurate data. In fact, two educational publications30,31 show advanced students how to obtain kinetic data from the coalescing (CO) bands of Fe(CO)3(COD).
Lorentzian shapes
So far, the discussion has assumed Lorentzian shapes for the absorption bands. Of course, IR bands almost always show a convo-lution of Lorentz and Gauss functions. This can be accommodated by employing Voigt functions.
Frequency and half-widths of IR bands without exchange
The application of the Bloch equations assumes that the position and half-width of the bands in the absence of exchange do not alter with change in conditions, i.e. as the temperature is raised. For NMR this is true but, as is well known, for IR and Raman spectra, however, these can vary dramatically, depending on the solvent. Thus, it is necessary to include such considerations carefully in any analysis.
Contribution from torsional energy levels
It was pointed out by Strauss29 that, if the torsional barrier vibrational levels are populated, and if the anharmonic coupling between these vibrations and the (CO) stretching vibrations is significant, then the latter may be affected as the temperature is raised, without any reference to exchange. This would make the Grevels approach invalid. Fortunately, for the iron tricarbonyl species, DFT calcu-lations show that the (CO) vibrations are hardly affected as the barrier is climbed.20 This point is raised here because it is important to consider such effects in the case of Fe(CO)5, and this will be discussed later.

Interacting vibrations
For metal carbonyls, there is mixing of the C-O stretching vibrations, which greatly complicates the issue. In the paper by Grevels et al.,26 McClung showed the method of taking this into account, and the net result is shown in Figure 8b. The match between experiment and theory (Figures 8a vs. 8b) is impressive. It is important, for comparison with Fe(CO)5, to see how this was done. The starting point was to assume that in the absence of exchange, the (CO) band positions shifted slightly with temperature in a manner similar to the non-exchanging Fe(CO)3(BUT). McClung’s spectrum simulation program was then used to fit the spectra at different temperatures with changing values of the rate constant. The details of the iteration process are given in the SI. The rate varied from 1.5×10¹¹ s−1 at 133 K to 1.54×10¹² s−1 at 293 K. An Arrhenius plot gave a straight line with an activation energy of 1.1 kcal mol−1. The McClung program generates non-exchanging Voigt profiles for the coalescing bands; see Table 3 in ref. 26. For example, the non-exchanging half-widths, wG (Gaussian), wL (Lorentzian), of the a’’ band at ~1948 cm−1 are 6.8 cm−1, 0.9 cm−1; and 1.2 cm−1, 5.6 cm−1 at 133 K and 293 K, respectively.
In several elegant experiments, Lear and co-workers32,33,34 have extended these experiments and essentially confirmed Grevels’s conclusions. It is worth mentioning that two authors30,32 have suggested a mistake in McClung’s method, but a careful analysis of the mathematics shows that the supposed error is only due to an unconventional definition, and in fact, McClung’s method is essentially the same as theirs.
The behavior of Fe(CO)5
What might one expect to observe for a rapid exchange in Fe(CO)5? Compared with the dienes, there is no obvious point group symmetry to assign to a rapidly exchanging five-coordinate system. However it is straightforward to extend the (CO)3 McClung method to a (CO)5 exchanging system, and McClung has provided the appropriate modification of the method. We are greatly in-debted to him. Figure 9 shows the expected pattern as the rate of the Berry mechanism increases.
Figure 9. Simulated IR absorption spectra of Fe(CO)5 in the region of the ν(CO) stretching vibrations. The simulation is based on the model of a Berry pseudorotation using the exchange rate constants kexch / s−1 = 0 (─), 3.17×10¹¹ (─) 8.17×10¹¹ (─), 3.17×10¹² (─). The absorption band maxima 2024.57 cm−1 and 2002.98 cm−1 and widths, wL / cm−1 = 2.58, 3.95, wG / cm−1 = 2.75, 3.08, apply throughout (L = Lorentzian; G = Gaussian).
Not surprisingly, the predicted pattern shows coalescence to a single band and mimics NMR behavior. It is clear that there is build-up of intensity between the peaks before there is clear moving-together of the peaks. The importance of this extra intensity feature has been mentioned above.
In addition to their 2D-IR work, Harris and colleagues11 also carefully examined the FTIR spectra of Fe(CO)5 in n-dodecane as a function of temperature, and concluded that, although there were hints of coalescence - including some evidence for build-up of inter-peak intensity - it was not possible to distinguish satisfactorily between a broadening pair of Lorentzian profiles and the effect of exchange based on McClung’s approach. Attempts to extract kinetic data were not really successful, with rate constants “on the order of 0.1 ps−1”, compared with 0.12 ps−1 to 0.22 ps−1 from their 2D-IR measurements. The real problem is, that before there is convincing evidence of coalescence with increasing temperature, Fe(CO)5 decomposes. However, with the advantage of liquid Xe as a solvent, and the resultant very high quality FTIR spectra, we believe there is weak but clear evidence for the build-up of intensity between the peaks (Figure 10).

Figure 10. The a2’’ (2025.5 cm−1) and e’ (2003.7 cm−1) bands of a Fe(CO)5 solution in supercritical xenon (14.67 mol dm−3) at 301.6 K (2054 psi, a, c) and 386.1 K (6372 psi, b, d); left: simulated spectra below experimental spectra based on the best fit using two pseudo-Voigt profiles. The thick black lines (│) indicate the extra intensity in the experimental spectra, greater than that predicted on the basis of simple band overlap; right: experimental spectra (─) and simulated spectra (─) are shown without off-set. The areas under the experimental spectra are normalized.
But can one obtain quantitative data? Figure 11 shows the IR spectra of Fe(CO)5 in supercritical xenon as a function of temperature. It was noticed that band maxima shift less and bands broaden less with increasing temperature, if the density of the supercritical fluid is kept constant instead of the pressure of the fluid, see SI, Table S1.
Starting with the same assumptions as employed for COD, the IR spectra of Fe(CO)5 were simulated which resulted in the data shown in Table 3.
Figure 11. 1975-2045 cm−1 section of the temperature-dependent IR spectra of Fe(CO)5 in supercritical xenon in the temperature interval 302 K to 386 K recorded at an optical resolution of 0.5 cm−1.
Figure 12 shows an Arrhenius plot derived from this data. Given the difficulties of the measurements, the data adheres within the estimated margins of error to a pleasing straight line. The experimentally determined Arrhenius activation energy was found to be Ea = 2.5(±0.4) kcal mol−1. This is in remarkable agreement with the calculated values from DFT theory ranging from 2.0 to 2.3 kcal mol−1, and is encouraging for the one-dimensional IR technique. The corresponding values of ΔH‡ / (kcal mol−1) and ΔG‡ / (kcal mol−1) are 1.8(±0.4) and 3.9(±1.6) (experiment) and 1.4 and 3.2 (theory, DFT, see Table 2). The activation energy obtained from the 2D-IR experiments11 was 1.6(±0.3) kcal mol−1. The differing experimental values could possibly arise from two factors: as mentioned above, 2D-IR supplies kinetic data between excited vibrational states (i), and the solvent, n-dodecane in this case, might influence the kinetics (ii). We have therefore been investigating the interaction between Fe(CO)5 and various solvents, as an extension to the Rose-Petruck work,13 and this will be published shortly. However there are further structural dynamics implications to consider.
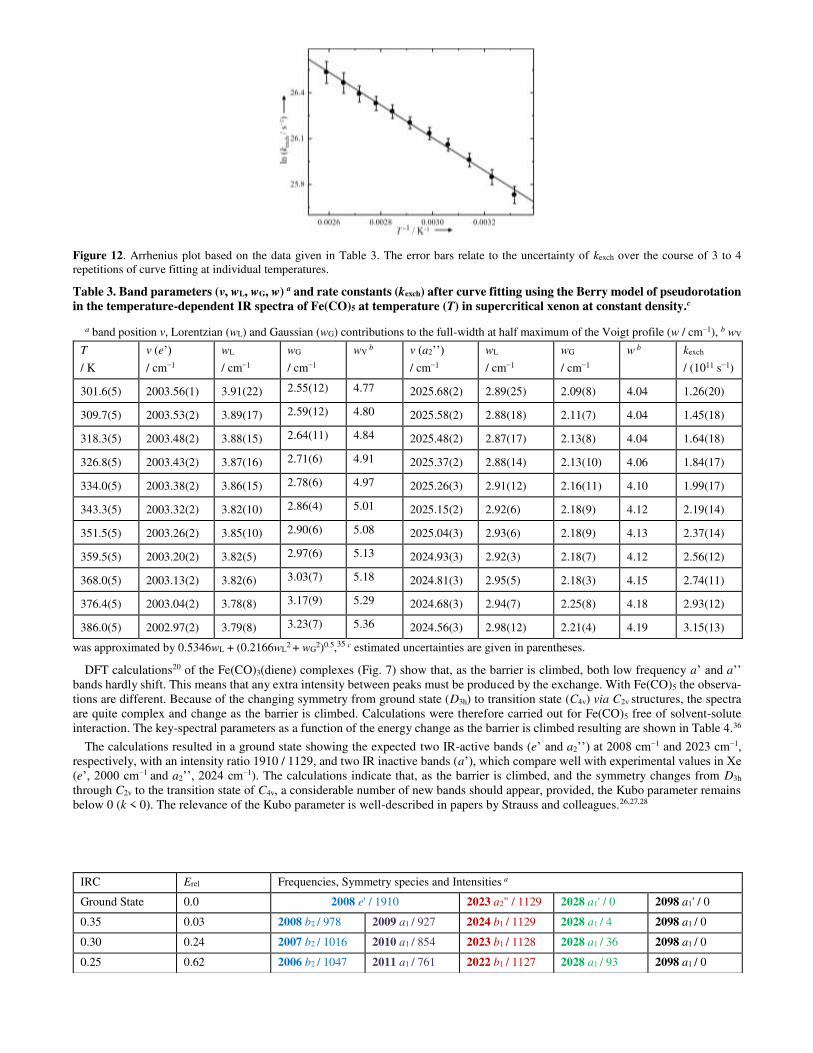
Figure 12. Arrhenius plot based on the data given in Table 3. The error bars relate to the uncertainty of kexch over the course of 3 to 4 repetitions of curve fitting at individual temperatures.
Table 3. Band parameters (ν, wL, wG, w) a and rate constants (kexch) after curve fitting using the Berry model of pseudorotation
in the temperature-dependent IR spectra of Fe(CO)5 at temperature (T) in supercritical xenon at constant density.c
a band position ν, Lorentzian (wL) and Gaussian (wG) contributions to the full-width at half maximum of the Voigt profile (w / cm−1), b wV
was approximated by 0.5346wL + (0.2166wL2 + wG
2)0.5,35 c estimated uncertainties are given in parentheses.
DFT calculations20 of the Fe(CO)3(diene) complexes (Fig. 7) show that, as the barrier is climbed, both low frequency a’ and a’’ bands hardly shift. This means that any extra intensity between peaks must be produced by the exchange. With Fe(CO)5 the observa-tions are different. Because of the changing symmetry from ground state (D3h) to transition state (C4v) via C2v structures, the spectra are quite complex and change as the barrier is climbed. Calculations were therefore carried out for Fe(CO)5 free of solvent-solute interaction. The key-spectral parameters as a function of the energy change as the barrier is climbed resulting are shown in Table 4.36
The calculations resulted in a ground state showing the expected two IR-active bands (e’ and a2’’) at 2008 cm−1 and 2023 cm−1, respectively, with an intensity ratio 1910 / 1129, and two IR inactive bands (a’), which compare well with experimental values in Xe (e’, 2000 cm−1 and a2’’, 2024 cm−1). The calculations indicate that, as the barrier is climbed, and the symmetry changes from D3h
through C2v to the transition state of C4v, a considerable number of new bands should appear, provided, the Kubo parameter remains below 0 (k < 0). The relevance of the Kubo parameter is well-described in papers by Strauss and colleagues.26,27,28
T
/ K
ν (e’) / cm−1
wL
/ cm−1
wG
/ cm−1
wV b
ν (a2’’) / cm−1
wL
/ cm−1
wG
/ cm−1
w b kexch
/ (1011 s−1)
301.6(5) 2003.56(1) 3.91(22) 2.55(12) 4.77 2025.68(2) 2.89(25) 2.09(8) 4.04 1.26(20)
309.7(5) 2003.53(2) 3.89(17) 2.59(12) 4.80 2025.58(2) 2.88(18) 2.11(7) 4.04 1.45(18)
318.3(5) 2003.48(2) 3.88(15) 2.64(11) 4.84 2025.48(2) 2.87(17) 2.13(8) 4.04 1.64(18)
326.8(5) 2003.43(2) 3.87(16) 2.71(6) 4.91 2025.37(2) 2.88(14) 2.13(10) 4.06 1.84(17)
334.0(5) 2003.38(2) 3.86(15) 2.78(6) 4.97 2025.26(3) 2.91(12) 2.16(11) 4.10 1.99(17)
343.3(5) 2003.32(2) 3.82(10) 2.86(4) 5.01 2025.15(2) 2.92(6) 2.18(9) 4.12 2.19(14)
351.5(5) 2003.26(2) 3.85(10) 2.90(6) 5.08 2025.04(3) 2.93(6) 2.18(9) 4.13 2.37(14)
359.5(5) 2003.20(2) 3.82(5) 2.97(6) 5.13 2024.93(3) 2.92(3) 2.18(7) 4.12 2.56(12)
368.0(5) 2003.13(2) 3.82(6) 3.03(7) 5.18 2024.81(3) 2.95(5) 2.18(3) 4.15 2.74(11)
376.4(5) 2003.04(2) 3.78(8) 3.17(9) 5.29 2024.68(3) 2.94(7) 2.25(8) 4.18 2.93(12)
386.0(5) 2002.97(2) 3.79(8) 3.23(7) 5.36 2024.56(3) 2.98(12) 2.21(4) 4.19 3.15(13)
IRC Erel Frequencies, Symmetry species and Intensities a
Ground State 0.0 2008 e' / 1910 2023 a2" / 1129 2028 a1' / 0 2098 a1' / 0
0.35 0.03 2008 b2 / 978 2009 a1 / 927 2024 b1 / 1129 2028 a1 / 4 2098 a1 / 0
0.30 0.24 2007 b2 / 1016 2010 a1 / 854 2023 b1 / 1128 2028 a1 / 36 2098 a1 / 0
0.25 0.62 2006 b2 / 1047 2011 a1 / 761 2022 b1 / 1127 2028 a1 / 93 2098 a1 / 0

Table 4. CO stretching frequencies in Fe(CO)5, calculated at the BP86/AE1 level along the intrinsic reaction coordinate (IRC,
values for the coordinate given in amu1/2 Bohr, relative energies in kcal mol−1).
a harmonic vibrational frequencies (cm−1) in boldface, next in normal face the symmetry labels of vibrations (in the D3h , C2v and C4v point groups for ground, intermediate and transition states, respectively) / IR intensities (km mol−1); a color code applies to the various vibrational modes to guide the eye. Note that depending on the point group symmetry, corresponding vibrations can have different symmetry labels.
The intensity of these bands will increase with the temperature. For instance, in the regions between ground and transition states, there are bands calculated to lie roughly half way between the experimentally observed bands in the spectral region between ca. 2014 cm−1 and 2017 cm−1. As the temperature is raised, these bands are predicted make an increasing, but still very small contribution to the spectrum, and this could, in principle, add extra intensity between the main peaks, and hence make the kinetic interpretation invalid. However there are two reasons for rejecting this model. In the first place, the Kubo parameters for the vibrational levels in these carbonyls have values k > 0, which implies that the molecule is very rapidly switching among the torsional levels. The resulting spectra are not the sum of contributing spectra but the intensity-weighted average of the spectra. For a discussion of this point see ref. 20. Secondly, if this were a determining factor, the rate constants would be way out of line, and the activation energy would not be sensible.
The Spectra of Isotopic Fe(CO)5
The exchange between ax-Fe(13CO)(12CO)4 and eq-Fe(13CO)(12CO)4 isotopomers will mimic the behaviour of their isotopolog, Fe(12CO)5. In principle, it should therefore be possible to examine the (CO) absorption bands of the isotopic molecules for similar behaviour. Bands 5 and 6 in Figures 3 and 5 are assigned to the axial and equatorial isotopomers. Moreover, because they are closer in frequency than the main (CO) absorption bands of Fe(12CO)5, they should display this behaviour more obviously. Figure 4 shows this phenomenon to occur in 2-methypentane, where the bands appear to be coalescing. Disappointingly, although there is some evidence for band coalescence in Xe, it is not convincing, and it is certainly not sufficient to produce meaningful kinetic data.
EXPERIMENTAL
Spectroscopy
The variable-temperature experiments involving Fe(CO)5 in xenon were carried out in the School of Chemistry of the University of Nottingham. Spectra in 2-methylcyclohexane and krypton were recorded by Grevels & Klotzbücher at the Max-Planck-Institut für Bioanorganische Chemie. Fourier-transform infrared spectra were recorded at a resolution of 0.5 cm−1 using custom-made miniature high-pressure stainless steel (r.t. to 386 K) and annealed copper optical cells (162 K to 316 K), which were adapted from published designs and equipped with CaF2 windows of various thickness.36 For measurements at and above the critical point, a constant density of xenon (14.7 mol dm−3) was maintained in the spectroscopic cell. The high-pressure stainless steel gas handling manifold and the optical cells connected to it were deoxygenated prior to loading samples and preparing solutions. After each temperature change and before each spectral measurement, the optical cells were allowed to equilibrate for 20 min, after which the temperature in solution was constant to within ±0.2 K. No sample degradation was observed below ca. 383 K. Measurements at low temperature were per-formed using an annealed Cu cell mounted on a cold finger cooled by a Displex He closed‐cycle cryostat and protected by a high-vacuum shroud equipped with CaF2 windows. Solutions were prepared with Fe(CO)5 concentrations in the order of 10−3 mol dm−3 and the ν(CO) absorption band absorption maxima were kept below unity.
Computations
Geometries were optimized at the BP86 and BP86-D3 levels of DFT (the latter including Grimme's empirical dispersion correc-tion), employing the following basis sets: AE1, an augmented (8s7p4d) Wachters' basis on Fe and 6-31G(d) basis on C and O; AE2: the same Wachters' basis on Fe, the aug-cc-pVTZ-PP basis together with the Stuttgart-Köln RSC-28-MDF relativistic effective core potential on Xe, and 6-311+G(d,p) basis on C and O. Starting from the BP86/AE1 transition state for Fe(CO)5, the intrinsic reaction coordinate (IRC) was followed. Harmonic frequencies were computed analytically for the stationary points as well as for selected points on the IRC, and are reported without scaling. Energies and frequencies for Fe(CO)5∙∙∙Xe were corrected for basis-set superpo-sition error (BSSE) using the Counterpoise method. The BP86-D3/AE2 frequencies were also used to calculate zero-point energies and thermodynamic corrections to enthalpies and free energies at 298 K. The scan in Figure 6 was obtained by fixing the Fe ∙∙∙Xe distance to selected values and relaxing all other parameters at the BP86-D3/AE2 level (including BSSE correction); the BP86/AE2 data were obtained by subtracting the -D3 correction from the BP86-D3/AE2 energies at each of the optimized points. These compu-tations employed the Gaussian suite of programs.
See the SI for full details and references.
CONCLUSION
Based on temperature-dependent FTIR spectral measurements in supercritical xenon solution at a constant density, a reliable value of 2.5(±0.4) kcal mol−1 has been obtained for the activation energy of the intramolecular interchange of CO ligands in Fe(CO)5
0.20 1.08 2006 b2 / 1071 2013 a1 / 659 2021 b1 / 1128 2027 a1 / 164 2097 a1 / 0
0.15 1.52 2007 b2 / 1090 2015 a1 / 550 2019 b1 / 1127 2026 a1 / 247 2097 a1 / 0
0.10 1.91 2008 b2 / 1104 2017 b1 / 1126 2017 a1 / 425 2025 a1 / 352 2096 a1 / 0
0.05 2.15 2010 b2 / 1114 2014 b1 / 1125 2019 a1 / 253 2024 a1 / 512 2096 a1 / 0
Transition State 2.24 2012 e / 1121 2020 b2 / 0 2023 a1 / 761 2096 a1 / 1
according to the Berry pseudorotation mechanism. This was enabled by a quantitative line shape analysis that accounts for the ex-change rate-dependent changes in the absorption bands of the CO stretching vibrations. The fluxionality of Fe(CO)5 was investigated by DFT theory, which afforded an activation barrier for pseudorotation that is consistent with the experiment. A solvate-assisted mechanism in the supercritical xenon fluid is unlikely, since any possible Xe-Fe coordination is of a weak van-der-Waals-type that leads to an only marginally lower activation barrier.
ASSOCIATED CONTENT
Supporting Information containing the energy-factored force field for metal carbonyls, details on the computer program for the evaluation of the energy-factored CO force field parameters, the eigenvector matrix, the wavenumbers of individual CO stretching vibrations, exchange- and z-Matrices, further computational details and those of spectral measurements and sample preparation is available free of charge via the Internet at http://pubs.acs.org.
AUTHOR INFORMATION
Corresponding Author
Author Contributions
FWG initiated the research and contributed the initial force field analysis. MB performed the DFT calculations. PP performed the experi-mental studies. PP and JJT analyzed the data and wrote the manuscript with the help of all authors.
Funding Sources
This work was supported by the European Union through a Marie Curie IntraEuropean Fellowship (PP, FP6-502440).
ACKNOWLEDGMENT
The authors are indebted to Prof. T. E. D. McClung (University of Alberta at Edmonton) and Dr. W. E. Klotzbücher (Max-Planck-Institut für Bioanorganische Chemie, Mülheim an der Ruhr) for the provision of the IR spectrum simulation program for fluxional carbonyl com-plexes and the indicated spectral data (Fig. 5). MB thanks the School of Chemistry and EaStCHEM for support. Calculations were performed on a local Opteron cluster maintained by Dr. H. Fruchtl. PP thanks the School of Chemistry, University of Nottingham, for supporting the experimental work.
ABBREVIATIONS
BUT, butadiene; COD, cyclooctadiene; DFT, density functional theory; FTIR, Fourier-transform infrared; IVR, intramolecular vibrational redistribution; NBD, norbornadiene; NMR, nuclear magnetic resonance.
REFERENCES

SYNOPSIS TOC. Temperature-dependent changes of the infrared-spectral line shape in supercritical xenon solution were used to experimentally determine the activation barrier of the CO ligand pseudorotation in Fe(CO)5 according to the Berry mecha-nism. Findings are backed up by DFT calculations and are consistent with time-resolved data. The work demonstrates the power of linear infrared spectroscopy to extract dynamic information.
(1) Mond, L.; Quick, F. LV. Note on a Volatile Compound of Iron with Carbon Oxide. J. Chem. Soc.Trans. 1891, 59, 604-607. (2) Beagley, B.; Schmidling, D. G. A Re-Evaluation of the Molecular Structure of Iron Pentacarbonyl. J. Mol. Struct. 1974, 22, 466-468. (3) Cotton, F. A.; Danti, A.; Waugh, J. S.; Fessenden, R. W. Carbon-13 Nuclear Resonance Spectrum and Low-Frequency Infrared Spectrum of
Iron Pentacarbonyl. J. Chem. Phys. 1958, 29, 1427-1428. (4) Jesson, J. P.; Meakin, P. Nuclear Magnetic Resonance Evidence for Stereochemical Rigidity in ML5 Complexes. J. Am. Chem. Soc. 1973, 85,
1344-1346. (5) Sheline, R. K.; Mahnke, H. The Flipping of CO Ligand Groups in Metal Carbonyl Compounds and its Frequency in Fe(CO)5. Angew. Chem.
Int. Ed. Eng. 1975, 14, 314-321. (6) Berry, R. S. Correlation of Rates of Intramolecular Tunnelling Processes, with Application to Some Group V Compounds. J. Chem. Phys.
1960, 32, 933-938. (7) Spiess, H. W.; Grosescu, R.; Haeberlen, U. Molecular Motion Studied by NMR powder spectra II. Experimental results for solid P4 and
Fe(CO)5. Chem. Phys. 1974, 6, 226-234. (8) Hanson, B. E.; Whitmore, K. H. Exchange of Axial and Equatorial Carbonyl Groups in Pentacoordinate Metal Carbonyls in the Solid State.
The Variable Temperature Magic Angle Spinning Carbon-13 NMR spectroscopy of Fe(CO)5, [Ph3PNPPh3][HFe(CO)4], and [NEt4][HFe(CO)4]. J.
Am. Chem. Soc. 1990, 112, 974-977. (9) Burdett, J. K.; Gryzbowski, J. M.; Poliakoff, M.; Turner, J. J. Freezing out the fluxional behaviour of Fe(CO)5 and other metal carbonyls. J.
Am. Chem. Soc. 1976, 98, 5728-5729. (10) Jang, J. H.; Lee, J.G.; Lee, H.; Xie, Y.; Schaefer, H. F. III. Molecular Structures and Vibrational Frequencies of Iron Carbonyls: Fe(CO)5,
Fe2(CO)9, and Fe3(CO)12. J. Phys. Chem. A, 1998, 102, 5298-5304. (11) Cahoon, J. F.; Sawyer, K. R.; Schlegel, J. P.; Harris, C. B. Determining Transition-State Geometries in Liquids Using 2D-IR. Science, 2008,
319, 1820-1823. (12) Couzijn, E. P. A.; Slootweg, J. C.; Ehlers, A. W.; Lammertsma, K. J. Stereomutation of Pentavalent Compounds: Validating the Berry
Pseudorotation, Redressing Ugi’s Turnstile Rotation, and Revealing the Two- and Three-Arm Turnstiles. J. Am. Chem. Soc. 2010, 132, 18127-18140. (13) Jiang, Y.; Lee, T.; Rose-Petruck, G. Structure of Solvated Fe(CO)5: FTIR Measurements and Density Functional Theory Calculations. J. Phys.
Chem. A 2003, 107, 7524-7538. (14) Rose-Petruck (ref. 13) assigns the higher frequency bands to overtones, but we prefer the assignment to isotope bands, particularly because of
the excellent force field analysis. (15) Bor, G. Infrared Spectroscopy Studies on Metal Carbonyl Compounds, XII. 13CO Isotopic Studies with Iron Pentacarbonyl. Inorganica Chim.
Acta, 1969, 3, 191-195. (16) The DFT computed energy difference between D3h and C4v structures compares very well to benchmark calculations at the CCSD(T) level;
see the Supporting Information for details and data. (17) Hamm, P.; Zanni, M. Concepts and Methods of 2D Infrared Spectroscopy; Cambridge University Press: Cambridge, U.K., 2011. (18) Le Seur, A. L.; Horness, R. E.; Thielges, M. C. Applications of Two-Dimensional Infrared Spectroscopy. Analyst, 2015, 140, 4336-4349. (19) Balz, C. R.; McRobbie, P. L.; Anna, J. M.; Geva, E.; Kubarych, K. J. Two-Dimensional Infrared Spectroscopy of Metal Carbonyls. Acc. Chem.
Res. 2009, 42, 1395-1404. (20) Turner, J, J.; Bühl, M.; The Infrared Dynamics of Iron Diene Complexes. J. Phys. Chem. A 2018, 122, 3497-3505. (21) Rogers, M. T.; Woodbrey, J. C. A Proton Magnetic Resonance Study of Hindered Internal Rotation in Some N,N-Dimethylamides. J. Phys.
Chem. 1962, 66, 540-546. (22) Kim, Y. S.; Hochstrasser, R. M. Comparison of Linear and 2D IR Spectra in the Presence of Fast Exchange. J. Phys. Chem. B, 2006, 110,
8531-8534. (23) Grevels, F.-W.; Jacke, J.; Klotzbücher, W. E.; Krüger, C.; Seevogel, K.; Tsay, Y. H. Dynamic Processes on the IR Time Scale: Coalescence
of CO Stretching Vibrational Bands in [(4-Diene)Fe(CO)3] Complexes. Angew. Chem. Int. Ed. Engl. 1987, 26, 885-887. (24) Grevels, F.-W.; Jacke, J.; Seevogel, K. Dynamics of Metal Carbonyls on the Infrared Timescale: Coalescence of CO stretching Vibrational
Bands. J. Mol. Struct. 1988, 174, 107-112.
13
(25) Kruczynski, L.; Takats, J. Intramolecular Rearrangement in (-Diene)tricarbonyliron and -Ruthenium compounds: A Carbon-13 Nuclear Magnetic Resonance Study. Inorg. Chem. 1976, 15, 3140-3147.
(26) Grevels, F.-W.; Kerpen, K.; Klotzbücher, W. E.; McClung, R. E.; Russell G.; Viotte, M.; Schaffner, K. The Very Low Barrier of CO Site Exchange in Tricarbonyl(4-1,4-cylclooctadiene)iron: Picosecond Kinetics in Solution Investigated by Line Shape Simulation of the (CO) IR Bands and Complementary Evidence from the Course of 13CO Incorporation in a Low-Temperature Matrix. J. Am. Chem. Soc. 1998, 120, 10423-10433.
(27) Wood, K. A.; Strauss, H. L. Broadening and Shifts of Vibrational Bands Due to the Effect of Thermal Chemical Reactions. J. Phys. Chem.
1990, 94, 5677-5684. (28) MacPhail, R. A.; Strauss, H. L. Can the Bloch equations describe the vibrational spectra of a reacting molecule? J. Chem. Phys. 1985, 832,
1156-1166. (29) Strauss, H. L. Changes of the Carbonyl Stretching Spectra with Temperature. J. Am. Chem. Soc. 1992, 114, 905-907. (30) Zoerb, M. C.; Harris, C. B. A Simulation Program for Dynamic Infrared (IR) Spectra. J. Chem. Educ. 2013, 90, 506-507. (31) Fröbel, S.; Appel, S.; Ganter, C.; Gilch, P. Extracting Picosecond Time Constants from Steady-State Spectroscopy: A Physical Chemistry
Experiment. J. Chem. Educ. 2013, 90, 1082-1086. (32) Giordano, A. N.; Morton, S. M.; Jensen, L.; Lear, B. J. Direct Test of the Equivalency of Dynamic IR and Dynamic Raman Spectroscopies
As Techniques for Observing Ultrafast Molecular Dynamics. J. Phys. Chem. A, 2013, 117, 2067-2074. (33) Giordano, A. N.; Lear, B. J. Solvent versus Temperature Control over the Infrared Band Shape and Position in Fe(CO)3(4-Ligand) Complexes.
J. Phys. Chem. A, 2013, 117, 12313-12319. (34) Giordano, A. N.; Lear, B. J. Comparing the Energetic and Dynamic Contributions of Solvent to Very Low Barrier Isomerization Using
Dynamic Steady-State Vibrational Spectroscopy. J. Phys. Chem. A, 2015, 119, 3545-3555. (35) Formula to estimate the Voigt width taken from: Olivero, J. J.; Longbothum, R. L. Empirical fits to the Voigt line width: A brief review. J.
Quant. Spectrosc. Radiat. Transfer 1997, 17, 233–236. (36) Rose-Petruck and colleagues (ref. 13) also performed similar DFT calculations, but we have now traced the evolution of the CO stretching
vibrations along the reaction pathway to show the smooth shift of the bands. Note that the harmonic vibrational frequencies are not strictly defined for the intermediate structures as they are are not stationary. However, the gradients building up from this shift torsional motion are small, and the CO stretching vibrations are well-decoupled from such torsional twists.
(36) (a) Poliakoff, M.; Howdle, S. M.; Healy, M. A.; Whalley, J. M., Proceedings of SPIE-The International Society for Optical Engineering, International Symposium on Supercritical Fluids, Perrutz, M., ed., Soc. Fr. Chim. 1988, 967; (b) Howdle, S. M.; Poliakoff, M., J. Chem. Soc., Chem.
Commun. 1989, 1099; (c) Howdle, S. M.; Healy, M. A.; Poliakoff, M., J. Am. Chem. Soc. 1990, 112, 4804-4813; (d) Poliakoff, M.; Howdle, S. M.; Kazarian, S. G., Angew. Chem. Int. Ed. Eng. 1995, 34, 1275-1295; (e) Cooper, A. I.; Poliakoff, M., Chem. Phys. Lett. 1993, 212, 611-616; (f) Banister, J. A.; Cooper, A. I.; Howdle, S. M.; Jobling, M.; Poliakoff, M., Organometallics 1996, 15, 1804-1812; (g) Portius, P.; George, M. W., Comprehensive
Organometallic Chemistry III, Elsevier: Oxford 2007, ed. R. H. Crabtree and D. M. P. Mingos, pp. 263-278.


![Valence ionized states of iron pentacarbonyl and 5 ...1].pdfelectron spectroscopy Ryoichi Fukuda,1,2,3,a Masahiro Ehara,1,3 Hiroshi Nakatsuji,2,3 Naoki Kishimoto,4 and Koichi Ohno4,5](https://img.pdfslide.net/doc/110x75/5f26a92c041b4c627c6eb62b/valence-ionized-states-of-iron-pentacarbonyl-and-5-1pdf-electron-spectroscopy.jpg)