Embed Size (px)
Citation preview
STRUCTURE OF ADENO‐ASSOCIATED VIRUS‐2 IN COMPLEX WITH NEUTRALIZING MONOCLONAL
ANTIBODY A20
Dustin M. McCrawA, Jason K. O’DonnellB,†, Kenneth A. TaylorC, Scott M. StaggB,D and Michael S.
ChapmanA*
A Department of Biochemistry and Molecular Biology, School of Medicine, Oregon Health & Science
University, Portland, OR 97239‐3098, USA
B Institute of Molecular Biophysics, Florida State University, Tallahassee, FL 32306‐4380, USA
C Department of Biological Science, Florida State University, Tallahassee, FL 32306‐4295, USA.
D Department of Chemistry and Biochemistry, Florida State University, Tallahassee, FL 32306, USA
† Current address: Department of Infectious Diseases, University of Georgia, Athens, Georgia, USA
* Corresponding author. Department of Biochemistry and Molecular Biology, School of Medicine, Mail code L224;
Oregon Health & Science University, 3181 S.W. Sam Jackson Park Road, Portland, OR 97239‐3098, USA. Fax: +1 503
494 8393. E‐mail address: [email protected] (M.S. Chapman).
ABSTRACT
The use of adeno‐associated virus (AAV) as a gene therapy vector is limited by the host neutralizing
immune response. The cryo‐electron microscopy (EM) structure at 8.5 Å resolution is determined for a
complex of AAV‐2 with the Fab’ fragment of monoclonal antibody (MAb) A20, the most extensively
characterized AAV MAb. The binding footprint is determined through fitting the cryo‐EM reconstruction
with a homology model following sequencing of the variable domain, and provides a structural basis for
integrating diverse prior epitope mappings. The footprint extends from the previously implicated
plateau to the side of the spike, and into the conserved canyon, covering a larger area than anticipated.
Comparison with structures of binding and non‐binding serotypes indicates that recognition depends on
a combination of subtle serotype‐specific features. Separation of the neutralizing epitope from the
heparan sulfate cell attachment site encourages attempts to develop immune‐resistant vectors that can
still bind to target cells.
KEYWORDS
Adeno‐associated virus; Antibody; A20, Epitope; Fab’; Gene therapy; Monoclonal
ABBREVIATIONS AND SYMBOLS
AAV – adeno associated Virus; CPV – canine parvovirus; CTF – contrast transfer function; EM – electron
microscopy; FPV – feline panleukopenia virus; HSPG – heparan sulfate proteoglycan; MVM – minute
virus of mouse; mAb – monoclonal antibody; NCS – non crystallographic symmetry; PCR – polymerase
chain reaction; rAAV – recombinant AAV; RMS(D) – root mean square (deviation); VP – viral protein; VR
– variable region.
INTRODUCTION
Gene therapy involves the delivery to cells of DNA designed to alleviate disease of genetic nature or
predisposition, DNA that commonly encodes a functional replacement for a mutated gene. AAV has
become a leading candidate vector for gene therapy because it is non‐pathogenic, induces little
inflammatory response, integrates site‐specifically into chromosome 19, infects dividing and non‐
dividing cells, has wide cell tropism, and is producible in large quantity (Carter et al., 2008). AAV’s main
disadvantages include a limited gene payload of 5kb (Dong et al., 1996) and seropositivity of 35‐80% of
the U.S. population to AAV‐2 (Calcedo et al., 2009) (vide infra). Current and recent clinical trials using
AAV vectors are targeting hemophilia B, prostate and melanoma cancers, Canavan disease, Alzheimer’s,
Parkinson’s, muscular dystrophy, rheumatoid arthritis and HIV vaccines (Carter, 2005).
AAV is a non‐enveloped virus with a single‐stranded DNA genome surrounded by a protein capsid that is
composed of 60 protein subunits related by icosahedral symmetry (Xie et al., 2002). Three capsid
proteins; VP‐1, VP‐2, and VP‐3 are present in a ratio of 1:1:10, and have molecular weights of 87kD,
73kD, and 62kD, differing (only) in N‐terminal extensions of 137 residues (VP‐1) and 64 residues (VP‐2)
relative to VP‐3 (Agbandje‐McKenna and Kleinschmidt, 2011). It is not clear whether VP‐1 & 2 substitute
for VP‐3 at specific locations in the otherwise 60‐fold symmetric capsid.
Immune responses to AAV are mild and non‐inflammatory, significantly reducing the possibility of
complications during treatment (Bueler, 1999; Chirmule et al., 1999). However, immune response still
presents a significant barrier to efficient delivery of the vector during initial treatment, as neutralizing
antibodies have been found in up to 60% of the population (Blacklow et al., 1968; Boutin et al., 2010;
Calcedo et al., 2009; Chirmule et al., 1999; Moskalenko et al., 2000). Clinical trials involving
experimental cystic fibrosis and hemophilia treatments required re‐administration of therapies (Flotte
and Carter, 1998; Kay et al., 2000). As only ~10% of progenitor cells below the lung epithelium are
transduced, transgene expression falls over 6 months as surface cells are turned over (Carter and Flotte,
1996). Exposure to natural AAV or vectors in animals and humans results in development of neutralizing
antibodies (Halbert et al., 2000; Moskalenko et al., 2000; Peden et al., 2004; Xiao et al., 1999). This can
decrease the efficiency of transgene expression upon subsequent administration(s) of vectors of the
same serotype (Davidoff et al., 2005; Manno et al., 2006; Wang et al., 2011; Wang et al., 2010). Cellular
immune response is largely directed against the viral capsid, while immune response to the transgene
product is rare (Brockstedt et al., 1999; Chirmule et al., 2000; Halbert et al., 1997; Hernandez et al.,
1999; Manning et al., 1998). Therefore, it is widely thought that the engineering of antigenic variant
vectors will have substantial impact in the development of efficient gene therapy treatments (Flotte,
2005; Peden et al., 2004; Xiao et al., 1997).
A20 is a monoclonal antibody which neutralizes AAV‐2 and AAV‐3B subsequent to primary receptor
binding (Wobus et al., 2000). It does not bind to the other predominant serotypes 1, 4, 5, 6, 8 and 9
(Murphy et al., 2008; Wobus et al., 2000; Wu et al., 2006; Xie et al., 2011). It is the most widely studied
monoclonal antibody against AAV‐2, due in part to its ability to bind only to fully assembled capsid and
not to unassembled capsid proteins (Moskalenko et al., 2000; Wistuba et al., 1995; Wobus et al., 2000).
It has been suggested that there are at least three neutralizing immunogenic sites on the capsid of AAV‐
2 (Lochrie et al., 2006), therefore it is unlikely that mutations solely within the A20 footprint will yield a
capsid that is completely distinct antigenically. However, two mutations which inhibit A20
neutralization also confer resistance to polyclonal neutralization, suggesting that A20 binding might
model neutralization at a dominant epitope (Lochrie et al., 2006). There have been multiple attempts to
locate the A20 epitope using various techniques, including PEPSCAN, peptide competition, peptide
insertions, and both site‐directed and scanning mutagenesis (Girod et al., 1999; Lochrie et al., 2006;
Moskalenko et al., 2000; Shi et al., 2001; Wobus et al., 2000; Wu et al., 2000). Lochrie et al. (2006) have
drawn attention to inconsistencies between some of the experimental epitope mappings, and between
some of the proposed immunogenic sites and the subsequent AAV‐2 atomic structure (Xie et al., 2002),
noting that inaccuracies result from known limitations of standard mehods (Van Regenmortel, 1992).
There has long been an interest in resolving these questions through direct visualization of an AAV‐
2/A20 complex (Lochrie et al., 2006).
We present here a cryo‐EM reconstruction of AAV‐2 in complex with A20 monoclonal Fab’ antibody at a
resolution of 8.5 Å. The antibody‐binding footprint of AAV‐2 has been determined from the previously
determined crystal structure of AAV‐2 by fitting a homology model of A20 Fab’ into the experimental
density of the complex. To our knowledge, this is the first structure of an AAV‐antibody complex. The
binding interface is compared with the corresponding surfaces of closely related viruses for insights into
the characteristics of serotypes that might determine whether or not a virus is recognized by A20.
RESULTS AND DISCUSSION
Use of Fab’ fragments
EM imaging takes advantage of the 60‐fold icosahedral symmetry, for which it was important to achieve
near saturated binding of equivalent binding sites on the virus. At the required stoichiometries,
attempts to image the complex of AAV‐2 with intact purified MAb A20 were foiled by aggregation,
either when virus and antibody were pre‐mixed in solution, or when antibody was added to virus pre‐
loaded onto EM grids. With papain‐digested Fab fragments, prepared the conventional way, neither
unstained or negatively stained EM revealed fragments bound to the AAV surface. Even large excesses
of Fab failed to compete with intact Mab in dot‐blot assays using biotinylated Mab A20. These data
suggested that the papain‐digested fragments were not stable in a native fold. By contrast, pepsin‐
digested Fab’ fragments competed with MAb in dot‐blot assays, and could be seen decorating the
surface of AAV‐2 in negatively stained EM images.
Electron microscopy reconstruction
The complex of AAV‐2 with Fab’ fragments of neutralizing monoclonal antibody A20 (Wistuba et al.,
1995) was visualized through cryo‐EM and reconstructed to a resolution of 8.5 Å (FSC0.5) (Figure 1).
11,898 particles from 1066 images were combined in a 3‐D reconstruction. Class averages of the
complex resolved the variable and constant Fab’ domains, with the presumptive variable domain, bound
to the capsid surface, better defined than the constant domain (Supplementary Figure 1). The EM
reconstruction clearly shows the distinctive features of AAV, previously seen in the uncomplexed virus
(O'Donnell et al., 2009; Xie et al., 2002), namely the three‐fold peaks, the 5‐fold cylinder, 2‐fold valley,
canyon, and plateau (Figure 2). All of the differences in the capsid density between the complex and
native forms could be attributed to differing resolution, i.e. there is no evidence of large scale antibody‐
induced conformational change in the virus.
Homology modeling
A20 is a murine Ig3 antibody whose sequence and 3‐D structure have not previously been reported.
Using sequences determined here for the variable regions of light and heavy chains (Table 1), Modeller
(Eswar et al., 2006) was used to create a homology model of the antibody’s variable region. The
structure of the complementarity determining regions (CDRs) depends on loop refinement, sometimes a
challenging step, so the homology model was checked against the database of CDR conformation based
on > 300 antibody structures (North et al., 2011). CDR conformers were used if their database
frequency among those with A20‐matching sequence motifs exceeded 5% (North et al., 2011).
Excluding two conformations of CDR H3 with 5 and 11 Cα outside the A20 density respectively, the
frequency‐weighted RMS Cα distance between the A20 homology CDRs and matching database
conformers was 0.7 Å. Five of the 6 CDRs were in excellent agreement (RMS Cα = 0.4 Å), with greater
uncertainty in H3 (RMS Cα = 1.5 Å). In principle, the homology model, built to fit the cryo‐EM density
(Eswar et al., 2006), should be superior to the un‐optimized density‐independent cluster structures, and
the discrepancy between them provides an upper‐limit estimate of the homology model backbone
error.
Analysis of the 3‐D reconstruction
Initial rigid group refinement using RSRef (Chapman, 1995) relieved strain in the inter‐molecular van der
Waals energy (by ~20%) with little change in the quality of the fit (CC = 0.775). (Correlation coefficients
are calculated for voxels of the map within 10 Å of any Fab’ or virus atom.) Least‐squares fitting of a
Butterworth low‐pass filter to the model density lowered the residual difference with the experimental
density by 1%, and suggested that the effective resolution of modeling was slightly lower (10.6 Å) than
would be expected of the FSC0.5 (8.5 Å), noting that the former reflects the limitations of both
experiment and modeling. Splitting the Fab’ into variable and constant domains led to only a small
improvement in correlation (0.778 to 0.781), but a 40% improvement in intra‐protomer van der Waals
energy as strain was released. Occupancy of the FAb’ refined robustly to 1.0, indicating saturated
binding. Refinement of isotropic group atomic displacement parameters (ADP, “B‐factors”) showed that
the variable domain was indistinguishable from the capsid protein (<B> = 23.5 Ų), but the more distal
constant domain had an optimal B of ~ 300 Ų. These correspond to rms harmonic displacements of U =
0.3 Å and U = 2 Å for the variable and constant domains respectively. Thus, the variable domain can be
considered tightly bound with displacement parameters that reflect the experimental resolution. By
contrast, constant domain displacements of 2 Å, and perceptibly more diffuse EM density, are
consistent with flexibility at the hinge. A final round of positional refinement converged at CC = 0.787
(Figure 2). From start to end of this refinement the rms coordinate change was 0.8 Å.
Binding site
With virus‐Fab complexes, it is usual to analyze the interface indirectly, using a model fit to the Fab
density, because the constraints of fitting a known fold, like the imposition of stereochemical restraints
in crystallographic refinement, can support analysis beyond the nominal experimental resolution
(Rossmann, 2000). It does introduce the errors of Fab homology modeling, which are modest for the
backbone (see above) and depend mostly on uncertainty in choice of side‐chain rotamers. It therefore
limits analysis to amino acid level, which is nevertheless a potential improvement upon the 8.5 Å
primary data. It was cross‐checked in two ways (Table S1). A model‐independent footprint was
determined by tracing saddle‐point vectors between the virus and Fab densities, contoured to
correspond to either the solvent excluded or solvent accessible volumes (Gerstein et al., 2001).
Footprints from the solvent‐excluded density and homology model are similar (Figure 3), sharing 12 of
16 amino acids, and only 2 homology model contacts fall outside the footprint density contoured to
approximate the solvent accessible surface. The impact of homology modeling errors was also assessed
by comparison with an alternative model (see above), consisting of spliced loops from Dunbrack’s CDR
database (North et al., 2011) with matching sequence motifs. 80% of the contact residues were
identical. In summary, of 16 footprint residues implicated by the homology model, 12 are robustly
implicated by all methods, two are doubtful (Ser658 and Thr660) lying outside the density footprint, and a
total of 7 additional residues on the periphery are suggested as possibilities by one or more of the
alternative approaches. Discussion will be framed around the core consensus footprint, except as
explicitly noted.
Residues implicated in the footprint are listed in Table 2 and Table S1 and illustrated in Figure 3. The
footprint is comprised of multiple peptides contributed by three different symmetry‐related subunits,
explaining why MAb A20 is specific for assembled capsids (Wobus et al., 2000). It encompasses regions
of diverse sequence on the plateau and side of the spike, but also nearly as many in the more conserved
canyon region. The more exposed parts of the footprint contain residues from 4 of 9 “variable regions”
(VR) previously noted to have the highest sequence diversity among AAVs (Agbandje‐McKenna and
Chapman, 2006; Govindasamy et al., 2006). Earlier difficulties in linear epitope mapping are explained
by the finding that 6 distinct segments of polypeptide chain contribute to the footprint; mAb A20 binds
to a conformational epitope defined by protein tertiary structure, and not a simple linear sequence of
amino acids.
It has been reported that human rhinovirus is neutralized by bivalent antibody attachment in some
cases (Hewat and Blaas, 1996; Rossmann et al., 1985). For bivalent attachment adjacent Fab C‐termini
need to be located within 25‐29 Å of each other (Hewat and Blaas, 1996; Hewat et al., 1998; Thouvenin
et al., 1997). For the A20 homology model, the closest symmetry‐related C‐terminal ends of A20 Fab’
are 47 Å apart. The resolution and distinctive features of the reconstruction leave little ambiguity in the
orientation of the Fab’, with the C‐termini of the heavy chain Fab’ fragments pointing outwards away
from their nearest neighbor. Bivalent attachment of an intact antibody would require implausible levels
of distortion at the elbow (relative to the observed configuration), and displacements that would be 10‐
fold greater than any disorder implied in the constant domain B‐factors. Thus, although symmetry‐
related antibody footprints come within 12 Å of each other, the structure is compatible with only
monovalent attachment.
MAb A20 neutralizes at a step subsequent to cellular attachment (Wobus et al., 2000). AAV enters cells
endosomally, after initial attachment to a heparan sulfate proteoglycan (HSPG) (Summerford and
Samulski, 1998), and subsequent binding to one of several possible protein co‐receptors (Agbandje‐
McKenna and Kleinschmidt, 2011). The HSPG binding footprint has recently been mapped by electron
microscopy (O'Donnell et al., 2009). Co‐receptor footprints are currently unknown. (A site suggested by
mutations affecting transduction but not heparin‐binding (Lochrie et al., 2006) actually fell within the
HSPG footprint (O'Donnell et al., 2009), so the sensitivity of heparin binding assays may not support
such specific designations.) Here, we see that the MAb A20 and heparin binding footprints do not
overlap. This is consistent with the earlier finding that A20 does not inhibit cellular attachment (Wobus
et al., 2000). It remains to be seen whether A20’s neutralization results from interference with co‐
receptor mediated entry, or conceivably some later step. A20 occludes considerably more of the surface
than the footprint residues making direct contact and thus could affect other interactions essential to
AAV’s life cycle. A20’s variable domain extends deep into the canyon and is nestled between the 5‐fold
cylinder and the 3‐fold spikes. Although none of the residues of the cylinder and only two of the spike
make direct contact, the gap between virus and antibody is narrow enough here to shield additional
residues from interacting with macromolecules that might be essential to AAV’s life cycle.
Comparison with autonomous parvoviruses
There are not yet other Dependovirus‐antibody complexes with which to compare, but there are several
cryo‐EM structures from the autonomous parvoviruses of the sister genus Parvovirus. The greatest
similarities are with antibodies that bind to epitope B of the closely related pair, canine parvovirus (CPV)
and feline panleukopenia virus (FPV) (Hafenstein et al., 2009; Wikoff et al., 1994) (Figure S1). The AAV‐2
A20 binding site therefore contrasts with the binding site of MAb B7 of minute virus of mouse (MVM)
which is directly above the 3‐fold axis of symmetry (Kaufmann et al., 2007). The surface topology of the
autonomous viruses at the B7 site differs from AAV with loops from adjacent subunits coming together
to form more of a single elevated “massif”. AAV has 3 distinct protrusions, between which are valleys
that meet at the 3‐fold, so the B7 site is less accessible. However, some common themes are emerging.
None of the complexes, including AAV‐2/A20, are compatible with bivalent attachment, and several of
the binding sites: MVM B7, CPV/FPV B‐site and AAV2 A20, are at interfaces where loops from
neighboring subunits come together to define the viral structure.
Cryo‐EM‐defined footprints for six CPV/FPV MAbs overlap at site “B”, comprised mostly of loop 3, a
region implicated by mutagenesis to be antigenic (Hafenstein et al., 2009; Wikoff et al., 1994). CPV
residues 298 to 302 superimpose over the AAV‐2 A20 footprint if aligned by icosahedral symmetry. The
B site and VR1 of the AAV‐2 A20 footprint are located on the plateaus of their respective viral surfaces.
In CPV/FPV, bound antibodies overlap with the binding site of the transferrin receptor, blocking both
viral attachment and subsequent entry steps (Hafenstein et al., 2007), but the steps of AAV entry and
mechanisms of A20 neutralization are not as well characterized. The considerable similarities appear to
result from convergent evolution, because AAV’s VR1 does not correspond in primary structure with
loop 3 of CPV/FPV. VR1 is in the loop between β‐strands B and C, which in CPV/FPV is pushed up from
the plateau as part of the 3‐fold massif, and comprises epitope A, to which a distinct set of 3 MAbs bind
(Hafenstein et al., 2009). Paradoxically, epitope B (on the plateau of CPV and FPV) is formed by residues
from the loop between strands G and H whose equivalents are at the exposed tip of the 3‐fold
protrusions in AAV. In the autonomous viruses, the plateau extends further out from the 3‐fold axis,
and the footprints of B‐site antibodies all fall within the bounds of the plateau. With AAV‐2, the
topography is more varied, and for the first time we see an Fab binding site extend over the edge of the
plateau into a more prominent and less exposed canyon.
Epitope
As the first AAV neutralizing monoclonal antibody (Wobus et al., 2000), MAb A20 has been the subject
of repeated epitope mappings using multiple approaches (vide infra). The AAV‐2 crystal structure (Xie et
al., 2002) showed that not all regions implicated by peptide scanning (Moskalenko et al., 2000; Wobus
et al., 2000) could fall within a typical antibody footprint, or, indeed were near the outer surface of the
virus. Thus, structure has already helped integrate the molecular data, complementing scanning
approaches and their known limitations (Van Regenmortel, 1992). Visualization of the A20‐AAV2
binding interface provides an additional perspective. Exact consistency with molecular approaches
should not be expected, due to ambiguities in each approach, including the potential for wider
conformational change in escape mutants, and limited precision in structural studies at 8.5 Å resolution
(see above). Nevertheless, integration of a physical epitope from EM visualization with the functional
molecular approaches can provide a more robust understanding of immunogenicity.
There has been wide variation in surface sites implicated in A20 binding, but the plateau has been
implicated more often than other regions. Single residue substitutions at 64 surface‐exposed sites
revealed a cluster that affected A20 binding or neutralization: Q263, S264, S384, Q385 and V708
(Lochrie et al., 2006). These are all within the EM footprint, and are joined in close proximity by the sites
of peptide insertions after S261, A266, N244 and S247, the first three of which inhibited A20 binding
(Girod et al., 1999; Wu et al., 2000). Thus, from this molecular data and our structure, a consistent
picture emerges that an important part of the A20 epitope is the plateau where the VR‐I and VR‐III loops
from one subunit and VR‐IX from a neighbor pack together.
The EM reconstruction shows the A20‐AAV2 binding surface extending into the canyon, a region that
was not tested by Lochrie et al. (2006) or other studies. To the EM footprint are added S261, S262 and
N717 on the edge of the plateau, K258 on the wall, then N253, N254, T659 and possibly S658 and T660
in the canyon. As in the complex of human rhinovirus (HRV) 14 with Fab17‐1A (Smith et al., 1996), the
CDRs of MAb A20 penetrate a less exposed, more conserved region of the surface, although in AAV, the
region has not yet been associated with any viral function. Extending the binding site into the canyon
approximately doubles the size of the footprint implicated by Lochrie’s cluster of plateau mutants.
The core residues of the footprint are implicated both in model‐based calculation of contacts, and in
projections of experimental Fab’ density onto AAV‐2 that are not dependent on modeling the Fab’. A
few residues on the periphery are less certain, because their designation is sensitive to the choice of
solvent probe or density contour level. E548 and K556 come within 4 Å of modeled A20 atoms, but are
connected by density only at lower contours corresponding to the solvent accessible surface. Mutation
of E548 has been seen to yield a small 3‐fold resistance to A20 neutralization (Lochrie et al., 2006) or,
like K556 (ibid), to have no impact upon binding (Wu et al., 2000). It seems likely that the observed
proximity of the Fab’ to two residues on the side of an adjacent AAV‐2 spike is incidental and not critical
to the binding interactions. Indeed, the spike residues are apparently not part of the epitope, because
the contact would be with conserved framework residues towards the side of the immunoglobulin
domain, not CDR loop residues usually associated with antigen recognition.
Distinctiveness of AAV‐2 and AAV‐3B
AAV‐2 and AAV‐3B are the only serotypes which are bound strongly by A20. A search was made for
distinguishing characteristics of the footprint that are conserved between AAV‐2 & AAV‐3B, but distinct
for non‐bound serotypes. As at 8.5 Å resolution, side chain conformation is not defined for the Fab’,
comparison of atomic interactions was not possible, but high resolution structures for AAV serotypes
supported comparison of viral surface properties within the footprint region.
In sequence, AAV‐3B differs from AAV‐2 only at three binding site residues, all on the edge of the A20
footprint: S658 is replaced by P659 in the canyon, while E548 and K556 of AAV‐2 are replaced by T549
and N557 in AAV‐3B on the side of the spike (Figure 3). Lochrie et al. (2006) found only modest impact
on A20‐binding of even non‐conservative mutations at E548 and K556. The contact at E548/K556 in the
AAV‐2 complex is superficial, relative to other interactions. Density bridges only when contoured to
enclose the solvent accessible, but not the van der Waals surface (Table S1). Furthermore the contact is
made by a conserved (non CDR) part of A20, all suggesting that the contact might be incidental. Thus,
the core of the footprint is conserved between AAV‐2 and ‐3B, and differences are restricted to
peripheral residues that have at most modest impact on binding (Lochrie et al., 2006).
Most of the differences in the surface topology of other serotypes lie outside the binding site. Within
the canyon, AAV‐2, ‐3B, ‐4, ‐6, and ‐8 are very similar. There are subtle differences on the plateau, but
these are not obviously correlated to A20 binding. For example, AAV‐6 (non‐binding) is more similar to
AAV‐3B (binding) than is AAV‐2 (binding). In the footprint region, there are not systematic differences
in amino acid polarity or electrostatic charge that would clearly disrupt binding. Local changes are
exemplified by a threonine insertion after S264 and/or a Q263A substitution in AAV‐6, ‐1 and an AAV‐2/‐
1 chimeric construct (Hauck and Xiao, 2003). These would not create large steric conflicts with A20
(Figure 3A & C). Analysis of subtle changes in interactions, that are presumably important, requires
greater precision in A20 side chain structure than available in an 8.5 Å homology‐based model.
For future efforts to engineer gene therapy vectors with reduced susceptibility to immune
neutralization, the reported structure is encouraging. The footprint is larger than previously anticipated,
providing a wider choice of residues to mutate for immune neutralization escape. Relatively modest
changes can affect antibody binding, and there is no overlap for binding sites of receptor HSPG and this
model antibody, increasing the prospects for engineering the vector without disrupting cell attachment.
METHODS
Preparation of AAV2 and A20 Fab’
AAV2 was produced as described previously (Xie et al., 2004). Stocks of hybridoma cells for A20 were
generously provided by Jürgen Kleinschmidt. They were grown by seeding 25x106 cells in 15mL of 90%
RPMI media (Sigma‐Aldrich) and 10% FetalClone 1 serum (Hyclone) in a CELLine CL 1000 bioreactor
(Integra). The bioreactor was maintained using 98% RPMI and 10% FetalClone 1 serum. Antibodies
were harvested after 1 week. Cells were pelleted out by centrifugation at 70x g for 5 min and the
supernatant was passed through a 0.45 μm filter. Secreted antibodies were purified with a HiTrap
protein G affinity column (GE Healthcare).
The antibody solution was dialyzed into 20 mM sodium acetate (pH 4.5) and digested with immobilized
pepsin (Thermo Scientific) as per the manufacturer’s protocol to yield F(ab2)’. The F(ab2)’ solution was
dialyzed overnight into 20 mM sodium phosphate (pH 7.2). Undigested IgG and Fc fragments were
removed using a HiTrap protein A affinity column (GE Healthcare). Flow‐through fractions containing
F(ab2)’ were dialyzed into 150mM PBS and 5 mM EDTA (pH 7.2) using a Float‐A‐Lyzer G2 (Spectra/Por)
with a molecular weight 50 kD weight cutoff.
The F(ab2)’ solution was reduced with Mercaptoethylamine‐HCl (2‐MEA; Thermo Scientific) according to
the manufacturer’s protocol. The resultant crude Fab’ solution was immediately purified by size
exclusion chromatography with Superdex 200 (GE Healthcare) using a running buffer of 150 mM sodium
chloride, 50 mM sodium phosphate, and 5 mM EDTA (pH 7.2). Gel electrophoresis with silver staining
was used to assess purity.
Preparation and cryo‐EM of AAV2‐A20 Fab’ complex
AAV‐2 in 100 mM HEPES, 50 mM magnesium chloride, and 5% glycerol (pH 7.2) was incubated with a 4‐
fold excess of purified Fab’ (240 Fab’ fragments per 60‐fold symmetric virus) for 30 min at 25 °C. Small
aliquots of this mixture were applied to holey carbon grids (C‐flat). The sample was then flash‐frozen by
plunging using a Vitrobot (FEI) at 100% humidity and 4C and using a 2 sec blot time. 1503 images of the
specimen were collected at 37,000x magnification and 120 keV on a FEI Titan Krios equipped with a
Gatan Ultrascan 4k x 4k CCD camera using the Leginon system (Suloway et al., 2005). The final pixel size
was 2.225 Å.
Reconstruction of AAV2‐A20 Fab’ complex
Appion (Lander et al., 2009) was used for particle picking, CTF estimation, and stack making. Initial
particle selection was performed using the difference of Gaussians method (Voss et al., 2009) and
particles over carbon were manually deselected. CTF estimation was performed with the ACE
(Automated CTF Estimation) software package (Mallick et al., 2005). Images with an ACE CTF estimation
confidence value of less than 0.7 were removed from the data set after which a 35,543 particle stack
was made with the phases flipped for individual particles according to their ACE‐estimated defocus.
EMAN (Tang et al., 2007) was used for subsequent refinement and reconstruction. Refinement first
yielded a reconstruction with a resolution of 9.8 Å by the FSC0.5 criterion. Inspection of the class
averages from the refinement suggested conformational heterogeneity in the Fabs. Subclassification
was employed to test for and, as necessary, remove heterogeneity. Multivariate statistical analysis was
performed on each class of particle projection following each iteration of refinement. Correspondence
analysis was performed with hierarchical ascendant classification on aligned particles in a given
orientation. This generated 2‐6 subclasses for each projection. Only the subclass correlating best with
the projection of the current model was included in the reconstruction for that iteration. After
refinement, this procedure resulted in an 8.5 Å resolution (FSC0.5) final reconstruction based on 11,898
particles. The whole refinement was repeated using two different starting models: a prior
reconstruction of the native virus (O'Donnell et al., 2009); and a model created de novo using the EMAN
STARTICOS program. These independent refinements converged on the same solution.
Scaling
Correction of the relative magnification proved to be critical. After data collection, it was discovered
that the relevant magnification calibration parameter had not been set appropriately in this first
structure determined using a newly commissioned microscope. Thus, such a large correction to the
relative magnification (1.075) had not been anticipated. Three approaches yielded the same value for
the relative magnification. Firstly, a search was made for the best agreement between the density of
the complex and an earlier reconstruction for the native virus (O'Donnell et al., 2009), masking out Fab’
density through use of radial cut‐offs of 72 & 120 Å. Secondly, a search was made for the highest
correlation between the experimental map of the complex, and the local density calculated from the
AAV‐2 (uncomplexed) crystallographic structure (Chapman, 1995; Xie et al., 2002). Finally, the
magnification was least‐squares refined by optimizing the agreement of the full atomic model of the
complex (see below) and the experimental EM density. Correction of the magnification had a dramatic
impact on the flatness of difference maps, and the model‐map correlation, improving from 0.2 to 0.7.
Creating a homology model
Initially, the Fab’ was modeled using an arbitrarily selected antibody from the protein data bank (PDBid
1A6T), without reference to the actual sequence of A20. This was sufficient to uniquely define the
approximate orientation of the Fab’ (Figure S3), but a more accurate binding footprint would require a
homology model with CDRs of length and conformation appropriate to the sequence of MAb A20. RNA
was extracted and cloned from snap‐frozen hybridoma cells for PCR amplification using degenerate VH
and VL primers and bidirectional cDNA sequencing of the A20 variable domains (Molecular Cloning
Laboratories). Modeller (Eswar et al., 2006) was used to create a homology model of the antibody’s
variable region. 19 structures from the protein databank with a sequence similarity of 58% or greater
were used as templates. 1000 models were produced by aligning the templates to the A20 sequence.
Of these, the top 100 models had DOPE scores ranging from ‐12337 to ‐12149 and were fitted into the
density by Modeller. Of these, the top 10 models had a correlation coefficient of 0.85 ‐ 0.86. The model
with the highest combined DOPE score and correlation coefficient was used as the variable domain in an
initial homology model for A20. To model the constant region, of known IgG Fab crystal structures,
mouse monoclonal antibody 184.1 (PDBid 1osp (Li et al., 1997)) was chosen on the basis of the highest
sequence identity.
CDR database models
Alternative models for the variable domain were generated from the Dunbrack database of CDR loop
conformations compiled from > 300 non‐redundant high resolution crystal structures (North et al.,
2011). For CDRs of a given length, conformations fall into a handful of clusters with sequence
fingerprints that have been characterized. For A20 CDRs L1 – L3 and H1 ‐ H2, there was a unique
sequence match to a database cluster, and for H3, four were possible, two of which could be eliminated
later as segments of five or eleven amino acids extended outside the A20 electron density. Median
structures coming from the best database cluster for each CDR were spliced together into a single A20
model after superimposing their constant regions. The process was repeated for the alternate H3
conformation. The sequences were then changed to that of A20, and, where necessary, new side chain
rotamers were selected to resolve clashes or bring side chains into density. No additional optimization
of these database‐derived models was performed. They were used to assess uncertainties in the
homology model and in the model‐derived footprint.
Docking & Refinement of the homology model
The FAb A20 homology model was fit approximately into a difference map calculated by subtracting a
native cryo‐EM reconstruction from that of the complex (Figure S3). Initial rigid‐group conjugate
gradient refinement was performed with the Flex‐EM option of Modeller‐9 (Topf et al., 2008). This
revealed two locations where the automatic homology modeling could be improved, residues 209‐210
that overlapped with residues 263‐264 of AAV‐2, and Lys69 which extended beyond the difference map
and clashed with AAV2 325. Residues 205‐216 were remodeled using another high‐scoring homolog
(model 554) that did not conflict, and an alternate favored rotamer (Dunbrack, 2002) was selected for
Lys69.
The structure was further optimized using a new implementation of the real‐space refinement RSRef
(Chapman, 1995), embedded in CNS (Brünger et al., 1998). From this point, instead of using a difference
map, the Fab’ model was refined in the presence of AAV‐2 into the reconstruction of the complex.
Additional refined parameters included the relative EM magnification, and the “soft” resolution limit of
a 5th order Butterworth low‐pass filter (Frank et al., 1996) applied when calculating the density of the
atomic model. The experimental map had been corrected (sharpened) by application of the inverse
envelope function with EMB‐factor (Fernandez et al., 2008). The low‐pass filter allowed the model
density to replicate the resulting smooth, but non‐Gaussian attenuation near the resolution limit. In
refinement, the squared difference between observed and calculated electron density levels was
minimized using all map grid points within 10 Å of any model atom, and considering density
contributions from atoms up to 25 Å away. Icosahedral symmetry was imposed as a constraint on both
Fab’ A20 and the AAV‐2 capsid protein. The virus structure was fixed, aligned to the icosahedral
symmetry of the map. The Fab’ was refined first as a single rigid group, optimizing a weighted (~20:1)
sum of the density residual and CNS van der Waals repulsion terms. The Fab’ was then split into variable
and constant domains for rigid‐group positional and group B‐factor refinement.
Modeling of the A20 structure led to a 0.8 Å clash at AAV‐2 Lys258. This was resolved by choosing a
different high frequency rotamer for Lys258. The closest remaining contact was 2.4 Å. No attempt was
made at the subtle adjustments needed to resolve contacts that were suboptimal by only ~ 0.5 Å given
the resolution of this study. The need for at most subtle adjustment of side chains is consistent with the
absence of features in the EM density indicative of significant conformational changes.
Density‐based footprint
AAV amino acids contacted by Fab A20 were identified as those with any atom within 4 Å of any
homology model atom. An alternative model‐independent identification was performed as follows:
Between density of the Fab’ and AAV‐2, a clear constriction at the periphery of the interface could be
used to demark an outline. The contour level of 2.2 σ was used, because it corresponded to the
calculated Fab’ solvent‐excluded volume in a map of the complex segmented in Chimera (Pettersen et
al., 2004). On the 2.2 σ contour of the non‐segmented map, the boundary between Fab’ and AAV‐2 was
outlined in 3D by connecting saddle points with markers placed interactively using Coot (Emsley et al.,
2010). The outline was projected onto the surface of the AAV‐2 model using Rivem (Xiao and Rossmann,
2006), identifying AAV‐2 amino acids whose surfaces were > 25% covered. A solvent‐accessible outline
was obtained by extending the markers outwards by the 1.4 Å radius of a solvent probe, and additional
potential contact regions were determined using the corresponding 1.1 σ contour level.
ACKNOWLEDGEMENTS
We acknowledge the Florida State University shared High‐Performance Computing facility and staff for
contributions to results presented in this paper. The research was supported by grants from the National
Institutes of Health (R01GM66875 & R01GM78538 to MSC), the Office of Naval Research
(N000141010082 to John Carruthers at Portland State University), and a grant partially supporting the
purchase of the microscope (S10‐RR025080 to KAT).
REFERENCES
Agbandje‐McKenna, M., and Chapman, M. S. (2006). Correlating structure with function in the viral capsid. In "Parvoviruses" (J. R. Kerr, S. F. Cotmore, M. E. Bloom, R. M. Linden, and C. R. Parrish, Eds.), pp. 124‐139. Hodder Arnold, Ltd., London.
Agbandje‐McKenna, M., and Kleinschmidt, J. (2011). AAV capsid structure and cell interactions. Methods Mol Biol 807, 47‐92.
Blacklow, N. R., Hoggan, M. D., and Rowe, W. P. (1968). Serologic evidence for human infection with adenovirus‐associated viruses. J Natl Cancer Inst 40(2), 319‐27.
Boutin, S., Monteilhet, V., Veron, P., Leborgne, C., Benveniste, O., Montus, M. F., and Masurier, C. (2010). Prevalence of serum IgG and neutralizing factors against adeno‐associated virus (AAV) types 1, 2, 5, 6, 8, and 9 in the healthy population: implications for gene therapy using AAV vectors. Hum Gene Ther 21(6), 704‐12.
Brockstedt, D. G., Podsakoff, G. M., Fong, L., Kurtzman, G., Mueller‐Ruchholtz, W., and Engleman, E. G. (1999). Induction of immunity to antigens expressed by recombinant adeno‐associated virus depends on the route of administration. Clin Immunol 92(1), 67‐75.
Brünger, A. T., Adams, P. D., Clore, G. M., DeLano, W. L., Gros, P., Grosse‐Kunstleve, R. W., Jiang, J.‐S., Kuszewski, J., Nilges, M., Pannu, N. S., Read, R. J., Rice, L. M., Simonson, T., and Warren, G. L. (1998). Crystallography and NMR system: A new software system for macromolecular structure determination. Acta Crystallographica D54, 905‐921.
Bueler, H. (1999). Adeno‐associated viral vectors for gene transfer and gene therapy. Biol Chem 380(6), 613‐22.
Calcedo, R., Vandenberghe, L. H., Gao, G., Lin, J., and Wilson, J. M. (2009). Worldwide epidemiology of neutralizing antibodies to adeno‐associated viruses. J Infect Dis 199(3), 381‐90.
Carter, B., and Flotte, T. (1996). Development of adeno‐associated virus vectors for gene therapy of cystic fibrosis. Current Topics in Microbiology and Immunology 218, 119‐144.
Carter, B. J. (2005). Adeno‐associated virus vectors in clinical trials. Hum Gene Ther 16(5), 541‐50. Carter, B. J., Burstein, H., and Peluso, R. W. (2008). Adeno‐associated Virus and AAV Vectors for Gene
delivery. In "Gene and cell therapy: therapeutic mechanisms and strategies" (N. S. Templeton, Ed.), pp. 115‐156. CRC Press, Boca Raton.
Chapman, M. S. (1995). Restrained Real‐Space Macromolecular Atomic Refinement using a New Resolution‐Dependent Electron Density Function. Acta Crystallographica A51, 69‐80.
Chirmule, N., Propert, K., Magosin, S., Qian, Y., Qian, R., and Wilson, J. (1999). Immune responses to adenovirus and adeno‐associated virus in humans. Gene Ther 6(9), 1574‐1583.
Chirmule, N., Xiao, W., Truneh, A., Schnell, M. A., Hughes, J. V., Zoltick, P., and Wilson, J. M. (2000). Humoral immunity to adeno‐associated virus type 2 vectors following administration to murine and nonhuman primate muscle. J Virol 74(5), 2420‐5.
Davidoff, A. M., Gray, J. T., Ng, C. Y., Zhang, Y., Zhou, J., Spence, Y., Bakar, Y., and Nathwani, A. C. (2005). Comparison of the ability of adeno‐associated viral vectors pseudotyped with serotype 2, 5, and 8 capsid proteins to mediate efficient transduction of the liver in murine and nonhuman primate models. Mol Ther 11(6), 875‐88.
Dong, J. Y., Fan, P. D., and Frizzell, R. A. (1996). Quantitative analysis of the packaging capacity of recombinant adeno‐associated virus. Human Gene Therapy 7(17), 2101‐2112.
Dunbrack, R. L., Jr. (2002). Rotamer libraries in the 21st century. Curr Opin Struct Biol 12(4), 431‐40. Emsley, P., Lohkamp, B., Scott, W. G., and Cowtan, K. (2010). Features and development of Coot. Acta
Crystallogr D Biol Crystallogr 66(Pt 4), 486‐501. Eswar, N., Eramian, D., Webb, B., Shen, M., and Sali, A. (2006). Protein Structure Modeling With
MODELLER. In "Current Protocols in Bioinformatics" (A. D. Baxevanis, L. D. Stein, G. D. Stormo, and J. R. Yates III, Eds.), Vol. Supplement 15, pp. 5.6.1‐5.6.30. John Wiley & Sons, Inc.
Fernandez, J. J., Luque, D., Caston, J. R., and Carrascosa, J. L. (2008). Sharpening high resolution information in single particle electron cryomicroscopy. J Struct Biol 164(1), 170‐5.
Flotte, T. R. (2005). Recent developments in recombinant AAV‐mediated gene therapy for lung diseases. Curr Gene Ther 5(3), 361‐6.
Flotte, T. R., and Carter, B. J. (1998). Adeno‐associated virus vectors for gene therapy of cystic fibrosis. Methods Enzymol 292, 717‐32.
Frank, J., Radermacher, M., Penczek, P., Zhu, J., Li, Y., Ladjadj, M., and Leith, A. (1996). SPIDER and WEB: processing and visualization of images in 3D electron microscopy and related fields. J Struct Biol 116(1), 190‐9.
Gerstein, M., Richards, F., Chapman, M. S., and Connolly, M. (2001). Protein surfaces and volumes: measurement and use. In "International Tables for Crystallography. Crystallography of Biological Molecules." (M. G. Rossmann, and E. Arnold, Eds.), Vol. F, pp. 531‐45 (Cpt. 22.1). Kluwer Academic Publishers, Dortrecht, Netherlands.
Girod, A., Ried, M., Wobus, C., Lahm, H., Leike, K., Kleinschmidt, J., Deleage, G., and Hallek, M. (1999). Genetic capsid modifications allow efficient re‐targeting of adeno‐ associated virus type 2. Nat Med 5(9), 1052‐1056.
Govindasamy, L., Padron, E., McKenna, R., Muzyczka, N., Kaludov, N., Chiorini, J. A., and Agbandje‐McKenna, M. (2006). Structurally mapping the diverse phenotype of adeno‐associated virus serotype 4. J Virol 80(23), 11556‐70.
Hafenstein, S., Bowman, V. D., Sun, T., Nelson, C. D., Palermo, L. M., Chipman, P. R., Battisti, A. J., Parrish, C. R., and Rossmann, M. G. (2009). Structural comparison of different antibodies interacting with parvovirus capsids. J Virol 83, 5556‐5566.
Hafenstein, S., Palermo, L. M., Kostyuchenko, V. A., Xiao, C., Morais, M. C., Nelson, C. D., Bowman, V. D., Battisti, A. J., Chipman, P. R., Parrish, C. R., and Rossmann, M. G. (2007). Asymmetric binding of transferrin receptor to parvovirus capsids. Proc Natl Acad Sci U S A 104(16), 6585‐9.
Halbert, C. L., Rutledge, E. A., Allen, J. M., Russell, D. W., and Miller, A. D. (2000). Repeat transduction in the mouse lung by using adeno‐associated virus vectors with different serotypes. J Virol 74(3), 1524‐32.
Halbert, C. L., Standaert, T. A., Aitken, M. L., Alexander, I. E., Russell, D. W., and Miller, A. D. (1997). Transduction by adeno‐associated virus vectors in the rabbit airway: efficiency, persistence, and readministration. J Virol 71(8), 5932‐41.
Hauck, B., and Xiao, W. (2003). Characterization of tissue tropism determinants of adeno‐associated virus type 1. J Virol 77(4), 2768‐74.
Hernandez, Y. J., Wang, J., Kearns, W. G., Loiler, S., Poirier, A., and Flotte, T. R. (1999). Latent adeno‐associated virus infection elicits humoral but not cell‐mediated immune responses in a nonhuman primate model. J Virol 73(10), 8549‐58.
Hewat, E. A., and Blaas, D. (1996). Structure of a neutralizing antibody bound bivalently to human rhinovirus 2. EMBO J 15(7), 1515‐23.
Hewat, E. A., Marlovits, T. C., and Blaas, D. (1998). Structure of a neutralizing antibody bound monovalently to human rhinovirus 2. J Virol 72(5), 4396‐402.
Kaufmann, B., Lopez‐Bueno, A., Mateu, M. G., Chipman, P. R., Nelson, C. D., Parrish, C. R., Almendral, J. M., and Rossmann, M. G. (2007). Minute virus of mice, a parvovirus, in complex with the Fab fragment of a neutralizing monoclonal antibody. J Virol 81(18), 9851‐8.
Kay, M. A., Manno, C. S., Ragni, M. V., Larson, P. J., Couto, L. B., McClelland, A., Glader, B., Chew, A. J., Tai, S. J., Herzog, R. W., Arruda, V., Johnson, F., Scallan, C., Skarsgard, E., Flake, A. W., and High, K. A. (2000). Evidence for gene transfer and expression of factor IX in haemophilia B patients treated with an AAV vector. Nat Genet 24(3), 257‐61.
Lander, G. C., Stagg, S. M., Voss, N. R., Cheng, A., Fellmann, D., Pulokas, J., Yoshioka, C., Irving, C., Mulder, A., Lau, P. W., Lyumkis, D., Potter, C. S., and Carragher, B. (2009). Appion: an integrated, database‐driven pipeline to facilitate EM image processing. J Struct Biol 166(1), 95‐102.
Li, H., Dunn, J. J., Luft, B. J., and Lawson, C. L. (1997). Crystal structure of Lyme disease antigen outer surface protein A complexed with an Fab. Proc Natl Acad Sci U S A 94(8), 3584‐9.
Lochrie, M. A., Tatsuno, G. P., Christie, B., McDonnell, J. W., Zhou, S., Surosky, R., Pierce, G. F., and Colosi, P. (2006). Mutations on the external surfaces of adeno‐associated virus type 2 capsids that affect transduction and neutralization. J Virol 80(2), 821‐34.
Mallick, S. P., Carragher, B., Potter, C. S., and Kriegman, D. J. (2005). ACE: automated CTF estimation. Ultramicroscopy 104(1), 8‐29.
Manning, W. C., Zhou, S., Bland, M. P., Escobedo, J. A., and Dwarki, V. (1998). Transient immunosuppression allows transgene expression following readministration of adeno‐associated viral vectors. Hum Gene Ther 9(4), 477‐85.
Manno, C. S., Pierce, G. F., Arruda, V. R., Glader, B., Ragni, M., Rasko, J. J., Ozelo, M. C., Hoots, K., Blatt, P., Konkle, B., Dake, M., Kaye, R., Razavi, M., Zajko, A., Zehnder, J., Rustagi, P. K., Nakai, H., Chew, A., Leonard, D., Wright, J. F., Lessard, R. R., Sommer, J. M., Tigges, M., Sabatino, D., Luk, A., Jiang, H., Mingozzi, F., Couto, L., Ertl, H. C., High, K. A., and Kay, M. A. (2006). Successful transduction of liver in hemophilia by AAV‐Factor IX and limitations imposed by the host immune response. Nat Med 12(3), 342‐7.
Moskalenko, M., Chen, L., van Roey, M., Donahue, B. A., Snyder, R. O., McArthur, J. G., and Patel, S. D. (2000). Epitope mapping of human anti‐adeno‐associated virus type 2 neutralizing antibodies: implications for gene therapy and virus structure. J Virol 74(4), 1761‐6.
Murphy, S. L., Bhagwat, A., Edmonson, S., Zhou, S., and High, K. A. (2008). High‐throughput Screening and Biophysical Interrogation of Hepatotropic AAV. Mol Ther 16(12), 1960‐1967.
North, B., Lehmann, A., and Dunbrack, R. L., Jr. (2011). A new clustering of antibody CDR loop conformations. J Mol Biol 406(2), 228‐56.
O'Donnell, J., Taylor, K. A., and Chapman, M. S. (2009). Adeno‐associated virus‐2 and its primary cellular receptor‐Cryo‐EM structure of a heparin complex. Virology 385, 434‐443.
Peden, C. S., Burger, C., Muzyczka, N., and Mandel, R. J. (2004). Circulating anti‐wild‐type adeno‐associated virus type 2 (AAV2) antibodies inhibit recombinant AAV2 (rAAV2)‐mediated, but not rAAV5‐mediated, gene transfer in the brain. J Virol 78(12), 6344‐59.
Pettersen, E. F., Goddard, T. D., Huang, C. C., Couch, G. S., Greenblatt, D. M., Meng, E. C., and Ferrin, T. E. (2004). UCSF Chimera‐‐a visualization system for exploratory research and analysis. J Comput Chem 25(13), 1605‐12.
Rossmann, M. G. (2000). Fitting atomic models into electron‐microscopy maps. Acta Crystallogr D Biol Crystallogr 56(Pt 10), 1341‐1349.
Rossmann, M. G., Arnold, E., Erickson, J. W., Frankenberger, E. A., Griffith, J. P., Hecht, H., Johnson, J. E., Kamer, G., Luo, M., Mosser, A., Rueckert, R., Sherry, B., and Vriend, G. (1985). Structure of human common cold virus and functional relationship to other picornaviruses. . Nature 317 145‐153
Shi, W., Arnold, G. S., and Bartlett, J. S. (2001). Insertional mutagenesis of the adeno‐associated virus type 2 (AAV2) capsid gene and generation of AAV2 vectors targeted to alternative cell‐surface receptors. Hum Gene Ther 12(14), 1697‐711.
Smith, T. J., Chase, E. S., Schmidt, T. J., Olson, N. H., and Baker, T. S. (1996). Neutralizing antibody to human rhinovirus 14 penetrates the receptor‐binding canyon. Nature 383(6598), 350‐4.
Suloway, C., Pulokas, J., Fellmann, D., Cheng, A., Guerra, F., Quispe, J., Stagg, S., Potter, C. S., and Carragher, B. (2005). Automated molecular microscopy: the new Leginon system. J Struct Biol 151(1), 41‐60.
Summerford, C., and Samulski, R. J. (1998). Membrane‐associated heparan sulfate proteoglycan is a receptor for adeno‐associated virus type 2 virions. J Virol 72(2), 1438‐45.
Tang, G., Peng, L., Baldwin, P. R., Mann, D. S., Jiang, W., Rees, I., and Ludtke, S. J. (2007). EMAN2: an extensible image processing suite for electron microscopy. J Struct Biol 157(1), 38‐46.
Thouvenin, E., Laurent, S., Madelaine, M. F., Rasschaert, D., Vautherot, J. F., and Hewat, E. A. (1997). Bivalent binding of a neutralising antibody to a calicivirus involves the torsional flexibility of the antibody hinge. J Mol Biol 270(2), 238‐46.
Topf, M., Lasker, K., Webb, B., Wolfson, H., Chiu, W., and Sali, A. (2008). Protein Structure Fitting and Refinement Guided by Cryo‐EM Density. Structure 16(2), 295‐307.
Van Regenmortel, M. H. V. (1992). "Structure of antigens." CRC Press, Boca Raton, Fla. Voss, N. R., Yoshioka, C. K., Radermacher, M., Potter, C. S., and Carragher, B. (2009). DoG Picker and
TiltPicker: software tools to facilitate particle selection in single particle electron microscopy. J Struct Biol 166(2), 205‐13.
Wang, L., Calcedo, R., Bell, P., Lin, J., Grant, R. L., Siegel, D. L., and Wilson, J. M. (2011). Impact of pre‐existing immunity on gene transfer to nonhuman primate liver with adeno‐associated virus 8 vectors. Hum Gene Ther 22(11), 1389‐401.
Wang, L., Calcedo, R., Wang, H., Bell, P., Grant, R., Vandenberghe, L. H., Sanmiguel, J., Morizono, H., Batshaw, M. L., and Wilson, J. M. (2010). The pleiotropic effects of natural AAV infections on liver‐directed gene transfer in macaques. Mol Ther 18(1), 126‐34.
Wikoff, W. R., Wang, G., Parrish, C. R., Cheng, R. H., Strassheim, M. L., Baker, T. S., and Rossmann, M. G. (1994). The structure of a neutralized virus: canine parvovirus complexed with neutralizing antibody fragment. Structure 2(7), 595‐607.
Wistuba, A., Weger, S., Kern, A., and Kleinschmidt, J. A. (1995). Intermediate of Adeno‐Associated Virus Type 2 Assembly: Identification of Soluble Complexes Containing Rep and Cap Proteins. Journal of Virology 69, 5311‐5319.
Wobus, C. E., Hugle‐Dorr, B., Girod, A., Petersen, G., Hallek, M., and Kleinschmidt, J. A. (2000). Monoclonal antibodies against the adeno‐associated virus type 2 (AAV‐2) capsid: epitope mapping and identification of capsid domains involved in AAV‐2‐cell interaction and neutralization of AAV‐2 infection. J Virol 74(19), 9281‐93.
Wu, P., Xiao, W., Conlon, T., Hughes, J., Agbandje‐McKenna, M., Ferkol, T., Flotte, T., and Muzyczka, N. (2000). Mutational analysis of the adeno‐associated virus type 2 (AAV2) capsid gene and construction of AAV2 vectors with altered tropism. J Virol 74(18), 8635‐47.
Wu, Z., Asokan, A., and Samulski, R. J. (2006). Adeno‐associated virus serotypes: vector toolkit for human gene therapy. Mol Ther 14(3), 316‐27.
Xiao, C., and Rossmann, M. G. (2006). Interpretation of electron density with stereographic roadmap projections. J Struct Biol.
Xiao, W., Chirmule, N., Berta, S. C., McCullough, B., Gao, G., and Wilson, J. M. (1999). Gene therapy vectors based on adeno‐associated virus type 1. J Virol 73(5), 3994‐4003.
Xiao, X., Li , J., McCown, T. J., and Samulski, R. J. (1997). Gene transfer by adeno‐associated virus vector into the central nervous system. Experimental Neurology 144(1), 113‐124.
Xie, Q., Bu, W., Bhatia, S., Hare, J., Somasundaram, T., Azzi, A., and Chapman, M. S. (2002). The atomic structure of adeno‐associated virus (AAV‐2), a vector for human gene therapy. Proc Natl Acad Sci U S A 99(16), 10405‐10.
Xie, Q., Hare, J., Turnigan, J., and Chapman, M. S. (2004). Large‐scale production, purification and crystallization of wild‐type adeno‐associated virus‐2. J Virol Methods 122(1), 17‐27.
Xie, Q., Lerch, T. F., Meyer, N. L., and Chapman, M. S. (2011). Structure‐function analysis of receptor‐binding in adeno‐associated virus serotype 6 (AAV‐6). Virology 420(1), 10‐9.
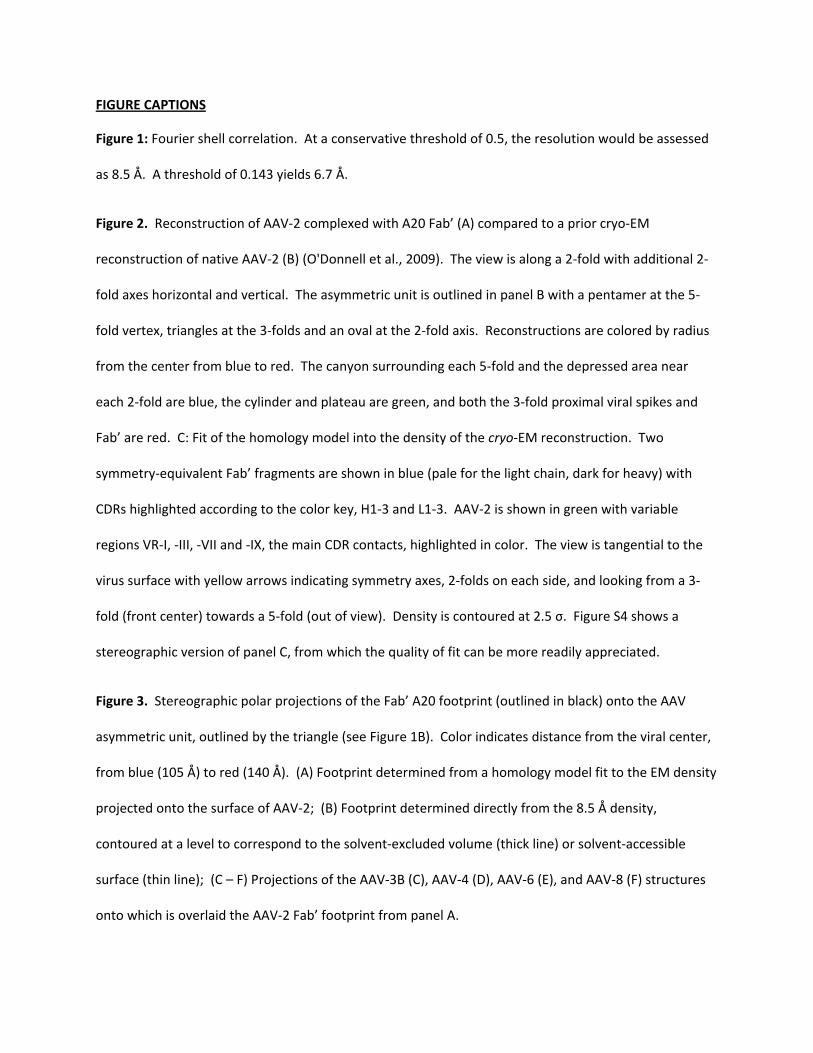
FIGURE CAPTIONS
Figure 1: Fourier shell correlation. At a conservative threshold of 0.5, the resolution would be assessed
as 8.5 Å. A threshold of 0.143 yields 6.7 Å.
Figure 2. Reconstruction of AAV‐2 complexed with A20 Fab’ (A) compared to a prior cryo‐EM
reconstruction of native AAV‐2 (B) (O'Donnell et al., 2009). The view is along a 2‐fold with additional 2‐
fold axes horizontal and vertical. The asymmetric unit is outlined in panel B with a pentamer at the 5‐
fold vertex, triangles at the 3‐folds and an oval at the 2‐fold axis. Reconstructions are colored by radius
from the center from blue to red. The canyon surrounding each 5‐fold and the depressed area near
each 2‐fold are blue, the cylinder and plateau are green, and both the 3‐fold proximal viral spikes and
Fab’ are red. C: Fit of the homology model into the density of the cryo‐EM reconstruction. Two
symmetry‐equivalent Fab’ fragments are shown in blue (pale for the light chain, dark for heavy) with
CDRs highlighted according to the color key, H1‐3 and L1‐3. AAV‐2 is shown in green with variable
regions VR‐I, ‐III, ‐VII and ‐IX, the main CDR contacts, highlighted in color. The view is tangential to the
virus surface with yellow arrows indicating symmetry axes, 2‐folds on each side, and looking from a 3‐
fold (front center) towards a 5‐fold (out of view). Density is contoured at 2.5 σ. Figure S4 shows a
stereographic version of panel C, from which the quality of fit can be more readily appreciated.
Figure 3. Stereographic polar projections of the Fab’ A20 footprint (outlined in black) onto the AAV
asymmetric unit, outlined by the triangle (see Figure 1B). Color indicates distance from the viral center,
from blue (105 Å) to red (140 Å). (A) Footprint determined from a homology model fit to the EM density
projected onto the surface of AAV‐2; (B) Footprint determined directly from the 8.5 Å density,
contoured at a level to correspond to the solvent‐excluded volume (thick line) or solvent‐accessible
surface (thin line); (C – F) Projections of the AAV‐3B (C), AAV‐4 (D), AAV‐6 (E), and AAV‐8 (F) structures
onto which is overlaid the AAV‐2 Fab’ footprint from panel A.
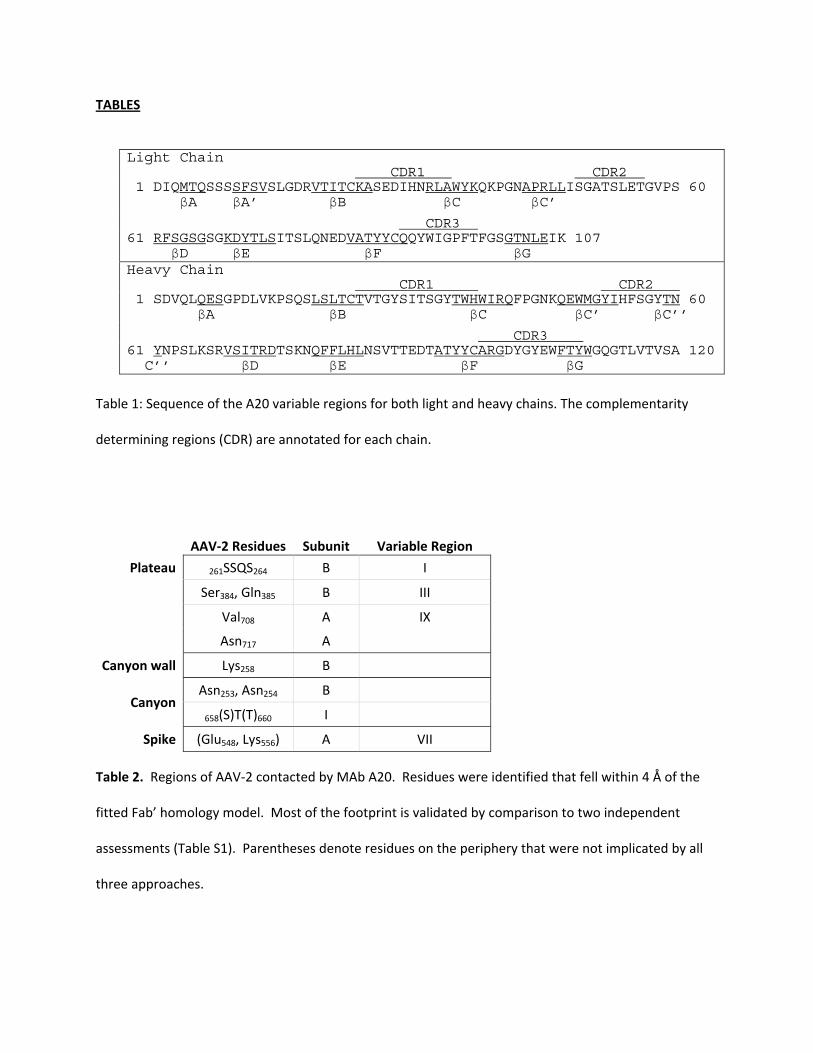
TABLES
Light Chain CDR1 CDR2 1 DIQMTQSSSSFSVSLGDRVTITCKASEDIHNRLAWYKQKPGNAPRLLISGATSLETGVPS 60 βA βA’ βB βC βC’
CDR3 61 RFSGSGSGKDYTLSITSLQNEDVATYYCQQYWIGPFTFGSGTNLEIK 107 βD βE βF βG Heavy Chain CDR1 CDR2 1 SDVQLQESGPDLVKPSQSLSLTCTVTGYSITSGYTWHWIRQFPGNKQEWMGYIHFSGYTN 60 βA βB βC βC’ βC’’
CDR3 61 YNPSLKSRVSITRDTSKNQFFLHLNSVTTEDTATYYCARGDYGYEWFTYWGQGTLVTVSA 120 C’’ βD βE βF βG
Table 1: Sequence of the A20 variable regions for both light and heavy chains. The complementarity
determining regions (CDR) are annotated for each chain.
AAV‐2 Residues Subunit Variable Region
Plateau 261SSQS264 B I
Ser384, Gln385 B III
Val708 A IX
Asn717 A
Canyon wall Lys258 B
Canyon Asn253, Asn254 B
658(S)T(T)660 I
Spike (Glu548, Lys556) A VII
Table 2. Regions of AAV‐2 contacted by MAb A20. Residues were identified that fell within 4 Å of the
fitted Fab’ homology model. Most of the footprint is validated by comparison to two independent
assessments (Table S1). Parentheses denote residues on the periphery that were not implicated by all
three approaches.