Embed Size (px)
Citation preview

HAL Id: pasteur-02057758https://hal-pasteur.archives-ouvertes.fr/pasteur-02057758
Submitted on 5 Mar 2019
HAL is a multi-disciplinary open accessarchive for the deposit and dissemination of sci-entific research documents, whether they are pub-lished or not. The documents may come fromteaching and research institutions in France orabroad, or from public or private research centers.
L’archive ouverte pluridisciplinaire HAL, estdestinée au dépôt et à la diffusion de documentsscientifiques de niveau recherche, publiés ou non,émanant des établissements d’enseignement et derecherche français ou étrangers, des laboratoirespublics ou privés.
Distributed under a Creative Commons Attribution| 4.0 International License
Structure of the DP1-DP2 PolD complex bound withDNA and its implications for the evolutionary history of
DNA and RNA polymerasesPierre Raia, Marta Carroni, Etienne Henry, Gérard Pehau-Arnaudet,
Sébastien Brûlé, Pierre Béguin, Ghislaine Henneke, Erik Lindahl, MarcDelarue, Ludovic Sauguet
To cite this version:Pierre Raia, Marta Carroni, Etienne Henry, Gérard Pehau-Arnaudet, Sébastien Brûlé, et al.. Structureof the DP1-DP2 PolD complex bound with DNA and its implications for the evolutionary history ofDNA and RNA polymerases. PLoS Biology, Public Library of Science, 2019, 17 (1), pp.e3000122.�10.1371/journal.pbio.3000122�. �pasteur-02057758�

RESEARCH ARTICLE
Structure of the DP1–DP2 PolD complex
bound with DNA and its implications for the
evolutionary history of DNA and RNA
polymerases
Pierre RaiaID1,2, Marta CarroniID
3, Etienne Henry4, Gerard Pehau-Arnaudet5,
Sebastien BruleID6, Pierre Beguin7, Ghislaine Henneke8, Erik Lindahl3, Marc Delarue1*,
Ludovic SauguetID1*
1 Unit of Structural Dynamics of Macromolecules, Pasteur Institute and CNRS UMR 3528, Paris, France,
2 Sorbonne Universite, Ecole Doctorale Complexite du Vivant (ED515), Paris, France, 3 Science for Life
Laboratory, Department of Biochemistry and Biophysics, Stockholm University, Sweden, 4 CNRS,
IFREMER, Univ Brest, Laboratoire de Microbiologie des Environnements Extrêmes, Plouzane, France,
5 Utech UBI, Pasteur Institute and CNRS UMR 3528, Paris, France, 6 Molecular Biophysics Platform,
Pasteur Institute, C2RT and CNRS UMR 3528, Paris, France, 7 Unit of Molecular Biology of Gene in
Extremophiles, Pasteur Institute, Paris, France, 8 IFREMER, CNRS, Univ Brest, Laboratoire de
Microbiologie des Environnements Extrêmes, Plouzane, France
* [email protected] (LS); [email protected] (MD)
Abstract
PolD is an archaeal replicative DNA polymerase (DNAP) made of a proofreading exonucle-
ase subunit (DP1) and a larger polymerase catalytic subunit (DP2). Recently, we reported
the individual crystal structures of the DP1 and DP2 catalytic cores, thereby revealing that
PolD is an atypical DNAP that has all functional properties of a replicative DNAP but with the
catalytic core of an RNA polymerase (RNAP). We now report the DNA-bound cryo–electron
microscopy (cryo-EM) structure of the heterodimeric DP1–DP2 PolD complex from Pyro-
coccus abyssi, revealing a unique DNA-binding site. Comparison of PolD and RNAPs
extends their structural similarities and brings to light the minimal catalytic core shared by all
cellular transcriptases. Finally, elucidating the structure of the PolD DP1–DP2 interface,
which is conserved in all eukaryotic replicative DNAPs, clarifies their evolutionary relation-
ships with PolD and sheds light on the domain acquisition and exchange mechanism that
occurred during the evolution of the eukaryotic replisome.
Author summary
PolD is an unusual archaeal replicative DNA polymerase (DNAP) in that it has all the
functional properties of a replicative DNAP but with a catalytic core reminiscent of an
RNA polymerase (RNAP). We now describe the cryo–electron microscopy (cryo-EM)
structure of a DNA-bound heterodimeric DP1–DP2 PolD complex from the archaeon
Pyrococcus abyssi, revealing a unique DNA-binding site. Comparison of PolD with
RNAPs extends their structural similarities and highlights the minimal catalytic core
PLOS Biology | https://doi.org/10.1371/journal.pbio.3000122 January 18, 2019 1 / 28
a1111111111
a1111111111
a1111111111
a1111111111
a1111111111
OPEN ACCESS
Citation: Raia P, Carroni M, Henry E, Pehau-
Arnaudet G, Brule S, Beguin P, et al. (2019)
Structure of the DP1–DP2 PolD complex bound
with DNA and its implications for the evolutionary
history of DNA and RNA polymerases. PLoS Biol
17(1): e3000122. https://doi.org/10.1371/journal.
pbio.3000122
Academic Editor: Ann M. Stock, Rutgers
University-Robert Wood Johnson Medical School,
UNITED STATES
Received: September 24, 2018
Accepted: January 10, 2019
Published: January 18, 2019
Copyright: © 2019 Raia et al. This is an open
access article distributed under the terms of the
Creative Commons Attribution License, which
permits unrestricted use, distribution, and
reproduction in any medium, provided the original
author and source are credited.
Data Availability Statement: Coordinates and
structure factors for DP1 H451 crystal structure
were deposited in the Protein Data Bank under the
accession code 6HMF. The cryo-EM map of the
DNA-bound PolD is deposited in the Electron
Microscopy Data Bank under accession code EMD-
0244. The C-alpha and metal ions atomic
coordinate of the complex are deposited in the
Protein Data Bank under accession code 6HMS.

shared by all cellular transcriptases. Elucidating the structure of the interface between
PolD’s DP1 and DP2 subunits, which is conserved in all eukaryotic replicative DNA poly-
merases, clarifies their evolutionary relationships with PolD and sheds light on the process
of domain acquisition and exchange that occurred during the evolution of the eukaryotic
replisome.
Introduction
All forms of life have evolved multiple DNA polymerases (DNAPs) in order to maintain their
genomes [1]. Highly processive and accurate replicative DNAPs are responsible for duplicating
the genome, and a variety of specialized DNAPs are involved in DNA repair and in resolving
the Okazaki fragments. Over the years, all DNAPs have been grouped in different families,
using sequence alignments [2–4] PolA, PolB, PolC, PolD, PolX, and PolY and reverse tran-
scriptases. The main replicative DNAPs from Eukarya are found in family B, Bacteria in family
C, and Archaea in families B and D. In recent years, a wealth of structural information brought
to light the molecular mechanisms evolved by B- and C-family replicative DNAPs to fulfill the
processivity and fidelity requirements for copying large genomes [5–7]. Such structural infor-
mation is missing for D-family DNAPs (PolD), which is by far the least characterized DNAP
at the structural level.
PolD is a heterodimeric replicative DNAP composed of a large catalytic subunit (DP2) and
a smaller subunit with 30-50 proofreading exonuclease activity (DP1) [8–9]. Based on biochem-
ical evidence, it has been proposed that PolD may act soon after initiation by the primase [10]
and that at a later stage, a switch occurs such that PolB becomes responsible for leading strand
replication while PolD continues to process the lagging strand [11]. PolD has been shown to
be essential for cell viability [12–13] and is widely distributed among Archaea, being present in
all four major superphyla: Euryarchaeota (including the methanogenic human symbionts);
Diapherotrites, Parvarchaeota, Aenigmarchaeota, Nanoarchaeota, Nanohaloarchaeota
(DPANN); the emerging Asgard superphylum; and Thaumarchaeota, Aigarchaeota, Crenarch-
aeota, Korarchaeota (TACK), only absent from Crenarchaeota [14]. Recently, we reported the
individual crystal structures of the DP1 and DP2 catalytic cores, thereby revealing that PolD is
an atypical DNAP that has all functional properties of a replicative DNAP but with the catalytic
core of an RNA polymerase (RNAP) [15]. Indeed, PolD has been shown to share an unex-
pected structural homology with the “two-double-psi β-barrel” (DPBB) family of RNAPs [16],
which includes multisubunit transcriptases from all domains of life, homodimeric RNA silenc-
ing pathway RNAPs, and atypical RNAPs encoded by some viruses [17]. All these nucleotide
polymerases share a common catalytic center that is formed between two DPBBs, which con-
tribute distinct amino acid residues to the active site in an asymmetrical fashion [16, 18–20].
However, DP1 and DP2 crystal structures were obtained separately and do not provide a
comprehensive description of the molecular mechanisms of DNA polymerization and proof-
reading by PolD. Furthermore, in the DP2 (1–1050) crystal structure, the active site was flexi-
ble and partly unresolved in the electron density, and a critical C-terminal domain (CTD) of
DP2 (1051–1270), which participates in the association with DP1, was deleted for crystalliza-
tion purposes.
Here, we report the cryo–electron microscopy (cryo-EM) structure of the DNA-bound
PolD complex. This structure sheds light on DNA-binding domains evolved by PolD to per-
form DNA replication and extends the repertoire of protein domains known to be involved in
Structure of the DP1–DP2 PolD complex bound with DNA
PLOS Biology | https://doi.org/10.1371/journal.pbio.3000122 January 18, 2019 2 / 28
Funding: The fellowship of PR is funded by
Sorbonnes University ED515 and Fondation pour la
Recherche Medicale. The work is funded by an
ANR JCJC grant ANR-17-CE11-0005-01, Institut
Pasteur, Ifremer, and the Swedish Research
Council (grant no. 2017-04641). The cryo-EM data
were collected at the Swedish National Cryo-EM
Facility funded by the Knut and Alice Wallenberg
Foundation and the Science for Life Laboratory.
The funders had no role in study design, data
collection and analysis, decision to publish, or
preparation of the manuscript.
Competing interests: The authors have declared
that no competing interests exist.
Abbreviations: cryo-EM, cryo–electron
microscopy; CTD, C-terminal domain; dGTP,
deoxyguanosine triphosphate; DNAP, DNA
polymerase; DPANN, Diapherotrites,
Parvarchaeota, Aenigmarchaeota, Nanoarchaeota,
Nanohaloarchaeota; DPBB, double-psi β-barrel;
dsDNA, double-stranded DNA; GTPase, guanosine
triphosphatase; HSH, helix-strand-helix; KH, K-
homology; OB, oligonucleotide binding; PCNA,
proliferating cell nuclear antigen; PDB, Protein Data
Bank; PDE, phosphodiesterase domain; PIP,
PCNA-interacting peptide; QDE-1, quelling
defective phenotype; RFC, replication factor C; r.m.
s.d., root-mean-square deviation; RNAP, RNA
polymerase; ssDNA, single-stranded DNA; TACK,
Thaumarchaeota, Aigarchaeota, Crenarchaeota,
Korarchaeota.

DNA replication. This work also enables a detailed comparison of PolD both with the cellular
transcriptases and the eukaryotic replicative DNAPs.
Results
Structure determination of the EM density-based atomic model of PolD
The Pyrococcus abyssi PolD complex (215 kDa) consists of two subunits, DP1 (75 kDa) and
DP2 (140 kDa), and could be coexpressed and copurified to homogeneity (Fig 1A). PolD
behaves as a 1:1 heterodimer in analytical ultracentrifugation (Fig 1B). The PolD exonuclease-
deficient variant [21] (DP1 H451A) was incubated with a 15-mer primed DNA duplex with a
5-nt overhang, mimicking DNA replication intermediates, to prepare samples for cryo-EM.
After four rounds of 2D classifications, an overall dataset of 74,674 particles was obtained from
952 micrographs. Ab initio reconstruction of PolD is arranged in two lobes, intimately associ-
ated, that are compatible with the small DP1 and large DP2 subunits. Although no structurally
distinct groups of PolD emerged from subsequent 3D classifications, the density correspond-
ing to DNA is unequally well resolved from one subset of particles to the other, thereby sug-
gesting partial occupancy and/or some flexibility of the DNA. The best electron density was
obtained from a subset of 8,774 particles isolated from iterative 3D classifications and yielding
to a density map at an overall resolution of 7.1 Å (Fig 1C). This 8,774-particle subset emerged
from a previous 3D class (15,282 particles) that could be refined to 6.7 Å. Although this model
displays a slightly higher resolution, the density corresponding to DNA is weaker, so it will not
be discussed further.
The quality of the map is confirmed by the visualization of individual helices and ß sheets
(Fig 2). Distribution of the local resolution shows that the most resolved region of the PolD–
DNA complex map (approximately 5-Å resolution) are the exonuclease and polymerase cata-
lytic cores of the DP1 and DP2 subunits (S1 Fig). Most of the cryo-EM maps can be interpreted
by fitting the high-resolution crystal structures of the PolD DP1 (144–619) and DP2 (1–1050)
individual subunits [15] (Fig 2). In order to prevent DNA degradation during cryo-EM prepa-
ration, the exonuclease-deficient variant [21] PolD (DP1 H451A) was used in this experiment.
The structure of the DP1 H451A (144–619) individual subunit was solved separately using X-
ray crystallography at 2.6-Å resolution, ensuring that neither the overall structure of DP1 nor
its two metal ion–binding sites are altered by the H451A mutation (S2 Fig). All the density
accounting for DP1 could be conveniently interpreted by rigid-body fitting the DP1 H451A
individual crystal structure, with the DP1 EM and crystal structures showing only little differ-
ences. On the other hand, large interdomain rearrangements are observed between the DP2
crystal and cryo-EM PolD structures (Fig 3A). The DP2 crystal structure was split into separate
domains and subdomains, which were fitted using real-space rigid-body refinement. Some
regions in the active site of DP2 (48 residues) and the DP1–DP2 interacting region (91 resi-
dues) were built guided by the homology with RNAPs and the CTD of the catalytic subunit of
Polε [24], respectively (Fig 2A). A region corresponding to two α helices (33 residues) was
traced de novo according to secondary structure predictions (Fig 2B and 2C). Residual density
remaining at high-level contouring is colocalized with the three zinc-binding domains con-
tained in DP2 and the binuclear Fe/Zn catalytic center of DP1, thereby assessing the quality of
the map and supporting the agreement between the map and the fitted model (Fig 2D). In the
DNA-bound PolD structure, a 15-mer/16-mer primer/template duplex B-form DNA was
docked in the cryo-EM density, guided by the unambiguous density for the duplex region,
showing minor and major grooves (Fig 2D). However, no clear density is observed for the four
50-terminal nucleotides of the template single-stranded DNA. Side chains deduced from exist-
ing crystals structures, including all side chains of DP1 and most side chains of DP2 (86%),
Structure of the DP1–DP2 PolD complex bound with DNA
PLOS Biology | https://doi.org/10.1371/journal.pbio.3000122 January 18, 2019 3 / 28

Structure of the DP1–DP2 PolD complex bound with DNA
PLOS Biology | https://doi.org/10.1371/journal.pbio.3000122 January 18, 2019 4 / 28
were included in the model used for real-space refinement in Phenix. However, as the full
model for PolD was built into a cryo-EM density map at intermediate resolution, we have
deposited only Cα positions of PolD, DNA, and metal ions to ensure that coordinates are not
overinterpreted.
Architecture of the PolD–DNA-binding site suggests a structure-based
nomenclature for D-family DNAPs
The structure of the native DNA-bound PolD sheds light on critical DNA interaction domains,
enabling us to propose a structure-based nomenclature for D-family DNAPs (Fig 4). PolD
shows a claw-shaped active site, at the center of which is the two-DPBB catalytic core and at
the edge of which are three zinc-binding modules named the Zn-I, Zn-II, and Zn-III domains.
The DNA substrate is cradled between a bipartite clamp domain, named 1 and 2, emanating
from DPBB-1 and DPBB-2, respectively. The clamp domain is barricaded from one side by a
globular domain (85–283) located in the N-terminal region of DP2, which is ideally located to
orient the DNA template in the active site. Consistently, former biochemical studies have
shown that this domain binds DNA, with a marked preference for 30-recessed DNA over dou-
ble-stranded DNA (dsDNA) [28]. The DP2 N-terminal domain was compared to the Protein
Data Bank (PDB) using Dali [29] and shown to share structural homology with several K-
homology (KH) domains (highest z-score = 5.7) (Fig 5). Eukaryotic type I and archaeal/bacte-
rial type II KH domains are ancestral single-stranded nucleic acid–binding folds that share a
β-α-α-β minimal core motif and two additional α and β elements, which are either located in
the C-terminal (type I) or the N-terminal (type II) region of the KH core motif [30]. The DP2
KH-like domain shares the topology of type II KH domains and can be superimposed onto the
Escherichia coli guanosine triphosphatase (GTPase) ERA [31] over 80 Cα with a root-mean-
square deviation (r.m.s.d.) of 3.6 Å. The most prominent sequence conservation among KH
domains is a conserved GxxG motif that is located within a loop that links the two α helices of
the KH minimal core and directly contacts nucleic acids. These two glycine residues are super-
posed and conserved with two canonical consecutive glycine residues (G151 and G152) of the
DP2 KH-like domain. KH domains have already been predicted in the N-terminal region of
bacterial PolC [32], and the cryo-EM structure of PolD shows—for the first time in a structural
context, to our knowledge—a KH domain associated with a replicative DNAP. Two accessory
domains, named -1 and -2 (emanating from insertions in DPBB-1 and DPBB-2 subdomains,
respectively), play a structural role by scaffolding together the essential two-DPBB catalytic
cores and the clamp-1 and clamp-2 domains. The KH-like domain is connected to the anchor
domain, which firmly attaches it to the clamp-2 domain and orients it in the active site (Fig 4).
A characteristic of PolD is that the exonuclease and polymerase active sites are hosted by
two distinct subunits. DP1 shows an oligonucleotide binding (OB) domain that is inserted
within the N-terminal region of a large Mre11-like nuclease phosphodiesterase domain (PDE)
whose active site entry faces the 30 end of the nascent DNA strand. DP1 interacts extensively
with the C-terminal region of DP2, which is part of clamp-1. Comparison of the cryo-EM
PolD structure with the DP2 (1–1061) crystal structure reveals that the association with DP1 is
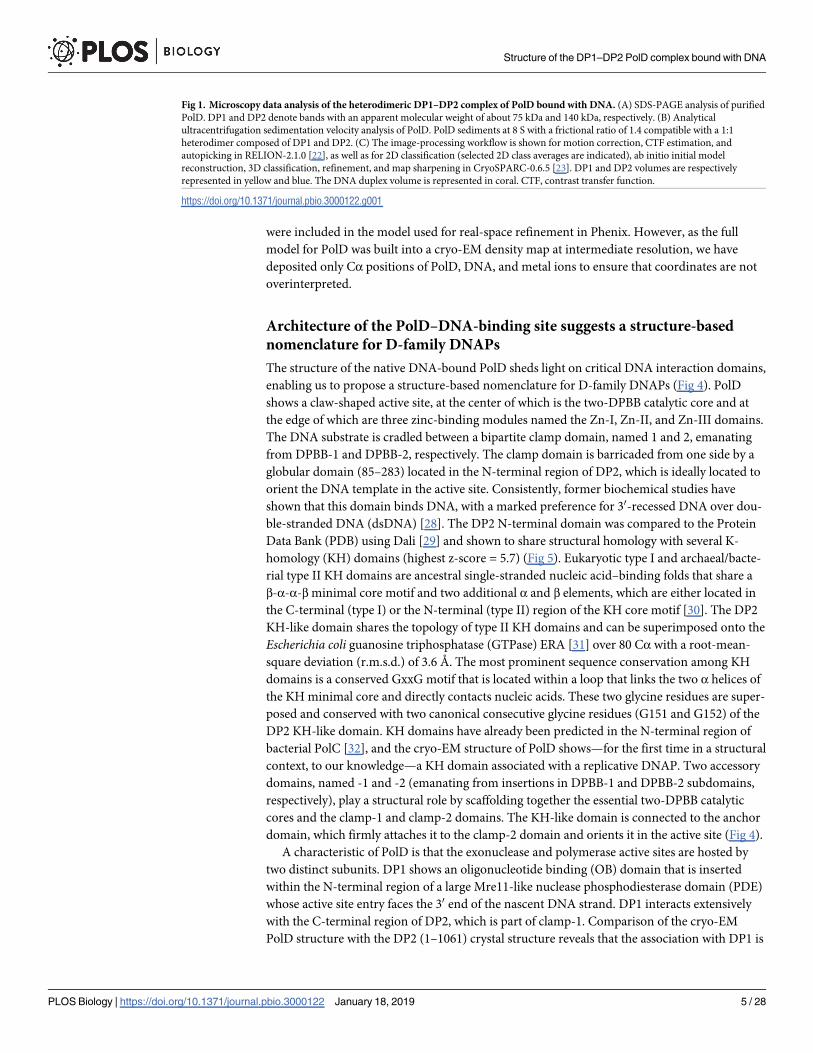
Fig 1. Microscopy data analysis of the heterodimeric DP1–DP2 complex of PolD bound with DNA. (A) SDS-PAGE analysis of purified
PolD. DP1 and DP2 denote bands with an apparent molecular weight of about 75 kDa and 140 kDa, respectively. (B) Analytical
ultracentrifugation sedimentation velocity analysis of PolD. PolD sediments at 8 S with a frictional ratio of 1.4 compatible with a 1:1
heterodimer composed of DP1 and DP2. (C) The image-processing workflow is shown for motion correction, CTF estimation, and
autopicking in RELION-2.1.0 [22], as well as for 2D classification (selected 2D class averages are indicated), ab initio initial model
reconstruction, 3D classification, refinement, and map sharpening in CryoSPARC-0.6.5 [23]. DP1 and DP2 volumes are respectively
represented in yellow and blue. The DNA duplex volume is represented in coral. CTF, contrast transfer function.
https://doi.org/10.1371/journal.pbio.3000122.g001
Structure of the DP1–DP2 PolD complex bound with DNA
PLOS Biology | https://doi.org/10.1371/journal.pbio.3000122 January 18, 2019 5 / 28

required for rearranging the DP2 catalytic core into an active conformation. Indeed, in the
DP2 (1–1061) crystal structure, deletion of the CTD of DP2 causes a profound reorganization
of the active site (Fig 3A): (1) the DPBB-1 domain is partly disordered and moves with respect
to DPBB-2 from the canonical relative orientation of the two-DPBB catalytic center that is
Fig 2. Cryo-EM reconstruction of the DNA-bound PolD binary complex. (A) Backbone trace of the cryo-EM model of
PolD. The blue region was built by fitting the DP1 H451A (PDB ID: 6HMF, this study) and DP2 (PDB ID: 5IJL [15])
crystal structures in the cryo-EM map. The C-terminal region of DP2 (1090–1195) (green) was built guided by the
homology with the CTD of the catalytic subunit of human Polε (PDB ID: 5VBN [24]) and adjusted manually in the cryo-
EM density. Part of the DPBB-1 domain and the DPBB-connecting loop (green) were built by homology modeling guided
against the structure of yeast RNAP-II (PDB ID: 2E2I [25]). A 15-/16-mer B-form DNA was generated with Coot [26]
(yellow) and rigid-body fitted into the cryo-EM density. Finally, two α helices (red) were built de novo in the cryo-EM
density: α14 (324–338) and α43 (1074–1089)). (B) Enlarged view showing the α14 and α43 α helices that were built de
novo. The cryo-EM map surrounding these helices is shown as a gray mesh contoured at 6 σ. (C) Secondary structure
predictions of Jpred [27] for the de novo–built α14 and α43 α helices. The confidence factor is indicated: 0, not confident,
and 9, very confident. (D) Detailed views of the DNA-bound PolD cryo-EM experimental map. Density surrounding PolD
and DNA is shown in gray mesh contoured at 6 σ. Residual peaks of density are shown in red mesh contoured at 12 σ.
cryo-EM, cryo–electron microscopy; CTD, C-terminal domain; DPBB, double-psi β-barrel; OB, oligonucleotide binding;
PDB, Protein Data Bank; PDE, phosphodiesterase domain; RNAP, RNA polymerase.
https://doi.org/10.1371/journal.pbio.3000122.g002
Structure of the DP1–DP2 PolD complex bound with DNA
PLOS Biology | https://doi.org/10.1371/journal.pbio.3000122 January 18, 2019 6 / 28

shared within all cellular transcriptases and full-length PolD, (2) clamp-1 and the accessory-1
domains are rotated by about 45˚ with respect to clamp-2, and (3) the KH-like domain moves
by about 10 Å away from the catalytic center. Consistently, in a DNA-elongation activity assay,
the native DP1–DP2 complex shows a far higher activity than the DP2 (1–1061) catalytic core
on its own (Fig 3B). Altogether, these data show that association with DP1 is required to rear-
range the catalytic core of DP2 in an active conformation.
Fig 3. The DP1–DP2 heterodimeric assembly is required for PolD activity. (A) Movements of the DPBB-1, KH-
like, and accessory-1 domains observed between the DP2 (1–1061) crystal structure (PDB ID: 5IJL [15]) and the PolD
cryo-EM structure, supported by the cryo-EM density contoured at 6 σ (gray). Movements are indicated by arrows.
Backbone traces of the DP2 cryo-EM structure and the DP2 (1–1061) crystal structure are shown in blue and black,
respectively. (B) Primer extension activities of the heterodimeric DP1–DP2 PolD complex and the DP2 (1–1061)
construct. A 50-32P-labeled 24-mer (red asterisk) associated with a 60-mer template was used as a substrate. A control
experiment was performed in absence of polymerase (lane T). (C) DNA-binding abilities of the heterodimeric complex
of PolD and the DP2 (1–1061) construct. The two constructs were added to hexachlorofluorescein-labeled primer/
templates, ssDNA substrates, and dsDNA substrates, and the increase in fluorescence anisotropy was noted. The
underlying data can be found in S1 Data. KD values (average ± standard deviation from three determinations) for the
binding of PolD were determined as detailed in S1 Text. cryo-EM, cryo–electron microscopy; DPBB, double-psi β-
barrel; dsDNA, double-stranded DNA; KH, K-homology; PDB, Protein Data Bank; ssDNA, single-stranded DNA.
https://doi.org/10.1371/journal.pbio.3000122.g003
Structure of the DP1–DP2 PolD complex bound with DNA
PLOS Biology | https://doi.org/10.1371/journal.pbio.3000122 January 18, 2019 7 / 28

Structure of the DP1–DP2 PolD complex bound with DNA
PLOS Biology | https://doi.org/10.1371/journal.pbio.3000122 January 18, 2019 8 / 28

Fig 4. Structure of the PolD heterodimeric DP1–DP2 complex bound with DNA. (A) Ribbon diagram of the DNA-bound PolD structure highlighting the
domains and domain-like regions that compose the DP1 and DP2 subunits. Zn2+ (blue) and Fe3+ (red) ions are shown as spheres. (B) Multiple-sequence alignment of
the DP1 and DP2 subunits of PolD: P. abyssi (“Pab”) with Lokiarchaeum sp. GC14_75 PolD (“Loki”) and Methanomassiliicoccus luminyensis PolD (“Mlu”). Secondary
structure elements are colored according to panel (A). Functionally important conserved residues are highlighted. DPBB, double-psi β-barrel; HSH, helix-strand-
helix; KH, K-homology; OB, oligonucleotide binding; PCNA, proliferating cell nuclear antigen; PDE, phosphodiesterase domain.
https://doi.org/10.1371/journal.pbio.3000122.g004
Fig 5. A KH-like domain orients the DNA template toward the active site of PolD. (A) Comparison of the PolD
KH-like domain with type II KH domains: from top to bottom, the ribbon diagrams of KH domains from P. abyssi(“Pab”) DP2 (PDB ID: 5IJL [15]), P. horikoshii DP2 (PDB ID: 3O59 [28]), Mycobacterium tuberculosis (“Mtu”) NusA
(PDB ID: 2ASB [33]), Thermus thermophilus (“Tth”) ribosomal protein S3 (PDB ID: 4OX9 [34]), and E. coli (“Eco”)
GTPase ERA (PDB ID: 1EGA [31]). Cα atoms of conserved Gly residues are depicted with gray spheres. (B) Structure-
based sequence alignment of the A and B helices from structures shown in (A). a: Pab PolD, b: Pho PolD, c: Mtu NusA,
d: Tth S3, e: Eco GTPase ERA. Conserved Gly and basic residues (“res.”) are highlighted in blue. Gly, glycine; GTPase,
guanosine triphosphatase; KH, K-homology; PDB Protein Data Bank.
https://doi.org/10.1371/journal.pbio.3000122.g005
Structure of the DP1–DP2 PolD complex bound with DNA
PLOS Biology | https://doi.org/10.1371/journal.pbio.3000122 January 18, 2019 9 / 28

Structural basis for the association between the DP1 and DP2 subunits of
PolD
Prior to this work, the DP1–DP2 interacting region had never been modeled. This region was
deleted from our previous constructs in order to crystallize the DP2 catalytic domain [15]. For-
mer bioinformatics studies showed that the C-terminal region of DP2 hosts a zinc-binding
domain resembling that of the eukaryotic replicative Polε [35] (Fig 6A). Taking advantage of
Fig 6. Structural basis for the interaction between DP1 and DP2. (A) Structure-based sequence alignment of the C-
terminal regions of Homo sapiens Polε A subunit (PDB ID: 5VBN [24]) and P. abyssi PolD DP2. Secondary structure
elements are shown above the sequence alignment according to the crystal structure of the H. sapiens Polε and the cryo-
EM structure of PolD. Sequence similarity is highlighted with yellow boxes, and conserved residues are highlighted with
red boxes. The “helix-breaker” motif is indicated with gray lines. Two connecting loops (1149–1155) and (1171–1777) were
omitted because of the lack of density. Secondary structures predictions from Jpred [27] of the P. abyssi PolD DP2–CTD
are shown below the sequence alignment. (B) Structure of the DP1/DP2-CTD interface. Density surrounding the DP2–
CTD is shown in gray mesh and contoured at 6 σ. Disordered loops are indicated by dotted blue lines. The right panel
shows an enlarged view of the cryo-EM density that surrounds the α1’N and α1’C helices. (C) Overall view highlighting the
contribution of the DP2C helices α1’ and α3’ and the Zn-III binding domain to the DP1–DP2 interface. DP2–CTD is
shown as ribbon, and the Zn2+ ion is represented as a blue sphere. Cα atoms of the KxRRxP motif contained in the Zn-III
binding domain are shown as green spheres. Left: Charge distribution at the interface of the DP1–DP2 complex.
Electrostatic surface potentials are generated using the DP1 H451A crystal structure (PDB ID: 6HMF, this study) fitted into
the cryo-EM density. Right: Same view showing the evolutionary conservation of the surface amino acids mapped on DP1,
calculated with Consurf [37] from an alignment of 150 DP1 sequences. Amino acid conservation is indicated by a
transition in color hues, from magenta (most conserved) to cyan (most variable). cryo-EM, cryo–electron microscopy;
CTD, C-terminal domain; DPBB, double-psi β-barrel; OB, oligonucleotide binding; PDB, Protein Data Bank; PDE,
phosphodiesterase domain; ssDNA, single-stranded DNA.
https://doi.org/10.1371/journal.pbio.3000122.g006
Structure of the DP1–DP2 PolD complex bound with DNA
PLOS Biology | https://doi.org/10.1371/journal.pbio.3000122 January 18, 2019 10 / 28

the recent crystal structure of the human Polε B subunit in complex with the CTD of its cata-
lytic subunit [24], a homology model (18% identity / 48% similarity) covering residues 1096–
1195 of DP2 was calculated using Phyre [36]. The DP1–DP2 interfacial region shows electron
density that can be accounted for by a bundle of four α helices and a globular region that
resembles a zinc-binding domain. The homology model can be conveniently fitted in the elec-
tron density, guided by the clear density for the helical bundle and by the globular density cor-
responding to the Zn-III domain (Figs 2D and 6B). The model was modified manually to
better account for the density. In particular, the first α helix (named α1’) splits into two α heli-
ces, named α1’N and α1’C. Consistent with secondary structure predictions, the helix is broken
at the level of two canonically conserved proline and glycine residues (P1107 and G1111,
respectively) (Fig 6A and 6B). The helix α1’N contributes to fold the α1’-30-helical bundle and
interacts with the rest of the DPBB-1 catalytic core, whereas the helix α1’C interacts with DP1
(Fig 6B).
The DP1 OB–PDE interface forms an electronegative groove interacting intimately with a
loop carried by the Zn-III domain, which hosts canonical basic residues (R1131 and R1132)
(Fig 6C). The key location of the DP2 Zn-III domain in the DP1-DP2 interaction area rational-
izes former studies demonstrating that a 20-amino-acid-long peptide covering the Zn-III
domain shows nanomolar affinity with DP1 in P. horikoshii PolD [38]. In addition, helices
α1’C and α3’ of DP2 interact with loops emanating from the core secondary elements of the
PDE (Fig 6C). Consistently, the DP1–DP2 interacting crevice shows the highest degree of evo-
lutionary conservation relative to the rest of the solvent-exposed regions of the DP1 surface
(Fig 6C). Our model thus suggests that a minimal core for the interaction between DP1 and
DP2 would involve the 1096–1195 DP2–CTD region and a large region of DP1 covering both
OB and PDE (144–619). Consistently, DP1 (144–619) fused to a His-Tag comigrated with DP2
(1096–1195) in chromatographic affinity column, and the complex could be copurified
through a three-chromatographic-steps protocol, including a step with salt concentration up
to 1 M NaCl, suggesting that this interaction is highly specific and stable (S3 Fig). Attempts to
express DP2–CTD (1096–1195) or DP2 full-length invariably resulted in aggregation, showing
that DP1–DP2 forms a constitutive complex and that association with DP1 is required to stabi-
lize the DP2–CTD. Similar results have been reported for PolD from P. horikoshii [38–39].
Structural basis for DNA binding by PolD as revealed at medium
resolution
All replicative DNAPs have evolved protein domains named palm, fingers, and thumb
domains arranged to form the DNA-binding cleft. The palm domain carries the catalytic resi-
dues, the fingers domain drapes over the nascent base pair, and the thumb domain holds the
DNA duplex during replication and contributes to processivity [40–41]. Equivalent DNA-
binding domains could not be predicted in PolD from the individual crystal structures of the
DP1 and DP2 subunits [15]. Although the reported DNA-bound cryo-EM structure of PolD
solved at an intermediate resolution does not allow for a detailed description of the polymeri-
zation mechanism by PolD, it reveals—for the first time, to our knowledge—the DNA-binding
site of PolD, extending the repertoire of domains known to be involved in DNA replication.
PolD has evolved a specific bipartite clamp domain, which completely surrounds the DNA
duplex (Fig 7). Clamp-1 and clamp-2 domains contribute a central cleft with a diameter of 30
Å, which is located upstream of the DP2 polymerase catalytic center. Clamp-1, which consists
of a 5-helix bundle and the Zn-III domain, faces from one side the polymerase catalytic center
and from the other side the nuclease catalytic center (Figs 4A and 7). Clamp-1 contributes sev-
eral canonical basic residues (R1122, K1125, K1129, and K1145), which form a highly biased
Structure of the DP1–DP2 PolD complex bound with DNA
PLOS Biology | https://doi.org/10.1371/journal.pbio.3000122 January 18, 2019 11 / 28
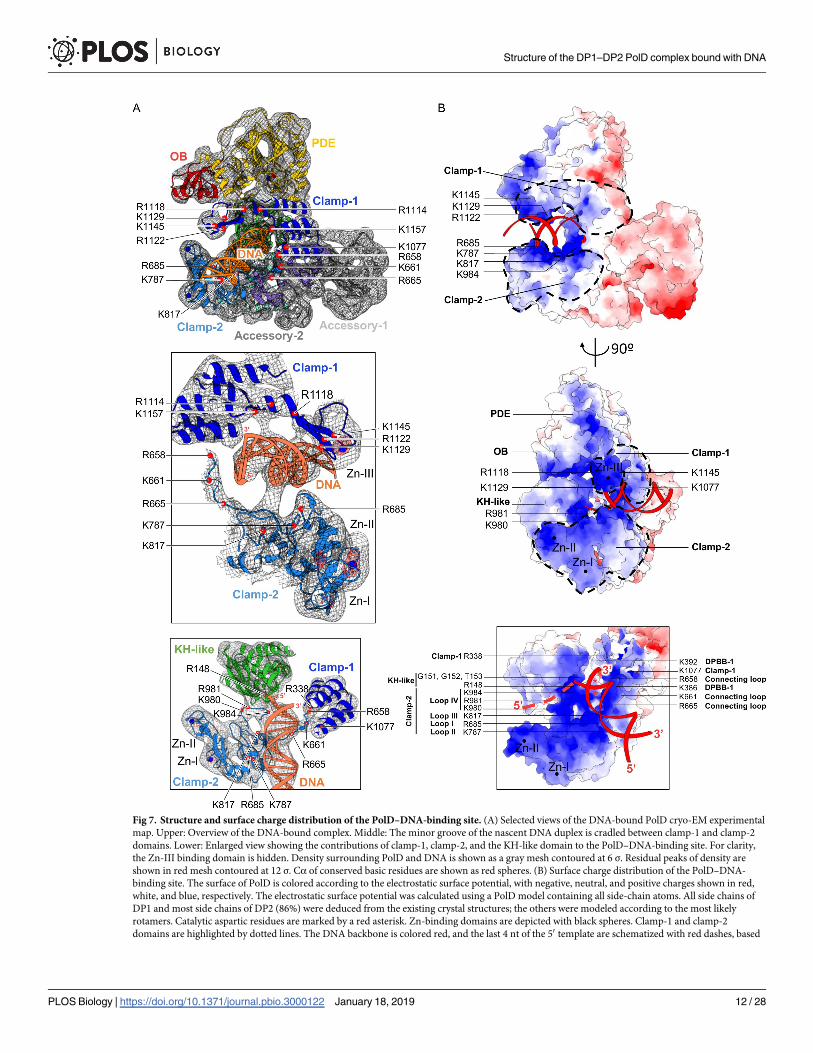
Fig 7. Structure and surface charge distribution of the PolD–DNA-binding site. (A) Selected views of the DNA-bound PolD cryo-EM experimental
map. Upper: Overview of the DNA-bound complex. Middle: The minor groove of the nascent DNA duplex is cradled between clamp-1 and clamp-2
domains. Lower: Enlarged view showing the contributions of clamp-1, clamp-2, and the KH-like domain to the PolD–DNA-binding site. For clarity,
the Zn-III binding domain is hidden. Density surrounding PolD and DNA is shown as a gray mesh contoured at 6 σ. Residual peaks of density are
shown in red mesh contoured at 12 σ. Cα of conserved basic residues are shown as red spheres. (B) Surface charge distribution of the PolD–DNA-
binding site. The surface of PolD is colored according to the electrostatic surface potential, with negative, neutral, and positive charges shown in red,
white, and blue, respectively. The electrostatic surface potential was calculated using a PolD model containing all side-chain atoms. All side chains of
DP1 and most side chains of DP2 (86%) were deduced from the existing crystal structures; the others were modeled according to the most likely
rotamers. Catalytic aspartic residues are marked by a red asterisk. Zn-binding domains are depicted with black spheres. Clamp-1 and clamp-2
domains are highlighted by dotted lines. The DNA backbone is colored red, and the last 4 nt of the 50 template are schematized with red dashes, based
Structure of the DP1–DP2 PolD complex bound with DNA
PLOS Biology | https://doi.org/10.1371/journal.pbio.3000122 January 18, 2019 12 / 28

distribution of positively charged side chains and contribute to surround the nascent DNA
duplex. In addition, Zn-III domain, as well as the β strands connecting Zn-III domain to the
clamp-1 helical bundle, is ideally located to interact with the minor groove of the nascent
duplex DNA (Fig 7). The critical role of clamp-1 in DNA replication suggested by the cryo-
EM structure is supported by a functional study showing that substituting two cysteines of the
Zn-III domain severely impairs the activity of PolD from Archaeoglobus fulgidus [42]. PolD
shares with its RNAP counterparts the N-terminal helix of the 5-helix bundle, which is part of
a hybrid-binding domain in two-DPBB RNAPs. This helix contains two canonical basic resi-
dues and shares a similar orientation with respect to the two-DPBB catalytic core and the
nascent duplex in both families of enzymes [25]. Clamp-2 encompasses the region between the
C terminus of the last β strand of DPBB-1 and the first β strand of DPBB-2, as well as the C-ter-
minal extension located at the C terminus of DPBB-2. It is mainly composed of four loops,
named loop-I, loop-II, and loop-III—which form the second electropositive patch surround-
ing the neo-formed DNA duplex—and loop-IV, which is ideally located for binding the
upstream DNA template (Fig 7B). Zn-I domain is located at the edge of clamp-2 and contrib-
utes to stabilizing clamp-2, which is otherwise composed mainly of loops. Zn-II domain is not
strictly conserved among PolD polymerases and is inserted in the Zn-I domain (Fig 4B). In
total, the Zn-III domain of clamp-1; loop-I, loop-II, and loop-III of clamp-2; and several resi-
dues of the two-DPBB catalytic center contribute conserved basic residues that form a circular
clamp that binds about one turn of helix (10–12 base pairs) of the nascent DNA duplex (Fig 7).
The role of this DNA-binding clamp was evaluated by comparing the DNA-binding properties
of the heterodimeric PolD complex with the DP2 (1–1065) construct, whose clamp-1 domain
is deleted (Fig 3C). As expected for a replicative DNAP, PolD binds primer-template DNA
with a dissociation constant in the nanomolar range (15 nM). Similar values of DNA-binding
constants have been reported previously for PolD from P. furiosus [43] and other replicative
DNAPs [44]. The affinities of PolD for dsDNA and single-stranded DNA (ssDNA) were
respectively 6.5-fold and 2.4-fold weaker, showing that PolD preferentially binds primed
DNA. This observation is consistent with former gel-shift assays [11]. In contrast, the DNA-
binding affinity of DP2 (1–1065) is strongly impaired compared to the entire PolD complex,
thereby showing that the clamp binding domain is crucial for DNA binding by PolD (Fig 3C).
All DNA-bound structures of replicative DNAPs show that the single-stranded part of the
DNA template is flipped out of stacking arrangement with the duplex by a sharp angle in the
template sugar-phosphate backbone [40]. Consistently, the DNA template enters the polymer-
ase active site through a crevice that points toward the two-DPBB catalytic core and is orthogo-
nal to the axis of the nascent DNA duplex. The putative DNA template entry site is lined by
the OB domain of DP1, the Zn-II domain, clamp-2, and the KH-like DNA-binding domain.
This region is particularly rich in basic residues that contribute a positively charged surface
electrostatic potential that is very favorable for DNA binding (Fig 7B). In particular, the KH-
like canonical motif (PIRxxGGT) (Fig 5) is located next to the first single-stranded nucleotide
of the template strand (Fig 7). In addition, loop-IV of the clamp-II domain lines the putative
DNA template-binding region and contributes several highly conserved basic residues, which
form a positively charged surface that is ideally located to interact with the phosphate back-
bone of the DNA template (Fig 7B).
The position of DNA in the cryo-EM structure of PolD can be compared with the many
structures of DNA-dependent RNAPs solved in complex with DNA. When the structures of
on the position of the KH-like domain. cryo-EM, cryo–electron microscopy; DPBB, double-psi β-barrel; KH, K-homology; OB, oligonucleotide
binding; PDE, phosphodiesterase domain.
https://doi.org/10.1371/journal.pbio.3000122.g007
Structure of the DP1–DP2 PolD complex bound with DNA
PLOS Biology | https://doi.org/10.1371/journal.pbio.3000122 January 18, 2019 13 / 28

PolD and the elongation complex of Saccharomyces cerevisiae RNAP-II are superimposed on
their two-DPBB catalytic cores, the nascent DNA duplex in PolD and the nascent RNA/DNA
hybrid in RNAP-II show a very similar orientation with respect to their two-DPBB catalytic
core (Fig 8A). However, whereas the 30 end of the RNA primer is only 6 Å distant from the Cαof the catalytic residue D481 in the structure of RNAP-II, the 30 end of the DNA primer is
located about 15 Å from the corresponding catalytic residue in PolD DP2 (D956). In the
PolD–DNA-bound binary complex, the DP2 KH domain prevents the DNA substrate from
coming closer to the DNAP elongation site. This observation suggests that in the elongation
mode, the KH domain would move in order to allow the 30 end of the primer to access the
elongation site, similarly to the finger domain in other families of DNAPs. Comparing the
structure of the KH domain in the DP2 individual crystal structure and the cryo-EM structure
shows that this domain is mobile and moved by about 10 Å between both structures (Fig 3A).
Fig 8. Proposed path for the 30 end of the DNA primer during elongation and proofreading by PolD. (A) Cutaway
front view of PolD showing a comparison of the position of DNA in the cryo-EM structure of PolD (red) and the
nascent RNA/DNA hybrid (green) in the crystal structure of the elongation complex of S. cerevisiae RNAP-II [25]. The
section plane crossing PolD is represented with gray area. The structures of PolD and RNAP-II are superimposed on
their two-DPBB catalytic cores, showing that the nascent DNA duplex in PolD (red) and the nascent RNA/DNA
hybrid in RNAP-II (green) share a similar orientation with respect to their two-DPBB catalytic core. However, in the
structure of PolD, the DP2 KH domain prevents the DNA substrate from coming closer to the DNAP elongation site.
This observation suggests that in the elongation mode, the KH domain would move in order to allow the 30 end of the
primer to access the elongation site, similarly to the finger domain in other families of DNAPs. (B) Same view as in (A)
showing a putative path for the DNA being digested. The helical axis of the DNA duplex is identical to that of the
DNA-bound PolD cryo-EM structure. The 30 end of the DNA primer is extended by approximately 4 nt toward the
exonuclease catalytic site of DP1. A red arrow shows the direction of the hypothetical proofreading backtracking mode
of PolD. (C) Model of the PolD–DNA–PCNA ternary complex. cryo-EM, cryo–electron microscopy; DNAP, DNA
polymerase; DPBB, double-psi β-barrel; KH, K-homology; PCNA, proliferating cell nuclear antigen; PDE,
phosphodiesterase domain; PIP, PCNA-interacting peptide; RFC, replication factor C; RNAP, RNA polymerase.
https://doi.org/10.1371/journal.pbio.3000122.g008
Structure of the DP1–DP2 PolD complex bound with DNA
PLOS Biology | https://doi.org/10.1371/journal.pbio.3000122 January 18, 2019 14 / 28

A straight path leads to the DP1 exonuclease active site
The DP1 nuclease and DP2 polymerase active sites sandwich the 30 end of the nascent DNA
strand and are about 40 Å distant from each other, a feature shared with other replicative
DNAPs [41] (Fig 8B). Although the cryo-EM PolD structure shows no contacts between DP1
and the bound DNA, the exonuclease active site is suitably located to catch the 30 end of the
nascent DNA strand. The phosphate moiety of the 30-terminal nucleotide of the primer lies at
a distance of 25 Å away from the exonuclease active site of DP1, which could be accounted for
by a 4-nt-long ssDNA, a value shared with other DNAPs with proofreading activity [41]. The
structure suggests that the DNA being digested would access the DP1 nuclease active site
through a path that faces the KH-like domain from one side and helix α1’C of clamp-1 from
the other side. Consistently, this path is lined by several basic residues that may stabilize DNA
binding. DNAPs with proofreading activity are able to sense mismatches by contacting the
minor groove of base pairs beyond the insertion site [45–46]. The PolD cryo-EM structure
shows that the Zn-III domain from clamp-1 and loop-I from clamp-2 are intimately interact-
ing with the minor groove of the nascent duplex DNA, suggesting that they may contribute to
sense mismatches (Fig 7).
Modeling of the PolD–PCNA–DNA ternary complex
Replicative DNAPs generally operate in association with a sliding clamp that encircles the
DNA and greatly enhances processivity. PolD has been shown to require the DNA sliding
clamp proliferating cell nuclear antigen (PCNA) for high processivity. The crystal structures of
the P. furiosus PCNA (PDB ID: 1ISQ) [47] (89% identity with P. abyssi PCNA) bound with a
PCNA-interacting peptide (PIP) [48], as well as the crystal structure of the H. sapiens PCNA
bound with DNA [49], have already been reported, thus facilitating modeling of the PolD–
DNA–PCNA ternary complex (Fig 8C). Taking advantage of these crystal structures, we pro-
pose a structural model of the interaction between PolD and PCNA, which is consistent with
former studies showing that PolD binds PCNA through multiple sites located in DP1 and
DP2, including a PIP motif that is hosted in the C terminus of DP2 [50]. Indeed, the model
shows that PolD and PCNA may interact through a wide surface of interactions overlapping
with both DP1 and DP2 subunits and that the C-terminal extremity of DP2, which hosts a PIP
motif (Fig 4B), colocalizes with the PCNA PIP box (Fig 8C). The model rationalizes how
PCNA enhances the processivity of PolD by perpetuating the interactions with the nascent
DNA duplex when it exits the PolD clamp. Binding to PCNA would thus substantially increase
the region of interaction between PolD and the nascent DNA duplex, thereby preventing the
polymerase from falling off prematurely [51].
Shared structural features of RNAPs and PolD active sites
The two-DPBB polymerase superfamily encompasses DNA-dependent RNAPs responsible for
DNA transcription in all forms of cellular life, some viruses, and the eukaryotic RNA-depen-
dent RNAPs (quelling defective phenotype [QDE-1]) involved in gene silencing [16, 52]. PolD
substantially extends the two-DPBB superfamily to DNA-dependent DNAPs. Comparing the
DNA-bound cryo-EM structure of PolD to the many structures of RNAPs enables us to delin-
eate the minimal core of these DNA or RNAPs and discuss the molecular basis for their respec-
tive substrate specificities (Fig 9). Nevertheless, some conclusions cannot be extended to QDE-
1, as its DNA-bound structure is not solved yet [52].
PolD and DNA-dependent RNAPs resemble a claw formed by the heterodimeric assembly
of two subunits, DP1–DP2 for PolD and Rpb1–Rpb2 for S. cerevisiae RNAP-II [25] (Fig 9A
and 9B). Both DNA-binding sites orient the DNA template entry and the nascent duplex exit
Structure of the DP1–DP2 PolD complex bound with DNA
PLOS Biology | https://doi.org/10.1371/journal.pbio.3000122 January 18, 2019 15 / 28

Fig 9. Structure-based comparison of PolD and two-DPBB RNAPs. (A) Shared structural elements between P. abyssi(“P.ab”) PolD and S. cerevisiae (“S.ce”) RNAP-II (PDB ID: 2E2I [25]). The structures of PolD and RNAP-II are aligned
with respect to their two-DPBB catalytic core. Black arrows indicate the DNA template entry site in both PolD and
RNAP-II active sites. DPBBs are colored in blue, with the last β strand of DPBB-1 (or DPBB-B) and the first β strand of
DPBB-2 (or DPBB-A) colored orange. The conserved DPBB-connecting loop (purple) and template-binding helix
(yellow) are also shown. The clamp-2 domain of PolD and the clamp domain of RNAP-II are depicted with a white
backbone trace. The conserved αGGα motif of the PolD KH-like domain and the bridge helix of RNAP-II occupy the
same location with respect to the nascent duplex. Zn-binding domains and Mg2+ ions are depicted with blue and cyan
spheres, respectively. (B) Enlarged view of the shared structural elements between PolD and RNAP-II. (C) Genetic
organization of these shared structural elements in PolD, DNA-dependent RNAPs, and QDE-1. dGTP, deoxyguanosine
triphosphate; DPBB, double-psi β-barrel; dsDNA, double-stranded DNA; KH, K-homology; QDE-1, quelling defective
phenotype; RNAP, RNA polymerase; ssDNA, single-stranded DNA.
https://doi.org/10.1371/journal.pbio.3000122.g009
Structure of the DP1–DP2 PolD complex bound with DNA
PLOS Biology | https://doi.org/10.1371/journal.pbio.3000122 January 18, 2019 16 / 28

in a same relative axis with respect to the two-DPBB catalytic core. The common architecture
of their two-DPBB catalytic core is underpinned by the conservation of two invariant catalytic
aspartic residues and two critical lysine residues, which have been shown to stabilize the 30 end
of the nascent RNA strand in DNA-dependent RNAPs (S4 Fig) [15]. Comparing the architec-
ture of their DNA-binding sites extends the structural elements that are conserved among the
two-DPBB superfamily beyond their canonical two DPBBs. First, PolD shares with its RNAPs
counterparts an α helix that is part of a hybrid-binding domain in DNA-dependent RNAPs.
This helix is connected to the N-terminal end of DPBB-1 (DPBB-B, in DNA-dependent
RNAPs) and shares a similar orientation with respect to the two-DPBB catalytic core and the
nascent duplex. This helix hosts two well-conserved basic residues (P. abyssi DP2 K329, R338
and S. cerevisiae Rpb2 R766, K775). The side chain of K775 interacts with the phosphate back-
bone of the nascent RNA strand in the ternary complex structure of yeast RNAP-II. The con-
served location of the Cα of R338 in the active site of PolD suggests that it is also involved in
interacting with the DNA template. Second, PolD and two-DPBB polymerases share a loop
that emanates from the C-terminal end of DPBB-1 (DPBB-B, in DNA-dependent RNAPs) and
is connected to the adjacent DPBB through secondary structure interactions. In DNA-bound
structures of both PolD and DNA-dependent RNAPs, this loop (hereafter named DPBB-con-
necting loop) hosts several well-conserved basic residues that contribute to the duplex-binding
cleft. Indeed, DP2 R659, K661 residues occupy equivalent positions to the S. cerevisiae Rpb2
R1096, K1102, which bind the minor groove of the nascent RNA–DNA hybrid duplex. Third,
both PolD and DNA-dependent RNAPs evolved a DNA-binding clamp domain, which occu-
pies the same relative location with respect to the two-DPBB active site. In both enzymes,
clamp domains host several loops that participate in binding the nascent DNA–DNA or
RNA–DNA duplex and several zinc-binding domains (Zn-I and Zn-II domains in PolD; Zn-7,
Zn-8, and Zn-6 in S. cerevisiae RNAP-II), which stabilize the loop-rich clamp domains.
Whereas these clamps do not share sequence motifs, Zn-I of PolD and Zn-7 of RNAP-II share
the same topology, which is conserved in all eukaryotic/archaeal DNA-dependent RNAPs.
These structural elements are clustered in a region of their primary sequence that encompasses
the two DPBBs (Fig 9C). Although these structural elements are carried on a single chain in
PolD and QDE-1, these structural elements are hosted by two different subunits in multisubu-
nit RNAPs, clustered at the C-terminal end of Rpb2 and the N-terminal end of Rpb1 in S. cere-visiae RNAP-II. This observation suggests that although all these two-DPBB polymerases share
a conserved ancestor, diversification and complexification may have resulted in a scission of
the minimal catalytic core of multisubunit RNAPs into two separate genes.
Comparing these structures also documents how this minimal catalytic core has recruited
different domains in order to adapt to their biological functions. As an example, DNA-depen-
dent RNAPs involved in DNA transcription have evolved the lid domain (absent in PolD and
QDE-1), which is inserted in DPBB-B, to prevent the formation of an extended upstream
RNA–DNA hybrid. In PolD, two ancestral ssDNA binding domains, OB and KH-like, have
been recruited for DNA replication to guide the DNA template into the active sites. Compar-
ing PolD with two-DPBBs also reveals structural determinants that are specific to DNAPs ver-
sus RNAPs. The catalytic site of all two-barrel RNAPs is characterized by two catalytic Mg2+
that are coordinated by 4 invariant aspartic residues (479DFDGD483 in RPB1 and D837 in
RPB2 in S. cerevisiae RNAP-II) [53] (S4 Fig). Only two aspartic residues are strictly conserved
in PolD: 956DGD958, respectively corresponding to 481DGD483 in S. cerevisiae RPB1, possi-
bly explaining why no density accounting for the presence of Mg2+ has been observed so far in
the active site of PolD, neither in the DNA-bound PolD cryo-EM structure nor in the DP2
individual crystal structure. Phosphates of the incoming nucleotide may thus be required in
order to bind the two catalytic magnesium ions in the active site, as observed for other DNAPs
Structure of the DP1–DP2 PolD complex bound with DNA
PLOS Biology | https://doi.org/10.1371/journal.pbio.3000122 January 18, 2019 17 / 28

[46]. Although conserved in all two-DPBB RNAPs [18, 54], the bridge helix is notably absent
in PolD. Instead, the DNA template seems to be guided in the active site of PolD by a KH-like
domain (Fig 9A and 9B). Both the bridge helix in RNAPs and the KH-like domain of PolD dis-
play a canonic motif of residues that are colocalized with respect to the DNA substrate, sug-
gesting that they may play a similar role in guiding the DNA substrate into the active site (Fig
9B).
Discussion
Although behaving in all aspects like a true polymerase involved in DNA replication, PolD dif-
fers structurally from all other known DNAPs [9–11]. First, the PolD two-DPBB catalytic core
differs from both Klenow-like and Polβ-like folds found in all other families of DNAPs. Sec-
ond, the Mre11-like DP1 nuclease differs from the DnaQ-like exonuclease domains found in
most DNAPs showing proofreading activity [55]. Indeed, PDE domains are encountered in a
wide range of hydrolases, but their dedication to DNAP-associated proofreading is specific to
PolD. Third, the clamp and KH-like DNA-binding domains of PolD are structurally distinct
from the palm, thumb, and finger domains of other DNAPs. The DNA-bound native PolD
cryo-EM structure reveals for the first time how domains—up to now never observed as being
involved in DNA replication, to our knowledge—collaborate together to form a DNA-binding
site. The PolD native cryo-EM structure provides a structural rationale to explain why the
association between DP1 and DP2 is required to rearrange the DP2 catalytic core in its active
conformation to clamp the DNA duplex and to orient efficiently the DP1 proofreading active
site with respect to the DNA substrate.
Comparing the structures of their DNA-binding sites enabled us to delineate a minimal cat-
alytic core that is shared by all two-DPBB polymerases. This minimal core is remarkably versa-
tile and is found to be associated to a wide range of structurally distinct DNA-binding
domains, which contribute to the wide range of substrate specificities (DNA dependent or
RNA dependent), activities (RNA and DNAPs), and functions (DNA transcription, replica-
tion, gene silencing) exhibited by two-DPBB polymerases. Two-DPBB cores share a common
ancestor, which may have been endowed with nucleotide polymerization in early forms of life.
The ability of this catalytic core to acquire novel nucleotide polymerization activities, like
DNA replication and DNA transcription, may have facilitated RNA-world/DNA-world transi-
tion. We hypothesize that a two-DPBB ancestor was present and functional as an RNA repli-
case in an RNA world. The versatility of the two-DPBB fold may have allowed DNA
replication and transcription to jointly evolve from a common catalytic core rather than being
invented separately.
Eukaryotic replicative DNAPs show a complex relationship with their archaeal ancestors,
including contributions from both the B- and D-families of archaeal polymerases. In addition
to their catalytic subunit (A), all eukaryotic replicative DNAPs possess a regulatory B subunit.
Bioinformatic predictions [56] and structural [15] studies have shown that DP1 is the ancestor
of the B-subunits of eukaryotic multimeric DNAPs, which, however, lost the nuclease catalytic
residues [56]. During evolution, the D-family DP2 catalytic core was replaced by a B-family
catalytic core in all eukaryotic replicative DNAPs, which are thus chimeric with respect to
their archaeal homologues (Fig 10). In addition, PolD and eukaryotic DNAPs share a con-
served domain located in the C-terminal region of their catalytic subunits, which is dedicated
to interacting with their DP1 or B subunit, respectively. The cryo-EM structure of PolD and
crystal structures of the CTD/B-subunit complexes of Polα and Polε show a well-conserved
Zn-binding domain (Zn-III in PolD, Zn-2 in eukaryotic DNAPs) that snugly fits a docking site
located at the OB/PDE interface and a helical bundle that interacts with the PDE domain.
Structure of the DP1–DP2 PolD complex bound with DNA
PLOS Biology | https://doi.org/10.1371/journal.pbio.3000122 January 18, 2019 18 / 28
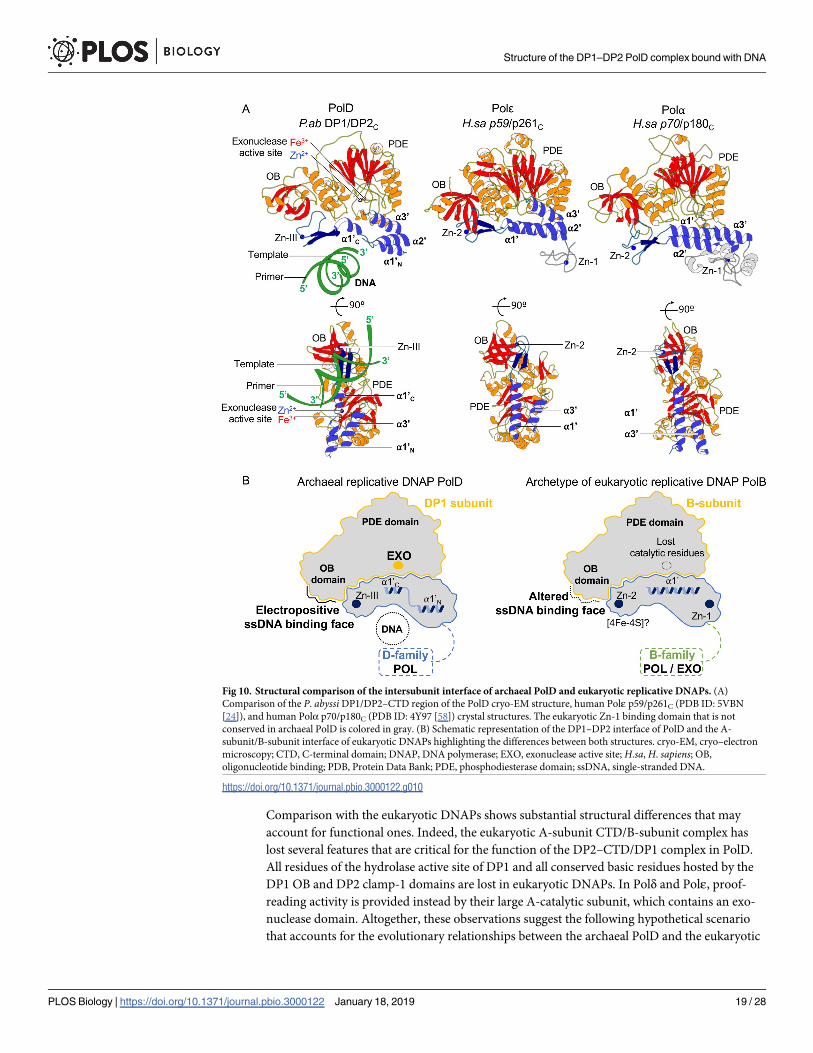
Comparison with the eukaryotic DNAPs shows substantial structural differences that may
account for functional ones. Indeed, the eukaryotic A-subunit CTD/B-subunit complex has
lost several features that are critical for the function of the DP2–CTD/DP1 complex in PolD.
All residues of the hydrolase active site of DP1 and all conserved basic residues hosted by the
DP1 OB and DP2 clamp-1 domains are lost in eukaryotic DNAPs. In Polδ and Polε, proof-
reading activity is provided instead by their large A-catalytic subunit, which contains an exo-
nuclease domain. Altogether, these observations suggest the following hypothetical scenario
that accounts for the evolutionary relationships between the archaeal PolD and the eukaryotic
Fig 10. Structural comparison of the intersubunit interface of archaeal PolD and eukaryotic replicative DNAPs. (A)
Comparison of the P. abyssi DP1/DP2–CTD region of the PolD cryo-EM structure, human Polε p59/p261C (PDB ID: 5VBN
[24]), and human Polα p70/p180C (PDB ID: 4Y97 [58]) crystal structures. The eukaryotic Zn-1 binding domain that is not
conserved in archaeal PolD is colored in gray. (B) Schematic representation of the DP1–DP2 interface of PolD and the A-
subunit/B-subunit interface of eukaryotic DNAPs highlighting the differences between both structures. cryo-EM, cryo–electron
microscopy; CTD, C-terminal domain; DNAP, DNA polymerase; EXO, exonuclease active site; H.sa, H. sapiens; OB,
oligonucleotide binding; PDB, Protein Data Bank; PDE, phosphodiesterase domain; ssDNA, single-stranded DNA.
https://doi.org/10.1371/journal.pbio.3000122.g010
Structure of the DP1–DP2 PolD complex bound with DNA
PLOS Biology | https://doi.org/10.1371/journal.pbio.3000122 January 18, 2019 19 / 28
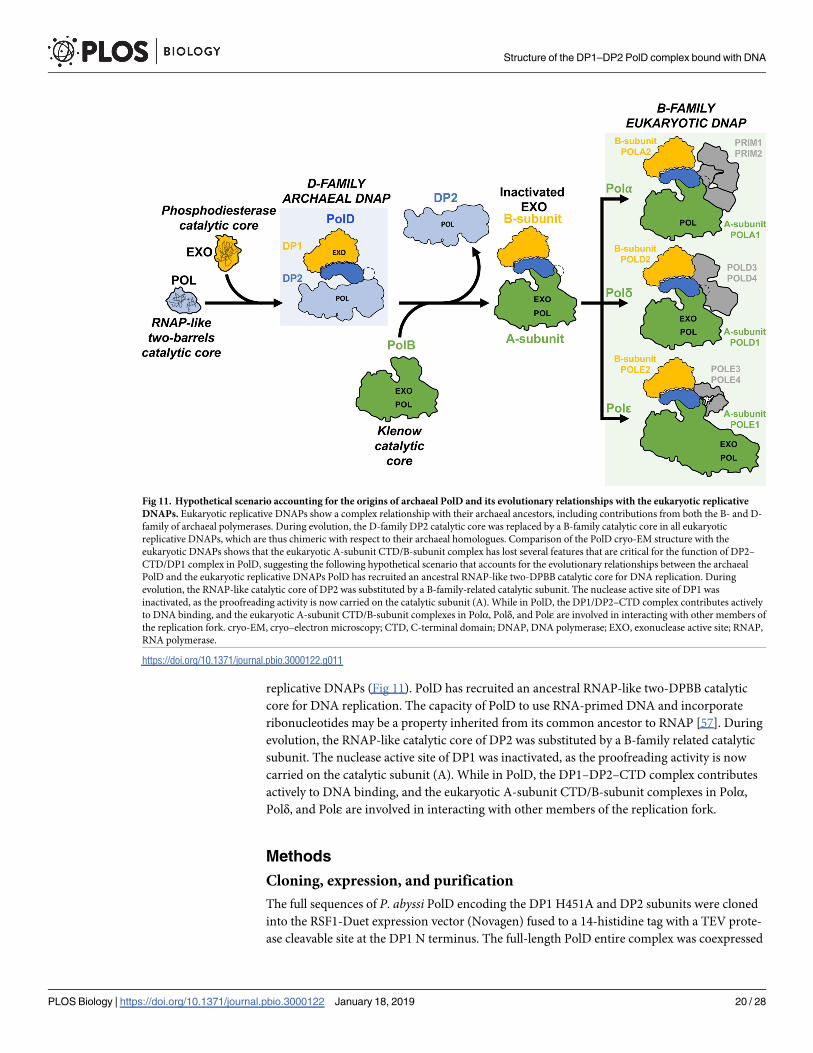
replicative DNAPs (Fig 11). PolD has recruited an ancestral RNAP-like two-DPBB catalytic
core for DNA replication. The capacity of PolD to use RNA-primed DNA and incorporate
ribonucleotides may be a property inherited from its common ancestor to RNAP [57]. During
evolution, the RNAP-like catalytic core of DP2 was substituted by a B-family related catalytic
subunit. The nuclease active site of DP1 was inactivated, as the proofreading activity is now
carried on the catalytic subunit (A). While in PolD, the DP1–DP2–CTD complex contributes
actively to DNA binding, and the eukaryotic A-subunit CTD/B-subunit complexes in Polα,
Polδ, and Polε are involved in interacting with other members of the replication fork.
Methods
Cloning, expression, and purification
The full sequences of P. abyssi PolD encoding the DP1 H451A and DP2 subunits were cloned
into the RSF1-Duet expression vector (Novagen) fused to a 14-histidine tag with a TEV prote-
ase cleavable site at the DP1 N terminus. The full-length PolD entire complex was coexpressed
Fig 11. Hypothetical scenario accounting for the origins of archaeal PolD and its evolutionary relationships with the eukaryotic replicative
DNAPs. Eukaryotic replicative DNAPs show a complex relationship with their archaeal ancestors, including contributions from both the B- and D-
family of archaeal polymerases. During evolution, the D-family DP2 catalytic core was replaced by a B-family catalytic core in all eukaryotic
replicative DNAPs, which are thus chimeric with respect to their archaeal homologues. Comparison of the PolD cryo-EM structure with the
eukaryotic DNAPs shows that the eukaryotic A-subunit CTD/B-subunit complex has lost several features that are critical for the function of DP2–
CTD/DP1 complex in PolD, suggesting the following hypothetical scenario that accounts for the evolutionary relationships between the archaeal
PolD and the eukaryotic replicative DNAPs PolD has recruited an ancestral RNAP-like two-DPBB catalytic core for DNA replication. During
evolution, the RNAP-like catalytic core of DP2 was substituted by a B-family-related catalytic subunit. The nuclease active site of DP1 was
inactivated, as the proofreading activity is now carried on the catalytic subunit (A). While in PolD, the DP1/DP2–CTD complex contributes actively
to DNA binding, and the eukaryotic A-subunit CTD/B-subunit complexes in Polα, Polδ, and Polε are involved in interacting with other members of
the replication fork. cryo-EM, cryo–electron microscopy; CTD, C-terminal domain; DNAP, DNA polymerase; EXO, exonuclease active site; RNAP,
RNA polymerase.
https://doi.org/10.1371/journal.pbio.3000122.g011
Structure of the DP1–DP2 PolD complex bound with DNA
PLOS Biology | https://doi.org/10.1371/journal.pbio.3000122 January 18, 2019 20 / 28

by 1 mM IPTG induction in E. coli strain BL21 (DE3) Rosetta2 grown overnight in Lysogeny
broth (LB) at 20˚C and copurified by Ni-NTA and heparin chromatography (GE Healthcare),
followed by TEV cleavage of the tag and size-exclusion chromatography. The purified PolD
was concentrated to 2 mg/ml in 20 mM Tris HCl (pH 8), 200 mM NaCl, 3 mM MgCl2 storage
buffer. PolD was flash-frozen in liquid nitrogen and stored at −80˚C. DP2 (1–1061), the DP1
(144–619)–DP2 (1096–1195) complex, and DP1 H451A (144–619) were expressed and puri-
fied as previously described [15].
Analytical ultracentrifugation assays
Sedimentation velocity experiment was performed with a Beckman Coulter XL-I analytical
ultracentrifuge (Beckman Coulter, Indianapolis, IN, USA) with an An-60 Ti rotor at 20˚C.
The PolD complex at a concentration of 0.2, 0.5, and 1 mg/ml was centrifuged at 42,000 rpm
in 12-mm double-sector epoxy centerpieces. Detection of the protein was performed both by
absorbance at 280 nm and interferometry, and the ProteomeLab software (Beckman Coulter,
Indianapolis, IN, USA) was used to monitor the experiment. Four hundred scans were col-
lected at 3-min intervals with a radial step size of 0.003 cm. Profiles were analyzed using the
continuous (s) distribution model of the software Sedfit [59]. The partial specific volume of the
protein and the viscosity and density of the buffer at 20˚C were theoretically calculated with
the software Sednterp (Spin Analytical, Berwick, ME, USA).
Biochemical primer-elongation assays
Oligonucleotides. Nucleotide sequences of the DNA substrates were inspired by Jokela
and colleagues [60]: a 24-mer DNA primer (50-ACGCCAGGCTTCGCCAGTCACGAC-30)
and a 60-mer DNA template (50-GCGGACTGCGATCGTACCTACGGACCTGCAGCTGA
CGTCGTGACTGGCGAAGCCTGGCGT-30). DNA primers were 50-labeled with 32P, and the
DNA duplex was annealed as described previously [15].
Activity tests. Five-micrometer native full-length DP1–DP2 PolD and 50-μM DP2(1–
1061), 50 nM DNA duplex, 25 mM Tris HCl (pH 7.6), 25 mM NaCl, and 2 mM MgCl2 in pres-
ence of 200 nM dNTPs were incubated at 55˚C for 1, 5, and 10 min. All reactions were stopped
by adding formamide. Samples were run through a 15% acrylamide–8 M urea sequencing gel
and revealed using a PhosphorImager Storm 860 (Fujifilm).
DNA-binding assays by steady-state fluorescence anisotropy
Oligonucleotides. DNA substrates were obtained by mixing equimolar amounts of com-
plementary strands (hexachlorofluorescein [HEX]-labeled DNA template: 30-GCGGCCCGGC
TCGGCACGTGCTGGA-50-HEX, mixed with the DNA primer: 50-CGCCGGGCCGAGCC
GTGC-30, or the full complementary: 50-CGCCGGGCCGAGCCGTGCACGACCT-30) in 20
mM Tris HCl (pH 8), 300 mM NaCl, and 1 mM EDTA and by heating at 95˚C for 5 min, fol-
lowed by slow cooling to room temperature.
DNA-binding assays. The binding of 30-HEX-labeled DNA substrates by PolD and DP2
(1–1061) was determined by measuring the steady-state fluorescence anisotropy parameter
using a spectrofluorometer equipped with polarizers (FL920, Edinburgh Instruments, Living-
ston, UK) in a cell thermostatically held at 25˚C. The excitation and emission wavelengths
were adjusted to 525 nm (2-nm bandpass) and 555 nm (20-nm bandpass), respectively. Titra-
tions were performed in 20 mM sodium-succinate (pH 6), 100 mM NaCl by increasing con-
centrations of PolD up to 600 nM and DP2 (1–1061) up to 6 μM, to 5 nM of HEX-labeled
DNA template. Details about steady-state fluorescence anisotropy calculation are mentioned
in S1 Text.
Structure of the DP1–DP2 PolD complex bound with DNA
PLOS Biology | https://doi.org/10.1371/journal.pbio.3000122 January 18, 2019 21 / 28

Sample preparation for cryo-EM
DNA duplex annealing. A unit of 100 μM of template: 50-ACTTTGACGCGGCCCGT
CTC-30 was mixed with 100 μM of primer: 50-GAGACGGGCCGCGTC-30 in the annealing
buffer: 20 mM Tris HCl (pH 8), 10 mM MgCl2, and 1 mM EDTA; incubated for 5 min at
95˚C; and slowly cooled to room temperature. The duplex is formed by a 15-bp primed DNA
substrate with a 5-nt overhang mimicking a replicated strand.
Grid preparation. The PolD protein complex (2 μM) was incubated for 10 min at 4˚C
with 3 μM of DNA before the samples were pipetted onto glow-discharged holey carbon cryo-
EM grids (C-flat Cu 1.2/1.3, 300 mesh, Thick) and frozen in liquid ethane by using a Vitrobot
Mark IV (ThermoFischer) at 100% humidity, 22˚C temperature, and blotting time of 2 s.
Cryo-EM data collection and image processing
Images of PolD in complex with DNA were collected using the EPU software on a Titan Krios
electron microscope (ThermoFischer) operated at 300 kV and equipped with a K2 summit
direct electron detector (Gatan, Pleasanton, CA) and a Bioquantum energy filter with 20-eV
slit. Data were collected in single-electron counting mode at a nominal magnification of
105.000× (1.36 Å/pixel). The defocus range was set between −1 and −3 μm with a total dose of
60 electrons per Å2 over a total of 60 frames. The dose rate on the K2 camera was 4.729 e/
pixel/s and the exposure time 24 s. Movie frame alignment with dose weighting and contrast
transfer function (CTF) estimation was performed on the fly using a Scipion suite. Particle
picking was performed using RELION-2.1.0 [22]; however, all subsequent classifications, gen-
eration of initial model, and 3D refinement are done using CryoSPARC-0.6.5. As illustrated in
Fig 1C, about 200,000 particles were picked from 952 micrographs. Four rounds of referenced
2D alignments and classifications (25 iterations) were carried out. The 2D references were iter-
atively improved between the rounds. After four rounds of 2D classifications, spurious parti-
cles were removed to yield an overall dataset of 74,674 particles. The 74,674 particles from
good 2D classes were selected for the unsupervised 3D classification using three classes, and
three distinct groups of particles were identified: two groups representing the PolD complex
without DNA and the third group (15.285) representing the PolD complex with DNA. The
two first groups showed preferential orientation of the particles, whereas the third DNA-
bound group showed a balanced angular distribution of the particles (S5 Fig). No structurally
distinct groups of PolD emerged from subsequent 3D classifications, and the density corre-
sponding to DNA is unequally well resolved from one subset of particles to the other, thereby
suggesting partial occupancy and/or some flexibility of the DNA. The best density was
obtained from a subset of 8,774 particles isolated from iterative 3D classifications, yielding to a
density map at an overall resolution of 7.1 Å (Fig 1C and S1 Table). This 8,774-particle subset
emerged from a previous 3D class (15,282 particles) that could be refined to 6.7 Å. Whereas
this model displays a slightly higher resolution, the density corresponding to DNA is weaker,
so it will not be discussed further. The overall resolution was estimated using the gold-standard
FSC = 0.143 criterion. B-factor sharpening was performed using automatic procedures in
CryoSPARC-v0.6.5 [23] (S1 Table). Local resolution for map was estimated by CryoSPARC-
v0.6.5 [23].
Building and refinement of the cryo-EM model
Individual crystal structures were manually placed in the cryo-EM maps and subsequently
rigid-body fitted in the density using Coot [26, 61]. To ensure that the H451A mutation does
not alter the structure of the DP1 subunit, the structure of the DP1 H451A (144–622) proof-
reading-deficient variant was solved using X-ray crystallography at 2.6-Å resolution. Neither
Structure of the DP1–DP2 PolD complex bound with DNA
PLOS Biology | https://doi.org/10.1371/journal.pbio.3000122 January 18, 2019 22 / 28

the overall structure nor the coordination of the catalytic metal ions is altered in the DP1 H451
crystal structure (S2 Fig). The P. abyssi DP1 H451A (144–622) and P. abyssi DP2 (1–1061)
(PDB ID: 5IJL [15]) crystal structures were divided into domains and subdomains to improve
the precision of fitting. The DP1–DP2 rigid-body groups are listed in S6 Fig. Several densities
not covered by the crystal structures were observed in the catalytic core of DP2 and at the
interface between DP1 and DP2 subunits. The C-terminal region of DP2 (1090–1195) dedi-
cated to interaction with DP1 was built by homology modeling with the CTD of the catalytic
subunit of human Polε [24] (PDB ID: 5VBN) using Phyre [36]. The model was first to be
rigid-body refined into the cryo-EM map and subsequently adjusted using modeling tools in
Coot [26]. Several structural elements of the DP2 subunits that were not covered by the former
DP2 (1–1061) crystal structure were built guided by the homology with the structure of yeast
RNAP-II (PDB ID: 2E2I [25]). In addition, two α helices, α14 (324–338) and α43 (1074–1089),
were built de novo in the cryo-EM density. The 15-mer/16-mer primer/template duplex B-
form DNA was generated with Coot [26] and docked in the electron density, guided by the
unambiguous density for the duplex region, showing minor and major grooves. No clear den-
sity is observed for the four 50-terminal nucleotides of the template ssDNA, which were not
included in the model. Details about the 3D model reconstructions are shown in Fig 2. All side
chains of DP1 and most side chains of DP2 (86%) were deduced from the existing crystal
structures; the others were modeled according to the most likely rotamers. The model was
real-space refined using Phenix [62], with a high weight on ideal geometry and restraints on
secondary structures (S1 Table). The final map correlation coefficient is 0.803.
Structure determination of the DP1 H451A proofreading-deficient variant
by X-ray crystallography
The structure of the DP1 H451A variant was determined by X-ray crystallography at 2.6 Å, fol-
lowing a similar procedure as that used for the wild-type DP1 crystal structure [15]. Details
about crystallization, structure determination, model building, and refinement of the DP1
H451A variant are mentioned in S2 Text and S2 Table.
Supporting information
S1 Table. Values of cryo-EM data collection and 3D reconstruction. Cryo-EM, cryo–elec-
tron microscopy.
(DOCX)
S2 Table. Data collection and refinement statistics. aNumbers in parentheses refer to the
highest-resolution shell. bCC1/2 = percentage of correlation between intensities from random
half-datasets. cCalculated with MolProbity.
(DOCX)
S1 Text. Details on anisotropy and Kd calculations for the DNA-binding assays by steady-
state fluorescence anisotropy.
(DOCX)
S2 Text. Details on the structure determination of the DP1 H451A proofreading-deficient
variant by X-ray crystallography.
(DOCX)
S1 Fig. FSC curves and local resolutions. (A) Gold-standard FSC curve calculated from
CryoSPARC-0.6.5 for the map of the DNA-bound PolD showing no significant overfitting.
Resolution is reported at FSC = 0.143. (B) Local resolution map of the DNA-bound PolD
Structure of the DP1–DP2 PolD complex bound with DNA
PLOS Biology | https://doi.org/10.1371/journal.pbio.3000122 January 18, 2019 23 / 28

calculated from CryoSPARC-0.6.5. Surfaces are colored according to the resolution scale
(right). The most resolved regions of the maps (local resolution around 5 Å) are the exonucle-
ase and polymerase catalytic cores of the DP1 and DP2 subunits. FSC, Fourier shell correla-
tion.
(DOCX)
S2 Fig. Crystal structure of the proofreading-deficient H451A DP1 variant. (A) Compari-
son of the nuclease active sites of DP1 wild type (PDB ID: 5IHE) (left) and the proofreading
DP1 H451A variant (PDB ID: 6HMF, this study) (right). Whereas H451 is a critical catalytic
residue acting as a proton donor, the H451A mutation does not alter the binding of the diva-
lent catalytic metals. The blue mesh shows the 2Fo-Fc electron density map contoured at 8.0 σ.
(B) Superimposition of the DP1 wild-type (black) and DP1 H451A (yellow) overall structures.
Both structures can be superimposed over 440 Cα with an r.m.s.d. of 0.079 Å. PDB, Protein
Data Bank; r.m.s.d., root-mean-square deviation.
(DOCX)
S3 Fig. Purification of the DP1ΔN(144–619)–DP2CTD(1096–1195) complex. (A) Gel-filtra-
tion chromatogram for the DP1ΔN (144–619)/DP2CTD (1096–1195) complex. (B) Fractions
from the major peak of the gel filtration shown in (A) were subjected to SDS-PAGE and Coo-
massie blue staining. CTD, C-terminal domain; M, molecular weight markers.
(DOCX)
S4 Fig. Structure-based alignment of the shared structural elements within the catalytic
cores of PolD, DNA-dependent RNA polymerases, and RNA-dependent RNA polymer-
ases. The sequences are denoted by the polymerase name and the abbreviated species names.
The shared secondary structure elements are shown above the alignment; H indicates α helix,
B indicates β strand, and L indicates loop. Yellow boxes highlight hydrophobic residues, green
boxes highlight hydrophilic residues, and red boxes highlight catalytic motifs and metal ion–
binding motifs. Regions of PolD that were built using homology modeling against the struc-
tures of DNA-dependent RNA polymerases are highlighted by a blue box. A, Archaeoglobus; E,
Escherichia; H, Haloferax; K, Korarchaeum; Loki, Cand. Lokiarchaeon; M, Methanomassiliicoc-cus; N, Neurospora; P, Pyrococcus; S, Saccharomyces; S. shibatae, Sulfolobus shibatae; T, Ther-mococcus.(DOCX)
S5 Fig. Image processing of the cryo-EM 3D reconstruction of PolD. Workflow showing the
evolution of the direction distributions along the iterative 3D classifications. Particles compos-
ing each class have been 2D classified. The 2D classification (selected 2D class averages are
indicated), ab initio initial model reconstruction, 3D classification, refinement, and map
sharpening are performed in CryoSPARC-0.6.5. DP1 and DP2 volumes are respectively repre-
sented in yellow and blue. The DNA duplex volume is represented in coral. cryo-EM, cryo–
electron microscopy.
(DOCX)
S6 Fig. List of rigid-body groups used for real-space refinement. (A) Crystal structures were
divided into rigid-body groups in order to improve the precision of the fitting. Rigid-body
groups were used for fitting and refining the DP1 and DP2 crystal structures in the cryo-EM
map. (B) Different views of PolD showing the different rigid-body groups used during refine-
ment. cryo-EM, cryo–electron microscopy.
(DOCX)
Structure of the DP1–DP2 PolD complex bound with DNA
PLOS Biology | https://doi.org/10.1371/journal.pbio.3000122 January 18, 2019 24 / 28

S1 Data.
(XLSX)
Acknowledgments
We wish to thank Rafael Navaza (Institut Pasteur, Paris, France) and Bjorn Forsberg (Scilife-
Lab, Stockholm, Sweden) for help with cryo-EM data analysis. In addition we would like to
thank Francois Bontems (Institut Pasteur, Paris, France) for help with the initial negative-stain
electron microscopy data analysis and Jeril Degrouard (Laboratoire de Physique du Solide,
Orsay, France) for help with preparing the samples.
Author Contributions
Conceptualization: Pierre Raia, Ludovic Sauguet.
Funding acquisition: Marc Delarue.
Investigation: Pierre Raia, Marta Carroni, Etienne Henry, Gerard Pehau-Arnaudet, Sebastien
Brule, Pierre Beguin, Ghislaine Henneke, Erik Lindahl.
Methodology: Ludovic Sauguet.
Resources: Marc Delarue.
Supervision: Ghislaine Henneke, Marc Delarue, Ludovic Sauguet.
Writing – original draft: Pierre Raia.
Writing – review & editing: Ludovic Sauguet.
References1. Kornberg A, Baker TA. DNA Replication. Sausalito, CA: University Science Books; 2005.
2. Patel PH, Loeb LA. Getting a grip on how DNA polymerases function. Nat Struct Biol. 2001 Aug; 8
(8):656–9. https://doi.org/10.1038/90344 PMID: 11473246
3. Braithwaite DK, Ito J. Compilation, alignment, and phylogenetic relationships of DNA polymerases.
Nucleic Acids Res. 1993 Feb 25; 21(4):787–802. PMID: 8451181
4. Delarue M, Poch O, Tordo N, Moras D, Argos P. An attempt to unify the structure of polymerases. Pro-
tein Eng. 1990 May; 3(6):461–7. PMID: 2196557
5. Hogg M, Osterman P, Bylund GO, Ganai RA, Lundstrom E-B, Sauer-Eriksson AE, et al. Structural
basis for processive DNA synthesis by yeast DNA polymerase ε. Nat Struct Mol Biol. 2014 Jan; 21
(1):49–55. https://doi.org/10.1038/nsmb.2712 PMID: 24292646
6. Evans RJ, Davies DR, Bullard JM, Christensen J, Green LS, Guiles JW, et al. Structure of PolC reveals
unique DNA binding and fidelity determinants. Proc Natl Acad Sci U S A. 2008 Dec 30; 105(52):20695–
700. https://doi.org/10.1073/pnas.0809989106 PMID: 19106298
7. Wing RA, Bailey S, Steitz TA. Insights into the replisome from the structure of a ternary complex of the
DNA polymerase III alpha-subunit. J Mol Biol. 2008 Oct 17; 382(4):859–69. https://doi.org/10.1016/j.
jmb.2008.07.058 PMID: 18691598
8. Imamura M, Uemori T, Kato I, Ishino Y. A non-alpha-like DNA polymerase from the hyperthermophilic
archaeon Pyrococcus furiosus. Biol Pharm Bull. 1995 Dec; 18(12):1647–52. PMID: 8787781
9. Ishino Y, Komori K, Cann IK, Koga Y. A novel DNA polymerase family found in Archaea. J Bacteriol.
1998 Apr; 180(8):2232–6. PMID: 9555910
10. Greenough L, Kelman Z, Gardner AF. The roles of family B and D DNA polymerases in Thermococcus
species 9˚N Okazaki fragment maturation. J Biol Chem. 2015 May 15; 290(20):12514–22. https://doi.
org/10.1074/jbc.M115.638130 PMID: 25814667
11. Henneke G, Flament D, Hubscher U, Querellou J, Raffin J-P. The hyperthermophilic euryarchaeota
Pyrococcus abyssi likely requires the two DNA polymerases D and B for DNA replication. J Mol Biol.
2005 Jul 1; 350(1):53–64. https://doi.org/10.1016/j.jmb.2005.04.042 PMID: 15922358
Structure of the DP1–DP2 PolD complex bound with DNA
PLOS Biology | https://doi.org/10.1371/journal.pbio.3000122 January 18, 2019 25 / 28

12. Berquist BR, DasSarma P, DasSarma S. Essential and non-essential DNA replication genes in the
model halophilic Archaeon, Halobacterium sp. NRC-1. BMC Genet. 2007 Jun 8; 8:31. https://doi.org/
10.1186/1471-2156-8-31 PMID: 17559652
13. Cubonova L, Richardson T, Burkhart BW, Kelman Z, Connolly BA, Reeve JN, et al. Archaeal DNA poly-
merase D but not DNA polymerase B is required for genome replication in Thermococcus kodakarensis.
J Bacteriol. 2013 May; 195(10):2322–8. https://doi.org/10.1128/JB.02037-12 PMID: 23504010
14. Castelle CJ, Banfield JF. Major New Microbial Groups Expand Diversity and Alter our Understanding of
the Tree of Life. Cell. 2018 Mar 8; 172(6):1181–97. https://doi.org/10.1016/j.cell.2018.02.016 PMID:
29522741
15. Sauguet L, Raia P, Henneke G, Delarue M. Shared active site architecture between archaeal PolD and
multi-subunit RNA polymerases revealed by X-ray crystallography. Nat Commun. 2016 Aug 22;
7:12227. https://doi.org/10.1038/ncomms12227 PMID: 27548043
16. Ruprich-Robert G, Thuriaux P. Non-canonical DNA transcription enzymes and the conservation of two-
barrel RNA polymerases. Nucleic Acids Res. 2010 Aug; 38(14):4559–69. https://doi.org/10.1093/nar/
gkq201 PMID: 20360047
17. Iyer LM, Koonin EV, Aravind L. Evolutionary connection between the catalytic subunits of DNA-depen-
dent RNA polymerases and eukaryotic RNA-dependent RNA polymerases and the origin of RNA poly-
merases. BMC Struct Biol. 2003 Jan 28; 3:1. https://doi.org/10.1186/1472-6807-3-1 PMID: 12553882
18. Werner F, Grohmann D. Evolution of multisubunit RNA polymerases in the three domains of life. Nat
Rev Microbiol. 2011 fevrier; 9(2):85–98. https://doi.org/10.1038/nrmicro2507 PMID: 21233849
19. Lehmann E, Brueckner F, Cramer P. Molecular basis of RNA-dependent RNA polymerase II activity.
Nature. 2007 Nov 15; 450(7168):445–9. https://doi.org/10.1038/nature06290 PMID: 18004386
20. Fouqueau T, Blombach F, Werner F. Evolutionary Origins of Two-Barrel RNA Polymerases and Site-
Specific Transcription Initiation. Annu Rev Microbiol. 2017 Sep 8; 71:331–48. https://doi.org/10.1146/
annurev-micro-091014-104145 PMID: 28657884
21. Palud A, Villani G, L’Haridon S, Querellou J, Raffin J-P, Henneke G. Intrinsic properties of the two repli-
cative DNA polymerases of Pyrococcus abyssi in replicating abasic sites: possible role in DNA damage
tolerance? Mol Microbiol. 2008 Nov; 70(3):746–61. https://doi.org/10.1111/j.1365-2958.2008.06446.x
PMID: 18826407
22. Kimanius D, Forsberg BO, Scheres SH, Lindahl E. Accelerated cryo-EM structure determination with
parallelisation using GPUs in RELION-2. eLife. 2016 Nov 15;5.
23. Punjani A, Rubinstein JL, Fleet DJ, Brubaker MA. cryoSPARC: algorithms for rapid unsupervised cryo-
EM structure determination. Nat Methods. 2017; 14(3):290–6. https://doi.org/10.1038/nmeth.4169
PMID: 28165473
24. Baranovskiy AG, Gu J, Babayeva ND, Kurinov I, Pavlov YI, Tahirov TH. Crystal structure of the human
Pol� B-subunit in complex with the C-terminal domain of the catalytic subunit. J Biol Chem. 2017 22;
292(38):15717–30. https://doi.org/10.1074/jbc.M117.792705 PMID: 28747437
25. Wang D, Bushnell DA, Westover KD, Kaplan CD, Kornberg RD. Structural basis of transcription: role of
the trigger loop in substrate specificity and catalysis. Cell. 2006 Dec 1; 127(5):941–54. https://doi.org/
10.1016/j.cell.2006.11.023 PMID: 17129781
26. Emsley P, Lohkamp B, Scott WG, Cowtan K. Features and development of Coot. Acta Crystallogr D
Biol Crystallogr. 2010 Apr; 66(Pt 4):486–501. https://doi.org/10.1107/S0907444910007493 PMID:
20383002
27. Drozdetskiy A, Cole C, Procter J, Barton GJ. JPred4: a protein secondary structure prediction server.
Nucleic Acids Res. 2015 Jul 1; 43(W1):W389–94. https://doi.org/10.1093/nar/gkv332 PMID: 25883141
28. Matsui I, Urushibata Y, Shen Y, Matsui E, Yokoyama H. Novel structure of an N-terminal domain that is
crucial for the dimeric assembly and DNA-binding of an archaeal DNA polymerase D large subunit from
Pyrococcus horikoshii. FEBS Lett. 2011 Feb 4; 585(3):452–8. https://doi.org/10.1016/j.febslet.2010.12.
040 PMID: 21192935
29. Holm L, Rosenstrom P. Dali server: conservation mapping in 3D. Nucleic Acids Res. 2010 Jul 1; 38
(suppl 2):W545–9.
30. Grishin NV. KH domain: one motif, two folds. Nucleic Acids Res. 2001 Feb 1; 29(3):638–43. PMID:
11160884
31. Chen X, Court DL, Ji X. Crystal structure of ERA: A GTPase-dependent cell cycle regulator containing
an RNA binding motif. Proc Natl Acad Sci U S A. 1999 Jul 20; 96(15):8396–401. PMID: 10411886
32. Timinskas K, VenclovasČ. The N-terminal region of the bacterial DNA polymerase PolC features a pair
of domains, both distantly related to domain V of the DNA polymerase III τ subunit. FEBS J. 2011 Sep;
278(17):3109–18. https://doi.org/10.1111/j.1742-4658.2011.08236.x PMID: 21740522
Structure of the DP1–DP2 PolD complex bound with DNA
PLOS Biology | https://doi.org/10.1371/journal.pbio.3000122 January 18, 2019 26 / 28

33. Beuth B, Pennell S, Arnvig KB, Martin SR, Taylor IA. Structure of a Mycobacterium tuberculosis NusA-
RNA complex. EMBO J. 2005 Oct 19; 24(20):3576–87. https://doi.org/10.1038/sj.emboj.7600829
PMID: 16193062
34. Dunkle JA, Vinal K, Desai PM, Zelinskaya N, Savic M, West DM, et al. Molecular recognition and modifi-
cation of the 30S ribosome by the aminoglycoside-resistance methyltransferase NpmA. Proc Natl Acad
Sci U S A. 2014 Apr 29; 111(17):6275–80. https://doi.org/10.1073/pnas.1402789111 PMID: 24717845
35. Tahirov TH, Makarova KS, Rogozin IB, Pavlov YI, Koonin EV. Evolution of DNA polymerases: an inacti-
vated polymerase-exonuclease module in Pol ε and a chimeric origin of eukaryotic polymerases from
two classes of archaeal ancestors. Biol Direct. 2009 Mar 18; 4:11. https://doi.org/10.1186/1745-6150-4-
11 PMID: 19296856
36. Kelley LA, Mezulis S, Yates CM, Wass MN, Sternberg MJE. The Phyre2 web portal for protein model-
ing, prediction and analysis. Nat Protoc. 2015 Jun; 10(6):845–58. https://doi.org/10.1038/nprot.2015.
053 PMID: 25950237
37. Landau M, Mayrose I, Rosenberg Y, Glaser F, Martz E, Pupko T, et al. ConSurf 2005: the projection of
evolutionary conservation scores of residues on protein structures. Nucleic Acids Res. 2005 Jul 1; 33
(Web Server issue):W299–302. https://doi.org/10.1093/nar/gki370 PMID: 15980475
38. Shen Y, Tang X-F, Yokoyama H, Matsui E, Matsui I. A 21-amino acid peptide from the cysteine cluster
II of the family D DNA polymerase from Pyrococcus horikoshii stimulates its nuclease activity which is
Mre11-like and prefers manganese ion as the cofactor. Nucleic Acids Res. 2004; 32(1):158–68. https://
doi.org/10.1093/nar/gkh153 PMID: 14704353
39. Tang X-F, Shen Y, Matsui E, Matsui I. Domain topology of the DNA polymerase D complex from a
hyperthermophilic archaeon Pyrococcus horikoshii. Biochemistry (Mosc). 2004 Sep 21; 43(37):11818–
27.
40. Rothwell PJ, Waksman G. Structure and mechanism of DNA polymerases. Adv Protein Chem. 2005;
71:401–40. https://doi.org/10.1016/S0065-3233(04)71011-6 PMID: 16230118
41. Doublie S, Zahn KE. Structural insights into eukaryotic DNA replication. Front Microbiol [Internet]. 2014
Aug 25 [cited 2016 Feb 1];5. Available from: http://www.ncbi.nlm.nih.gov/pmc/articles/PMC4142720/
42. Abellon-Ruiz J, Waldron KJ, Connolly BA. Archaeoglobus Fulgidus DNA Polymerase D: A Zinc-Binding
Protein Inhibited by Hypoxanthine and Uracil. J Mol Biol. 2016 Jul 17; 428(14):2805–13. https://doi.org/
10.1016/j.jmb.2016.06.008 PMID: 27320386
43. Richardson TT, Gilroy L, Ishino Y, Connolly BA, Henneke G. Novel inhibition of archaeal family-D DNA
polymerase by uracil. Nucleic Acids Res. 2013 Apr; 41(7):4207–18. https://doi.org/10.1093/nar/gkt083
PMID: 23408858
44. Richardson TT, Wu X, Keith BJ, Heslop P, Jones AC, Connolly BA. Unwinding of primer-templates by
archaeal family-B DNA polymerases in response to template-strand uracil. Nucleic Acids Res. 2013
Feb; 41(4):2466–78. https://doi.org/10.1093/nar/gks1364 PMID: 23303790
45. Seeman NC, Rosenberg JM, Rich A. Sequence-specific recognition of double helical nucleic acids by
proteins. Proc Natl Acad Sci U S A. 1976 Mar; 73(3):804–8. PMID: 1062791
46. Doublie S, Tabor S, Long AM, Richardson CC, Ellenberger T. Crystal structure of a bacteriophage T7
DNA replication complex at 2.2 A resolution. Nature. 1998 Jan 15; 391(6664):251–8. https://doi.org/10.
1038/34593 PMID: 9440688
47. Matsumiya S, Ishino Y, Morikawa K. Crystal structure of an archaeal DNA sliding clamp: Proliferating
cell nuclear antigen from Pyrococcus furiosus. Protein Sci Publ Protein Soc. 2001 Jan; 10(1):17–23.
48. Matsumiya S, Ishino S, Ishino Y, Morikawa K. Physical interaction between proliferating cell nuclear
antigen and replication factor C from Pyrococcus furiosus. Genes Cells Devoted Mol Cell Mech. 2002
Sep; 7(9):911–22.
49. McNally R, Bowman GD, Goedken ER, O’Donnell M, Kuriyan J. Analysis of the role of PCNA-DNA con-
tacts during clamp loading. BMC Struct Biol. 2010 Jan 30; 10:3. https://doi.org/10.1186/1472-6807-10-
3 PMID: 20113510
50. Tori K, Kimizu M, Ishino S, Ishino Y. DNA polymerases BI and D from the hyperthermophilic archaeon
Pyrococcus furiosus both bind to proliferating cell nuclear antigen with their C-terminal PIP-box motifs. J
Bacteriol. 2007 Aug; 189(15):5652–7. https://doi.org/10.1128/JB.00073-07 PMID: 17496095
51. Castillo-Lizardo M, Henneke G, Viguera E. Replication slippage of the thermophilic DNA polymerases B
and D from the Euryarchaeota Pyrococcus abyssi. Front Microbiol [Internet]. 2014 [cited 2018 Sep 7];5.
Available from: https://www.frontiersin.org/articles/10.3389/fmicb.2014.00403/full
52. Salgado PS, Koivunen MRL, Makeyev EV, Bamford DH, Stuart DI, Grimes JM. The structure of an
RNAi polymerase links RNA silencing and transcription. PLoS Biol. 2006 Dec; 4(12):e434. https://doi.
org/10.1371/journal.pbio.0040434 PMID: 17147473
Structure of the DP1–DP2 PolD complex bound with DNA
PLOS Biology | https://doi.org/10.1371/journal.pbio.3000122 January 18, 2019 27 / 28

53. Westover KD, Bushnell DA, Kornberg RD. Structural basis of transcription: nucleotide selection by rota-
tion in the RNA polymerase II active center. Cell. 2004 Nov 12; 119(4):481–9. https://doi.org/10.1016/j.
cell.2004.10.016 PMID: 15537538
54. Weinzierl ROJ. The Bridge Helix of RNA Polymerase Acts as a Central Nanomechanical Switchboard
for Coordinating Catalysis and Substrate Movement [Internet]. Archaea. 2011 [cited 2018 Sep 7]. Avail-
able from: https://www.hindawi.com/journals/archaea/2011/608385/
55. Hamdan S, Carr PD, Brown SE, Ollis DL, Dixon NE. Structural basis for proofreading during replication
of the Escherichia coli chromosome. Struct Lond Engl 1993. 2002 Apr; 10(4):535–46.
56. Aravind L, Koonin EV. Phosphoesterase domains associated with DNA polymerases of diverse origins.
Nucleic Acids Res. 1998 Aug 15; 26(16):3746–52. PMID: 9685491
57. Lemor M, Kong Z, Henry E, Brizard R, Laurent S, Bosse A, et al. Differential Activities of DNA Polymer-
ases in Processing Ribonucleotides during DNA Synthesis in Archaea. J Mol Biol [Internet]. 2018 Oct
31; Available from: http://www.sciencedirect.com/science/article/pii/S0022283618307277
58. Suwa Y, Gu J, Baranovskiy AG, Babayeva ND, Pavlov YI, Tahirov TH. Crystal Structure of the Human
Pol α B Subunit in Complex with the C-terminal Domain of the Catalytic Subunit. J Biol Chem. 2015 Jun
5; 290(23):14328–37. https://doi.org/10.1074/jbc.M115.649954 PMID: 25847248
59. Schuck P, Perugini MA, Gonzales NR, Howlett GJ, Schubert D. Size-distribution analysis of proteins by
analytical ultracentrifugation: strategies and application to model systems. Biophys J. 2002 Feb; 82
(2):1096–111. https://doi.org/10.1016/S0006-3495(02)75469-6 PMID: 11806949
60. Jokela M, Eskelinen A, Pospiech H, Rouvinen J, Syvaoja JE. Characterization of the 3’ exonuclease
subunit DP1 of Methanococcus jannaschii replicative DNA polymerase D. Nucleic Acids Res. 2004; 32
(8):2430–40. https://doi.org/10.1093/nar/gkh558 PMID: 15121900
61. Emsley P, Cowtan K. Coot: model-building tools for molecular graphics. Acta Crystallogr D Biol Crystal-
logr. 2004 Dec; 60(Pt 12 Pt 1):2126–32. https://doi.org/10.1107/S0907444904019158 PMID: 15572765
62. Adams PD, Afonine PV, Bunkoczi G, Chen VB, Echols N, Headd JJ, et al. The Phenix software for auto-
mated determination of macromolecular structures. Methods San Diego Calif. 2011 Sep; 55(1):94–106.
Structure of the DP1–DP2 PolD complex bound with DNA
PLOS Biology | https://doi.org/10.1371/journal.pbio.3000122 January 18, 2019 28 / 28