Embed Size (px)
Citation preview

Structured Finance
www.fitchratings.com 21 December 2010
RMBS Australia Special Report
Australian Mortgage Delinquency by Postcode — 30 September 2010
Summary Overall, delinquencies have considerably increased across all six states in Australia. As of September 2010, 1% of borrowers were one month or more behind on their scheduled balance. Delinquent borrowers tend to be in arrears on higher-than-average outstanding loan balances and 1.54% of the total mortgage balance is not performing.
Between September 2009 and September 2010, the Reserve Bank of Australia (RBA) increased the cash rate six times, each by 25 basis points (bp). The average bank Standard Variable Rate (SVR) also increased over this period and as of September 2010 stood at 7.40%, negatively affecting delinquencies.
Australia – 30+ Day Delinquencies0.00% To 0.51%
0.51% To 1.03%
1.03% To 1.54%
1.54% To 2.05%
2.05% To 2.57%
2.57% To 10.00%
1 Northern QLD 1.29
2 Mackay 1.99
3 Fitzroy 1.44
4 Wide Bay-Burnett 1.74
5 Sunshine Coast 1.96
6 Darling Downs 1.62
7 Richmond-Tweed 1.56
8 North NSW 1.96
9 Hunter 2.08
10 Illawarra 2.03
11 South East NSW 1.39
12 ACT 0.74
13 Murray Murrumbidgee 1.77
14 Mallee,Wimmera & Loddon 1.11
15 Western VIC 1.62
16 Barwon 1.33
17 Goulburn & Ovens Murray 1.27
18 Gippsland 1.06
WesternAustralia
(excl. Perth and South West)1.52
NorthernTerritory0.93
1.78
South Australia
(excl. Adelaide)1.42
North West & Western NSW
1.89
Tasmania1.20
Far North and West
1
2
34
678
9
10
11 12
1314
15
16
1718
5
Source: ABS, Fitch
South West WA2.82
Regional Highlights In terms of mortgage performance, regions that have been historically labelled as the “worst performing regions” have been impacted the most by the increasing interest rates: South Western Sydney and the Central Coast north of Sydney, the Gold Coast in Queensland and the South West region in Western Australia are still experiencing delinquency rates far above the national average. Fairfield-Liverpool continues to be the worst performing region in Australia, with one delinquent mortgage out of 60 and a 30+ day delinquency rate of 2.81%.
Nelson Bay continues to be by far the worst performing postcode overall, recording a delinquency ratio of 8.0% by dollar amount and 3.3% by number of loans in arrears. Other suburbs, such as Budgewoi (NSW), Mandurah (WA), Casuarina (WA), Richmond (NSW) and Helensvale (QLD) continue to be among the worst performing postcodes.
Analysts Structured Finance James Zanesi +61 2 8256 0306 [email protected]
David Carroll +61 2 8256 0333 [email protected]
Natasha Vojvodic +61 2 8256 0350 [email protected] Ben Newey +61 2 8256 0341 [email protected]
James Leung +61 2 8256 0322 [email protected]
Spencer Wilson +61 2 8256 0320 [email protected]
Adam Daman +61 2 8256 0358 [email protected] Kim Bui +61 2 8256 0340 [email protected] Courtney Miller +61 2 8256 0347 [email protected]
Investor Relations Vickie Brumwell +61 2 8256 0305 [email protected]
Related Research • Australian Mortgage Delinquency by Postcode – 30 September 2009
(December 2009)
• The Dinkum Index – Q310, Fitch Ratings’ Quarterly Australian Residential Mortgage
Performance Report (November 2010)

Structured Finance
Australian Mortgage Delinquency by Postcode — 30 September 2010
December 2010 2
For the first time in the history of this report, Western Australia is the worst performing state in terms of 30+ day arrears (1.95%). Delinquency rates in Perth and in the South West region have considerably increased since September 2009 and five of the worst twenty postcodes are currently located in Western Australia.
With the exception of the area around Inner Brisbane, all of the regions in Queensland have experienced a considerable increase in delinquency rates, although the delinquency rate for the overall state is in line with the national average. As of September 2010, four of the worst performing postcodes were located in Queensland: Surfers Paradise is the worst performing postcode by value, with 4.3% of the mortgage balance in arrears.
The regions which have experienced a considerable improvement in delinquencies in the last year are all located in Victoria: Boroondara City, Mornington Peninsula and Greater Dandengong City.
In this report, Fitch Ratings covers all securitised mortgages (prime and non-conforming) including, for the first time, mortgages which form the collateral of REPO-eligible transactions with the RBA. As of September 2010, securitised mortgages represented approximately 13% of all Australian mortgages by volume.

Structured Finance
Australian Mortgage Delinquency by Postcode — 30 September 2010
December 2010 3
Background This is Fitch’s fifth report covering the performance of Australian mortgages by postcode. The analysis is based on loan-by-loan data for Australian securitised residential mortgages and provides a window on the Australian mortgage market as a whole and specifically, the performance of mortgages across postcodes.
For the purpose of this report, Fitch has used its mortgage performance data to divide Australian mortgage performance by geography. The agency has done this by placing an emphasis on the postcode in which the security property is located. In this manner, Fitch is able to analyse missed payments on residential mortgages in Australia at varying levels of granularity, including by state, city, region and postcode.
As not all of the mortgages are owner-occupied, the location of the property might be different than the residency of the borrower and the business focus of the lender. Therefore, for small geographical areas such as postcodes, the study provides more information on the performance of the secured property market rather than the creditworthiness of the residents in that particular area, or the performance of a specific lender’s portfolio. For example, while properties in one geographical area may form collateral for investment properties, the borrower might be resident anywhere else in Australia (eg in a metropolitan city). According to the Reserve Bank of Australia (RBA), 30.12% of the mortgages are currently investment properties. Even if the location of the property might not always tell the credit profile of the obligor, it remains a discriminating factor in performance.
This study has been devised to examine Australian mortgage delinquency at a granular level and to highlight areas of stress in the Australian mortgage market that may not be in evidence when looking at national or even state-based data. The variability of the performance of postcodes across Australia is a reminder to those reviewing RMBS performance that the geographic diversity of a portfolio is an important attribute to be considered.
The study relies on data from home loans that have been securitised in the Australian market. This year, the study also takes into account the loans of REPO-eligible transactions with the RBA, as such transactions are now well-seasoned. At 30 September 2010, the study included approximately 900,000 loans (730,000 at 30 September 2009) with a total outstanding balance of over AUD155bn (AUD118bn at 30 September 2009). While the volume of data has increased due to the inclusion of REPO-eligible transactions, the total outstanding balance of securitised mortgages has decreased by approximately 24% since September 2009. Currently, the volume of securitised mortgages in the study represents approximately 13% by value of the total housing loan stock in Australia and provides a good proxy for the performance of the Australian residential housing finance sector. The data includes both conforming and non-conforming securitised residential loans.
Methodology In order to compare different geographical areas across Australia, Fitch displays statistics both by postcode and by regions. Fitch started to provide statistics about specific geographical regions in 2007, when it highlighted the divergence in performance between South West Sydney and the rest of New South Wales. In March 2008, Fitch presented for the first time a detailed overview about the performances among the 54 largest regions in Australia.
While in this report Fitch has continued to use the same postcode classification, it also decided to further increase the number of regions that are covered in the study. In its previous report, Fitch analysed exclusively the largest Statistical Subdivisions (SSD), as classified by the Australian Bureau of Statistics (ABS), with an outstanding mortgage balance greater than AUD1.0bn. Such criteria allowed the agency to quickly assess the performance in a specific and geographically-delimited

Structured Finance
Australian Mortgage Delinquency by Postcode — 30 September 2010
December 2010 4
area and, at the same time, avoid the risk of running into statistically misleading results. On the other hand, such methodology does not easily allow Fitch to cover the whole Australian territory, as it focuses on the most densely populated areas. Moreover, it is relatively hard to capture the divergence in performance between metropolitan and more remote areas.
In metropolitan areas such as Sydney, Melbourne, Brisbane, Adelaide, and Perth, Fitch has decided to continue to display information for subdivisions, as provided by the ABS. While some cities (eg Sydney and Melbourne) allow further segmentation and in turn, show geographical differences within the metropolitan area itself, this is not always possible: for example, the portion and size of the sample in small areas such as Darwin might lack statistical significance. Fitch has therefore decided to group two or more small subdivisions in order to form a new geographical area. In the particular case of Darwin, Fitch has decided to group all of the subdivisions in the Northern Territory in one geographical area, as this provides a significant sample which could be compared with other regions of similar size.
Fitch has therefore segmented Australia into proportionate and homogenous areas. In identifying and grouping statistical subdivisions, Fitch has reached statistical significance and geographical divergence at the same time.
Fitch has identified 76 regions. In metropolitan areas such as Sydney, Melbourne, Brisbane, Adelaide and Perth, the information continues to be displayed for Statistical Subdivisions (SSD) as defined by the ABS. The 47 SSD in the five biggest cities have remained the same since the last report. Other SSD, which have previously been excluded from Fitch’s report, have been grouped together in larger divisions (eg Statistical Divisions as defined by the ABS). For more information, see Appendix “Statistical Subdivision within Fitch Regions” on page 31.
In this report, the information is also represented visually using geographical maps. Information is displayed in two maps for postcodes (Australia and Sydney) and six maps for regional performance (Australia, Sydney, Melbourne, Brisbane, Perth and Adelaide). While the postcode maps show the location of the twenty worst performing postcodes, the regional maps show which geographical areas are currently experiencing higher or lower than average 30+ day arrears by dollar amount. Information by number of loans in arrears is provided in tables, but is not displayed in geographical maps.
The colour of a specific region indicates whether it is under- or over-performing the national average: arrears are grouped into quintile in relation to the national average at a particular reporting date. For example, as of September 2010, Australian securitised mortgage arrears amounted to 1.54%, and 30+ day arrears are displayed in three quintiles above and three quintiles below such value. In each geographical map, Fitch also displays the level of arrears as a numeric value for each region. Furthermore, the maps show whether performance has deteriorated or improved from the last reporting date (in this case, September 2009).

Structured Finance
www.fitchratings.com 21 December 2010
90
100
110
120
130
140
Sep 07 Sep 08 Sep 09 Sep 10
SydneyMelbourneBrisbaneAdelaidePerthCanberra8 Capitals
Sept 2007 = 100
Australia - House Price
Appreciation in the Last 3
Years
Source: ABS, Fitch
Residential Loan Performance by Region
Australia – 30+ Day Delinquencies0.00% To 0.51%
0.51% To 1.03%
1.03% To 1.54%
1.54% To 2.05%
2.05% To 2.57%
2.57% To 10.00%
1 Northern QLD 1.29
2 Mackay 1.99
3 Fitzroy 1.44
4 Wide Bay-Burnett 1.74
5 Sunshine Coast 1.96
6 Darling Downs 1.62
7 Richmond-Tweed 1.56
8 North NSW 1.96
9 Hunter 2.08
10 Illawarra 2.03
11 South East NSW 1.39
12 ACT 0.74
13 Murray Murrumbidgee 1.77
14 Mallee,Wimmera & Loddon 1.11
15 Western VIC 1.62
16 Barwon 1.33
17 Goulburn & Ovens Murray 1.27
18 Gippsland 1.06
WesternAustralia
(excl. Perth and South West)1.52
NorthernTerritory0.93
1.78
South Australia
(excl. Adelaide)1.42
North West & Western NSW
1.89
Tasmania1.20
Far North and West
1
2
34
678
9
10
11 12
1314
15
16
1718
5
Source: ABS, Fitch
South West WA2.82
Overall, delinquencies have increased considerably across all of the six states in Australia. As of September 2010, the average 30+ day delinquency ratio by dollar amount in Australia was 1.54%. The delinquency ratio by number of loans in arrears is exactly 1.00%. This means that in Australia, one borrower out of 100 is in arrears and that delinquent borrowers tend to have higher-than-average outstanding loan balances. As house prices, the Australia economy and unemployment are stabilising, the increase in the mortgage rate remains the main variable to impact households’ affordability.
0.0
0.5
1.0
1.5
2.0
2.5
3.0
3.5
4.0
Mar 09 Jun 09 Sep 09 Dec 09 Mar 10 Jun 10 Sep 10
Blacktown Central Coast Sydney South West WA
Fairfield-Liverpool Outer Western Sydney ACT
Boroondara City Inner Melbourne Lower Northern Sydney
Northern Middle Melbourne Australia(%)
Australia - Historical 30+ Day Arrears of Selected Regions
Source: Fitch
Queensland and Western Australia have experienced a remarkable deterioration in performance over the last year, with 30+ day arrears increasing to respectively 1.54% and 1.97% in September 2010 (versus 1.12% and 1.37% in September 2009). Victoria and Tasmania are the states which experienced the lowest increase in 30+ day arrears since the last report. The Australian Capital Territory continues to be the best performing, with a delinquency ratio of 0.71% and less than one delinquency out of two hundred mortgages on average.
The Melbourne housing market has strongly appreciated during the last three years, while Perth house price growth has been modest
0.0
0.5
1.0
1.5
2.0
2.5
Mar
09
Jun
09
Sep
09
Dec
09
Mar
10
Jun
10
Sep
10
NSW QLD SA
TAS VIC WA
(%)
Australia - Historical
Performance of States
Source: Fitch
QLD and WA have experienced a remarkable deterioration in performance over the last year

Structured Finance
Australian Mortgage Delinquency by Postcode — 30 September 2010
December 2010 6
For the first time in the history of this series of reports, NSW is not the worst performing state in terms of 30+ delinquencies by dollar amount. Mortgage arrears in Western Australia have worsened considerably over the past year and especially over the last quarter (for more information see the “Western Australia” section on page 17). As in Fitch’s previous reports, the worst performing geographical areas in Australia are located in the west side of Sydney. Interestingly, performance in South West WA has strongly deteriorated and this has been reflected both at a regional level (eg South West WA) and at a suburb level (eg Mandurah).
Worst Performing Regions in Australia
Fairfield-Liverpool continues to be the worst performing region in Australia, above other NSW regions such as the Central Coast and Blacktown. The deterioration in Blacktown has been considerable; it is currently the third worst-performing region by arrears amount and the second worst-performing region by delinquent loan number. Delinquencies in the Canterbury-Bankstown region have now stabilised and in relative terms the region is no longer among the ten worst performing regions; as of September 2010, it was the nineteenth worst performing region.
10 Worst Performing Regions in Australia By Number As at 30 September 2010 As at 31 March 2010
Rank Fitch Region State
30+ day arrears
(%) Fitch Region State
30+ day arrears
(%)
1 Fairfield-Liverpool NSW 1.76 Fairfield-Liverpool NSW 1.80 2 Blacktown NSW 1.69 Blacktown NSW 1.75 3 Central Coast Sydney NSW 1.67 Outer South Western Sydney NSW 1.71 4 Outer Western Sydney NSW 1.61 Central Coast Sydney NSW 1.69 5 Outer South Western Sydney NSW 1.60 Outer Western Sydney NSW 1.60 6 South West WA WA 1.45 Hume City VIC 1.55 7 North West NSW NSW 1.42 Melton-Wyndham VIC 1.42 8 Logan City
(incl. Beaudesert Shire) QLD 1.39 Murray & Murrumbidgee VIC 1.42 9 Melton-Wyndham VIC 1.36 North West NSW NSW 1.39 10 Gold Coast East QLD 1.35 South West WA WA 1.34
Source: Fitch, ABS
While in September 2009 just one out of the 10 worst performing regions was located in Western Australia, today that number has increased to three (as the south west and east part of Perth have experienced a higher degree of deterioration than other regions in Australia). Of particular note is the increase in delinquencies in South Western WA, where 2.80% of the mortgage balance in the analysis is not performing. This is almost a 50% increase year-on-year (yoy). In
10 Worst Performing Fitch Regions in Australia By Value As at 30 September 2010 As at 31 March 2010
Rank Region State
30+ day arrears
(%) Region State
30+ day arrears
(%)
1 Fairfield-Liverpool NSW 2.81 Fairfield-Liverpool NSW 2.84 2 South West WA WA 2.80 Blacktown NSW 2.59 3 Central Coast Sydney NSW 2.74 Central Coast Sydney NSW 2.50 4 Blacktown NSW 2.65 Outer Western Sydney NSW 2.50 5 Outer Western Sydney NSW 2.56 Outer South Western Sydney NSW 2.45 6 Outer South Western Sydney NSW 2.42 Gold Coast East QLD 2.11 7 Gold Coast East QLD 2.26 South West WA WA 2.08 8 Hunter NSW 2.08 Gold Coast West QLD 2.04 9 South West Metro Perth WA 2.07 Hume City VIC 2.02 10 East Metropolitan Perth WA 2.03 Mackay QLD 2.01
Source: Fitch, ABS
• Fairfield-Liverpool continues to be the worst performing region in Australia
• The number of regions located in Western Australia among the 10 worst performing has increased
• The East Gold Coast continues to be the worst performing region in QLD
• Victorian regions tend to be among the best performing regions in Australia

Structured Finance
Australian Mortgage Delinquency by Postcode — 30 September 2010
December 2010 7
terms of loan number, on average, 15 mortgages out of 1,000 were delinquent in September 2010.
The East Gold Coast remains the only Queensland region to be among the 10 worst performing regions by arrears amount. However, three out of the ten regions with the highest portion of delinquent obligors are from Queensland (Logan City, Gold Coast East and Caboolture Shire), indicating that an increasing number of borrowers are experiencing mortgage payment difficulties.
Melton-Wyndham continues to be the worst performing region in Victoria and the only Victorian region among the 10 worst performing regions by number of mortgages; approximately one mortgage in 73 were in arrears as of September 2010.
Best Performing Regions in Australia
10 Best Performing Fitch Regions in Australia By Value As at 30 September 2010 As at 31 March 2010
Rank Region State
30+ day arrears
(%) Region State
30+ day arrears
(%)
1 Boroondara City VIC 0.27 Moreland City VIC 0.56 2 Northern Middle Melbourne VIC 0.66 Boroondara City VIC 0.58 3 Lower Northern Sydney NSW 0.68 Inner Melbourne VIC 0.62 4 Inner Melbourne VIC 0.69 Lower Northern Sydney NSW 0.66 5 ACT ACT 0.71 ACT ACT 0.67 6 Northwest Inner Brisbane QLD 0.77 NT NT 0.71 7 Northwest Outer Brisbane QLD 0.84 Southern Melbourne VIC 0.73 8 Southern Melbourne VIC 0.84 Northern Middle Melbourne VIC 0.75 9 Western Melbourne VIC 0.88 Inner Brisbane QLD 0.77 10 Mornington Peninsula Shire VIC 0.92 Northwest Inner Brisbane QLD 0.82
Source: Fitch, ABS
Six out of the ten best performing regions are located in Melbourne. The statistical subdivision of Borrondara City is currently the best performing region in Australia, as a considerable number of obligors have cured their delinquent payments in the last year: on average, only two mortgages out of 1,000 are currently delinquent.
10 Best Performing Regions in Australia By Number As at 30 September 2010 As at 31 March 2010
Rank Fitch Region State
30+ day arrears
(%) Fitch Region State
30+ day arrears
(%)
1 Boroondara City VIC 0.20 Boroondara City VIC 0.38 2 Lower Northern Sydney NSW 0.39 Lower Northern Sydney NSW 0.39 3 Inner Melbourne VIC 0.44 Moreland City VIC 0.42 4 ACT ACT 0.44 Inner Melbourne VIC 0.44 5 Northern Middle Melbourne VIC 0.46 Southern Melbourne VIC 0.46 6 Northwest Inner Brisbane QLD 0.47 ACT ACT 0.46 7 Southeast Inner Brisbane QLD 0.49 NT NT 0.49 8 Southern Melbourne VIC 0.54 Central Metropolitan Perth WA 0.52 9 Inner Brisbane QLD 0.56 Inner Brisbane QLD 0.54 10 Northern Beaches NSW 0.60 Southeast Inner Brisbane QLD 0.54
Source: Fitch, ABS
Lower Northern Sydney is the only subdivision of New South Wales to be among the best ten regions, boasting the lowest portion of mortgage balances in arrears. The Northern Beaches subdivision (located north east of Sydney) is the second best performing area in NSW, with six mortgages out of 1,000 being delinquent. Northwest Inner and Northwest Outer Brisbane continue to be among the best performing regions in Queensland by arrears amount.

Structured Finance
Australian Mortgage Delinquency by Postcode — 30 September 2010
December 2010 8
Residential Loan Performance by Suburb
20 Worst Performing Postcodes in Australia by Value As at 30 September 2010 As at 31 March 2010
Rank Post code State Suburb
30+ day arrears
(%) Post code State Suburb
30+ day arrears
(%)
1 2315 NSW Nelson Bay 8.0 2315 NSW Nelson Bay 6.8 2 2262 NSW Budgewoi 4.4 2164 NSW Smithfield 5.0 3 4217 QLD Surfers Paradise 4.3 6167 WA Casuarina 4.9 4 2164 NSW Smithfield 4.1 2156 NSW Kenthurst 4.7 5 2759 NSW St Clair 3.9 4212 QLD Helensvale 4.6 6 6210 WA Mandurah 3.9 2224 NSW Sylvania 4.6 7 2190 NSW Greenacre 3.8 2263 NSW Gorokan 4.0 8 6167 WA Casuarina 3.8 2780 NSW Blue Mountains 3.9 9 2766 NSW Rooty Hill 3.7 2262 NSW Budgewoi 3.9 10 2168 NSW Green Valley 3.7 2753 NSW Richmond 3.7 11 6064 WA Marangaroo 3.6 2770 NSW Mount Druitt 3.7 12 2280 NSW Belmont 3.7 2767 NSW Doonside/Woodcroft 3.6 13 2176 NSW Bossley Park 3.7 2168 NSW Green Valley 3.6 14 2747 NSW Kingswood 3.6 2190 NSW Greenacre 3.5 15 4132 QLD Crestmead/Marsden 3.6 6110 WA Gosnells 3.4 16 2753 NSW Richmond 3.5 3337 VIC Melton 3.4 17 6110 WA Gosnells 3.4 2571 NSW Wilton 3.3 18 6069 WA Swan 3.3 4217 QLD Surfers Paradise 3.3 19 4212 QLD Helensvale 3.3 2756 NSW Womerah 3.2 20 4000 QLD Brisbane 3.3 2761 NSW Oakhurst/Plumpton 3.2
Source: Fitch, ABS
This study exclusively analyses performance among the larger postcodes in Australia. Postcodes with less than AUD100m of the total securitised mortgage balance are excluded in the analysis, as Fitch believes that the sample does not have a sufficient size to provide useful and reliable information.
Moreover, only postcodes with more than 500 securitised loans and more than 10 delinquent loans are included among the worst performing loans. In relatively small postcodes, a few jumbo loans falling into arrears could easily exaggerate the real deterioration in such areas.
Eight out of the twenty worst performing postcodes are located around Sydney (see map “Worst 20 Performing Australian Postcodes – including Sydney” on page 9). However, Nelson Bay — which includes the areas of Corlette, Fingal Bay, Nelson Bay and Shoal Bay — continues to be by far the worst performing postcode, with mortgages being in arrears for 8.0% of their collateral balance. Other suburbs, such as Budgewoi (NSW), Mandurah (WA), Casuarina (WA), Richmond (NSW) and Helensvale (QLD), continue to be among the worst performing postcodes.
• Nelson Bay continues to be by far the worst performing postcode, by arrears value and loan number
• Six of the postcodes from September 2009 are still among the twenty worst performing
• Eight out of the twenty worst performing postcodes are located around Sydney
• Surfers Paradise is the worst performing postcode in QLD, with a 4.3% delinquency rate

Structured Finance
Australian Mortgage Delinquency by Postcode — 30 September 2010
December 2010 9
Worst 20 Performing Australian Postcodes – Excluding Sydney
Source: ABS, Fitch
6210Mandurah
6167Casuarina
6064Marangaroo
6110Gosnells
2315 Nelson Bay
4217SurfersParadise
4132Crestmead/Marsden6069
Swan
4000Brisbane
4212Helensvale
NT
SA
WA
QLD
NSW
VIC
TAS
Apart from Sydney, the other worst performing suburbs are located around Brisbane and Perth. As of September 2010, no postcode from the Australian Capital Territory, the Northern Territory or Tasmania was among the twenty worst performing postcodes.
Worst 20 Performing Australian Postcodes – Including Sydney
2262,
Budgewoi
2164, Smithfield2759, St Clair
2190, Greenacre
2766, Rooty Hill
2168, Green Valley
2280,
Belmont
2176, Bossley Park
2747, Kingswood
2753, Richmond
Source: ABS, Fitch
SYDNEY
No postcode located in Victoria and South Australia is among the worst performing postcodes by value; however, this is not the case when looking at the statistics by number of mortgages in arrears: Hampton Park (VIC) and Salisbury Heights (SA) are

Structured Finance
Australian Mortgage Delinquency by Postcode — 30 September 2010
December 2010 10
the worst performing postcodes in Victoria and South Australia, with respectively 22 and 21 mortgages out of 1,000 in arrears.
The study shows that the number of worst performing postcodes from Queensland, and especially from Western Australia, has increased. Postcodes around Perth (Gosnells, Marangaroo and Swan) have experienced a considerable degree of deterioration in the last year. On the other hand, Floreat/Wembley (WA) is no longer among the 20 worst performing postcodes. The deterioration in performance is not however limited to a few postcodes, as the whole Perth and South West region has experienced a considerable increase in delinquencies during the last year (see the section “Residential Loan Performance by Region” on page 5).
Crestmead/Marsden and Surfers Paradise are among the worst performers in Queensland by number and value. Surfers Paradise has experienced a large degree of deterioration and currently, on average, 23 mortgages out of 1,000 are not performing, representing 4.3% of the balance of mortgages with properties located in that postcode. Unexpectedly, Inner Brisbane is also among the worst twenty postcodes by value.
20 Worst Performing Postcodes in Australia by Number As at 30 September 2010 As at 31 March 2010
Rank Post code State Suburb
30+ day arrears (%)
Post code State Suburb
30+ day arrears
(%)
1 2315 NSW Nelson Bay 3.3 2315 NSW Nelson Bay 3.4 2 2262 NSW Budgewoi 3.0 2164 NSW Smithfield 3.2 3 4132 QLD Crestmead/Marsden 2.7 6167 WA Casuarina 3.1 4 6167 WA Casuarina 2.6 2780 NSW Blue Mountains 2.6 5 2164 NSW Smithfield 2.5 2262 NSW Budgewoi 2.6 6 2766 NSW Rooty Hill 2.5 2571 NSW Wilton 2.4 7 2759 NSW St Clair 2.4 6110 WA Gosnells 2.4 8 2168 NSW Green Valley 2.4 2263 NSW Gorokan 2.4 9 4217 QLD Surfers Paradise 2.3 2767 NSW Doonside/Woodcroft 2.4 10 6064 WA Marangaroo 2.3 2168 NSW Green Valley 2.3 11 2190 NSW Greenacre 2.3 2156 NSW Kenthurst 2.3 12 6110 WA Gosnells 2.2 2770 NSW Mount Druitt 2.3 13 3976 VIC Hampton Park 2.2 2224 NSW Sylvania 2.3 14 2747 NSW Kingswood 2.2 2760 NSW St Marys 2.3 15 6210 WA Mandurah 2.2 4212 QLD Helensvale 2.3 16 4280 QLD Jimboomba 2.2 2190 NSW Greenacre 2.3 17 2176 NSW Bossley Park 2.1 2580 NSW Tarlo 2.2 18 2280 NSW Belmont 2.1 2577 NSW Werai 2.2 19 5109 SA Salisbury Heights 2.1 2761 NSW Oakhurst/Plumpton 2.2 20 2575 NSW High Range 2.1 2753 NSW Richmond 2.2
Source: Fitch, ABS

Structured Finance
Australian Mortgage Delinquency by Postcode — 30 September 2010
December 2010 11
New South Wales
As of September 2010, NSW dropped the tag of ‘worst performing state in terms of mortgages in arrears’, as delinquencies have considerably increased in Western Australia over the last year. The study has analysed the performance of over 280,000 mortgages in NSW, for an equivalent amount of AUD53.9bn. On average, 1.81% of the total mortgage balance in NSW was in arrears, slightly worse than the national average of 1.54%. Sydney is performing in line with the rest of NSW, with a delinquency rate of 1.80%.
While 90+ day arrears have been overall stable since September 2009, 30-60 day arrears have been constantly increasing, as households have had to deal with higher mortgage payments.
Following the peak in March 2009, unemployment has constantly improved over the last year; it is now in line with historical levels. Moreover, NSW remains a well-diversified economy. As of August 2010, the majority of residents were employed in the Health Care sector: the industry employs 415,900 people, or approximately 12% of the total employed persons in NSW. NSW is performing well in terms of employment, given the impact of the Global Financial Crisis (GFC) on the banking sector and the impact of the dollar on the tourism and manufacturing sectors. At the moment, the main risk to households’ affordability is represented by an eventual further increase in mortgage rates.
In this report, Fitch has analysed the Sydney metropolitan area according to ABS’s statistical subdivisions. As mentioned, Fairfield/Liverpool, Blacktown and the Central Coast (previously known as Gosford-Wyong) continue to be the worst performing suburbs in Sydney and NSW. Regions around these areas still have higher than average delinquency rates. Consequently, the majority of the worst performing postcodes in Australia are located in or nearby Fairfield/Liverpool and Blacktown (eg Smithfield, St Clair, Rooty Hill, Green Valley, Bossley Park, Kingswood and Richmond) (see the section “Residential Loan Performance by Suburb” on page 8). According to ABS data, the unemployment rate in
90
95
100
105
110
115
120
Sep 07 Sep 08 Sep 09 Sep 10
Sydney8 Capitals
Sept 2007 = 100
Sydney- House Price
Appreciation in the last 3 Years
Source: ABS, Fitch
The increase in 30+ day arrears is mainly due to constraints on household affordability following the increase in interest rates
0.0
0.5
1.0
1.5
2.0
2.5
3.0
Sep 09 Dec 09 Mar 10 Jun 10 Sep 10
30-60 days 60-90 days
90+ days 0-30 days
New South Wales - Arrears
Source: Fitch
(%)
Regions that have historically experienced higher than average arrears, such as South West & Western Sydney have been impacted the most.
2
4
6
8
Oct 07 Oct 08 Oct 09 Oct 10
NSW Sydney
NSW Unemployment
Source: ABS, Fitch
(%)

Structured Finance
Australian Mortgage Delinquency by Postcode — 30 September 2010
December 2010 12
Fairfield/Liverpool and Blacktown was 9.1% and 8.4% respectively as of 2009. Moreover, the average wage and salary in these two regions has also been historically below the NSW average. It is therefore likely that the high portion of mortgages in arrears can be attributed to the sensitivity of the residents of these specific regions to fluctuations in interest rates. The fact that performance in these regions has particularly worsened in March 2010, after the three consecutive interest rate hikes in Q409, supports this conclusion. The credit performance in terms of mortgage arrears in these areas has also considerably worsened since September 2009.
0.0
0.5
1.0
1.5
2.0
2.5
3.0
3.5
4.0
Mar 09 Jun 09 Sep 09 Dec 09 Mar 10 Jun 10 Sep 10
Blacktown Eastern Suburbs Fairfield-Liverpool
Central Coast Inner Sydney Lower Northern Sydney
Northern Beaches Outer Western Sydney Sydney(%)
Sydney - Historical 30+ Day Arrears of Selected Regions
Source: Fitch
While the Central Coast shares a similar trend in terms of mortgage performance, the economy of this region is considerably different to that in Fairfield/Liverpool or Blacktown. Despite it being the third largest urban area in NSW, the Central Coast strongly relies on tourism from Sydney and Newcastle. The area is also a known location for holiday homes and investment properties for Sydney residents.
Lower Northern Sydney continues to be the best performing suburb in NSW, with a 0.68% delinquency rate. Lower Northern Sydney is considered to be a more affluent area; according to ABS data, approximately 40% of wage and salary earners are represented by professionals and associate professionals and the average income in the Lower Northern Sydney region is AUD68,600 (in comparison to the NSW average of approximately AUD46,500). Mosman, which is a suburb located in this area, had the highest average income in NSW (AUD109,500). Regions around this area and close to the city are also out-performing the national average (eg Inner Sydney, Inner West Sydney, Eastern Suburbs and Northern beaches). Moreover, mortgage performance in these areas has remained stable overall over the last year.
Fitch believes that the regions located south west of Sydney (Blacktown, Fairfield/Liverpool, Outer West, and South Outer West) and the Central Coast will continue to experience higher than average arrears.

Structured Finance
www.fitchratings.com 21 December 2010
Victoria
In the study, Fitch has analysed approximately 206,000 mortgages for an equivalent amount of AUD32.8bn. Victoria is performing well in terms of mortgage arrears, with an overall delinquency rate of 1.11%, which is considerably lower than the other large states of New South Wales (1.81%) and Queensland (1.54%). Melbourne is performing slightly better than the rest of Victoria, with a delinquency ratio of 1.07%. Victoria’s strengths include a stable and diversified economy, stable property market, satisfactory affordability and low unemployment rates. Unemployment in Melbourne has strongly decreased to a current level of 4.8% from the 6.4% level in May 2009 (slightly better than the average 5.2% in Victoria). Manufacturing, which has historically been the largest industry in Victoria, has experienced a constant reduction in terms of number of employed people over the last three years. However, Health Care — and especially the Construction sector —have seen an increasing demand for skilled labour. The property market has also experienced a considerable growth: property prices in Melbourne have increased by 40% in the last three years (twice the increase of the average house price in the eight capital cities) and by 2.7% in the last quarter.
0.0
0.5
1.0
1.5
2.0
2.5
3.0
Mar 09 Jun 09 Sep 09 Dec 09 Mar 10 Jun 10 Sep 10
Boroondara City Frankston City
Hume City Inner Melbourne
Melton-Wyndham Northern Middle Melbourne
South Eastern Outer Melbourne Melbourne
(%)
Melbourne - Historical 30+ Day Arrear of Selected Regions
Source: Fitch
0
50,000
100,000
150,000
200,000
250,000
300,000
350,000
Aug-05
Aug-06
Aug-07
Aug-08
Aug-09
Aug-10
Manufacturing
Health Care
Constructionn°
VIC-Work Force
Source: ABS
90
100
110
120
130
140
Sep 07 Sep 08 Sep 09 Sep 10
Melbourne
8 Capitals
Sept 2007 = 100
Melbourne - House Price
Appreciation in the last 3 years
Source: ABS, Fitch
The low and stable unemployment rate, the diversified and stable economy and the strong property market have positively impacted mortgage performance across Victoria, and especially in Inner Melbourne.
0.0
0.5
1.0
1.5
2.0
2.5
Sep 09 Dec 09 Mar 10 Jun 10 Sep 10
30-60 days 60-90 days
90+ days 0-30 days
Victoria - Arrears
Source: Fitch
(%)
2
4
6
8
Oct 07 Oct 08 Oct 09 Oct 10
VIC Melbourne
VIC Unemployment
Source: ABS, Fitch
(%)

Structured Finance
Australian Mortgage Delinquency by Postcode — 30 September 2010
December 2010 14
A number of divisions of Inner Melbourne are outperforming the Australian average delinquency rate. Five Melbourne regions are among the ten best performing suburbs by loan balance. South-East Melbourne, Northern Middle Melbourne, Inner Melbourne and Borroondara City are also among the better performing suburbs by loan number, with respectively 54, 46, 44 and 20 loans out of 10,000 being delinquent for more than 30 days. In the inner city of Melbourne, on average only one out of two hundred mortgages is currently behind on its payments. Melbourne is performing soundly, as employment is low and the property market is still relatively strong.
Fitch’s study on mortgage delinquencies across Australia shows that arrears are mainly concentrated in the north-western part of Melbourne. Melton-Wyndham and Hume are among the worst performing suburbs in relative terms, with a delinquency ratio of respectively 2.00% and 1.81%. However, their performance is not substantially worse than the national 1.54% delinquency rate.
The Hume economy is mainly based on manufacturing (automotive), transport and storage, while many international companies have major operations located in this area. While there is no data available from ABS, preliminary data from the Department of Education, Employment and Workplace Relations (DEEWR) estimates that the unemployment rate in the City of Hume was approximately 10.0% in June 2010 (versus 6.3% one year before).
Although Melton-Wyndham is not known to be a low-income region, it has historically experienced unemployment levels above the national average. According to DEEWR, the unemployment level has been overall stable in this geographical area: preliminary data shows a stable unemployment rate at around 7% in June 2010 (versus 6.8% in June 2009). On the other hand, the local economy is well diversified; moreover, data recently released by the ABS shows an average income of AUD42,900 in June 2008, which is in line with the state and national levels. As 30+ day delinquencies have been overall stable since March 2010, it is likely that households experienced an interest rate shock in Q110, and those borrowers are still having trouble coping with increased mortgage payments.
As unemployment is slightly improving and remains low, GDP is growing, affordability remains high and the property market is still experiencing price appreciation, there is no reason to expect a drastic change in delinquency rates in Victoria in the near term.

Structured Finance
Australian Mortgage Delinquency by Postcode — 30 September 2010
December 2010 15
Queensland
Ipswich City1.73
West GoldCoast2.00
Darling Downs & West Moreton1.62
Logan1.98
Northwest Inner0.77
Inner Brisbane1.10
Redland1.14
East GoldCoast2.26
South Inner0.97
SE Outer1.13
Sunshine1.96
Caboolture1.77
Pine1.21
Northwest 0.84
Source: ABS, Fitch
Brisbane – 30+ Day Delinquencies0.00% To 0.51%
0.51% To 1.03%1.03% To 1.54%
1.54% To 2.05%2.05% To 2.57%
2.57% To 10.00%
Queensland is the second largest state in terms of securitised mortgage balance. Fitch has available information on approximately 220,000 mortgages for an equivalent amount of AUD39bn. At the end of September 2010, the average delinquency ratio in Queensland was exactly the same as the Australian average of 1.54%. In February 2010, Queensland recorded the highest level of unemployment in the last six years. The high unemployment, in conjunction with the increase in interest rates, has seriously impacted households’ affordability.
This has been reflected in 0-90 day delinquencies. Moreover, preliminary data from ABS suggests that house prices in Brisbane have decreased over the last quarter. As the property market has been softening, properties have been sold at a lower pace. Meanwhile, 90+ day arrears have also been increasing. According to the ABS, the unemployment rate has strongly improved since February and was recorded at 5.0% in October 2010 (versus 6.6% in February 2010). Eventual concerns on affordability will therefore depend on future monetary policy decisions.
0.0
0.5
1.0
1.5
2.0
2.5
Mar 09 Jun 09 Sep 09 Dec 09 Mar 10 Jun 10 Sep 10
Caboolture Shire Logan City Northwest Inner Brisbane
Northwest Outer Brisbane Southeast Inner Brisbane Brisbane(%)
Brisbane - Historical 30+ Day Arrears of Selected Regions
Source: Fitch
The peak in unemployment, in conjunction with the increase in interest rates, has impacted households’ affordability
90
100
110
120
130
Sep 07 Sep 08 Sep 09 Sep 10
Brisbane8 Capitals
Sept 2007 = 100
Brisbane - House Price
Appreciation in the last 3 years
Source: ABS, Fitch
As the property market has been softening, properties have been sold at a lower pace, and 90+ days arrears have been slightly accumulating over time.
0.0
0.5
1.0
1.5
2.0
2.5
3.0
Sep 09 Dec 09 Mar 10 Jun 10 Sep 10
30-60 days 60-90 days
90+ days 0-30 days
Queensland - Arrears
Source: Fitch
(%)
2
4
6
8
Oct 07 Oct 08 Oct 09 Oct 10
QLD Brisbane
QLD Unemployment
Source: ABS, Fitch
(%)

Structured Finance
Australian Mortgage Delinquency by Postcode — 30 September 2010
December 2010 16
Delinquency rates have increased for the majority of the Queensland regions since September 2009. As shown in Fitch’s previous reports, the Gold Coast continues to be the worst performing region in Queensland. The delinquency rate in the East Gold Coast was 2.26% in September 2010. The West Gold Coast is the second worst performing region with a delinquency ratio of 2.00%. In these two regions, approximately one loan out of 75 is currently non-performing. Two of the twenty worst postcodes in Australia are located in this geographical area (Helensvale and Surfers Paradise). As of September 2010, the worst performing region in terms of number of mortgages was Logan City (including Beaudesert Shire) with on average one loan out of 70 in arrears for more than 30 days.
Inner Brisbane has experienced a considerable increase in delinquency rates, mainly related to a few loans falling behind in their scheduled balance for one or two months in the postcode of Brisbane CBD (4,000). Delinquencies have been increasing mainly in the 30-89 day bucket and therefore might be cured over coming months. Moreover, a few delinquent “jumbo” loans on large value properties have skewed upward the delinquency rate: in fact, Inner Brisbane is among the best performing regions in terms of number of borrowers in arrears. Future performance might therefore normalise, aligning itself with the rest of the inner part of the city.
However, Fitch still believes that coastal regions like the Sunshine Coast and the Gold Coast East are subject to a higher level of volatility than the rest of Queensland.

Structured Finance
Australian Mortgage Delinquency by Postcode — 30 September 2010
December 2010 17
Western Australia
Fitch’s analysis covers 79,600 mortgages across Western Australia, for an equivalent amount of AUD13.7bn. The study shows increasing arrears in Perth and in the South West region of Western Australia. Despite this, Western Australia has experienced a rebound in both the tourism and mining industries and a slight improvement in employment over the last year.
The property market in Western Australia may suffer additional volatility in case of downsizing, relocation or changes in the mining industry. In contrast to other states, the mining industry is among the main industries in Western Australia. Almost 44% of all employed persons in the Australian mining industry are located in Western Australia, followed by Queensland (26%). However, the mining industry has rebounded in 2010 and according to ABS, the number of persons employed in this industry in Western Australia has considerably increased (from 59,000 in August 2009 to almost 87,000 in August this year). The mining industry was also the largest contributor in the fiscal year 2009-2010 to the Gross State Product (GSP) of Western Australia. Other industries have also experienced a rebound, contributing positively to the unemployment rate, which has considerably improved in the last year to 4.2% in October 2010 from 5.9% at September 2009.
The increase in 30+ day arrears since September 2009 is mainly due to the interest rate shock and volatility in the housing market. From October 2009 until February 2010, 30-60 day arrears almost doubled, as households were impacted by increasing mortgage rates. Western Australian households were particularly affected by the increase in interest rates in Q409; however, arrears then stabilised until June 2010, as borrowers adjusted their spending and curing their missed payments. Housing prices in Perth have remained overall unchanged since March 2010. As was the case for Queensland, as the housing market softens, properties are being sold at a slower pace; the portion of 90+ day arrears has increased as 90+ day loans accumulate and 30-90 day arrears move into the 90+ day bucket.
Currently, delinquencies outside Perth are mainly concentrated in the South West of Western Australia. With the exception of Poddington, the major mines are
0
20,000
40,000
60,000
80,000
100,000
Aug-04
Aug-05
Aug-06
Aug-07
Aug-08
Aug-09
Aug-10
Number of Employees
n°
WA - Mining Work Force
Source: ABS
90
95
100
105
110
115
120
Sep 07 Sep 08 Sep 09 Sep 10
Perth8 Capitals
Sept 2007 = 100
Perth - House Prices
Source: ABS, Fitch
The stagnant housing market is likely to be one of the main reasons for poor mortgage performance.
At the moment the mining industry is contributing positively to households’ affordability
0.0
0.5
1.0
1.5
2.0
2.5
3.0
Sep 09 Dec 09 Mar 10 Jun 10 Sep 10
30-60 days 60-90 days
90+ days 0-30 days
Western Australia - Arrears
Source: Fitch
(%)
0
2
4
6
8
Oct 07 Oct 08 Oct 09 Oct 10
WA Perth
WA Unemployment
Source: ABS, Fitch
(%)
Structured Finance
Australian Mortgage Delinquency by Postcode — 30 September 2010
December 2010 18
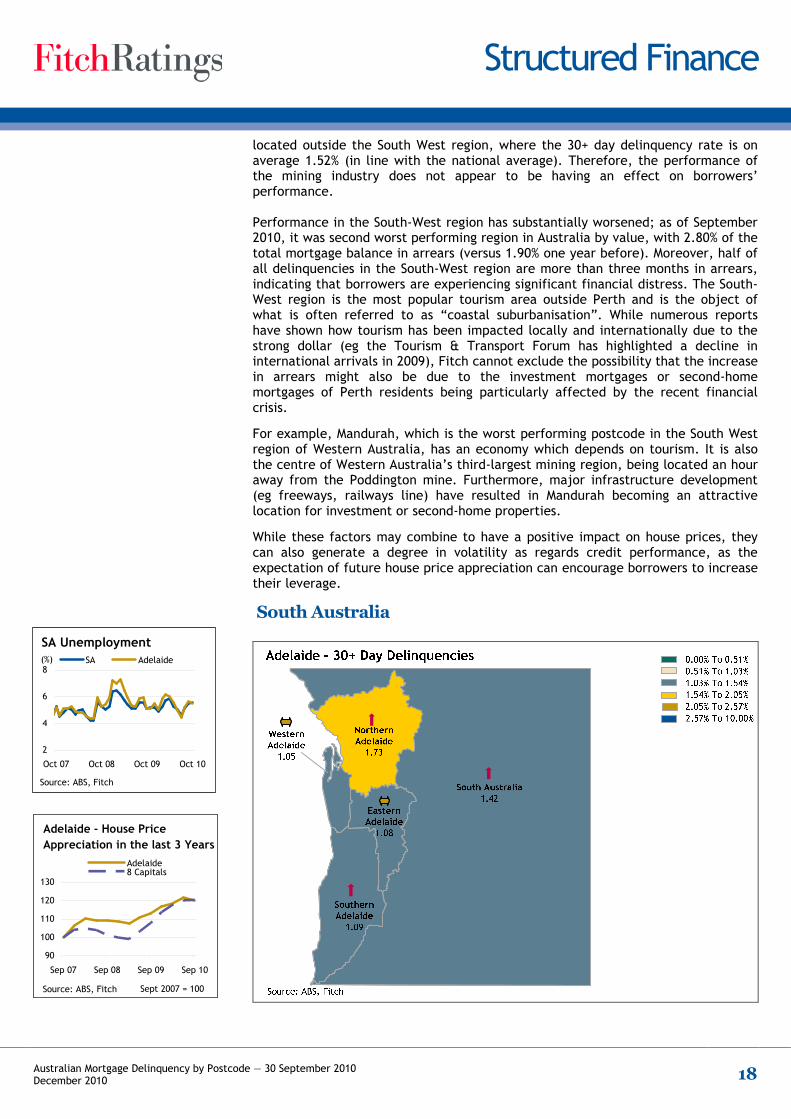
located outside the South West region, where the 30+ day delinquency rate is on average 1.52% (in line with the national average). Therefore, the performance of the mining industry does not appear to be having an effect on borrowers’ performance. Performance in the South-West region has substantially worsened; as of September 2010, it was second worst performing region in Australia by value, with 2.80% of the total mortgage balance in arrears (versus 1.90% one year before). Moreover, half of all delinquencies in the South-West region are more than three months in arrears, indicating that borrowers are experiencing significant financial distress. The South-West region is the most popular tourism area outside Perth and is the object of what is often referred to as “coastal suburbanisation”. While numerous reports have shown how tourism has been impacted locally and internationally due to the strong dollar (eg the Tourism & Transport Forum has highlighted a decline in international arrivals in 2009), Fitch cannot exclude the possibility that the increase in arrears might also be due to the investment mortgages or second-home mortgages of Perth residents being particularly affected by the recent financial crisis.
For example, Mandurah, which is the worst performing postcode in the South West region of Western Australia, has an economy which depends on tourism. It is also the centre of Western Australia’s third-largest mining region, being located an hour away from the Poddington mine. Furthermore, major infrastructure development (eg freeways, railways line) have resulted in Mandurah becoming an attractive location for investment or second-home properties.
While these factors may combine to have a positive impact on house prices, they can also generate a degree in volatility as regards credit performance, as the expectation of future house price appreciation can encourage borrowers to increase their leverage.
South Australia
2
4
6
8
Oct 07 Oct 08 Oct 09 Oct 10
SA Adelaide
SA Unemployment
Source: ABS, Fitch
(%)
90
100
110
120
130
Sep 07 Sep 08 Sep 09 Sep 10
Adelaide8 Capitals
Sept 2007 = 100
Adelaide - House Price
Appreciation in the last 3 Years
Source: ABS, Fitch

Structured Finance
Australian Mortgage Delinquency by Postcode — 30 September 2010
December 2010 19
Fitch has analysed approximately 63,800 mortgages in South Australia for an equivalent amount of AUD8.8bn. Overall delinquencies in South Australia are below the national average. Currently, the worst performing region is Northern Adelaide, for which 1.73% of the securitised mortgage balance is 30+ days in arrears.

Structured Finance
Australian Mortgage Delinquency by Postcode — 30 September 2010
December 2010 20
Australian Regions Ranked by Dollar Amount of 30+ Day Arrears at 30 September 10 Rank Region State 30 Sep 10 (%) 31 Mar 10 (%) 30 Sep 09 (%) 31 Mar 09 (%)
1 Fairfield-Liverpool NSW 2.81 2.84 2.29 3.38 2 South West WA WA 2.80 2.08 1.90 2.45 3 Central Coast Sydney NSW 2.74 2.50 2.21 3.06 4 Blacktown NSW 2.65 2.59 1.95 2.93 5 Outer Western Sydney NSW 2.56 2.50 2.14 2.91 6 Outer South Western Sydney NSW 2.42 2.45 1.88 2.67 7 Gold Coast East QLD 2.26 2.11 1.80 2.24 8 Hunter NSW 2.08 1.99 1.93 2.83 9 South West Metropolitan Perth WA 2.07 1.86 1.43 1.87 10 East Metropolitan Perth WA 2.03 1.54 1.37 1.92 11 Illawarra NSW 2.03 1.78 1.81 2.60 12 Melton-Wyndham VIC 2.00 1.92 1.49 2.09 13 Gold Coast West QLD 2.00 2.04 1.59 1.89 14 Mackay QLD 1.99 2.01 1.01 1.19 15 Logan City (incl. Beaudesert Shire) QLD 1.98 1.69 1.37 1.59 16 Sunshine Coast QLD 1.96 1.80 1.50 1.76 17 Mid-North Coast NSW 1.96 2.01 1.61 1.94 18 Central Metropolitan Perth WA 1.91 0.87 1.04 1.46 19 Canterbury-Bankstown NSW 1.90 1.99 1.96 2.36 20 Central Western Sydney NSW 1.89 1.79 1.53 2.14 21 North West NSW NSW 1.89 1.73 1.47 2.01 22 Murray & Murrumbidgee VIC 1.89 1.82 1.36 1.59 23 North Metropolitan Perth WA 1.86 1.60 1.20 1.33 24 Hume City VIC 1.81 2.02 1.20 1.95 25 Murray & Murrumbidgee VIC 1.89 1.82 1.36 1.59 26 Caboolture Shire QLD 1.77 1.77 1.44 1.72 27 Wide Bay-Burnett QLD 1.74 1.74 1.27 1.42 28 Northern Adelaide SA 1.73 1.54 1.15 1.51 29 Ipswich City QLD 1.73 1.73 1.29 1.67 30 South East Metropolitan Perth WA 1.67 1.70 1.42 1.72 31 South Eastern Outer Melbourne VIC 1.63 1.77 1.32 2.03 32 Frankston City VIC 1.62 1.32 0.93 1.55 33 Central Highlands & Western District VIC 1.62 1.48 1.17 1.81 34 Darling Downs & West Moreton QLD 1.62 1.48 0.79 1.28 35 St George-Sutherland NSW 1.58 1.52 1.28 1.40 36 Richmond-Tweed NSW 1.56 1.73 1.24 1.65 37 Central Northern Sydney NSW 1.56 1.41 1.18 1.61 38 WA (excl. Perth and South West) WA 1.49 1.36 1.34 1.81 39 Fitzroy QLD 1.44 1.35 0.90 1.28 40 SA Regional SA 1.42 1.29 1.06 1.35 41 South Eastern NSW NSW 1.39 1.51 1.43 1.74 42 Barwon VIC 1.33 1.19 1.15 1.55 43 Northern Outer Melbourne VIC 1.31 1.35 1.12 1.86 44 Northern QLD QLD 1.29 1.53 0.77 0.90 45 Inner Western Sydney NSW 1.27 1.06 1.34 1.56 46 Goulburn & Ovens-Murray VIC 1.27 1.26 1.06 1.41 47 Inner Sydney NSW 1.21 1.09 1.11 1.45 48 Pine Rivers Shire & Redcliffe City QLD 1.21 1.18 0.73 1.10 49 TAS TAS 1.20 1.23 0.96 1.03 50 Eastern Suburbs NSW 1.18 0.99 1.21 1.25 51 Redland Shire QLD 1.14 1.18 1.11 1.00 52 Southeast Outer Brisbane QLD 1.13 1.05 0.79 0.84 53 Yarra Ranges Shire Part A VIC 1.11 1.03 1.11 1.80 54 Northern Beaches NSW 1.11 1.21 1.06 1.67 55 Mallee, Wimmera & Loddon VIC 1.10 1.11 1.02 1.16 56 Inner Brisbane QLD 1.10 0.77 0.67 0.84 57 Southern Adelaide SA 1.09 0.93 0.65 0.97 58 Eastern Adelaide SA 1.08 0.95 1.07 1.07 59 Gippsland (incl. East Gippsland) VIC 1.06 1.28 0.88 1.80 60 Eastern Outer Melbourne VIC 1.06 0.95 0.72 0.98 61 Western Adelaide SA 1.05 1.03 0.85 1.21 62 Greater Dandenong City VIC 1.00 1.67 1.12 1.83 63 Southeast Inner Brisbane QLD 0.97 0.98 0.80 0.95 64 Moreland City VIC 0.96 0.56 0.88 1.03 65 Eastern Middle Melbourne VIC 0.94 1.01 0.75 0.89 66 NT NT 0.93 0.71 0.62 0.75 67 Mornington Peninsula Shire VIC 0.92 1.39 1.39 1.64 68 Western Melbourne VIC 0.88 0.99 0.83 1.27 69 Southern Melbourne VIC 0.84 0.73 0.71 0.93 70 Northwest Outer Brisbane QLD 0.84 0.95 0.71 0.84

Structured Finance
Australian Mortgage Delinquency by Postcode — 30 September 2010
December 2010 21
Australian Regions Ranked by Dollar Amount 30+ Day Arrears at 30 September 10 (Continued) Rank Region State 30 Sep 10 (%) 31 Mar 10 (%) 30 Sep 09 (%) 31 Mar 09 (%)
71 Northwest Inner Brisbane QLD 0.77 0.82 0.55 0.50 72 ACT ACT 0.71 0.67 0.46 0.61 73 Inner Melbourne VIC 0.69 0.62 0.78 0.88 74 Lower Northern Sydney NSW 0.68 0.66 0.82 0.76 75 Northern Middle Melbourne VIC 0.66 0.75 0.58 0.83 76 Boroondara City VIC 0.27 0.58 0.68 0.87
Source: Fitch, ABS

Structured Finance
Australian Mortgage Delinquency by Postcode — 30 September 2010
December 2010 22
Australian Regions Ranked by Number of Loans in 30+ Day Arrears at 30 September 10 Rank Region State 30 Sep 10 (%) 31 Mar 10 (%) 30 Sep 09 (%) 31 Mar 09 (%)
1 Fairfield-Liverpool NSW 1.76 1.80 1.54 2.16 2 Blacktown NSW 1.69 1.75 1.35 2.00 3 Central Coast Sydney NSW 1.67 1.69 1.35 1.90 4 Outer Western Sydney NSW 1.61 1.60 1.37 1.84 5 Outer South Western Sydney NSW 1.60 1.71 1.28 1.80 6 South West WA WA 1.45 1.34 1.17 1.47 7 North West NSW NSW 1.42 1.39 1.15 1.61 8 Logan City (incl. Beaudesert Shire) QLD 1.39 1.24 0.99 1.21 9 Melton-Wyndham VIC 1.36 1.42 1.12 1.60 10 Gold Coast East QLD 1.35 1.18 0.90 1.14 11 Murray & Murrumbidgee VIC 1.34 1.42 0.98 1.14 12 Caboolture Shire QLD 1.33 1.24 0.99 1.10 13 Gold Coast West QLD 1.31 1.28 0.97 1.16 14 South West Metropolitan Perth WA 1.31 1.15 0.90 1.26 15 Hume City VIC 1.30 1.55 0.90 1.44 16 Ipswich City QLD 1.28 1.26 0.95 1.16 17 Frankston City VIC 1.27 1.04 0.69 1.15 18 Mid-North Coast NSW 1.27 1.32 1.06 1.37 19 East Metropolitan Perth WA 1.27 1.05 0.76 1.12 20 Northern Adelaide SA 1.20 1.13 0.82 1.08 21 Hunter NSW 1.19 1.34 1.26 1.75 22 Mackay QLD 1.18 1.31 0.75 0.85 23 Central Western Sydney NSW 1.17 1.13 0.98 1.34 24 Wide Bay-Burnett QLD 1.16 1.27 0.82 1.03 25 South Eastern Outer Melbourne VIC 1.16 1.26 0.96 1.45 26 Illawarra NSW 1.15 1.17 1.14 1.56 27 South Eastern NSW NSW 1.15 1.27 1.09 1.40 28 North Metropolitan Perth WA 1.15 1.11 0.80 0.91 29 South East Metropolitan Perth WA 1.14 1.14 0.94 1.16 30 Far North and West QLD QLD 1.13 1.23 0.89 0.99 31 Darling Downs & West Moreton QLD 1.13 1.01 0.59 0.91 32 Canterbury-Bankstown NSW 1.12 1.27 1.26 1.54 33 Central Highlands & Western District VIC 1.09 1.04 0.79 1.04 34 Fitzroy QLD 1.08 0.97 0.66 0.92 35 Sunshine Coast QLD 1.05 1.07 0.82 1.05 36 Richmond-Tweed NSW 1.04 1.05 0.68 0.93 37 WA (excl. Perth and South West) WA 1.04 1.19 0.99 1.23 38 SA Regional SA 1.02 0.95 0.79 1.01 39 Barwon VIC 0.95 0.87 0.80 1.09 40 Goulburn & Ovens-Murray VIC 0.91 0.98 0.80 1.12 41 Gippsland (incl. East Gippsland) VIC 0.90 0.99 0.71 1.30 42 TAS TAS 0.87 0.94 0.72 0.78 43 Northern Outer Melbourne VIC 0.87 0.92 0.72 1.15 44 Pine Rivers Shire & Redcliffe City QLD 0.87 0.89 0.47 0.69 45 Mallee, Wimmera & Loddon VIC 0.87 0.90 0.78 0.88 46 Northern QLD QLD 0.86 1.13 0.59 0.70 47 Redland Shire QLD 0.83 0.76 0.68 0.74 48 Central Northern Sydney NSW 0.83 0.75 0.62 0.89 49 St George-Sutherland NSW 0.83 0.79 0.68 0.88 50 Yarra Ranges Shire Part A VIC 0.78 0.88 0.87 1.32 51 Inner Sydney NSW 0.75 0.66 0.70 0.93 52 Southeast Outer Brisbane QLD 0.73 0.69 0.52 0.51 53 Southern Adelaide SA 0.71 0.69 0.51 0.71 54 Eastern Suburbs NSW 0.71 0.60 0.67 0.66 55 Western Adelaide SA 0.71 0.77 0.64 0.81 56 Central Metropolitan Perth WA 0.70 0.52 0.55 0.68 57 Mornington Peninsula Shire VIC 0.70 1.11 0.96 1.12 58 Inner Western Sydney NSW 0.70 0.68 0.78 0.95 59 Eastern Adelaide SA 0.69 0.61 0.59 0.64 60 Greater Dandenong City VIC 0.68 1.18 0.81 1.11 61 Western Melbourne VIC 0.66 0.76 0.61 0.90 62 Moreland City VIC 0.66 0.42 0.59 0.68 63 Eastern Outer Melbourne VIC 0.64 0.70 0.56 0.74 64 Eastern Middle Melbourne VIC 0.61 0.61 0.47 0.56 65 Northwest Outer Brisbane QLD 0.61 0.72 0.53 0.60 66 NT NT 0.60 0.49 0.51 0.59 67 Northern Beaches NSW 0.60 0.68 0.66 0.96 68 Inner Brisbane QLD 0.56 0.54 0.43 0.55 69 Southern Melbourne VIC 0.54 0.46 0.51 0.58 70 Southeast Inner Brisbane QLD 0.49 0.54 0.45 0.56

Structured Finance
Australian Mortgage Delinquency by Postcode — 30 September 2010
December 2010 23
Australian Regions Ranked by Number of Loans in 30+ Day Arrears at 30 September 10 (Continued) Rank Region State 30 Sep 10 (%) 31 Mar 10 (%) 30 Sep 09 (%) 31 Mar 09 (%)
71 Northwest Inner Brisbane QLD 0.47 0.54 0.42 0.31 72 Northern Middle Melbourne VIC 0.46 0.56 0.41 0.51 73 ACT ACT 0.44 0.46 0.32 0.43 74 Inner Melbourne VIC 0.44 0.44 0.51 0.60 75 Lower Northern Sydney NSW 0.39 0.39 0.46 0.49 76 Boroondara City VIC 0.20 0.38 0.40 0.46
Source: Fitch, ABS

Structured Finance
Australian Mortgage Delinquency by Postcode — 30 September 2010
December 2010 24
Australian Worst 100 Postcodes Ranked by Dollar Amount 30+ Days Arrears (%) Rank Postcode Districts 30Sep10(%) 31Mar10(%) 30Sep09(%) 31Mar09(%)
1 2315 CORLETTE, FINGAL BAY, NELSON BAY, SHOAL BAY 8.02 6.80 6.75 8.55
2 2262 BLUE HAVEN, BUDGEWOI, BUDGEWOI PENINSULA, BUFF POINT, COLONGRA, DOYALSON, DOYALSON NORTH, HALEKULANI, SAN REMO 4.38 3.89 4.05 4.10
3 4217 BENOWA, BUNDALL, BUNDALL BC, BUNDALL DC, CHEVRON ISLAND, GOLD COAST MC, ISLE OF CAPRI, MAIN BEACH, SURFERS PARADISE 4.33 3.28 2.68 3.35
4 2164 SMITHFIELD, SMITHFIELD WEST, WETHERILL PARK, WOODPARK 4.09 4.96 3.28 5.19 5 2759 ERSKINE PARK, ST CLAIR 3.87 2.57 2.21 2.67
6 6210
COODANUP, DUDLEY PARK, ERSKINE, FALCON, GREENFIELDS, HALLS HEAD, MADORA BAY, MANDURAH, MANDURAH DC, MANDURAH EAST, MANDURAH NORTH, MEADOW SPRINGS, SAN REMO, SILVER SANDS, WANNANUP 3.85 2.58 2.64 3.53
7 2190 CHULLORA, GREENACRE, MOUNT LEWIS 3.84 3.55 3.42 3.28
8 6167 ANKETELL, BERTRAM, CALISTA, CASUARINA, KWINANA BEACH, KWINANA TOWN CENTRE, MANDOGALUP, MEDINA, ORELIA, PARMELIA, POSTANS, THE SPECTACLES, WANDI 3.81 4.91 3.52 4.24
9 2766 EASTERN CREEK, ROOTY HILL 3.70 3.13 2.99 5.53 10 2168 ASHCROFT, BUSBY, CARTWRIGHT, GREEN VALLEY, HECKENBERG, HINCHINBROOK, MILLER, SADLEIR 3.69 3.57 2.94 3.94 11 6064 ALEXANDER HEIGHTS, GIRRAWHEEN, KOONDOOLA, MARANGAROO 3.61 2.58 1.59 2.36
12 2280 BELMONT, BELMONT NORTH, BELMONT SOUTH, CROUDACE BAY, FLORAVILLE, JEWELLS, MARKS POINT, VALENTINE 3.52 2.85 1.80 2.51
13 2176 ABBOTSBURY, BOSSLEY PARK, EDENSOR PARK, GREENFIELD PARK, PRAIRIEWOOD, ST JOHNS PARK, WAKELEY 3.47 2.78 2.53 3.46
14 2747 CAMBRIDGE GARDENS, CAMBRIDGE PARK, CLAREMONT MEADOWS, KINGSWOOD, LLANDILO, SHANES PARK, WERRINGTON, WERRINGTON COUNTY, WERRINGTON DOWNS 3.43 2.70 1.41 2.76
15 4132 CRESTMEAD, MARSDEN 3.40 2.09 1.05 1.67
16 2753 AGNES BANKS, BOWEN MOUNTAIN, GROSE VALE, GROSE WOLD, HOBARTVILLE, LONDONDERRY, RICHMOND, RICHMOND LOWLANDS, YARRAMUNDI 3.36 3.75 2.75 2.78
17 6110 GOSNELLS, HUNTINGDALE, MARTIN, SOUTHERN RIVER 3.36 3.42 2.35 3.34 18 6069 AVELEY, BELHUS, BRIGADOON, ELLENBROOK, ELLENBROOK EAST, THE VINES, UPPER SWAN 3.34 1.47 1.32 2.02 19 4212 HELENSVALE, HELENSVALE TOWN CENTRE, HOPE ISLAND, SANCTUARY COVE 3.34 4.64 3.03 4.47 20 4000 BRISBANE, BRISBANE ADELAIDE STREET, BRISBANE CITY, BRISBANE GPO, PETRIE TERRACE, SPRING HILL 3.30 0.74 1.10 1.17 21 2205 ARNCLIFFE, TURRELLA, WOLLI CREEK 3.28 2.50 2.47 2.39
22 2171 CARNES HILL, CECIL HILLS, ELIZABETH HILLS, HORNINGSEA PARK, HOXTON PARK, LEN WATERS ESTATE, MIDDLETON GRANGE, WEST HOXTON 3.15 3.15 3.02 3.55
23 2261
BATEAU BAY, BAY VILLAGE, BERKELEY VALE, BLUE BAY, CHITTAWAY BAY, CHITTAWAY POINT, GLENNING VALLEY, KILLARNEY VALE, LONG JETTY, MAGENTA, SHELLY BEACH, THE ENTRANCE, THE ENTRANCE NORTH, TOOWOON BAY, TUMBI UMBI 3.13 2.53 2.22 2.95
24 6230 BUNBURY, CAREY PARK, COLLEGE GROVE, DALYELLUP, DAVENPORT, EAST BUNBURY, GELORUP, GLEN IRIS, PELICAN POINT, SOUTH BUNBURY, USHER, VITTORIA, WITHERS 3.12 1.83 1.08 2.32
25 2575
ALPINE, AYLMERTON, BALACLAVA, BRAEMAR, BULLIO, COLO VALE, GOODMANS FORD, HIGH RANGE, HILL TOP, JOADJA, MANDEMAR, MITTAGONG, MOUNT LINDSEY, RENWICK, WATTLE RIDGE, WELBY, WILLOW VALE, WOODLANDS, YERRINBOOL 3.09 2.39 2.20 2.75
26 2767 DOONSIDE, WOODCROFT 3.08 3.61 2.40 2.87 27 4575 BIRTINYA, BOKARINA, BUDDINA, MINYAMA, PARREARRA, WARANA, WURTULLA 3.07 1.88 2.16 3.41
28 2250
BUCKETTY, CALGA, CENTRAL MANGROVE, EAST GOSFORD, ERINA, ERINA FAIR, GLENWORTH VALLEY, GOSFORD, GREENGROVE, HOLGATE, KARIONG, KULNURA, LISAROW, LOWER MANGROVE, MANGROVE CREEK, MANGROVE MOUNTAIN, MATCHAM, MOONEY MOONEY CREEK, MOUNT ELLIOT, MOUNT WHITE, NARA 3.06 2.24 1.96 2.92
29 2160 MERRYLANDS, MERRYLANDS WEST 3.05 3.05 2.53 3.83 30 6169 SAFETY BAY, SHOALWATER, WAIKIKI, WARNBRO 3.02 2.42 1.58 2.67 31 4213 AUSTINVILLE, BONOGIN, MUDGEERABA, NERANWOOD, SPRINGBROOK, TALLAI, WORONGARY 2.99 3.13 2.24 1.95 32 6059 DIANELLA 2.99 2.02 1.99 1.85 33 3976 HAMPTON PARK 2.97 2.73 3.17 2.84 34 2760 COLYTON, NORTH ST MARYS, OXLEY PARK, ROPES CROSSING, ST MARYS, ST MARYS EAST, ST MARYS SOUTH 2.95 3.20 3.29 3.62
35 2770 BIDWILL, BLACKETT, DHARRUK, EMERTON, HEBERSHAM, LETHBRIDGE PARK, MINCHINBURY, MOUNT DRUITT, MOUNT DRUITT VILLAGE, SHALVEY, TREGEAR, WHALAN, WILLMOT 2.94 3.68 3.25 5.08
36 2565 BARDIA, DENHAM COURT, INGLEBURN, MACQUARIE LINKS 2.92 2.65 2.63 3.69 37 2142 BLAXCELL, CAMELLIA, CLYDE, GRANVILLE, HOLROYD, ROSEHILL, SOUTH GRANVILLE 2.92 2.12 1.34 2.05 38 3337 KURUNJANG, MELTON, MELTON WEST, TOOLERN VALE 2.91 3.40 1.94 2.49 39 2216 BANKSIA, BRIGHTON-LE-SANDS, KYEEMAGH, ROCKDALE 2.90 2.23 1.45 1.87 40 2165 FAIRFIELD, FAIRFIELD EAST, FAIRFIELD HEIGHTS, FAIRFIELD WEST 2.89 2.93 2.08 3.75
41 6168 COOLOONGUP, EAST ROCKINGHAM, GARDEN ISLAND, HILLMAN, PERON, ROCKINGHAM, ROCKINGHAM BEACH, ROCKINGHAM DC 2.87 2.38 2.17 3.69
42 6172 PORT KENNEDY 2.83 1.60 0.28 0.73 43 2193 ASHBURY, CANTERBURY, HURLSTONE PARK 2.81 1.33 0.92 0.63 44 4879 CLIFTON BEACH, ELLIS BEACH, KEWARRA BEACH, PALM COVE, TRINITY BEACH, TRINITY PARK 2.81 2.25 2.53 3.51
45 5109 BRAHMA LODGE, SALISBURY EAST, SALISBURY EAST NORTHBRI AVE, SALISBURY HEIGHTS, SALISBURY PARK, SALISBURY PLAIN 2.77 1.07 1.97 2.58
46 2161 GUILDFORD, GUILDFORD WEST, OLD GUILDFORD, YENNORA 2.74 2.74 2.74 5.21 47 2195 LAKEMBA, WILEY PARK 2.72 1.32 1.33 3.25 48 4020 NEWPORT, REDCLIFFE, REDCLIFFE NORTH, SCARBOROUGH 2.68 2.20 1.89 2.17
49 6076 BICKLEY, CARMEL, GOOSEBERRY HILL, HACKETTS GULLY, KALAMUNDA, LESMURDIE, PAULLS VALLEY, PICKERING BROOK, PIESSE BROOK, RESERVOIR, WALLISTON, WALLISTON DC 2.68 0.82 0.58 1.27
50 6112 ARMADALE, BEDFORDALE, BROOKDALE, FORRESTDALE, HARRISDALE, HAYNES, HILBERT, MOUNT NASURA, MOUNT RICHON, PIARA WATERS, SEVILLE GROVE, WUNGONG 2.68 2.22 2.09 2.76
51 2541 BANGALEE, BOMADERRY, NORTH NOWRA, NOWRA, NOWRA DC, NOWRA EAST, NOWRA NORTH, SOUTH NOWRA, WEST NOWRA 2.67 1.19 1.31 2.32
52 2259
ALISON, BUSHELLS RIDGE, CEDAR BRUSH CREEK, CHAIN VALLEY BAY, CRANGAN BAY, DOORALONG, DURREN DURREN, FRAZER PARK, FREEMANS, GWANDALAN, HALLORAN, HAMLYN TERRACE, JILLIBY, KANWAL, KIAR, KINGFISHER SHORES, LAKE MUNMORAH, LEMON TREE, LITTLE JILLIBY, MANNERING 2.67 2.90 2.23 3.12
53 4114 KINGSTON, LOGAN CENTRAL, LOGAN CITY DC, WOODRIDGE 2.65 2.29 1.50 2.79 54 2146 OLD TOONGABBIE, TOONGABBIE, TOONGABBIE EAST 2.65 1.43 1.02 1.46 55 2166 CABRAMATTA, CABRAMATTA WEST, CANLEY HEIGHTS, CANLEY VALE, LANSVALE 2.62 2.08 1.85 2.95 56 3064 CRAIGIEBURN, DONNYBROOK, KALKALLO, MICKLEHAM, ROXBURGH PARK 2.59 2.20 1.77 2.68

Structured Finance
Australian Mortgage Delinquency by Postcode — 30 September 2010
December 2010 25
Australian Worst 100 Postcodes Ranked by Dollar Amount 30+ Days Arrears (%) (Continued) Rank Postcode Districts 30Sep10(%) 31Mar10(%) 30Sep09(%) 31Mar09(%)
57 2325
ABERDARE, ABERNETHY, BELLBIRD, BELLBIRD HEIGHTS, CEDAR CREEK, CESSNOCK, CESSNOCK WEST, CONGEWAI, CORRABARE, ELLALONG, ELRINGTON, GRETA MAIN, KEARSLEY, KITCHENER, LAGUNA, LOVEDALE, MILLFIELD, MORUBEN, MOUNT VIEW, NULKABA, OLNEY, PAXTON, PAYNES CROSSING, PE 2.56 2.58 2.05 4.47
58 4573 COOLUM BEACH, MARCUS BEACH, MOUNT COOLUM, PEREGIAN BEACH, PEREGIAN SPRINGS, POINT ARKWRIGHT, YAROOMBA 2.55 2.72 1.59 1.60
59 4655
BOORAL, BUNYA CREEK, CRAIGNISH, DUNDOWRAN, DUNDOWRAN BEACH, ELI WATERS, GREAT SANDY STRAIT, HERVEY BAY, HERVEY BAY DC, KAWUNGAN, KINGFISHER BAY RESORT, NIKENBAH, PIALBA, POINT VERNON, RIVER HEADS, SCARNESS, SUNSHINE ACRES, SUSAN RIVER, TAKURA, TOOGOOM, TO 2.55 1.82 1.58 1.85
60 2011 ELIZABETH BAY, HMAS KUTTABUL, POTTS POINT, RUSHCUTTERS BAY, WOOLLOOMOOLOO 2.53 1.37 1.52 2.60 61 6061 BALGA, MIRRABOOKA, NOLLAMARA, WESTMINSTER 2.53 2.45 1.19 1.52 62 6107 BECKENHAM, CANNINGTON, EAST CANNINGTON, KENWICK, QUEENS PARK, WATTLE GROVE, WILSON 2.52 2.15 1.97 1.92
63 2756
BLIGH PARK, CATTAI, CENTRAL COLO, CLARENDON, COLO, COLO HEIGHTS, CORNWALLIS, CUMBERLAND REACH, EBENEZER, FREEMANS REACH, GLOSSODIA, LOWER PORTLAND, MAROOTA, MCGRATHS HILL, MELLONG, MULGRAVE, PITT TOWN, PITT TOWN BOTTOMS, SACKVILLE, SACKVILLE NORTH, SCHEYV 2.50 3.23 2.55 3.38
64 6151 KENSINGTON, SOUTH PERTH, SOUTH PERTH ANGELO ST 2.49 1.00 0.29 1.00 65 6030 CLARKSON, MERRIWA, MINDARIE, QUINNS ROCKS, RIDGEWOOD, TAMALA PARK 2.49 2.41 1.45 2.21
66 4285
ALLENVIEW, BEAUDESERT, BIRNAM, BROMELTON, CAINBABLE, CEDAR GROVE, CEDAR VALE, CHINGHEE CREEK, CHRISTMAS CREEK, CRYNA, DARLINGTON, GLENEAGLE, HILLVIEW, INNISPLAIN, JOSEPHVILLE, KAGARU, KERRY, KNAPP CREEK, KOORALBYN, LAMINGTON, LARAVALE, MOUNT GIPPS, MUNDOO 2.48 1.88 0.83 2.44
67 2761 COLEBEE, DEAN PARK, GLENDENNING, HASSALL GROVE, OAKHURST, PLUMPTON 2.48 3.22 1.45 2.69 68 4280 JIMBOOMBA, NORTH MACLEAN, SOUTH MACLEAN, STOCKLEIGH 2.47 1.47 2.65 2.74
69 2560
AIRDS, AMBARVALE, APPIN, BLAIR ATHOL, BRADBURY, CAMPBELLTOWN, CAMPBELLTOWN NORTH, CATARACT, ENGLORIE PARK, GILEAD, GLEN ALPINE, KENTLYN, LEUMEAH, MACARTHUR SQUARE, ROSEMEADOW, RUSE, ST HELENS PARK, WEDDERBURN, WOODBINE 2.47 2.29 1.73 2.70
70 2768 GLENWOOD, PARKLEA, STANHOPE GARDENS 2.45 2.06 1.47 2.04
71 5118 BIBARINGA, BUCHFELDE, CONCORDIA, GAWLER, GAWLER BELT, GAWLER EAST, GAWLER RIVER, GAWLER SOUTH, GAWLER WEST, HEWETT, KALBEEBA, KANGAROO FLAT, KINGSFORD, REID, WARD BELT, WILLASTON 2.45 1.46 1.03 1.14
72 4128 SHAILER PARK, TANAH MERAH 2.42 1.36 0.73 0.78 73 2749 CASTLEREAGH, CRANEBROOK 2.42 2.30 1.09 2.42
74 3215 BELL PARK, BELL POST HILL, DRUMCONDRA, GEELONG NORTH, HAMLYN HEIGHTS, NORTH GEELONG, RIPPLESIDE 2.41 2.17 3.62 2.33
75 4207
ALBERTON, BAHRS SCRUB, BANNOCKBURN, BEENLEIGH, BELIVAH, BUCCAN, CEDAR CREEK, EAGLEBY, EDENS LANDING, HOLMVIEW, LOGAN VILLAGE, LUSCOMBE, MOUNT WARREN PARK, STAPYLTON, STEIGLITZ, WINDAROO, WOLFFDENE, WOONGOOLBA, YARRABILBA, YATALA, YATALA DC 2.39 2.10 1.55 1.82
76 2148 ARNDELL PARK, BLACKTOWN, BLACKTOWN WESTPOINT, HUNTINGWOOD, KINGS PARK, MARAYONG, PROSPECT 2.37 2.28 1.72 2.64
77 6065 ASHBY, DARCH, HOCKING, KINGSWAY, LANDSDALE, MADELEY, PEARSALL, SINAGRA, TAPPING, WANGARA, WANGARA DC, WANNEROO 2.35 2.49 1.90 1.56
78 4216 BIGGERA WATERS, COOMBABAH, HOLLYWELL, PARADISE POINT, RUNAWAY BAY, SOUTH STRADBROKE 2.34 1.92 2.27 2.81
79 2170 CASULA, CASULA MALL, CHIPPING NORTON, HAMMONDVILLE, LIVERPOOL, LIVERPOOL SOUTH, LIVERPOOL WESTFIELD, LURNEA, MOOREBANK, MOUNT PRITCHARD, PRESTONS, WARWICK FARM 2.32 2.69 2.12 3.40
80 2566 BOW BOWING, MINTO, MINTO DC, MINTO HEIGHTS, RABY, ST ANDREWS, VARROVILLE 2.25 2.22 1.69 2.62
81 3977 BOTANIC RIDGE, CANNONS CREEK, CRANBOURNE, CRANBOURNE EAST, CRANBOURNE NORTH, CRANBOURNE SOUTH, CRANBOURNE WEST, DEVON MEADOWS, JUNCTION VILLAGE, SANDHURST, SKYE 2.25 2.14 1.22 2.49
82 5114 ANDREWS FARM, BLAKEVIEW, CRAIGMORE, GOULD CREEK, HUMBUG SCRUB, ONE TREE HILL, SAMPSON FLAT, SMITHFIELD, SMITHFIELD PLAINS, SMITHFIELD WEST, ULEYBURY, YATTALUNGA 2.22 2.47 1.71 1.86
83 2430
BLACK HEAD, BOHNOCK, BOOTAWA, BRIMBIN, CABBAGE TREE ISLAND, CHATHAM, CROKI, CUNDLETOWN, DIAMOND BEACH, DUMARESQ ISLAND, FAILFORD, GHINNI GHINNI, GLENTHORNE, HALLIDAYS POINT, HILLVILLE, JONES ISLAND, KIWARRAK, KOORAINGHAT, KUNDLE KUNDLE, LANSDOWNE, LANSDOW 2.21 3.17 3.34 3.44
84 2285 CAMERON PARK, CARDIFF, CARDIFF HEIGHTS, CARDIFF SOUTH, EDGEWORTH, GLENDALE, MACQUARIE HILLS 2.19 2.55 0.66 1.95
85 4305
BASIN POCKET, BRASSALL, BREMER, CHURCHILL, COALFALLS, EAST IPSWICH, EASTERN HEIGHTS, FLINDERS VIEW, IPSWICH, LEICHHARDT, LIMESTONE RIDGES, MOORES POCKET, NEWTOWN, NORTH IPSWICH, NORTH TIVOLI, ONE MILE, RACEVIEW, SADLIERS CROSSING, TIVOLI, WEST IPSWICH, WO 2.16 2.03 1.08 1.60
86 6330
ALBANY, BAYONET HEAD, BIG GROVE, BORNHOLM, CENTENNIAL PARK, COLLINGWOOD HEIGHTS, COLLINGWOOD PARK, CUTHBERT, DROME, ELLEKER, EMU POINT, FRENCHMAN BAY, GLEDHOW, GOODE BEACH, GREEN VALLEY, KALGAN, KING RIVER, KRONKUP, LANGE, LITTLE GROVE, LOCKYER, LOWER KIN 2.15 2.04 2.00 1.65
87 4558 COTTON TREE, KULUIN, MAROOCHYDORE, MAROOCHYDORE BC, MAROOCHYDORE DC, SUNSHINE PLAZA 2.14 0.86 0.80 1.00
88 2640
ALBURY, BUNGOWANNAH, EAST ALBURY, ETTAMOGAH, GLENROY, LAVINGTON DC, MOORWATHA, NORTH ALBURY, OURNIE, SOUTH ALBURY, SPLITTERS CREEK, TABLE TOP, TALMALMO, THURGOONA, WEST ALBURY, WIRLINGA, WYMAH 2.12 2.55 2.12 3.39
89 2540
BAMARANG, BARRINGELLA, BASIN VIEW, BEECROFT PENINSULA, BERRARA, BEWONG, BOLONG, BOOLIJAH, BREAM BEACH, BROWNS MOUNTAIN, BRUNDEE, BUANGLA, BURRIER, CALLALA BAY, CALLALA BEACH, CAMBEWARRA, CAMBEWARRA VILLAGE, COMBERTON, COMERONG ISLAND, CUDMIRRAH, CULBURRA 2.08 2.02 2.13 2.84
90 2580
BANNABY, BANNISTER, BAW BAW, BOXERS CREEK, BRISBANE GROVE, BUNGONIA, CARRICK, CHATSBURY, CURRAWANG, CURRAWEELA, GOLSPIE, GOULBURN, GOULBURN DC, GOULBURN NORTH, GREENWICH PARK, GUNDARY, JERRONG, KINGSDALE, LAKE BATHURST, LOWER BORO, MAYFIELD, MIDDLE ARM, M 2.08 2.31 1.80 2.95
91 2830
BALLIMORE, BARBIGAL, BENI, BOOTHENBA, BROCKLEHURST, BRUAH, BUNGLEGUMBIE, BURRABADINE, BUTLERS FALLS, COOLBAGGIE, CUMBOOGLE, DUBBO, DUBBO DC, DUBBO EAST, DUBBO GROVE, DUBBO WEST, ESCHOL, EULOMOGO, GLENGERRA, GOONOO FOREST, JONES CREEK, KICKABIL, MINORE, MO 2.08 1.87 1.42 2.11
92 4214 ARUNDEL, ARUNDEL BC, ARUNDEL DC, ASHMORE, ASHMORE CITY, MOLENDINAR, PARKWOOD 2.08 2.09 1.38 1.42 93 4506 MOORINA, MORAYFIELD 2.08 1.43 1.68 1.51 94 3201 CARRUM DOWNS 2.06 2.16 1.13 2.15 95 2154 CASTLE HILL 2.05 1.96 1.42 2.42 96 4161 ALEXANDRA HILLS 2.04 1.62 0.75 1.03 97 3024 MAMBOURIN, MOUNT COTTRELL, WYNDHAM VALE 2.04 1.52 1.31 1.90 98 2147 KINGS LANGLEY, LALOR PARK, SEVEN HILLS, SEVEN HILLS WEST 2.02 1.90 1.45 1.93 99 4226 CLEAR ISLAND WATERS, MERRIMAC, ROBINA, ROBINA DC 2.02 1.68 1.56 1.77 100 3214 CORIO, NORLANE, NORTH SHORE 2.01 1.28 1.31 3.64
Source: Fitch

Structured Finance
Australian Mortgage Delinquency by Postcode — 30 September 2010
December 2010 26
Australian Worst 100 Postcodes Ranked by Number of Loans in 30+ Days Arrears (%) Rank Postcode Districts 30Sep10(%) 31Mar10(%) 30Sep09(%) 31Mar09(%)
1 2315 CORLETTE, FINGAL BAY, NELSON BAY, SHOAL BAY 3.28 3.37 3.39 4.18
2 2262 BLUE HAVEN, BUDGEWOI, BUDGEWOI PENINSULA, BUFF POINT, COLONGRA, DOYALSON, DOYALSON NORTH, HALEKULANI, SAN REMO 2.97 2.60 2.33 2.45
3 4132 CRESTMEAD, MARSDEN 2.70 1.54 0.98 1.25
4 6167 ANKETELL, BERTRAM, CALISTA, CASUARINA, KWINANA BEACH, KWINANA TOWN CENTRE, MANDOGALUP, MEDINA, ORELIA, PARMELIA, POSTANS, THE SPECTACLES, WANDI 2.63 3.14 2.12 2.89
5 2164 SMITHFIELD, SMITHFIELD WEST, WETHERILL PARK, WOODPARK 2.54 3.22 2.39 3.60 6 2766 EASTERN CREEK, ROOTY HILL 2.49 1.85 1.85 3.62 7 2759 ERSKINE PARK, ST CLAIR 2.42 1.79 1.49 1.68 8 2168 ASHCROFT, BUSBY, CARTWRIGHT, GREEN VALLEY, HECKENBERG, HINCHINBROOK, MILLER, SADLEIR 2.38 2.35 2.10 2.62
9 4217 BENOWA, BUNDALL, BUNDALL BC, BUNDALL DC, CHEVRON ISLAND, GOLD COAST MC, ISLE OF CAPRI, MAIN BEACH, SURFERS PARADISE 2.35 1.64 1.13 1.38
10 6064 ALEXANDER HEIGHTS, GIRRAWHEEN, KOONDOOLA, MARANGAROO 2.30 1.79 1.11 1.63 11 2190 CHULLORA, GREENACRE, MOUNT LEWIS 2.27 2.26 2.26 1.95 12 6110 GOSNELLS, HUNTINGDALE, MARTIN, SOUTHERN RIVER 2.20 2.43 1.74 2.43 13 3976 HAMPTON PARK 2.20 1.97 2.11 2.11
14 2747 CAMBRIDGE GARDENS, CAMBRIDGE PARK, CLAREMONT MEADOWS, KINGSWOOD, LLANDILO, SHANES PARK, WERRINGTON, WERRINGTON COUNTY, WERRINGTON DOWNS 2.17 1.71 0.98 1.95
15 6210
COODANUP, DUDLEY PARK, ERSKINE, FALCON, GREENFIELDS, HALLS HEAD, MADORA BAY, MANDURAH, MANDURAH DC, MANDURAH EAST, MANDURAH NORTH, MEADOW SPRINGS, SAN REMO, SILVER SANDS, WANNANUP 2.16 1.73 1.70 2.15
16 4280 JIMBOOMBA, NORTH MACLEAN, SOUTH MACLEAN, STOCKLEIGH 2.16 1.50 2.01 2.55 17 2176 ABBOTSBURY, BOSSLEY PARK, EDENSOR PARK, GREENFIELD PARK, PRAIRIEWOOD, ST JOHNS PARK, WAKELEY 2.13 1.85 1.67 2.23
18 2280 BELMONT, BELMONT NORTH, BELMONT SOUTH, CROUDACE BAY, FLORAVILLE, JEWELLS, MARKS POINT, VALENTINE 2.11 1.63 1.23 1.67
19 5109 BRAHMA LODGE, SALISBURY EAST, SALISBURY EAST NORTHBRI AVE, SALISBURY HEIGHTS, SALISBURY PARK, SALISBURY PLAIN 2.10 0.85 1.12 1.08
20 2575
ALPINE, AYLMERTON, BALACLAVA, BRAEMAR, BULLIO, COLO VALE, GOODMANS FORD, HIGH RANGE, HILL TOP, JOADJA, MANDEMAR, MITTAGONG, MOUNT LINDSEY, RENWICK, WATTLE RIDGE, WELBY, WILLOW VALE, WOODLANDS, YERRINBOOL 2.09 2.13 2.04 1.78
21 2767 DOONSIDE, WOODCROFT 2.08 2.36 1.61 1.70 22 2760 COLYTON, NORTH ST MARYS, OXLEY PARK, ROPES CROSSING, ST MARYS, ST MARYS EAST, ST MARYS SOUTH 2.06 2.29 2.04 2.74 23 2165 FAIRFIELD, FAIRFIELD EAST, FAIRFIELD HEIGHTS, FAIRFIELD WEST 2.06 1.93 1.50 2.32 24 6169 SAFETY BAY, SHOALWATER, WAIKIKI, WARNBRO 2.05 1.67 0.97 1.74 25 6069 AVELEY, BELHUS, BRIGADOON, ELLENBROOK, ELLENBROOK EAST, THE VINES, UPPER SWAN 1.99 0.99 0.60 1.40 26 6151 KENSINGTON, SOUTH PERTH, SOUTH PERTH ANGELO ST 1.98 0.36 0.34 0.41 27 6030 CLARKSON, MERRIWA, MINDARIE, QUINNS ROCKS, RIDGEWOOD, TAMALA PARK 1.97 1.92 1.07 1.61 28 4212 HELENSVALE, HELENSVALE TOWN CENTRE, HOPE ISLAND, SANCTUARY COVE 1.96 2.27 1.69 2.11 29 4575 BIRTINYA, BOKARINA, BUDDINA, MINYAMA, PARREARRA, WARANA, WURTULLA 1.95 1.09 1.28 1.72
30 2580
BANNABY, BANNISTER, BAW BAW, BOXERS CREEK, BRISBANE GROVE, BUNGONIA, CARRICK, CHATSBURY, CURRAWANG, CURRAWEELA, GOLSPIE, GOULBURN, GOULBURN DC, GOULBURN NORTH, GREENWICH PARK, GUNDARY, JERRONG, KINGSDALE, LAKE BATHURST, LOWER BORO, MAYFIELD, MIDDLE ARM, M 1.93 2.22 1.28 2.39
31 2160 MERRYLANDS, MERRYLANDS WEST 1.89 1.88 1.50 2.22 32 3201 CARRUM DOWNS 1.88 1.85 1.12 1.90
33 6112 ARMADALE, BEDFORDALE, BROOKDALE, FORRESTDALE, HARRISDALE, HAYNES, HILBERT, MOUNT NASURA, MOUNT RICHON, PIARA WATERS, SEVILLE GROVE, WUNGONG 1.83 1.79 1.53 2.02
34 2205 ARNCLIFFE, TURRELLA, WOLLI CREEK 1.82 1.41 1.41 1.77 35 2195 LAKEMBA, WILEY PARK 1.82 1.19 1.06 2.48
36 2770 BIDWILL, BLACKETT, DHARRUK, EMERTON, HEBERSHAM, LETHBRIDGE PARK, MINCHINBURY, MOUNT DRUITT, MOUNT DRUITT VILLAGE, SHALVEY, TREGEAR, WHALAN, WILLMOT 1.82 2.31 2.12 3.33
37 2193 ASHBURY, CANTERBURY, HURLSTONE PARK 1.82 0.83 0.51 0.34 38 2761 COLEBEE, DEAN PARK, GLENDENNING, HASSALL GROVE, OAKHURST, PLUMPTON 1.79 2.18 1.06 1.77 39 6172 PORT KENNEDY 1.78 1.19 0.30 0.74
40 2259
ALISON, BUSHELLS RIDGE, CEDAR BRUSH CREEK, CHAIN VALLEY BAY, CRANGAN BAY, DOORALONG, DURREN DURREN, FRAZER PARK, FREEMANS, GWANDALAN, HALLORAN, HAMLYN TERRACE, JILLIBY, KANWAL, KIAR, KINGFISHER SHORES, LAKE MUNMORAH, LEMON TREE, LITTLE JILLIBY, MANNERING 1.77 1.94 1.57 2.17
41 6054 ASHFIELD, BASSENDEAN, BASSENDEAN DC, EDEN HILL, KIARA, LOCKRIDGE 1.77 1.54 1.07 1.36 42 2161 GUILDFORD, GUILDFORD WEST, OLD GUILDFORD, YENNORA 1.77 1.67 1.66 3.01
43 2261
BATEAU BAY, BAY VILLAGE, BERKELEY VALE, BLUE BAY, CHITTAWAY BAY, CHITTAWAY POINT, GLENNING VALLEY, KILLARNEY VALE, LONG JETTY, MAGENTA, SHELLY BEACH, THE ENTRANCE, THE ENTRANCE NORTH, TOOWOON BAY, TUMBI UMBI 1.76 1.87 1.55 2.05
44 2560
AIRDS, AMBARVALE, APPIN, BLAIR ATHOL, BRADBURY, CAMPBELLTOWN, CAMPBELLTOWN NORTH, CATARACT, ENGLORIE PARK, GILEAD, GLEN ALPINE, KENTLYN, LEUMEAH, MACARTHUR SQUARE, ROSEMEADOW, RUSE, ST HELENS PARK, WEDDERBURN, WOODBINE 1.76 1.73 1.30 1.95
45 2753 AGNES BANKS, BOWEN MOUNTAIN, GROSE VALE, GROSE WOLD, HOBARTVILLE, LONDONDERRY, RICHMOND, RICHMOND LOWLANDS, YARRAMUNDI 1.75 2.18 2.07 1.91
46 3064 CRAIGIEBURN, DONNYBROOK, KALKALLO, MICKLEHAM, ROXBURGH PARK 1.72 1.70 1.30 1.84 47 6107 BECKENHAM, CANNINGTON, EAST CANNINGTON, KENWICK, QUEENS PARK, WATTLE GROVE, WILSON 1.72 1.42 1.53 1.56
48 6168 COOLOONGUP, EAST ROCKINGHAM, GARDEN ISLAND, HILLMAN, PERON, ROCKINGHAM, ROCKINGHAM BEACH, ROCKINGHAM DC 1.72 1.30 1.37 2.20
49 3337 KURUNJANG, MELTON, MELTON WEST, TOOLERN VALE 1.71 2.15 1.22 1.99
50 4510 BEACHMERE, BELLMERE, CABOOLTURE, CABOOLTURE BC, CABOOLTURE SOUTH, DONNYBROOK, MELDALE, MOODLU, ROCKSBERG, TOORBUL, UPPER CABOOLTURE 1.70 1.59 0.88 0.95
51 2142 BLAXCELL, CAMELLIA, CLYDE, GRANVILLE, HOLROYD, ROSEHILL, SOUTH GRANVILLE 1.70 1.58 1.06 1.39 52 4226 CLEAR ISLAND WATERS, MERRIMAC, ROBINA, ROBINA DC 1.69 1.24 0.66 1.04
53 2325
ABERDARE, ABERNETHY, BELLBIRD, BELLBIRD HEIGHTS, CEDAR CREEK, CESSNOCK, CESSNOCK WEST, CONGEWAI, CORRABARE, ELLALONG, ELRINGTON, GRETA MAIN, KEARSLEY, KITCHENER, LAGUNA, LOVEDALE, MILLFIELD, MORUBEN, MOUNT VIEW, NULKABA, OLNEY, PAXTON, PAYNES CROSSING, PE 1.68 1.64 1.71 2.80
54 2216 BANKSIA, BRIGHTON-LE-SANDS, KYEEMAGH, ROCKDALE 1.68 1.27 0.65 1.36 55 4213 AUSTINVILLE, BONOGIN, MUDGEERABA, NERANWOOD, SPRINGBROOK, TALLAI, WORONGARY 1.68 1.98 1.24 1.23
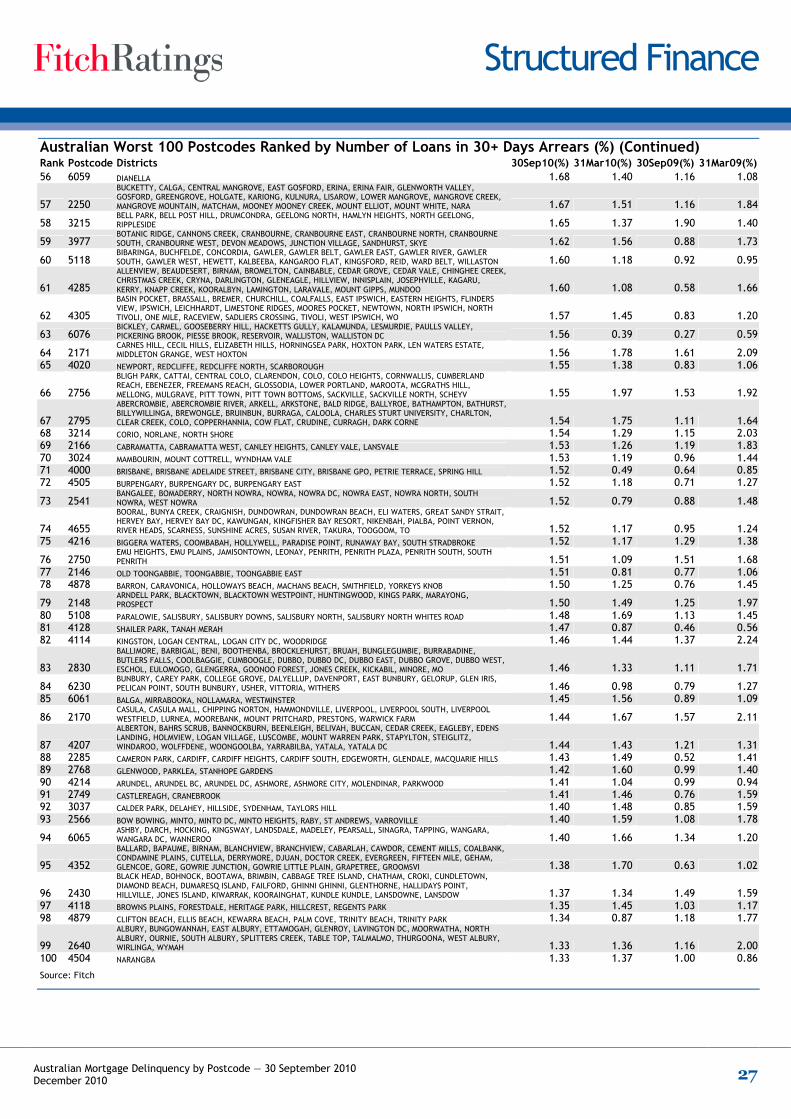
Structured Finance
Australian Mortgage Delinquency by Postcode — 30 September 2010
December 2010 27
Australian Worst 100 Postcodes Ranked by Number of Loans in 30+ Days Arrears (%) (Continued) Rank Postcode Districts 30Sep10(%) 31Mar10(%) 30Sep09(%) 31Mar09(%)
56 6059 DIANELLA 1.68 1.40 1.16 1.08
57 2250
BUCKETTY, CALGA, CENTRAL MANGROVE, EAST GOSFORD, ERINA, ERINA FAIR, GLENWORTH VALLEY, GOSFORD, GREENGROVE, HOLGATE, KARIONG, KULNURA, LISAROW, LOWER MANGROVE, MANGROVE CREEK, MANGROVE MOUNTAIN, MATCHAM, MOONEY MOONEY CREEK, MOUNT ELLIOT, MOUNT WHITE, NARA 1.67 1.51 1.16 1.84
58 3215 BELL PARK, BELL POST HILL, DRUMCONDRA, GEELONG NORTH, HAMLYN HEIGHTS, NORTH GEELONG, RIPPLESIDE 1.65 1.37 1.90 1.40
59 3977 BOTANIC RIDGE, CANNONS CREEK, CRANBOURNE, CRANBOURNE EAST, CRANBOURNE NORTH, CRANBOURNE SOUTH, CRANBOURNE WEST, DEVON MEADOWS, JUNCTION VILLAGE, SANDHURST, SKYE 1.62 1.56 0.88 1.73
60 5118 BIBARINGA, BUCHFELDE, CONCORDIA, GAWLER, GAWLER BELT, GAWLER EAST, GAWLER RIVER, GAWLER SOUTH, GAWLER WEST, HEWETT, KALBEEBA, KANGAROO FLAT, KINGSFORD, REID, WARD BELT, WILLASTON 1.60 1.18 0.92 0.95
61 4285
ALLENVIEW, BEAUDESERT, BIRNAM, BROMELTON, CAINBABLE, CEDAR GROVE, CEDAR VALE, CHINGHEE CREEK, CHRISTMAS CREEK, CRYNA, DARLINGTON, GLENEAGLE, HILLVIEW, INNISPLAIN, JOSEPHVILLE, KAGARU, KERRY, KNAPP CREEK, KOORALBYN, LAMINGTON, LARAVALE, MOUNT GIPPS, MUNDOO 1.60 1.08 0.58 1.66
62 4305
BASIN POCKET, BRASSALL, BREMER, CHURCHILL, COALFALLS, EAST IPSWICH, EASTERN HEIGHTS, FLINDERS VIEW, IPSWICH, LEICHHARDT, LIMESTONE RIDGES, MOORES POCKET, NEWTOWN, NORTH IPSWICH, NORTH TIVOLI, ONE MILE, RACEVIEW, SADLIERS CROSSING, TIVOLI, WEST IPSWICH, WO 1.57 1.45 0.83 1.20
63 6076 BICKLEY, CARMEL, GOOSEBERRY HILL, HACKETTS GULLY, KALAMUNDA, LESMURDIE, PAULLS VALLEY, PICKERING BROOK, PIESSE BROOK, RESERVOIR, WALLISTON, WALLISTON DC 1.56 0.39 0.27 0.59
64 2171 CARNES HILL, CECIL HILLS, ELIZABETH HILLS, HORNINGSEA PARK, HOXTON PARK, LEN WATERS ESTATE, MIDDLETON GRANGE, WEST HOXTON 1.56 1.78 1.61 2.09
65 4020 NEWPORT, REDCLIFFE, REDCLIFFE NORTH, SCARBOROUGH 1.55 1.38 0.83 1.06
66 2756
BLIGH PARK, CATTAI, CENTRAL COLO, CLARENDON, COLO, COLO HEIGHTS, CORNWALLIS, CUMBERLAND REACH, EBENEZER, FREEMANS REACH, GLOSSODIA, LOWER PORTLAND, MAROOTA, MCGRATHS HILL, MELLONG, MULGRAVE, PITT TOWN, PITT TOWN BOTTOMS, SACKVILLE, SACKVILLE NORTH, SCHEYV 1.55 1.97 1.53 1.92
67 2795
ABERCROMBIE, ABERCROMBIE RIVER, ARKELL, ARKSTONE, BALD RIDGE, BALLYROE, BATHAMPTON, BATHURST, BILLYWILLINGA, BREWONGLE, BRUINBUN, BURRAGA, CALOOLA, CHARLES STURT UNIVERSITY, CHARLTON, CLEAR CREEK, COLO, COPPERHANNIA, COW FLAT, CRUDINE, CURRAGH, DARK CORNE 1.54 1.75 1.11 1.64
68 3214 CORIO, NORLANE, NORTH SHORE 1.54 1.29 1.15 2.03 69 2166 CABRAMATTA, CABRAMATTA WEST, CANLEY HEIGHTS, CANLEY VALE, LANSVALE 1.53 1.26 1.19 1.83 70 3024 MAMBOURIN, MOUNT COTTRELL, WYNDHAM VALE 1.53 1.19 0.96 1.44 71 4000 BRISBANE, BRISBANE ADELAIDE STREET, BRISBANE CITY, BRISBANE GPO, PETRIE TERRACE, SPRING HILL 1.52 0.49 0.64 0.85 72 4505 BURPENGARY, BURPENGARY DC, BURPENGARY EAST 1.52 1.18 0.71 1.27
73 2541 BANGALEE, BOMADERRY, NORTH NOWRA, NOWRA, NOWRA DC, NOWRA EAST, NOWRA NORTH, SOUTH NOWRA, WEST NOWRA 1.52 0.79 0.88 1.48
74 4655
BOORAL, BUNYA CREEK, CRAIGNISH, DUNDOWRAN, DUNDOWRAN BEACH, ELI WATERS, GREAT SANDY STRAIT, HERVEY BAY, HERVEY BAY DC, KAWUNGAN, KINGFISHER BAY RESORT, NIKENBAH, PIALBA, POINT VERNON, RIVER HEADS, SCARNESS, SUNSHINE ACRES, SUSAN RIVER, TAKURA, TOOGOOM, TO 1.52 1.17 0.95 1.24
75 4216 BIGGERA WATERS, COOMBABAH, HOLLYWELL, PARADISE POINT, RUNAWAY BAY, SOUTH STRADBROKE 1.52 1.17 1.29 1.38
76 2750 EMU HEIGHTS, EMU PLAINS, JAMISONTOWN, LEONAY, PENRITH, PENRITH PLAZA, PENRITH SOUTH, SOUTH PENRITH 1.51 1.09 1.51 1.68
77 2146 OLD TOONGABBIE, TOONGABBIE, TOONGABBIE EAST 1.51 0.81 0.77 1.06 78 4878 BARRON, CARAVONICA, HOLLOWAYS BEACH, MACHANS BEACH, SMITHFIELD, YORKEYS KNOB 1.50 1.25 0.76 1.45
79 2148 ARNDELL PARK, BLACKTOWN, BLACKTOWN WESTPOINT, HUNTINGWOOD, KINGS PARK, MARAYONG, PROSPECT 1.50 1.49 1.25 1.97
80 5108 PARALOWIE, SALISBURY, SALISBURY DOWNS, SALISBURY NORTH, SALISBURY NORTH WHITES ROAD 1.48 1.69 1.13 1.45 81 4128 SHAILER PARK, TANAH MERAH 1.47 0.87 0.46 0.56 82 4114 KINGSTON, LOGAN CENTRAL, LOGAN CITY DC, WOODRIDGE 1.46 1.44 1.37 2.24
83 2830
BALLIMORE, BARBIGAL, BENI, BOOTHENBA, BROCKLEHURST, BRUAH, BUNGLEGUMBIE, BURRABADINE, BUTLERS FALLS, COOLBAGGIE, CUMBOOGLE, DUBBO, DUBBO DC, DUBBO EAST, DUBBO GROVE, DUBBO WEST, ESCHOL, EULOMOGO, GLENGERRA, GOONOO FOREST, JONES CREEK, KICKABIL, MINORE, MO 1.46 1.33 1.11 1.71
84 6230 BUNBURY, CAREY PARK, COLLEGE GROVE, DALYELLUP, DAVENPORT, EAST BUNBURY, GELORUP, GLEN IRIS, PELICAN POINT, SOUTH BUNBURY, USHER, VITTORIA, WITHERS 1.46 0.98 0.79 1.27
85 6061 BALGA, MIRRABOOKA, NOLLAMARA, WESTMINSTER 1.45 1.56 0.89 1.09
86 2170 CASULA, CASULA MALL, CHIPPING NORTON, HAMMONDVILLE, LIVERPOOL, LIVERPOOL SOUTH, LIVERPOOL WESTFIELD, LURNEA, MOOREBANK, MOUNT PRITCHARD, PRESTONS, WARWICK FARM 1.44 1.67 1.57 2.11
87 4207
ALBERTON, BAHRS SCRUB, BANNOCKBURN, BEENLEIGH, BELIVAH, BUCCAN, CEDAR CREEK, EAGLEBY, EDENS LANDING, HOLMVIEW, LOGAN VILLAGE, LUSCOMBE, MOUNT WARREN PARK, STAPYLTON, STEIGLITZ, WINDAROO, WOLFFDENE, WOONGOOLBA, YARRABILBA, YATALA, YATALA DC 1.44 1.43 1.21 1.31
88 2285 CAMERON PARK, CARDIFF, CARDIFF HEIGHTS, CARDIFF SOUTH, EDGEWORTH, GLENDALE, MACQUARIE HILLS 1.43 1.49 0.52 1.41 89 2768 GLENWOOD, PARKLEA, STANHOPE GARDENS 1.42 1.60 0.99 1.40 90 4214 ARUNDEL, ARUNDEL BC, ARUNDEL DC, ASHMORE, ASHMORE CITY, MOLENDINAR, PARKWOOD 1.41 1.04 0.99 0.94 91 2749 CASTLEREAGH, CRANEBROOK 1.41 1.46 0.76 1.59 92 3037 CALDER PARK, DELAHEY, HILLSIDE, SYDENHAM, TAYLORS HILL 1.40 1.48 0.85 1.59 93 2566 BOW BOWING, MINTO, MINTO DC, MINTO HEIGHTS, RABY, ST ANDREWS, VARROVILLE 1.40 1.59 1.08 1.78
94 6065 ASHBY, DARCH, HOCKING, KINGSWAY, LANDSDALE, MADELEY, PEARSALL, SINAGRA, TAPPING, WANGARA, WANGARA DC, WANNEROO 1.40 1.66 1.34 1.20
95 4352
BALLARD, BAPAUME, BIRNAM, BLANCHVIEW, BRANCHVIEW, CABARLAH, CAWDOR, CEMENT MILLS, COALBANK, CONDAMINE PLAINS, CUTELLA, DERRYMORE, DJUAN, DOCTOR CREEK, EVERGREEN, FIFTEEN MILE, GEHAM, GLENCOE, GORE, GOWRIE JUNCTION, GOWRIE LITTLE PLAIN, GRAPETREE, GROOMSVI 1.38 1.70 0.63 1.02
96 2430
BLACK HEAD, BOHNOCK, BOOTAWA, BRIMBIN, CABBAGE TREE ISLAND, CHATHAM, CROKI, CUNDLETOWN, DIAMOND BEACH, DUMARESQ ISLAND, FAILFORD, GHINNI GHINNI, GLENTHORNE, HALLIDAYS POINT, HILLVILLE, JONES ISLAND, KIWARRAK, KOORAINGHAT, KUNDLE KUNDLE, LANSDOWNE, LANSDOW 1.37 1.34 1.49 1.59
97 4118 BROWNS PLAINS, FORESTDALE, HERITAGE PARK, HILLCREST, REGENTS PARK 1.35 1.45 1.03 1.17 98 4879 CLIFTON BEACH, ELLIS BEACH, KEWARRA BEACH, PALM COVE, TRINITY BEACH, TRINITY PARK 1.34 0.87 1.18 1.77
99 2640
ALBURY, BUNGOWANNAH, EAST ALBURY, ETTAMOGAH, GLENROY, LAVINGTON DC, MOORWATHA, NORTH ALBURY, OURNIE, SOUTH ALBURY, SPLITTERS CREEK, TABLE TOP, TALMALMO, THURGOONA, WEST ALBURY, WIRLINGA, WYMAH 1.33 1.36 1.16 2.00
100 4504 NARANGBA 1.33 1.37 1.00 0.86
Source: Fitch

Structured Finance
Australian Mortgage Delinquency by Postcode — 30 September 2010
December 2010 28
Australian Mortgage Performance by Postcode as at 30 September 2010
NSW/ACT Postcodes Ranked by 30+ Day Arrears (%) as at 30 September 2010 By Number By Value
Rank Postcode Arrears (%) Rank Postcode Arrears (%) Rank Postcode Arrears (%) Rank Postcode Arrears (%)
1 2315 3.28 46 2640 1.33 1 2315 8.02 47 2830 2.08 2 2262 2.97 47 2036 1.33 2 2262 4.38 48 2154 2.05 3 2164 2.54 48 2263 1.32 3 2164 4.09 49 2147 2.02 4 2766 2.49 49 2777 1.32 4 2759 3.87 50 2251 1.99 5 2759 2.42 50 2486 1.32 5 2190 3.84 51 2000 1.99 6 2168 2.38 51 2147 1.32 6 2766 3.70 52 2777 1.97 7 2190 2.27 52 2196 1.31 7 2168 3.69 53 2750 1.97 8 2747 2.17 53 2763 1.30 8 2280 3.52 54 2763 1.96 9 2176 2.13 54 2565 1.30 9 2176 3.47 55 2777 1.97 10 2280 2.11 55 2540 1.28 10 2747 3.43 56 2750 1.97 11 2575 2.09 56 2251 1.25 11 2753 3.36 57 2763 1.96 12 2767 2.08 57 2000 1.21 12 2205 3.28 58 2795 1.95 13 2760 2.06 58 2567 1.21 13 2171 3.15 59 2257 1.93 14 2165 2.06 59 2340 1.21 14 2261 3.13 60 2444 1.91 15 2580 1.93 60 2260 1.20 15 2575 3.09 61 2204 1.86 16 2160 1.89 61 2800 1.20 16 2767 3.08 62 2263 1.83 17 2205 1.82 62 2530 1.16 17 2250 3.06 63 2155 1.80 18 2195 1.82 63 2204 1.15 18 2160 3.05 64 2145 1.79 19 2770 1.82 64 2145 1.30 19 2760 2.95 65 2260 1.79 20 2193 1.82 65 2287 1.30 20 2770 2.94 66 2500 1.75 21 2761 1.79 66 2444 1.28 21 2565 2.92 67 2567 1.75 22 2259 1.77 67 2745 1.25 22 2142 2.92 68 2480 1.73 23 2161 1.77 68 2011 1.21 23 2216 2.90 69 2486 1.72 24 2261 1.76 69 2570 1.21 24 2165 2.89 70 2340 1.70 25 2560 1.76 70 3500 1.21 25 2193 2.81 71 2196 1.68 26 2753 1.75 71 2450 1.20 26 2161 2.74 72 2077 1.61 27 2142 1.70 72 2155 1.20 27 2195 2.72 73 2234 1.61 28 2325 1.68 73 2257 1.16 28 2541 2.67 74 2144 1.59 29 2216 1.68 74 2144 1.15 29 2259 2.67 75 2800 1.59 30 2250 1.67 75 2077 1.14 30 2146 2.65 76 2233 1.55 31 2171 1.56 76 2233 1.11 31 2166 2.62 77 2036 1.55 32 2756 1.55 77 2154 1.10 32 2325 2.56 78 2745 1.54 33 2795 1.54 78 2153 1.10 33 2011 2.53 79 2570 1.47 34 2166 1.53 79 2615 1.07 34 2756 2.50 80 2530 1.43 35 2541 1.52 80 2026 1.07 35 2761 2.48 81 2010 1.40 36 2750 1.51 81 2500 1.06 36 2560 2.47 82 2287 1.39 37 2146 1.51 82 2480 1.05 37 2768 2.45 83 2200 1.36 38 2148 1.50 83 2620 1.03 38 2749 2.42 84 2905 1.31 39 2830 1.46 84 2620 1.03 39 2148 2.37 85 2153 1.30 40 2170 1.44 85 2010 1.01 40 2170 2.32 86 2650 1.22 41 2285 1.43 86 2650 1.00 41 2566 2.25 87 2450 1.14 42 2768 1.42 87 2234 0.98 42 2430 2.21 88 2620 1.12 43 2749 1.41 88 2200 0.94 43 2285 2.19 89 2620 1.12 44 2566 1.40 89 2905 0.90 44 2640 2.12 90 2615 1.09 45 2430 1.37 45 2540 2.08 91 2026 1.03 46 2580 2.08 92 3500 0.94
Source: Fitch

Structured Finance
Australian Mortgage Delinquency by Postcode — 30 September 2010
December 2010 29
QLD Postcodes Ranked by 30+ Day Arrears (%) as at 30 September 2010 By Number By Value
Rank Postcode Arrears (%) Rank Postcode Arrears (%) Rank Postcode Arrears (%) Rank Postcode Arrears (%)
1 4132 2.70 34 4124 1.18 1 4217 4.33 36 4221 1.73 2 4217 2.35 35 4810 1.16 2 4132 3.40 37 4301 1.69 3 4280 2.16 36 4161 1.14 3 4212 3.34 38 4878 1.67 4 4212 1.96 37 4300 1.14 4 4000 3.30 39 4560 1.66 5 4575 1.95 38 4210 1.13 5 4575 3.07 40 4118 1.64 6 4510 1.70 39 4558 1.13 6 4213 2.99 41 4505 1.64 7 4226 1.69 40 4869 1.12 7 4879 2.81 42 4109 1.56 8 4213 1.68 41 4221 1.10 8 4020 2.68 43 4551 1.54 9 4285 1.60 42 4573 1.08 9 4114 2.65 44 4504 1.50 10 4305 1.57 43 4165 1.08 10 4573 2.55 45 4300 1.49 11 4020 1.55 44 4868 1.07 11 4655 2.55 46 4127 1.47 12 4000 1.52 45 4650 0.98 12 4285 2.48 47 4740 1.44 13 4505 1.52 46 4560 0.98 13 4280 2.47 48 4210 1.44 14 4655 1.52 47 4220 0.97 14 4128 2.42 49 4870 1.40 15 4216 1.52 48 4115 0.95 15 4207 2.39 50 4814 1.39 16 4878 1.50 49 4670 0.95 16 4216 2.34 51 4306 1.34 17 4128 1.47 50 4503 0.95 17 4305 2.16 52 4556 1.33 18 4114 1.46 51 4814 0.94 18 4558 2.14 53 4220 1.33 19 4207 1.44 52 4870 0.94 19 4214 2.08 54 4680 1.33 20 4214 1.41 53 4306 0.94 20 4506 2.08 55 4152 1.33 21 4352 1.38 54 4740 0.93 21 4161 2.04 56 4165 1.32 22 4118 1.35 55 4680 0.91 22 4226 2.02 57 4670 1.29 23 4879 1.34 56 4209 0.91 23 4557 2.00 58 4350 1.28 24 4504 1.33 57 4500 0.88 24 4510 1.97 59 4115 1.26 25 4570 1.29 58 4215 0.86 25 4701 1.92 60 4503 1.24 26 4506 1.29 59 4551 0.82 26 4227 1.91 61 4215 1.23 27 4701 1.27 60 4350 0.82 27 4570 1.87 62 4209 1.22 28 4227 1.26 61 4109 0.77 28 4124 1.87 63 4078 1.21 29 4218 1.26 62 4034 0.75 29 4810 1.87 64 4500 1.12 30 4211 1.26 63 4069 0.69 30 4218 1.86 65 4122 1.03 31 4557 1.25 64 4078 0.68 31 4211 1.84 66 4034 1.03 32 4301 1.20 65 4817 0.68 32 4869 1.81 67 4017 1.03 33 4127 1.19 66 4017 0.68 33 4352 1.79 68 4817 0.97 34 4868 1.73 69 4069 0.81 35 4650 1.73 70 4053 0.64
Source: Fitch
VIC/TAS Postcodes Ranked by 30+ Day Arrears (%) as at 30 September 2010 By Number By Value
Rank Postcode Arrears (%) Rank Postcode Arrears (%) Rank Postcode Arrears (%) Rank Postcode Arrears (%)
1 3976 2.20 18 3500 1.06 1 3976 2.97 18 3630 1.44 2 3201 1.88 19 3023 1.06 2 3337 2.91 19 3174 1.42 3 3064 1.72 20 3910 1.00 3 3064 2.59 20 3136 1.41 4 3337 1.71 21 3630 0.96 4 3215 2.41 21 3082 1.41 5 3215 1.65 22 3082 0.95 5 3977 2.25 22 3023 1.33 6 3977 1.62 23 3174 0.93 6 3201 2.06 23 3844 1.27 7 3214 1.54 24 3805 0.92 7 3024 2.04 24 3805 1.24 8 3024 1.53 25 3429 0.88 8 3214 2.01 25 3216 1.20 9 3037 1.40 26 3216 0.88 9 3037 1.94 26 3178 1.16 10 3029 1.20 27 3020 0.88 10 3350 1.88 27 7250 1.14 11 3810 1.20 28 3136 0.80 11 3029 1.84 28 3020 1.10 12 3199 1.19 29 3175 0.74 12 3219 1.82 29 3429 1.09 13 3219 1.18 30 7250 0.73 13 3030 1.69 30 3806 1.05 14 3030 1.17 31 3178 0.69 14 3810 1.64 31 3175 1.01 15 3350 1.17 32 3150 0.67 15 3910 1.61 32 3150 0.95 16 3844 1.13 33 3806 0.65 16 3021 1.58 33 3500 0.94 17 3021 1.06 34 3550 0.55 17 3199 1.50 34 3550 0.78
Source: Fitch

Structured Finance
Australian Mortgage Delinquency by Postcode — 30 September 2010
December 2010 30
Western Australia Postcodes Ranked by 30+ Day Arrears (%) as at 30 September 2010 By Number By Value
Rank Postcode Arrears (%) Rank Postcode Arrears (%) Rank Postcode Arrears (%) Rank Postcode Arrears (%)
1 6167 2.63 14 6059 1.68 1 6210 3.85 14 6107 2.52 2 6064 2.30 15 6076 1.56 2 6167 3.81 15 6151 2.49 3 6110 2.20 16 6230 1.46 3 6064 3.61 16 6030 2.49 4 6210 2.16 17 6061 1.45 4 6110 3.36 17 6065 2.35 5 6169 2.05 18 6065 1.40 5 6069 3.34 18 6330 2.15 6 6069 1.99 19 6066 1.30 6 6230 3.12 19 6056 1.87 7 6151 1.98 20 6056 1.24 7 6169 3.02 20 6066 1.87 8 6030 1.97 21 6330 1.19 8 6059 2.99 21 6027 1.71 9 6112 1.83 22 6108 1.15 9 6168 2.87 22 6163 1.69 10 6172 1.78 23 6163 1.08 10 6172 2.83 23 6108 1.67 11 6054 1.77 24 6164 0.94 11 6076 2.68 24 6164 1.51 12 6107 1.72 25 6027 0.92 12 6112 2.68 25 6054 1.38 13 6168 1.72 26 6025 0.82 13 6061 2.53 26 6025 1.20
Source: Fitch
South Australia Postcodes Ranked by 30+ Day Arrears (%) as at 30 September 2010 By Number By Value
Rank Postcode Arrears (%) Rank Postcode Arrears (%) Rank Postcode Arrears (%) Rank Postcode Arrears (%)
1 5109 2.10 4 5114 1.28 1 5109 2.77 4 5108 1.84 2 5118 1.60 5 5158 0.98 2 5118 2.45 5 5158 1.53 3 5108 1.48 3 5114 2.22
Source: Fitch

Structured Finance
Australian Mortgage Delinquency by Postcode — 30 September 2010
December 2010 31
Statistical Subdivision within Fitch Regions
State Previous District (SSD) Included in the Previous Report New Fitch Region Description
ACT Belconnen No ACT Grouped at State level ACT Gungahlin-Hall No ACT Grouped at State level ACT North Canberra No ACT Grouped at State level ACT South Canberra No ACT Grouped at State level ACT Southern Tablelands (excl. Queanbeyan) No ACT Grouped at State level ACT Tuggeranong No ACT Grouped at State level ACT Weston Creek-Stromlo No ACT Grouped at State level ACT Woden Valley No ACT Grouped at State level NSW Blacktown Yes Blacktown Continue to be a separate division NSW Canterbury-Bankstown Yes Canterbury-Bankstown Continue to be a separate division NSW Gosford-Wyong Yes Central Coast Sydney Continue to be a separate division NSW Central Northern Sydney Yes Central Northern Sydney Continue to be a separate division NSW Central Western Sydney Yes Central Western Sydney Continue to be a separate division NSW Eastern Suburbs Yes Eastern Suburbs Continue to be a separate division NSW Fairfield-Liverpool Yes Fairfield-Liverpool Continue to be a separate division NSW Hunter SD Bal No Hunter Grouped at Statistical Division level NSW Newcastle Yes Hunter Grouped at Statistical Division level NSW Illawarra SD Bal No Illawarra Grouped at Statistical Division level NSW Nowra-Bomaderry No Illawarra Grouped at Statistical Division level NSW Wollongong Yes Illawarra Grouped at Statistical Division level NSW Inner Sydney Yes Inner Sydney Continue to be a separate division NSW Inner Western Sydney Yes Inner Western Sydney Continue to be a separate division NSW Lower Northern Sydney Yes Lower Northern Sydney Continue to be a separate division NSW Clarence (excl. Coffs Harbour) No Mid-North Coast Grouped at Statistical Division level NSW Coffs Harbour No Mid-North Coast Grouped at Statistical Division level NSW Hastings (excl. Port Macquarie) No Mid-North Coast Grouped at Statistical Division level NSW Port Macquarie No Mid-North Coast Grouped at Statistical Division level NSW Bathurst No North West NSW Grouped in a new region NSW Central Macquarie (excl. Dubbo) No North West NSW Grouped in a new region NSW Central Tablelands (excl. Bathurst & Orange) No North West NSW Grouped in a new region NSW Dubbo No North West NSW Grouped in a new region NSW Far West No North West NSW Grouped in a new region NSW Lachlan No North West NSW Grouped in a new region NSW Macquarie-Barwon No North West NSW Grouped in a new region NSW North Central Plain No North West NSW Grouped in a new region NSW Northern Slopes (excl. Tamworth) No North West NSW Grouped in a new region NSW Northern Tablelands No North West NSW Grouped in a new region NSW Orange No North West NSW Grouped in a new region NSW Tamworth No North West NSW Grouped in a new region NSW Upper Darling No North West NSW Grouped in a new region NSW Northern Beaches Yes Northern Beaches Continue to be a separate division NSW Outer South Western Sydney Yes Outer South Western Sydney Continue to be a separate division NSW Outer Western Sydney Yes Outer Western Sydney Continue to be a separate division NSW Lismore No Richmond-Tweed Grouped at Statistical Division level NSW Richmond-Tweed SD Bal No Richmond-Tweed Grouped at Statistical Division level NSW Tweed Heads & Tweed Coast No Richmond-Tweed Grouped at Statistical Division level NSW Lower South Coast No South Eastern NSW Grouped at Statistical Division level NSW Queanbeyan No South Eastern NSW Grouped at Statistical Division level NSW Snowy No South Eastern NSW Grouped at Statistical Division level NSW Southern Tablelands (excl. Queanbeyan) No South Eastern NSW Grouped at Statistical Division level NSW St George-Sutherland Yes St George-Sutherland Continue to be a separate division NT Barkly No NT Grouped at State level NT Central NT No NT Grouped at State level NT Darwin City No NT Grouped at State level NT East Arnhem No NT Grouped at State level NT Finniss No NT Grouped at State level NT Litchfield Shire No NT Grouped at State level NT Lower Top End NT No NT Grouped at State level NT Palmerston-East Arm No NT Grouped at State level QLD Caboolture Shire No Caboolture Shire Continue to be a separate division QLD Darling Downs SD Bal No Darling Downs & West Moreton Grouped in a new region QLD Lower West Moreton No Darling Downs & West Moreton Grouped in a new region QLD Toowoomba No Darling Downs & West Moreton Grouped in a new region QLD Upper West Moreton No Darling Downs & West Moreton Grouped in a new region QLD Cairns City Part A No Far North and West QLD Grouped in a new region QLD Central West No Far North and West QLD Grouped in a new region QLD Far North SD Bal No Far North and West QLD Grouped in a new region QLD North West No Far North and West QLD Grouped in a new region QLD South West No Far North and West QLD Grouped in a new region

Structured Finance
Australian Mortgage Delinquency by Postcode — 30 September 2010
December 2010 32
Statistical Subdivision within Fitch Regions (continued)
State Previous District Included in the Previous Report New Fitch Region Description
QLD Fitzroy SD Bal No Fitzroy Grouped at Statistical Division level QLD Gladstone No Fitzroy Grouped at Statistical Division level QLD Rockhampton No Fitzroy Grouped at Statistical Division level QLD Gold Coast East Yes Gold Coast East Continue to be a separate division QLD Gold Coast North No Gold Coast West Grouped in a new region QLD Gold Coast SD Bal No Gold Coast West Grouped in a new region QLD Gold Coast West Yes Gold Coast West Grouped in a new region QLD Inner Brisbane No Inner Brisbane Continue to be a separate division QLD Ipswich City Yes Ipswich City Continue to be a separate division QLD Beaudesert Shire Part A No Logan City (incl. Beaudesert Shire) Grouped in a new region QLD Logan City Yes Logan City (incl. Beaudesert Shire) Grouped in a new region QLD Mackay City Part A No Mackay Grouped at Statistical Division level QLD Mackay SD Bal No Mackay Grouped at Statistical Division level QLD Northern SD Bal No Northern QLD Grouped at Statistical Division level QLD Thuringowa City Part A No Northern QLD Grouped at Statistical Division level QLD Townsville City Part A No Northern QLD Grouped at Statistical Division level QLD Northwest Inner Brisbane Yes Northwest Inner Brisbane Continue to be a separate division QLD Northwest Outer Brisbane Yes Northwest Outer Brisbane Continue to be a separate division QLD Pine Rivers Shire Yes Pine Rivers Shire & Redcliffe City Grouped in a new region QLD Redcliffe City No Pine Rivers Shire & Redcliffe City Grouped in a new region QLD Redland Shire No Redland Shire Continue to be a separate division QLD Southeast Inner Brisbane Yes Southeast Inner Brisbane Continue to be a separate division QLD Southeast Outer Brisbane Yes Southeast Outer Brisbane Continue to be a separate division QLD Sunshine Coast Yes Sunshine Coast Grouped at Statistical Division level QLD Sunshine Coast SD Bal No Sunshine Coast Grouped at Statistical Division level QLD Bundaberg No Wide Bay-Burnett Grouped at Statistical Division level QLD Hervey Bay City Part A No Wide Bay-Burnett Grouped at Statistical Division level QLD Wide Bay-Burnett SD Bal No Wide Bay-Burnett Grouped at Statistical Division level SA Eastern Adelaide Yes Eastern Adelaide Continue to be a separate division SA Northern Adelaide Yes Northern Adelaide Continue to be a separate division SA Barossa No SA (excl. Adealide) Grouped in a new region SA Far North No SA (excl. Adealide) Grouped in a new region SA Fleurieu No SA (excl. Adealide) Grouped in a new region SA Flinders Ranges No SA (excl. Adealide) Grouped in a new region SA Kangaroo Island No SA (excl. Adealide) Grouped in a new region SA Lincoln No SA (excl. Adealide) Grouped in a new region SA Lower North No SA (excl. Adealide) Grouped in a new region SA Lower South East No SA (excl. Adealide) Grouped in a new region SA Mt Lofty Ranges No SA (excl. Adealide) Grouped in a new region SA Murray Mallee No SA (excl. Adealide) Grouped in a new region SA Pirie No SA (excl. Adealide) Grouped in a new region SA Riverland No SA (excl. Adealide) Grouped in a new region SA Upper South East No SA (excl. Adealide) Grouped in a new region SA West Coast No SA (excl. Adealide) Grouped in a new region SA Whyalla No SA (excl. Adealide) Grouped in a new region SA Yorke No SA (excl. Adealide) Grouped in a new region SA Southern Adelaide Yes Southern Adelaide Continue to be a separate division SA Western Adelaide Yes Western Adelaide Continue to be a separate division TAS Burnie-Devonport No TAS Grouped at State level TAS Central North No TAS Grouped at State level TAS Greater Hobart No TAS Grouped at State level TAS Greater Launceston No TAS Grouped at State level TAS Lyell No TAS Grouped at State level TAS North Eastern No TAS Grouped at State level TAS North Western Rural No TAS Grouped at State level TAS Southern No TAS Grouped at State level VIC East Barwon No Barwon Grouped at Statistical Division level VIC Greater Geelong City Part A No Barwon Grouped at Statistical Division level VIC West Barwon No Barwon Grouped at Statistical Division level VIC Boroondara City No Boroondara City Continue to be a separate division VIC Ballarat City No Central Highlands & Western District Grouped in a new region VIC East Central Highlands No Central Highlands & Western District Grouped in a new region VIC Glenelg No Central Highlands & Western District Grouped in a new region VIC Hopkins No Central Highlands & Western District Grouped in a new region VIC Warrnambool City No Central Highlands & Western District Grouped in a new region VIC West Central Highlands No Central Highlands & Western District Grouped in a new region VIC Eastern Middle Melbourne Yes Eastern Middle Melbourne Continue to be a separate division VIC Eastern Outer Melbourne Yes Eastern Outer Melbourne Continue to be a separate division

Structured Finance
Australian Mortgage Delinquency by Postcode — 30 September 2010
December 2010 33
Statistical Subdivision within Fitch Regions (continued)
State Previous District Included in the Previous Report New Fitch Region Description
VIC Frankston City No Frankston City Continue to be a separate division VIC East Gippsland Shire No Gippsland (incl. East Gippsland) Grouped in a new region VIC La Trobe Valley No Gippsland (incl. East Gippsland) Grouped in a new region VIC South Gippsland No Gippsland (incl. East Gippsland) Grouped in a new region VIC Wellington Shire No Gippsland (incl. East Gippsland) Grouped in a new region VIC West Gippsland No Gippsland (incl. East Gippsland) Grouped in a new region VIC East Ovens-Murray No Goulburn & Ovens-Murray Grouped in a new region VIC Greater Shepparton City Part A No Goulburn & Ovens-Murray Grouped in a new region VIC North Goulburn No Goulburn & Ovens-Murray Grouped in a new region VIC South Goulburn No Goulburn & Ovens-Murray Grouped in a new region VIC South West Goulburn No Goulburn & Ovens-Murray Grouped in a new region VIC West Ovens-Murray No Goulburn & Ovens-Murray Grouped in a new region VIC Wodonga No Goulburn & Ovens-Murray Grouped in a new region VIC Greater Dandenong City No Greater Dandenong City Continue to be a separate division VIC Hume City No Hume City Continue to be a separate division VIC Inner Melbourne Yes Inner Melbourne Continue to be a separate division VIC East Mallee No Mallee, Wimmera & Loddon Grouped in a new region VIC Greater Bendigo City Part A No Mallee, Wimmera & Loddon Grouped in a new region VIC Mildura Rural City Part A No Mallee, Wimmera & Loddon Grouped in a new region VIC North Loddon No Mallee, Wimmera & Loddon Grouped in a new region VIC North Wimmera No Mallee, Wimmera & Loddon Grouped in a new region VIC South Loddon No Mallee, Wimmera & Loddon Grouped in a new region VIC South Wimmera No Mallee, Wimmera & Loddon Grouped in a new region VIC West Mallee No Mallee, Wimmera & Loddon Grouped in a new region VIC Melton-Wyndham Yes Melton-Wyndham Continue to be a separate division VIC Moreland City No Moreland City Continue to be a separate division VIC Mornington Peninsula Shire No Mornington Peninsula Shire Continue to be a separate division VIC Albury No Murray & Murrumbidgee Grouped in a new region VIC Central Murray No Murray & Murrumbidgee Grouped in a new region VIC Central Murrumbidgee (excl. Wagga Wagga) No Murray & Murrumbidgee Grouped in a new region VIC East Ovens-Murray No Murray & Murrumbidgee Grouped in a new region VIC Lower Murrumbidgee No Murray & Murrumbidgee Grouped in a new region VIC Murray-Darling No Murray & Murrumbidgee Grouped in a new region VIC North Goulburn No Murray & Murrumbidgee Grouped in a new region VIC Upper Murray (excl. Albury) No Murray & Murrumbidgee Grouped in a new region VIC Wagga Wagga No Murray & Murrumbidgee Grouped in a new region VIC Northern Middle Melbourne Yes Northern Middle Melbourne Continue to be a separate division VIC Northern Outer Melbourne No Northern Outer Melbourne Continue to be a separate division VIC South Eastern Outer Melbourne Yes South Eastern Outer Melbourne Continue to be a separate division VIC Yarra Ranges Shire Part A No South Eastern Outer Melbourne Continue to be a separate division VIC Southern Melbourne Yes Southern Melbourne Continue to be a separate division VIC Western Melbourne Yes Western Melbourne Continue to be a separate division VIC Yarra Ranges Shire Part A No Yarra Ranges Continue to be a separate division WA Central Metropolitan No Central Metropolitan Perth Continue to be a separate division WA East Metropolitan Yes East Metropolitan Perth Continue to be a separate division WA North Metropolitan Yes North Metropolitan Perth Continue to be a separate division WA South East Metropolitan Yes South East Metropolitan Perth Continue to be a separate division WA South West Metropolitan Yes South West Metropolitan Perth Continue to be a separate division WA Blackwood No South West WA Grouped at Statistical Division level WA Bunbury No South West WA Grouped at Statistical Division level WA Mandurah No South West WA Grouped at Statistical Division level WA Preston No South West WA Grouped at Statistical Division level WA Vasse No South West WA Grouped at Statistical Division level WA Avon No WA (excl. Perth and South West) Grouped in a new region WA Campion No WA (excl. Perth and South West) Grouped in a new region WA Carnegie No WA (excl. Perth and South West) Grouped in a new region WA De Grey No WA (excl. Perth and South West) Grouped in a new region WA Fitzroy No WA (excl. Perth and South West) Grouped in a new region WA Fortescue No WA (excl. Perth and South West) Grouped in a new region WA Gascoyne No WA (excl. Perth and South West) Grouped in a new region WA Geraldton No WA (excl. Perth and South West) Grouped in a new region WA Greenough River No WA (excl. Perth and South West) Grouped in a new region WA Hotham No WA (excl. Perth and South West) Grouped in a new region WA Johnston No WA (excl. Perth and South West) Grouped in a new region WA Kalgoorlie/Boulder City Part A No WA (excl. Perth and South West) Grouped in a new region WA King No WA (excl. Perth and South West) Grouped in a new region WA Lakes No WA (excl. Perth and South West) Grouped in a new region

Structured Finance
Australian Mortgage Delinquency by Postcode — 30 September 2010
December 2010 34
Statistical Subdivision within Fitch Regions (continued)
State Previous District Included in the Previous Report New Fitch Region Description
WA Lefroy No WA (excl. Perth and South West) Grouped in a new region WA Moore No WA (excl. Perth and South West) Grouped in a new region WA Ord No WA (excl. Perth and South West) Grouped in a new region WA Other Territories No WA (excl. Perth and South West) Grouped in a new region WA Pallinup No WA (excl. Perth and South West) Grouped in a new region
Source: ABS, Fitch

Structured Finance
Australian Mortgage Delinquency by Postcode — 30 September 2010
December 2010 35
ALL FITCH CREDIT RATINGS ARE SUBJECT TO CERTAIN LIMITATIONS AND DISCLAIMERS. PLEASE READ THESE LIMITATIONS AND DISCLAIMERS BY FOLLOWING THIS LINK: HTTP://FITCHRATINGS.COM/UNDERSTANDINGCREDITRATINGS. IN ADDITION, RATING DEFINITIONS AND THE TERMS OF USE OF SUCH RATINGS ARE AVAILABLE ON THE AGENCY'S FREE WEB SITE AT WWW.FITCHRATINGS.COM. PUBLISHED RATINGS, CRITERIA, AND METHODOLOGIES ARE AVAILABLE FROM THIS SITE AT ALL TIMES. FITCH'S CODE OF CONDUCT, CONFIDENTIALITY, CONFLICTS OF INTEREST, AFFILIATE FIREWALL, COMPLIANCE, AND OTHER RELEVANT POLICIES AND PROCEDURES ARE ALSO AVAILABLE FROM THE CODE OF CONDUCT SECTION OF THIS SITE.
Copyright © 2010 by Fitch, Inc., Fitch Ratings Ltd. and its subsidiaries. One State Street Plaza, NY, NY 10004.Telephone: 1–800–753–4824, (212) 908–0500. Fax: (212) 480–4435. Fitch Australia Pty Ltd holds an Australian financial services licence (AFS licence no. 337123) which authorises it to provide credit ratings to wholesale clients only. Credit ratings information published by Fitch is not intended to be used by persons who are retail clients within the meaning of the Corporations Act 2001. Reproduction or retransmission in whole or in part is prohibited except by permission. All rights reserved. In issuing and maintaining its ratings, Fitch relies on factual information it receives from issuers and underwriters and from other sources Fitch believes to be credible. Fitch conducts a reasonable investigation of the factual information relied upon by it in accordance with its ratings methodology, and obtains reasonable verification of that information from independent sources, to the extent such sources are available for a given security or in a given jurisdiction. The manner of Fitch’s factual investigation and the scope of the third-party verification it obtains will vary depending on the nature of the rated security and its issuer, the requirements and practices in the jurisdiction in which the rated security is offered and sold and/or the issuer is located, the availability and nature of relevant public information, access to the management of the issuer and its advisers, the availability of pre-existing third-party verifications such as audit reports, agreed-upon procedures letters, appraisals, actuarial reports, engineering reports, legal opinions and other reports provided by third parties, the availability of independent and competent third-party verification sources with respect to the particular security or in the particular jurisdiction of the issuer, and a variety of other factors. Users of Fitch’s ratings should understand that neither an enhanced factual investigation nor any third-party verification can ensure that all of the information Fitch relies on in connection with a rating will be accurate and complete. Ultimately, the issuer and its advisers are responsible for the accuracy of the information they provide to Fitch and to the market in offering documents and other reports. In issuing its ratings Fitch must rely on the work of experts, including independent auditors with respect to financial statements and attorneys with respect to legal and tax matters. Further, ratings are inherently forward-looking and embody assumptions and predictions about future events that by their nature cannot be verified as facts. As a result, despite any verification of current facts, ratings can be affected by future events or conditions that were not anticipated at the time a rating was issued or affirmed. As a result, the information in this report is provided "as is" without any representation or warranty of any kind. A Fitch rating is an opinion as to the creditworthiness of a security. The rating does not address the risk of loss due to risks other than credit risk, unless such risk is specifically mentioned. Fitch is not engaged in the offer or sale of any security. A report providing a Fitch rating is neither a prospectus nor a substitute for the information assembled, verified and presented to investors by the issuer and its agents in connection with the sale of the securities. Ratings may be changed, suspended, or withdrawn at anytime for any reason in the sole discretion of Fitch. Fitch does not provide investment advice of any sort. Ratings are not a recommendation to buy, sell, or hold any security. Ratings do not comment on the adequacy of market price, the suitability of any security for a particular investor, or the tax–exempt nature or taxability of payments made in respect to any security. Fitch receives fees from issuers, insurers, guarantors, other obligors, and underwriters for rating securities. Such fees generally vary from US$1,000 to US$750,000 (or the applicable currency equivalent) per issue. In certain cases, Fitch will rate all or a number of issues issued by a particular issuer, or insured or guaranteed by a particular insurer or guarantor, for a single annual fee. Such fees are expected to vary from US$10,000 to US$1,500,000 (or the applicable currency equivalent). The assignment, publication, or dissemination of a rating by Fitch shall not constitute a consent by Fitch to use its name as an expert in connection with any registration statement filed under the United States securities laws, the Financial Services and Markets Act of 2000 of Great Britain, or the securities laws of any particular jurisdiction. Due to the relative efficiency of electronic publishing and distribution, Fitch research may be available to electronic subscribers up to three days earlier than to print subscribers.


![Australian Bushcraft [Australian Army education service] c1948](https://img.pdfslide.net/doc/110x75/553cd9be550346a43f8b4b6f/australian-bushcraft-australian-army-education-service-c1948.jpg)