Embed Size (px)
Citation preview

Structured Finance
www.fitchratings.com 7 June 2012
Residential Mortgage / EMEA
EMEA RMBS Cash Flow Analysis Criteria Sector-Specific Criteria Report
Summary
RMBS Cash Flow Analysis: Fitch Ratings has updated its criteria for the analysis of cash-
flows in new residential mortgage-backed securities (RMBS) transactions. This includes both
cash RMBS securitisation notes — which rely on the cash flows generated by the underlying
mortgage loans to meet the issuer‘s interest and principal payment obligations under the notes
— and ―synthetic‖ RMBS transactions, which involve synthetic excess spread (or, more
generally, payment obligations which are not exclusively driven by portfolio losses).
Existing Transactions: The agency will use the main elements of these criteria in its
surveillance methodology when analysing cash flows for existing RMBS notes rated by Fitch.
Key Related Criteria: This report replaces the previous report of the same title and does not
contain substantial changes to the rating framework and to the previous report. It serves as an
accompanying report to the latest country-specific criteria (available at www.fitchratings.com
and listed in Appendix 1), which contains details of country-specific assumptions and deviations
from the general modelling approach. These criteria should also be read in conjunction with the
report EMEA Cash RMBS Structural Overview, dated 20 May 2009.
Structural Analysis: This report focuses primarily on the structural analysis of the rated
securities. The report does not cover the operational risk analysis or the credit risk analysis
performed by Fitch to determine the expected losses in each rating category for a residential
mortgage portfolio (these are described in the reports titled Global Rating Criteria for Structured
Finance Servicers, 13 August 2010 and EMEA Residential Mortgage Loss Criteria, 7 June
2012 respectively).
Key Highlights
Key Drivers: The main risk factors affecting the cash flow analysis described in this report are
default timing and recovery timing assumptions, prepayment rate assumptions, and interest
rate assumptions, as well as their interaction with the transaction hedging arrangements.
Risk Factor Weightings: When analysing a transaction, and depending on the structure of the
transaction, Fitch may give each factor different weightings in the rating stress scenarios it
analyses in order to determine the rating to be assigned to the transaction.
Inside This Report
Summary 1 Key Highlights 1 Role of Cash Flow Analysis and
Data Adequacy 2 Building Blocks of RMBS Cash
Flow Analysis 2 Cash Flow Modelling Criteria:
Standard Portfolio Assumptions 3 Commingling Risk and Portfolio
Variations 16 RMBS Structural Features 18 Tail Risk 20 Standard Scenarios Recap 20 Rating Sensitivity Analysis 21 Surveillance 21 Scope and Limitations 21 Appendix 1: Related Research
a 22
Related Criteria
See Appendix 1
Analysts
Michele Cuneo +39 02 879087 230 [email protected]
Andre Dahlkamp +44 20 3530 1145 [email protected] Ketan Thaker +44 20 3530 1392 [email protected] Gregg Kohansky +44 20 3530 1376 [email protected]
This criteria report replaces the
previous report of the same title,
dated 7 June 2011 and does not
contain substantial changes to the
rating framework and to the previous
report.

Structured Finance
EMEA RMBS Cash Flow Analysis Criteria
June 2012 2
Role of Cash Flow Analysis and Data Adequacy
The main purpose of Fitch‘s cash flow criteria is to analyse whether payments of principal and
interest on the various classes of notes will be made in accordance with the terms of the
transaction documentation. This analysis is based on expected losses resulting from the
portfolio analysis as described in the report EMEA Residential Mortgage Loss Criteria and the
stress scenarios described in this report.
The agency has developed a proprietary Excel-based cash flow model which can be used for
the vast majority of RMBS transaction structures. The general characteristics of the model are
described in the report EMEA Cash RMBS Structural Overview, dated 20 May 2009 and
available at www.fitchratings.com.
Due to the complexity of certain transaction structures, eg master trusts, Fitch may use an
external cash flow model provided by the transaction arranger. This is reviewed by Fitch
analysts to ensure it is consistent with the agency‘s cash flow analysis criteria (as described in
the section Third Party Models in the report Criteria for Model Management, dated 13 August
2010 and available at www.fitchresearch.com).
Fitch‘s cash flow modelling assumptions rely on available market data and the accuracy of the
historical data provided by the originator and servicer. Fitch expects to receive historical
mortgage loan prepayment and recovery timing information.
In the absence of sufficient data, the agency may use proxy or supplemental information in
order to have a conservative basis from which to derive its assumptions as regards future
performance. Alternatively, in the absence of adequate data or if available data does not meet
Fitch‘s standards, Fitch may apply a rating cap or may decide not to assign or maintain
transaction ratings.
As the main purpose of the agency‘s cash flow analysis is to test the ability of the structure to
meet its obligations under various stress scenarios, some of the assumptions represent
extreme conditions which go beyond the historically observed data.
To determine the rating of a given tranche of notes, Fitch analyses various stress scenarios to
determine whether the payment of interest and principal under such notes is fulfilled in all
relevant stress scenarios. However, while the cash flow model output is an important
consideration in determining the final rating, ratings are ultimately assigned by a Fitch credit
committee, which also considers other quantitative and qualitative factors.
Building Blocks of RMBS Cash Flow Analysis
The factor that affects the cash flow analysis the most is the expected performance of the
underlying mortgage collateral, mainly in terms of defaults and loss severity (or loss given
default); these aspects are discussed in detail in the report EMEA Residential Mortgage Loss
Criteria and in the various country-specific addenda. The effects of a potential disruption to the
portfolio performance on the noteholders can be mitigated by including some form of credit
enhancement (CE) to the notes, ie, by providing the notes with ―extra-protection‖, either in the
form of external or internal support.
Fitch notes that in EMEA cash RMBS transactions rated by the agency CE may consist of a
combination of some or all of the following: excess spread (ExS), subordination amongst
different classes of notes, over-collateralisation of assets over liabilities, cash reserves (or
reserve funds) and, in some instances, support provided by third parties (such as eg the hedge
counterparty).
One of the primary purposes of the cash flow analysis is to determine the amount of credit
support that is provided by ExS — which is also driven by prepayments and defaults — as well
as the effectiveness of the structure in utilising ExS to mitigate any underperformance of the
portfolio.

Structured Finance
EMEA RMBS Cash Flow Analysis Criteria
June 2012 3
Another purpose of the cash flow analysis is to test whether the ―liquid‖ forms of CE (eg, the
ExS and cash reserve) are sufficient to compensate for temporary liquidity shortfalls caused,
for example, by delinquent mortgages or adverse interest rate movements. Additional liquidity
support may be necessary in certain scenarios in order to ensure that the issuer is able to meet
its interest payment obligations under the notes. This can take the form of external third-party
liquidity facilities or internal liquidity by way of ―borrowing principal funds‖ to pay interest.
Cash Flow Modelling Criteria: Standard Portfolio Assumptions
Fitch‘s proprietary cash flow model simulates the cash flows from the mortgage portfolio and
from the other transaction counterparties (eg, the swap counterparty). It determines the
reallocation of cash flows within the structure to pay interest on, and the principal of, the notes
in accordance with the specific priority of payments (or ―waterfall‖) set out in the transaction
documentation. The following section provides an overview of Fitch‘s standard assumptions
regarding the individual risk factors affecting the cash flows generated by the portfolio and the
costs related to the servicing of the portfolio and the issuer.
As a general principle, if the transaction includes structural features that make one or more of
the stress assumptions described below beneficial to the notes, Fitch may consider alternative
stress scenarios (see the section Interest Rate Scenarios for Transactions Including Interest
Rate Caps); alternatively, Fitch may analyse the transaction as if the structural feature were not
available (see the section titled Swaps Covering the Cost of Carry of Delinquencies).
Transaction-specific deviations from the set-up described in the following three sections will be
disclosed in presales and new issue reports.
Portfolio Principal Amortisation Profile
Based on available loan-by-loan information, Fitch uses a proprietary model to calculate the
amortisation of the loans according to their terms. The scheduled principal amortisation is
calculated for each loan assuming zero prepayments and no defaults or delinquency: in Fitch‘s
model, prepayments, delinquencies and defaults are ―overlayed‖ on the scheduled principal
pay-down of the portfolio.
In case of revolving transactions (see, for example, the section titled Revolving Periods), Fitch
takes into account the impact of evolution on the portfolio principal amortisation profile.
Common principal amortisation types for loans in EMEA RMBS transactions include the
following.
Constant Principal: a constant amount of principal is repaid in each instalment. In
practice, the loan amount is divided by the number of instalments in order to determine the
principal payment due on each loan payment date.
Actuarial Amortisation (Constant Instalment): the principal due on each instalment is
calculated according to a formula that ensures that the instalment paid by the borrower
(comprising a principal and an interest component) is constant over time. For floating rate
loans (where the instalment amount cannot be fixed, unless interest rates are stable
throughout the life of the loan), the schedule of the principal payments can be either set at
the loan inception and based on the interest rate levels as of the loan‘s granting or reset at
each loan payment date and based on the then current interest rate levels. In the second
case, the loan‘s principal amortisation speed will depend on the interest rate trend; it will
decrease in a rising interest rate environment and increase in a falling interest rate
environment.
Floating Maturity Loans: these are floating rate loans whose instalments (comprising an
interest and a principal component) are calculated according to the actuarial amortisation
formula described above, but which are capped at a certain amount. Any ―extra payment‖
due to interest rate increases will add one or more instalments to the loan and thereby

Structured Finance
EMEA RMBS Cash Flow Analysis Criteria
June 2012 4
increase its maturity, while decreases in interest rates will shorten the loan‘s maturity. Most
of these loans envisage upwards adjustments of the instalment cap, if interest rates
increase above certain thresholds.
Increasing Instalment Amortisation: consists of an alteration of the actuarial
amortisation formula which has the effect of producing increasing instalments (assuming
stable interest rates). From a principal perspective, increasing instalment loans amortise
more slowly than loans with actuarial amortisation.
Loans with Flexible Maturities: under certain conditions (eg, no past arrears on the loan)
the borrower has the option of changing the maturity of the loan.
Interest Only or Bullet Amortisation: the full amount of the loan is repaid at maturity and
during the life of the loan the borrower will pay only interest.
Micro-Bullets Amortisation: the borrower has the option to choose when to repay the
loan‘s principal according to a certain flexible schedule (eg, 5% of the principal must be
repaid every two years, with no specification of the payment dates).
Some originators give their borrowers the option to switch from one amortisation type to
another or, more commonly, combine the repayment features described above (eg, a loan that
is half constant instalment and half bullet).
Considering the increasing complexity of the amortisation of loans in certain jurisdictions, Fitch
takes particular care to understand the amortisation mechanics of the products included in the
portfolio. In particular, the agency expects originators to be able to provide models showing any
non-standard amortisation options they offer to their borrowers.
As discussed above, interest rate scenarios can have an important role in determining the
principal amortisation profile of the portfolio, and this aspect is taken into consideration in
Fitch‘s models. The following two charts show the aggregate principal amortisation profile and
the issuer‘s principal receipts for a floating rate portfolio where all the loans amortise according
to the actuarial formula, with principal reset upon interest rate change.
Figure 1 Figure 2
0
20
40
60
80
100
1 36 71 106 141 176 211 246 281 316 351
(Months)
AAA - rising interest rates
BB - rising interest rates
Stable interest rates
(% of portfolio at closing)
Portfolio Amortisation ProfileImpact of different interest rate scenarios
Source: Fitch
0.0
0.1
0.2
0.3
0.4
0.5
1 36 71 106 141 176 211 246 281 316 351
AAA - rising interest rates
BB - rising interest rates
Stable interest rates
(% of portfolio at closing)
Principal Cash-in ProfileImpact of different interest rate scenarios
Source: Fitch
(Months)
The first figure shows the effect of ‗AAA‘ and ‗BB' increasing interest scenarios on principal
amortisation, illustrating the reverse correlation between interest rate trends and principal
repayment speed; the second chart shows the impact on the principal funds available to the
issuer and the implications for its liquidity position.
The line showing the portfolio amortisation in a stable interest rate environment demonstrates
how the principal amortisation of the portfolio changes, if the floating loans amortise according
to the actuarial amortisation, with no principal re-set (the principal schedule is defined at loan
inception and based on the then current interest rate level, ie, assuming a stable interest rate
environment).

Structured Finance
EMEA RMBS Cash Flow Analysis Criteria
June 2012 5
As stated above, Fitch‘s model overlays prepayments, delinquencies and defaults on the
portfolio‘s scheduled principal amortisation. It is worth noting that in those scenarios where
prepayments, defaults and delinquencies are high, the portfolio amortisation will be driven more
by these events than by the product amortisation features designed by the originator.
Prepayment Rates
For the purposes of RMBS cash flow modelling, Fitch makes jurisdiction-specific assumptions
on prepayment rates ie, voluntary early principal redemptions excluding scheduled principal
and unpaid principal due to arrears or defaults. For Fitch‘s EMEA RMBS prepayment scenarios,
please refer to the assumptions in the spreadsheet titled EMEA Residential Mortgage
Prepayment Assumptions, unless the assumptions differ in the country-specific criteria, in
which case, readers are advised that the country-specific criteria takes priority. Fitch‘s
prepayment rate assumptions are expressed as a percentage of the current total portfolio
principal outstanding (gross of the scheduled principal payments). These assumptions consist
of constant annualised rates and therefore are usually referred to as ―constant prepayment
rates‖ (CPRs).
The prepayment rate is a key variable in determining the lifetime volume (in cash terms) and
periodic percentage of ExS generated by the structure: the faster the amortisation of the
portfolio, the lower the lifetime volume of ExS available for noteholders. In addition, if the loans
paying the highest coupons are the first to prepay, high prepayments would also lower the
portfolio weighted average spread (WAS) (unless guaranteed by a total return swap, which in
turn may create counterparty dependency; see section titled Swap Modelling) - and therefore
the ExS level (see the section titled WAS Compression Assumptions for details on Fitch‘s
assumptions in this respect). To account for the potential variability in prepayment speeds,
Fitch models both high- and low-speed prepayment scenarios. The chart on this page shows
the effect of different CPR assumptions on the ‗AAA‘ rising interest amortisation profile of the
portfolio analysed in the two charts under the section titled Portfolio Principal Amortisation
Profile.
As discussed in the previous paragraph, it is evident how in high prepayment environments the
CPR assumption becomes the main driver of the portfolio principal amortisation profile. For
example (see the diagram titled Portfolio Amortisation Profile), with a prepayment rate of 20%
per annum, almost 80% of the portfolio would repay within six years after closing, when only
13% would have repaid according to the schedules defined by the loan agreements (0% CPR).
The weighted average life of the pool, around 10.5 years in a 0% CPR environment, becomes
7.5 years with 5% CPR and 3.75 with 20% CPR.
Prepayment Assumptions – High Prepayments
The level of prepayments experienced in Europe varies significantly across countries, and
depends on a series of variables analysed in
detail in the report Diversity in Union –
Prepayment Drivers in European RMBS –
update, dated 11 October 2007 and
available at www.fitchresearch.com. Based
on the empirical prepayment rate evidence in
each jurisdiction, Fitch has determined the
rising prepayment stresses detailed in the
country-specific RMBS criteria papers (see
Appendix 1 hereto).
Except for UK non-conforming transactions
(see the UK country-specific criteria), Fitch
models a ―ramp-up‖ period of three to four
years for unseasoned transactions, as
Figure 3
0
20
40
60
80
100
1 36 71 106 141 176 211 246 281 316 351
(Months)
0% CPR 5% CPR 20% CPR(%)
Portfolio Amortisation Profile Impact of different CPRs
Source: Fitch

Structured Finance
EMEA RMBS Cash Flow Analysis Criteria
June 2012 6
empirical evidence shows that the propensity to prepay is low in the years immediately after
origination - owing in part to incentive rates or prepayment penalties.
The prepayment rate is applied to the performing balance (ie, exclusive of defaulted and
delinquent loans) before any scheduled principal payment; therefore, the total amount of the
prepaid portfolio in Fitch modelling scenarios declines as the rate of defaults and delinquencies
rises.
The high prepayment stress assumptions may be adjusted on a case-by-case basis should an
individual lender‘s prepayment experience differ significantly from the one analysed by Fitch in
the relevant jurisdiction. Deviations are also possible where the transaction documentation
includes specific loan repurchase provisions (eg, repurchase of loans if the lender wants to re-
negotiate the terms of the agreement with the borrower, further advances, etc) or where the
specific products offered by a lender have a higher prepayment propensity. In all cases,
adjustments will be disclosed in presales and new issue reports.
Prepayment Assumptions – Low Prepayments
Although generally high prepayment scenarios are more stressful for the notes (owing to the
reduced volume of ExS), there may be circumstances under which low prepayment rates could
pose an additional risk factor. This is the case, for example, for ―bullet‖ notes (which are
redeemed in full at maturity and normally have much shorter amortisation periods than those of
the underlying portfolio) since it is necessary to accumulate sufficient cash in time to meet the
repayment of such bullet notes.
Similarly, low prepayment scenarios might be more stressful if the structure includes ExS
trapping mechanisms to accelerate the notes paydown that are linked to the portfolio CPR, or if
the most senior notes are pass-through but have a shorter legal maturity than the other notes
(ie, the structure relies on the expectation that the principal portfolio paydown - before the most
senior notes‘ legal maturity - will be enough to repay them).
For these reasons, Fitch will run low prepayment scenarios based on Fitch‘s expectation of
future CPR trends as well as the historical CPR levels for the securitised product types in the
relevant jurisdiction as well as the level of the CPR-related triggers in the structure, if any.
Weighted Average Spread (WAS) of the Portfolio
Fitch‘s cash flow model can analyse the trend of the portfolio WAS over the notes‘ index in the
absence of hedges and under different interest rate scenarios. In particular:
the floating-rate portion of the portfolio is modelled by bucketing the loans‘ margin over the index of the notes into eight buckets (ie eight groups of loans with similar margins);
for those loans where a basis risk or a reset risk is present, the margin over the index of the notes includes Fitch‘s assessment of these risks (see the section titled Analysis of Transactions Where the Interest Rate Risk is Not Hedged);
the model can take into account the fact that the floating loans‘ margin can change over time, due to the terms of the loan agreement or to the expected increase/decrease of the basis or reset risk;
the fixed-rate portion of the portfolio is modelled by bucketing the loans‘ coupons into eight buckets (ie, eight groups of loans with similar coupons);
the model can take into account the presence of loans that start fixed and then compulsorily switch to floating or vice versa (referred to in the market as ―mixed loans‖) or loans where the borrower has one or more options to switch from fixed to floating or vice versa (referred to as ―modular loans‖); and
for modular loans considering the shape of Fitch‘s standard interest rate scenarios (see ―Interest Rate Assumptions‖), the agency assumes that borrowers will choose a fixed rate in a rising interest rate scenario, choose a floating rate in a decreasing interest rate environment and remain with their current interest rate option in a stable interest rate environment.

Structured Finance
EMEA RMBS Cash Flow Analysis Criteria
June 2012 7
WAS Compression Assumptions
Fitch assumes that the loans paying the highest coupons are the first to default or to prepay. In
particular, Fitch‘s models allocate all of the defaults and a certain percentage of the
prepayments to the highest coupon bucket of the portfolio; in the absence of any evidence to
the contrary, the percentage assumed for prepayments is 80% (ie, 80% of prepayments are
attributed to the highest-margin bucket). As the assumed prepayment rate is higher for higher
rating scenarios (see the section titled prepayment Assumptions) the extent of WAS
compression is also higher for higher ratings.
The magnitude of WAS compression will not only depend on the level of prepayments and
defaults but also on the dispersion of loan margins in the portfolio. A relatively homogenous
pool will likely experience less margin compression than a portfolio with a wide range of
margins.
The WAS compression will reduce the ExS ―percentage size‖, unless this is covered by a total
return swap (for more detail see the sections titled Swaps as Additional Source of Credit
Enhancement and Excess Spread in the report titled EMEA Cash RMBS Structural Overview,
dated 20 May 2009 and available at www.fitchratings.com).
Figure 4 gives an example of the approach.
Figure 4 WAS Compression Assumptions: Example
Total portfolio composition at closing
Bucket 1 Bucket 2 Bucket 3 Bucket 4
Total portfolio Size Margin (%) Size Margin (%) Size Margin (%) Size Margin (%)
100 25 1.2 40 1.0 15 0.8 20 0.6 Portfolio WAS at closing = (25 * 1.2% + 40 * 1.0% + 15 * 0.8% + 20 * 0.6%)/100 = 0.94% Month 1 Defaults and 80% of prepayments amounting to 30 25 allocated to bucket 1 5 allocated to bucket 2
Total portfolio composition after month 1
Bucket 1 Bucket 2 Bucket 3 Bucket 4
Total portfolio Size Margin (%) Size Margin (%) Size Margin (%) Size Margin (%)
100 – 30 = 70 0 1.2 35 1.0 15 0.8 20 0.6 Portfolio WAS after month 1 = (0 * 1.2% + 35 * 1.0% + 15 * 0.8% + 20 * 0.6%)/70 = 0.84%
Source: Fitch
Swap Modelling
The impact of the swaps protecting the transaction against interest rate risk or providing CE
(see the sections titled Swaps: Interest Rate and Currency Risk and Swaps as Additional
Source of Credit Enhancement in the report titled EMEA Cash RMBS Structural Overview,
dated 20 May 2009 and available at www.fitchratings.com) will be factored into the cash flow
modelling.
In extreme cases, the interest rate, prepayment and margin compression risks can be
transferred to a swap counterparty, thereby isolating the transaction from such risks. However,
as a result the transaction will have an increased counterparty dependency that will be taken
into account in the rating analysis, potentially resulting in a credit-link to the counterparty rating.
For more information please see ―Counterparty Criteria for Structured Finance Transactions”,
published 14 March 2011, available at www.fitchratings.com.
Fitch‘s models can reproduce all types of hedging arrangements which the agency has seen so
far in the EMEA RMBS transactions that it has rated.
Structured Finance
EMEA RMBS Cash Flow Analysis Criteria
June 2012 8
Default and Recovery Rates
Fitch determines portfolio default and recovery rates using ResiEMEA, which is the agency‘s
analytical model for residential mortgage loans (the details of which are discussed in the report
EMEA Residential Mortgage Loss Criteria and the various country-criteria).
The model generates rating-specific foreclosure frequency, loss severity and recovery rates for
each mortgage loan in the portfolio. For cash flow modelling purposes, Fitch uses the recovery
rate. The individual rates are aggregated to yield a weighted average foreclosure frequency
(WAFF) and a weighted average recovery rate (WARR) for the portfolio. These results are
used in Fitch‘s cash flow analysis to simulate the default and recovery behaviour of the pool,
according to certain default distribution and recovery timing scenarios (see the sections titled
Default Timing Distribution and Recovery Timing).
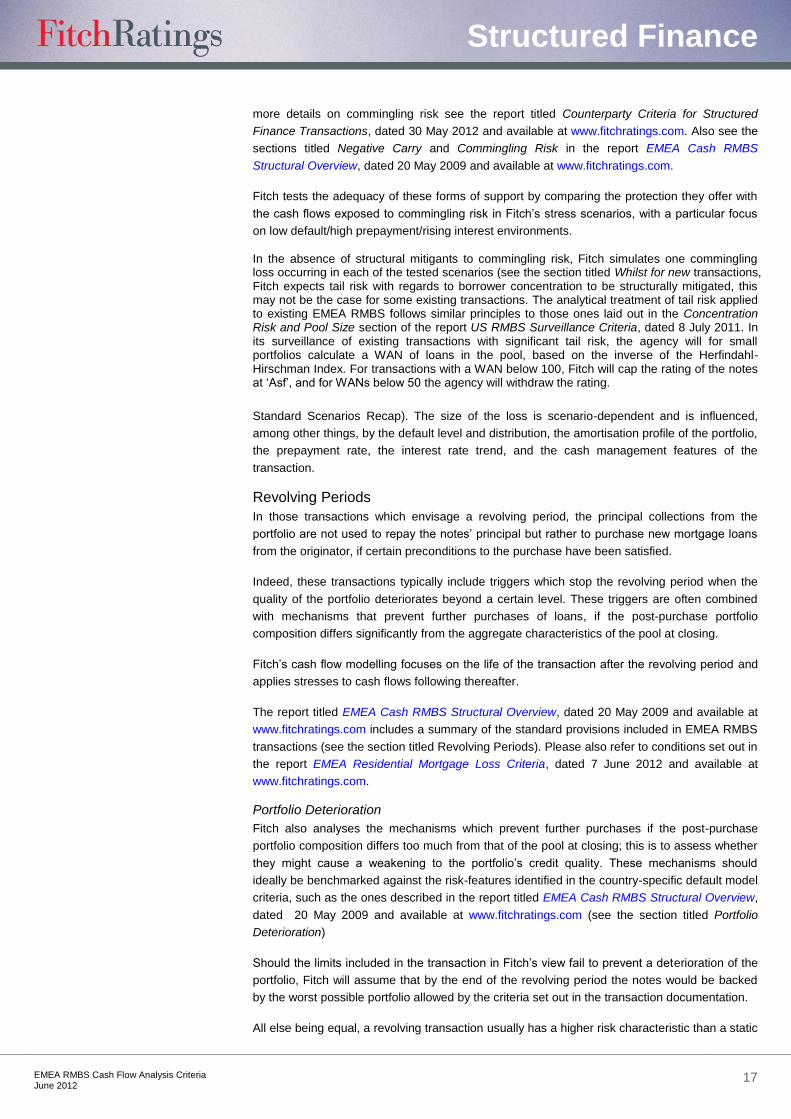
In general, Fitch‘s jurisdiction-specific default models calculate the single-loan recovery rate as
the minimum of:
the current principal balance of the loan, plus the potential recovery of ―accrued interest‖; and
the distressed foreclosure proceeds (essentially the value of the secured property assuming a recession in the real estate market) less prior charge amounts and foreclosure expenses;
divided by the principal balance of the loan at the date of the securitisation. Assumptions on
recovery rates may be capped in specific jurisdictions depending on the local legal regime (for
example, due to law-imposed caps on recoveries), common market practice, or the country‘s
economic environment, as well as historic market-wide and originator-specific recovery rate
performance information. Please refer to country-specific addenda for more details.
Deleveraging Effect
In those transactions where further advances by the issuer are not possible - or where further
advances by the originator rank junior to the claims of the issuer vis-à-vis the borrowers - Fitch
recognises that, as the borrowers repay their loans‘ principal, the recovery rate will
progressively increase as a result of the ―deleveraging‖ of the loans. This happens for example
in those instances where the loan-to-value ratios (LTVs) of the loans decrease over time (and
cannot increase as consequence of further pari-passu draws) and/or that the borrower cannot
free up the mortgage charge on the property proportionally to the loan paydown.
Fitch‘s models take this deleveraging effect into account, but cap the increase of the recovery
rates applied over time by the Fitch cash flow model to the minimum of: a) the historical
recovery rates achieved by the originator and its peers on similar assets; and b) Fitch‘s
maximum recovery expectations in stressed environments, considering the characteristics of
the assets and of the jurisdiction (but in any case, never above the loan‘s outstanding principal
at default plus accrued interest, if any).
Other Sources of Recovery
Other sources of recoveries may be taken into account in the single-loan recovery rate formula
described above; when the timing of these receipts is different from those of the recoveries,
they are modelled as a separate source of recovery in Fitch‘s cash flow model. Examples of
such sources of recoveries are loss pay-outs made under the Nationale Hypotheek Garantie
(NHG) in the Netherlands. For further details on the NHG see EMEA RMBS Criteria Addendum
- Netherlands, dated 6 July 2011 and available at www.fitchratings.com.
Depending on the jurisdiction, additional sources of recovery such as attachment of the
borrower‘s salary might also be taken into account, as long as the issuer has full and
unencumbered access to them (see the country-specific criteria listed in Appendix 1 for more
details).

Structured Finance
EMEA RMBS Cash Flow Analysis Criteria
June 2012 9
Default Timing Distribution
Historical observations show that for a
given static pool of loans, defaults evolve
according to typical patterns. In most
cases, defaults are characterised by an
initial ramp-up period of several years, in
which the defaulted amounts gradually
increase before reaching their peak and
then tailing off towards the end of the
loans‘ scheduled maturity.
The available data show that the rate of
repossession rises during the first three to
four years after origination, peaking in
years‘ four to five. The chart in this page
shows for example the timing and
magnitude of repossessions for static portfolios of Italian prime mortgages, based on the
historical data provided by a sample of ten mortgage lenders.
The typical default timing curve results from the fact that after origination it takes some time for
the personal circumstances of the borrower to deteriorate to the degree that he or she is no
longer able to service the loan and for the foreclosure process to proceed. Once the critical
phase of a borrower‘s vulnerability to economic events has passed, borrower defaults become
increasingly dominated by specific personal events such as illness and divorce. Accordingly,
default rates tend to slowly tail off for a given vintage.
Regarding loss-severity, the lower the LTV, the higher the recovery rate should the borrower
indeed default (see also the section titled Deleveraging Effect). Therefore, in a non-declining
house price environment, defaults are generally more stressful during the early years after the
closing of a transaction.
Note, however, that the pattern of defaults
depends on a number of factors. In
particular, the speed of defaults is subject
to economic factors such as the rate of
interest and unemployment.
Front-Loaded Distribution
Most transaction structures are more
vulnerable to front-loaded default
assumptions due to the impact of front-
loaded defaults on ExS. The earlier the
defaults occur and the higher the rate of
prepayment, the lower the volume ExS
received from the portfolio over the life of
the transaction. In addition, as highlighted above the actual default experiences follow a rather
front-loaded pattern as well. Therefore, Fitch derived a front-loaded stress using actual default
distribution experience, with defaults starting soon after closing of the transaction.
Fitch back-tested this default timing vector against available information in various developed
countries (eg, the UK, Italy, Portugal). The data constitute long-term vintage-based default
rates provided by major prime lenders in the respective countries or compilations from
government institutions. Fitch's front-loaded distribution invariably allocates defaults
significantly more to the earlier stages of a transaction than any of the historically observed
vintages.
The following figures illustrate Fitch‘s standard front-loaded default curve, assumed for all
rating levels and expressed as a percentage of the relevant WAFF.
Figure 5
0
20
40
60
80
100
1 14 27 40 53 66 79 92
(Months since closing)
0.0
0.5
1.0
1.5
2.0
2.5
3.0
Cumulative defaults (LHS)
Default allocated (RHS)
Standard Front-Loaded Default
Distribution
(%)
Source: Fitch
(%)
Figure 6
0.0
0.3
0.6
0.9
1.2
1.5
1 2 3 4 5 6 7 8 9 10 11
(Year after origination)
2001 2002 2003 2004
2005 2006 2007 2008
(% originated loans by vintage)
Repossession Rates - Italian Lenders
Source: Sampe of 8 Italian lenders

Structured Finance
EMEA RMBS Cash Flow Analysis Criteria
June 2012 10
Figure 7 Front-Loaded Default Curve Months after closing
1-10 11-23 24-35 36-47 48-59 60-71 72-84 Total
WAFF (%) 2.5 20 30 20 15 10 2.5 100
The defaults for each period are spread evenly on a monthly basis Source: Fitch
The agency models 87.5% of defaults occurring in the first five years after closing of the
transaction.
The amount of defaults is calculated in reference to the closing, rather than the current,
portfolio principal balance. For instance, if the default model calculates a 20% WAFF to be
applied to a portfolio of EUR1,000 Fitch‘s cash-flow model will assume defaults for EUR200. To
illustrate the methodology consider the following example:
Figure 8 Example: Front-Loaded Default Distribution Quarter Allocated WAFF (A)
a (%) New defaults (AxB) (%) New defaults in EUR (AxBxC)
1 0.75 0.15 1.50 2 0.75 0.15 1.50 3 0.75 0.15 1.50 4 3.33 0.67 6.65 5 4.62 0.92 9.23 6 4.62 0.92 9.23 7 4.62 0.92 9.23 8 5.58 1.12 11.15 9 7.50 1.50 15.00 10 7.50 1.50 15.00 11 7.50 1.50 15.00 12 6.67 1.33 13.33 13 5.00 1.00 10.00 14 5.00 1.00 10.00 15 5.00 1.00 10.00 16 4.58 0.92 9.17 17 3.75 0.75 7.50 18 3.75 0.75 7.50 19 3.75 0.75 7.50 20 3.33 0.67 6.67 21 2.50 0.50 5.00 22 2.50 0.50 5.00 23 2.50 0.50 5.00 24 1.88 0.38 3.75 25 0.63 0.13 1.25 26 0.63 0.13 1.25 27 0.63 0.13 1.25 Total 100 20 200
B = WAFF resulting from the default model: 20% C = Portfolio balance: EUR1,000 a % of total WAFF allocated to each quarter, according to the figure ―Front-Loaded Distribution‖
Source: Fitch
Back-Loaded Default Distribution
The timing of when defaults occur during the life of a transaction can heavily influence the
ability for a structure to withstand these stressful periods. Therefore, Fitch models alternative
default timing scenarios to assess the ability of the structure to withstand various clusters of
defaults. For example, a ―back-loaded‖ default distribution may be more stressful for
transactions where the most senior notes are protected by very tight performance triggers
linked to defaults. In such a case, modelling back-loaded defaults will create an additional
stress, as the structure will start to protect the senior notes later in the life of the deal, when a
portion of the available ExS has already been paid out of the structure (based on the
assumption that the ExS is available on a use-or-lose basis, as per standard market practice).
This would be exacerbated, if there was a ―step-up‖ interest on the notes‘ margin.

Structured Finance
EMEA RMBS Cash Flow Analysis Criteria
June 2012 11
Therefore, Fitch will also test the default distribution described below, in addition to the front-
loaded distribution.
Jurisdiction-Specific and Portfolio-Specific Distributions
Fitch will apply jurisdiction-specific or portfolio-specific default distributions if there is evidence
that, for a certain type of jurisdiction, asset or originator defaults are distributed differently from
the standard curves presented in this
report.
For example, if a high share of the portfolio
consists of interest-only loans, Fitch
expects the default distribution to be
influenced by the maturity date distribution
of the loans and therefore will test a
portfolio-specific default distribution.
Portfolio-specific distributions may also be
tested, if the transaction includes structural
features that transform the standard
default distributions described above into a
beneficial environment for the notes (eg,
ExS trapping subject to performance
triggers that mirror the default distribution assumptions).
For portfolios where the above-described default patterns are not applicable (eg, because a
portfolio has a very steep amortisation profile) Fitch will adjust the applied default patterns to
account for the specifics of the analysed portfolio. Similarly, when testing high-prepayment
scenarios, Fitch may fine-tune its CPR assumptions and/or re-shape the default distributions
described above to avoid situations where the transaction has prepaid the entire capital
balance of assets before the assumed WAFF has been applied in its entirety.
Figure 10 Back-Loaded Default Curve
Months after closing
1-10 11-23 24-35 36-47 48-59 60-71 72-111 Total
WAFF (%) 2.5 10 12.5 45 20 5 5 100
The defaults for each period are spread evenly on a monthly basis Source: Fitch
Deviations to the standard default distribution curves will be disclosed in country-specific
criteria, presales or new issue reports.
Default Definition
The vast majority of EMEA RMBS defines defaulted loans based on the number of unpaid
instalments for the purpose of principal deficiency ledger (PDL) debits or performance triggers
calculation.
Under its stress scenarios, Fitch assumes that immediately after closing borrowers start to
default, ie, that a portion of the borrowers will stop paying their instalments. However, the
default definition in the transaction determines the time in which these non-performing
borrowers are recognised as defaulted; this will influence how soon the transaction structure
implements any consequences of poor performance, for example default provisioning or
changes in the waterfall when defaults (as defined by the transaction‘s documentation) exceed
a certain threshold.
Figure 9
0
20
40
60
80
100
1 16 31 46 61 76 91 106 121
(Months since closing)
0.0
1.0
2.0
3.0
4.0
Cumulative defaults (LHS)
Default allocated (RHS)
Standard Back-Loaded Default
Distribution
(%)
Source: Fitch
(%)

Structured Finance
EMEA RMBS Cash Flow Analysis Criteria
June 2012 12
Recovery Timing
The assumed length of the foreclosure period is based on the empirical evidence available in
each jurisdiction, and depends in good part on the regulatory framework governing the
foreclosure process. The foreclosure times assumed in the relevant European countries are
detailed in the country-specific criteria (see Appendix 1).
Maturity of the Rated Notes
Fitch expects that the legal maturity of the notes should fall after the longest maturity of the
loans included in the portfolio, plus the maximum recovery time assumed by Fitch in relation to
the specific portfolio.
Delinquency
Fitch assumes stressed levels of delinquencies to test the structure‘s ability to withstand
potential liquidity shortfalls.
Fitch models both defaulting and delinquent borrowers as those who stop payment to the
issuer from a certain point in time onwards. For delinquent borrowers, this will be limited to a
certain period of time, at the end of which the delinquent borrowers will begin paying their loans
again. Indeed, loans in arrears are usually restructured, allowing the borrower to repay the
amount in arrears in addition to ongoing scheduled mortgage payments over a limited period of
time. The length of such arrangements depends on the individual lender‘s collection and
servicing guidelines and on the financial means of the borrower.
The approach outlined in the following paragraphs applies to portfolios where delinquencies
represent a negligible portion of the pool at closing. Should that not be the case for a particular
portfolio, Fitch would rate the transaction assuming deal-specific default distribution and
delinquency modelling, and would disclose that assumption in the transaction‘s new issue
report.
Delinquency Assumptions
The agency assumes that a multiple of the monthly defaulting loan balance falls delinquent for
a certain period. Thereafter, the delinquent balance becomes fully performing again and the
accrued arrears interest is assumed to be fully repaid after 10 months.
As the assumed level of delinquencies is based on the WAFF — which is always higher in
more severe recession scenarios — arrears are more widespread under more stressful rating
conditions. To temper this, and to support the assertion that in economic recessions a greater
proportion of financially distressed borrowers will ultimately default, the multiple applied to the
WAFF is reduced in more severe rating scenarios. The multiples are scaled such that the
amount falling into arrears rises in the more severe rating scenarios. The following figure shows
the multiples applied.
Figure 11 Delinquency Multiple AAA AA A BBB BB
Multiple of monthly defaults 1.5 2 2.5 2.75 3
Source: Fitch
The assumed duration of delinquency depends on the payment frequency of the mortgages.
For example, the period of delinquency is expected to be longer for mortgage loans that pay
quarterly and semi-annually compared to those which pay monthly, as detailed in the following
figure.

Structured Finance
EMEA RMBS Cash Flow Analysis Criteria
June 2012 13
Figure 12 Delinquency Period
Payment frequency Assumed number of missed
payments Assumed number of delinquency
months
Monthly 7 7 Quarterly 3 9 Semi-annually 2 12 Annually 1 12 Other Case-by-case
Source: Fitch
For the purpose of cash flow modelling, Fitch determines a weighted average (WA)
delinquency period of the portfolio based on the WA loans‘ payment frequency, using the loans‘
outstanding as weights.
To illustrate Fitch‘s approach, consider the following example: assuming a ‗BBB‘ scenario
(multiple of 2.75) and a WAFF of 20%, which for illustrative purposes is evenly spread over a
period of 12 quarters, the following figure shows the amount assumed to become delinquent
each quarter:
Figure 13 Example: Application of Delinquency Stress Initial balance (%)
Quarter (%) New defaults New arrears Total arrears
1 1.70 5.00 5.00 2 1.70 5.00 10.00 3 1.70 5.00 10.00 4 1.70 5.00 10.00 5 1.70 5.00 10.00 6 1.70 5.00 10.00 7 1.70 5.00 10.00 8 1.70 5.00 10.00 9 1.70 5.00 10.00 10 1.70 5.00 10.00 11 1.70 5.00 10.00 12 1.70 5.00 10.00 13 0.00 0.00 5.00 14 0.00 0.00 0.00
Source: Fitch
For the purpose of this example, the duration of non-payment is assumed to be two quarters,
after which the loan becomes performing again. Hence in aggregate, after the initial two
quarters, the outstanding balance of loans in arrears remains the same, as newly-delinquent
loans are offset by those that become performing again.
It is important to stress that the delinquency assumptions are assumed in addition to the default
ones, ie, the arrears balance shown in the example above does not include the balance of
defaulted loans.
Swaps Covering the Cost of Carry of Delinquencies
Some EMEA RMBS transactions benefit from swaps where the swap provider‘s notional
amount includes performing and delinquent (but not defaulted) loans, whereas the issuer‘s
notional amount consists of performing loans only.
With such a swap, the available cash flows to the issuer could be positively correlated with the
portfolio delinquency levels and therefore transform the delinquency stress, described above,
into a favourable environment for the issuer.
For these reasons, Fitch also tests these transactions under alternative low or no delinquency
environments and considers whether the notes‘ rating can be justified, given reliance on the
swap flows and the creditworthiness of the swap provider.

Structured Finance
EMEA RMBS Cash Flow Analysis Criteria
June 2012 14
Interest Rates
Interest rate risk may leave the issuer exposed to adverse movements in the notes‘ index. As
discussed, interest rate risk is generally hedged in respect of performing mortgage loans
through the use of swaps, while non-performing positions (defaulted and delinquent loans) are
usually un-hedged in EMEA RMBS transactions. Therefore, a rise in interest rates would
increase the differential between the issuer‘s income (ie, interest from the performing portfolio)
and expenses (ie, interest on the notes plus senior costs) which will have to service the notes
inclusive of the proportion corresponding to such non-performing positions.
Delinquent loans that subsequently return to performing (and pay off all accumulated arrears
interest) will cause a liquidity stress only, which will last until full recovery of the delinquent
amounts. The magnitude of this stress depends on the length of time a loan is delinquent and
on the change in interest rates during that period of time.
This cost of carry is significantly larger for defaulted positions, for which the time to recovery
can last several years in certain jurisdictions. If subsequent recoveries are insufficient to cover
both principal and interest up to the amount the issuer paid under the notes during the time
needed to complete the foreclosure, such cost of carry will cause or compound principal
deficiencies.
To mitigate cost of carry, certain transactions include provisioning mechanisms designed to
capture available interest cash flows (including ExS) and use them to amortise the notes in
advance of any recovery being made on defaulted loans or loans in severe arrears (see the
section titled Provisioning in the report titled EMEA Cash RMBS Structural Overview, dated 20
May 2009 and available at www.fitchratings.com). As mentioned above, other transactions limit
the cost of carry through a swap.
Figure 14 Example: Application of Rising Interest Rate Stresses
Month Rising interest rate
stress vectora (%)
Notes payment date
b
Interest rate vector applied in the rising interest scenario
c (%)
1 + 0.71 N 5.00 2 + 1.36 N 5.00 3 + 1.93 Y 5.00 4 + 2.46 N 7.46 5 + 2.93 N 7.46 6 + 3.35 Y 7.46 7 + 3.73 N 8.73 8 + 4.07 N 8.73 9 + 4.36 Y 8.73 10 + 4.61 N 9.61 11 + 4.83 N 9.61 12 + 5.01 Y 9.61 a Illustrative vector
b Notes‘ payment frequency: Quarterly
c Notes‘ index spot level at closing: 5%
Source: Fitch
Interest Rate Assumptions
In order to stress the cost of carry of non-performing loans, Fitch tests the structure in a rising
interest rate environment. The agency also tests stable and decreasing interest rate scenarios,
with the purpose of addressing any possible hedging mismatches.
Fitch‘s interest rate stress criteria are detailed in the report Criteria for Interest Rate Stresses in
Structured Finance Transactions, dated 20 March 2012. Interest rate stresses are updated
periodically and are currently found in Fitch‘s report titled Interest Rate Assumptions for
Structured Finance, dated 20 March 2012.
The stresses consist of vectors of monthly increases/decreases to be applied to the spot
Euribor/GBP Libor at closing, with the same frequency as the notes‘ interest payment
frequency, as detailed in the example above.

Structured Finance
EMEA RMBS Cash Flow Analysis Criteria
June 2012 15
The impact of the transaction‘s hedging will be assessed using the above-described
methodology and the hedging will be modelled as per the terms of the documentation
regulating it. Should the transaction structure appear particularly vulnerable to small changes in
the interest rate path, Fitch will perform additional sensitivity tests, which will be disclosed in the
presale and new issue reports.
Interest Rate Scenarios for Transactions Including Interest Rate Caps
A significant number of EMEA RMBS transactions include one or more interest rate caps (see
Interest Rate Caps in the report titled EMEA Cash RMBS Structural Overview, dated 20 May
2009 and available at www.fitchratings.com). In a rising interest rate scenario, especially for
higher rating levels, the index rate assumed by Fitch can be higher than the cap strike rate.
Under such a scenario, the interest rate cap will therefore generate positive cash flows for the
transaction.
To ensure that the notes would still be able to pay the interest and principal according to their
terms - without the benefit of cash flows from interest rate caps, which depend on the assumed
interest rate scenario - Fitch will also test alternative interest rate patterns.
Analysis of Transactions Where the Interest Rate Risk is Not Hedged
In some EMEA RMBS transactions the interest rate risk is not covered or only partially covered.
The presence of fixed-rate loans, not hedged by a fixed-floating swap, has a significantly
negative impact on noteholders in a rising interest rate scenario, where the structure will suffer
from a natural ―cost of carry‖ of fixed rate loans. Similarly, transaction with floating rate
mortgages and fixed rate notes would be negatively impacted in decreasing interest rate
scenarios.
Fitch may decide not to rate transactions where unhedged interest rate risk is too complex to
be quantified and modelled (eg when there are non-standard interest rate options granted to
the borrowers, or where the transaction structure allows the modification of loan terms and the
inherent risks can not be modelled).
Unhedged Basis or Currency Risk
There are also EMEA RMBS transactions where the basis and/or reset risk on floating rate
loans (ie, floating rate mortgages with an index different from that of the notes and/or with an
index reset date different from that of the notes) are not covered by a basis swap. In these
instances, Fitch estimates the basis and reset risk taking into account expected future market
trends, as well as by comparing the historical data available on the index of the notes and the
index of the loans.
Should the transaction be exposed to unhedged or partially hedged currency risk, Fitch would
test the transaction assuming transaction and currency-specific stresses and disclose such
stresses in the transaction‘s new issue report.
Fitch may decide not to rate transactions where unhedged currency risk or basis risk is too
complex to be quantified and modelled.
Transaction and Servicing Costs
Fitch stresses the transaction and servicing costs of the portfolio and of the issuer to the higher
of the actual deal‘s expenses and the agency‘s expected cost of servicing in a high default and
delinquency environment, such as those tested in the rating analysis.
Fitch‘s assumptions take into account extraordinary costs such as, but not limited to, those
related to the invocation of back-up or stand-by servicing arrangements or the engagement of a
replacement servicer following a servicer event of default. For example, in cases where a back-
up servicing agreement is not in place for a specific transaction servicing cost assumptions
may be increased, particularly at the higher rating categories, to account for the increased

Structured Finance
EMEA RMBS Cash Flow Analysis Criteria
June 2012 16
expenses associated with locating and engaging a replacement servicer. These assumptions
may vary by jurisdiction driven in part by the country‘s third party servicing environment and/or
the sophistication of the national mortgage market.
Countries with well-established third party servicers provide a pool from which a replacement
servicer can be more easily identified. Furthermore, such servicers typically have experience in
processing transfers of servicing from lenders or other servicers, potentially mitigating some of
the operational concerns as well as reducing the time and costs associated with such transfer
events.
The details of this assumption are available in each country-specific criteria (see Appendix 1
hereto).
Swaps Covering Servicing Costs
Swaps can protect the transaction‘s ExS by including the servicing costs among the amounts to
be paid by the swap counterparty. In these instances, Fitch will model the contractual
commitments of the swap counterparty, therefore giving full credit to the CE provided by the
swap. Nevertheless, depending on the provisions of the swap agreement and the jurisdiction‘s
specificities, the agency could make the conservative assumption that the issuer will still have
to cover some extra senior expenses in a stressed environment. Fitch will also consider
whether the notes‘ reliance on the swap flows justify treating their rating as being directly
dependant on the rating of the swap provider.
Moreover, Fitch will pay special attention to the rating downgrade language incorporated in the
transaction documents and whether the formula to calculate the mark-to-market of the swap
takes servicing fees into account (for more details see the report titled Counterparty Criteria for
Structured Finance Transactions, dated 30 May 2012 and available at www.fitchratings.com).
Available Cash Investments
In order to limit the impact of negative carry the EMEA RMBS issuers usually negotiate a
certain yield on their accounts (where portfolio principal and interest collections as well as the
amounts standing to the credit of the reserve fund (RF), if any, are deposited). For more details
on negative carry see the section titled Negative Carry in the report titled EMEA Cash RMBS
Structural Overview, dated 20 May 2009 and available at www.fitchratings.com)
In some instances, the negotiation of such yield is formalised in a guaranteed investment
contract, where the account provider agrees to pay a guaranteed rate of interest on the issuer‘s
accounts. The agreed rate of interest is usually the reference rate of the notes minus a margin.
Alternatively, the issuer may invest the funds deposited on its accounts in certain types of
investments (normally securities and repos). However, such investments would introduce
counterparty risk and credit and market risk in the transaction, as well as liquidity risk. Fitch‘s
criteria in respect of these ―investment-related‖ risks are described in the report titled
Counterparty Criteria for Structured Finance Transactions, dated 11 May 2012 and available at
www.fitchratings.com.
In the absence of any contrary evidence, Fitch assumes that interest earned on the funds
available to the EMEA RMBS issuer are at the relevant reference rate of the notes less 50bp.
Commingling Risk and Portfolio Variations
This section summarises Fitch‘s approach to quantitatively assessing those risks that do not
stem from the portfolio‘s performance but from other transactional features.
Commingling Risk
In several RMBS transactions, commingling risk is addressed by including additional sources of
―external‖ CE in the structure, such as third-party guarantees or dedicated cash reserves. For
Structured Finance
EMEA RMBS Cash Flow Analysis Criteria
June 2012 17
more details on commingling risk see the report titled Counterparty Criteria for Structured
Finance Transactions, dated 30 May 2012 and available at www.fitchratings.com. Also see the
sections titled Negative Carry and Commingling Risk in the report EMEA Cash RMBS
Structural Overview, dated 20 May 2009 and available at www.fitchratings.com.
Fitch tests the adequacy of these forms of support by comparing the protection they offer with
the cash flows exposed to commingling risk in Fitch‘s stress scenarios, with a particular focus
on low default/high prepayment/rising interest environments.
In the absence of structural mitigants to commingling risk, Fitch simulates one commingling loss occurring in each of the tested scenarios (see the section titled Whilst for new transactions, Fitch expects tail risk with regards to borrower concentration to be structurally mitigated, this may not be the case for some existing transactions. The analytical treatment of tail risk applied to existing EMEA RMBS follows similar principles to those ones laid out in the Concentration Risk and Pool Size section of the report US RMBS Surveillance Criteria, dated 8 July 2011. In its surveillance of existing transactions with significant tail risk, the agency will for small portfolios calculate a WAN of loans in the pool, based on the inverse of the Herfindahl-Hirschman Index. For transactions with a WAN below 100, Fitch will cap the rating of the notes at ‗Asf‘, and for WANs below 50 the agency will withdraw the rating.
Standard Scenarios Recap). The size of the loss is scenario-dependent and is influenced,
among other things, by the default level and distribution, the amortisation profile of the portfolio,
the prepayment rate, the interest rate trend, and the cash management features of the
transaction.
Revolving Periods
In those transactions which envisage a revolving period, the principal collections from the
portfolio are not used to repay the notes‘ principal but rather to purchase new mortgage loans
from the originator, if certain preconditions to the purchase have been satisfied.
Indeed, these transactions typically include triggers which stop the revolving period when the
quality of the portfolio deteriorates beyond a certain level. These triggers are often combined
with mechanisms that prevent further purchases of loans, if the post-purchase portfolio
composition differs significantly from the aggregate characteristics of the pool at closing.
Fitch‘s cash flow modelling focuses on the life of the transaction after the revolving period and
applies stresses to cash flows following thereafter.
The report titled EMEA Cash RMBS Structural Overview, dated 20 May 2009 and available at
www.fitchratings.com includes a summary of the standard provisions included in EMEA RMBS
transactions (see the section titled Revolving Periods). Please also refer to conditions set out in
the report EMEA Residential Mortgage Loss Criteria, dated 7 June 2012 and available at
www.fitchratings.com.
Portfolio Deterioration
Fitch also analyses the mechanisms which prevent further purchases if the post-purchase
portfolio composition differs too much from that of the pool at closing; this is to assess whether
they might cause a weakening to the portfolio‘s credit quality. These mechanisms should
ideally be benchmarked against the risk-features identified in the country-specific default model
criteria, such as the ones described in the report titled EMEA Cash RMBS Structural Overview,
dated 20 May 2009 and available at www.fitchratings.com (see the section titled Portfolio
Deterioration)
Should the limits included in the transaction in Fitch‘s view fail to prevent a deterioration of the
portfolio, Fitch will assume that by the end of the revolving period the notes would be backed
by the worst possible portfolio allowed by the criteria set out in the transaction documentation.
All else being equal, a revolving transaction usually has a higher risk characteristic than a static

Structured Finance
EMEA RMBS Cash Flow Analysis Criteria
June 2012 18
transaction due to the possibility of credit quality erosion of the assets through replenishment.
This is usually addressed through the replenishment conditions mentioned in the report titled
EMEA Cash RMBS Structural Overview and often also higher available CE.
Loan Modifications and Asset Substitution
In certain instances the originator retains the right to modify the terms of the loans or substitute
the loans transferred to the issuer, even if they are not in severe arrears or defaulted.
In this case, Fitch‘s analysis is similar to that described in the paragraph above titled Portfolio
Deterioration, and focuses on the modification/substitution criteria and on the worst possible
portfolio allowed by them. The analysis also considers whether any of the portfolio deterioration
risks, which stem from the modification/substitution, are transferred to third parties. For
example, if the structure is protected by a margin-guaranteed swap, any renegotiation of the
loan‘s margin — or substitution of high margin loans with loans paying lower margins — will
impact the swap counterparty only. Please also refer to the report titled EMEA Residential
Mortgage Loss Criteria, dated 7 June 2012 and available at www.fitchratings.com.
RMBS Structural Features
This section summarises Fitch‘s rating criteria with respect to those structural RMBS features
that can have an impact on ratings. As noted above, please refer to the report titled EMEA
Cash RMBS Structural Overview, dated 20 May 2009 and available at www.fitchratings.com for
further detail.
Reserve Fund Reserve Fund Build-Up Triggers
Some structures provide that the reserve fund (RF) can ―build-up‖ subject to triggers which
ensure that the build-up starts only when the portfolio performance (eg, delinquencies, defaults,
losses, etc) deteriorates. In such instances, Fitch will not only focus on scenarios in which
triggers have been breached but also, unless highly unlikely, assess scenarios without breach
of the RF build-up trigger .
Reserve Fund Amortisation
Most EMEA RMBS transactions allow the RF to amortise in line with the principal amortisation of
the notes (typically, the RF required amount is expressed as a percentage of the outstanding
notes) provided that certain conditions related to the structure and portfolio performance are met.
Fitch views transactions that do not include the standard provisions — described in the section
titled Reserve Fund Amortisation in the report EMEA Cash RMBS Structural Overview, dated
20 May 2009 and available at www.fitchratings.com — as weaker transactions. Specifically,
transaction structures that feature reserve fund amortisation and have no performance tests in
place may be subject to downward ratings migration in the event that the pool is experiencing
higher than expected delinquencies or defaults. In these instances, Fitch will run multiple stress
scenarios in its cash flow model, in addition to the standard scenarios (detailed in the section
titled Standard Scenarios Recap) to evaluate all the sensitivities of the structures and capture
all the possible scenarios that drive the results. The outcome of these stress test scenarios
may result in Fitch applying a rating cap or the agency may decide not to assign or maintain
ratings.
Liquidity Facility Credit Enhancement From the Liquidity Facility
In some instances, the combination of the waterfall and the liquidity facility (LF) agreement
provisions result in the LF providing CE to the rated notes. In practice, in the case of poor
performance of the structure and/or the portfolio, the structure may let the issuer repay the
noteholders in priority to the LF provider, which will therefore absorb part of the losses.

Structured Finance
EMEA RMBS Cash Flow Analysis Criteria
June 2012 19
In these cases Fitch carefully reviews the scenarios where the LF provides the structure with
CE in order to assess how the repayment of the rated notes relies on the amounts made
available under the LF and therefore, if the rating to be assigned to the notes is in any way
linked to the credit standing of the LF provider.
Similarly, some transactions may rely on LFs to cover short term liquidity constraints
particularly present in high rating scenarios. In such instances Fitch‘s analytical approach will
focus on the contractual availability of the LF as well as its size. In the absence of a sufficiently
sized LF high ratings may be difficult to achieve if no other mechanisms, such as use of
principal to pay interest on senior notes, are available to remedy liquidity shortfalls.
Liquidity Facility Amortisation
Some EMEA RMBS transactions benefit from a LF which can amortise in line with the principal
amortisation of the notes (for example, the LF size is expressed as a percentage of the
outstanding notes) provided that certain conditions related to the structure and portfolio
performance are met.
Fitch views transactions that do not include the standard provisions for LF amortisation -
described in the section titled Liquidity Facility Amortisation in the report titled EMEA Cash
RMBS Structural Overview, dated 20 May 2009 and available at www.fitchratings.com - as
weaker transactions.
In these instances, Fitch will run multiple stress test scenarios in its cash flow model in the
absence of standard conditions, in addition to the standard scenarios (detailed in the section
titled Whilst for new transactions, Fitch expects tail risk with regards to borrower concentration
to be structurally mitigated, this may not be the case for some existing transactions. The
analytical treatment of tail risk applied to existing EMEA RMBS follows similar principles to
those ones laid out in the Concentration Risk and Pool Size section of the report US RMBS
Surveillance Criteria, dated 8 July 2011. In its surveillance of existing transactions with
significant tail risk, the agency will for small portfolios calculate a WAN of loans in the pool,
based on the inverse of the Herfindahl-Hirschman Index. For transactions with a WAN below
100, Fitch will cap the rating of the notes at ‗Asf‘, and for WANs below 50 the agency will
withdraw the rating.
Standard Scenarios Recap), to evaluate all the sensitivities of the structures and capture all the
possible scenarios that drive the results.
Pro-Rata Amortisation
To mitigate adverse selection and concentration risks, pro-rata amortisation in EMEA RMBS
transaction can typically start only, if sufficient credit enhancement for the most senior class
has built up and/or certain conditions on the portfolio and structural performance are met.
Fitch views transactions that do not include the standard provisions for pro rata amortisation -
described in the section titled Pro-Rata Conditions of the report ―EMEA Cash RMBS Structural
Overview‖, dated 20 May 2009 and available at www.fitchratings.com - as weaker structures.
), to evaluate all the sensitivities of the structures and capture all the possible scenarios that
drive the results.
In these instances, Fitch will run multiple stress test scenarios in its cash flow model in the
absence of standard conditions, in addition to the standard scenarios (detailed in the section
titled Whilst for new transactions, Fitch expects tail risk with regards to borrower concentration
to be structurally mitigated, this may not be the case for some existing transactions. The
analytical treatment of tail risk applied to existing EMEA RMBS follows similar principles to
those ones laid out in the Concentration Risk and Pool Size section of the report US RMBS
Surveillance Criteria, dated 8 July 2011. In its surveillance of existing transactions with
significant tail risk, the agency will for small portfolios calculate a WAN of loans in the pool,

Structured Finance
EMEA RMBS Cash Flow Analysis Criteria
June 2012 20
based on the inverse of the Herfindahl-Hirschman Index. For transactions with a WAN below
100, Fitch will cap the rating of the notes at ‗Asf‘, and for WANs below 50 the agency will
withdraw the rating.
Standard Scenarios Recap), to evaluate all the sensitivities of the structures and capture all the
possible scenarios that drive the results.
Notes Backed by Excess Spread
In some cases Fitch is able to assign a rating to the ExS extractions and/or to the investments
made by the ―equity investors‖. The repayment of these obligations is reliant on the level and
timing of ExS, which in turn relies on the portfolio performance and structural features. Among
the structural features, the presence of margin step-ups and the potentially associated call or
put options play an important role, especially regarding the analysis of the holdings of the
―equity investors‖. Indeed, the presence of a step-up feature can significantly affect the levels of
ExS that the structure generates over time, reducing the amount of funds available to the equity
investors.
In addition, if the associated call or put option does not require the issuer to repay the equity
notes, its exercise will be detrimental to them. This is due not only to the potential principal
losses in case of call option exercise, but also to the fact that the availability of ExS to repay the
equity notes after the call date will be subject to the call option not being exercised. For this
reason, when analysing the equity notes, Fitch carefully considers the impact of the call option
and takes its exercise into account, if it can negatively affect the equity notes.
Since the level and timing of the ExS is highly sensitive to small variations of the stress
scenarios tested by Fitch, the rating analysis of these obligations will involve the analysis of a
series of scenarios where the interactions between variables discussed in the paragraph Whilst
for new transactions, Fitch expects tail risk with regards to borrower concentration to be
structurally mitigated, this may not be the case for some existing transactions. The analytical
treatment of tail risk applied to existing EMEA RMBS follows similar principles to those ones
laid out in the Concentration Risk and Pool Size section of the report US RMBS Surveillance
Criteria, dated 8 July 2011. In its surveillance of existing transactions with significant tail risk,
the agency will for small portfolios calculate a WAN of loans in the pool, based on the inverse
of the Herfindahl-Hirschman Index. For transactions with a WAN below 100, Fitch will cap the
rating of the notes at ‗Asf‘, and for WANs below 50 the agency will withdraw the rating.
Standard Scenarios Recap are tested.
As this type of obligation is far from standard in EMEA RMBS transactions, and its operation
depends on its interaction with the rest of the structure (eg, call or put options, presence of
performance triggers tightening the ExS trapping in favour of the noteholders, etc) the
scenarios tested by Fitch are tailored to the characteristics of the obligations analysed.
Tail Risk
Fitch expects transactions to be protected against increasing performance volatility as the
portfolio size declines. The agency considers the level of concentration in the transaction‘s
mortgage portfolio to be a key factor in the assessment of tail risk within a particular transaction.
When assigning a rating, Fitch will assess whether the portfolio is sufficiently granular to
withstand loan concentration risk; for further details, please see the Scope and Limitations
section of the report EMEA Residential Mortgage Loss Criteria. The agency will assess
whether the transaction structure has a minimum amount of credit enhancement which covers
for the loan concentration risk. This coverage is typically in the form of a reserve fund floor or a
minimum amount of subordination (for further details please see the section titled Reserve
Fund Amortisation in the special report titled EMEA Cash RMBS Structural Overview, 20 May
2009). Fitch expects the minimum amount of credit enhancement available in the transaction
Structured Finance
EMEA RMBS Cash Flow Analysis Criteria
June 2012 21
structure at closing to cover at least the outstanding balance of the 10 largest loans in the
portfolio.
Whilst for new transactions, Fitch expects tail risk with regards to borrower concentration to be
structurally mitigated, this may not be the case for some existing transactions. The analytical
treatment of tail risk applied to existing EMEA RMBS follows similar principles to those ones
laid out in the Concentration Risk and Pool Size section of the report US RMBS Surveillance
Criteria, dated 8 July 2011. In its surveillance of existing transactions with significant tail risk,
the agency will for small portfolios calculate a WAN of loans in the pool, based on the inverse
of the Herfindahl-Hirschman Index. For transactions with a WAN below 100, Fitch will cap the
rating of the notes at ‗Asf‘, and for WANs below 50 the agency will withdraw the rating.
Standard Scenarios Recap
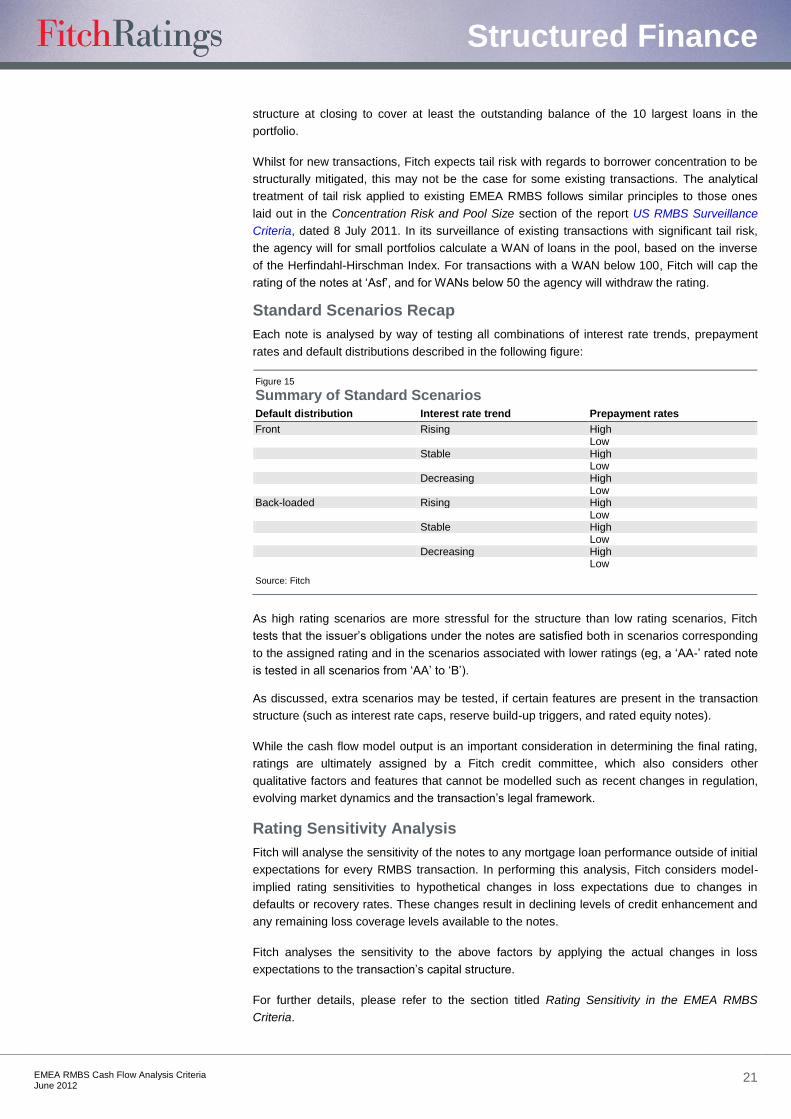
Each note is analysed by way of testing all combinations of interest rate trends, prepayment
rates and default distributions described in the following figure:
Figure 15 Summary of Standard Scenarios Default distribution Interest rate trend Prepayment rates
Front Rising High Low Stable High Low Decreasing High Low Back-loaded Rising High Low Stable High Low Decreasing High Low
Source: Fitch
As high rating scenarios are more stressful for the structure than low rating scenarios, Fitch
tests that the issuer‘s obligations under the notes are satisfied both in scenarios corresponding
to the assigned rating and in the scenarios associated with lower ratings (eg, a ‗AA-‘ rated note
is tested in all scenarios from ‗AA‘ to ‗B‘).
As discussed, extra scenarios may be tested, if certain features are present in the transaction
structure (such as interest rate caps, reserve build-up triggers, and rated equity notes).
While the cash flow model output is an important consideration in determining the final rating,
ratings are ultimately assigned by a Fitch credit committee, which also considers other
qualitative factors and features that cannot be modelled such as recent changes in regulation,
evolving market dynamics and the transaction‘s legal framework.
Rating Sensitivity Analysis
Fitch will analyse the sensitivity of the notes to any mortgage loan performance outside of initial
expectations for every RMBS transaction. In performing this analysis, Fitch considers model-
implied rating sensitivities to hypothetical changes in loss expectations due to changes in
defaults or recovery rates. These changes result in declining levels of credit enhancement and
any remaining loss coverage levels available to the notes.
Fitch analyses the sensitivity to the above factors by applying the actual changes in loss
expectations to the transaction‘s capital structure.
For further details, please refer to the section titled Rating Sensitivity in the EMEA RMBS
Criteria.

Structured Finance
EMEA RMBS Cash Flow Analysis Criteria
June 2012 22
Surveillance
For existing transactions, Fitch does not necessarily conduct a full re-assessment of the cash
flows generated by a transaction following each performance reporting period. Assessing a
transaction‘s cash flows can be critical in the rating analysis at any time, but if the asset
performance remains broadly unchanged from previous periods and/or the future cash flows
can be readily understood, then a full cash flow analysis may not be performed.
Otherwise, the cash flow analysis undertaken for existing RMBS transactions uses the same
techniques and framework as described above for new transactions. The models are updated
to reflect the prevailing characteristics and performance of the transaction, including the
outstanding note balances, status of triggers and asset performance. The assumptions for the
timing of expected defaults and prepayments are adjusted, based on the seasoning of the
portfolio.
Scope and Limitations
This report outlines Fitch‘s cash flow modelling criteria for the analysis of residential mortgage-
backed securities (RMBS).
Specific liability-level and counterparty risks may prevent Fitch from rating a transaction, or may
limit the highest achievable ratings in the agency‘s analysis. The core areas where such
restrictions may apply are generally those detailed in the report, Criteria for Rating Caps in
Global Structured Finance Transactions, dated 23 June 2010. Specific examples for EMEA
RMBS transactions include excessive counterparty exposure, where unhedged interest rate
risk or unhedged currency risk is too complex to be quantified and modelled, and where basis
risk is too complex to be quantified and modelled.

Structured Finance
EMEA RMBS Cash Flow Analysis Criteria
June 2012 23
Appendix 1: Related Criteriaa
General Rating and Structured Finance Criteria
―Global Structured Finance Rating Criteria‖, 4 August 2011
―Fitch: "What Credit Ratings Mean" -A Look Behind the Ratings‖, 7 August 2007
―Special-Purpose Vehicles in Structured Finance Transactions‖, May 2012
―EMEA RMBS Legal Assumptions‖, June 2011
EMEA RMBS Criteria
“EMEA RMBS Master Rating Criteria‖, dated 7 June 2012
―EMEA Residential Mortgage Loss Criteria‖, 7 June 2012
―EMEA Cash RMBS Structural Overview‖, 20 May 2009
Counterparty Risk Criteria
―Counterparty Criteria for Structured Finance Transactions‖, 30 May 2012
―Counterparty Criteria for Structured Finance Transactions: Derivative Addendum – Amended‖,
30 May 2012
―Fitch Structured Finance Counterparty Criteria: Advanced Rates for Government Bond and
Current Risk‖, 30 May 2011
Interest Rate Criteria
―Criteria for Interest Rate Stresses in Structured Finance Transactions‖,
30 March 2012
―Fitch’s Interest Rate Stress Assumptions for Structured Finance‖, 20 March 2012
Servicing
―Servicing Continuity Risk Criteria for Structured Finance Transactions‖,
12 August 2011
“Global Rating Criteria for Structured Finance Servicers‖, 13 August 2010
Covered Bonds
―Covered Bonds Rating Criteria‖, 30 May 2012
All the above research is available at www.fitchratings.com
a Criteria can be updated or amended: readers should always make reference to the last criteria available
at www.fitchratings.com
Source: Fitch

Structured Finance
EMEA RMBS Cash Flow Analysis Criteria
June 2012 24
ALL FITCH CREDIT RATINGS ARE SUBJECT TO CERTAIN LIMITATIONS AND DISCLAIMERS. PLEASE READ THESE LIMITATIONS AND DISCLAIMERS BY FOLLOWING THIS LINK: HTTP://FITCHRATINGS.COM/UNDERSTANDINGCREDITRATINGS. IN ADDITION, RATING DEFINITIONS AND THE TERMS OF USE OF SUCH RATINGS ARE AVAILABLE ON THE AGENCY'S PUBLIC WEB SITE AT WWW.FITCHRATINGS.COM. PUBLISHED RATINGS, CRITERIA, AND METHODOLOGIES ARE AVAILABLE FROM THIS SITE AT ALL TIMES. FITCH'S CODE OF CONDUCT, CONFIDENTIALITY, CONFLICTS OF INTEREST, AFFILIATE FIREWALL, COMPLIANCE, AND OTHER RELEVANT POLICIES AND PROCEDURES ARE ALSO AVAILABLE FROM THE CODE OF CONDUCT SECTION OF THIS SITE.
Copyright © 2012 by Fitch, Inc., Fitch Ratings Ltd. and its subsidiaries. One State Street Plaza, NY, NY 10004.Telephone: 1-800-753-4824, (212) 908-0500. Fax: (212) 480-4435. Reproduction or retransmission in whole or in part is prohibited except by permission. All rights reserved. In issuing and maintaining its ratings, Fitch relies on factual information it receives from issuers and underwriters and from other sources Fitch believes to be credible. Fitch conducts a reasonable investigation of the factual information relied upon by it in accordance with its ratings methodology, and obtains reasonable verification of that information from independent sources, to the extent such sources are available for a given security or in a given jurisdiction. The manner of Fitch‘s factual investigation and the scope of the third-party verification it obtains will vary depending on the nature of the rated security and its issuer, the requirements and practices in the jurisdiction in which the rated security is offered and sold and/or the issuer is located, the availability and nature of relevant public information, access to the management of the issuer and its advisers, the availability of pre-existing third-party verifications such as audit reports, agreed-upon procedures letters, appraisals, actuarial reports, engineering reports, legal opinions and other reports provided by third parties, the availability of independent and competent third-party verification sources with respect to the particular security or in the particular jurisdiction of the issuer, and a variety of other factors. Users of Fitch‘s ratings should understand that neither an enhanced factual investigation nor any third-party verification can ensure that all of the information Fitch relies on in connection with a rating will be accurate and complete. Ultimately, the issuer and its advisers are responsible for the accuracy of the information they provide to Fitch and to the market in offering documents and other reports. In issuing its ratings Fitch must rely on the work of experts, including independent auditors with respect to financial statements and attorneys with respect to legal and tax matters. Further, ratings are inherently forward-looking and embody assumptions and predictions about future events that by their nature cannot be verified as facts. As a result, despite any verification of current facts, ratings can be affected by future events or conditions that were not anticipated at the time a rating was issued or affirmed.
The information in this report is provided ―as is‖ without any representation or warranty of any kind. A Fitch rating is an opinion as to the creditworthiness of a security. This opinion is based on established criteria and methodologies that Fitch is continuously evaluating and updating. Therefore, ratings are the collective work product of Fitch and no individual, or group of individuals, is solely responsible for a rating. The rating does not address the risk of loss due to risks other than credit risk, unless such risk is specifically mentioned. Fitch is not engaged in the offer or sale of any security. All Fitch reports have shared authorship. Individuals identified in a Fitch report were involved in, but are not solely responsible for, the opinions stated therein. The individuals are named for contact purposes only. A report providing a Fitch rating is neither a prospectus nor a substitute for the information assembled, verified and presented to investors by the issuer and its agents in connection with the sale of the securities. Ratings may be changed or withdrawn at anytime for any reason in the sole discretion of Fitch. Fitch does not provide investment advice of any sort. Ratings are not a recommendation to buy, sell, or hold any security. Ratings do not comment on the adequacy of market price, the suitability of any security for a particular investor, or the tax-exempt nature or taxability of payments made in respect to any security. Fitch receives fees from issuers, insurers, guarantors, other obligors, and underwriters for rating securities. Such fees generally vary from US$1,000 to US$750,000 (or the applicable currency equivalent) per issue. In certain cases, Fitch will rate all or a number of issues issued by a particular issuer, or insured or guaranteed by a particular insurer or guarantor, for a single annual fee. Such fees are expected to vary from US$10,000 to US$1,500,000 (or the applicable currency equivalent). The assignment, publication, or dissemination of a rating by Fitch shall not constitute a consent by Fitch to use its name as an expert in connection with any registration statement filed under the United States securities laws, the Financial Services and Markets Act of 2000 of the United Kingdom, or the securities laws of any particular jurisdiction. Due to the relative efficiency of electronic publishing and distribution, Fitch research may be available to electronic subscribers up to three days earlier than to print subscribers.