Embed Size (px)
Citation preview
SUSAN C. WELLER
Eleven
Structured Interviewing and Questionnaire Construction
Introduction and Overview
Studies of humans can be based on different forms of information: observations, archival records, and interviews. I focus here on developing interview materials for studies that rely on direct informant-based information. The chapter is organized by interview purpose; I describe different approaches to interviewing and questionnaire construction within the context of the overall study goals. The best format for a question or series of questions depends on the type of information desired. In general, the less that is known about an area, the more appropriate are unstructured, open-ended methods. 'The same is true with interviewing.
The initial stage of any project should include a descriptive exploration of the topic under study. A variety of strategies are available for conducting semistructured individual or group interviews. Your goal is to develop a set of items relevant to the area of interest and to the people to be interviewed. This phase may elicit a set of relevant items for further inquiry or generate descriptive cultural models.
The second stage incorporates the results into structured interview materials for systematic examination. In anthropology, descriptive information may be used to design a detailed study of cultural models, assertions, or beliefs. In cross-cultural psychology, descriptive results may be used to modify existing materials (for example, standardized scales) or to check their validity. A combination of initial descriptive exploration and subsequent systematic interviewing produces a study superior to one based on either method alone, although it involves a greater commitment of time and energy.
364 WELLER
Projects that rely solely on either responses to open-ended questions or to a series of agreement rating scales can be biased and thus inaccurate. Responses to open- ended questions are limited by memory bias: People can recall fewer items (reasons, cases, etc.) than they can recognize when presented with a complete list of relevant items. This means that spontaneous, unstructured requests for information, while retrieving important information, may not retrieve all of it. When a respondent doesn't mention a particular item, it may mean that the item is unimportant or that it's been forgotten. Also, some informants provide long, detailed answers while others give short ones. Using different probes or different amounts of probing across individuals effectively changes the questions and makes it difficult to compare responses across individuals.
Using a standardized list of items or set of statements helps you minimize or avoid the problem of obtaining inconsistent or noncomparable data across informants and helps you make systematic comparisons across individuals and groups. However, if the questions or items to be explored are generated by you and not preceded by descriptive interviewing, the interview may focus on items of interest to you and may misrepresent or entirely miss topics of importance to informants. A preferable approach is to combine both methods: Use open-ended questions to explore a topic and develop an understanding of relevant questions and responses, then collect further systematic data based on the responses.
In the second phase of a study, you develop structured interview materials to examine in detail knowledge, attitudes, beliefs, and reported practices. A variety of question formats are available. For example, most interview-based studies contain some general information questions covering sociodemographic characteristics of the respondent. These questions can be constructed in a variety of formats (close ended, multiple choice, or open ended) and are designed to collect specific information like gender, religious affiliation, raciallethnic identity, age, years of education, number of children, etc. There may also be questions about behaviors ("In the last year, how many times did you visit a doctor?")or relationships ("Name the people with whom you have discussed important personal matters during the past six months.").
Another type of study where questions are used is in assessment of knowledge, Knowledge tests evaluate the degree to which an individual or group p ~ ~ ~ e ~ s t i ~ knowledge about a particular topic. You may construct tests with multiple choice, truelfalse, or open-ended questions. A specific assumption of a knowledge test is that the correct answer to each question is known, so that respondents' answers may be scored as correctlincorrect.
A related type of study assesses affifudes. Attitudinal studies attempt to measure the degree to which individuals demonstrate a specific a priori defined concept that is usually psychological, such as authoritarianism, feminine role identity, accultura- tion, or aggressiveness. The most common format for such studies is to have a

Structured Interviewing and Questionnaire Construction 365
series of statements, with a rating scale for each; respondents are asked to express their relative agreement with each statement. Similar to knowledge tests, responses are "scored" according to the a priori defined standard or criterion.
A fourth type of study describes the categories or dimensions people use to discriminate among items in a set to describe their class~fication of items. Classi- fication studies try to uncover respondents' dimensions of discrimination rather than assess their adherence to a priori defined dimensions. You ask informants to com- pare items in terms of their similarity without reference to any specific dimensions or criteria. Formats appropriate for collecting similarity data include: pile-sorting tasks (items are sorted into piles according to their similarity); paired-comparisons of items (similarity is rated on a rating scale); and triadic comparisons of items (respondents pick the most different item from a set of three). Classification procedures are often used to study relations or structure in a face-to-face or closed- group social network.
Finally, the purpose of a study may be to describe the beliefi of a group of respondents. Whereas classification studies examine respondents' beliefs (such as how they divide up the world into sets and subsets), beliefs may be examined in greater depth by administering a series of related questions on a single topic. For example, questions might refer to attributes relevant to a specific topic or to assertions contained in a cultural model. Question formats differ from those appropriate for classification studies and include: open-ended, multiple choice, ordered or ranked items, and interval or frequency estimate questions.
Classification and belief studies depart meaningfully from knowledge and attitudinal studies in how informants' responses are handled. In classification and belief studies, responses are not recoded or scored against a predetermined standard. Thus, while many formats are applicable across a variety of study purposes, not all formats lend themselves to every purpose.
Phase I: Exploratory Interviewing and Item Generation
The first phase of a project should be about gaining a broad understanding of the area of study. Without general background knowledge, it's impossible to know whai questions are appropriate. So, depending on how familiar you are with the topic and informants, begin with unstructured and semistructured interviews and progress to more structured ones. Initial interviews may explore a topic in general to gain broad understanding of the topic and terminology. The first step in this phase of interviewing, however, focuses on learning whether your topic is relevant to the population and discovering the "right" questions to ask. Spradley's books (1970, 1979) are helpful in this phase. After eliciting the information, you may use it to develop new interview materials or to check the appropriateness of existing materials.

366 WELLER
Results of the initial interviews may be used to modify existing materials or to develop new ones. Items should be elicited from informants in their own words. (Without such elicitation, items may reflect your ideas and not theirs.) The set of items is sometimes called a semantic or cultural "domain." A domain is a set of related words, concepts, or statements about a single theme. The set typically is defined as the items with the highest agreement across informants. Examples of domains include: color terms (Berlin and Kay 1969; Kay 1975), plants (Berlin et al. 1974), kinship terms (Romney and D'Andrade 1964), animals (Henley 1969; Rummelhart and Abramson 1973), illnesses (Frake 1961; D'Andrade et al. 1972; Lieberman and Dressler 1977; Young 1978; Weller 1983, 1984); types of pain (Moore et al. 1986); and emotions (Fillenbaum and Rapoport 1971; Romney et al. 1997).
Free-Recall Listing
Free-recall listing is a technique where an open-ended question is used to obtain a list or partial set of items from each informant. (What kinds of s are there? Name all the s you know.) The goal is to get a comprehensive sample of items. Some domains may be predefined with items belonging to a clear set, like months of the year or days of the week. Usually, however, the boundaries are unknown, and you use interview responses to define the set and its boundaries.
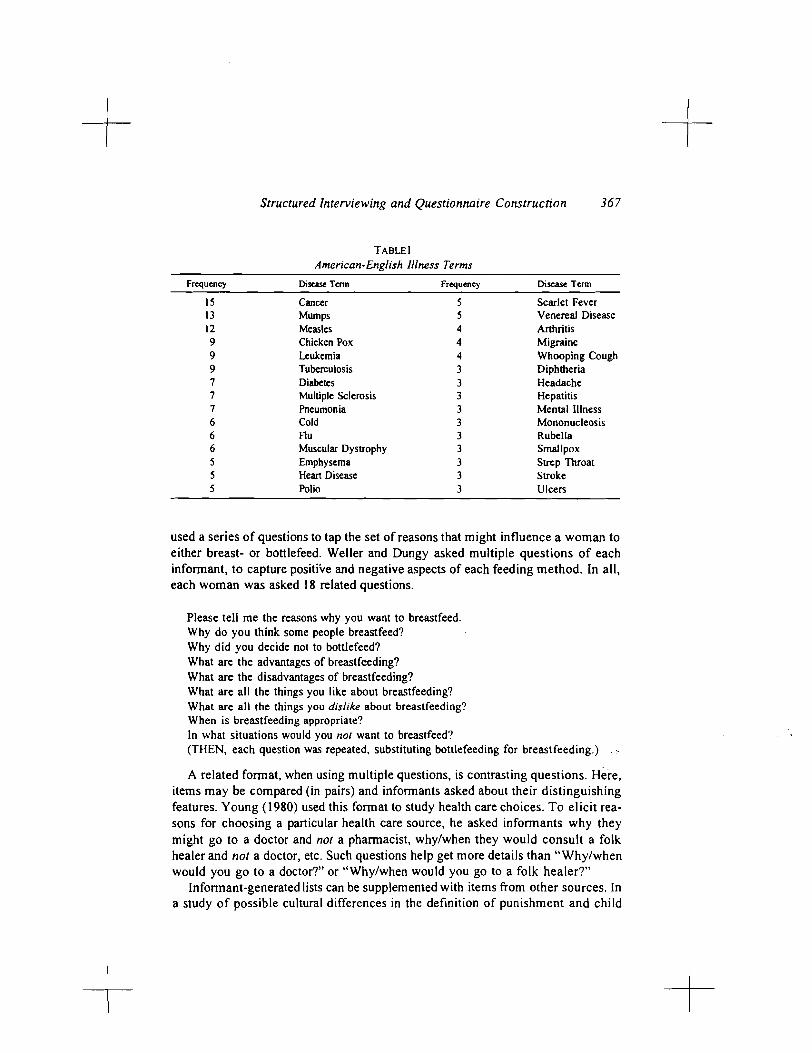
After deciding on a general subject, you have to find a meaningful question. Some areas or topics are so clearly defined that a single question can elicit domain items. Such a question is usually of the form, "Name all the Xs that you know of." For example, in a study comparing the perceptionof illnesses by urban Guatemalan and U.S. women, Weller (1984) began by eliciting a set of illness terms well known to the informants. To do this, Weller asked 20 women in each country to name all the illnesses that they knew (and to describe each). In the United States she said, "I would like you to name illnesses or expressions for being sick. Could you please tell me all the diseases or illnesses that you can think of?"
Table 1 shows the distribution of response frequencies for the U.S. sample for items mentioned by three or more respondents. Note the number of respondents mentioning each item: The first item was mentioned by three-fourths of the sample; 6 items were mentioned by about half (9120) of the sample; and 30 items were mentioned by at least 15% (3120) of the respondents. The 30 items formed the set of items for further interviews with U.S. women.
You may ask questions in a variety of formats. A series of related questions may elicit more exhaustive lists from informants. Some informants may perceive such a series as being all the same, but others respond differently to each question and provide detailed responses to some questions and not to others. In a study of women's preferences for different infant-feeding methods, We1 ler and Dungy (1 986)
Structured Interviewing and Questionnaire Construction 367
TABLE 1 American-English Illness Terms
~p - - - - - - -
Frequency Disease Tmn Frequency Di- Term
I5 Cancer 5 Scarlet Fever 13 Mumps 5 Venereal Disease 12 Measles 4 Arthritis 9 Chicken Pox 4 Migraine 9 Leukemia 4 Whooping Cough 9 Tuberculosis 3 Diphtheria 7 Diabetes 3 Headache 7 Multiple Sclerosis 3 Hepatitis 7 Pneumonia 3 Mental Illness 6 Cold 3 Mononucleosis 6 Flu 3 Rubella 6 Muscular Dystrophy 3 Smallpox 5 Emphysema 3 Swp Throat 5 Heart Disease 3 Stroke 5 Polio 3 Ulcers
used a series of questions to tap the set of reasons that might influence a woman to either breast- or bottlefeed. Weller and Dungy asked multiple questions of each informant, to capture positive and negative aspects of each feeding method. In all, each woman was asked 18 related questions.
Please tell me the reasons why you want to breastfeed. Why do you think some people breastfeed? Why did you decide not to bottlefeed? What are the advantages of breastfeeding? What are the disadvantages of breastfeeding? What are all the things you like about breastfeeding? What are all the things you dislike about breastfeeding? When is breastfeeding appropriate? In what situations would you not want to breastfeed? (THEN, each question was repeated. substituting bottlefeeding for breastfeeding.) . ..
A related format, when using multiple questions, is contrasting questions. b ere, items may be compared (in pairs) and informants asked about their distinguishing features. Young (1980) used this format to study health care choices. T o elicit rea- sons for choosing a particular health care source, he asked informants why they might go to a doctor and not a pharmacist, whylwhen they would consult a folk healer and not a doctor, etc. Such questions help get more details than "Whylwhen would you go to a doctor?" or "Whylwhen would you go to a folk healer?"
Informant-generated lists can be supplemented with items from other sources. In a study of possible cultural differences in the definition of punishment and child

368 WELLER
abuse, "punishment" items listed by Anglo and Hispanic adolescents were sup- plemented with examples of physical abuse (Weller et al. 1987). Because Hispanics appeared in the child-abuse registries at a rate exceeding that of Anglos, the study sought to discover if the difference was due to a greater use and possible acceptance of corporal punishment among Latinos or if there might be bias in reporting statistics. Interviews conducted with Anglo and Hispanic adolescents explored ado- lescent "misbehaviors"and "adult disciplinary responses." Verbatim responses of 29 Anglo and 27 Hispanic adolescents(with approximately equal numbers of males and females) were recorded. Each interview took one-two hours to complete and con- sisted of open-ended free-listing questions, descriptive answers, and probes by interviewers to seek further explanations. The following issues were explored:
1. "What things do you (or other teenagers) do that make your parentslmotherl father/adults/etc., angry?"
2. (For each response to the previous question) "When you do , what do your parents, etc., do?"
3. "What other things might be likely to make adults upset or angry?" 4. (For each item mentioned) "And if m a k e s adultsletc., angry, what might they
do in response?"
To elicit as exhaustive a list as possible for each question, Weller et al. (1987) changedthe question slightly and asked it again as informants exhausted their list. These questions elicited two related lists: the set of things teenagers do and the set of things adults do in response. Weller et al. tabulated the responses across all 56 adolescents. Because extreme forms of punishment and abuse are infrequent enough so that they would not be expected to appear in such a small sample size, a list of the most frequently reported forms of physical abuse were incorporated into the list of items from the log of the university hospital emergency room.
Informants should be able to generate lists of about a dozen items. If lists are short, try probing more. Avoid asking questions that can be answered with "yes" or "no." Rather than asking, "Are there any more s ? , " say, "You said that - and
are kinds of s . What other kinds of s are there?'This reminds the informant what he or she was thinking and conveys the message that you're looking for a more complete listing. If such probes fail to generate richer lists, you mighf try a different format for the focus of the question, by using multiple or contrasting questions, or try an altogether different focus. It is possible that the "set" may exist in your mind, but not in those of the informants.
Record responses verbatim. Clarify all ambiguous phrases and thoughts. You want to elicit statements or themes that are clear so that only one meaning is conveyed (for example, if a statement is repeated to others, they will understand the exact meaning implied by the informant). In the infant-feeding study, some women said that they had chosen breastfeeding because it was "convenient." Others said they had chosen bottlefeeding because that was "convenient." Further probing
Structured Interviewing and Questionnaire Construction 369
revealed that the breastfeeders meant that they could feed their infant without having to prepare or clean bottles and the bottlefeeders meant that they could feed their baby anywhere without exposing their breasts. Thus, the latter statementsmore clearly expressed the reasons for choosing a particular feeding method. A goal in recording responses is to be sure that you have captured the essence or underlying meaning in the informants' own words, so that you may use specific statements, phrases, and idioms in subsequent interviews.
Responses should also be at the same level of contrast. Simply, there should not be any set-subset relationships among items in a list. Suppose an informant is asked to name fruits and the list contains the following: berries, strawberries, blueberries, oranges, lemons, and citrus fruits. Further questioning should clarify possible relationships among items on the list: "Is a berry a kind of strawbeny? Is a strawbeny a kind of blueberry? . . . Is a beny a kind of citrus fruit?" Responses should clarify the relationships and would eliminate berries and citrus h i t s from the list. Alternatively, asking "What kinds of fruits are there?'may elicit classes or subtypes of fruit. The taxonomic relationships among items in a set may be elicited through detailed interviewing about what kind of things there are in the world (see section below on Taxonomic Elicitation).
Unique, verbatim answers are tabulated across respondents. Tabulate answers by informant, not by question. This is especially important when using multiple questions to elicit items, so that when someone mentions something more than once, it is counted only once-for that informant. The final tabulation list, then, should reflect the number of people who mentioned each item.
The final statements should be in clear language with consistent syntax. Statements should convey the same meaning to each and every reader. In the infant-feeding study, Weller and Dungy (1986) chose the 18 most frequently mentioned themes from the English-speaking Anglo and the Spanish-speaking Hispanic lists for study. They used two separate statements to capture the notion of convenience. They changed all statements to a neutral form: "A way to feed your baby that . . ." The list was balanced, so that half of the items referred to breast- and half to bottlefeeding; half contained "positive" attributes and half "negative" ones. Although the list had a culled and modified set of the multitude of statements collected, the language and ideas were concordant with those in the original interviews.
The necessary sample size for open-ended interviews is a function of variability. This is true for both qualitative and quantitative research. The less variation there is (that is, the more homogeneous the responses), the fewer informants are necessary. With high agreement and repetitive responses across informants, a small sample size may suffice. For some domains, a sample size of 10 may be sufficient; for other domains, or for increased accuracy, sample sizes of 50 or more may be needed. Typically, about 20 informants is adequate. As the number of interviewed
370 WELLER
informants increases, say in increments of 5, a point will be reached where little new information is added. Thus, the sample size is adequate when the addition of new informants doesn't alter the frequency distribution of items.
By attempting to get a list of items from each informant, more information is obtained per informant and fewer informants are needed. With a meaningful question, each informant should be able to generate a list of approximately 10 items (6-14 items). Agreement on items, statements, or themes is estimated by counting the number of informants that mentioned each. The set or domain is defined for the group by the overlap across informants. The most frequently mentioned items are the most salient ones interviewed. Psychologists have shown that the most salient items will be named by more people and those will appear higher up in individual lists. While the set of items obtained with free-recall listing is not necessarily definitive or complete, it should nevertheless capture well-recognized items.
Group Interviews
Lists generated from group interviews do not necessarily reflect the thoughts of each person. Individual lists generated in a group setting are not independent because of interaction among informants. Thus, only one list is generated per group. An exception to this is the initial request for written free-recall lists from indi- viduals and the collection of the lists, before any discussion begins. When lists are collected after discussion begins, sample size is the number of groups and not the total number of individuals in the groups.
Taxonomic Elicitation
Structured interviews may be used to elicit an entire taxonomy from a single (or multiple) informant(s). General questioning of the sort, "What kinds of s are there?'with comparative and contrastive questions like, "Is - a ? " can be used to construct a taxonomy of domain items. This form of questioning and the resultant description or model of beliefs can be seen in the work of.Meztger and Wi1liam.s (1 963a, 1963b, 1966), Frake (196 l), and Conklin (1 969). This type of interviewing is excellent for mapping-out terminology (especially in a new language) and gaining an understanding of the interrelations among items. Interviews may focus on collecting all terms related to a particular topic. For example, Frake elicited all illness terms in the Subanum language (the lexicon) and identified features that distinguished classesof illnesses. Berlin et al. (1974) detailed indigenous knowledge of plants, and Berlin and Kay (1 969) described color terms. Kay ( 1977) described a taxonomy of kinds of illnesses for Mexican Americans, and Spradley (1970) described kinds of "drunks."
Structured Interviewing and Questionnaire Construction 371
Narratives and Cultural Models
Another way to learn about a topic or domain is to collect narratives or individual accounts (case histories). Common themes can then be extracted from textual materials and studied. Quinn (1987) created a descriptiveaccount or "model" of American beliefs about marriage based on informants' descriptions of it. Chavez et al. (1995) recorded descriptions of possible cancer etiologies and used the common or recurring themes across informants to compare beliefs across different informant groups. Kempton, Boster, and Hartley (1995) also began their study of U.S. environmental beliefs by collecting narratives and then systematically explored the salient themes.
Narrative analyses can only suggest possible interconnections and relationships among themes. Unstructured methods of interviewing are excellent for suggesting hypotheses, but you need systematic data to test the validity of observations and to
.
make comparisons across groups. Personal narratives sometimes yield more detail on a single case, but typically require a larger sample size to cover the breadth of cases. For example, interviews with individuals about "all the illnesses they know" can uncover information on the diagnosis, symptoms, and treatments for a variety of illnesses. In contrast, a detailed case history of the last illness case that occurred in the household collects information on only one case of one illness. Furthermore, it's difficult to get case information on rare events. The appropriate sample size for collecting narrative materials-as with any technique-is determined by the degree of homogeneity in the sample. If a high degree of redundancy (say 50%75% overlap in themes) is reached within a homogeneous category of informants (for example, gender and SES), then only a few interviews (say 10-20 informants) may be necessary. However, as with all interviewing, sample size minimums apply to each category (gender andlor SES groupings) of informants.
Phase 11: Structured Interviewing Techniques and Questionnaire Construction
After you establish the items for study, you can pursue a more structured interview format. Open-ended, semistructured formats facilitate the collection of new information, providing the flexibility to explore different topics in-depth with different informants. Meaningful comparisons across people may not be possible, however; informants have been encouraged to discuss different items, so they haven't really been asked the "same" questions. Structured formats let you make comparisons across people and groups.
In this section, I describe a variety of question formats. The focus is on designing interview materials (questions, tests, and tasks) appropriate for the goal of the study. Thus, the section is organized by study purpose: general information questions,

knowledge tests, attitude scales, classification studies, and assessment of cultural beliefs.
General Information Questions
Most studies collect general information. Questions in such studies may be straightfonvard requests for information: age, gender, ethnicity, household composition, length of residency, and reports of familial practices. Some questions provide information about respondents' sociodemographic characteristics. These questions most closely parallel those found in surveys.
The term "survey," however, is often used to refer to a combination of method- ologies: the selection of respondents, method of interviewing, and questionnaire design (Fowler 1993). Sampling procedures in survey research usually focus on different procedures for selecting a random sample. There are many disadvantages to nonrandom or conveniencesamples (for example, they may not be representative and it's impossible to estimate the degree of bias that they contain). Nevertheless, conveniencesamples can sometimes be useful, especially when they're chosen from specific segments of the population (Johnson 1990).
The method of interviewing refers to whether interviews are conducted in person, on the phone, or by mail. In-person or face-to-faceinterviews may be administered by an interviewer or be self-administered and tend to have the highest participation rates. Phone interviews can only be administered by an interviewer, but may be computer assisted by having the questionnaire on a computer. With computer- assisted telephone interviews (known as CAT1 in the sociological literature), the interviewer enters responses directly into a computer. Mail interviews must be self- administered. More complex responses can be obtained in face-to-face interviews, with the use of visual aids, if necessary. Questions and responses must be simplified for orallphone presentation. Self-administered open-ended questions usually do not produce useful information, due to the lack of probing for clarification.
Participation rates for the three different approaches parallel their costs. In general, face-to-face interviews have the highest participation rates and are the most expensive. Phone and mail methods tend to be less expensive, but also have lower rates of participation. As follow-up procedures (call backs and remailings) -are intensified, phone and mail participation rates (and costs) increase. A minimal participation rate of 75% is required for surveys contracted by the U.S. government.
The biggest weakness in questionnaire design occurs when an investigator drafts a set of questions without sufficient background. The result is often a set of poorly worded questions with unclear response categories. Sociologists and psychologists have spent an enormous amount of time studying the effect of different wordings and orders of questions. The interactive context of an interview has long been recognized and studied by sociologists. It's a waste of research effort not to take
Structured Interviewing and Questionnaire Comtruction 3 73
advantage of their experience and knowledge. Recommendations on wording and ordering of items can be found in the sociology literature. See, for example, Sudman and Bradburn's (1982) book Asking Questions? or the Sage Series, The Survey Kit (Fink 1995). It's worth investing a weekend or a full week to review some of these materials.
Question formats include: open-ended, close-ended multiple choice, and rating scales. Open-ended questions should be simple and seek clear, short answers. For example, "What was your age at your last birthday?," "What is your birthdate?," or "How many times have you been to the hospital this year?" Social network infor- mation may be requested from informants who do not have overlapping networks and who are not necessarily describing the same people with questions that parallel those used in the General Social Survey (Burt [I9841 appends the actual questions). Close-ended questions should be concise, with a complete listing of mutually exclusive response categories. Rating scales are usually appropriate only for literate informants with a moderate degree of education, although they may be simplified sufficiently to be handled in an oral interview (Weller and Romney 1988).
In general, questions should proceed from broad, general requests for information to those requesting specific or more detailed information. This is done so that questions requesting detailed information don't bias responses for more general information. Similarly, less personal questions should precede those perceived as more private or threatening. Questions requesting sociodemographic information may be asked initially, especially if they help establish whether the informant fits the study's inclusion criteria. Some sociodemographic questions may be asked at the very end of the interview, as is often done with questions in the United States regarding income.
Inclusion and exclusion criteria for interviewing informants should be part of the study design or protocol. If you want to study Latina women, then before interviewing anyone you should define who is and who is not a Latina woman. Thus, the initial questions may seek to establish the informant's gender, ethnicity (by self-report and possibly by birthplace and language preference), and age (in years or parental status). The advantage of having all inclusion and exclusion criteria-related questions first is that an interview may be terminated quickly for people who don't meet study criteria. Sometimes, though, it may be necessary to collect some information on the excluded individuals so that they are not offended by a short interview.
Only questions relevant to the study should be included in the interview (that is, factors implicated by theory, factors mentioned in the literature, and factors that might potentially affect results). Too often, extraneous questions are included without considering how responses will be handled. For example, a question on marital status ("Are you married, single, divorced, or widowed?") might be included, but if you're really interested in whether a woman is living with the father

374 WELLER
of her child, then a direct question about that would provide more useful information. Still, it's best to ask too many rather than too few questions: A question/answer can always be ignored after it's collected but it's usually difficult or impossible to go back and ask a question that was omitted inadvertently.
If you want to know how your sample compares with a larger population, use questions from large or national surveys. Not only can you compare responses with those in the larger survey, but you can take advantage of the time and effort that went into the development and wording of the questions. Also, you can compare different sets of questions purported to measure the same thing. For example, ques- tions about ethnicity can come from multiple sources: the categories used in a national census andlor from questions you have developed that you believe are more appropriate indicators. Using the census categories allows you to discuss the results in terms of those categories and to compare findings with other reports. Using a new series of questions in conjunction with the census questions would allow direct comparison of the two ways to define ethnicity. When beginning to design a ques- tionnaire, take advantage of previous scholarly work and look for published questions (and responses) and don't hesitate to use them if they're good.
Combining Responses to Create Scales and Indices
As the requested information becomes more abstract (that is, as questions move from simple ideas like gender and age to more complex ideas such as social class), more questions are needed to get a reliable estimate of the concept. For concepts that can't be measured simply or directly, use proxy questions to get information associated with or indicative of the underlying concept. Then, combine responses to obtain a more reliable and accurate estimate. For example, we believe that social class or socioeconomic status exists, even though there is no direct, single question or ruler by which we can assess or categorize an individual or household.
In developed countries, we often use combinations of educational level, income, and occupation as proxy measures for social class (see Haug 1977). In less- developed countries and among populations with little variability in occupation, education, and income, such variables may not be helpful in differentiating social strata. In lesser developed and rural areas, it's more helpful to ask a series of questions related to or indicative of socioeconomic status (for example, house construction, water source, type of stove, etc.) and to combine responses to dif- ferentiate households.
A surnmative score across variables creates an index or scale. The choice of questions whose content is related to the underlying concept ensures the content validity of such a scale. Thus, the choice of a set of reasonable questions or proxy variables and a combination of responses to those variables should also provide a reasonable estimate. Another kind of validity is construct validiy, or whether the scale is correlated with other measures of the same concept. An additional check on

Structured Interviewing and Questionnaire Construction 375
construct validity is to ensure that items selected for combination in a scale are in fact scalable (that is, whether they are mathematically correlated). Questions measuring the same thing should have similar responses across respondents and should be correlated. Principal components analysis provides a solution of how to optimally combine variables that are in different units of measurement. A principal components analysis clusters items into groups according to their intercorrelations; items with the same pattern of responses across people (those that have the same pattern of high values and low values across people) are grouped together.
In developing a scale of financial resources in rural Guatemala, Weller et al. (1 997) asked over two dozen questions about household composition, characteristics of head of household (gender, age, education, ability to read, ability to write), house construction, and assets (ownership of land, appliances, vehicles, and animals). Some questions requested yeslno responses: "Do you own your house?," "Do you have a bicycle?" Others requested the number of people or animals. Weller et al. created codes for questions with multiple responses (for example, household construction).
In seeking to develop a scale concordant with community perceptions (construct validity), Weller et al. (1997) asked three informants in six villages to rank ten families according to their economic resources and retained only those questionnaire items that correlated with the community judgments (10 of the original 28 questions). A principal components analysis of those questions showed that variables most indicative of financial resources (including monthly income) grouped together on the first factor, and variables representing other dimensions of socioeconomic status (educational level and household size) grouped on successive factors.
Weller et al. (1997) wanted a relatively simple scale that could be used in other studies in the region, so they used the principal components solution to identify which variables should be combined (those on the first factor), but not for a weighted combination of variables. To overcome the problem of different units of measure, variables were dichotomized (so they would be in the same units) and summed. Each household received a cumulative score (+ 1) for the presence of each indicator: monthly income greater than the median; ownership of any appliance; more than two rooms in the house; nondirt floor; more than three chickens; adobe, brick, or block walls (as opposed to bamboo, wood, or plastic); land ownership; and ownership of a bicycle. Summing across the eight variables created a nine-point (0-8) scale. The final scale was concordant with other scales previously constructed to assess socioeconomic status in rural Guatemala (Freeman et al. 1977; Johnston et al. 1987). Such scales are surprisingly similar across rural regions of the world and use indicators such as floor construction (dirt versus other), type of cooking fuel, and availability of animals for sale.
Guttrnan scaling is another way to combine household indicators of socio- economic status. DeWalt (1979: 106-1 15) created a nine-point "material style of
376 WELLER
life" scale by combining responses across the presence or absence of eight variables: iron, radio, bed, cooking facilities off the floor, sewing machine, wardrobe, stove, and television. Guttman scaling of households by these eight variables reveals the cumulative and sequential ordering of the variables: If a household has an item on the list, it tends to have objects that precede it. Similarly, if a household lacks an item, it tends to lack subsequent items. DeWalt checked the validity of the scale by comparing the final scale to informant ratings of wealth and found them highly correlated. Another example of Guttman scaling of consumer goods for Polynesian households appears in Kay (1964; and see Weller and Romney 1990:79-83).
Responses can be combined across related questions or variables to create a single scale or index. Such indices are more reliable and accurate than a single question, especially when the question requests more than simple information like someone's age, height, or weight. While the combination of simple questions about households may be combined to estimate the socioeconomic status of a household, a variety of other variables may be similarly combined to obtain better estimates of behaviors and experiences. Handwerker (1996) describes the combination of responses from questions regarding household activities and responses about experiences of violence and affection.
Challenges to Validity
Accuracy of responses can be compromised by questions that are interpreted differently by different respondents. Questions should be in complete, grammatically correct language to minimize the possibility of reading questions one way with some informants and another way with other informants. A technique psychologists use to understand how informants interpret a question is to ask individuals to think out loud, to describe their interpretation of the question and the process of answering, and to list possible answers.
Another source of inaccurate responses is the informants' own memory. Infor- mants may report an event that actually happened 12 months ago as occurring 6 months ago. Marking a period with an important or widely recognized event (since - occurred . . .) reduces this telescoping effect (Loftus and Marburger 1983).- Informants also may misrernember an event, reporting instead what they think happened or what usually happens. Informants are much better at telling you what they typically do than what happened at a specific time. Freeman et al. ( 1 987) asked a group of individuals about attendance at a group presentation the previous week. Errors consistently counted those who usually were in attendance, but were not there, as being there; and those who usually were absent, but were there, as absent.
In another study of systematicerrors caused by memory (described in D'Andrade 1974), two groups of individuals observed interactions among members of a small group and rated the occurrence of specific behaviors. One group rated behaviors

Structured Interviewing and Questionnaire Construction 377
simultaneously while they were watching the film and the other group recorded the behaviors immediately after the film was over. The responses of the group that rated the behaviors after the film was over corresponded more to the similarity among the words or adjectives than to the ratings of the first group. In other words, if someone was remembered as having smiled, then they were more likely to be attributed with actions associated with smiling like having been facilitative, friendly, and so on whether they were or not. Again, reports may reflect broader patterns of occurrence rather than a specific instance. The series of studies by Bernard et al. (1980; see also Bernard et al. 1985) also reflect this: Although informants were asked about social interactions during a specific time period, the longer the observational period (a better sample of typical interactions), the higher the informants' accuracy.
Accuracy of responses may also be affected by the interview itself. Contextual effects have long been documented and studied by sociologists and, generally, better responses are obtained when the interviewer and the informant share characteristics such as gender and ethnicity. An informant's lack of experience with the interview process may decrease accuracy, and informants may offer socially desirable respon- ses or may deliberately mislead you. It isn't necessarily true, however, that because information comes from a structured interview with a stranger that the information won't be accurate. Stone and Campbell (1984) found that when individuals were first interviewed with a survey administered by a stranger and then reinterviewed in an unstructured format' by someone known to them, the second interview reflected greater family-planning awareness. Unfortunately, without a group of informants interviewed in an unstructured way followed by a survey, it's impossible to tell if the difference in reporting is due to a difference in interview format or if results reflect increased awareness due to the prior interview on the same topic.
Knowledge Tests
A knowledge test consists of a series of questions designed to test someone's ability or knowledge. The answers-the correct answers-to the questions are known, and responses are scored or recoded as correct/incorrect. First, a domain of questions is established that covers the subject matter or ability to be tested. Then, test questions are drafted. Question format may be multiple choice (with two or more choices) or open ended (requesting single-word or short-phrase answers). Performance of respondents is usually described as the percentage of correct responses (of the total number of questions) or as a percentile, comparing per- formance of respondents to one another from the distribution of scores across respondents. Just as sociologists have much expertise in writing general information questions, psychologists have extensive expertise in developing knowledge tests. Nunnally's (1978) book, Psychometric Theory, presents a thorough review of issues involved in developing a test.
378 WELLER
Unfortunately, some tests are simply drafted, administered, scored, and reported without assessing the reliability of the test. An assessment of a test's reliability and modification of the test, can greatly improve a test's ability to discriminate between knowledgeableand less knowledgeable informants. Reliability is the degree to which a variable or test yields the same result when administered to the same people, under the same circumstances. A test with low reliability is analogous to a sloppy measuring device-it may be valid, but it has a lot of measurement error. For example, if you measured the height of a sample of college undergraduates with a weight-height measuring device typically found in a physician's office and again with a 6" pocket-ruler, you might find that the pocket-ruler estimates could contain measurement error large enough to mask the difference in height between men and women. The more accurate the measuring device, the greater the ability to detect smaller differences. The same is true for tests. If a test can be streamlined and limited to questions that best differentiate degree of knowledge of the subject matter (thus, increasing the reliability), it can be a shorter, more accurate, and hence a more powerful test.
Reliability
Reliability of a test can be assessed in a variety of ways. One way to assess reliability is to give the.same test twice, after an interval of time, to the same individuals. Reliability is estimated by the correlation between the two sets of scores. Because the Pearson Correlation Coefficient is used, reliability ranges from zero to one. This type of reliability, test-retest reliability, is limited because scores may improve due to practice or learning effects. Two equivalent, but nonidentical tests can be administered, but it is diff~cult to develop "equivalent but nonidentical" tests and the individuals being assessed may change during the time interval. Another approach is to create "two" tests by arbitrarily dividing a test in half and calculating separate scores for odd-numbered and even-numbered items. This type of reliability, split-halfreliability, is estimated by the correlation between the two sets of scores. The best overall estimate of reliability, because it subsumes the previous estimates, is provided by the reliability coelficient. The reliability coef- ficient, sometimes called coeficient alpha or Cronbach's alpha, is mathematically equivalent to calculating all possible split-half reliabilities, and, while it may sound complex, it is widely available as an easily accessible option in most statistical software packages.
For a test to have high reliability, all the questions must be on only a single topic and be at the same general level of difficulty. This means that items should be intercorrelated, and performance on individual items should be concordant with the overall score. A test question would not be a good estimate of ability if the "best" or high scorers got it wrong and those with lower total scores tended to get it right. Such questions reduce the accuracy of the total score. An item analysis helps

Structured Interviewing and Questionmire Construction 379
identify items that do and do not parallel the total score. The item-to-total correlation for each question tells how well responses for each question parallel the total score. If the correlation is not positive, or if the correlation is weak (less than +.20 or +.30), the item should be dropped. Items considered for omission can be dropped or modified. Writing good multiple choice answers is very difficult! The overall reliability of a test, the reliability coefficient alpha, is a hnction of the intercorrelation among the questions (the degree to which they measure the same concept) and the number of items (the more items on a single topic the more accurate the estimate):
Reliability = k rl ( I + (k - 1) 3.
where k is the number of questions and F is the average Pearson Correlation Coefficient between questions. Thus, a reliable test can be created with a few, highly correlated items or with a lengthy test of weakly related items. When dichotomous responses are analyzed, this formula is called Kuder-Richardson 20 (KR-20). The overall reliability coefficient and the reliability of each item can be readily obtained with the Reliability Procedure in the Statistical Package for the Social Sciences (SPSS 1990) or other statistics programs.
Example
In a study on the Pacific South Coast of Guatemala, Ruebush et al. (1992) developed a test to assess local knowledge about the causes, symptoms, and treatment of malaria. Experience both with residents of the region and the National Malaria Service led to a draft questionnaire or test with 65 truelfalse items. Since the correct answers to the questions comprised the scientific or biomedical model of malaria transmission and treatment, an initial pilot of the test was a very simple test to see if National Malaria Service workers (those with more biomedical experience) scored higher than the rural residents. This involved a day's worth of interviewing, going household to household, interviewing a half a dozen respondents and National Malaria Service workers.
A quick tabulation of responses and scores, in the field, helped identify obvious problems with the test. A revised version with 65 truetfalse questions was admin- istered to a larger sample of residents and National Malaria Service workers. Responses, where 0 = nolfalse and 1 = yesltme, were compared to the correct answers and recoded to I if answers matched and the answer was correct and to 0 if answers were incorrect. A reliability analysis, especially the item analysis, helped identify items that did not perform well because they did not contribute to the total score. The 65-item test had a reliability coefficient of .82. The reliability analysis indicated that reliability could be improved by omitting items with low item-to-total score correlations. The omission of 25 items created a 40-item test with a reliability coefficient of .91. Thus, the shorter version of the test had better

380 WELLER
discriminatory ability and comparisons between groups could be made with greater precision.
Scores from knowledge tests indicate how much someone knows the correct answers. In the above example, the correct answers constituted the scientific or the biomedical model of malaria, but the scores did not indicate whether wrong answers were due to a lack of knowledge or whether they were due to different beliefs. In the malaria study, Ruebush et al. (1992) also analyzed responses in their original form without coding them as correct/incorrect, and used the modal response for each question as an estimate for local beliefs regarding the answers. Cultural beliefs can then be compared to the scientific answer key used to score the knowledge test. Similarly, Trotter et al. (1997) compared Latino beliefs about AIDS to national survey results about AIDS knowledge. They found that although Latinos made more errors on knowledge tests (for example, they knew the biomedical or scientific model of AIDS less well than other groups [Anglos]), many of the items that the Latinos got wrong were not because Latino beliefs differed from the biomedical model. Rather, many items tapped areas about which there were no strong cultural beliefs (see section below on Exploration of Specific Beliefs).
Attitude Scales and Tests
Similar to knowledge tests, attitudinal scales or tests measure the degree to which individuals and groups possess specific constructs. (A construct is an a priori defined concept.) Development of attitudinal scales begins by defining the domain of items relevant to the particular attitude being studied. Statements are generated that describe the attitude. The statements are then administered to respondents, usually with a checklist or rating scales. lnformants indicate whether the statements describe their feelings and thoughts. Responses are scored by reversing or reflecting some responses (for example, reversing scale values by subtracting them from the value of the largest anchor point), so that the meaning of the values is consistent and small (or large) scores all indicating the absence (or presence) of the attribute. Thus, scale responses to some questions are reversed (by subtraction or by mul- tiplication with - 1). This reflection of responses parallels the handling of responses with knowledge tests, in that responses are scored in accordance with a previously determined standard. Attitude scales have been developed for a variety of topics, like depression, acculturation, and quality of life. Question formats can be dichoto- mous or checklist questions, but are usually rating scales.
Adapting Existing Materials and Scales
There are considerable advantages to using existing interview materials. Most importantly, it allows you to take advantage of the large amount of work that goes into the development of an interview protocol and facilitates communication with

Structured Interviewing and Questionnaire Comtruction 381
a larger group of scholars. Even for the seemingly simplest things, like collecting sociodemographic information, use of exact wording from national surveys allows for the comparison of sample results with those for the total population. The main disadvantage in using existing materials, especially standardized attitudinal scales, is the questionable validity of the results. A scale designed for one population may not be transferable to another population and conclusions based on one population may be erroneously generalized to another. Also, applying existing materials in a new setting may miss concepts important to the new group. There may be ideas or elaborations of ideas that are relevant in the new population that were not tapped or fully articulated in the original scale.
Nevertheless, the advantagesof adopting existing interview materials, when and where they exist, usually outweigh the disadvantages. One approach is to borrow and adapt materials as necessary. A thorough discussion of how to translate and modify materials (especially, tests) is presented by Brislin (1986) in the edited volume Field Method in Cross-Cultural Research. Cross-cultural psychologists have extensive expertise in the development of tests and materials that are comparable across cultural boundaries.
The first step in adapting a test for another culture or another setting is to translate statements and rating scales. Materialsshould be translated from the source language to the target language by one person and then translated back into the source language by another person. Brislin recommends two full translation loops (four people). Taking statements through such loops allows the investigator to see which concepts translate. Statements that retain their meaning through translation and retranslation are easily and directly usable. Statements that change meaning or that cannot be captured across translations need to be modified.
The next step involves ensuring that test questions are appropriate. One way to validate the items of a test or the statements for an attitude scale is to generate the item pool de novo. When applying a test to a new group, even within the same language group, it's advisable to generate new items. Open-ended questions with a small sample can sometimes reveal quickly and directly the validity of the items in a test. If newly generated items match or overlap statements and concepts already on the test, the test probably needs little or no modification. If, on the other hand, descriptive interviews elicit many ideas and themes not well developed or measured on the test, then the test probably needs revision. One solution is to add new questions at the end of the set of standard questions. Adding new questions at the end allows you to score the scale in the traditional way and build on the body of literature relevant to the scales as well as to base an analysis on a new set of items.
In a study of preterm deliveries among inner-city African American women, a standardized measure of stress was modified for that population. Stress, defined as the fit between an individual and his or her environment, was measured with the Holmes and Rahe (1967) Social Readjustment Rating Scale. The scale is a checklist

382 WELLER
of 43 life events that may have occurred in the past year, such as death of spouse and change in residence, where a greater number of positive answers is assumed to be indicative of higher stress. Before using the scale in a larger study of inner-city women, the investigators conducted open-ended, descriptive interviews with pregnant African American women about the stress in their lives.
Interviews began with a discussion of stress itself, to discover how it was defined and understood. Then, discussions covered the kinds of things that caused them stress. The results showed that although the women shared a general definition of stress and hadexperiencedsimilar stress-causingsituations, their stressful life events didn't correspond completely with those in the Holmes and Rahe scale. For exam- ple, they experienced stressful events not captured in the scale, such as loss of heat or electricity, being beaten or hit by a husband or boyfriend, and being evicted from home (being homeless). To be able to communicate with a larger group of research- ers who might use the same scale, the investigators added new items to the end of the scale, rather than modify the scale itself. This gave them the flexibility to analyze stress in terms of either the standardized approach or as a modified test.
A limitation with attitudinal scales is their questionable validity when used on populations different from that on which the scale was developed. In general, this does not indicate a problem with the test, but one with the application and con- clusions. Validity, most generally, is the degree to which something does what it is supposed to do. A valid'question, scale, or test measures what it is intended to measure. Content validity refers to the appropriateness of the items: Does the content of the test items seem relevant to the topic being assessed? If responses from open-ended interviews with members of the target population overlap with the items and ideas contained in the existing set of questions, the questionnaire is appropriate for the new application. When the two sets of items overlap on many ideas but not all, the existing materials can be modified or expanded. If there is little overlap in the ideas and themes captured by the two approaches, an alternative or new test is needed.
Creating a New Scale
Numally (1978:604-609) describes the process of creating an attitude scale. His discussion is summarized here as five steps.
1. An item pool is created by writing about 40 items on a single topic. Half of the items should be moderately positive and half should be moderately negative. Statements where all or most respondents tend to answer similarly do not help to differentiate people. Thus, neutral statements are nor helpful nor are very strong statements.
2. Statements are composed into a draft questionnaire and administered to individuals similar to whom the scale will eventually be administered(the target population). Questions may have dichotomous or rating scale responses. The
Structured Interviewing and Questionnaire Construction 383
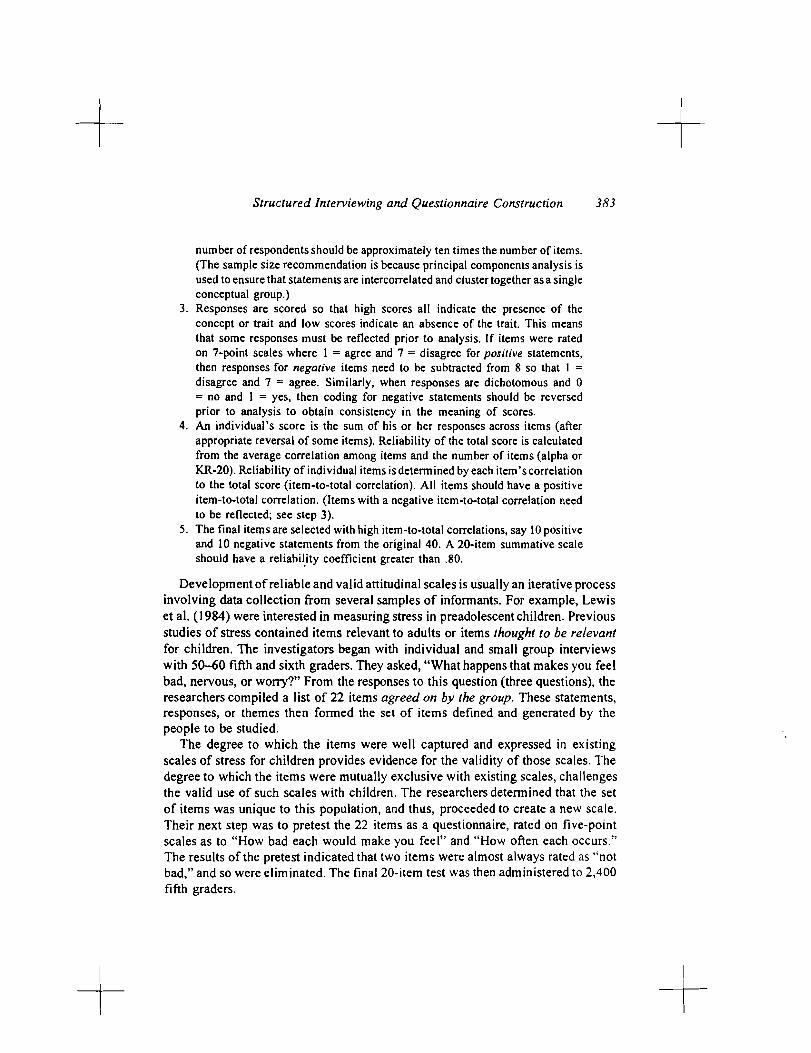
number of respondents should be approximately ten times the number of items. (The sample size recommendation is because principal components analysis is used to ensure that statements are intercorrelated and cluster together as a single conceptual group.)
3. Responses are scored so that high scores all indicate the presence of the concept or trait and low scores indicate an absence of the trait. This means that some responses must be reflected prior to analysis. If items were rated on 7-point scales where 1 = agree and 7 = disagree for positive statements, then responses for negative items need to be subtracted from 8 so that I =
disagree and 7 = agree. Similarly, when responses are dichotomous and 0 = no and 1 = yes, then coding for negative statements should be reversed prior to analysis to obtain consistency in the meaning of scores.
4. An individual's score is the sum of his or her responses across items (after appropriate reversal of some items). Reliability of the total score is calculated from the average correlation among items and the number of items (alpha or KR-20). Reliability of individual items is determined by each item'scorrelation to the total score (item-to-total correlation). All items should have a positive item-to-total correlation. (Items with a negative item-to-total correlation need to be reflected; see step 3).
5 . The final items are selected with high item-to-total correlations, say 10 positive and 10 negative statements from the original 40. A 20-item summative scale should have a reliabi!ity coefficient greater than 30.
Development of reliable and valid attitudinal scales is usually an iterative process involving data collection from several samples of informants. For example, Lewis et al. (1984) were interested in measuring shess in preadolescentchildren. Previous studies of stress contained items relevant to adults or items thought to be relevant for children. The investigators began with individual and small group interviews with 50-60 fifth and sixth graders. They asked, "What happens that makes you feel bad, nervous, or worry?'From the responses to this question (three questions), the researchers compiled a list of 22 items agreed on by the group. These statements, responses, or themes then formed the set of items defined and generated by the people to be studied.
The degree to which the items were well captured and expressed in existing scales of stress for children provides evidence for the validity of those scales. The degree to which the items were mutually exclusive with existing scales, challenges the valid use of such scales with children. The researchers determined that the set of items was unique to this population, and thus, proceeded to create a new scale. Their next step was to pretest the 22 items as a questionnaire, rated on five-point scales as to "How bad each would make you feel" and "How often each occurs." The results of the pretest indicated that two items were almost always rated as "not bad," and so were eliminated. The final 20-item test was then administered to 2,400 fifth graders.

384 WELLER
Classification Studies
In a departure from knowledge tests and attitudinal scales where answers are known, classification studies seek to understand and describe ways in which indi- viduals classify items into categories. For a set of items, similarity data are collected from respondents without directing informants as to the criteria for making com- parisons; judgments are made only in terms of the similarity or difference between items. Formats appropriate for similarity data collection are: pile sorting of items and paired or triadic comparisons of items. Similarity between items may also be estimated indirectly as a function of their shared attributes. Typically, responses are aggregated across informants and the similarity information is represented with a spatial plot or tree structure to summarize the relationships among items.
A classification study has at least three parts. First, the set of items for study must be defined. Second, similarity between each pair of items is estimated. Third, the similarity data are represented in a spatial or tree model. Similarity information can be collected directly with judged similarity or indirectly with a measure of similarity between pairs of items across a series of questions (their similarity in profiles). Direct, judged similarity may be collected with the names of items written on cards and sorted into piles according to their similarity (pile sort); with items arranged into sets of two and each pair is rated on the degree of similarity (paired comparisons); or items can be arranged in sets of three and the most different item is selected (triadic comparisons). For the collection of social network data, the question/task is modified slightly to emphasize the relationship being studied. Network studies often use an indirect estimate of similarity by calculating the similarity between informants' lists of group members' names. (For more detail on social network data collection, consult Wasserman and Faust [1994:45-551.)
Pile Sorting
After the set of items for study has been defined, the name of each can be written on a card or visual stimuli (pictures or objects) can be used. Informants are asked to read or review all of the items and to put them into piles, so that similar items are together in the same pile. Instructions are deliberately kept at a general level: Group the items according to their similarity without providing any specific criteria or examples. Individuals may make as many or as few piles as they wish. Pile sorting was originally described by Miller (1 969) and is reviewed in Weller and Romney (1988). Some applications include the study of social networks (Miller and Johnson 198 1 ; Johnson and Miller 1983; Freeman et al. 1988, 1989), recreational activites (Roberts and Chick 1979; Roberts and Nattrass 1980; Roberts et al. 198 1 ; Miller and Hutchins 1989), concepts of success and failure (Romney et al. 1979; Freeman et al. 1981), and pilot error (Roberts et al. 1980).

Structured Interviewing and Questionnaire Construction 385
For example, Kirk and Miller (1978) were interested in the perception of coca in South America and attempted to discover if it was considered a food product, a beverage, or a drug. They collected pile sort similarity data on 16 words, including foods, condiments, beverages, cigarettes, and drugs. They selected samples of 12 informants from each of 12 different sites: 2 cities in Colombia, I in Ecuador, and 6 locales in Peru (with 4 separate samples in Lima). Because Kirk and Miller used small, convenience samples, they used multiple samples to check the reliability of their results. Although some would argue for a single, large representative(random) sample to accurately represent the perceptions of a group, multiple, diverse, con- venience samples can provide similar information-il the results are consistent across the diverse groups. If the results differ, then further work is necessary to discover what factors are associated with the difference. In this case, results were similar across samples, so they were combined.
The classification or grouping of items appears in Figure 1 as a treelike repre- sentation. Here, "meat" and "food" are the most similar pair and are linked together
Hot pepper
Chocolate -I
COCA 2 Marijuana Pills
Poison
Liquor
Cigarettes
Figure I: Perceived similarity among foods and drugs (adapted from Figure 2 in Kirk and Miller 1978:144; reprinted with permission).

386 WELLER
at the lowest level of the tree, indicating the highest level of similarity. A cluster of edible things is then formed with other foods and condiments: meat, food, and vegetables join with salt and hot pepper. The beverages, coffee and chocolate also belong to this cluster. Another cluster contains the drugs: herb, COCA, and marijuana are in one subgroup; and liquor, cigarettes, poison, and pills are in another. Thus coca, although chewed often and drunk as tea, is perceived to be a drug, similar to marijuana.
The pile sort is a widely used and quick way to estimate similarity among items for a group of people. The task is easily understood and can facilitate conversation. After an individual has finished sorting items, she or he can describe the groupings. The data are best used to describe a group of individuals, rather than a single individual because the data are sparse. Information from each individual only indicates if an item is paired with another or not. Thus, only dichotomous (yeslno or onehero) data are collected for each pair from each individual. Because of the sparsity of information at the individual level, the method is recommended for larger samples of people (at least 30 people) and for larger sets of items (two dozen or more items, where other methods of data collection such as triadic and paired- comparisons become prohibitive).
To collect pile sort data write or type the names of items on cards (and number the backs of each card). Then, shume (and randomize) the cards and present them to an informant. Ask the informant to sort the cards according to their similarity. You can record responses immediately or later, by putting colored cards between the piles and putting a rubber band around the total set. Record responses by piles. For example, if someone sorts seven things into four piles:
This can be recorded as above, indicating the item numbers in each pile or, the item numbers can be separated by slashes:
Here, seven items have been sorted into four piles: items 1,2, and 3 are together; and items 4 and 5 are together. Items 6 and 7 were not put into piles with any other items. Similarity between each pair of the seven items is then recorded into a square, symmetric table or matrix. Since items 1, 2, and 3 are together, each pair in the group ( 1 and 2 , 2 and 3, 1 and 3) are tabulated as similar. Items 4 and 5 also occur together and are tabulated as similar. All other pairs are not perceived to be similar and are coded with zeros (see below).
Responses are tabulated into a matrix for each individual and then summed together into an aggregate matrix for the entire sample of informants. The tabulation

Structured Interviewing and Questionnaire Construction 387
of responses can be done by hand or with the aid of computer software. The ANTHROPAC program (Borgatti 1992) acceptspile sort information (item numbers separated by slashes), and provides both the individual and group matrices. Here is the individual matrix for the example above:
Variations on pile sorting include: allowing informants to split items, so that an item may go into more than one pile; constraining the number of piles an informant may make; or collecting successive pile sorts from each individual. Stefflre (1972) asked informants, when they were finished sorting items, if any items should go into more than one pile. Items or cards were then split and put into multiple piles.
In the unconstrained version of the pile sort, informants may make as many or as few piles as they wish. In the constrained version; informants are instructed to make a specific number of piles, say between seven and nine piles (Romney, Smith et al. 1979). The constrained version of the pile-sort attempts to control for individual differences in style; some individuals make finer dis- criminations between items (splitters) than others (lumpers). Burton (1975) pro- posed a method for assigning greater weight to the responses of splitters in an unconstrained sorting task. Because of the strong effect of such style differences, sorting tasks are usually not appropriate for comparisons between informants (Boorman and Arabie 1972; Arabie and Boorman 1973; Boorman and Olivier 1973). Comparisons between informants, rather than items, can be made only with an equal number of piles per informant or with successive pile sorts (Truex 1977; Boster 1986a; see Weller and Romney 1988 for more information on successive sorts).

388 WELLER
Paired-Comparison and Triads Similarity Data
Since similarity data technically concern pairs of items, sets of items can be created and informants asked directly about each pair. The advantage of such a design is that much more information can be collected per informant. With m items there are m(m- 1)/2 pairs or relationships to be estimated. Pile sort similarity data provide only dichotomous information (two values; co-occur = I, do not co-occur = 0) on the m(m-1)/2 pairs for each informant. A direct rating of pairs, say on a nine-point rating scale, theoretically provides a nine-point range of information for each pair for each informant. A triad design offers a measurement range that is equal to the number of times each pair occurs in the design. Thus, a paired- comparison design or a triadic design collects the same type of information as the pile sort, but collects more detail from each informant. The tradeoff is that although more information is collected, the tasks may be somewhat less interesting to informants than doing a pile sort.
In triad designs, items are systematically arranged into sets of three (see Weller and Romney 1988). Usually informants are instructed to pick the most different item in each set, which, in turn, identifies the most similar pair (the two remaining items). Painvise similarity is thus estimated from responses. Picking the most different item is simple and can be done orally. Because of that, it is the method preferred by anthropologists. Psychologists, working in more controlled conditions like classroom data collection, sometimes collect much more detailed information per informant. For example, because a triad of items actually contains three pairs, some have asked informants to identify the most similar pair in each triad and the least similar pair. In that way, all three pairs within each triad are ranked (1 = least, 2 and 3 = most similar). This latter method is much more intensive than the simple, "pick the most different one," and provides much more information per informant, but is not practical for most field applications.
Tasks collecting judged similarity through designs that use subsets of items can collect more detailed information per informant, but the task can be lengthy and cumbersome. With m items there are m(m-1)/2 pairs in any set of items and m!l[3!(m-3)!] triads.
Thus, with 10 items there are 45 pairs and 120 triads; with 21 items there are 2 10 pairs and 1,330 triads. Because the subset designs quickly become cumbersome, there are special designs to limit the number of necessary subsets and still collect similarity judgments on all pairs of items. These are called balanced-incomple~e- block designs and can be found in Burton and Nerlove (1976) or in Weller and Romney (1988). The designs are identified by the number of items to be compared (m), the size of the subsets (2 = pairs, 3 = triads, etc.), and the number of times each pair appears (lambda). A complete triads design with 7 items requires 35 triads, but designs may be created where each pair appears once (creating 7 triads), twice (14 triads), three times (21 triads), four times (28 triads), and five times (35
Structured Interviewing and Questionnaire Construction 389
triads in the complete set). A complete triads design for 21 items contains 1,330 unique sets of 3 items, but only 70 triads are necessary if a design is created where each pair occurs only once. A lambda-one design for 21 items has a large enough number of items to provide interesting results and yet is simple enough to be administered orally in the field.
To create a triad design for a set of items, first enumerate all unique sets of three items. Because the number of triads increases quickly, triads are most useful with two dozen or fewer items. If a balanced-incomplete-blockdesign is to be used to reduce the number of triads, first make sure a solution exists for the number of items that you have (check Weller and Romney 1988). Often an item may need to be added or deleted from the set, since designs exist for only certain size domains. After all triads have been listed, the order of the sets and the order of items within each set must be randomized (see Weller and Romney 1988:33-34). Failure to randomize items can lead to biased selections by informants and might confound results (Romney et al. 1979). Subset designs are created in a systematic way to insure that all pairs are included. The computer program ANTHROPAC (Borgatti 1992) has an option to develop and print the data collection forms for some of the triad designs. Clear instructions should be given and informants should be provided with a few practice sets. When examples are given, they should have obvious answers, they should come from a different domain, and the correct answer in each should be in a different position within the set (first, second, third item).
The triad selections for each individual can be typed into a computer file, and ANTHROPAC will tabulate them into a matrix. The similarity matrix containing the aggregate responses across all informants (whether from pile sorting, triads, or paired-comparisons) can be analyzed to determine the perception or categorizations for the group.
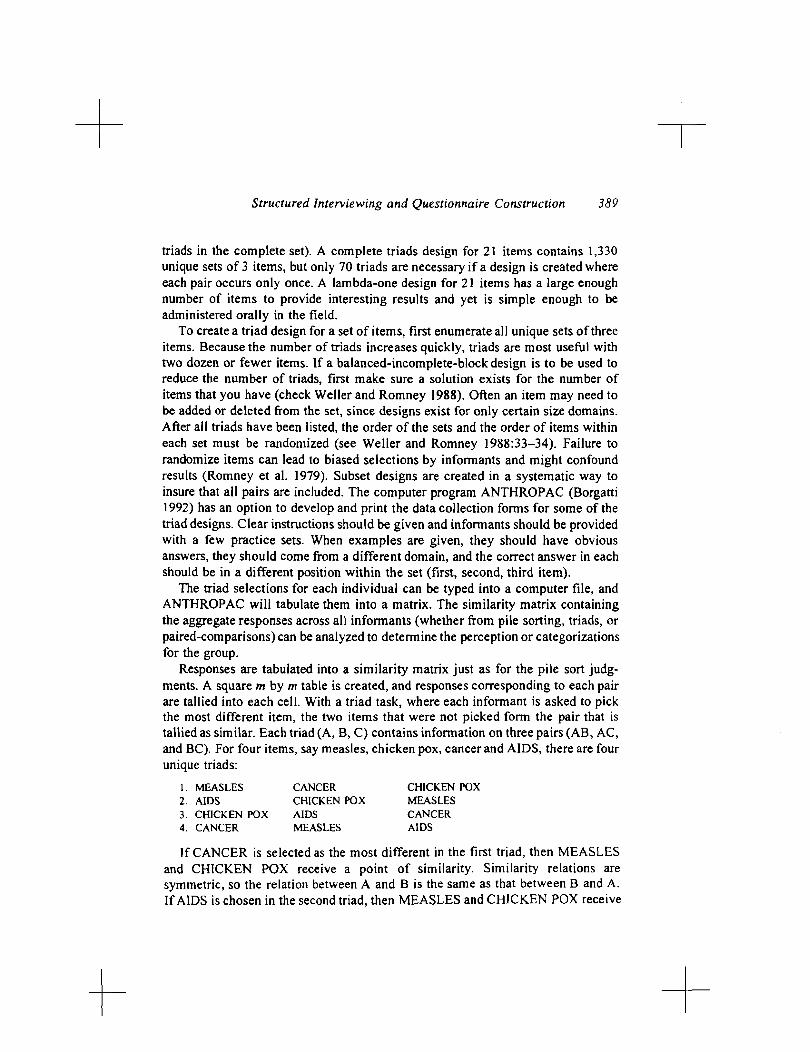
Responses are tabulated into a similarity matrix just as for the pile sort judg- ments. A square rn by m table is created, and responses corresponding to each pair are tallied into each cell. With a triad task, where each informant is asked to pick the most different item, the two items that were not picked form the pair that is tallied as similar. Each triad (A, B, C) contains information on three pairs (AB, AC, and BC). For four items, say measles, chicken pox, cancer and AIDS, there are four unique triads:
1. MEASLES CANCER CHICKEN POX 2. AIDS CHICKEN POX MEASLES 3. CHICKEN POX AIDS CANCER 4. CANCER MEASLES AIDS
If CANCER is selected as the most different in the first triad, then MEASLES and CHICKEN POX receive a point of similarity. Similarity relations are symmetric, so the relation between A and B is the same as that between B and A. If AIDS is chosen in the second triad, then MEASLES and CHICKEN POX receive

390 WELLER
an additional point of similarity. If CHICKEN POX is chosen in the third triad, then AIDS and CANCER receive a point of similarity. If MEASLES is chosen in the last set, then CANCER and AIDS receive an additional point of similarity. Thus, the responses from this one individual can be tabulated into a matrix:
If pairs are rated, the first step is to list all possible pairs of items. Next, the ordering of the pairs and the order of items within each pair is randomized. A rating scale is then created, where the smallest number indicates the least similarity and the largest number indicates the highest similarity. Informants judge the similarity of items in each pair on the rating scales. The rating scale value selected for each pair is tallied into a matrix. An example with the four illness terms from above yields the following pairs:
Measles
Chicken Pox
AIDS
Cancer
Minimum Maximum 1 . CHlCKEN POX-MEASLES 2. CANCER--CHICKEN POX 3. CANCER-MEASLES 4. AIDS-CHICKEN POX 5. CANCER-AIDS 6. AIDSMEASLES
M
2
0
0
If someone responded to these six rating scales selecting 6 for the first pair and 2, 1, 2, 5, and 1 for subsequent pairs, the values would be tabulated into a similarity matrix as:
CP
0
0
A
2
Measles
Chicken Pox
AIDS
Cancer
Ca
CP
2
2
M
6
I
I
A
5
Ca
Structured Interviewing and Questionnaire Construction 391
Applications using triads to collect similarity data include the study of kinship terms (Romney and D'Andrade 1964), animals (Henley 1969), occupations (Burton 1972; Burton and Romney 1975; MagaAaet al. 1995), illness terms (Lieberman and Dressler 1977; Young and Garro 1982; Weller 1983), and personality descriptors (Kirk and Burton 1977; Burton and Kirk 1979). In a recent study, Romney et al. (1997) compared monolingual English- and monolingual and bilingual Japanese- speakers' judgments of 15 emotion terms. Figure 2 shows the similarity between terms and across the two monolingual samples in a spatial representation. Corres- pondence analysis was used to represent the similarity data in two dimensions. The figure may be interpreted as a "map," where closeness in the picture indicates simil- arity. Thus, "disgust," "anger," and "hate" are perceived as similar to one another and different from "sad" or "happy." Differences between the two samples are neg- ligible for 4 terms, small for 8 terms (for example, "disgustlmukatsuku," "hate1 kirai," and "angerlharagatatsu"), and large for 3 terms ("shamelhazukashii," "anxiouslfuan," and "boredltsumaranai "). Rom ney et al. conclude that there is a substantial amount of shared meaning in emotions between the English and Japanese samples.
- -
Figure 2. Correspondence analysis of similarity among Japanese and English emotion terms (adapted from Romney et al. 1997; reprinted with permission, copyright 0 1997, National Academy of Sciences, U.S.A.).
I - -
In a study of societal problems, Wish and Carrol (presented in Kruskal and Wish 1990:36-41) asked 14 individuals to rate 22 societal problems in terms of their similarity. Rating scales were used to collect judged similarity on a1 l 23 1 pairs.
0
- 1
d i p 1 \w tlciremcnl
love
- w w -
- - bond
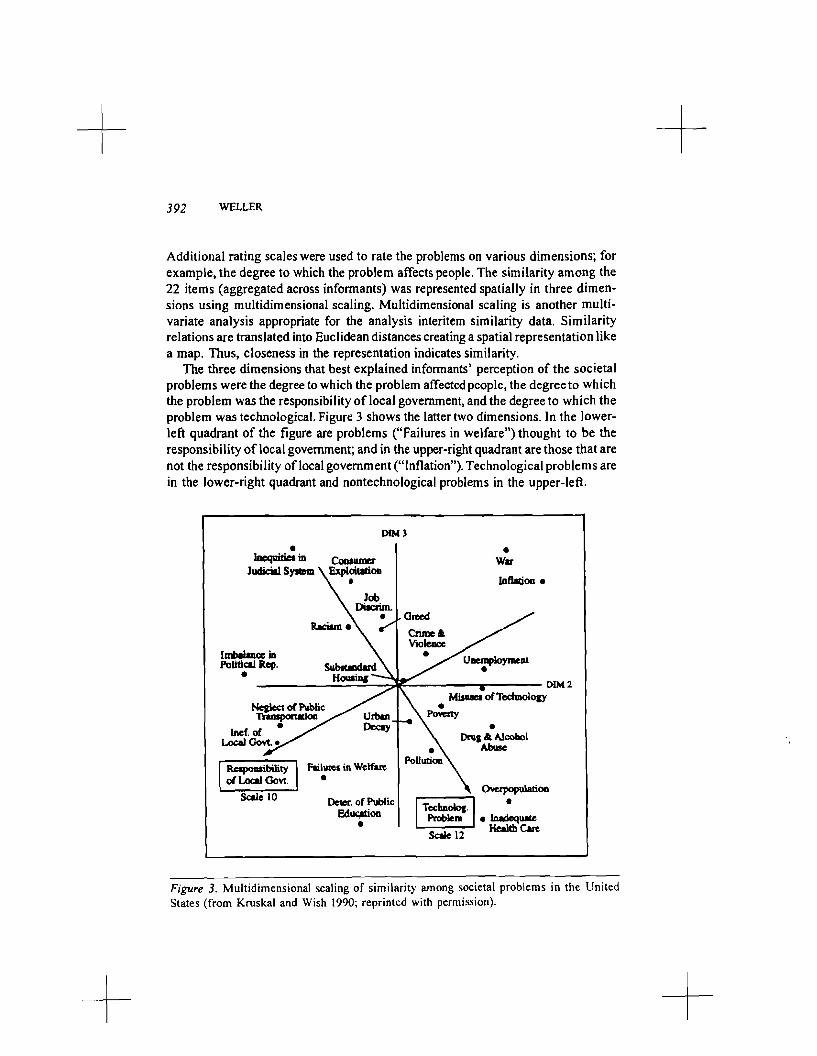
392 WELLER
Additional rating scales were used to rate the problems on various dimensions; for example, the degree to which the problem affects people. The similarity among the 22 items (aggregated across informants) was represented spatially in three dimen- sions using multidimensional scaling. Multidimensional scaling is another multi- variate analysis appropriate for the analysis interitem similarity data. Similarity relations are translated into Euclidean distances creating a spatial representation like a map. Thus, closeness in the representation indicates similarity.
The three dimensions that best explained informants' perception of the societal problems were the degree to which the problem affected people, the degree to which the problem was the responsibility of local government, and the degree to which the problem was technological. Figure 3 shows the latter two dimensions. In the lower- left quadrant of the figure are problems ("Failures in welfare") thought to be the responsibility of local government; and in the upper-right quadrant are those that are not the responsibility of local government ("Inflation"). Technological problems are in the lower-right quadrant and nontechnological problems in the upper-left.
Figure 3. Multidimensional scaling of similarity among societal problems in the United States (from Kruskal and Wish 1990; reprinted with permission).
Structured Interviewing and Questionnaire Construction 393
Sentence-Substitution or Profile Data
As discussed, similarity between items can be collected directly with judgments of similarity (pile sorting, triads, or paired-comparisons), or similarity can be estimated indirectly, between the "profiles" of pairs of items across a series of questions. For example, D'Andrade et al. (1972) asked about the attributes of 50 illness terms by repeating a set of 50 attribute questions for each illness (2,500 questions); then they estimated the similarity between the illnesses from their proportion of shared attributes. This interviewing procedure-the systematic comparison of a set of items with a set of attributes or features-is sometimes called sentence-substitutiondatacollection because the items are systematically substituted into sentence-frames containing the attributes for the interview.
Sentence-substitution interviews begin with two related lists. The first list is the set of domain items and the second list is a set of statements about the domain items. The latter list may include descriptivestaternents, attributes, features, or uses (behaviors) relevant to the domain items. In the interview, each item is paired with every attribute, and informants are asked to judge the acceptability or veracity of the newly formed statement. The task is easy to understand and may be admin- istered orally. For oral administration, a matrix can be used to indicate the inter- section of the two lists (rows as attributes and columns as domain items). For written administration, all statements should be completely written out with correct syntax. Responses areusually dichotomous yes/trueorno/false. Usually, informants' responses are summed into a single item-by-attribute table. Aggregated responses may then be dichotomized so that item-attribute pairs with majority affirmative responses are recoded to "X" (or I) and others are recoded to blanks (or 0).
Similarity among items may be calculated from their shared attributes (or sim- ilarity among attributes can be calculated from their co-occurrence in items). From either, a square symmetric matrix of similarities is obtained. In D'Andrade et al.'s (1972) study of illnesses and illness attributes, the similarity between each pair of illnesses (across attributes) was calculated with a Pearson correlation coefficient. The item-by-item correlation matrix was represented with both multidimensional scaling and hierarchical clustering. Clustering results can be used to interpret the similarity between items and to reorder the rows (items) and columns (attributes) in the aggregate item-by-attribute response table so that the joint item-attribute clusters can be seen.
Stefflre (1972), D'Andrade et al, (1972), Young (1978), and Welleret al. (1987) used hierarchical clustering to reorder the rows and columns of item-by-attribute response tables to aid interpretation. D'Andrade (1976) and Young (1978) also tried to identify attributes that best differentiated illness categories. Weller et al. (1987) and Garro (1986) collected sentence-substitution data, but examined variation between informants. Sentence-substitutions provide rich and valuable information, but the interview can be lengthy. Interviews like Stefflre's (1972) and D'Andrade
394 WELLER
et al.'s (1972) comparison of 50 items and 50 attributes (2,500 questions) were carried out over a few days, and informants were reimbursed for their time.
A more general form of this type of interviewing is systematic collection of information on any two related lists of items to create a profile of information for one set of items based on the second set of items. For example, interviews with members of a small face-to-face social group may ask that each group member "Name the individuals with whom you interact the most," "Name the three people with whom you interact most," or "Rate each member in terms of how much you interacted with them in the last month." Although these three questions vary from unconstrained and constrained dichotomous responses (those named and those not named) to responses for all members (rating or ranking), the information refers to the set of all group members. The two related lists each contain the names of all members: The first list indicates the informant or member interviewed, and the second list indicates that informant's responses, choices, or names of members selected by that informant. Similarity is then calculated between informants, based on their profile of responses or choices. Similarity in their pattern of choices may be calculated with a Pearson correlation coefficient or other measure and represented spatially with multidimensional scaling, correspondenceanalysis, or graph theoretic techniques (Wasserman and Faust 1994).
Reliability and Validity of Similarity Data Representations
Data collection and analysis for the study of classifications include three steps: (1) collecting similarity data; (2) tabulating the data into a single table or matrix for each group; and (3) getting a descriptive model or representation of the similarity relationships. Similarity data may be collected directly with pile sorting, triads, or paired-comparisonsor indirectly from the shared attributes across items. With direct judged similarity, a similarity matrix is created for each individual and then the matrices are summed together. Tabulation of similarity can be done by hand or by computer (Borgatti 1992). With indirect measures of similarity, a matrix of sim- ilarity coefficients (for example, Pearson correlation coefficients) is usually gen- erated by a computer program. Finally, aggregatesimilarity information in the form of a square, symmetric matrix of similarities is represented with a descriptive multivariate technique.
Descriptive statistical analyses used for the representation of similarity data includehierarchicalclustering(Mezzichand Solomon 1980), nonmetric multidimen- sional scaling (Mezzich and Solomon 1980; Kruskal and Wish 1990), and cor- respondence analysis (Weller and Romney 1990). These analyses are available in most major statistical packages. Hierarchical clustering represents the relationships between items in a treelike structure or dendrogram, like a taxonomy and is avail- able in SAS (SAS Institute 1989) and BMDP (Dixon et al. 1990). Although there

Structured Interviewing and Questionnaire Construction 395
are about three dozen different clustering algorithms, some are better than others in accurately representing the structure in data. The most widely available and prob- ably best method is the average-link method, sometimes called UPGMA (Sokal and Sneath 1963). D'Andrade's (1978; and see Buccholtzand Weller [I9851 and Weller and Buccholtz [1986]). U-Statistic, or median-linking method, is also good.
Both nonmetric multidimensional scaling (MDS) and correspondence analysis spatially represent data so that similar items are closer together on a map or plot of items. Correspondence analysis is a sister of principal components, appropriate for scaling qualitativelcategorical data. When using correspondence analysis on similarity data, a large or the largest number must appear down the main diagonal. (The largest possible similarity number plus one may be used.) Correspondence analysis is less sensitive to artifactual effects than MDS and allows for simultaneous scaling of two or more groups of informants. Multidimensional scaling is available in ALSCAL in SAS. Correspondence analysis is in BMDP (Moran et al. 1990), SPSS (SPSS, Inc. 1990), and SAS.
A variety of studies have tested the validity and reliability of using one of these multivariate models to represent similarity data. Simple exercises include submitting a set of interpoint distances (where similarity is the degree of propinquity) for analysis and checking to see if the same information can be retrieved. As men- tioned, although there are many types of hierarchical clustering, the average-link method outperforms others in being able to retrieve known structures (Milligan 1980). Green and Carmone (1970) illustrate MDS's ability to translate such infor- mation into an accurate map with a configuration of points representing the letters "A" and "M"; Kruskal and Wish do so with a map of the United States. Weller and Romney repeat Kruskal and Wish's example and show that correspondenceanalysis also accurately maps the location of cities. Magafia et al. (1981) studied the per- ception of a college campus and compared estimates of distances, triad judgments, and distances from hand-drawn maps and found the MDS representations to accurately reflect true distances.
A more complicated form of validation concerns the degree to which such mod- els accurately represent what people think. Friendly (1 977) used hierarchical cluster- ing and MDS models of free-recall listing and similarity data to successfully predict memory performance tasks. Similarly, Romney et al. (1993) used an MDS model of similarity data to predict list length in a free-recall listing task. Hutchinson and Lockhead (1977) found the MDS model of similarity data predicted reaction time judgments of the same stimuli. Rumelhart and Abrahamson (1973) used an MDS model to predict informants' responses on analogical reasoning tasks.
Most studies have found similarity judgments to be highly reliable. This means that there tends to be little intracultural variation in them. Romney, Smith et al. (1979), in a study of conceptsof success and failure, compared results across several samples and found them to be highly concordant. A check on the internal con- cordance in similarity judgments is an important step in justifying an aggregate

396 WELLER
representation. Similarity between items from direct judged similarity or from shared attributes is usually concordant (compare D'Andrade et al. [1972] and Weller [1983]; and see Young and Garro [1982]). Tversky (1977) proposed that similarity between items is a function of their shared attributes.
Exploration of Specific Beliefs
A series of questions on a single topic may be used to evaluate knowledge, attitudes, or beliefs. In studies of beliefs, however, the purpose is discover the answers and not to measure deviance from a standard. Thus, only original responses are used; they are not transformed or recoded in any way. Studies focusing on beliefs are similar to classification studies, except that classification studies rely on similarity data generally without reference to specific criteria and studies of beliefs may expIore specific criteria. Question formats include: open-ended questions requesting short answers or phrases; questions with predetermined multiple choice response categories (including dichotomous yeslno or truelfalse); requests to order or rank items on a specific topic; and open-ended questions requesting numeric answers (interval estimates, like frequencies, distances, or ages). Typically, responses are summarized by aggregating responses across informants.
Interviews are conducted with a series of statements or questions on the same topic, in the same format, and at the same level of difficulty. As with all interview materials, the items should be relevant to the informants and developed from open- ended interviewing. The actual format of questions is guided by the purpose of the study. If the purpose is to discover detailed beliefs, for example a cultural model of the causes, symptoms, and treatments for an illness, then an appropriate format may be a series of yesfno or truelfalse questions covering all of the potential attributes of the illness (Garro 1986, 1987; Weller et al. 1993).
Alternatively, a project might focus on a single question, "What causes breast cancer?'(Chavez et al. 1995) or "What are the reasons that influence a woman to choose breast or bottlefeeding?" (Weller and Dungy 1986). Here, the set of items would consist of all possible causes of breast cancer or all possible reasons influ- encing the choice of an infant feeding method. Data collection could include either yeslno judgments for each item or the items can be ordered from most to least likely. Or, a researcher may wish to study land ownership (Sankoff 1971) or names of plants (Boster 1985) by asking simple open-ended questions such as, "Who owns this land?" or "What do you call'this?" Finally, if you are interested in numeric information, say cultural beliefs about infant development, you can ask informants the age at which certain behaviors typically occur (Pachter and Dworkin 1997).
Description of beliefs from the responses to a series of questions usually involves some summarization procedure across informants. Intuitively, the best estimate of an answer is provided by the majority response or an average across informants
Structured Interviewing and Questionnaire Construction 397
(D'Andrade 1987). Such measures, called central tendency measures in statistics, provide the best single description of responses to a question. Thus, open-ended or categorical responses are best described by the majority or modal response, and ranked or interval data are best described by the median (midpoint) or mean (average) response.
Aggregate measures, however, are accurate only to the degree that there is little to moderate variability in responses. That is why basic statistical descriptions also report an indicator of the spread or range of values in a variable. If responses are truly heterogeneous, a description based on pooled or aggregate data would be misleading. For example, if 95% of informants say "yes" to a question and 5% say "no," there is a clear cultural preference for "yes." In contrast, if 5 1% say "yes" and 49% say "no," the majority response is "yes," but there is no strong cultural preference for that answer. When responses to a single question are analyzed, a binomial test (or chi-square test) can determine when responses exhibit a strong cultural preference and thus are significantly different from a 5050 split. Since the description ofcultural beliefs-modal beliefs-involvesan aggregation of responses, the first question is whether there is sufficient agreement in responses to identify culturally preferred answers.
The notion of sufficient agreement in responses for a single question can be generalized to a set of questions. Agreement across informants' responses for a series of questions can be assessed with a concordance measure. Anthropologists have often noted that agreement is related to accuracy (Young and Young 1962), and this can be expressed as a general principle of aggregation. The accuracy of a set of aggregated responses is a function of the concordance among the informants and the number of informants (the Spearman-Brown Prophesy Formula described in Weller and Romney 1988). In other words, if the agreement between each pair of informants is measured with a Pearson correlation coefficientand averaged across all pairs of informants, the higher the agreement among informants the fewer informants are necessary to achieve an accurate estimate of the "true" answers. Thus, cultural beliefs can be estimated by pooling the responses of a group of informants to a set of questions (all on the same topic and all in the same format) if there is sufficient agreement among informants. A summarization of responses must include an assessment of the degree of intracultural variation and only when concordance is high can responses be summarized meaningfully.
Cultural Consensus Model
An analytical model that estimates the culturally appropriate answers and the degree to which each informant shares those beliefs is the cultural consensus model (Romney et al. 1986). The model assumes that the ethnographer does not know the answers to the questions, nor how much each informant knows about the domain under consideration. The analysis first determines ifthere are highly shared beliefs

398 WELLER
and, if so, provides an estimate of the answer for each question and an estimate of how much each informant knows the shared beliefs. Open-ended (single word or short phrase) responses, multiple choice, and full-ranklinterval responses can each be accommodated. The model also includes a method for estimating the number of informants needed to provide given levels of confidence in the answers for different levels of shared cultural knowledge. With highly shared beliefs, accurate results can be obtained with few informants.
The analysis focuses on the degree of agreement among informants and begins by assessing the similarity between all pairs of respondents. The proportion of matching responses is calculated for responses that are categorical (open-ended or multiple-choice)(Romney et al. 1986). If responses are dichotomous (yeslno or true/ false categories), similarity can be measured with the match coefficient or covari- ance (Batchelder and Romney 1988). The next step evaluates the degree of homo- geneity or agreement in responses. The matrix of similarity between pairs of informants is factored to solve for individual knowledge or cultural competency levels. The analysis parallelsa principal components of people (with missing values on the main diagonal). Whether or not the solution is a single factor solution is used to determine if there is a single pattern in responses. If the ratio of the first-to- second eigenvalues is greater than three and if the competency values are all between zero and one, inclusive, then the solution is said to fit the model and thus represent homogenous responses.
If responses are sufficiently homogeneous to meet these criteria and thus fit the cultural consensus model, then the cultural knowledge of each individual can be estimated and the estimates are used to weight the responses prior to aggregating. Thus, responses of more knowledgeable informants are weighted more heavily. For categorical response data this is done by adjusting the prior probabilities and calculating a Bayesian posterior probability (confidence level) for each answer.
Applications include the study of illness beliefs and plant naming. Garro (1987) studied Ojibwa beliefs about hypertension with a series of yeslno questions con- cerning various aspects of the condition. Similarly, she asked a series of questions about illnesses and their attributes and compared the beliefs of Tarascan Indian women with those of specialized healers (Garro 1986). Wel ler et al. (1 993) studied the beliefs of Latinos in Connecticut, Texas, Mexico, and Guatemala regarding the folk illness empacho. Pachteret al. (1996) compared the beliefs of Puerto Rican and African American parents with those of health care providers. Open-ended responses of words or short phrases can also be used. Boster (1985, 1986b) walked Jivaro women through a garden and asked them to name specific plants.
The model also extends to rank-order data (Romney et al. 1987). For full-rank or interval-scaled response data, similarity between people is measured with a Pearson correlation coefficient, and the person-by-person correlation matrix is fac- tored to obtain knowledge scores. If a single factor solution is obtained, the
Structured Interviewing and Questionnaire Construction 399
cultural knowledge scores for individuals appear as the first set of factor loadings. The weighting procedure that is used to find the answer key is the simple linear combination of standardized responses weighted by the individual knowledge scores. The solution or answer key is provided as the first set of factor scores and contains a numeric value for each item. Chavez et al. (1995) compared the beliefs of four different groups of Latinas and one group of physicians by having each group of informants rank order 30 potential causes of breast cancer. MagaAa et al. (I 995) compared U.S., Mexican, and Guatemalan perceptions of socioeconomic status and prestige by comparing informants' ordering of occupations. The full- ranklinterval model also accommodates open-ended requests for numerical information.
With high agreement few informants are needed to get stable, accurateestimates of beliefs (Weller and Romney 1988). For dichotomous response data, low levels of cultural sharing (50) with high accuracy (.99 of answers correct) and a high degree of confidence (.95 Bayesian posteriori probability) requires at least 29 informants. For the same accuracy and confidence, but with high cultural sharing (.70), only 10 informants are necessary. Similarly with ranked data, low levels of sharing (.25 average Pearson correlation coefficient between informants) and high accuracy (.95 correlation between the aggregate answers and the true answers) requires a sample size of 28. For the same level of accuracy and higher agreement among informants (.49), 10 informants are necessary. The square root of the average Pearson Correlation coefficient estimates the level of shared cultural knowledge (Weller 1987).
A limitation of the consensus model, as currently formulated, is that it is very silnplistic and cannot handle complex conditions. For example, "I don't know" responses cannot be accommodated. It is assumed that informants will answer every question, and the match coefficient corrects for possible guessing. A more complex model is needed to estimate the individual thresholds for using the "I don't know" option. Also, the match coefficient assumes that there is no response bias in the data. Response bias can have many forms; with field data it may be the simple pattern of respondents to tend to say "yes" to all questions about which they have doubt or conversely to say "no." Thus, analyses based on the match method are sensitive to such bias and accurate only to the degree that they do not contain bias (Wller and Mann 1997).
The covariance method assumes that the investigator can estimate the proportion of positive answers (the proportion of answers that will be "yes"). While this can be estimated, especially since the investigator defines the set of items and creates the interview, the answers are truly unknown to the investigator (hence the purpose of the study) and a very skewed distribution (very few positive answers or very few negative answers) may affect the model's estimates. Thus, use of the covariance method is dependent on the accuracy of the estimate of the proportion of answers

400 WELLER
that are really yeses and a very skewed distribution (very few positive answers or very few negative answers) may affect the model's estimates.
This chapter briefly describes the variety of methods available for conducting inter- views. Choice of an approach varies, depending on the amount of knowledge of the subject matter and the people to be interviewed. Taxonomic interviews are a good beginning point when there is little prior knowledge of the topic and linle experi- ence with appropriate languageor terminology (lexicon). With increasedunderstand- ing of the topic or domain, questions can be formulated that are relevant to the topic and the informants. Interviews with individuals or groups to hrther elaborate the domain may be conducted with listing tasks or case descriptions. Such descriptive interviewing techniques provide understanding of a topic and suggest ideas that can be explored further. Systematic interviewing with questionnaires or specific tasks (such as pile sorts) may then be used to explore ideas and test assertions.
This "bottom-up" approach describes the development of materials from the beginning of a study with unstructured methods followed by structured methods. A "top-down" approach is also valid. One might begin with survey results collected by someone else (a national survey, the census, etc.) and supplement their findings with more detailed open-ended work on the same topic. Kempton et al. (1995) gave the context and rationale for their study of U.S. environmental values by presenting results from national surveys (based on representative samples of the U.S. pop- ulation) on environmental issues. Baer (1996) conducted in-depth interviews with Mexican migrant workers in Florida and explored informants' understandings of U.S. census questions about mental health. Survey results are good at providing a representative picture of what the population may be doing or thinking, but are limited in the depth with which they may explore a topic.
REFERENCES
Arabie, P., and S. A. Boorman. 1973. Multidimensional Scaling of Measures of Distances Between Partitions. Journal ofMathematica1 Psychology 10:148-203.
Baer, R. D. 1996. Health and Mental Health among Mexican American Migrants: Implications for Survey Research. Human Organization 55(1):5846.
Batchelder, W. H., and A. K. Romney. 1988. Test Theory Without an Answer Key. Psychometrika 53:7 1-92.
Bernard, H. R., P. D. Killwonh, and L. Sailer. 1980. Informant Accuracy in Social Network Data IV: A Comparison of Clique-Level Structure in Behavioral and Cognitive Network Data. Social Networks 2: 19 1-2 18.
Structured Interviewing and Questionnaire Construction 401
Bernard, H. R., P. D. Killworth, D. Kronenfeld, and L. Sailer. 1985. On the Validity of Retrospective Data: The Problem of Informant Accuracy. Annual Reviews in Anthro- pology:495-5 17. Palo Alto: Stanford University Press.
Berlin. B. O., D. Breedlove, and P. Raven. 1974. Principles of Tzeltal Plant Classificarion. New York: Academic Press.
Berlin, B. O., and P. D. Kay. 1969. Basic Color Terms. Berkeley: University of California Press.
Boorman, S. A., and P. Arabie. 1972. Structural Measures and the Method of Sorting. In Multidimensional Scaling: Theoty and Applicarions, Vol. 1. R. Shepard et al., eds. Pp. 225-249. New York: Seminar Press.
Boorman. S. A., and D. C. Olivier. 1973. Metrics on Spaces of Finite Trees. Journal of Mathematical Psychology 10:26-59.
Borgatti, S. P. 1992. ANTHROPAC, Version 4.93. Columbia, SC: Analytic Technologies.
Boster, J. S. 1985. Requiem for the Omniscient Informant: There's Life in the Old Girl Yet. In Directions in Cognitive Anthropology. J . Dougherty, ed. Pp. 177-197. Urbana: University of Illinois Press.
Boster, J. S. 1986a. Can Individuals Recapitulate the Evolutionary Development of Color Lexicons? Ethnology 25(1):61-74.
Boster, J. S. 1986b. Exchange of Varieties and Information Between Aquaruna Manioc Cultivators. American Anthropologist 88:428-436.
Brislin, R. W. 1986. The Wording and Translation of Research Instruments. In FieldMethoh in Cross-CulturalResearch. W . J . Lonner and J. W. Berry, eds. Pp. 137-164. Thousand Oaks, CA: Sage Publications.
Buchhola C., and S. C. Weller. 1985. 4M: A Pascal Program for Min, Max, Mean, and Median Hierarchical Clustering. Unpublished software. Philadelphia: University of Pennsylvania.
Burt, R. S. 1984. Network Items and the General Social Survey. Social Networks 6: 293-340.
Burton, M. L. 1972. Semantic Dimensions of Occupation Names. In Multidimensional Scaling: Theoty and Applications in the Behavioral Sciences, Vol. 2. A. K. Romney et al., eds. Pp. 55-77. New York: Seminar Press.
Burton, M. L. 1975. Dissimilarity Measures for Unconstrained Sorting Data. Multivariate Behavioral Research 10:409424.
Burton, M. L., and L. Kirk. 1979. Sex Differences in Maasai Cognition of Personality and Social Identity. American Anthropologist 81:841-873.
Burton, M. L., and S. B. Nerlove. 1976. Balanced Designs for Triads Tests: Two Examples from English. Social Science Research 5:247-267.
Burton, M. L., and A. K. Rornney. 1975. A Multidimensional Representationof Role Terms. American E~hnologisr 2(3):397407.
Chavez, L. R., Hubbell, F. A., McMullin, J. M., Martinez, R. G., and S. I. Mishra. 1995. Structure and Meaning in Models of Breast and Cervical Cancer Risk Factors: A
402 WELLER
Comparison of Perceptions among Latinas, Anglo Women, and Physicians. Medical Anthropology Quarterly 9( 1 ):40-74.
Conklin, H. 1969. Lexicographical Treatment of Folk Taxonomies. In Cognitive Anthropology. Stephen Tyler, ed. Pp. 41-59. New York: Holt, Rinehart and Winston.
D'Andrade, R. G. 1974. Memory and the Assessment of Behavior. In Measurement in the Social Sciences. H. M. Blalock, ed. Pp. 139-186. Chicago: Aldine.
D'Andrade, R. G. 1976. A Propositional Analysis of U.S. American Beliefs about Illness. American Ethnologist 2(3):397-407.
D'Andrade, R. G. 1978. U-Statistic Clustering. Psychometrika 43(1):5947.
D'Andrade, R. G. 1987. Modal Responses and Cultural Expertise. American Behavioral Sciences 31: 194-202.
D'Andrade, R. G., N. Quinn, S. B. Nerlove, and A. K. Romney. 1972. Categories of Disease in American-English and Mexican-Spanish. In Multidimensional Scaling: Theory and Applications in the Behavioral Sciences, Vol. 2. A. K. Romney et al., eds. Pp. 9-54. New York: Seminar Press.
DeWalt, B. R. 1979. Modernization in a Mexican Ejido: A Study in Economic Adaptation. Cambridge: Cambridge University Press.
Dixon, W. J., M. B. Brown, L. Engelman, M. A. Hill. and R. 1. Jennrich, eds. 1990. BMDP. Statistical Sojlware Manual, Vols. I and 2. Los Angeles: University of California Press.
Fillenbaum, S., and A. Rapoport. 1971. Structures in the Subjective Lexicon. New York: Academic Press.
Fink, A. 1995. How to Ask Survey Questions. The Survey Kit, Vol. 2. Thousand Oaks, CA: Sage Publications.
Fowler, F. J. 1993. Survey Research Methods. Applied Social Research Methods Series, Vol. 1. Newbury Park, CA: Sage Publications.
Frake, C. 0 . 1961. The Diagnosis of Disease among the Subanun of Mindanao. American Anthropologist 63(1): 1 13-132.
Freeman, H. E., R. E. Klein, J. Kagan. and C. Yarbrough. 1977. Relations Between Nutrition and Cognition in Rural Guatemala. American Journal ofPublic Health 67:233-239.
Freeman, H. E., A. K. Romney, J. Ferreira-Pinto, R. E. Klein, and T. Smith. 1981. Guatemalan and U.S. Concepts of Success and Failure. Human Organization 40(2): 140-145.
Freeman, L. C., Freeman, S. C., and A. G. Michaelson. 1988. On Human Social Intelligence. Journal of Social and Biological Structures 11 :4 1 5-425.
Freeman, L. C., S. C. Freeman, and A. G. Michaelson. 1989. How Humans See Social Groups: A Test of the Sailer-Gaulin Models. Journal of Quantitative Anthropology 1:229-238.
Freeman, L. C., A. K. Romney, and S. C. Freeman. 1987. Cognitive Structure and Informant Accuracy. American Anthropologisf 89(2):3 10-325.

Structured Interviewing and Questionnaire Construction 403
Friendly M. L. 1977. In Search of the M-Gram: The Structure of Organization in Free-Recall. Cognitive Psychology 9: 188-249.
Garro, L. C. 1986. Intracultural Variation in Folk Medical Knowledge: A Comparison Between Curers and Noncurers. American Anthropologist 88(2):35 1-370.
Garro, L. C. 1987. Explaining High Blood Pressure: Variation in Knowledge about Illness. American Ethnologist 15(1):98-119.
Green, P. E., and F. J. Carmone. 1970. Multidimensional Scaling and Related Techniques in Marketing Analysis. Boston: Allyn and Bacon.
Handwerker, W. P. 1996. Constructing Likert Scales: Testing the Validity and Reliability of Single Measures of Multidimensional Variables. Cultural Anthropology Methods 8(1):1-6,
Haug, M. R. 1977. Measurement in Social Stratification. Annual Reviews in Sociology 3:5 1-77.
Henley, N. M. 1969. A Psychological Study of the Semantics of Animal Terms. Journal of Verbal Learning and Verbal Behavior 8: 176-1 84.
Holmes, T. H., and R. H. Rahe. 1967. The Social Readjustment Rating Scale. Journal of Psychosomatic Research 11:2 13-2 1 8.
Hutchinson, J. W., and G. R. Lockhead. 1977. Similarity as Distance: A Structural Principle for Semantic Memory. Aluman Learning and Memory 6:660-678.
Johnson, J. C. 1990. Selecting Ethnographic 1nformants.Qualitative Research MethodsSeries, Vol. 22, Thousand Oaks, CA: Sage Publications.
Johnson, J. C., and M. L. Miller. 1983. Deviant Social Positions in Small Groups: The Relations Between Role and Individual. Social Network 5:5 1-69.
Johnston, F. E., S. M. Low, Y. deBessa, and R. B. MacVean. 1987. Interaction of Nutrition and Socioeconomic Status as Determinants of Cognitive Development in Disadvantaged Urban Guatemalan Children. American Journal of Physical Anthropology 73:50 1-506.
Kay, M. A. 1977. Health and Illness in a Mexican American Barrio. In Ethnic Medicine in the Southwest. E . H . Spicer, ed. Pp. 99-166. Tuscon: University of Arizona Press.
Kay, P. 1964. A Gunman Scaling Model of Tahitian Consumer Behavior. Southwestern Journal of Anthropology 20: 160-1 67.
Kay, P. 1975. Synchronic Variability and Diachronic Change in Basic Color Terms. Language in Society 4:257-270.
Kempton, W., J. S. Boster, and J. A: Hartley. 1995. Environmental Values in American Culture. Cambridge: MIT Press.
Kirk, L. and M. Burton. 1977. Meaning and Context: A Study in Contextual Shifts in Meaning of Maasai Personality Descriptors. American Ethnologist 4(4):734-761.
Kirk, J., and M. L. Miller. 1978. Cognitions of Coca in Columbia, Ecuador, and Peru. In A Multicultural View of Drug Abuse. D. E . Smith, S. M. Anderson, M. Buxton,
404 WELLER
N. Gottlieb, W. Harvey, and T. Chung, eds. Pp. 132-146. Cambridge: Schenkman Publishing.
Kruskal, J. B., and M. Wish. 1990. Multidimensional Scaling. Quantitative Applications in the Social Sciences Series, Vol. I I . Thousand Oaks, CA: Sage Publications.
Lewis, C. E., J. M. Siegel, and M. A. Lewis. 1984. Feeling Bad: Exploring Sources of Distress Among Pre-Adolescent Children. American Journal of Public Health 74: 117-122.
Lieberman, D., and W. M. Dressler. 1977. Bilingualism and Cognition of St. Lucian Disease Terms. Medical Anthropology 1:81-110.
Loftus, E., and W. Marburger. 1983. Since the Eruption of Mt. St. Helens Did Anyone Beat You Up? lmproving the Accuracy of Retrospective Reports with Landmark Events. Memory and Cognition 11: 1 14-1 20.
MagaAa, J. R., M. Burton, and J. Ferreira-Pinto. 1995. Occupational Names in Three Nations. Journal of Quantitative Anthropology 5: 1 149-1 168.
MagaAa, J. R., G. W. Evans, and A. K. Romney. 1981. Scaling Techniques in the Analysis of Environmental Cognition Data. Professional Geographer 33: 294-3 10.
Meztger, D., and G. Williams. 1963a. Formal Ethnographic Analysis of Tenejapa Ladino Weddings. American Anthropologist 65: 1074-1 101.
Meztger, D., andG. Williams. 1963b. Tenejapa Medicine 1: The Curer. SouthwesternJournal of Anthropology 19:2 16-234.
Meztger, D., and G. Williams. 1966. Some Procedures and Results in the Study of Native Categories: Tzeltal Firewood. American Anthropologist 68:389407.
Mezzich, J . E., and H. Solomon. 1980. Taxonomy and Behavioral Science. London: Academic Press.
Miller, G. A. 1969. A Psychological Method to Investigate Verbal Concepts. Journal of Mathematical Psychology 6: 169-1 9 1.
Miller, M. L., and E. Hutchins. 1989. On the Acquisition of Boardsailing Skill. In The Content of Culture: Constants and Variants. Studies in Honor of John M. Roberts. R. Bolton, ed. Pp. 153-170. New Haven: HRAF Press.
Miller, M. L., and J. C. Johnson. 1981. Hard Work and Competition in an Alaskan Fishery. Human Organization 40(2): 13 1-1 39.
Milligan, G. W. 1980. An Examination of the Effect of Six Types of Error Perturbation of Fifteen Clustering Algorithms. Psychometrika 45:325-342.
Moore, R., M. L. Miller, P. Weinstein, S. F. Dworkin, and H. Liou. 1986. Cultural Percep- tions of Pain and Pain Coping among Patients and Dentists. Communify Dental Oral Epidemiology 14:327-333.
Moran, A,, L. Engelman, E. Stephen, and G. FitzGerald. 1990. Correspondence Analysis. Ln BMDP, S~atisfical Sofrware Manual, Vols. I and 2. W. J. Dixon, M. B. Brown, L. Engelman, M. A. Hill, and R. I. Jennrich, eds. Los Angeles: University of California Press.
Nunnally, J. C. 1978. Psychometric Theory. New York: McGraw-Hill
Structured Interviewing and Questionnaire Construction 405
Pachter, L. M., and P. H. Dworkin. 1997. Maternal Expectations about Normal Child Devel- opment in Four Cultural Groups. Archives of Pediatrics and Adolescent Medicine I5I:I 144-1 150.
Pachter, L. M., S. Niego, and P. J. Pelto. 1996. Differences and Similarities Between Health Care Providers and Parents Regarding Symptom Lists for Childhood Respiratory Illnesses. Ambulatory Child Health 1: 196-204.
Quinn, N. 1987. Convergent Evidence for a Cultural Model of American Marriage. In Cultural Models in Language and Thought. D. Holland and N. Quinn, eds. Pp. 173-1 92. Cambridge: Cambridge University Press.
Roberts, J. M., and G. E. Chick. 1979. Butler County Eight Ball: A Behavioral Space Analysis. In Sports, Games, and Play: Social and Psychological Viewpoints. J. H. Goldstein, ed. Pp. 65-99. Hillsdale, NJ: Lawrence Erlbaum.
Roberts, J. M., G. E. Chick, M. Stephanson, and L. L. Hyde. 1981. Inferred Categories for Tennis Play: A Limited Semantic Analysis. In Play as Context. A. B. Cheska, ed. Pp. 181-195. West Point, NY: Leisure Press.
Roberts, J. M., T. V. Golder, and G. E. Chick. 1980. Judgment, Oversight and Skill: A Cultural Analysis of P-3 Pilot Error. Human Organization 39(1):5-2 1.
Roberts, J. M., and S. H. Nattrass. 1980. Women and Trapshooting: Competence and Expression in a Game of Skill with Chance. In Play and Culture. H. B. Schwartman, ed. Pp. 262-291. West Point, NY: Leisure Press.
Romney, A. K., W. H. Batchelder, and S. C. Weller. 1987. Recent Applications of Consensus Theory. American Behavioral Scientist 31: 163-1 77.
Romney, A. K., D. D. Brewer, and W. H. Batchelder. 1993. Predicting Clustering from Semantic Structure. Psychological Science 4:28-34.
Romney, A. K., and R. G. D'Andrade. 1964. Cognitive Aspects of English Kin Terms. American Anthropologist 66(3): 146-1 70.
Romney, A. K., M. Keiffer, and R. E. Klein. 1979. A Normalization Procedure for Correcting Biased Response Data. Social Science Research 2:307-320.
Romney, A. K., C. C. Moore, and C. D. Rusch. 1997. Cultural Universals: Measuring the Semantic Structure of Emotion Terms in English and Japanese. Proceeedings ofthe National Academy of Science USA, 945489-5494.
Romney, A. K., T. Smith, H. E. Freeman, J. Kagan, and R. E. Klein. 1979. Concepts of Success and Failure. Social Science Research 8:302-326.
Romney, A. K., S. C. Weller, and W. H. Batchelder. 1986. Culture as Consensus: A Theory of Cultural and Informant Accuracy. American Anthropologist 88(2): 3 13-338.
Ruebush, 11, T. K., S. C. Weller, and R. E. Klein. 1992. Knowledge and Beliefs about Malaria on the Pacific Coastal Plain of Guatemala. American Journal of Tropical Medicine and Hygiene 46:45 1459.
Rumelhart, D. E., and A. A. Abrahamson. 1973. A Model for Analogical Reasoning. Cognitive Psychology 5: 1-28.


406 WELLER
Sankoff, G. 1971. Quantitative Analysis of Sharing and Variability in a Cognitive Model. Ethnology 10:389-408.
SAS Institute, Inc. 1989. SAYSTAT User's Guide, Version 6,4th ed., Vol 1. Cary, NC: SAS Institute.
Sokal, R., and P. Sneath. 1963. Principles of Numerical Taxonomy. San Francisco: W. H. Freeman.
Spradley, J. P. 1970. You Owe Yourself a Drunk. Boston: Little Brown.
Spradley, J. P. 1979. The Ethnographic Interview. New York: Holt, Rinehart and Winston.
SPSS, Inc. 1990. SPSS-PC. Chicago: SPSS, Inc.
Stefflre, V. J. 1972. Some Applications of Multidimensional Scaling to Social Science Problems. In Multidimensional Scaling: Theory and Applications in the Behavioral Sciences, Vol. 2. A. K. Romney et al., eds. Pp. 21 1-243. New York: Academic Press.
Stone, L. and J. G. Cambell. 1984. The Use and Misuse of Surveys in International Development: An Experiment from Nepal. Human Organization 43:27-37.
Sudman, S., and N. M. Bradburn. 1982. Asking Questions. San Francisco: Jossey-Bass.
Trotter, 11, R., S. C. Weller, R. D. Baer, L. M. Pachter, M. Glazer, J. E. Garcia de Alba Garcia. 1998. Consensus Theory Model of AIDSISIDA Beliefs in Four Latino Populations. Manuscript under review.
Truex, G. F. 1977. Measurement of Intersubject Variations in Categorizations. Journal of Cross-Cultural Psychology 8(1):7 1-82.
Tversky, A. 1977. Features of Similarity. Psychological Review 84:327-352.
Wasserman, S. and K. Faust. 1994. Social Network Analysis. Cambridge: Cambridge University Press.
Weller, S. C. 1983. New Data on Intra-Cultural Variation: The Hot-Cold Concept. Human Organization 42:249-257.
Weller, S. C. 1984. Cross-Cultural Concepts of Illness: Variation and Validation. American Anthropologist 86:34 1-35 I.
Weller, S. C. 1987. Shared Knowledge, Intercultural Variation and Knowledge Aggregation. American Behavioral Scientist 31(2): 178-1 93.
Weller, S. C., and C. H. Buchholtz. 1986. When Single Clustering Creates More than One Tree: A Reanalysis of the Salish Languages. American Anthropologist 88(3): 667474.
Weller, S. C., and C. I. Dungy. 1986. Personal Preferences and Ethnic Variations among Anglo and Hispanic Breast and Bottle Feeders. Social Science and Medicine 23(6): 539-548.
Weller, S. C., and N. C. Mann. 1997. Assessing Rater Performance Without a "Gold Standard" Using Consensus Theory. Medical Decision Making 17:71-79.
Weller, S. C., L. M. Pachter, R. T. Trotter, 11, and R. D. Baer. 1993. Empacho in Four Latino Groups: A Study of Intra- and Inter-Cultural Variation in Beliefs. Medical Anthropology 15: 109- 136.
Structured Interviewing and Questionnaire Consnuction 407
Weller, S. C., and A. K. Rornney. 1988. Systematic Data Collection. Qualitative Research Methods Series, Vol. 10. Thousand Oaks, CA: Sage Publications.
Weller, S. C., and A. K. Rornney. 1990. Metric Scaling: CorrespondenceAnalysis. Quantita- tive Applications in the Social Sciences Series, Vol. 75. Thousand Oaks, CA: Sage Publications.
Weller, S. C., A. K. Romney, and D. P. Orr. 1987. The Myth of a Sub-culture of Corporal Punishment. Human Organization 46: 39-47.
Weller, S. C., T. R. Ruebush, 11, and R. E. Klein. 1997. Predicting Treatment-Seeking Behavior in Guatemala: A Comparison of the Health Services Research and Decision- Theoretic Approaches. Medical Anthropology Quarterly 11:224-245.
Young, F. W. and R. C. Young. 1962. Key Informant Reliability in Rural Mexican Villages. Human Organization 20: 14 1-1 48.
Young. J. C. 1978. Illness Categories and Action Strategies in a Tarascan Town. American Ethnologist 5% 1-97.
Young, J. C. 1980. A Model of Illness Treatment Decisions in a Tarascan Town. American Ethnologist 7(1): 106-13 1 .
Young, J. C. and L. Y. Garro. 1982. Variation in the Choice of Treatment in Two Mexican Communities. Social Science and Medicine 16: 1453-1 465.