Embed Size (px)
Citation preview
STRUCTURES AND STABILITY OF CLUSTERS AND
NANOWIRES OF GOLD AND OTHER TRANSITION METALS
A THESIS
Submitted to the FACULTY OF SCIENCE
PANJAB UNIVERSITY, CHANDIGARH For the degree of
DOCTOR OF PHILOSOPHY
2014
PRIYANKA
CENTRE OF ADVANCED STUDY IN PHYSICS PANJAB UNIVERSITY, CHANDIGARH
INDIA

Dedicated To
Gunbir And Seerat
Contents
Sr. No.
Title Page No.
Acknowledgements……………………………………………………… i, ii Abstract………………………………………………………………….. iii, iv List of Figures…………………………………………………………… v-vii List of Tables……………………………………………………………. viii Chapter 1 1. Introduction……………………………………………………………… 1 1.1 A brief note on nanoparticles…………………………………. 1 1.2 Why Gold ??? Historical background and applications……... 2 1.3 Relativistic effects in Gold……………………………………. 6 1.4 Structure of Gold……………………………………………… 7 1.4.1 Magic geometries and magic clusters numbers………. 8 1.4.2 Gold magic clusters…………………………………… 9 1.5 Pure Gold Clusters……………………………………………. 11 1.6 Doped Gold Clusters………………………………………….. 16 1.7 Gold Nanotube and Nanowires ………………………………. 18 1.8 Work done and its scope……………………………………… 19 1.9 Broad outline of the Thesis…………………………………… 20 Bibliography……………………………………………………………. 22 Chapter 2 2. Computational Methodology…………………………………………… 29 2.1 Introduction ………………………………………………….. 29 2.2 Gupta Potential – The Semi Empirical approach ……………. 30 2.2.1 Gupta Potential ………………………………………. 31 2.3 First Principle or Ab-initio methods ………………………… 32 2.3.1 Hartree Fock Method…………………………………. 33 2.3.2 Density Functional Theory (DFT) …………………... 34 2.4 Basis Function……………………………………………. 37 2.4.1 Linearized Augmented Plane Wave (LAPW)………. 37 2.4.2 Plane Wave method (PW) ………………………….. 37 2.4.3 Localized basis sets ………………………………….. 38 2.5 Pseudopotential………………………………………………. 39 2.6 Computational Details………………………………………… 42 2.6.1 SIESTA Code ……………………………………….. 43 2.6.2 VASP Code………………………………………….. 44 2.7 Geometric Optimization ……………………………….. 44 2.7.1 Conjugate Gradient Technique(CG) …………………. 45 2.8 Discussion and Conclusion ……………………………….. 45 Bibliography…………………………………………………………….. 46 Chapter 3 3. Small Gold Clusters (Aun, n= 1- 14) …………………………………… 48 3.1 Introduction………………………………………………. 48 3.2 Methodology……………………………………………… 49 3.2.1 The Gupta Potential(GP) ……………………………. 49 3.2.2 Density Functional Theory(DFT) …………………… 50 3.3 Results and Discussions………………………………………… 51 3.3.1 Structure of Au3-14 clusters…………………………... 51
3.3.2 Energetics……………………………………………. 56 3.4 Electronic Properties……………………………………………. 58 3.4.1 HOMO-LUMO gap……………………………………. 58 3.4.2 Ionisation Potential and Electron Affinity…………….. 60 3.4.3 Chemical Hardness……………………………………. 61 3.5 Conclusion……………………………………………………… 61 Bibliography……………………………………………………………. 62 Chapter 4 4. Doping of gold clusters with Si and Ge atoms…………………………. 64 4.1 Introduction……………………………………………….. 64 4.2 Computational Details…………………………………….. 65 4.3 Results and Discussions ………………………………………… 66 4.3.1 Aun+1 clusters………………………………………….. 67 4.3.2 AunSi clusters…………………………………………. 67 4.3.3 Energetics……………………………………………… 72 4.4 Electronic properties…………………………………………… 76 4.4.1 HOMO-LUMO gap……………………………………. 76 4.4.2 Ionisation Potential and Electron Affinity…………….. 78 4.4.3 Chemical Hardness…………………………………….. 78 4.4.4 Mulliken Charge Analysis…………………………….. 79 4.5 Germanium doped Gold clusters, AunGe (n =1 -10)…………. 80 4.5.1 Structure of AunGe …………………………………… 80 4.5.2 Energetics……………………………………………… 81 4.5.3 Electronic Properties………………………………….. 83 4.6 Conclusion……………………………………………………… 84 Bibliography……………………………………………………………. 86 Chapter 5 5. Doped Golden Fullerenes……………………………………………….. 89 5.1 Introduction…………………………………………………….. 89 5.2 Computational Details…………………………………………... 90 5.3 Results and Discussions………………………………………… 90 5.3.1 Structure and Energetics of M12@Au20……………….. 90 5.4 Electronic Properties…………………………………………….. 92 5.5 Conclusion………………………………………………………. 94 Bibliography……………………………………………………………. 95 Chapter 6 6. The Structural and Electronic Properties of Doped Tubular Gold Cages.. 96 6.1 Introduction……………………………………………………... 96 6.2 Computational Details………………………………………….. 97 6.3 Results and Discussions……………………………………….. 98 6.3.1 Structure of M@Au24 (M = Cu, Ag) ………………….. 98 6.3.2 Energetics……………………………………………… 100 6.4 Electronic Properties…………………………………………… 101 6.4.1 HOMO-LUMO gap……………………………………. 101 6.4.2 Mulliken Charge Analysis…………………………….. 102 6.5 Conclusion……………………………………………………… 102 Bibliography…………………………………………………………… 104 Chapter 7 7. Tubular Gold Clusters with Spinal Support……………………………. 106 7.1 Introduction…………………………………………………….. 106
7.2 Computational Details………………………………………….. 108 7.3 Results and Discussions………………………………………… 109 7.3.1 Pure AuN (N= 24, 42 and 60) cages …………………. 109 7.3.2 Doped AuN cages (XMAuN, X = Si, Al and Au)……… 110 7.3.3 Energetics……………………………………………… 113 7.4 Electronic properties……………………………………………. 115 7.4.1 HOMO-LUMO gap……………………………………. 115 7.4.2 Mulliken Charge Analysis…………………………….. 116 7.5 Conclusion……………………………………………………… 116 Bibliography……………………………………………………………. 118 Chapter 8 8. Gold Monoatomic Chains………………………………………………. 120 8.1 Introduction……………………………………………………… 120 8.2 Computational Details…………………………………………… 121 8.3 Results and Discussion………………………………………….. 122 8.3.1 Energy vs Length of chain………………………………. 123 8.3.2 Force vs Length of chain ………………………………… 124 8.3.3 Modulus vs Length of chain……………………………… 124 8.4 Conclusion……………………………………………………….. 125 Bibliography……………………………………………………………. 126 Chapter 9 9. Phonon Dispersion Of Gold Nanotube………………………………….. 127 9.1 Introduction ……………………………………………………… 127 9.2 Methodology…………………………………………………….. 129 9.2.1 Dynamics of a sheet of Au atoms……………………… 131 9.2.2 Cell at origin and neighboring cells……………………. 131 9.2.3 Evaluation of the force constants………………………. 132 9.2.4 Evalution of Dynamical Matrix ……………………….. 136 9.3 Conclusion………………………………………………………. 138 Bibliography……………………………………………………………. 139 Chapter 10 10. Summary and Conclusions……………………………………………… 140 List of Publications ……………………………………………………... Papers presented and Conferences attended …………………………….

i
Acknowledgements
I would like to express my sincere gratitude and thanks to my esteemed
supervisor, Prof. Keya Dharamvir. Her wide knowledge and logical way
of thinking have been of great value for me. Her understanding,
encouraging and personal guidance has provided a good basis for the
present thesis. She is an excellent example of a successful woman
physicist and professor.
A special thanks and a grateful acknowledgement goes to Dr. Hitesh
Sharma, who has guided during my initial years of my Ph.D. He has
encouraged me and suggested new ideas regarding my work.
I am thankful to the Chairman, Department of Physics, Panjab University
for providing adequate facilities to work in the department. I would like
to thank my lab-mates for their unending support through whole of my
research period. A special thanks to Isha who has helped in learning of
the code. I am heartily thankful to my seniors Shuchi Di, Narinder Di,
Veena Mam, Dr Ali and Shobhna Mam for their constant guidance and
support. I’m grateful to Seema, Pooja for their immense help in learning
the code. I’m also thankful to Sumali and Seema Gautam for their
cooperation and healthy discussions. A special thanks to Kiran,
Gagandeep, Vaishali, Vaneetha, Kulwinder, and Anjali for providing with
supportive and cooperative environment in lab. I’m also thankful to my
friends Neelu, Jaspreet, Reema, Amarjot for their cheerful presence in my
life.
I’m grateful to my Mother in law for unconditional support and love she
has given me and my children. Without her encouragement and support I
wouldn’t have been able to complete this whole work efficiently. I’m
thankful to her and my Father in law for taking care of my kids in my

ii
absence. Especial thanks to my sister in law Ramandeep, who has always
been supportive and encouraging.
I’m lucky to have a loving and supportive life-partner, Sarbjeet Singh. He
has always been source of inspiration and strength of my life. He has
always encouraged me to chase my dreams and without his persuasion,
this work would not have been completed. It brings a smile on my face to
mention the names of two little angels Gunbir and Seerat who have
changed my life and made me a stronger person. Their innocent faces
love and trust on me has always encouraged me during my low times to
get up and fight back. Their smile always brings a boost of positive
energy in me.
My deepest gratitude goes to my parents for their love and support
throughout my life. This dissertation was simply impossible without them.
I am indebted to my father and mother for their understanding and
unconditional love. They have always supported me in every way and
whatever I chose in my life. My father has a never die attitude towards
life from which I have learnt a lot and it always helped me to achieve my
goals. My mother has always prayed for me more than anyone else. My
brother, Vineet in his own way, have always motivated me and supported
me throughout this work. Also my cousin sister, Shuchi deserves special
thanks for her ways to make me smile. My father has always wanted me
to do Ph.D., by submitting this thesis I hope to fulfill his dream.
At the end, I’m thankful to God for providing me the strength to complete
this work and fulfill my dream. I dedicate this thesis to my loving and
caring family.
Priyanka
iii
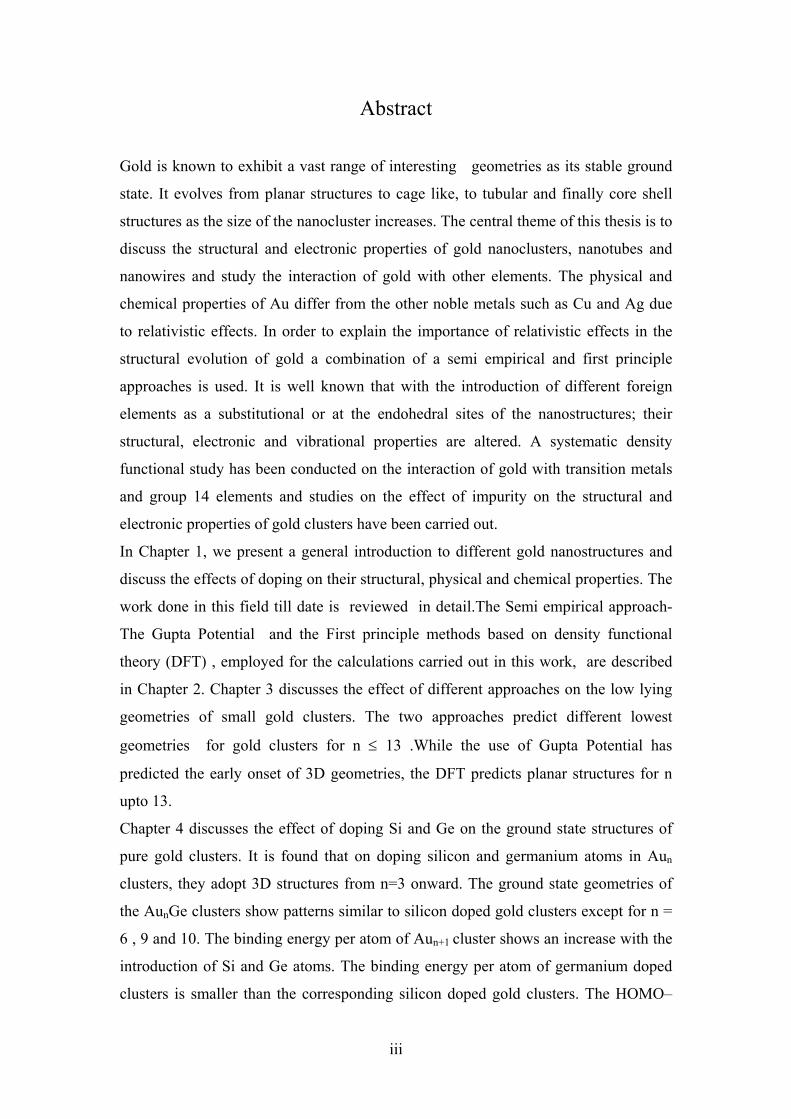
Abstract Gold is known to exhibit a vast range of interesting geometries as its stable ground
state. It evolves from planar structures to cage like, to tubular and finally core shell
structures as the size of the nanocluster increases. The central theme of this thesis is to
discuss the structural and electronic properties of gold nanoclusters, nanotubes and
nanowires and study the interaction of gold with other elements. The physical and
chemical properties of Au differ from the other noble metals such as Cu and Ag due
to relativistic effects. In order to explain the importance of relativistic effects in the
structural evolution of gold a combination of a semi empirical and first principle
approaches is used. It is well known that with the introduction of different foreign
elements as a substitutional or at the endohedral sites of the nanostructures; their
structural, electronic and vibrational properties are altered. A systematic density
functional study has been conducted on the interaction of gold with transition metals
and group 14 elements and studies on the effect of impurity on the structural and
electronic properties of gold clusters have been carried out.
In Chapter 1, we present a general introduction to different gold nanostructures and
discuss the effects of doping on their structural, physical and chemical properties. The
work done in this field till date is reviewed in detail.The Semi empirical approach-
The Gupta Potential and the First principle methods based on density functional
theory (DFT) , employed for the calculations carried out in this work, are described
in Chapter 2. Chapter 3 discusses the effect of different approaches on the low lying
geometries of small gold clusters. The two approaches predict different lowest
geometries for gold clusters for n ≤ 13 .While the use of Gupta Potential has
predicted the early onset of 3D geometries, the DFT predicts planar structures for n
upto 13.
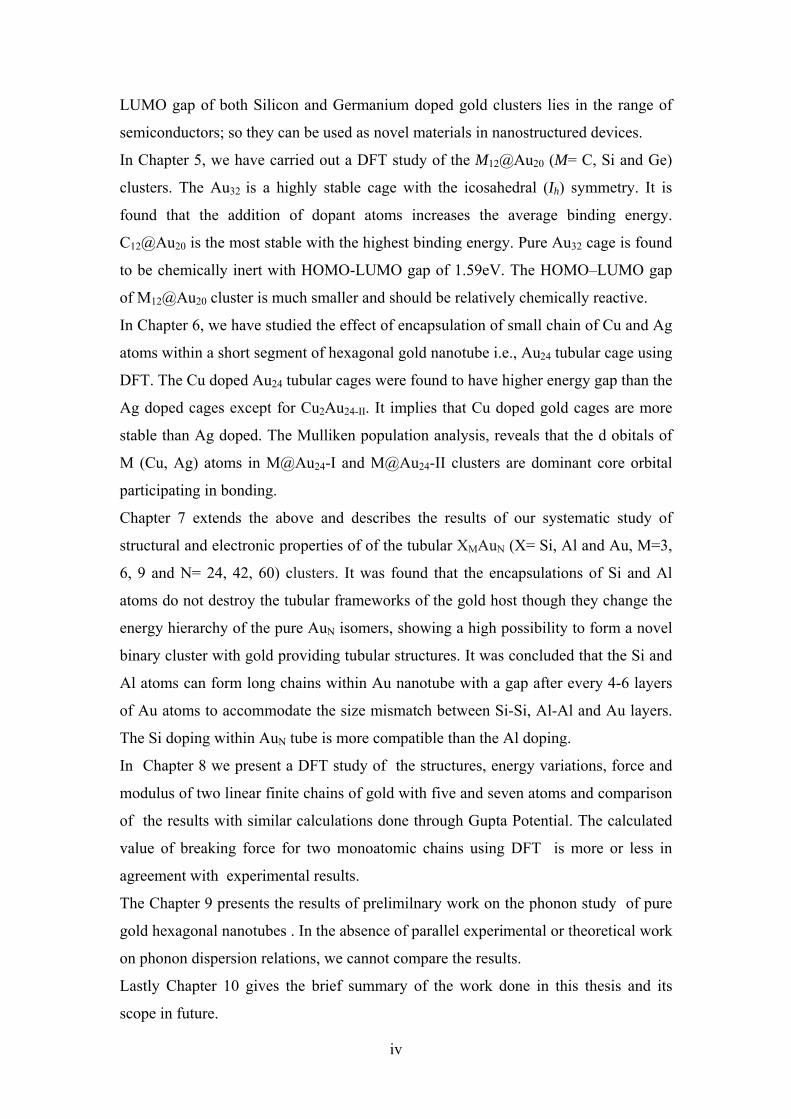
Chapter 4 discusses the effect of doping Si and Ge on the ground state structures of
pure gold clusters. It is found that on doping silicon and germanium atoms in Aun
clusters, they adopt 3D structures from n=3 onward. The ground state geometries of
the AunGe clusters show patterns similar to silicon doped gold clusters except for n =
6 , 9 and 10. The binding energy per atom of Aun+1 cluster shows an increase with the
introduction of Si and Ge atoms. The binding energy per atom of germanium doped
clusters is smaller than the corresponding silicon doped gold clusters. The HOMO–
iv
LUMO gap of both Silicon and Germanium doped gold clusters lies in the range of
semiconductors; so they can be used as novel materials in nanostructured devices.
In Chapter 5, we have carried out a DFT study of the M12@Au20 (M= C, Si and Ge)
clusters. The Au32 is a highly stable cage with the icosahedral (Ih) symmetry. It is
found that the addition of dopant atoms increases the average binding energy.
C12@Au20 is the most stable with the highest binding energy. Pure Au32 cage is found
to be chemically inert with HOMO-LUMO gap of 1.59eV. The HOMO–LUMO gap
of M12@Au20 cluster is much smaller and should be relatively chemically reactive.
In Chapter 6, we have studied the effect of encapsulation of small chain of Cu and Ag
atoms within a short segment of hexagonal gold nanotube i.e., Au24 tubular cage using
DFT. The Cu doped Au24 tubular cages were found to have higher energy gap than the
Ag doped cages except for Cu2Au24-II. It implies that Cu doped gold cages are more
stable than Ag doped. The Mulliken population analysis, reveals that the d obitals of
M (Cu, Ag) atoms in M@Au24-I and M@Au24-II clusters are dominant core orbital
participating in bonding.
Chapter 7 extends the above and describes the results of our systematic study of
structural and electronic properties of of the tubular XMAuN (X= Si, Al and Au, M=3,
6, 9 and N= 24, 42, 60) clusters. It was found that the encapsulations of Si and Al
atoms do not destroy the tubular frameworks of the gold host though they change the
energy hierarchy of the pure AuN isomers, showing a high possibility to form a novel
binary cluster with gold providing tubular structures. It was concluded that the Si and
Al atoms can form long chains within Au nanotube with a gap after every 4-6 layers
of Au atoms to accommodate the size mismatch between Si-Si, Al-Al and Au layers.
The Si doping within AuN tube is more compatible than the Al doping.
In Chapter 8 we present a DFT study of the structures, energy variations, force and
modulus of two linear finite chains of gold with five and seven atoms and comparison
of the results with similar calculations done through Gupta Potential. The calculated
value of breaking force for two monoatomic chains using DFT is more or less in
agreement with experimental results.
The Chapter 9 presents the results of prelimilnary work on the phonon study of pure
gold hexagonal nanotubes . In the absence of parallel experimental or theoretical work
on phonon dispersion relations, we cannot compare the results.
Lastly Chapter 10 gives the brief summary of the work done in this thesis and its
scope in future.
v
List of Figures
Figure No Title Page No. Figure1.1 Image of the Lycurgus cup, probably made in Rome in
fourth century (from the British Museum free image
service) (a): light falling from outside. (b): light falling
from inside.
3
Figure1.2 TEM images (a) square planar and (b) hexagonal
arrangements of Au55 clusters, generated on PEI (poly
ethyleneimine) and PPE (poly p-phenylene ethynylenes)
films respectively
5
Figure1.3 Few high-symmetry clusters having the geometric shells
completed with the magic numbers: 147-atom icosahedron,
147-atom cuboctahedron, 116-atom truncated octahedron,
146-atom octahedron,
9
Figure 1.4 Energy levels in the jellium model 10
Figure 1.5 The tetrahedron (Td) ground-state of gold Au20 cluster. 10
Figure 1.6 The tetrahedron of 20 gold atoms. Image credit: University
of Birmingham
14
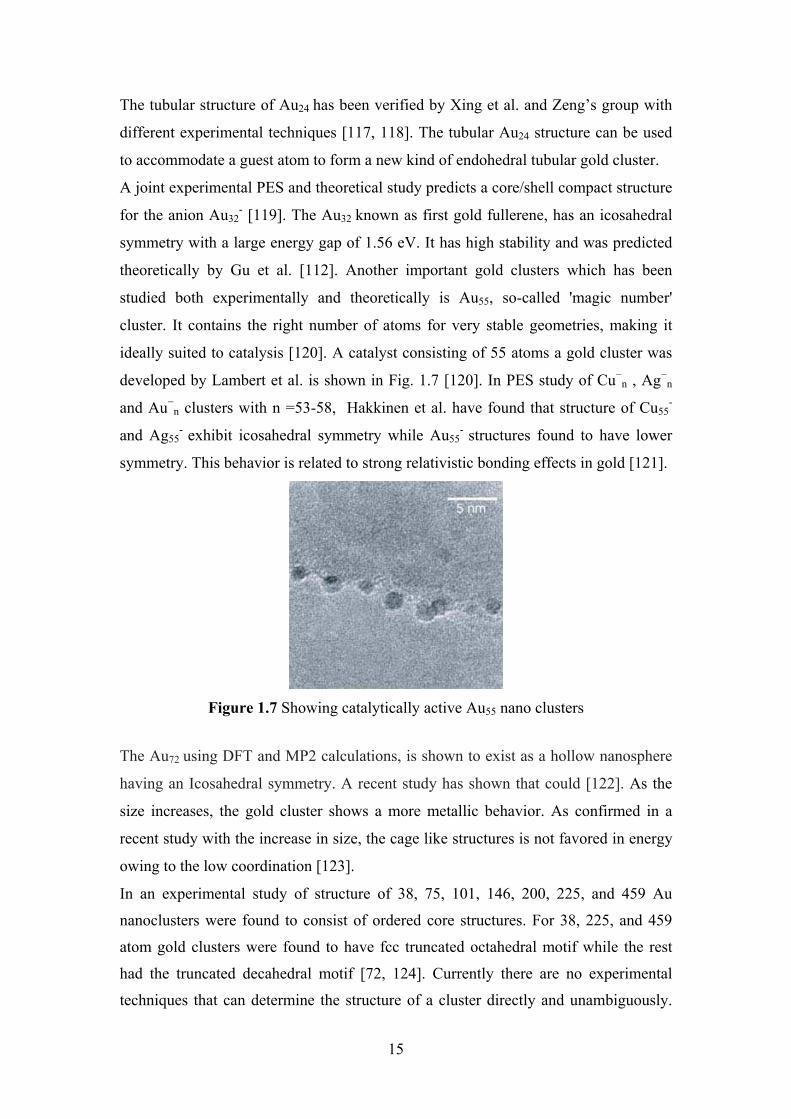
Figure 1.7 Showing catalytically active Au55 nano clusters 15
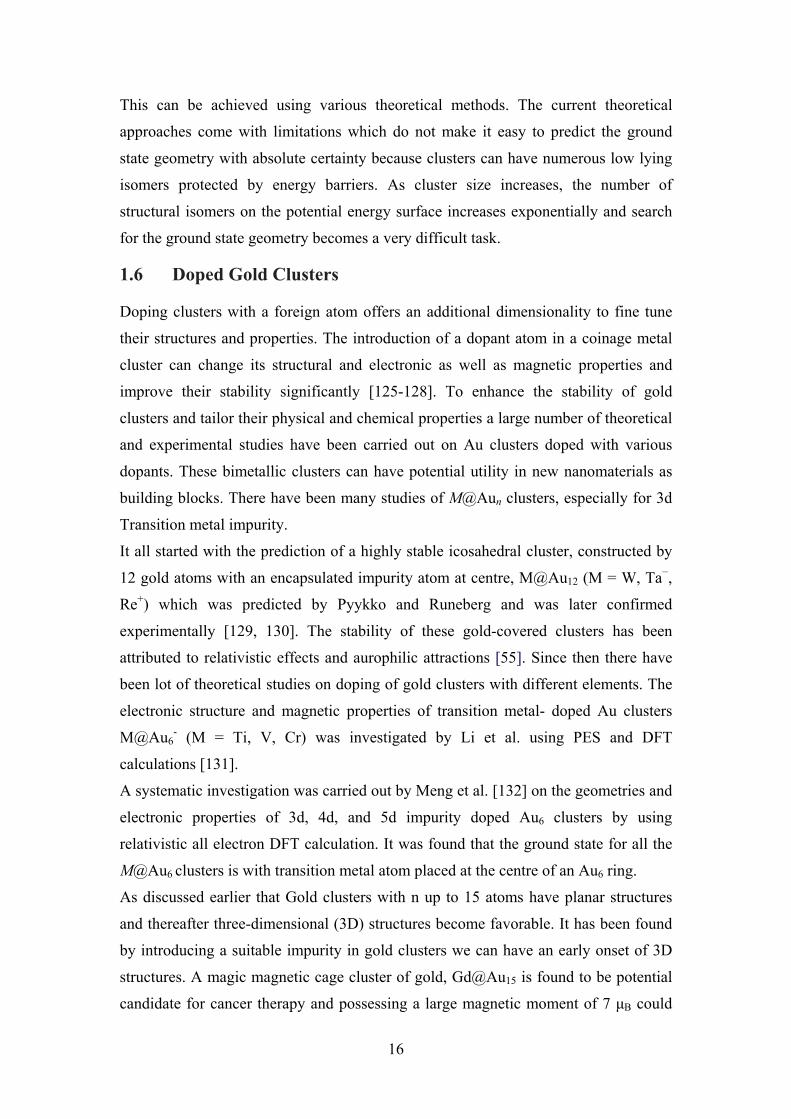
Figure 1.8 The gold SWNTs obtained by cylindrical folding of the 2D
triangular lattice. The tube circumference is |C|, and radius
R = (n2 + m2
-nm)1/2
/ |a12|, where n of tube are the helical
strands and m defines the chirality.
18
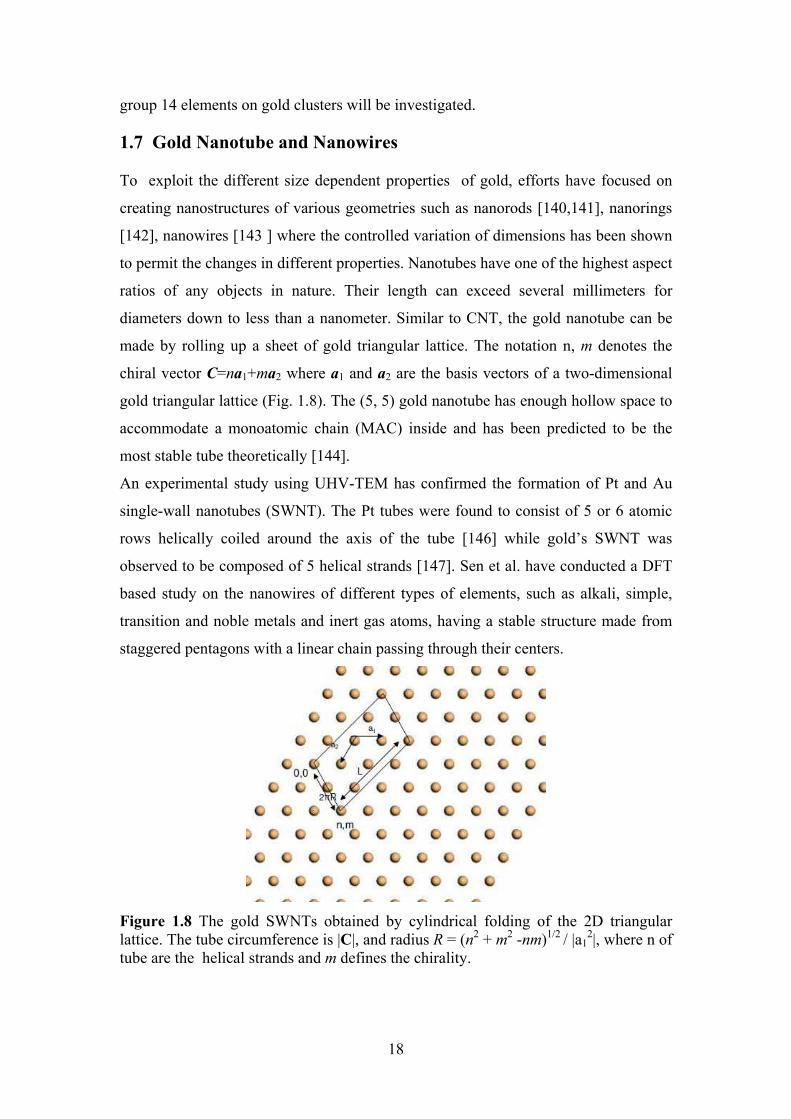
Figure 1.9 Tubular structure of gold 19
Figure 2.1 Flow chart describing a self-consistent cycle for electron
density
36
Figure 2.2 An illustration of the all-electron (solid lines) and
pseudoelectron (dashed lines) potentials and their
corresponding wave functions. The radius rc, is the cut off
distance after which all-electron and pseudoelectron values
match.
40
Figure3.1(a) The optimized geometries of Aun cluster (n=3 -13)
obtained from GP
51
Figure3.1(b) The optimized geometries of Aun (n=3 -14) and their close
lying isomer obtained from DFT
54
Figure 3.2 The binding energy per atom curve of Aun clusters for
n=3-14 using Gp and DFT.
57
Figure 3. 3 The second difference of energy (∆2E) of Aun clusters
(n=3- 13) with DFT and Gp calculations
58
Figure 3.4 The HOMO-LUMO gaps of the lowest energy Aun (n=2 -
14) clusters
58
Figure 3.5 The electron affinities (EAs) , ionization potentials (IPs)
and Chemical Hardness (さ) of lowest energy Aun clusters
for n=2-14
60
Figure 4.1 The ground state structures of Aun+1 and AunSi for n = 1-8.
The numbers under the structures are relative difference of
energy w.r.t the ground state structure. The blue and
golden ball represents Si and Au atoms respectively.
69
vi
Figure 4.2. The ground state structure of Au10 and Au9Si with other
low lying isomers. The numbers under the structures are
relative difference of energy w.r.t the ground state
structure. The blue and golden ball represents Si and Au
atoms respectively.
70
Figure 4.3. The ground state structure of Au11 and Au10Si with other
low lying isomers. The numbers under the structures are
relative difference of energy w.r.t the ground state
structure. The blue and golden ball represents Si and Au
atoms respectively.
71
Figure 4.4. The ground state structure of Au12 and Au11Si with other
low lying isomers. The numbers under the structures are
relative difference of energy w.r.t the ground state
structure. The blue and golden ball represents Si and Au
atoms respectively.
71
Figure 4.5 The ground state structure of Au13 and Au12Si. The blue
and golden ball represents Si and Au atoms respectively
72
Figure 4. 6 The binding energy per atom curve of AunSi and Aun+1
cluster for n=1-12
74
Figure 4.7 The dissociation energy curve of AunSi cluster for n=1-12 75
Figure 4.8 The second difference of energy ∆2E of AunSi and Aun+1
cluster for n=1-12
76
Figure 4.9 HOMO-LUMO gap of AunSi and Aun+1 cluster (n=1-12) 77
Figure 4.10 The electron affinities (EAs) and ionization potentials (IPs)
AunSi cluster for n=1-12
78
Figure 4.11 Size dependence of the calculated chemical hardness (さ) of
lowest energy AunSi clusters
79
Figure 4.12 The ground state structures of AunGe for n = 1-10 .The
numbers under the structures are relative difference of
energy w.r.t the ground state structure. The grey and
black ball represents Ge and Au atoms respectively
81
Figure 4.13 Comparison of the binding energy per atom AunGe with
AunSi and Aun+1 clusters
82
Figure 4.14 Comparision of the second difference of energy ∆2E of
AunGe, AunSi and Aun+1 clusters
82
Figure 4.15 Comparison of HOMO-LUMO gap of AunGe with AunSi
and Aun+1 clusters
84
Figure 5.1 The initial geometry of Au32 cage with position of dopant (M) atoms is shown in Fig. 5.1(a) by green spheres. The low lying geometries of the M12@Au20 clusters (M= Si, Ge and C) obtained from symmetry unrestricted optimization using density functional theory. The Si atom is represented by blue spheres (Fig.5.1 (b)), Ge atom is represented as purple spheres (Fig. 5.1(c)) and C atom is represented as brown spheres (Fig. 5.1(d)).
91
Figure 5.2 The average binding energy (Eb) of the M12@Au20 clusters
(M=C, Si and Ge)
92
Figure 5.3 Partial density of states for (a) Au32, C12@Au20 (b&c),
Si12@Au20 (d&e) and Ge12@Au20 (f&g) clusters with their
lowest-energy configurations. Fermi level is set at zero on
the energy axis
93
vii
Figure 6.1 Au24-I and Au24-II represents the two different
arrangement of Au24 cage and other represents the
optimized geometries of M@ Au24 where M is Cu, Ag. The
yellow ball represents Au atom, silver ball is Ag atom and
blue ball represents Cu atom.
98
Figure 6.2 The average binding energy of the ground-state of
M@Au24-I and M@Au24-II (M=Cu, Ag)
101
Figure 6.3 The HOMO-LUMO gap of M@Au24-I and M@Au24-II
(M= Cu, Ag)
102
Figure 7.1 Lowest energy geometries of XMAuN where X= Si, Al and
Au, M=3, 6, 9 and N= 24, 42, 60. The outer tubular
framework represents Au atoms and the ball along the
central axis of tube represents X, the dopant atoms
110
Figure 7.2 The lowest energy geometry of Si8Au60. The outer tubular
framework represents Au atoms and the balls along the
central axis of tube represent Si atoms.
113
Figure 7.3 The average binding energy (Eb) of the ground-state
XMAuN (X= Al, Si and Au, M=3, 6, 9 and N= 24, 42, and
60) tube like structures
114
Figure 7. 4 Partial density of states for (a) Au24 tube (b) Si3Au24 (c)
Al3Au24 and (d) Au3Au24, clusters with their lowest-energy
configurations representing s,d states of Au24 tube and
comparison of the s, d states of Au24 tube after doping
with the s and p states of dopant Al and Si. Fermi level is
set at zero on the energy axis.
115
Figure 8.1 Various stages of stretching for pure monatomic Au chain
containing 5 and 7 atoms.
122
Figure 8.2 Comparison of variation in total energy with the total
length of gold chain from different approaches DFT and
GP.
123
Figure 8.3 Comparison of variation of force with the total length of
gold chain of 5 and 7 atoms for DFT and GP
124
Figure 8.4 Comparison of variation of modulus with total length of
gold chain of 5 and 7 atoms for DFT and GP
125
Figure 9.1 The optimized Au108 nanotube using GP (without the top
and bottom layer)
129
Figure 9.2 The unit cell of sheet of gold atoms having a rhombus
cross section
130
Figure 9.3 Dispersion curve for 2D gold sheet 138
viii
List of Tables Table No Title Page No. Table 3.1 Parameters used in Gupta potential 50
Table 3.2 Computed and experimental Binding Energy per atom (BE)
and Bond Length of the dimer Au2
51
Table 3.3 Binding Energy per atom of neutral optimized gold clusters
Aun calculated DFT and Gp. All values are in electron volts
per atom (eV /atom).
56
Table 3.4 HOMO-LUMO gap (Eg), Adiabatic Electron Affinity
(AEA), Adiabatic Ionisation Potential (AIP), Chemical
Hardness (さ) of neutral Gold clusters Aun calculated at
DFT-GGA level through siesta code (SC). All values are in
electron volts (eV).
59
Table 4.1 Binding energy per atom (Eb) and bond lengths (Rau-si and
Rau-au) of AunSi clusters
73
Table 4.2 Second order differences (eV) and Dissociation Energy
(eV) of AunSi clusters
74
Table 4.3 HOMO-LUMO gap (Eg), Electron Affinity (AEA),
Adiabatic Ionisation Potential (AIP), Chemical Hardness
(さ), Magnitude of charge (Qn(e)) on Si atom from Au atom
Q(e) in AunSi clusters. All values are in electron volts (eV).
77
Table 4.4 Binding Energy per atom (eV/atom), Second Energy
Difference (eV), HOMO-LUMO gap (Eg), in AunGe (n= 1-
10) clusters
83
Table 5.1 Symmetry, Binding Energy per atom (eV/atom), HOMO-
LUMO gap (Eg)
91
Table 6.1 Average Binding Energy per Atom (E b), Average
Distances of Dopants from the bonded Au atoms in the shell
(R), HOMO-LUMO gap (Eg)
100
Table 7.1 Computed and experimental Binding Energy per atom (BE)
and Bond lengths of the dimer
108
Table 7.2 Average Binding Energy per Atom (Eb ), Average
Distances of Au-Au atoms (inter-layer) and X-X (X=Al, Si,
Au) present at the centre(R) and HOMO-LUMO gap (Eg),
Energy of HOMO level
112
1
Chapter 1
1. Introduction
1.1 A brief note on nanoparticles
"There's Plenty of Room at the Bottom - An Invitation to Enter a New Field of
Physics." a visionary talk by Richard Feynman’s at Caltech in 1959 gave birth to the
idea of nanotechnology. His talk inspired the scientists to develop new devices and
machines that could be constructed from the components containing tens or hundreds
of atoms. A nanoparticle is the most fundamental component in the fabrication of
nanostructured devices. It is far smaller than the everyday objects which are governed
by Newton’s laws of motion and bigger than an atom or a simple molecule that are
governed by quantum mechanics. They are the particles with number of atoms or
molecules bonded together with a radius between 1-100nm. At this size, structure
built from them exhibit new electronic structure, conductivity, chemical reactivity,
mechanical properties etc [1]. Clusters form the building blocks of different
nanostructured materials.
The clusters are nanoparticles composed of countable number of atoms, intermediate
in size between the individual atom and the bulk. Their property differs from the bulk
material in terms of electronic structures [2]. The electronic structure of a cluster
consists of discrete molecule like energy levels and exhibits strong size dependence
while the bulk material has smoothly varying continuous band structure. Clusters are
also different from conventional molecules. The Molecules have fixed compositions
and definite structures, whereas clusters can exist in diverse stoichiometries and
multiple geometries (or isomers). Clusters can be neutral or charged. They may be
homogeneous or heterogeneous. Like molecules they are held together by different
kinds of forces, e.g. metallic bonds (as in alkali and coinage metal clusters), ionic
forces (as in NaCl clusters), covalent chemical bonds (as in carbon and silicon
clusters), or Van der Waals attraction (as in He and Ar clusters) [3,4,5]. Clusters
provide an ideal medium for studying different properties such as, geometric and
electronic structure, melting temperature, magnetic moment etc, not only by changing
the size one atom at a time but also by changing geometry.
It is observed that the change in these properties take place upto a critical size, e.g. the
electrical conductivity of a metal strongly depends on the mean free path. If the size
2
of the particle is less than the characteristics length it is possible to observe new
properties [1].
By studying the properties of small clusters and working toward the larger ones,
scientists can better understand the origins of known bulk material properties. The
different properties of clusters are also strongly characterized by quantum size effects.
Study of clusters as a function of size enables one to track the manner in which size
dependent properties change from molecular-like to the bulk limit. As an example we
can study the Au20 cluster, which has a beautiful pyramidal structure in which all the
gold atoms are on the four surfaces of a tetrahedron, resembling that of Au (111)
surface [6]. Thus clusters provide valuable models for surface chemistry and catalysis.
Besides presenting novel properties interesting for fundamental research, clusters also
hold promise for several applications.
Nanotubes and nanowires constitute an important class in nanoelectronics with their
potential applications as nanodevices or as connectors between them. Recent
advances in experimental techniques, such as Scanning Tunneling Microscopy (STM)
[7, 8] and electron-beam lithography [9], are giving rise to fabrication of wires at
nanometre scale. Properties of nanotubes and nanowires are actively studied both
experimentally and theoretically [10-13].
1.2 Why Gold??? - Historical background and applications
Gold nanoparticles (AuNPs) have emerged as an object of great interest in the fields
of physics, chemistry, biology, medicine, material science as well as some
interdisciplinary field due their attractive electronic, optical, thermal and catalytic
properties. Compared with other nanostructures, study of metallic nanoparticles is
found to be more flexible owing to synthetic control of their shape, size, composition
etc.
Historical importance of gold lies in the role played by it due to its exquisite qualities
among metals, making it exceptionally valuable from the earliest civilizations till
date. The earlier use of gold nanoparticles appeared in Roman era as an elaborate
decorating material. The beautiful “Lycurgus Cup” (owned by the British Museum),
which is red in transmission and green in reflection, contains silver-gold bimetallic
nanoparticles of around 50-100 nm in diameter [14]. Until the seventeenth century,
the gold colloids were used to colour glass and their synthesis was described by the
Italian glass makers. Later, in 1857, Michael Faraday carried out his first remarkable
3
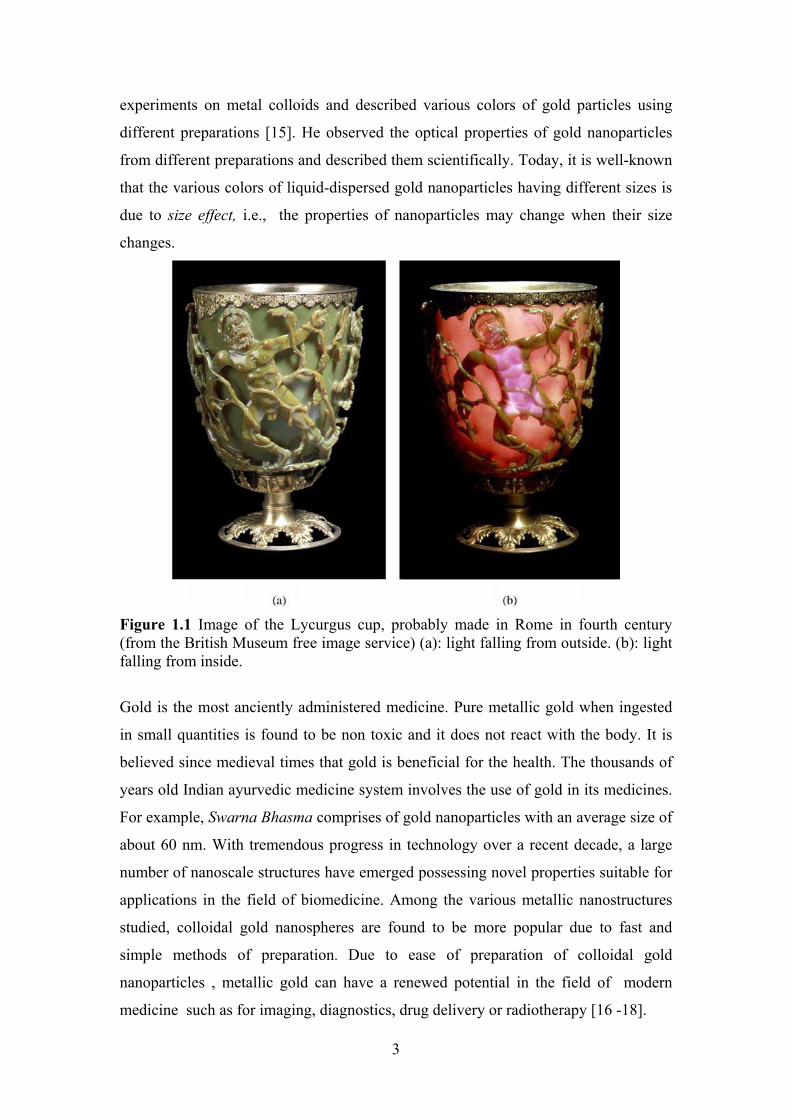
experiments on metal colloids and described various colors of gold particles using
different preparations [15]. He observed the optical properties of gold nanoparticles
from different preparations and described them scientifically. Today, it is well-known
that the various colors of liquid-dispersed gold nanoparticles having different sizes is
due to size effect, i.e., the properties of nanoparticles may change when their size
changes.
Figure 1.1 Image of the Lycurgus cup, probably made in Rome in fourth century (from the British Museum free image service) (a): light falling from outside. (b): light falling from inside.
Gold is the most anciently administered medicine. Pure metallic gold when ingested
in small quantities is found to be non toxic and it does not react with the body. It is
believed since medieval times that gold is beneficial for the health. The thousands of
years old Indian ayurvedic medicine system involves the use of gold in its medicines.
For example, Swarna Bhasma comprises of gold nanoparticles with an average size of
about 60 nm. With tremendous progress in technology over a recent decade, a large
number of nanoscale structures have emerged possessing novel properties suitable for
applications in the field of biomedicine. Among the various metallic nanostructures
studied, colloidal gold nanospheres are found to be more popular due to fast and
simple methods of preparation. Due to ease of preparation of colloidal gold
nanoparticles , metallic gold can have a renewed potential in the field of modern
medicine such as for imaging, diagnostics, drug delivery or radiotherapy [16 -18].
4
Gold has become an important nanoscale electronic component because of its
resistance to oxidation and its mechanical strength. At nanosize the bulk gold, exhibit
different electronic structure which is intermediate between the band structure of the
bulk metal and the discrete energy levels of molecules with a characteristic highest
occupied molecular orbital (HOMO)–lowest unoccupied molecular orbital (LUMO).
Also in comparison to other inorganic nanomaterials, the gold nanoparticles can be
synthesized in large variety of shapes and sizes.
To avoid the oxidation or precipitation of gold nanoparticles in the solution phase or
controlling size during growth of nanoparticles, stabilizing agents or ligands are used
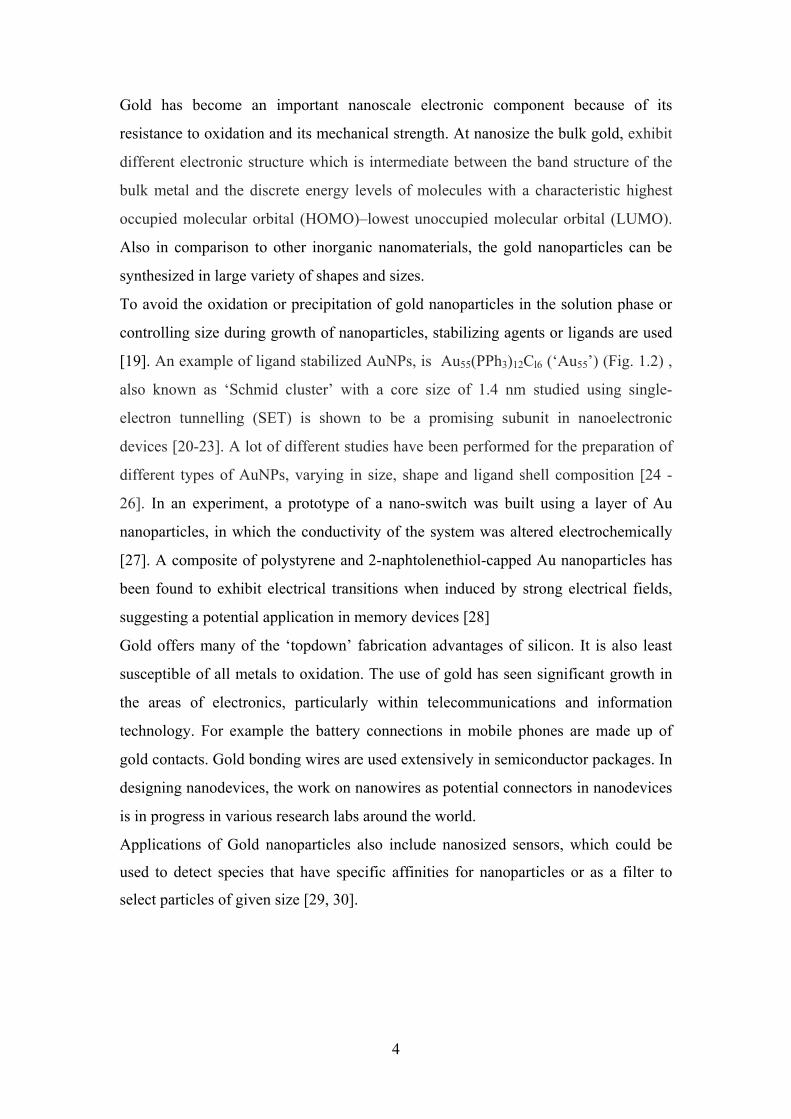
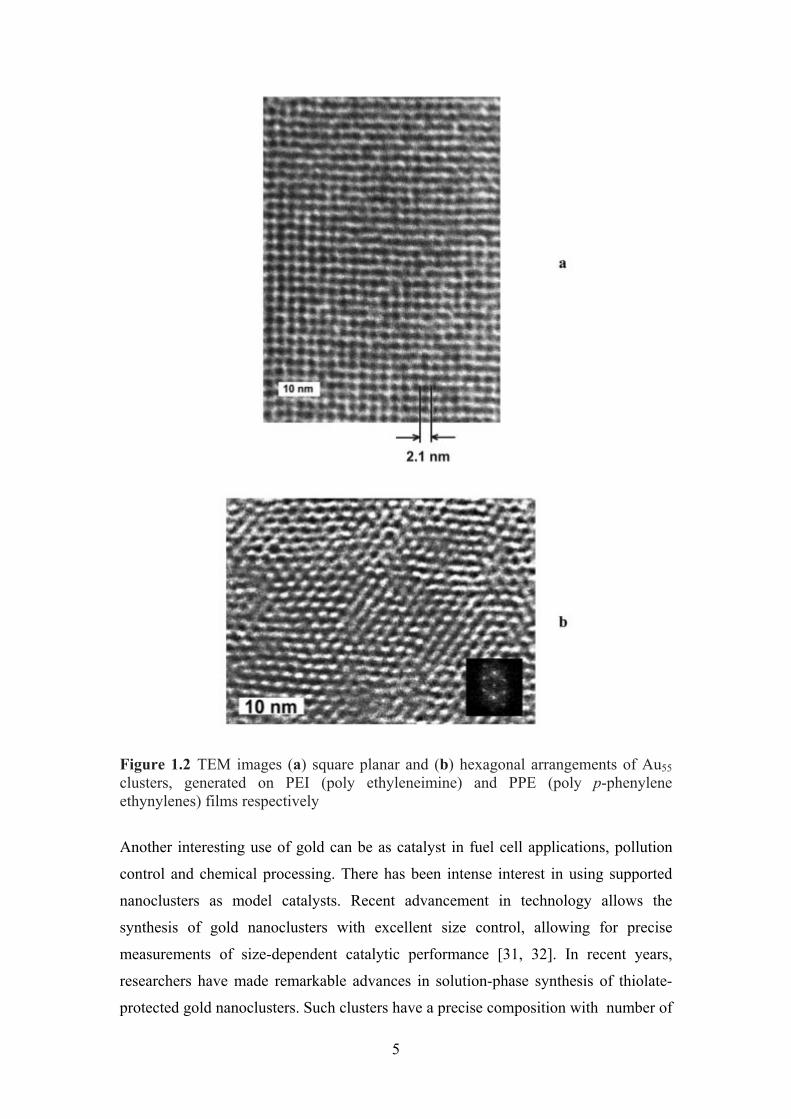
[19]. An example of ligand stabilized AuNPs, is Au55(PPh3)12Cl6 (‘Au55’) (Fig. 1.2) ,
also known as ‘Schmid cluster’ with a core size of 1.4 nm studied using single-
electron tunnelling (SET) is shown to be a promising subunit in nanoelectronic
devices [20-23]. A lot of different studies have been performed for the preparation of
different types of AuNPs, varying in size, shape and ligand shell composition [24 -
26]. In an experiment, a prototype of a nano-switch was built using a layer of Au
nanoparticles, in which the conductivity of the system was altered electrochemically
[27]. A composite of polystyrene and 2-naphtolenethiol-capped Au nanoparticles has
been found to exhibit electrical transitions when induced by strong electrical fields,
suggesting a potential application in memory devices [28]
Gold offers many of the ‘topdown’ fabrication advantages of silicon. It is also least
susceptible of all metals to oxidation. The use of gold has seen significant growth in
the areas of electronics, particularly within telecommunications and information
technology. For example the battery connections in mobile phones are made up of
gold contacts. Gold bonding wires are used extensively in semiconductor packages. In
designing nanodevices, the work on nanowires as potential connectors in nanodevices
is in progress in various research labs around the world.
Applications of Gold nanoparticles also include nanosized sensors, which could be
used to detect species that have specific affinities for nanoparticles or as a filter to
select particles of given size [29, 30].
5
Figure 1.2 TEM images (a) square planar and (b) hexagonal arrangements of Au55 clusters, generated on PEI (poly ethyleneimine) and PPE (poly p-phenylene ethynylenes) films respectively
Another interesting use of gold can be as catalyst in fuel cell applications, pollution
control and chemical processing. There has been intense interest in using supported
nanoclusters as model catalysts. Recent advancement in technology allows the
synthesis of gold nanoclusters with excellent size control, allowing for precise
measurements of size-dependent catalytic performance [31, 32]. In recent years,
researchers have made remarkable advances in solution-phase synthesis of thiolate-
protected gold nanoclusters. Such clusters have a precise composition with number of
6
metal atoms (n) and ligands (m), denoted as Aun(SR)m, with n ranging up to a few
hundred atoms[33].
It can be presumed that the use of gold nanoparticles will increase dramatically in the
near future in varied fields. The gold nanowires as conducting contacts in
nanoelectronics will contribute to the progress of nanotechnology. The use of gold as
catalysis seems to have already started. Gold nanoparticles in combination with
biomolecules will have commercial applications in medical diagnostics in near future.
1.3 Relativistic effects in gold
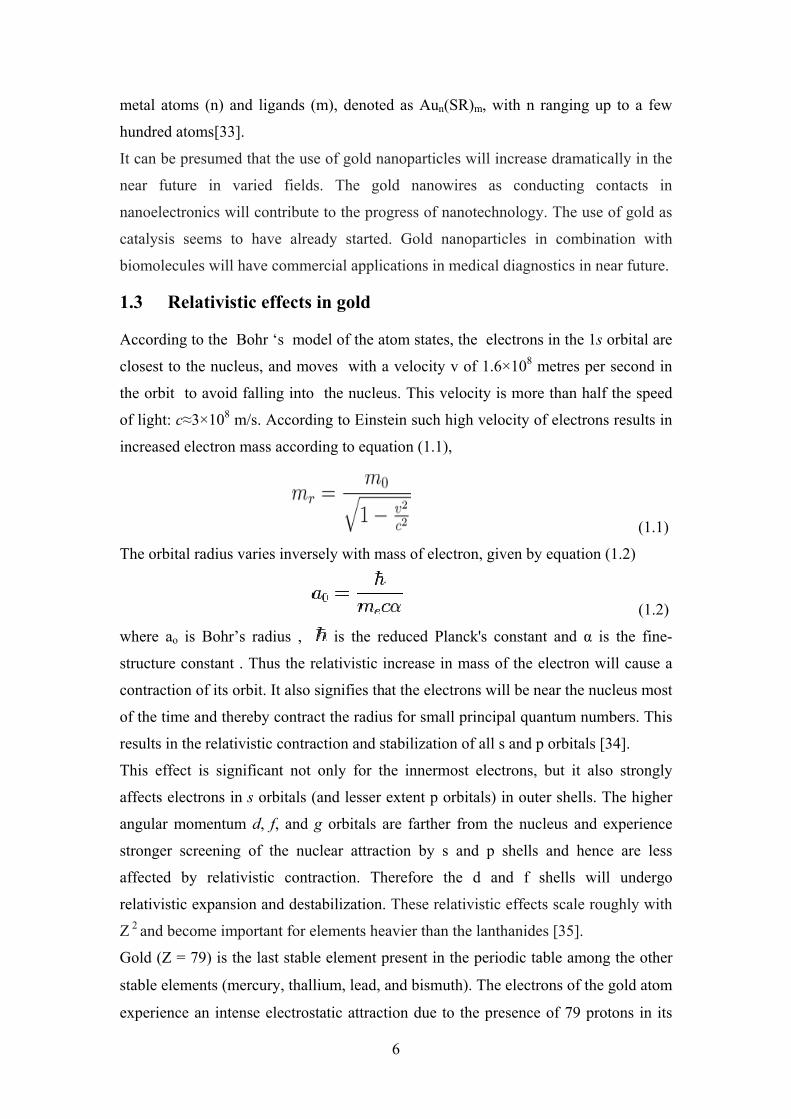
According to the Bohr ‘s model of the atom states, the electrons in the 1s orbital are
closest to the nucleus, and moves with a velocity v of 1.6×10⁸ metres per second in
the orbit to avoid falling into the nucleus. This velocity is more than half the speed
of light: c≈3×10⁸ m/s. According to Einstein such high velocity of electrons results in
increased electron mass according to equation (1.1),
(1.1)
The orbital radius varies inversely with mass of electron, given by equation (1.2)
(1.2)
where ao is Bohr’s radius , is the reduced Planck's constant and g is the fine-
structure constant . Thus the relativistic increase in mass of the electron will cause a
contraction of its orbit. It also signifies that the electrons will be near the nucleus most
of the time and thereby contract the radius for small principal quantum numbers. This
results in the relativistic contraction and stabilization of all s and p orbitals [34].
This effect is significant not only for the innermost electrons, but it also strongly
affects electrons in s orbitals (and lesser extent p orbitals) in outer shells. The higher
angular momentum d, f, and g orbitals are farther from the nucleus and experience
stronger screening of the nuclear attraction by s and p shells and hence are less
affected by relativistic contraction. Therefore the d and f shells will undergo
relativistic expansion and destabilization. These relativistic effects scale roughly with
Z 2 and become important for elements heavier than the lanthanides [35].
Gold (Z = 79) is the last stable element present in the periodic table among the other
stable elements (mercury, thallium, lead, and bismuth). The electrons of the gold atom
experience an intense electrostatic attraction due to the presence of 79 protons in its
7
nucleus. The yellow appearance of bulk gold is attributed to strong relativistic effects
exhibited by it. Due to the relativistic contraction of s orbitals in gold, the energy
levels shift closer to d orbitals (which are less affected by relativity). This shifts the
light absorption (5ds6s transition) from the ultraviolet down into the lower
frequency blue visual range. Therefore gold absorbs blue light more than the other
visible wavelengths of light, this makes a piece of gold appear yellow (under white
light) to human eyes. A non-relativistic gold would be white.
While in Ag similar transition occurs, but because of the relativistic effects the 4d-5s
distance in Ag is much greater than the 5d-6s distance in Au; hence silver appears
white. The relativistic effect has raised the 5d orbital and lowered the 6s orbital [36].
Another important impact of a relativistic effect is the initial resistance of gold
towards oxidation. Due to the relativistic contraction of 6s orbital toward the nucleus
and stronger electrostatic attraction of the 79 protons in the nucleus, the “atomic
radius” of gold reduces considerably. Only the strongly reactive substances can tug
gold's 6s1 electron out from where it's place. The importance of relativistic effects in
gold has been a topic of theoretical and experimental research for a long time [36-39].
1.4 Structure of Gold
Bulk gold is soft, yellow metal with the face centered cubic crystal structure, its
melting point is 1068oC and has excellent electrical conductivity. But at nanoscale
some these properties tend to change, these changes are exploited in field of
nanotechnology [40]. Due to lack of translational symmetry the structure of
nanoparticles is different from the bulk structure of the same materials. This results in
a complicated competition in energetic stability of various structural motifs. Thus, it is
important to characterize both experimentally and theoretically the structure of
nanoparticles. Due to its electronic configuration, bulk gold is a good conductor of
electricity, with its conductivity only beaten by copper and silver. But at nanoscale
the gold structures, depending on shape and substrate, can actually be semi-
conductors [41]. The study of structures of gold nanoclusters of various sizes and
their impact on the various properties such as electronic, optical etc is areas of active
research in cluster science because of possible applications in the nanoelectronic
devices [42-46].
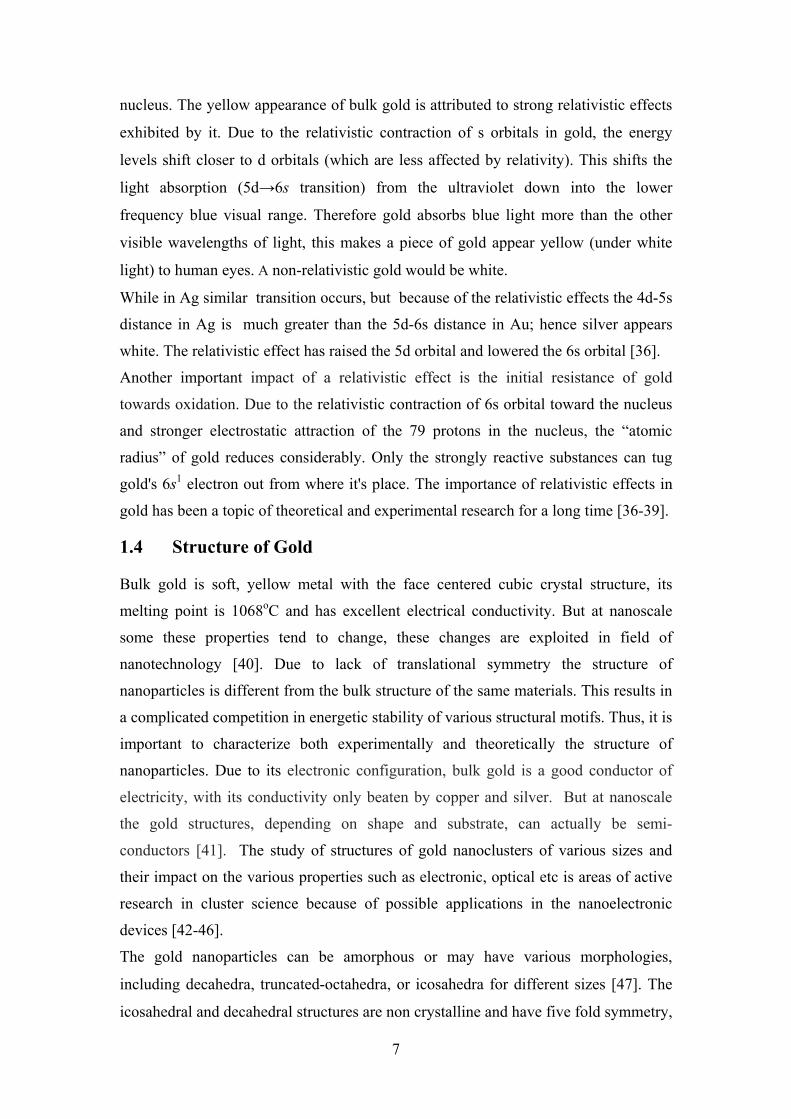
The gold nanoparticles can be amorphous or may have various morphologies,
including decahedra, truncated-octahedra, or icosahedra for different sizes [47]. The
icosahedral and decahedral structures are non crystalline and have five fold symmetry,
8
hence can not be packed together to make macroscopic crystal. These structures are
only found to exist at nanoscale. Also the surface effect becomes significant at
nanoscale; therefore the internal energy must be minimized with respect to electronic
configuration, surface energy and elastic strain resulting in the change in the structure
of gold. It has been observed that icosahedron yields an efficient compromise between
surface energy and packing density [16].
1.4.1 Magic geometric numbers and magic electron numbers
The bulk state adopts a packing arrangement which minimizes its free energy. At
nanoscale, the atoms in clusters have a tendency to minimize surface-to-volume ratio
to form closely packed, high-symmetry cluster structures. These high-symmetry
structures are constructed from specific shells of atoms called as geometric shells.
If a number of atoms that can be packed complete the geometric shells of a high-
symmetry structure, it is said to be magic geometric number [48].
For example, icosahedral structures (Ih symmetry) are constructed from one central
atom surrounded by geometric shells consisting of 12, 42, 92, 162, etc. atoms. Thus
the respective magic atom numbers are 1 + 12 = 13, 13 + 42 = 55, 55 + 92 =147, 147
+ 162 = 309, etc.The structures with an octahedral symmetry (Oh) have face-centred
cubic (FCC) packing. There geometric shells can be completed in two ways. The first
way is the formation of the cuboctahedral geometry having the same magic atom
numbers of the icosahedra: 13, 55, 147, 309, etc. In the other way, a basic octahedron
is built from 6 atoms, and the larger clusters are constructed by surrounding that
central octahedron with the subsequent shells of 38, 102, 198, etc. atoms, resulting in
octahedral clusters with the respective magic atom numbers are 6, 44, 146, 344, etc.
On removing the corner atoms from the octahedral, we get a truncated-octahedral.
The truncated-octahedral species can be either cuboctahedral geometry which has
triangular (111) facets or the plain called truncated-octahedral geometry which has
hexagonal (111) facets. The magic atom numbers for the truncated octahedral
geometry are: 38, 116, 260, etc.
9
Figure 1.3 Few high-symmetry clusters having the geometric shells completed with the magic numbers: 147-atom icosahedron, 147-atom cuboctahedron, 116-atom truncated octahedron, 146-atom octahedron,
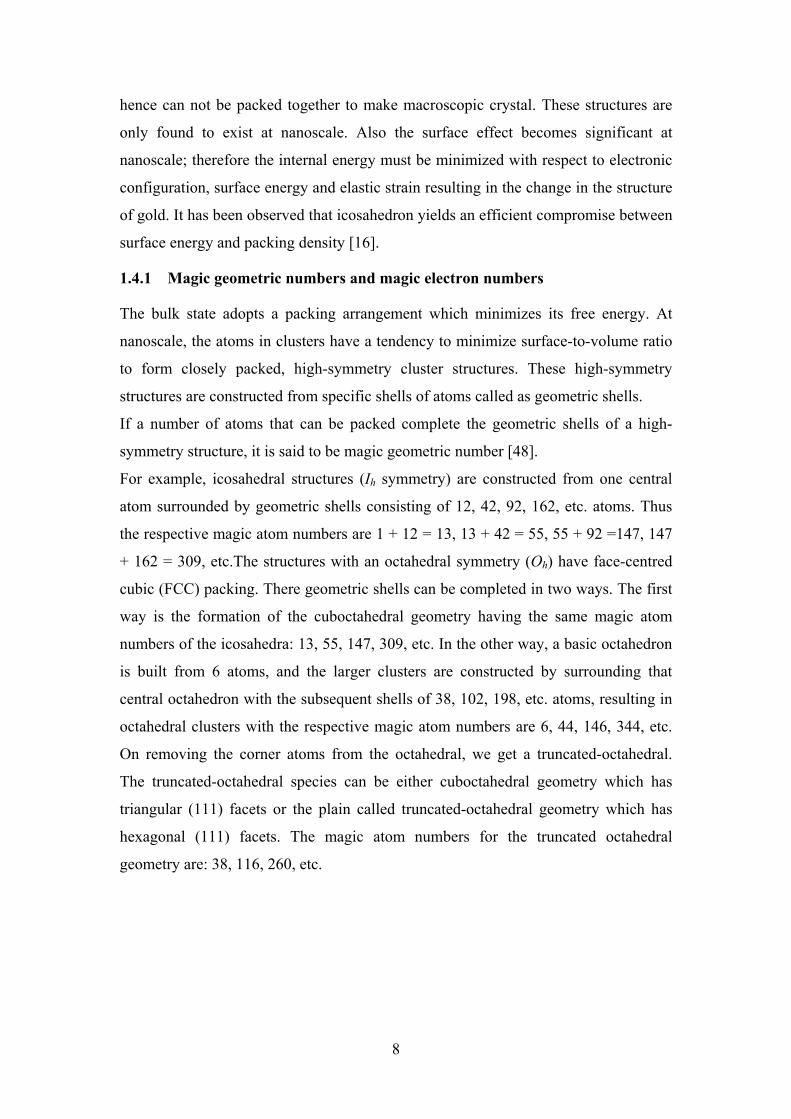
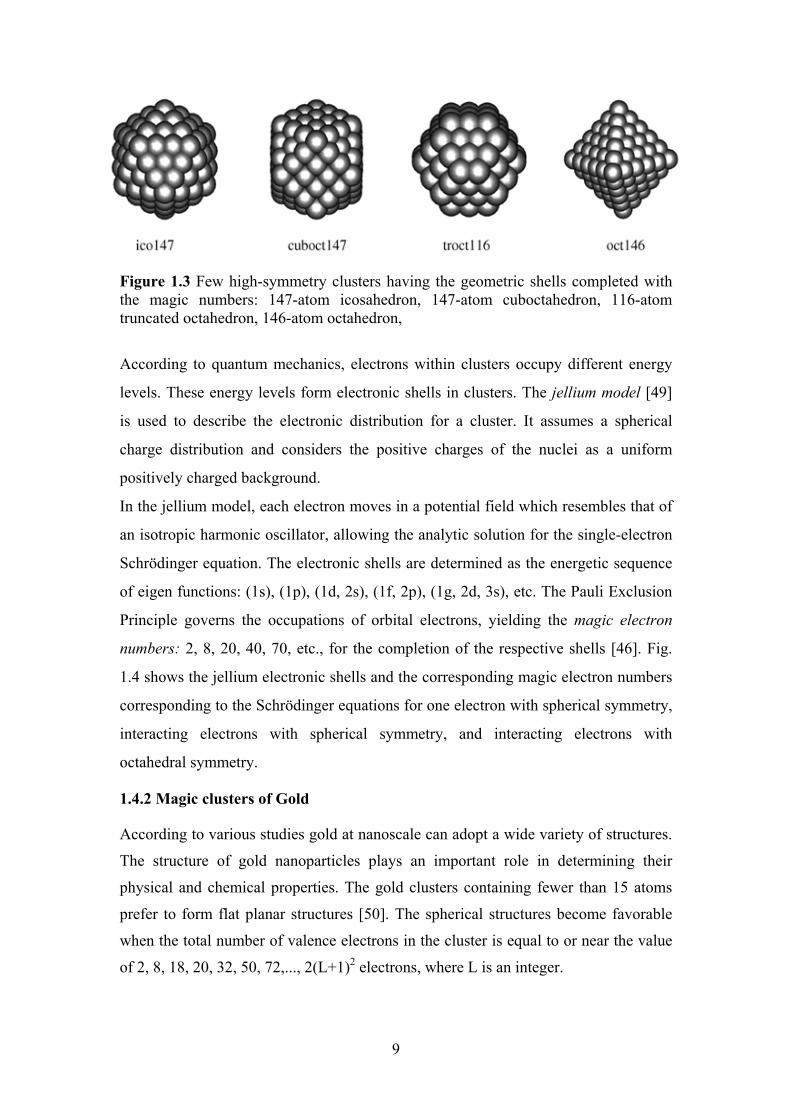
According to quantum mechanics, electrons within clusters occupy different energy
levels. These energy levels form electronic shells in clusters. The jellium model [49]
is used to describe the electronic distribution for a cluster. It assumes a spherical
charge distribution and considers the positive charges of the nuclei as a uniform
positively charged background.
In the jellium model, each electron moves in a potential field which resembles that of
an isotropic harmonic oscillator, allowing the analytic solution for the single-electron
Schrödinger equation. The electronic shells are determined as the energetic sequence
of eigen functions: (1s), (1p), (1d, 2s), (1f, 2p), (1g, 2d, 3s), etc. The Pauli Exclusion
Principle governs the occupations of orbital electrons, yielding the magic electron
numbers: 2, 8, 20, 40, 70, etc., for the completion of the respective shells [46]. Fig.
1.4 shows the jellium electronic shells and the corresponding magic electron numbers
corresponding to the Schrödinger equations for one electron with spherical symmetry,
interacting electrons with spherical symmetry, and interacting electrons with
octahedral symmetry.
1.4.2 Magic clusters of Gold
According to various studies gold at nanoscale can adopt a wide variety of structures.
The structure of gold nanoparticles plays an important role in determining their
physical and chemical properties. The gold clusters containing fewer than 15 atoms
prefer to form flat planar structures [50]. The spherical structures become favorable
when the total number of valence electrons in the cluster is equal to or near the value
of 2, 8, 18, 20, 32, 50, 72,..., 2(L+1)2 electrons, where L is an integer.
10
Figure 1.4 Energy levels in the jellium model [46].
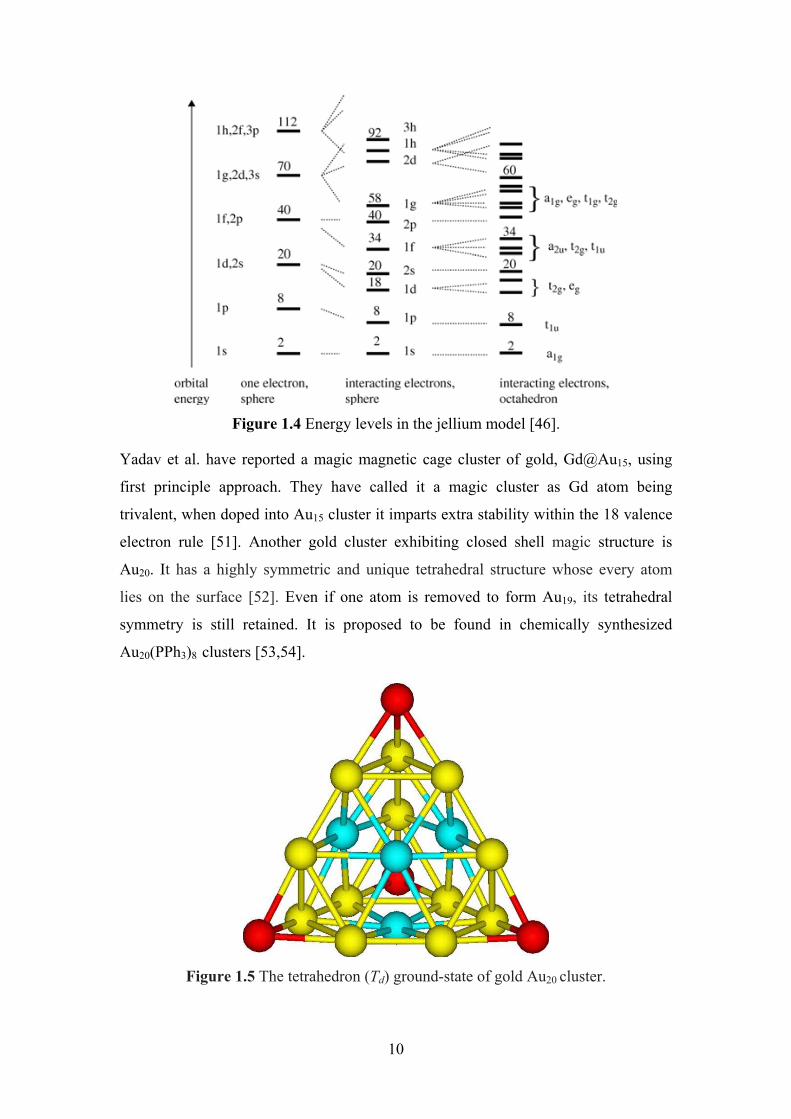
Yadav et al. have reported a magic magnetic cage cluster of gold, Gd@Au15, using
first principle approach. They have called it a magic cluster as Gd atom being
trivalent, when doped into Au15 cluster it imparts extra stability within the 18 valence
electron rule [51]. Another gold cluster exhibiting closed shell magic structure is
Au20. It has a highly symmetric and unique tetrahedral structure whose every atom
lies on the surface [52]. Even if one atom is removed to form Au19, its tetrahedral
symmetry is still retained. It is proposed to be found in chemically synthesized
Au20(PPh3)8 clusters [53,54].
Figure 1.5 The tetrahedron (Td) ground-state of gold Au20 cluster.
11
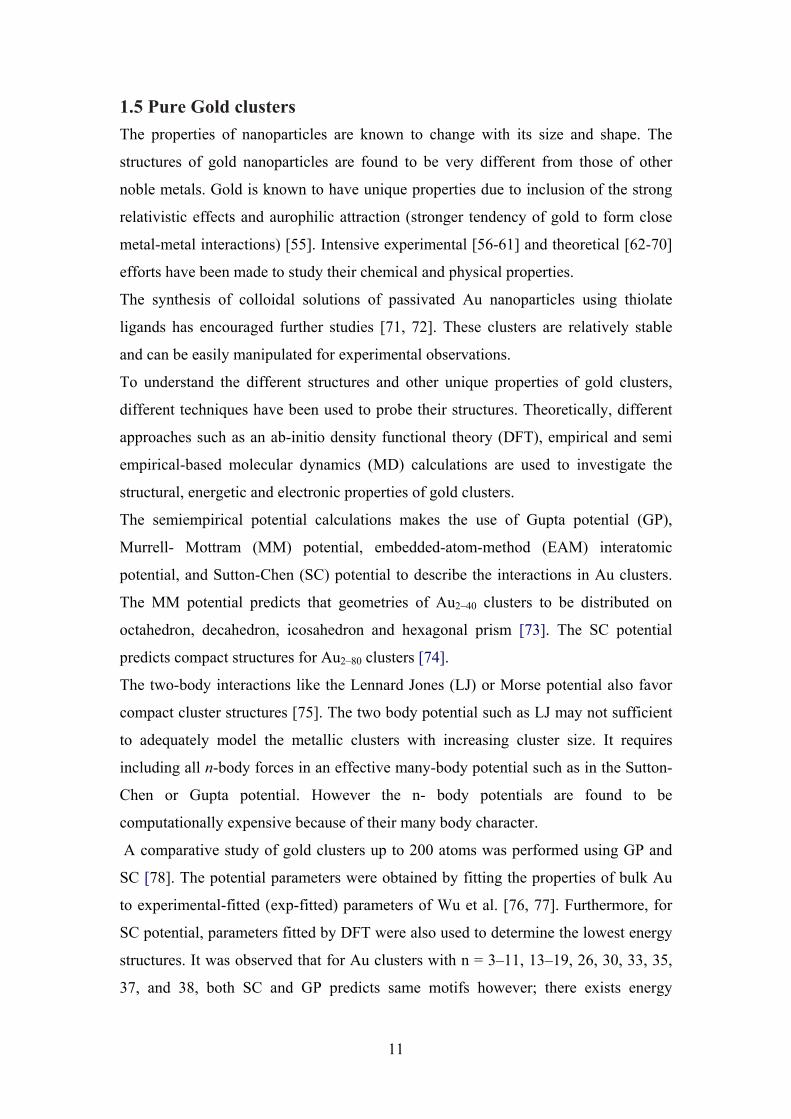
1.5 Pure Gold clusters
The properties of nanoparticles are known to change with its size and shape. The
structures of gold nanoparticles are found to be very different from those of other
noble metals. Gold is known to have unique properties due to inclusion of the strong
relativistic effects and aurophilic attraction (stronger tendency of gold to form close
metal-metal interactions) [55]. Intensive experimental [56-61] and theoretical [62-70]
efforts have been made to study their chemical and physical properties.
The synthesis of colloidal solutions of passivated Au nanoparticles using thiolate
ligands has encouraged further studies [71, 72]. These clusters are relatively stable
and can be easily manipulated for experimental observations.
To understand the different structures and other unique properties of gold clusters,
different techniques have been used to probe their structures. Theoretically, different
approaches such as an ab-initio density functional theory (DFT), empirical and semi
empirical-based molecular dynamics (MD) calculations are used to investigate the
structural, energetic and electronic properties of gold clusters.
The semiempirical potential calculations makes the use of Gupta potential (GP),
Murrell- Mottram (MM) potential, embedded-atom-method (EAM) interatomic
potential, and Sutton-Chen (SC) potential to describe the interactions in Au clusters.
The MM potential predicts that geometries of Au2–40 clusters to be distributed on
octahedron, decahedron, icosahedron and hexagonal prism [73]. The SC potential
predicts compact structures for Au2–80 clusters [74].
The two-body interactions like the Lennard Jones (LJ) or Morse potential also favor
compact cluster structures [75]. The two body potential such as LJ may not sufficient
to adequately model the metallic clusters with increasing cluster size. It requires
including all n-body forces in an effective many-body potential such as in the Sutton-
Chen or Gupta potential. However the n- body potentials are found to be
computationally expensive because of their many body character.
A comparative study of gold clusters up to 200 atoms was performed using GP and
SC [78]. The potential parameters were obtained by fitting the properties of bulk Au
to experimental-fitted (exp-fitted) parameters of Wu et al. [76, 77]. Furthermore, for
SC potential, parameters fitted by DFT were also used to determine the lowest energy
structures. It was observed that for Au clusters with n = 3–11, 13–19, 26, 30, 33, 35,
37, and 38, both SC and GP predicts same motifs however; there exists energy
12
difference for the two potentials. Results also showed that in Au100–200 clusters, the
dominant motif for both potentials is decahedral. In another study the magic clusters
Au38, Au55 and Au75 were studied using Gupta potential and were found to have
amorphous-like, face-centered-cubic (fcc), and decahedral structures, respectively
[79,80].
The Jahn-Teller and spin-orbit effects are found to play an important role in
predicting the lowest energy structures of gold clusters, e.g., the lowest energy
structure of the gold trimer (Au3) [81] or the anion 20-gold cluster (Au20-1) [82]. The
use of any potential will give an ideal triangle as the lowest energy geometry for the
interaction between three atoms and an ideal tetrahedron for the interaction between
four atoms. But in the case of metal clusters it is different. The bonding in
homonuclear coinage metals ground state is due to single s electron on each atom and
their d orbitals are involved in electron correlation and spin–orbit effects. The heavier
trimer such as Au3 cluster retains its D3h symmetry due to large spin–orbit
stabilization and does not undergo a Jahn–Teller distortion which would have reduced
the symmetry to C2v [83]. It was suggested by Bersuker, that spin-orbit coupling
could dominate the Jahn Teller distortions [84]. Thus it suggests that the gold clusters
do not follow the pattern predicted by Lennard-Jones, Morse or Gupta potential, all
favoring a maximum number of close atom–atom contacts.
Another aspect which is not explained by semi empirical potentials is the onset of 2D
geometries in small Aun clusters. It is observed that the transition from two-
dimensional to three-dimensional structures occurs at n >13 in Aun clusters [50, 64].
The preference for planarity in gold clusters cannot be explained by the many-body
potentials, such as the Gupta or Sutton- Chen potential [85]. The preference for
planarity of small gold cluster compounds has been attributed to the relativistic effects
[86]. The GP or other similar potential cannot account correctly for many-body
effects and the relativistic effects which are important to obtain the correct shape and
structures of small to medium sized gold. To include the many-body effects in gold
clusters, their preference for planarity and to study their electronic properties we use
DFT.
There is a vast literature available on theoretical investigations of electronic and
structural properties of small, homonuclear, neutral, and ionic gold clusters using
density functional theory (DFT) or ab initio methods. Structures and energetics of
13
neutral and ionic gold clusters ±nAu up to the decamer are discussed in Refs. 87 - 91.
A two dimensional to three dimensional transitions in small gold clusters is widely
discussed and studied. Wang et al. [68] using DFT calculations have found planar
structures (2D) for gold clusters up to n= 6 and more compact spherical structures
(3D) starting n= 16, and flat cage-like structures in-between, while Fernandez et al.
[92] found 2D structures up to Au11 using DFT/GGA with the transition from 2D to
3D occurring at Au12. In contrast, the 2D/3D structural transition for Cu and Ag occur
at n=6. Landman et al. have observed that Cu7− and Ag7
− have compact 3D structures,
while Au7− is planar. It was found that this is due to relativistic effects as non
relativistic Au7 would behave similar to copper and silver [86]. Koskinen et al.
studied the dynamics of Aun- (n= 11–14) and showed the co-existence of 2D and 3D
structures at finite temperatures [93]. In general, different studies including the
systematic searches for the global minimum structures of larger cluster sizes, predicts
the two- to three dimensional 2Dĺ3D transition to occur at n ≥13 [50, 94, 95].
However, the results are ambiguous and sensitive to the method chosen. Hence the 2D
ĺ3D transition in neutral Aun is predicted to occur somewhere between n=13 and 15.
Similar trends are found for the cationic and anionic gold species [89, 96]. The strong
relativistic and spin-orbit (SO) coupling effects in gold make it theoretically very
challenging to determine the true global minimum structures of even relatively small
gold clusters. Therefore, state-of-the-art experimental data, in conjunction with
extensive theoretical studies, are needed in order to obtain unequivocal structural
information of gold clusters.
Experimentally, the first molecular-beam experiment was conducted on gold clusters
using a liquid metal ion source to generate small singly and doubly charged cluster
cations. The ion-intensity distributions showed structure dependence on size [97, 98].
The experimental photoelectron spectra (PES) of Aun have been reported by Taylor et
al. [99]. Nowadays a number of modern experimental techniques have been used to
study size-selected gold clusters, such as ion mobility [64], photoelectron
spectroscopy (PES) [56, 100], infrared multiphoton dissociation spectroscopy [53,
102], and trapped ion electron diffraction (TIED)[103, 104]. Recently, using Ar-
tagging, the coexistence of both the 2D and 3D isomers in the cluster beam of Au12-
has been shown and also obtained isomer-specific photoelectron spectra for this
critical cluster [105].
14
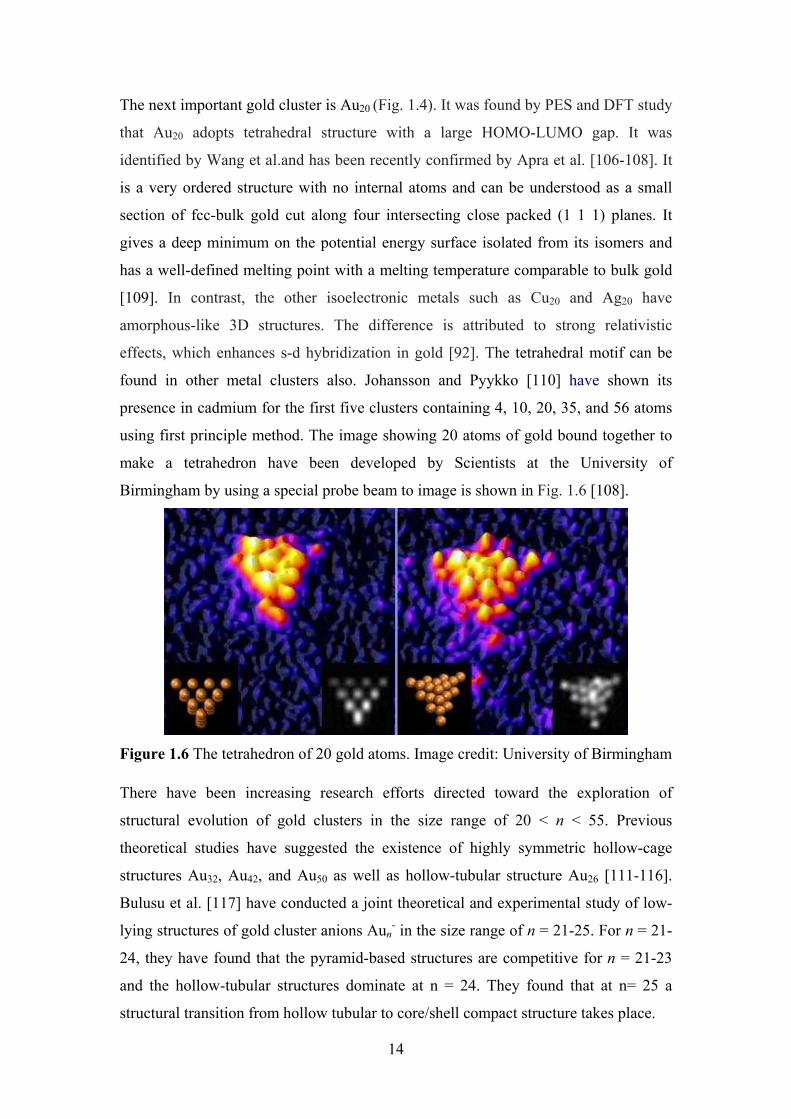
The next important gold cluster is Au20 (Fig. 1.4). It was found by PES and DFT study
that Au20 adopts tetrahedral structure with a large HOMO-LUMO gap. It was
identified by Wang et al.and has been recently confirmed by Apra et al. [106-108]. It
is a very ordered structure with no internal atoms and can be understood as a small
section of fcc-bulk gold cut along four intersecting close packed (1 1 1) planes. It
gives a deep minimum on the potential energy surface isolated from its isomers and
has a well-defined melting point with a melting temperature comparable to bulk gold
[109]. In contrast, the other isoelectronic metals such as Cu20 and Ag20 have
amorphous-like 3D structures. The difference is attributed to strong relativistic
effects, which enhances s-d hybridization in gold [92]. The tetrahedral motif can be
found in other metal clusters also. Johansson and Pyykko [110] have shown its
presence in cadmium for the first five clusters containing 4, 10, 20, 35, and 56 atoms
using first principle method. The image showing 20 atoms of gold bound together to
make a tetrahedron have been developed by Scientists at the University of
Birmingham by using a special probe beam to image is shown in Fig. 1.6 [108].
Figure 1.6 The tetrahedron of 20 gold atoms. Image credit: University of Birmingham
There have been increasing research efforts directed toward the exploration of
structural evolution of gold clusters in the size range of 20 < n < 55. Previous
theoretical studies have suggested the existence of highly symmetric hollow-cage
structures Au32, Au42, and Au50 as well as hollow-tubular structure Au26 [111-116].
Bulusu et al. [117] have conducted a joint theoretical and experimental study of low-
lying structures of gold cluster anions Aun- in the size range of n = 21-25. For n = 21-
24, they have found that the pyramid-based structures are competitive for n = 21-23
and the hollow-tubular structures dominate at n = 24. They found that at n= 25 a
structural transition from hollow tubular to core/shell compact structure takes place.
15
The tubular structure of Au24 has been verified by Xing et al. and Zeng’s group with
different experimental techniques [117, 118]. The tubular Au24 structure can be used
to accommodate a guest atom to form a new kind of endohedral tubular gold cluster.
A joint experimental PES and theoretical study predicts a core/shell compact structure
for the anion Au32- [119]. The Au32 known as first gold fullerene, has an icosahedral
symmetry with a large energy gap of 1.56 eV. It has high stability and was predicted
theoretically by Gu et al. [112]. Another important gold clusters which has been
studied both experimentally and theoretically is Au55, so-called 'magic number'
cluster. It contains the right number of atoms for very stable geometries, making it
ideally suited to catalysis [120]. A catalyst consisting of 55 atoms a gold cluster was
developed by Lambert et al. is shown in Fig. 1.7 [120]. In PES study of Cu−n , Ag−n
and Au−n clusters with n =53-58, Hakkinen et al. have found that structure of Cu55-
and Ag55- exhibit icosahedral symmetry while Au55
- structures found to have lower
symmetry. This behavior is related to strong relativistic bonding effects in gold [121].
Figure 1.7 Showing catalytically active Au55 nano clusters
The Au72 using DFT and MP2 calculations, is shown to exist as a hollow nanosphere
having an Icosahedral symmetry. A recent study has shown that could [122]. As the
size increases, the gold cluster shows a more metallic behavior. As confirmed in a
recent study with the increase in size, the cage like structures is not favored in energy
owing to the low coordination [123].
In an experimental study of structure of 38, 75, 101, 146, 200, 225, and 459 Au
nanoclusters were found to consist of ordered core structures. For 38, 225, and 459
atom gold clusters were found to have fcc truncated octahedral motif while the rest
had the truncated decahedral motif [72, 124]. Currently there are no experimental
techniques that can determine the structure of a cluster directly and unambiguously.
16
This can be achieved using various theoretical methods. The current theoretical
approaches come with limitations which do not make it easy to predict the ground
state geometry with absolute certainty because clusters can have numerous low lying
isomers protected by energy barriers. As cluster size increases, the number of
structural isomers on the potential energy surface increases exponentially and search
for the ground state geometry becomes a very difficult task.
1.6 Doped Gold Clusters
Doping clusters with a foreign atom offers an additional dimensionality to fine tune
their structures and properties. The introduction of a dopant atom in a coinage metal
cluster can change its structural and electronic as well as magnetic properties and
improve their stability significantly [125-128]. To enhance the stability of gold
clusters and tailor their physical and chemical properties a large number of theoretical
and experimental studies have been carried out on Au clusters doped with various
dopants. These bimetallic clusters can have potential utility in new nanomaterials as
building blocks. There have been many studies of M@Aun clusters, especially for 3d
Transition metal impurity.
It all started with the prediction of a highly stable icosahedral cluster, constructed by
12 gold atoms with an encapsulated impurity atom at centre, M@Au12 (M = W, Ta−,
Re+) which was predicted by Pyykko and Runeberg and was later confirmed
experimentally [129, 130]. The stability of these gold-covered clusters has been
attributed to relativistic effects and aurophilic attractions [55]. Since then there have
been lot of theoretical studies on doping of gold clusters with different elements. The
electronic structure and magnetic properties of transition metal- doped Au clusters
M@Au6- (M = Ti, V, Cr) was investigated by Li et al. using PES and DFT
calculations [131].
A systematic investigation was carried out by Meng et al. [132] on the geometries and
electronic properties of 3d, 4d, and 5d impurity doped Au6 clusters by using
relativistic all electron DFT calculation. It was found that the ground state for all the
M@Au6 clusters is with transition metal atom placed at the centre of an Au6 ring.
As discussed earlier that Gold clusters with n up to 15 atoms have planar structures
and thereafter three-dimensional (3D) structures become favorable. It has been found
by introducing a suitable impurity in gold clusters we can have an early onset of 3D
structures. A magic magnetic cage cluster of gold, Gd@Au15 is found to be potential
candidate for cancer therapy and possessing a large magnetic moment of 7 µB could

17
be beneficial for magnetic resonance imaging [51]. With Gd doping, we find that the
GdAun clusters favor 3D structures beyond n=9 as their lowest in energy structure.
The magic number cluster containing 20 gold atoms (Au20) with tetrahedral pyramidal
structure is a highly stable and chemically inert cluster. A natural question to ask
would be how the high stability and chemical inertness associated with Au20 are
altered when it is doped with a metallic atom. Pal et al. [133] have studied the effect
of substitution by Ag and Cu atoms on the structural and electronic properties of gold
clusters using a combination of PES and DFT. They have found that overall effect of
the isoelectronic substitution is minor on the structures except that the dopant atoms
lower the symmetries of the doped clusters. The structural and electronic properties of
Au19X clusters doped with Li, Na, K, Rb, Cs, Cu, and Ag have been studied by
Ghanty et al. [134] using relativistic density functional theory. They found that
endohedrally doped Au19X clusters (X = Li, Na, and Cu) have binding energies
comparable to those of the corresponding exohedrally doped clusters while the
endohedrally doped cage-like structures of larger atoms (X = K, Rb, Cs, and Ag) are
found to be less stable than the corresponding exohedral structures.
Another group of interesting elements which would be doped in gold are the group 14
elements C, Si, Ge and Sn. Theoretical and experimental studies had already shown
that the Si and Ge as well as Sn atom doped into the sixteen-atom golden cage cannot
form a stable geometry. The dopant atom is found to be either exohedral (Ge and Sn)
or it becomes a part of the gold cage (Si) [135,136]. A detailed theoretical study of the
structural and electronic properties of CAuq16 (q = −1, 0) was conducted by Fa et al.
[137]. They have found that the endohedral structures of both neutral and anionic C-
doped gold clusters are not the most stable configurations but they rather are distorted
closed flat cages. In another theoretical study by Walter it is suggested that the
endohedral doping of the Au16 cage by Al or Si yields a geometrically robust,
tuneable oxidation and reduction agent [138]. While doping the hollow golden cage
Au16- with Si, Ge etc prefers an exohedral geometry, the Cu atom (or a Ag atom)
results in the endohedral cluster Cu@Au16- (or Ag@Au16
- ) causing little structural
deformation to the original golden cage [139]. Thus the doping of group 14 elements
may have different effect on the structural and other physical as well as chemical
properties of gold clusters in comparison with transition metal.
In this thesis effect of doping of different elements i.e, both transition elements and
18
group 14 elements on gold clusters will be investigated.
1.7 Gold Nanotube and Nanowires
To exploit the different size dependent properties of gold, efforts have focused on
creating nanostructures of various geometries such as nanorods [140,141], nanorings
[142], nanowires [143 ] where the controlled variation of dimensions has been shown
to permit the changes in different properties. Nanotubes have one of the highest aspect
ratios of any objects in nature. Their length can exceed several millimeters for
diameters down to less than a nanometer. Similar to CNT, the gold nanotube can be
made by rolling up a sheet of gold triangular lattice. The notation n, m denotes the
chiral vector C=na1+ma2 where a1 and a2 are the basis vectors of a two-dimensional
gold triangular lattice (Fig. 1.8). The (5, 5) gold nanotube has enough hollow space to
accommodate a monoatomic chain (MAC) inside and has been predicted to be the
most stable tube theoretically [144].
An experimental study using UHV-TEM has confirmed the formation of Pt and Au
single-wall nanotubes (SWNT). The Pt tubes were found to consist of 5 or 6 atomic
rows helically coiled around the axis of the tube [146] while gold’s SWNT was
observed to be composed of 5 helical strands [147]. Sen et al. have conducted a DFT
based study on the nanowires of different types of elements, such as alkali, simple,
transition and noble metals and inert gas atoms, having a stable structure made from
staggered pentagons with a linear chain passing through their centers.
Figure 1.8 The gold SWNTs obtained by cylindrical folding of the 2D triangular lattice. The tube circumference is |C|, and radius R = (n2 + m2 -nm)1/2 / |a1
2|, where n of tube are the helical strands and m defines the chirality.
19
They have found all nanowires of different elements except Xe, are metallic in the
pentagonal structure [148]. In another first principle study by Senger it was shown
that free-standing gold chiral (n, m) tubes with 3 ≤ n ≤ 5 are stable and exhibit novel
electronic and transport properties [149].
Figure 1.9 Tubular structures of gold [149]
One-dimensional nanowires or monoatomic chains (MAC’s) have also attracted much
attention in recent years because of their broad applications in different areas, such as
in nano-mechanical and nano electronic devices. Metallic nanowires with well-
defined structures several nanometres in size have been fabricated by using various
methods [150-153]. The formation of monoatomic chains of metal was observed and
studied by both experiments and MD simulations [154 - [156].
The freestanding MACs are metastable and hard to be used directly in application
[157]. So the application of MACs would require stabilizing them without
significantly changing their unique properties. One of the solutions could be to
encapsulate them into a stable tubular structure [158-161]. The strong tube-TM
interaction is expected to modulate the electronic structures of the guest atoms to
enhance their magnetic properties In an interesting DFT study by Zhu et al. of the
magnetic properties of gold nanotubes encapsulating transition metal (TM=Co and
Mn ) and monoatomic chains TM@Au , it is found that the TM chains can be
significantly stabilized with a gold nanotube coating [162].This work has motivated
us to study the encapsulation of MAC’s within a gold nanotube and study the changes
it brings in the different properties.
1.8 Work done and its scope
The present study gives an insight to the interesting world of gold nanostructure and
the effect of doping on it. The work involves the DFT study of structural and
electronic properties of pure gold clusters and gold clusters doped with different
impurities such as Cu, Ag, C, Si and Ge. We have also studied the tubular gold
20
structures, monoatomic chains of gold and finally presented a brief review on the
phonon dispersion of gold nanotube. A combination of semi empirical and first
principle approach is used to study the optimization of structures of gold clusters upto
14 atoms and study the relativistic effects on their geometry.
A detailed DFT study has been conducted on the changes in the structural and
electronic properties of gold nanostructure on doping them with transition elements
such as Cu and Ag and with group 14 elements such as C, Si and Ge. The size of gold
nanostructures studied lies over range of small clusters upto intermediate size i.e., 3 ≤
n ≤ 60. It is well known the properties of nanoclusters changes with size and with the
introduction of impurity atoms. It will be interesting to explore the changes in
structures and other related properties of gold nanoclusters for their application as
novel material.
1.9 Broad outline of the Thesis
A systematic study of gold nanoclusters, nanotubes and nanowires and the effect of
impurity on their structural and electronic properties have been conducted. The
computational methodology is a combination of a semi empirical approach and
density functional theory, which is used to study optimization of the geometrical
structure of pure gold clusters. Effect of doping of different foreign elements on the
structural, electronic and vibrational properties of gold clusters is studied using DFT.
In this thesis, we discuss some of the properties of doped nanostructures in detail.
In Chapter 1, gives the general introduction to different gold nanostructures and
discuss the effects of doping on the structural, physical and chemical properties of
these nanostructures. The work done in this field till date is also reviewed here in
details. The computational methodology used in our thesis is discussed in Chapter 2.
The Semi empirical approach- The Gupta potential and the first principle methods
based on density functional theory (DFT) have been employed for the calculations
carried out in this work The Chapter 3 addresses the issue of relativistic effects on
the low lying geometries of small gold clusters. The two approaches predict different
lowest geometries for gold clusters for n ≤ 13 .The GP predicts the early onset of 3D
geometries while the DFT predicts planar structures for n upto 13.
Chapter 4 gives a systematic DFT study of endohedral doping of Si and Ge atoms in
gold clusters. It is found that the doping of silicon and germanium atoms in Aun
clusters, results in early onset of 3D geometries. The binding energy per atom Aun+1
21
cluster shows an increase with the introduction of Si and Ge atoms. The binding
energy per atom of germanium doped clusters was found to be smaller than the
corresponding silicon doped gold clusters.
In Chapter 5 we have carried out a DFT study of M12@Au20 (M= C, Si and Ge)
clusters. Pure Au32 cage is found to be chemically inert with HOMO-LUMO gap of
1.59eV. It is seen on doping of Au32 cage the HOMO–LUMO gap reduces, making it
chemically reactive.
In Chapter 6, we have explored the effect of encapsulation of small chain of Cu and
Ag atoms within Au24 tubular cage. In general, the Cu doped Au24 tubular cages are
more stable than the Ag doped cages.
The Chapter 7 describes the results of our systematic study of structural and electronic
properties of of the tubular XMAuN (X= Si, Al and Au, M=3, 6, 9 and N= 24, 42, 60)
clusters. It was found that the encapsulations of Si and Al atoms do not destroy the
tubular frameworks of the gold host .
The Chapter 8 describes the DFT study of the stretching of small monoatomic
chains of gold and calculates their breaking force and modulus.The results were
compared with similar calculations done using GP.
In Chapter 9, we have presented an algebra based on calulation of force constants to
study the phonon dispersion relation for gold nanotube. Chapter 10 gives the
summary of the work done in this thesis and its future scope.
22
Bibliography
[1] P. Jr.Owens, Introduction to Nanotechnology, Wiley publications (2003).
[2] D. J. Wales, J. P. K. Doye, J. Phys. Chem. A 101, 5111 (1997).
[3] J. A. Alonso, Structure and Properties of Atomic Nanoclusters (Imperial College Press), London (2005).
[4] O. Echt et al., J. Chem. Soc. Faraday Trans. 86, 2411(1990).
[5] T. P. Martin, Physics Reports 273, 199(1996).
[6] J. Li, X. Li , H. J. Zhai, L. S. Wang, Science 7 , 299 , 5608 , 864-867 (2003).
[7] H. Ohnishi, Y. Kondo, K. Takayanagi, Nature 395, 780 (1998).
[8] A. I. Yanson, G. Rubio Bollinger, H. E. van den Brom, N. Agrait, J. M. van Ruitenbeek, Nature 395, 783 (1998).
[9] H. Hegger, K. Hecker, G. Reckziegel, A. Freimuth, B. Huckestein, M. Janssen, and R.Tuzinski, Phys. Rev. Lett. 77,3885 (1996).
[10] J. W. Kang, H. J. Hwang, J. Kor.Phys. Soc., 42, S708-S712 (2003).
[11] J.C. González, V. Rodrigues, J. Bettini, L. G. C. Rego, A. R. Rocha, P. Z. Coura, S. O. Dantas, F. Sato, D .S. Galvão, D. Ugarte , Phys. Rev. Lett.93, 126103 (2004).
[12] Y. J. Lee, M. Brandbyge, M. J. Puska, J. Taylor, K. Stokbro, and R. M. Nieminen, Phy. Rev. B 69, 125409 (2004).
[13] D. K. Avasthi , A. Kumar , R. Singhal, A. Tripathi, D. S. Misra, J Nanosci Nanotechnol. 10, 6, 3767-79 (2010).
[14] BritishMuseum,http://www.britishmuseum.org/explore/online_tours/museum and exhibition/theartofglass/thelycurguscup.aspx. (2012)
[15] M. Faraday, Philos. Trans. R. Soc. London 147, 145 (1857).
[16] G. Frens , Nat. Phys.Sci 241,20-22,(1973).
[17] Materials World, 11, 2, p.12-14 (2003).
[18] P .Mukherjee , R. Bhattacharya , N. Bone, Y. K. Lee , C. R. Patra, S. Wang, L. Lu, C. Secreto, P. C. Banerjee, M. J. Yaszemski , N. E. Kay, D. Mukhopadhyay , J. Nanobiotechnology 5, 4 (2007).
[19] C.W. C. Warren (Ed), Bio-Applications of Nanoparticles, Advances in Experimental Medicine and Biology 620, 207 (2007).
[20] G. Schmid, Y. P. Liu, M. Schumann , T. Raschke, C. Radehaus, Nano Lett. 1, 405 (2001.)
[21] G. Schmid, M. Bäumle, N. Beyer, Angew. Chem. 112, 187-189(2000); Angew. Chem. Int. Ed. 39, 181(2000).
[22] G. Schmid, N. Beyer, Eur. J. Inorg. Chem. 835 (2000).
[23] Th. Sawitowski, St. Franzka, N. Beyer, M. Levering, G. Schmid, Adv. Funct. Mater. 11, 169(2001).
23
[24] C. Burda, X. Chen, R. Narayanan, M. A. El-Sayed ,Chem. Rev. 105, 1025–1102 (2005).
[25] M. Grzelczak, J. Pérez-Juste, P. Mulvaney, L. M. Liz-Marzán, Chem. Soc. Rev. 37, 1783–1791 (2008).
[26] G. Periyasamy and F. Remacle, Nano Lett. 9, 3007–3011 (2009).
[27] D. I. Gittins, D. Bethell, D.J. Schiffrin, R.J. Nichols, Nature 408, 67(2000).
[28] J. Y. Ouyang, C. W. Chu, D. Sieves, Y. Yang, Appl. Phys. Lett. 86, 123507 (2005).
[29] C. Wang , C. Yu, Reviews in Analytical Chemistry 32, 1, 1–14 (2012).
[30] K. Saha, S. S. Agasti, C. Kim, X. Li, V. M. Rotello, Chem.Rev. 112, 2739−2779 (2012).
[31] H. Qian, M. Zhu, Z. Wu, R. Jin, Acc. Chem. Res. 45, 1470–1479 (2012).
[32] T. Tsukuda, Bull. Chem. Soc. Jpn. 85, 151–168 (2012).
[33] G. Li, R. Jin, Acc Chem Res. 46, 8, 1749-58 (2013).
[34] K. S. Pitzer, Acc. Chem. Res. 12 , 8 (1979).
[35] P. Pyykkö, Chem. Rev. 88, 563 (1988).
[36] P. Pyykko, J. P. Desclaux, Acc. Chem. Res. 12, 8, 276(1979).
[37] K. Pitzer, Accnts. Chem. Res. 12, 271(1979).
[38] N. Kaltsoyannis, J. Chem. Soc., Dalton Trans. 1 (1997).
[39] M. Jansen , Solid State Sciences 7 , 1464–1474(2005).
[40] R.P. Andres et al., Science 272, 1323 (1996).
[41] M. Valden, X. Lai and D.W. Goodman, Science 281, 5583, 1647(1998).
[42] S. Bulusu, X. C. Zeng, J. Chem. Phys. 125, 154303 (2006).
[43] J. Wang, G. Wang, and J. Zhao, Phys. Rev. B 66, 035418 (2002).
[44] M.J. Ford , B. Soul´e de Bas, M.B. Cortie, Materials Science and Engineering B 140, 177–181(2007).
[45] A. K. Murthy, R. J. Stover, A. U. Borwankar, G. D. Nie, S. Gourisankar, T. M. Truskett, K. V. Sokolov, K. P. Johnston, A.C. S. Nano 7,1(2013).
[46] Z. Li ,C. V . Ciobanu , J. Hu ,J. P. Palomares-Báez, J. L. Rodríguez-López, R. Richards , Phys. Chem. Chem. Phys. 13, 7 (2013).
[47] Z. Y. Li, N. P. Young, M. Di Vece, S. Palomba, R. E. Palmer, A. L. Bleloch, B. C. Curley, R. L. Johnston, J. Jiang, J. Yuan, Nature (Lett.) 451, 46 (2008).
[48] F. Weigend and R. Ahlrichs, Phil. Trans. R. Soc. A 368, 1245 (2010).
[49] K. Clemenger, Phys. Rev. B 32, 1359 (1985).
[50] B. Yoon, P. Koskinen, B. Huber, O. Kostko, B. von Issendorff, H. Häkkinen, M. Moseler, U. Landman,Chem Phys Chem 8, 157 (2007).
[51] B. D. Yadav, V. Kumar, Phys. Lett. 97, 133701 ( 2010).
24
[52] D. M. P. Mingos, Y. Slee, Z. Lin, Chem Rev 90, 383(1990).
[53] P. Gruene, D. M. Rayner, B. Redlich, A. F. G. Van der Meer, J. T. Lyon, G. Meijer, A. Fielicke, Science 321, 674 (2008).
[54] H.F. Zhang, M. Stender, R. Zhang, C. Wang, J. Li, L. S. Wang, J. Phys. Chem. B 108, 12259 (2004).
[55] P. Pyykko, Angew. Chem. Int. Ed. 43, 4412–4456 (2004).
[56] H. Hakkinen, B. Yoon, U. Landman, X. Li, H. J. Zhai, L.S. Wang, J. Phys. Chem. A 107, 6168 (2003).
[57] Y. Gao, W. Huang, J. Woodford, L.S. Wang, X.C. Zeng, J. Am. Chem. Soc. 131, 9484 (2009).
[58] T.G. Schaaff, W.G. Cullen, P.N. First, I. Vezmar, R.L. Whetten, W.G. Cullen, P.N. First, C. Gutieerez-Wing, J.Ascensio, M.J. Jose-Yacama, J. Phys. Chem. 101, 7885 (1997).
[59] K. Koga, H. Takeo, T. Ikeda, K.I. Ohshima, Phys. Rev. B 57, 4053 (1998).
[60] C.L. Cleveland, U. Landman, T.G. Schaaff, M.N. Shafigullin, P.W. Stephens, R.L. Whetten, Phys. Rev. Lett. 79, 1873 (1997).
[61] B. Palpant, B. Prevel, J. Lerme, E. Cottancin, M. Pellarin, M. Treilleux, A. Perez, J.L. Vialle, M. Broyer, Phys. Rev. B 57, 1963 (1998).
[62] B.H. Hess, U. Kaldor, J. Phys. Chem. 112, 1809 (2000).
[63] M.A. Omary, M.A. Rawashdeh-Omary, C.C. Chusuei, J.P. Fackler, P.S. Bagus, J. Chem. Phys. 114, 10695(2001).
[64] F. Furche, R. Ahlrichs, P. Weiss, C. Jacob, S. Gib, T. Bierweiler, M. Kappes, J. Chem. Phys. 117, 6982 (2002).
[65] Z. Zhang, A. Berg, H. Levanon, R. Fessenden, W.D. Meisel, J. Am. Chem. Soc. 125, 7959 (2003).
[66] J. Zheng, J.T. Petty, R.M. Dickson, J. Am. Chem. Soc. 125, 7780 (2003).
[67] J. Li, X. Li, H.J. Zhai, L.S.Wang, Science 299, 864 (2003).
[68] J. Wang, G. Wan, J. Zhao, Phys. Rev. B 66, 035418-1–035418-6. (2002).
[69] J. Zhao, J. Yang, J.G. Hou, Phys. Rev. B 67, 085404 (2003).
[70] K. Sugawara, F. Sobott, A.B. Vakhtin, J. Chem. Phys. 118, 7808 (2003).
[71] R.L. Whetten, J.T. Khoury, M.M. Alvarez, S. Murthy, I. Vezmar, Z.L. Wang, P.W. Stephens, C.L. Cleveland, W.D. Luedtke, U. Landman, Adv. Mater. 8, 428 (1996).
[72] M.M. Alvarez, J.T. Khoury, T.G. Schaa, W. Shagullin, I. Vezmar, R.L. Whetten, Chem. Phys. Lett. 266, 91(1997).
[73] N.T. Wilson and R.L. Johnston, Eur. Phys. J. D 12, 161-169 (2000).
[74] J.P.K. Doye, D.J. Wales, New J. Chem. 22 ,733–744(1998).
[75] P. M. Morse, Phys. Rev. 34, 57 (1929).
25
[76] A.W. Jasper, N.E. Schultz, D.G. Truhlar, J. Phys. Chem. B 109, 3915–3920 (2005).
[77] X. Wu, S. Chen, Y. Sun, Y. Chen, Computational and Theoretical Chemistry 1002, 43–48 (2012).
[78] T. Pawluk, L. Xiao, J. Yukna, L.C. Wang, J. Chem. Theory Comput. 3, 328–335(2007).
[79] I. L. Garzon, K. Michaelian, M.R. Belran, A. Posada-Amarillas, P. Ordejon, E. Artacho, D. Sanchez-Portal, J.M. Soler, Phys. Rev. Lett. 81, 1600–1603(1998).
[80] I. L. Garzon, Alvaro Posada-Amarillas, Phys Rev B 54,16 (1996).
[81] Y.S. Shen, J.J. BelBruno, J. Phys. Chem. A 109, 512 (2005).
[82] J. Li, X. Li, H.-J. Zhai, L. S. Wang, Science 299, 864 (2003).
[83] G. Bravo-Pérez, I. L. Garzón, O. Novaro, J. Mol. Struct. THEOCHEM 493, 225 (1999).
[84] I.B. Bersuker, The Jahn-Teller Effect, Cambridge University Press (2006).
[85] A. Hermann, R.P. Krawczyk, M. Lein, P. Schwerdtfeger, I. P. Hamilton, J.J.P. Stewart, Phys. Rev. A 76, 013202(2007).
[86] H. Hakkinen, M. Moseler, and U. Landman, Physical Review Letters 89, 033401-1–033401-4 (2002).
[87] A. V. Walker, J. Chem. Phys. 122, 094310 (2005).
[88] H. Häkkinen , U. Landman, Phys. Rev. B 62, R2287 (2000).
[89] F. Remacle, E. S. Kryachko, J. Chem. Phys. 122, 044304 (2005).
[90] V. Bonačić-Koutecký, J. Burda, R. Mitrić, M. Ge, G. Zampella, P. Fantucci, J. Chem. Phys. 117, 3120 (2002).
[91] A. Castro, M. A. L. Marques, A. H. Romero, M. J. T. Oliveira, A. Rubio, J. Chem. Phys. 129, 144110 (2008).
[92] E. M. Fernandez, J. M. Soler, I. L. Garzón, L .C. Balbas, Phys. Rev. B – Condensed Matter, 70, 165403-1–165403-14 (2004).
[93] P. Koskinen, H. Hakkinen, B. Huber, B. von Issendorff, M. Moseler , Phys. Rev. Lett. 98, 015701-1–015701(2007).
[94] M. P. Johansson, A. Lechtken, D. Schooss, M. M. Kappes, F. Furche, Phys. Rev. A 77, 053202 (2008)
[95] L. Xiao, B. Tollberg, X. Hu, L. Wang, J. Chem. Phys. 124, 114309 (2006)
[96] S. Gilb, P. Weis, F. Furche, R. Ahlrichs , M. M. Kappes , J. Chem. Phys. 116, 4094–4101(2002).
[97] P. Sudraud, C. Colliex, J. Vandewalle, J. Phys. Lett. 40, L207–L211(1979).
[98] W. D. Knight, K. Clemenger, W. A. de Heer, W. A. Saunders, M. Y. Chou, M .L. Cohen, Phys. Rev. Lett. 52, 2141–2143 (1984).
[99] K. J. Taylor, C. L. Pettiette-Hall, O. Cheshnovsky, R. E. Smalley, J. Chem. Phys. 96, 3319 – 3329(1992).
26
[100] C. Jackschath, I. Rabin, W. Schulze, B. Bunsen-Ges. 96, 1200 –1204(1992).
[101] H. Häkkinen, M. Moseler, O. Kostko, N. Morgner, M. A. Hoffmann, B. von Issendorff, Phys. Rev. Lett. 93 , 093401 (2004).
[102] L. Lin, P. Claes, P. Gruene, G. Meijer, A. Fielicke, M. T. Nguyen, P. Lievens, Chem Phys Chem . 11 , 1932 (2010).
[103] A. Lechtken, C. Neiss, M. M. Kappes, D. Schooss, Phys. Chem. Chem.Phys. 11, 4344 (2009).
[104] L. M. Wang, J. Bai, A. Lechtken, W. Huang, D. Schooss, M. M. Kappes, X. C. Zeng, L. S. Wang, Phys. Rev.B, 79 , 033413 (2009).
[105] W. Huang , L. S. Wang, Phys. Rev. Lett.102, 153401 (2009).
[106] J. Li, X. Li, H. J. Zhai, L. S. Wang, Science, 299, 864–867 (2003).
[107] E. S. Kryachko, F. Remacle, Int. J. Quant. Chem. 107, 2922–2934 (2007).
[108] (a) E. Apra, R. Ferrando, A. Fortunelli, Phys. Rev. B - Condensed Matter, 73, 205414-1–205414-5 (2006) ; (b) Z. W. Wang , R. E. Palmer, Nanoscale 4, 4947-4949 (2012).
[109] B. Soul´e de Bas, M.J. Ford, M.B. Cortie, J. Phys.: Condens. Matter 18, 55–74 (2006).
[110] M.P. Johansson, P. Pyykko, Phys. Chem. Chem. Phys. 6, 2907–2909(2004).
[111] M. P Johansson, D. Sundholm, J. Vaara, Angew. Chem. Int. Ed. 43, 2678 ( 2004).
[112] X. Gu, M. Ji, S. H. Wei, X. G. Gong, Phys. Rev. B. 70, 205401(2004).
[113] Y. Gao, X. C. Zeng, J. Am. Chem. Soc. 127, 3698 (2005).
[114] J. Wang, J. Jellinek, J. Zhao, Z. Chen, R. B. King, P.V.R. Schleyer, J. Phys. Chem A, 109, 9265 (2005).
[115] E. M. Fernandez, J. M Soler, L. C Balbas, Phys. ReV. B. 73, 235433(2006).
[116] W. Fa, J. Dong, J. Chem. Phys. 124, 114310(2006) .
[117] S. Bulusu, X. Li, L. S. Wang, X. C. Zeng, J. Phys. Chem. C, 111, 4190-4198 (2007).
[118] X. P Xing, B Yoon, U. Landman, J. H. Parks, Phys. ReV. B, 74, 165423 (2006).
[119] M. Ji, X. Gu, X. Li, X. Gong, J. Li, L. S. Wang, Angew. Chem. Int. Ed 44, 7119 (2005).
[120] (a) M. Turner , V B Golovko, O P Vaughan , P Abdulkin , A. Berenguer-Murcia M S Tikhov , B F Johnson , R M Lambert , Nature. 454, 7207, 981-3 (2008); (b) M. Turner, V. B. Golovko, O. P. H. Vaughan, P. Abdulkin, A. Berenguer-Murcia, M. S. Tikhov, B. F. G. Johnson, R. M. Lambert, doi:10.1038/nature07194 (2008).
[121] H.Hakkinen, M.Moseler, O.Kostko, N. Morgner, M.Astruc Hoffmann, B.V. Issendorff, arXiv:cond-mat/0404184 [cond-mat.other]
27
[122] A. J. Karttunen, M. Linnolahti, T A Pakkanen, P. Pyykko, Chem. Comm. 4, 465–467(2008).
[123] M. P. Johansson, J. Vaara, D. Sundholm, J. Phys. Chem. C 112, 19311 (2008).
[124] C. L. Cleveland, U. Landman, M. N. Shafigullin, P. W. Stephens, and R. L. Whetten, Z. Phys. D 40, 503 (1997).
[125] D .W Yuan, Y Wang, Z. Zeng, J. Chem. Phys. 122, 114310 (2005).
[126] Q. Sun, Q Wang, J Z .Yu, Z Q Li, J T Wang, J.Phys. 7 1233 (1997).
[127] M B Torres, E M Fernandez, L C Balbas, Phys. Rev. B 71 155412 (2005).
[128] S Y Wang, J Z Yu, H Mizuseki, Q Sun, C Y Wang, Y Kawazoe, Phys. Rev. B 70 ,165413 (2004).
[129] P.Pyykko,N. Runeberg, Angew. Chem. 114, 2278 (2002); P.Pyykko, N Runeberg,. Angew. Chem., Int. Ed. 41, 2174( 2002).
[130] X. Li, B. Kiran, J. Li, H. J. Zhai, L. S. Wang, Angew. Chem. Int. Ed. 41, 4786 (2002).
[131] X . Li, B. Kiran, L. F Cui, L. S. Wang, Phys. ReV. Lett, 95, 253401(2005).
[132] Z. Meng , F. X. Juan , Z. L. Xia, H. L. Ming, L. Y. Hua, Chin. Phys. B 19, 4 043103 (2010).
[133] R. Pal, L. M. Wang, Wei Huang, Lai-Sheng Wang, Xiao Cheng Zeng, J. Chem. Phys. 134, 054306 (2011).
[134] T K Ghanty, A. Banerjee, A. Chakrabarti, J .Phy. Chem. C 114, 20-27 (2010).
[135] L. Wang, S. Bulusu, W. Huang, R. Pal, L.S. Wang, X.C. Zeng, J. Am. Chem.
Soc. 129, 15136(2007).
[136] Q. Sun, Q. Wang, G. Chen, P. Jena, J. Chem. Phys. 127, 214706(2007).
[137] F. Wei , Y.Aping , Phys. Lett. A 372, 6392–6395(2008).
[138] M. Walter, H. Ha kkinen, Phys. Chem. Chem. Phys. 8, 5407–5411(2006).
[139] L. M Wang, S Bulusu, H. J Zhai, X. C Zeng, L. S. Wang, Angew. Chem., Int. Ed., 46, 2915(2007) .
[140] S. Link, M. A. El-SayedJ. Phys. Chem. B 103, 8410 (1999).
[141] H. W. Wang, C. F Shieh, H. Y Chen, W. C Shiu, B Russo, G. Cao, Nanotechnology 17, 2689–94 (2006).
[142] J. Aizpurua, P. Hanarp, D. S. Sutherland, M. Kall, G .W. Bryant, F. J. G. de Abajo Phys. Rev. Lett. 90, 057401 (2003).
[143] K. Takayangi, Y. Kondo, H. Ohnishi, Japan Soc. Appl.Phys. Int. 3, 3–8 (2001); Y Kondo and K Takayangi, Phys. Rev. Lett. 79, 3455(1997).
[144] R. T. Senger, S. Dag, S. Ciraci, Phys. Rev. Lett. 93, 196807 (2004).
[145] H. W. Wang, C. F.Shieh, H. Y. Chen, W. C. Shiu, B. Russo and G. Cao, Nanotechnology 17, 2689–2694(2006).
[146] Y. Oshima, H. Koizumi, K. Mouri, H. Hirayama, K. Takayanagi, and Y. Kondo, Phys. Rev. B 65, 121401(2002).
28
[147] Y. Oshima, A. Onga, K. Takayanagi, Phys. Rev. Lett. 91, 205503 (2003).
[148] P. Sen, O. Gulseren, T. Yildirim, I. P. Batra, and S. Ciraci, arXiv:cond-mat/0205313v1 [cond-mat.mtrl-sci] (2002).
[149] R. T. Senger, S. Dag, S. Ciraci, Turk J Phys 29, 269 – 276 (2005).
[150] T T Albrecht, J Schotter, G A Kastle, N Emley , Science 290 , 2126(2000).
[151] S Michotte, S M Tempfli, L Piraux, Appl. Phys. Lett. 82, 4119(2003).
[152] R Sordan, M Burghard, K Kern, Appl. Phys. Lett. 79, 2073(2001).
[153] Z Tang, N A Kotov, M Giersig, Science 297, 237(2002).
[154] P Z Coura, S B Legoas, A S Moreira, F Sato, V Rodrigues, S O Dantas, D Ugarte and D S Galvao , Nano lett. 4, 1187 (2004).
[155] E Z da Silva, A J R da Silva, A Fazzio, Phys. Rev. Lett. 87 256102(2001).
[156] J. I. Pascual, J. Mendez, J. Herrero-Gomez, A. M. Baro,N. Garcia, U. Landman, W. D. Luedtke, E. N. Bogachek,H. P. Cheng, Science 267, 1793 (1995).
[157] J. C. Tung, G. Y. Guo, Phys. Rev. B 76, 094413 (2007).
[158] M. Weissmann, G. García, M. Kiwi, R. Ramírez, C. C. Fu, Phys.Rev. B 73, 125435 (2006).
[159] H. Shiroishi, T. O. da, H. Sakashita, N. Fujima, Eur. Phys. J. D 43,129 (2007).
[160] L. Liu, S. Mu, S. Xie, W. Zhou, L. Song, D. Liu, S. Luo, Y. Xiang, Z.Zhang, X. Zhao, W. Mal, J. Shen, C. Wang, G. Wang, J. Phys. D 39, 3939 (2006).
[161] L. Guan, K. Suenaga, S. Okubo, T. Okazaki, S. Iijima, J. Am. Chem. Soc. 130, 2162 (2008).
[162] L. Zhu, J. Wang, F. Ding, J. Chem. Phys. 130, 064706 (2009).
29
Chapter 2
2. Computatoional Methodology
2.1 Introduction
A study of cluster structures can be termed as the study of stable structures as only
later can be used for practical applications of nanoparticles. Moreover, the structure
influences the different physical and electronic properties of the nanoparticles. .
The optimization of geometry is one of the central problems of cluster studies. A
cluster at a given finite temperature, with a given size and composition, can have
different structural states (isomers), that is, meta-stable states and the most stable state
(thermodynamic equilibrium structure) which can be described as local minima (LM)
and the global minimum (GM), respectively, on the potential energy surface. Solving
an optimization problem means finding the GM – the structural state having the
lowest potential energy, as well as low-lying LM. As the cluster size increases the
optimization becomes more difficult due to an exponential increase in the number of
minima with cluster size [1].
Two different approaches are used for the optimization problems: ab initio and non-ab
initio. The first principle or ab initio methods apply many-body quantum theories
such as Density Functional Theory (DFT) to calculate the properties of a system from
first principles with no parameterization. Despite their high accuracy, ab initio
calculations for large clusters (consisting of hundred of atoms or more) are
computationally expensive [2]. The non-ab initio approach (i.e., the empirical or
semi- empirical approach) involves the use of empirical atomistic potentials which
have parameters fitted to experimental data.
There are two different models of atomistic potentials which are often used in cluster
studies: pair-wise potentials, such as the Morse potential and the Lennard-Jones, and
many-body potentials, such as the Gupta and Sutton-Chen potentials. The main
difference between the many-body potentials and pair wise potentials is that the
interaction between two atoms is not only dependent on two atoms, but also upon
their local environment. [1, 3, 4].
As discussed in the Chapter 1, we will be mainly studying gold clusters, nanotubes
and nanowires. We have used a combined empirical and ab initio approach to study
structural and energetic configurations of pure gold clusters.

30
Gupta potential (GP) have been widely employed to determine the different
configurations of gold nanoclusters of various size ranges [5, 6]. The empirical
approach is preferred in order to overcome the computational limitations imposed by
more computationally expensive first principles approaches The GP is suitable and
versatile for modeling noble and quasi-noble metals. However, in order to study
electronic effects on the structure, it is important to verify the predictions of the GP
using first principles calculations i.e., Density Functional Theory (DFT) [7].
DFT methods are the most widely used ab initio methods in computational material
science and solid state physics due to their high accuracy and computational
efficiency (among the first-principle methods).Since we have used both GP and DFT
methods in our research, we will discuss both methods in details in the following
sections.
2.2 . Gupta Potential- The Semi Empirical approach
The potential energy of an N body system can be expanded in terms of interactions
involving up to N particles.
)(...123
2 1)3(
1)2()1()0( ____ N
N
N
i
N
ij
N
jk
ijk
N
i
N
ij
ij
N
i
i VVVVVV +++++= ∑∑∑∑∑∑− −
⟩ ⟩
−
⟩
(2.1)
)0(V denotes the background energy of the system, taken to be zero if there is no
external field acting on the system.
)1(iV is the energy of isolated atom i and is taken to be zero if the atom is in ground
state
)2(ijV is the two body interaction between atom i and j there are higher order terms
)(...123
N
NV involving all the particles of the system.
In pair potential only the interactions between pairs of particles are calculated and the
summation becomes [8]
( )ij
N
i
N
ij
ij rVV ∑∑−
= ⟩
=1
1
(2.2)
where ( )ijij rV denotes that the functional form of the potential is dependent on the
interparticle separation, rij. The effect of the changes in the electron density which
causes the binding between the two atoms has been averaged into a functional form,
Vij, which approximates the interactions within the system.
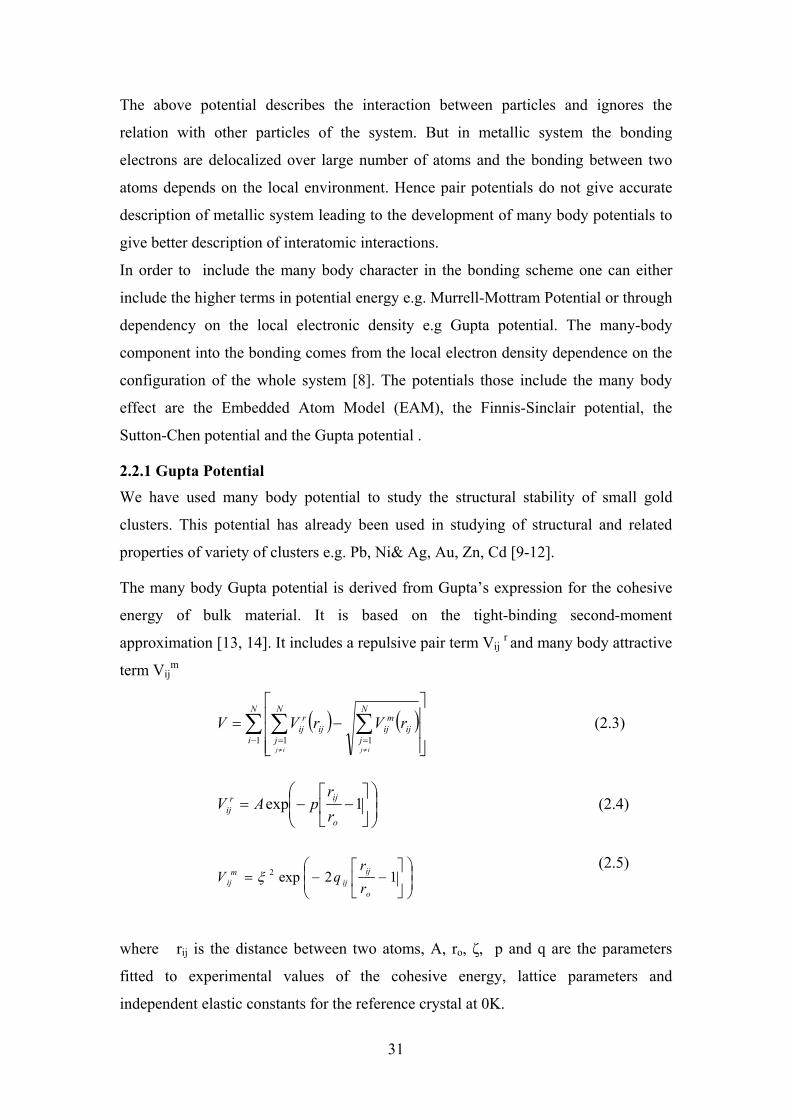
31
The above potential describes the interaction between particles and ignores the
relation with other particles of the system. But in metallic system the bonding
electrons are delocalized over large number of atoms and the bonding between two
atoms depends on the local environment. Hence pair potentials do not give accurate
description of metallic system leading to the development of many body potentials to
give better description of interatomic interactions.
In order to include the many body character in the bonding scheme one can either
include the higher terms in potential energy e.g. Murrell-Mottram Potential or through
dependency on the local electronic density e.g Gupta potential. The many-body
component into the bonding comes from the local electron density dependence on the
configuration of the whole system [8]. The potentials those include the many body
effect are the Embedded Atom Model (EAM), the Finnis-Sinclair potential, the
Sutton-Chen potential and the Gupta potential .
2.2.1 Gupta Potential
We have used many body potential to study the structural stability of small gold
clusters. This potential has already been used in studying of structural and related
properties of variety of clusters e.g. Pb, Ni& Ag, Au, Zn, Cd [9-12].
The many body Gupta potential is derived from Gupta’s expression for the cohesive
energy of bulk material. It is based on the tight-binding second-moment
approximation [13, 14]. It includes a repulsive pair term Vij r and many body attractive
term Vijm
( ) ( )∑ ∑ ∑− = = ⎥
⎥⎥
⎦
⎤
⎢⎢⎢
⎣
⎡−=
≠ ≠
N
i
N
j
N
j
ij
m
ijij
r
ij
ij ij
rVrVV1 1 1
(2.3)
⎟⎟⎠
⎞⎜⎜⎝
⎛⎥⎦
⎤⎢⎣
⎡−−= 1exp
o
ijr
ijr
rpAV (2.4)
⎟⎟⎠
⎞⎜⎜⎝
⎛⎥⎦
⎤⎢⎣
⎡−−= 12exp2
o
ij
ij
m
ijr
rqV ξ
(2.5)
where rij is the distance between two atoms, A, ro, こ, p and q are the parameters
fitted to experimental values of the cohesive energy, lattice parameters and
independent elastic constants for the reference crystal at 0K.

32
The Gupta potential has been parameterized by Cleri and Rosato for a wide variety of
metals [14].
2.3. First Principle or Ab-initio methods
The semi empirical method discussed above relies on the experimental data rather
than theoretical information whereas the quantum mechanical methods (ab initio, or
first-principle method) do not use any empirically or experimentally derived
quantities. One of the limitations of the empirical-potential approach is that they
cannot tell us the electronic properties of a given material.
Various quantum chemistry techniques are used in materials science for performing
the electronic structure calculations and can simulate systems composed of small
molecules to one thousand atoms up. We can have different quantum mechanical
methods such as Hartree Fock method, DFT. The methods involve solving of many
electron Schrödinger equation.
The time-independent, non-relativistic Schrödinger equation for a system of N
interacting electrons, (in atomic units):
(2.6)
where ね is a true many-body wave function of the system which depends on each of
the spatial coordinates of each of the N electrons; E is the eigen ground state energy
of the electrons; ri, RI are the sets of electronic and ionic coordinates with indices i
and I representing all electrons and ions respectively.
The Hamiltonian for interacting electrons in a many-body system is given by,
(2.7)
where ZI and MI are ionic charges and ionic masses, m is the mass of electron.
1st term represents the kinetic energy of each electron,
2nd term represents the kinetic energy of ions or nuclei
3rd term is the interaction energy between different electrons or Hartree term
VH,
4th term is the potential acting on each electron due to the atomic nuclei,
and 5th term is the interaction energy between ions.
It is very difficult to solve the many-body Schrödinger equation (2.6) and the
respective Hamiltonian (2.7), because of the large difference between the masses of
{ }{ }( ) { }{ }( )iIiI rRErRHrrrr
,, Ψ=Ψ∧
∑∑∑∑∑ −+
−−
−+∇−∇−=
∧
JI JI
JI
iI iI
I
ji ji
I
I I
i
i RR
eZZ
rR
eZ
rr
e
MmH
,
2
,
2
,
22
22
2
2
1
2
1
22
hh
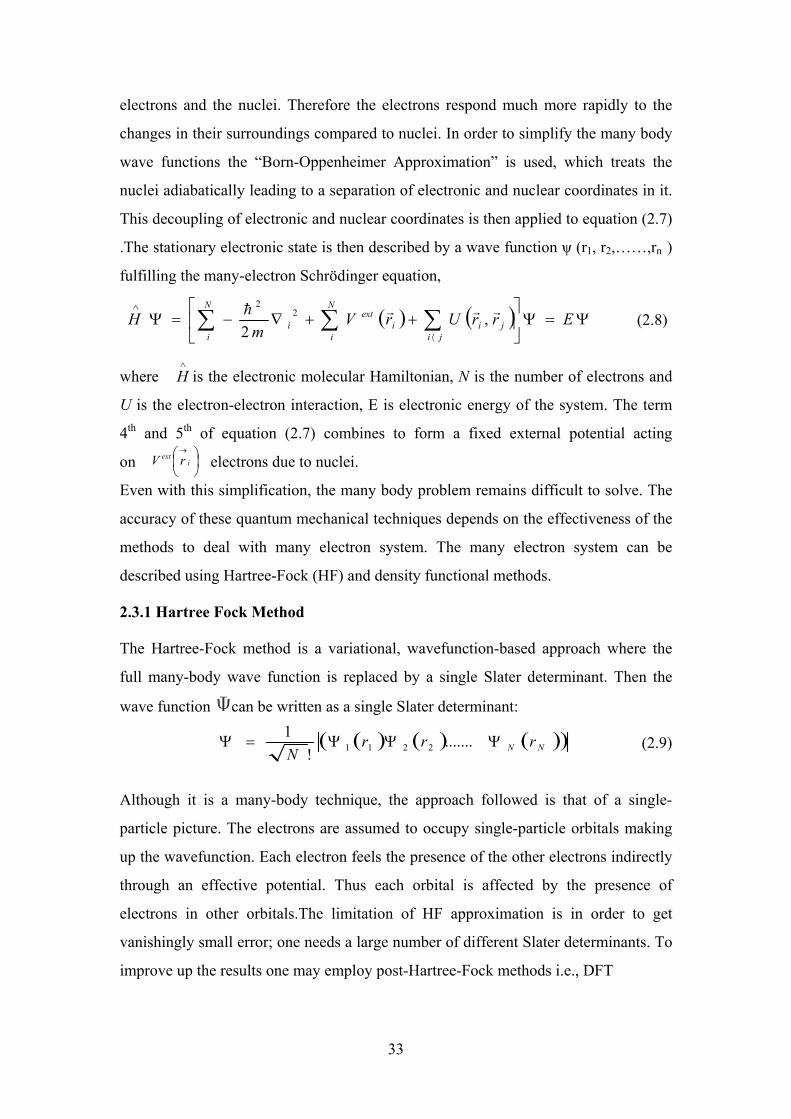
33
⎟⎠⎞
⎜⎝⎛→
iext rV
electrons and the nuclei. Therefore the electrons respond much more rapidly to the
changes in their surroundings compared to nuclei. In order to simplify the many body
wave functions the “Born-Oppenheimer Approximation” is used, which treats the
nuclei adiabatically leading to a separation of electronic and nuclear coordinates in it.
This decoupling of electronic and nuclear coordinates is then applied to equation (2.7)
.The stationary electronic state is then described by a wave function ね (r1, r2,……,rn )
fulfilling the many-electron Schrödinger equation,
( ) ( ) Ψ=Ψ⎥⎦
⎤⎢⎣
⎡++∇−=Ψ ∑∑∑
⟨
∧
ErrUrVm
Hji
ji
N
i
i
extN
i
i
rrrh,
22
2
(2.8)
where ∧
H is the electronic molecular Hamiltonian, N is the number of electrons and
U is the electron-electron interaction, E is electronic energy of the system. The term
4th and 5th of equation (2.7) combines to form a fixed external potential acting
on electrons due to nuclei.
Even with this simplification, the many body problem remains difficult to solve. The
accuracy of these quantum mechanical techniques depends on the effectiveness of the
methods to deal with many electron system. The many electron system can be
described using Hartree-Fock (HF) and density functional methods.
2.3.1 Hartree Fock Method
The Hartree-Fock method is a variational, wavefunction-based approach where the
full many-body wave function is replaced by a single Slater determinant. Then the
wave function can be written as a single Slater determinant:
(2.9)
Although it is a many-body technique, the approach followed is that of a single-
particle picture. The electrons are assumed to occupy single-particle orbitals making
up the wavefunction. Each electron feels the presence of the other electrons indirectly
through an effective potential. Thus each orbital is affected by the presence of
electrons in other orbitals.The limitation of HF approximation is in order to get
vanishingly small error; one needs a large number of different Slater determinants. To
improve up the results one may employ post-Hartree-Fock methods i.e., DFT
( ) ( ) ( )( )NN rrrN
ΨΨΨ=Ψ .......!
12211
34
2.3.2 Density Functional Theory (DFT)
Density functional theory is among the most popular and successful quantum
mechanical approaches applied to the matter. It determines the properties of a system
solely as a function of the electron density. It is widely used for the simulation of the
electronic structure of clusters, molecules and nanowires [15-17]. It can predict the
properties of the ground state of any system of electrons.
Density functional theory (DFT) allows the replacement of complicated N electron
wave function ね (r1, r2, ……, rn) and associated Schrödinger equation by simpler
electron density ( )rnr .
( ) ( ) ( )NNN rrrrrrrdrdrdNrn ....,....,..... 21213
23
13 ΨΨ= ∗∫∫∫
r (2.10)
The DFT formulism is based on two fundamental mathematical theorems proposed by
Kohn and Hohenberg in 1964 [18].
Theorem I: For any system of interacting particles in an external potential Vext (r), the
potential Vext(r) is uniquely determined, except for a constant, by the ground state
particle density no(r).
Theorem II: A universal functional for the energy E[n] in terms of the density n(r)
can be defined, which is valid for any external potential Vext(r). For any particular
Vext(r), the exact ground state of the system is the global minimum value of this
functional, and the density n(r) which minimizes the functional is the exact ground
state density no(r).Thus, one writes the total energy E of the system as a functional of
the charge density.
[ ] [ ] ( ) ( ) [ ] [ ]nEnVdrrnnVnTnE xcH
ext +++= ∫ (2.11)
where T is kinetic energy, V
ext is external potential acting on system including the
electron-nuclei interaction, VH is Hartree energy describing electron- electron
coulomb repulsion
VH =( ) ( ) '
'
'2
2drdr
rr
rnrne∫ −
(2.12)
and Exc is exchange-correlation energy because it contains contributions from the
Hartree-Fock (HF)-like exchange of electrons of same spin, and the correlation of the
individual electrons, due to Pauli repulsion. It was difficult to evaluate the kinetic
energy of electrons directly from charge density. The potential Vext and the total
energy E are universal but unknown functionals of the density.
35
Kohn and Sham (KS) [19] showed that there exists a mapping between the full
interacting problem and a one-particle problem, in which the one-particle
wavefunctions give the exact density. They suggested using single electron orbitals
wavefunctions ねi to define density as
( ) ( )2
,∑ ∑ Ψ=N
i s
i srrn (2.13)
where N is the number of electrons and kinetic energy of a system of non interacting
electrons with electron charge density as
( )[ ] i
N
i
im
rnT Ψ∇Ψ−= ∑ 22
2
h (2.14)
Kohn and Sham solved the variational problem of minimizing the energy functional
by applying the Lagrangian method of undetermined multipliers to equation (2.8).
The Schrödinger equation for N non interacting electrons moving in an effective
potential can now be written as
( ) ( ) ( ) ( )srsrrVsrm
iiieffi ,,,2
22
Ψ=Ψ+Ψ∇− εh (2.15)
where V eff is
( ) ( ) ( ) [ ]n
ndr
rr
rnerVrV xc
exteff δδΕ
+−
+= ∫ '
'
'2
(2.16)
These equations form the Kohn-Sham orbital equations. This system is then solved
iteratively, until self-consistency is reached. It starts with an initial guess for n(r), then
calculates the corresponding Veff and solves the Kohn-Sham equations for ( )sri ,Ψ .
From these one calculates a new density and starts again. This procedure is then
repeated until convergence is reached. The steps to achieve self consistency are
presented in form of a flowchart (see Fig. 2.1).
The main problem arises in solving equation (2.15), is how to approximate the
exchange correlation functional Exc[n]. One of the first approaches is the local density
approximation (LDA) [20]. It states that an inhomogeneous system is treated as
locally-homogeneous, and the functional is approximated as an integral of the local
functional ( )nxcε multiplied with the electron density, over the system volume and is
given by
[ ] ( ) ( ) rdrnnnE xcxc
3∫= ε (2.17)
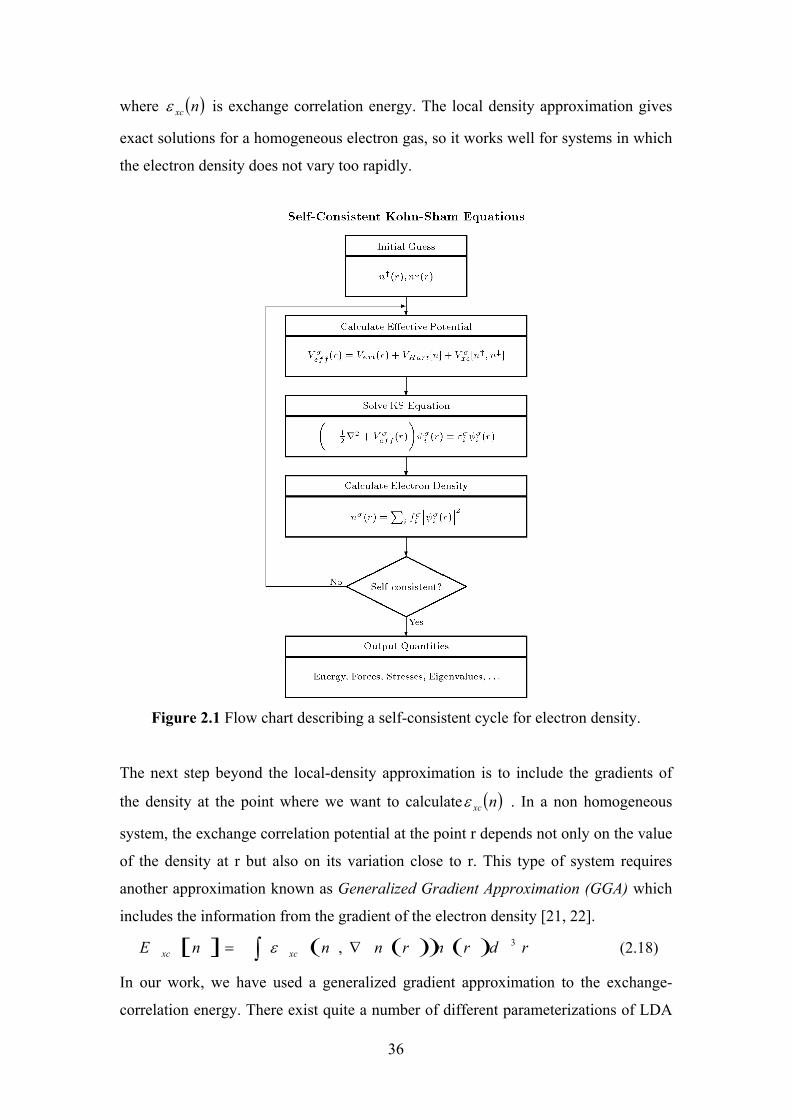
36
where ( )nxcε is exchange correlation energy. The local density approximation gives
exact solutions for a homogeneous electron gas, so it works well for systems in which
the electron density does not vary too rapidly.
Figure 2.1 Flow chart describing a self-consistent cycle for electron density.
The next step beyond the local-density approximation is to include the gradients of
the density at the point where we want to calculate ( )nxcε . In a non homogeneous
system, the exchange correlation potential at the point r depends not only on the value
of the density at r but also on its variation close to r. This type of system requires
another approximation known as Generalized Gradient Approximation (GGA) which
includes the information from the gradient of the electron density [21, 22].
[ ] ( )( ) ( ) rdrnrnnnE xcxc
3,∫ ∇= ε (2.18)
In our work, we have used a generalized gradient approximation to the exchange-
correlation energy. There exist quite a number of different parameterizations of LDA
37
and GGA. The local density approximation (LDA) with the Perdew - Zunger
parametrization of the correlation energy of a homogeneous electron gas was
calculated by Ceperley and Alder [23]. For GGA, two of the most widely used
functionals are the Perdew Wang functional (PW91) [24] and the Perdew- Burke-
Ernzerhof functional (PBE) [25].
Adding additional constraints to functionals of n, ∇ n, or the kinetic energy density,
one gets so-called meta- GGA [26, 27] approximations. For our research, we have
used both GGA-PBE and GGA- PW 91 for the parameterizations of the exchange-
correlation energy. It has been reported in a theoretical study that for the structures
and energies of gold clusters the GGA functionals provide overall better performance
than the LDA and hybrid GGA functionals [28].
2.4 Basis Function
Solving the Kohn-Sham equation (2.15) requires information about the molecular
orbitals which is represented by some sets of functions called the basis set. These
functions are usually atomic orbitals. There are different methods which propose
different basis functions and each method has its advantages and shortcomings at the
same time. Few of them are discussed here.
2.4.1 Linearized augmented plane wave (LAPW) basis
The linearized augmented planewave (LAPW) method [29] is used for solving the
equations of DFT. It is a variational expansion approach which approximates the
solutions as a finite linear combination of basis functions. Its methodology includes
the dividing the unit cell into two parts: spheres around each atom in which the wave
functions varies rapidly and are atomic-like; and the remaining interstitial region,
where the wave functions are not atomic-like and are much smoother. Each basis
function is defined as a plane wave in the interstitial region connected smoothly to a
linear combination of atomic-like functions in the spheres. The LAPW basis is
accurate and efficient for the solution of the all-electron ab initio electronic-structure
problem. However, it is computationally very expensive and is difficult to implement.
2.4.2 Plane wave (PW) method
The plane wave (PW) basis set is extensively used as it is easy to implement, uses
simple basis functions and allows systematic convergence. PW basis sets are often
38
used in combination with an 'effective core potential (ECP) ' or pseudo potential,
hence are only used to describe the valence charge density.
In PW basis set, the representation of Kohn Sham orbital would require a continuous,
and infinite, basis set. Applying the periodic boundary conditions, the orbital may be
written as
( ) ( ) rGki
G
kiki eGcr ).(,,
+∑=Ψ (2.19)
where the sum is over reciprocal lattice vectors G and k is a symmetry label which
lies within the first Brillouin zone.
The core electrons are concentrated very close to the atomic nuclei, therefore the
density gradients near the nuclei are not easily described by a plane-wave basis set, it
requires the use of very high energy cutoff
cut
e
Em
Gk≤
+22
2
h (2.20)
Thus, the convergence of the calculation with respect to basis set may be ensured by
variation of a single parameter, cutE . Thus PW offers a major advantage over many
other basis set choices, as the calculated properties often show extreme sensitivity to
small changes in basis set.The main disadvantage of the use of a PW basis set is it
requires a large number of basis functions to accurately represent the Kohn-Sham
orbitals.
2.4.3 Localized basis sets
The plane wave basis functions because of their extended nature over the whole
system cannot be used in linear-scaling calculations; hence a different choice has to
be made, in which the basis functions are localized in real-space. The different
representations of atomic orbitals are Gaussian type [30, 31], Slater type [32] and
numerical atomic orbitals [19, 33]. Numerical atomic orbital (NAO) are discussed in
detail in the following section:
Numerical atomic orbitals
Numerical atomic orbitals (NAO's) are best suited to linear scaling methods as they
are very flexible, strictly localized, and only few of them are required for accurate
39
results. The basis orbitals are products of spherical harmonics times numerical radial
functions centered on atoms:
( ) ⎟⎠⎞
⎜⎝⎛⎟
⎠
⎞⎜⎝
⎛=Φ∧→
IlmIIlmIlmn rYrRr (2. 21)
where, I is the index of the atom, m is the angular momentum quantum number, n is
the number of degenerate orbitals with same l and m, RIlm is the radial part describing
the degrees of freedom and Ylm denotes the spherical harmonics. The main features of
a basis set of atomic orbitals are:
Size: From the nomenclature of Quantum Chemistry, a hierarchy of basis sets is given
as first-つ, second- つ orbital, etc. A single- つ (also called minimal) basis set has one
radial function per angular momenta channel. Radial flexibility is obtained by adding
a second function per channel called as double- つ (DZ). The split valence scheme [34,
35, 36] is widely used to explain the basis sets and is applied to localized NAOs.
Range: Cutoff radii of orbitals or the strictly localized orbitals (zero beyond a cutoff
radius) are used in order to obtain sparse Hamiltonian and overlap matrices for linear
scaling. The accuracy and computational efficiency of the calculations depend upon
defining all the different cutoff radii for strictly localized orbitals by a single
parameter called "Energy Shift”. It is the energy raise suffered by the orbital when
confined defines all the cutoff radii [37].
Shape: The shape of the orbitals at larger radii depends on the cutoff radius and on
the localization of the orbitals. The first proposal was an infinite square-well potential
which has been widely used for minimal bases within the ab initio tight-binding
scheme of Sankey and collaborators [38]. A new soft confinement potential was later
proposed [18]. It is flat in the core region, starts of at some internal radius ri with all
derivatives continuous, and diverges at rc ensuring a strict localization .
For a given system and basis size, the range and shape of the orbitals are defined as
described above, depending on parameters: the energy is minimized with respect to all
of them.
2.5 Pseudopotential
Most of the physical properties of solids are dependent on the valence electrons and
the core electrons (though to much smaller extent). Since the core electrons are
relatively unaffected by the chemical environment of an atom, their contribution to
the total binding energy does not change when isolated atoms are brought together to
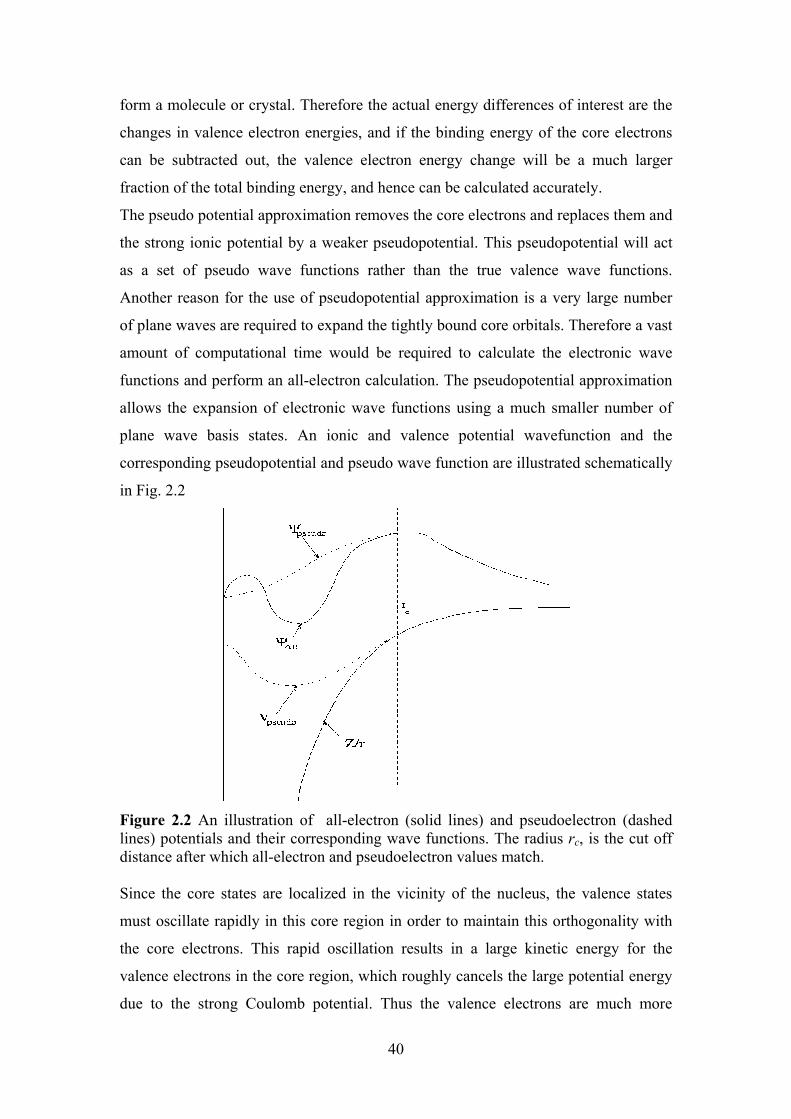
40
form a molecule or crystal. Therefore the actual energy differences of interest are the
changes in valence electron energies, and if the binding energy of the core electrons
can be subtracted out, the valence electron energy change will be a much larger
fraction of the total binding energy, and hence can be calculated accurately.
The pseudo potential approximation removes the core electrons and replaces them and
the strong ionic potential by a weaker pseudopotential. This pseudopotential will act
as a set of pseudo wave functions rather than the true valence wave functions.
Another reason for the use of pseudopotential approximation is a very large number
of plane waves are required to expand the tightly bound core orbitals. Therefore a vast
amount of computational time would be required to calculate the electronic wave
functions and perform an all-electron calculation. The pseudopotential approximation
allows the expansion of electronic wave functions using a much smaller number of
plane wave basis states. An ionic and valence potential wavefunction and the
corresponding pseudopotential and pseudo wave function are illustrated schematically
in Fig. 2.2
Figure 2.2 An illustration of all-electron (solid lines) and pseudoelectron (dashed lines) potentials and their corresponding wave functions. The radius rc, is the cut off distance after which all-electron and pseudoelectron values match. Since the core states are localized in the vicinity of the nucleus, the valence states
must oscillate rapidly in this core region in order to maintain this orthogonality with
the core electrons. This rapid oscillation results in a large kinetic energy for the
valence electrons in the core region, which roughly cancels the large potential energy
due to the strong Coulomb potential. Thus the valence electrons are much more
41
weakly bound than the core electrons. The pseudopotential is constructed in such a
way to replace the valence electron wave-functions, which oscillate rapidly in the core
region, by pseudo-wave-functions, which vary smoothly in the core region [39, 40]. It
can be from the graph that outside the core region the two potentials are identical, and
the scattering from the two potentials is indistinguishable.
The general form for pseudopotential is:
lmVlmV l
lm
∑=ln (2.22)
where, lm are the spherical harmonics and Vl is the pseudopotential for angular mo-
mentum l. A pseudopotential that uses the same potential for all the angular
momentum components of the wave function is called a local pseudopotential [44]. A
nonlocal pseudopotential uses a different potential for each angular momentum
component of the wave function. Local pseudopotentials are computationally much
more efficient than nonlocal ones.
A good pseudopotential must ensure that the integrals of the squared amplitudes of
the real and the pseudo wave functions inside the core regions are identical and are
equal outside the core region. This is achieved by using a non-local pseudopotential.
Pseudopotentials of this type are known as non-local norm-conserving
pseudopotentials and are the most transferable as they are capable of describing the
scattering properties of an ion in a variety of atomic environments.
The pseudopotential is not unique, therefore several methods of generation exists.
One of the methods was proposed by Troullier and Martin [41] which is further
transformed from a semi-local form into the fully non-local form by Kleinman and
Bylander (KB) [42]. Another approach was suggested by Vanderbilt [43], involves
relaxing the norm conservation requirement in order to generate much softer
pseudopotentials Ultrasoft pseudopotentials attain much smoother (softer) pseudo-
wave functions which use fewer plane-waves for calculations of the same accuracy.
This is achieved by relaxing the norm-conservation constraint, which offers greater
flexibility in the construction of the pseudo-wave functions. Other common
pseudopotentials commonly used in DFT calculations are Effective core potentials
(ECPs). The ECPs replaces the core electrons in a calculation with an effective
potential, thus eliminating the need for the core basis functions. In addition to
replacing the core, they are used to represent relativistic effects, which are largely
confined to the core.
42
Following points are to be kept in mind for constructing a pseudopotential
i. Choice of exchange-correlation potential (LDA or GGA ), relativistic or non
relativistic.
ii. Flavor for the pseudopotential construction (Troullier-Martins etc.).
iii. The valence shell electronic configuration of a free-atom.
iv. The choice of cut off radii, rc. If the value of rc is too large, its radial
behavior inside rc may be too different from that of the all-electron function.
On the contrary, setting rc too short may result in large fluctuations. So it is
appropriate to choose rc just beyond the last maximum of the all-electron
function.
v. Use of core correction is important if a non-negligible overlap occurs
between core and valence functions.
Pseudopotential must be tested before using since it is generated with just one specific
atomic configuration. A good pseudopotential should be transferable. In our
calculations, all the pseudopotentials were generated by the Troullier and Martins
method [41].
2.6 Computational Details
A large number of DFT based codes are available today. These include WEIN2k,
CRYSTAL, GAUSSIAN-09, VASP, ABINIT, PWSCF, SIESTA and many others.
The choice of a computational code will depend on the system under consideration
as some codes are better suited for particular type of problems and materials than
others. These computational codes can be broadly classified as - all-electron and
pseudopotential methods. WIEN2k, CRYSTAL, are all-electron methods, which take
into account, the wave functions of all electrons in each atom, from 1s upwards. On
the contrary, SIESTA, ABINIT, PWSCF, and VASP are pseudopotential methods. In
such methods, only valence electrons (some may include so-called semi- core states)
are explicitly included in the equations, whereas deep core states are excluded from
the treatment. This is usually accurate enough for describing chemical bonding,
equilibrium geometry, phonons etc. However, the properties like e.g. hyper fine field
at atom cores, isomer shift, electric field gradient which depends up on core electrons,
are not well explained.
43
Another important distinction is the choice of basis functions for expanding the
solutions of the Kohn-Sham equation. There are three different methods in this
regard: (i) those which use atom centered bases, and (ii) atom-independent ones such
as plane waves, and, (iii) hybrid methods, which combine numerical accuracy in intra
atomic regions with reasonable flexibility in the interatomic region. The codes like
CRYSTAL, SIESTA use atom-centered bases, commonly called tight-binding group
of methods; ABINIT, VASP use plane waves, and the basis in WIEN2k is a hybrid
one. Among the various methods discussed, we have used SIESTA code [45] and
VASP code for calculating all the structural, electronic and vibrational properties of
pure and doped gold clusters and nanotube structures.
2.6.1. SIESTA Code
SIESTA (Spanish Initiative for Electronic Simulation with thousands of atoms) is a
computational code based on DFT which calculates ground state properties of the
systems. This code does not perform many-electron wave calculations and deals with
electron density which is in many aspects good and reasonable bit is a single
determinant density. The computational cost for various ab initio quantum mechanical
codes scales as N3, with the number of atoms N, whereas SIESTA is one of the few
codes that scales only linearly with number of atoms i.e. "order-N method" [O(N)]
scaling.
SIESTA uses the standard Kohn-Sham self-consistent density functional method in
the local density (LDA-LSD) or generalized gradient (GGA) approximations. It
employs norm-conserving pseudopotentials in their fully non local (Kleinman-
Bylander) form. It uses atomic orbitals with finite support as a basis set, allowing
unlimited multiple-zeta and angular momenta, polarization and off-site orbitals. It has
some problems in describing Vander-Waals which has been overcome in the recent
versions interactions and hydrogen bonds. The ATOM program is provided with the
SIESTA code for pseudopotential generation. The various parameters such as cut off
radii used for generation pseudopotentials are provided in each respective Chapter.
The vibrational frequency analysis of the lowest enrgy geometries was done using the
VIBRA utility provided with SIESTA. It computes the force constants and
corresponding vibrational frequencies of a given geometry. A geometry is truly
optimized if the computed vibrational frequencies,
44
• have three acoustic modes with の < 0.1cm-1 and all other modes have positive
frequencies.
• if some are negative ones, this indicates bad initial lattice relaxation
2.6.2 VASP Code
VASP is a plane-wave all-electron code using the projector-augmented wave method
to describe the electron-core interaction. It was developed by Georg Kresse and his
coworkers [46-49]. The code uses fast iterative techniques for the diagonalization of
the DFT Hamiltonian and allows performing total-energy calculations and structural
optimizations for systems with thousands of atoms and ab initio molecular dynamics
simulations for ensembles with a few hundred atoms extending upto many thousands.
A comparative investigation of the performance of plane-wave (VASP) and local-
basis set methods (using the GAUSSIAN and SIESTA package) in structural studies
of small gold clusters was performed by Gruber et al.[50].They have concluded that
relatively lower binding energy of planar clusters provided by SIESTA and
GAUSSIAN03 which could be a consequence of a lower “effective quality” of the
basis set for systems .We have used VASP for the optimization of gold nanotubes.
2.7. Geometric Optimization
A geometry optimization procedure consists of sampling points on the potential
energy surface, searching for minima. The technique used to search for the minimum
is called the optimization algorithm. In principle, the cluster total energy Etot
corresponding to a certain structure gives the forces (using Hellmann –Fenyman
Theorem) [51]
R
EF
∂∂
−=r
(2.23)
and the energy is minimized by allowing the structure to relax to new equilibrium
position.
If the total energy does not reach an extremum, the forces will be non-zero and make
atoms move to a new structure. At an extremum, the forces vanish and a stationary
point is found. The structure will be accepted as a new optimized one if the extremum
is a minimum (local minimum). Different methods are provided within the
computational codes for geometrical optimization such as Monte Carlo, Conjugate
gradient method, Steepest descent method etc. We will explain the conjugate-gradient
technique.
45
2.7.1. Conjugate-gradients (CG) technique
The conjugate-gradients provide a simple and effective procedure for implementation
of minimization approach. The initial direction is taken to be the negative of the
gradient at the starting point. A subsequent conjugate direction is then constructed
from a linear combination of the new gradient and the previous direction that
minimized the function. This technique, the search direction is generated using
information about the function obtained from all the sampling points along the
conjugate gradients path. It is important, however, to implement the conjugate
gradients technique in such a way as to maximize the computational speed and to
minimize the memory requirement so that calculations are not limited by the available
memory.
2.8. Discussion and Conclusions
In this chapter, we have described the methodology applied in semi-empirical and
first principle methods to calculate the properties of nanomaterials. We have
discussed many body Gupta potential and density functional theory in detail as it
forms the basis of our work done in this thesis. By minimizing the total energy of the
system under consideration, the optimized geometries and related properties of
various structures have been calculated. It has been observed that the choice of
approach used effect the structural and electronic properties of nanoparticles.
46
Bibliography
[1] D. J. Wales, H. A. Scheraga, Science 285, 1368 (1999).
[2] R. L. Johnston, Dalton Trans. 4193 (2003).
[3] D. J. Wales, J. P. K. Doye, J. Phys. Chem. A 101, 5111 (1997).
[4] J. P. K. Doye, D. J. Wales, J. Chem. Soc., Faraday Trans. 93, 4233(1997).
[5] A. Bruma, R. Ismail, L. O. PazBorbon, H. Arslan, G. Barcaro, A. Fortunelli , Z. Y. Li , R. L. Johnston , Nanoscale 5, 646 (2013).
[6] D. T. Tran, R. L. Johnston, Proc. R. Soc. A 467, 2131, 2004-2019 (2011).
[7] R. Ferrando, A. Fortunelli, G. Rossi, Phys. Rev. B: Condens. Matter Mater. Phys. 72, 085449(2005).
[8] N. T. Wilson Thesis ‘The Structure and Dynamics of Noble Metal Clusters’ School of Chemistry, University of Birmingham (2000).
[9] J. P. K. Doye, Comp. Mater. Sci. 35, 227-231 (2006).
[10] K. Michaelian, N. Rendon, I. L. Garzon, Phys Rev B 60, 3 (1999).
[11] K. Michaelian, M. R. Beltran, I. L. Garzon, Phys Rev B 65, 041403(2002).
[12] I. L. Garzón , A. Posada-Amarillas, Phys. Rev. B 54, 11 796 (1996).
[13] R. P. Gupta, Phys. Rev. B 23, 6265 (1981).
[14] F. Cleri, V. Rosato, Phys. Rev. B 48, 22( 1993).
[15] A. I. Mares, A. F. Otte, L. G. Soukiassian, R. H. M. Smit, and J. M. van Ruitenbeek, Phys. Rev. B 70, 073401 (2004).
[16] P. Sen, O. Gulseren, T. Yildirim, I. P. Batra, S. Ciraci, Phys. Rev. B 65, 235433 (2002).
[17] P. K. Jain, Structural Chemistry 16, 4 (2005).
[18] P. Hohenburg and W. Kohn, Phys. Rev. B 136, 864 (1964).
[19] W. Kohn, L.J. Sham, Phys. Rev. 140, A 1133 - A 1138(1965).
[20] W. Kohn, Rev. Mod. Phys. 71, 1253 (1999).
[21] J. P. Perdew, Phys. Rev. Lett. 55, 1665(1985).
[22] J. P. Perdew, Phys. Rev. Lett. 55, 2370 (1985).
[23] D. M. Ceperley, B. J. Alder, Phys. Rev. Lett. 45, 566 (1980).
[24] J. P. Perdew, Y. Wang, Phys. Rev. B 45, 23 (1992).
[25] J. P. Perdew, K. Burke, M. Ernzerhof, Phys. Rev. Lett. 77, 38 (1996).
[26] M. Filatov and W. Thiel., Phys. Rev. A 57, 189- 199(1998).
[27] J.P. Perdew, S. Kurth, A. Zupan, and P. Blaha. , Phys. Rev. Lett. 82, 2544- 2547(1999).
[28] S. Ryu, H. W. Lee , Y. K. Han, Bull. Korean Chem. Soc. 32,8 (2011).
[29] D. Singh, Plane waves, pseudopotentials and the LAPW method, Kluwer
47
Academic (1994).
[30] M. C. Pyne, M. P. Teter, D.C. Arias, J. D. Joannopoulos, Rev. Mod. Phys. 64,
1045 (1992).
[31] K. N. Kudin, G. E. Scuseria, Phys. Rev. B 61, 16440 (2000).
[32] D. Sholl, J. A. Steckel, Density Functional Theory: A Practical Introduction Wiley-Interscience (2009).
[33] J. Junquera, Ó. Paz, D. Sánchez-Portal, E. Artacho, Phys. Rev. B 64, 235111 (2001) .
[34] S. Huzinaga, Computer Physics Reports 2, 279 (1985); S.Huzinaga et al. Elsevier Sci. Publ. Co., Amsterdam (1984).
[35] A. Szabo and N. Ostlund, Modern Quantum Chemistry, MacMillan, New York, (1982).
[36] E. Artacho, D. S anchez-Portal, P. Ordej on, A. Garćıa, J. M. Soler, Phys. Stat. Sol. (b) 215, 809 (1999).
[37] A. D. Becke, J. Chem. Phys. 98, 5648 (1993).
[38] O. F. Sankey, D. J. Niklewski, Phys. Rev. B. 40, 3979 (1989).
[39] J. C. Phillips, Phys. Rev. 112, 3, 685 (1958).
[40] J. C. Phillips, L. Kleinman., Phys. Rev. 116, 2, 287 (1959).
[41] N. Troullier, Jose Luıs Martins, Phys. Rev. B 43, 3 (1991).
[42] L. Kleinman, D. M. Bylander, Phys. Rev. Lett. 48, 20, 1425 (1982).
[43] D. Vanderbilt, Phys. Rev. B 41, 7892-7895 (1990).
[44] J. Harris, R.O. Jones. Phys. Rev. Lett. 41, 191(1978).
[45] http://departments.icmab.es/leem/siesta/About/overview.html
[46] G Kresse, J. Hafner, Phys. Rev. B 47, 558 (1993).
[47] G. Kresse, J. Furthmler Computat Mater Sci. 6, 15(1996).
[48] G. Kresse, J. Furthmler, Phys. Rev. B 54, 11 169(1996).
[49] G. Kresse, D. Joubert, Phys. Rev. B 59, 1758 (1999).
[50] M. Gruber, G. Heimel, L. Romaner, J. L. Bras, E. Zojer, Phys. Rev. B 77, 165411(2008).
[51] H.Hellmann,Einfuhrung in die Quntumchemie,Deuticke,Leipzig(1937).
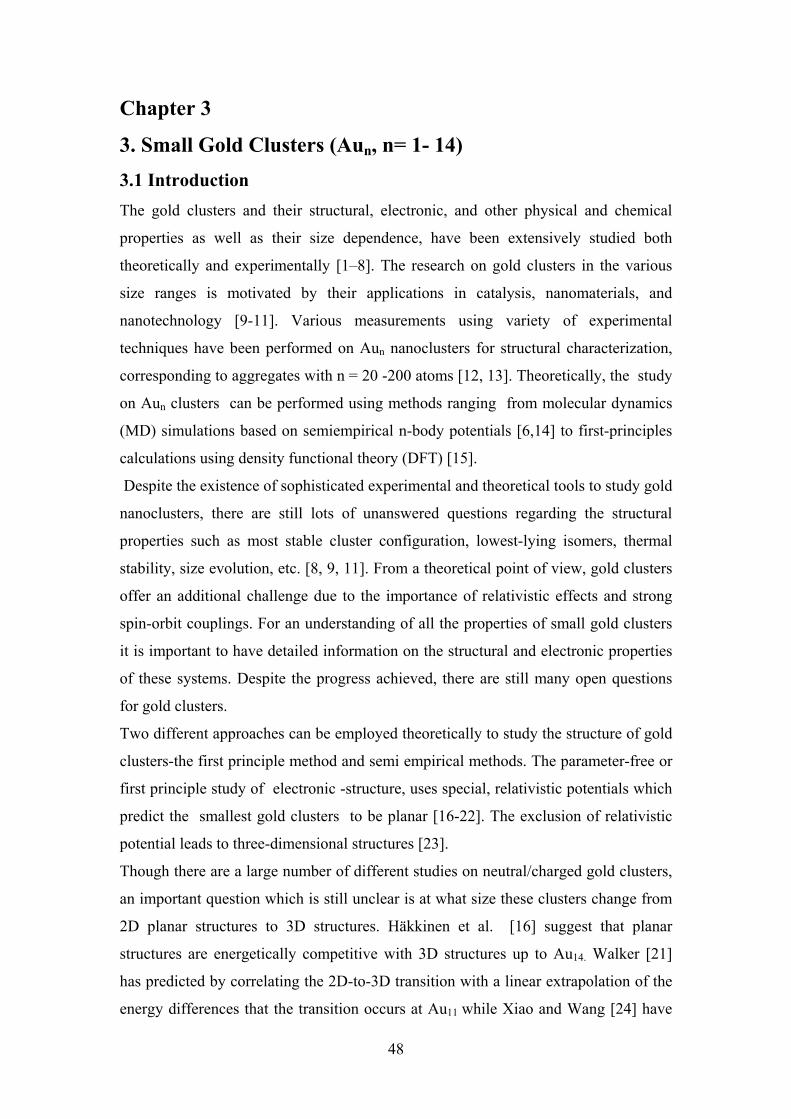
48
Chapter 3
3. Small Gold Clusters (Aun, n= 1- 14)
3.1 Introduction
The gold clusters and their structural, electronic, and other physical and chemical
properties as well as their size dependence, have been extensively studied both
theoretically and experimentally [1–8]. The research on gold clusters in the various
size ranges is motivated by their applications in catalysis, nanomaterials, and
nanotechnology [9-11]. Various measurements using variety of experimental
techniques have been performed on Aun nanoclusters for structural characterization,
corresponding to aggregates with n = 20 -200 atoms [12, 13]. Theoretically, the study
on Aun clusters can be performed using methods ranging from molecular dynamics
(MD) simulations based on semiempirical n-body potentials [6,14] to first-principles
calculations using density functional theory (DFT) [15].
Despite the existence of sophisticated experimental and theoretical tools to study gold
nanoclusters, there are still lots of unanswered questions regarding the structural
properties such as most stable cluster configuration, lowest-lying isomers, thermal
stability, size evolution, etc. [8, 9, 11]. From a theoretical point of view, gold clusters
offer an additional challenge due to the importance of relativistic effects and strong
spin-orbit couplings. For an understanding of all the properties of small gold clusters
it is important to have detailed information on the structural and electronic properties
of these systems. Despite the progress achieved, there are still many open questions
for gold clusters.
Two different approaches can be employed theoretically to study the structure of gold
clusters-the first principle method and semi empirical methods. The parameter-free or
first principle study of electronic -structure, uses special, relativistic potentials which
predict the smallest gold clusters to be planar [16-22]. The exclusion of relativistic
potential leads to three-dimensional structures [23].
Though there are a large number of different studies on neutral/charged gold clusters,
an important question which is still unclear is at what size these clusters change from
2D planar structures to 3D structures. Häkkinen et al. [16] suggest that planar
structures are energetically competitive with 3D structures up to Au14. Walker [21]
has predicted by correlating the 2D-to-3D transition with a linear extrapolation of the
energy differences that the transition occurs at Au11 while Xiao and Wang [24] have
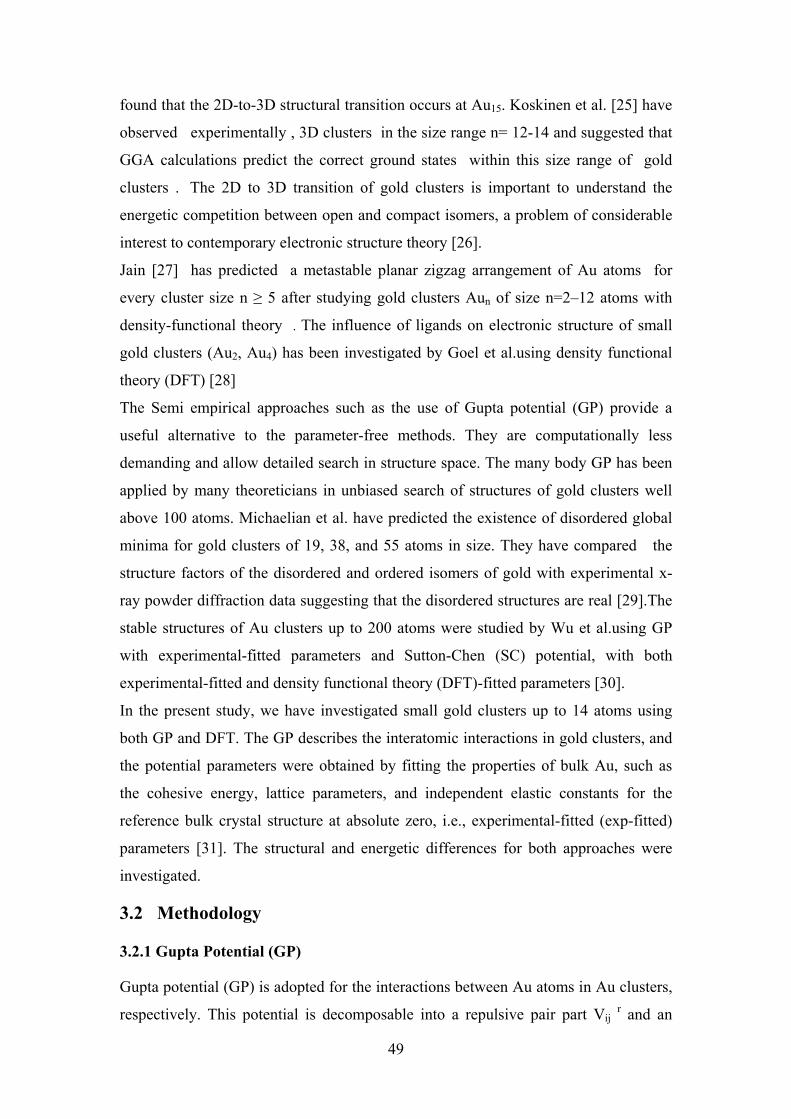
49
found that the 2D-to-3D structural transition occurs at Au15. Koskinen et al. [25] have
observed experimentally , 3D clusters in the size range n= 12-14 and suggested that
GGA calculations predict the correct ground states within this size range of gold
clusters . The 2D to 3D transition of gold clusters is important to understand the
energetic competition between open and compact isomers, a problem of considerable
interest to contemporary electronic structure theory [26].
Jain [27] has predicted a metastable planar zigzag arrangement of Au atoms for
every cluster size n ≥ 5 after studying gold clusters Aun of size n=2–12 atoms with
density-functional theory . The influence of ligands on electronic structure of small
gold clusters (Au2, Au4) has been investigated by Goel et al.using density functional
theory (DFT) [28]
The Semi empirical approaches such as the use of Gupta potential (GP) provide a
useful alternative to the parameter-free methods. They are computationally less
demanding and allow detailed search in structure space. The many body GP has been
applied by many theoreticians in unbiased search of structures of gold clusters well
above 100 atoms. Michaelian et al. have predicted the existence of disordered global
minima for gold clusters of 19, 38, and 55 atoms in size. They have compared the
structure factors of the disordered and ordered isomers of gold with experimental x-
ray powder diffraction data suggesting that the disordered structures are real [29].The
stable structures of Au clusters up to 200 atoms were studied by Wu et al.using GP
with experimental-fitted parameters and Sutton-Chen (SC) potential, with both
experimental-fitted and density functional theory (DFT)-fitted parameters [30].
In the present study, we have investigated small gold clusters up to 14 atoms using
both GP and DFT. The GP describes the interatomic interactions in gold clusters, and
the potential parameters were obtained by fitting the properties of bulk Au, such as
the cohesive energy, lattice parameters, and independent elastic constants for the
reference bulk crystal structure at absolute zero, i.e., experimental-fitted (exp-fitted)
parameters [31]. The structural and energetic differences for both approaches were
investigated.
3.2 Methodology
3.2.1 Gupta Potential (GP)
Gupta potential (GP) is adopted for the interactions between Au atoms in Au clusters,
respectively. This potential is decomposable into a repulsive pair part Vij r and an

50
attractive glue/many body term Vijm terms. The interaction potential of all (N) atoms
V can be depicted in the following form,
( ) ( )∑ ∑ ∑− = = ⎥
⎥⎥
⎦
⎤
⎢⎢⎢
⎣
⎡−=
≠ ≠
N
i
N
j
N
j
ij
m
ijij
r
ij
ij ij
rVrVV1 1 1
(3.1)
⎟⎟⎠
⎞⎜⎜⎝
⎛⎥⎦
⎤⎢⎣
⎡−−= 1exp
o
ijr
ijr
rpAV (3.2)
⎟⎟⎠
⎞⎜⎜⎝
⎛⎥⎦
⎤⎢⎣
⎡−−= 12exp2
o
ij
ij
m
ijr
rqV ξ (3.3)
where rij is the distance between two atoms with index i and j. The parameters A, ro,
こ, p and q are fitted to experimental values of the cohesive energy, lattice parameters
and independent elastic constants for the reference crystal at 0K. The values of the
parameters are provided in Table 3.1. The GP has been parameterized by Cleri and
Rosato [31] for a wide variety of metals.
Table 3.1 Parameters used in Gupta potential
A(eV) ȗ (eV) P q ro(Ao)
0.2061 1.790 10.229 4.036 2.884
3.2.2 Density Functional Theory (DFT)
We have used the well known Spanish Initiative for Electronic Simulation with
Thousands of Atoms computational (SIESTA) code, based on Density Functional
theory [32-35]. The electron density functional is treated by the generalized gradient
approximation (GGA) with exchange correlation functional parameterized by Perdew,
Zunger and Ernzerhof (PBE) scheme [36]. The core electrons are replaced by a non-
local norm conserving relativistic pseudopotential factorized by Kleimann-Bylander
form [37]. Relativistic pseudo potential for gold is generated with atomic valence
electron configurations 5d10 6s1. The core radii (in units of Å) for gold are as follows:
s (2.55), p (2.98), d (2.22), f (2.00). The valence states were described using DZP
(double-zeta + polarization) basis sets. The reciprocal space integrations are carried
out at the gamma point. The clusters are optimized inside a simulation cell of 20 ┭
and energy cutoff of 200 Ry. Geometry optimizations were performed with the
conjugate gradient algorithm and the geometries were considered to be optimized
when the forces were reduced upto 0.01 eV/Å.
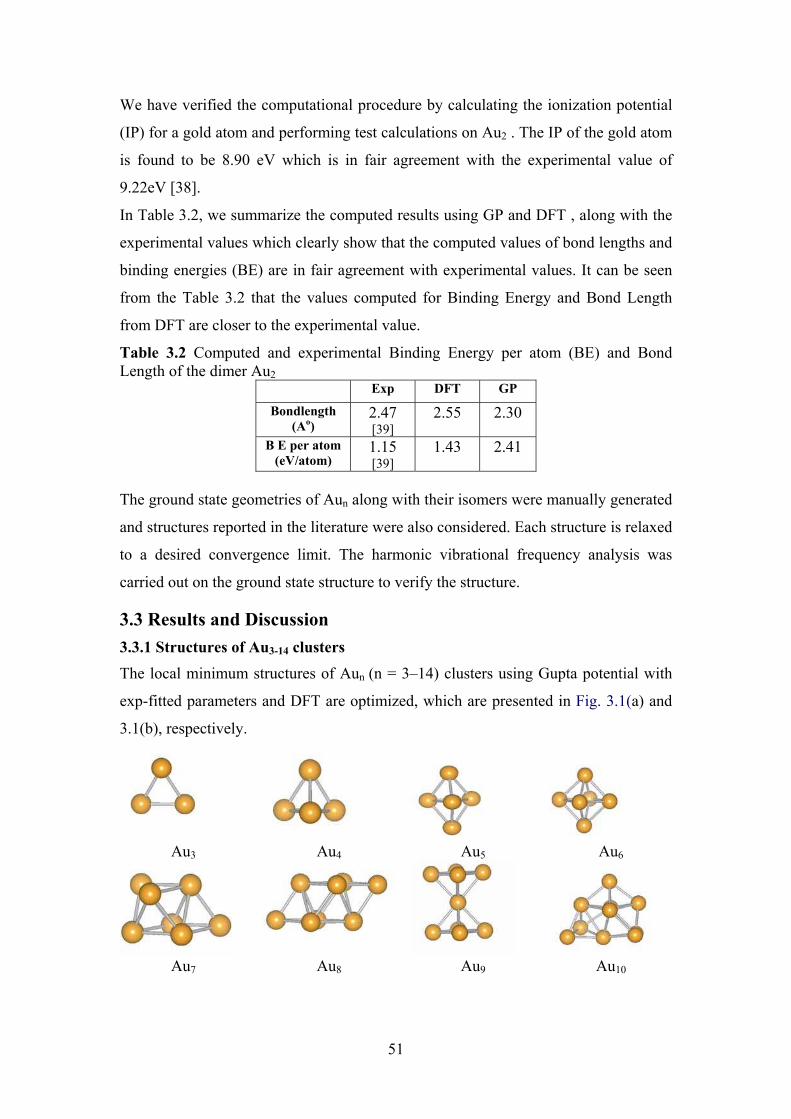
51
We have verified the computational procedure by calculating the ionization potential
(IP) for a gold atom and performing test calculations on Au2 . The IP of the gold atom
is found to be 8.90 eV which is in fair agreement with the experimental value of
9.22eV [38].
In Table 3.2, we summarize the computed results using GP and DFT , along with the
experimental values which clearly show that the computed values of bond lengths and
binding energies (BE) are in fair agreement with experimental values. It can be seen
from the Table 3.2 that the values computed for Binding Energy and Bond Length
from DFT are closer to the experimental value.
Table 3.2 Computed and experimental Binding Energy per atom (BE) and Bond Length of the dimer Au2
Exp DFT GP
Bondlength
(Ao)
2.47 [39]
2.55 2.30
B E per atom
(eV/atom) 1.15 [39]
1.43 2.41
The ground state geometries of Aun along with their isomers were manually generated
and structures reported in the literature were also considered. Each structure is relaxed
to a desired convergence limit. The harmonic vibrational frequency analysis was
carried out on the ground state structure to verify the structure.
3.3 Results and Discussion
3.3.1 Structures of Au3-14 clusters
The local minimum structures of Aun (n = 3–14) clusters using Gupta potential with
exp-fitted parameters and DFT are optimized, which are presented in Fig. 3.1(a) and
3.1(b), respectively.
Au3 Au4 Au5 Au6
Au7 Au8 Au9 Au10
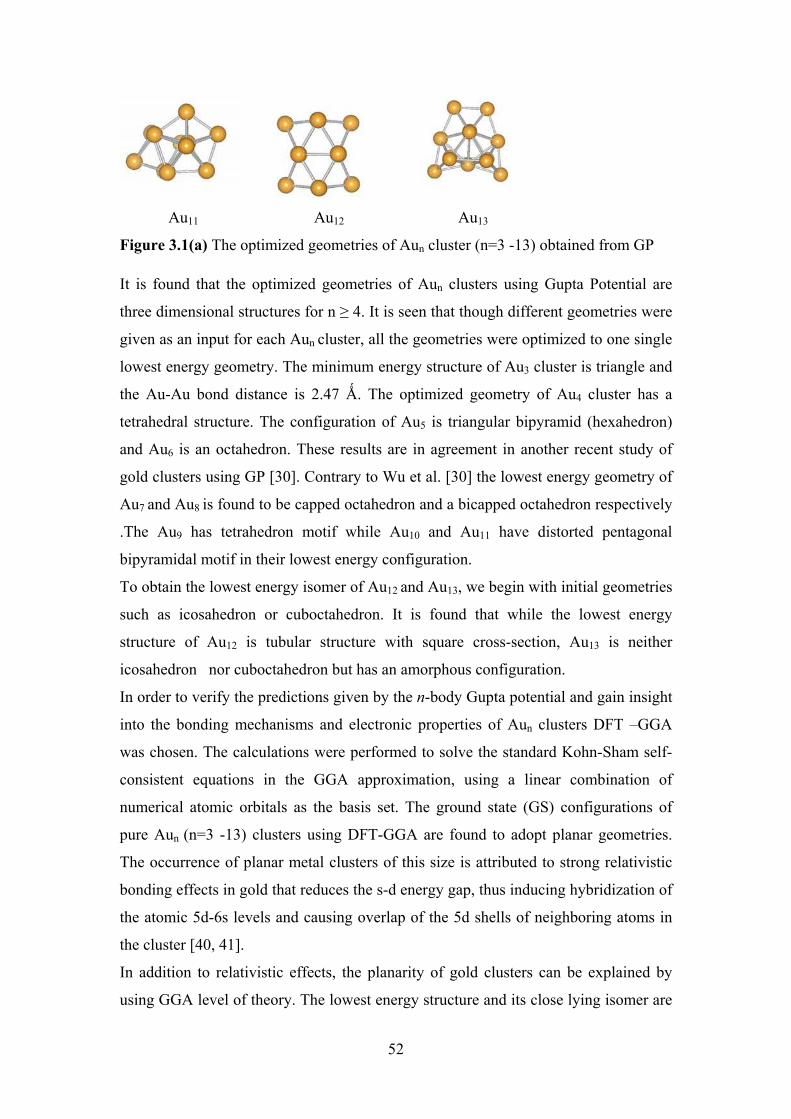
52
Au11 Au12 Au13
Figure 3.1(a) The optimized geometries of Aun cluster (n=3 -13) obtained from GP
It is found that the optimized geometries of Aun clusters using Gupta Potential are
three dimensional structures for n ≥ 4. It is seen that though different geometries were
given as an input for each Aun cluster, all the geometries were optimized to one single
lowest energy geometry. The minimum energy structure of Au3 cluster is triangle and
the Au-Au bond distance is 2.47 ┭. The optimized geometry of Au4 cluster has a
tetrahedral structure. The configuration of Au5 is triangular bipyramid (hexahedron)
and Au6 is an octahedron. These results are in agreement in another recent study of
gold clusters using GP [30]. Contrary to Wu et al. [30] the lowest energy geometry of
Au7 and Au8 is found to be capped octahedron and a bicapped octahedron respectively
.The Au9 has tetrahedron motif while Au10 and Au11 have distorted pentagonal
bipyramidal motif in their lowest energy configuration.
To obtain the lowest energy isomer of Au12 and Au13, we begin with initial geometries
such as icosahedron or cuboctahedron. It is found that while the lowest energy
structure of Au12 is tubular structure with square cross-section, Au13 is neither
icosahedron nor cuboctahedron but has an amorphous configuration.
In order to verify the predictions given by the n-body Gupta potential and gain insight
into the bonding mechanisms and electronic properties of Aun clusters DFT –GGA
was chosen. The calculations were performed to solve the standard Kohn-Sham self-
consistent equations in the GGA approximation, using a linear combination of
numerical atomic orbitals as the basis set. The ground state (GS) configurations of
pure Aun (n=3 -13) clusters using DFT-GGA are found to adopt planar geometries.
The occurrence of planar metal clusters of this size is attributed to strong relativistic
bonding effects in gold that reduces the s-d energy gap, thus inducing hybridization of
the atomic 5d-6s levels and causing overlap of the 5d shells of neighboring atoms in
the cluster [40, 41].
In addition to relativistic effects, the planarity of gold clusters can be explained by
using GGA level of theory. The lowest energy structure and its close lying isomer are
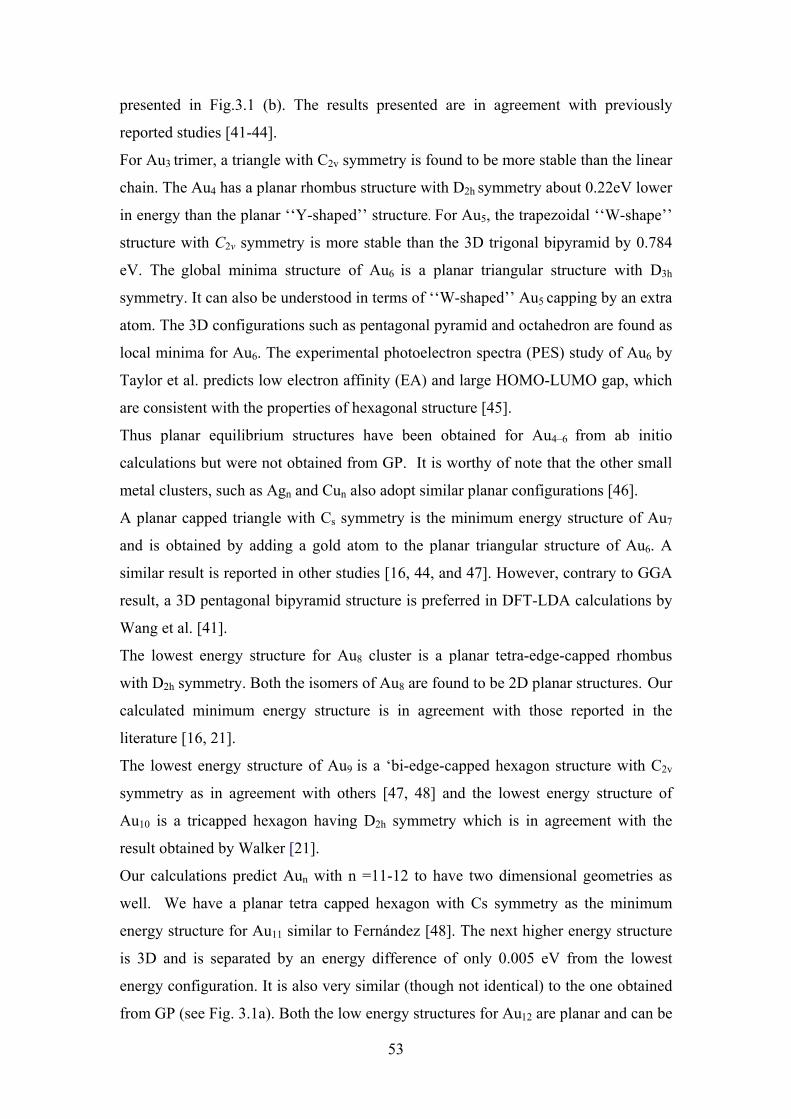
53
presented in Fig.3.1 (b). The results presented are in agreement with previously
reported studies [41-44].
For Au3 trimer, a triangle with C2v symmetry is found to be more stable than the linear
chain. The Au4 has a planar rhombus structure with D2h symmetry about 0.22eV lower
in energy than the planar ‘‘Y-shaped’’ structure. For Au5, the trapezoidal ‘‘W-shape’’
structure with C2v symmetry is more stable than the 3D trigonal bipyramid by 0.784
eV. The global minima structure of Au6 is a planar triangular structure with D3h
symmetry. It can also be understood in terms of ‘‘W-shaped’’ Au5 capping by an extra
atom. The 3D configurations such as pentagonal pyramid and octahedron are found as
local minima for Au6. The experimental photoelectron spectra (PES) study of Au6 by
Taylor et al. predicts low electron affinity (EA) and large HOMO-LUMO gap, which
are consistent with the properties of hexagonal structure [45].
Thus planar equilibrium structures have been obtained for Au4–6 from ab initio
calculations but were not obtained from GP. It is worthy of note that the other small
metal clusters, such as Agn and Cun also adopt similar planar configurations [46].
A planar capped triangle with Cs symmetry is the minimum energy structure of Au7
and is obtained by adding a gold atom to the planar triangular structure of Au6. A
similar result is reported in other studies [16, 44, and 47]. However, contrary to GGA
result, a 3D pentagonal bipyramid structure is preferred in DFT-LDA calculations by
Wang et al. [41].
The lowest energy structure for Au8 cluster is a planar tetra-edge-capped rhombus
with D2h symmetry. Both the isomers of Au8 are found to be 2D planar structures. Our
calculated minimum energy structure is in agreement with those reported in the
literature [16, 21].
The lowest energy structure of Au9 is a ‘bi-edge-capped hexagon structure with C2v
symmetry as in agreement with others [47, 48] and the lowest energy structure of
Au10 is a tricapped hexagon having D2h symmetry which is in agreement with the
result obtained by Walker [21].
Our calculations predict Aun with n =11-12 to have two dimensional geometries as
well. We have a planar tetra capped hexagon with Cs symmetry as the minimum
energy structure for Au11 similar to Fernández [48]. The next higher energy structure
is 3D and is separated by an energy difference of only 0.005 eV from the lowest
energy configuration. It is also very similar (though not identical) to the one obtained
from GP (see Fig. 3.1a). Both the low energy structures for Au12 are planar and can be
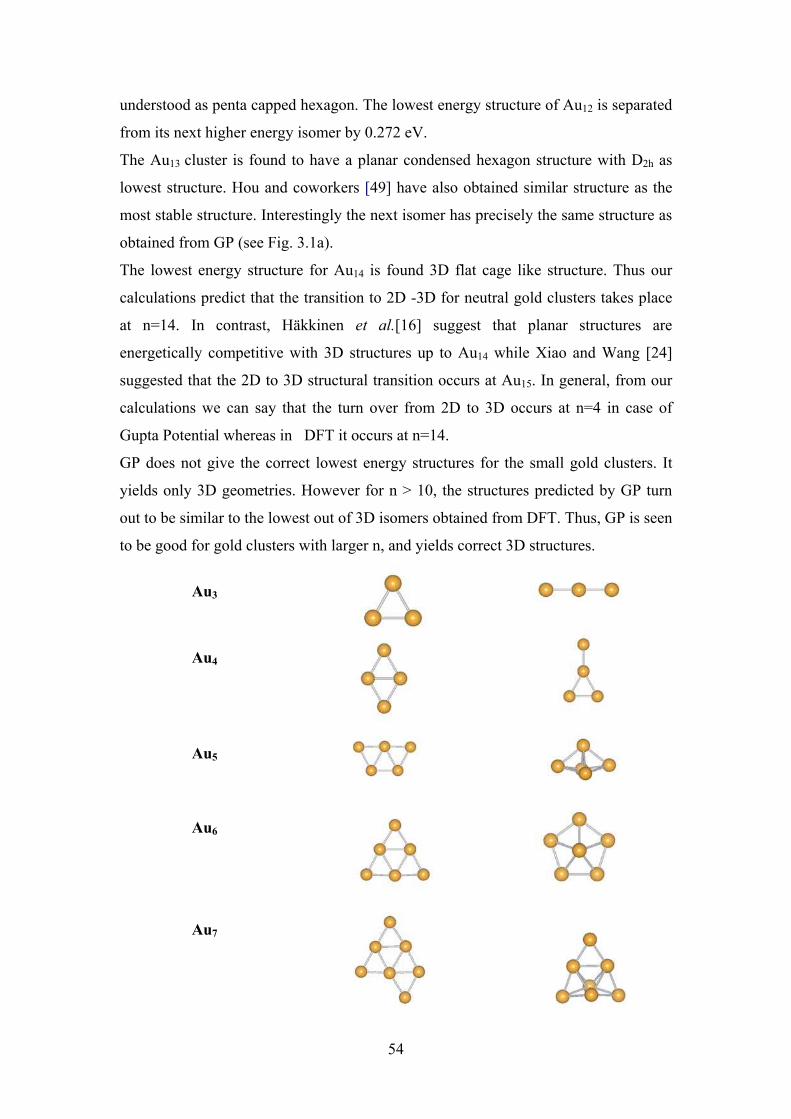
54
understood as penta capped hexagon. The lowest energy structure of Au12 is separated
from its next higher energy isomer by 0.272 eV.
The Au13 cluster is found to have a planar condensed hexagon structure with D2h as
lowest structure. Hou and coworkers [49] have also obtained similar structure as the
most stable structure. Interestingly the next isomer has precisely the same structure as
obtained from GP (see Fig. 3.1a).
The lowest energy structure for Au14 is found 3D flat cage like structure. Thus our
calculations predict that the transition to 2D -3D for neutral gold clusters takes place
at n=14. In contrast, Häkkinen et al.[16] suggest that planar structures are
energetically competitive with 3D structures up to Au14 while Xiao and Wang [24]
suggested that the 2D to 3D structural transition occurs at Au15. In general, from our
calculations we can say that the turn over from 2D to 3D occurs at n=4 in case of
Gupta Potential whereas in DFT it occurs at n=14.
GP does not give the correct lowest energy structures for the small gold clusters. It
yields only 3D geometries. However for n > 10, the structures predicted by GP turn
out to be similar to the lowest out of 3D isomers obtained from DFT. Thus, GP is seen
to be good for gold clusters with larger n, and yields correct 3D structures.
Au3
Au4
Au5
Au6
Au7
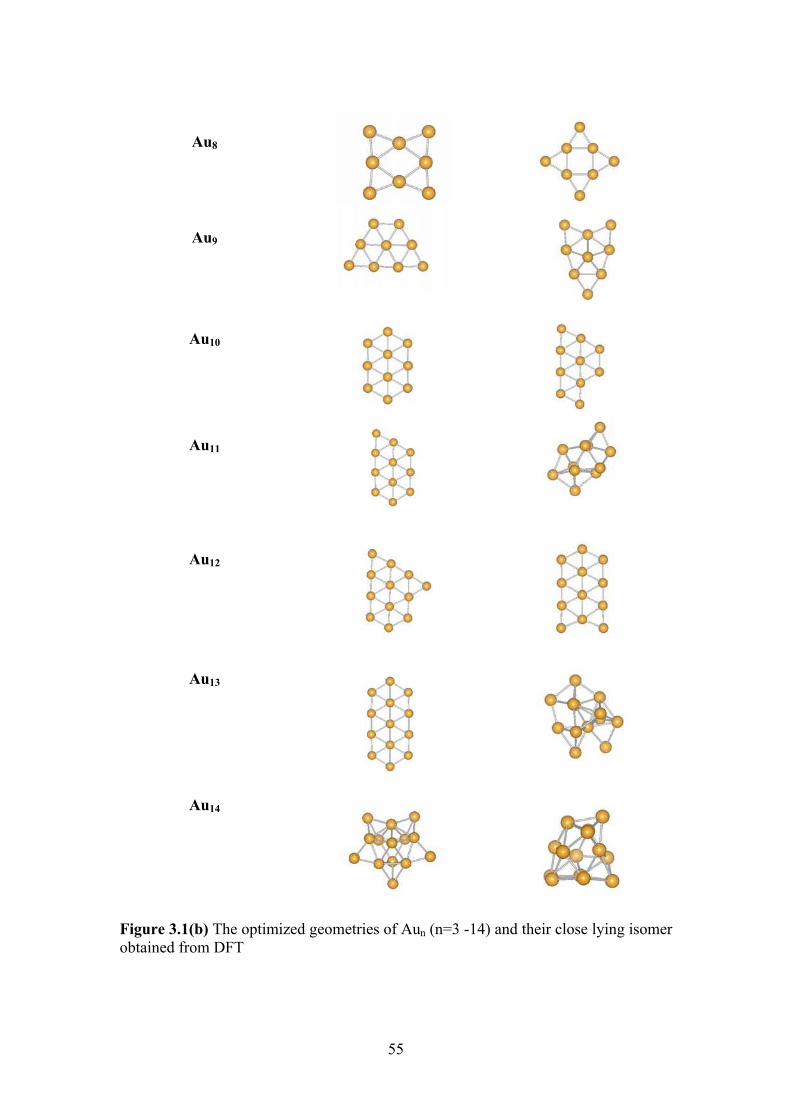
55
Au8
Au9
Au10
Au11
Au12
Au13
Au14
Figure 3.1(b) The optimized geometries of Aun (n=3 -14) and their close lying isomer obtained from DFT
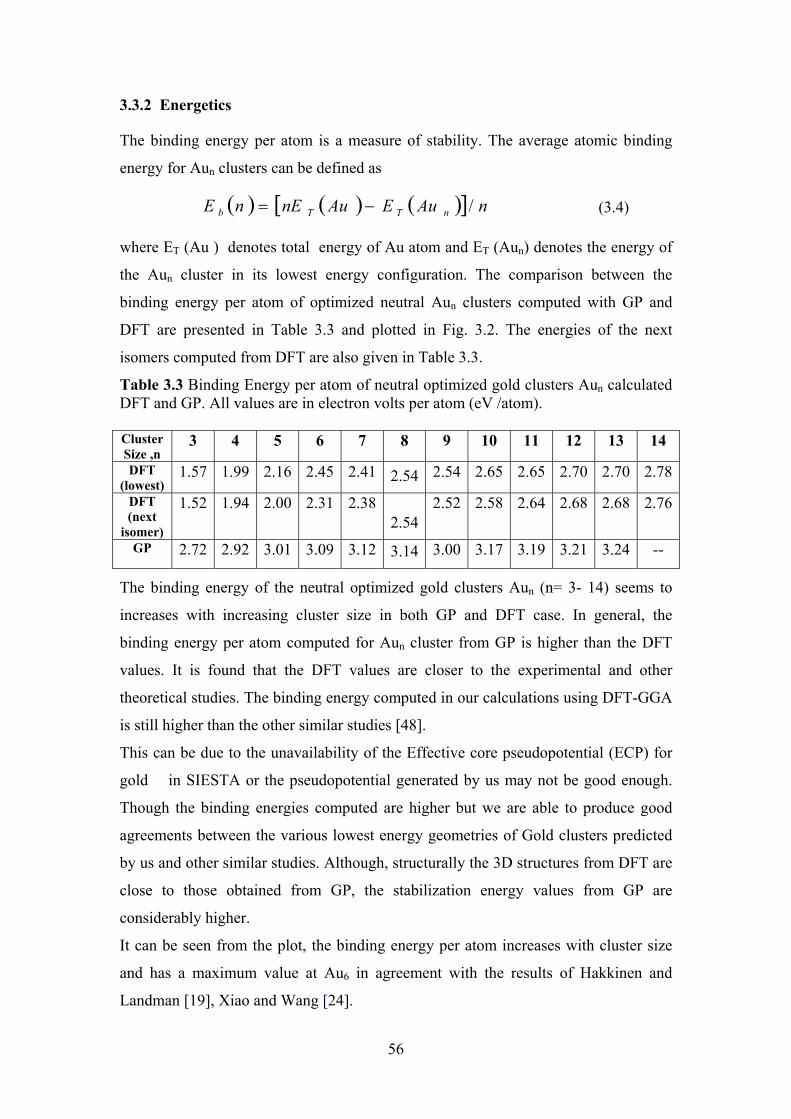
56
3.3.2 Energetics
The binding energy per atom is a measure of stability. The average atomic binding
energy for Aun clusters can be defined as
( ) ( ) ( )[ ] nAuEAunEnE nTTb /−= (3.4)
where ET (Au ) denotes total energy of Au atom and ET (Aun) denotes the energy of
the Aun cluster in its lowest energy configuration. The comparison between the
binding energy per atom of optimized neutral Aun clusters computed with GP and
DFT are presented in Table 3.3 and plotted in Fig. 3.2. The energies of the next
isomers computed from DFT are also given in Table 3.3.
Table 3.3 Binding Energy per atom of neutral optimized gold clusters Aun calculated DFT and GP. All values are in electron volts per atom (eV /atom). Cluster
Size ,n 3 4 5 6 7 8 9 10 11 12 13 14
DFT
(lowest) 1.57 1.99 2.16 2.45 2.41 2.54 2.54 2.65 2.65 2.70 2.70 2.78
DFT
(next
isomer)
1.52 1.94 2.00 2.31 2.382.54
2.52 2.58 2.64 2.68 2.68 2.76
GP 2.72 2.92 3.01 3.09 3.12 3.14 3.00 3.17 3.19 3.21 3.24 --
The binding energy of the neutral optimized gold clusters Aun (n= 3- 14) seems to
increases with increasing cluster size in both GP and DFT case. In general, the
binding energy per atom computed for Aun cluster from GP is higher than the DFT
values. It is found that the DFT values are closer to the experimental and other
theoretical studies. The binding energy computed in our calculations using DFT-GGA
is still higher than the other similar studies [48].
This can be due to the unavailability of the Effective core pseudopotential (ECP) for
gold in SIESTA or the pseudopotential generated by us may not be good enough.
Though the binding energies computed are higher but we are able to produce good
agreements between the various lowest energy geometries of Gold clusters predicted
by us and other similar studies. Although, structurally the 3D structures from DFT are
close to those obtained from GP, the stabilization energy values from GP are
considerably higher.
It can be seen from the plot, the binding energy per atom increases with cluster size
and has a maximum value at Au6 in agreement with the results of Hakkinen and
Landman [19], Xiao and Wang [24].
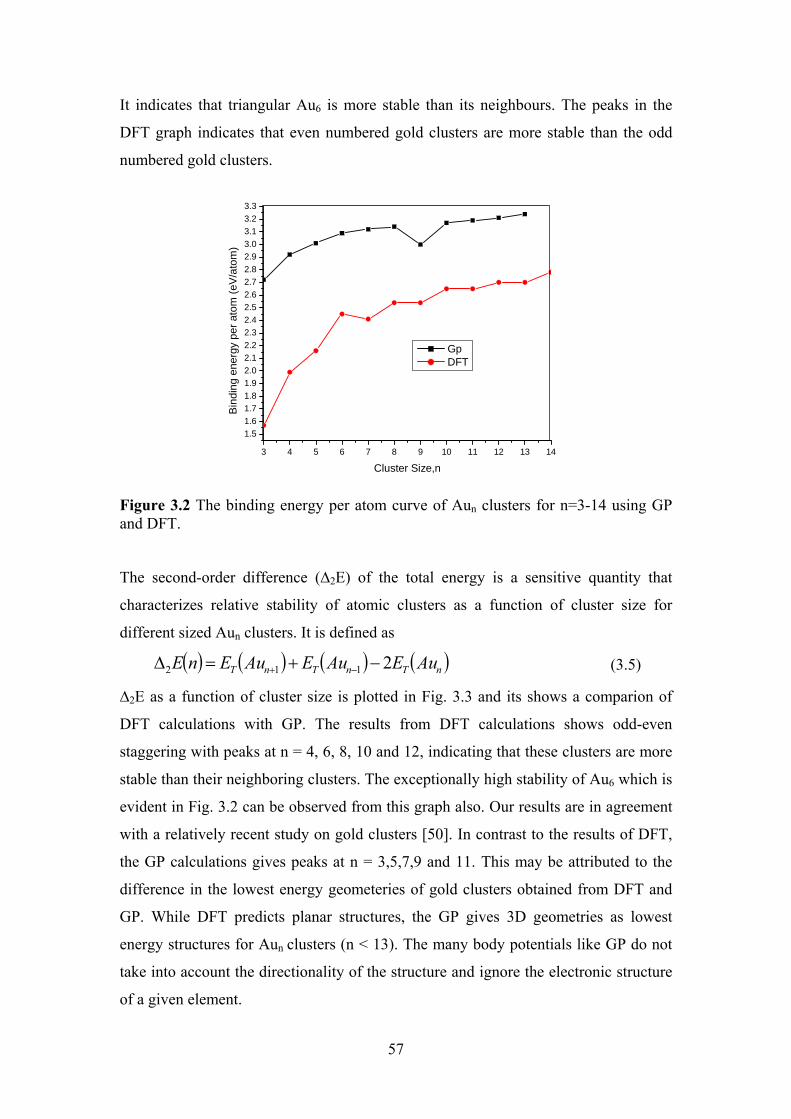
57
It indicates that triangular Au6 is more stable than its neighbours. The peaks in the
DFT graph indicates that even numbered gold clusters are more stable than the odd
numbered gold clusters.
3 4 5 6 7 8 9 10 11 12 13 14
1.51.61.71.81.92.02.12.22.32.42.52.62.72.82.93.03.13.23.3
Bin
ding
ene
rgy
per
atom
(eV
/ato
m)
Cluster Size,n
Gp DFT
Figure 3.2 The binding energy per atom curve of Aun clusters for n=3-14 using GP and DFT.
The second-order difference (∆2E) of the total energy is a sensitive quantity that
characterizes relative stability of atomic clusters as a function of cluster size for
different sized Aun clusters. It is defined as
( ) ( ) ( ) ( )nTnTnT AuEAuEAuEnE 2112 −+=∆ −+ (3.5)
∆2E as a function of cluster size is plotted in Fig. 3.3 and its shows a comparion of
DFT calculations with GP. The results from DFT calculations shows odd-even
staggering with peaks at n = 4, 6, 8, 10 and 12, indicating that these clusters are more
stable than their neighboring clusters. The exceptionally high stability of Au6 which is
evident in Fig. 3.2 can be observed from this graph also. Our results are in agreement
with a relatively recent study on gold clusters [50]. In contrast to the results of DFT,
the GP calculations gives peaks at n = 3,5,7,9 and 11. This may be attributed to the
difference in the lowest energy geometeries of gold clusters obtained from DFT and
GP. While DFT predicts planar structures, the GP gives 3D geometries as lowest
energy structures for Aun clusters (n < 13). The many body potentials like GP do not
take into account the directionality of the structure and ignore the electronic structure
of a given element.
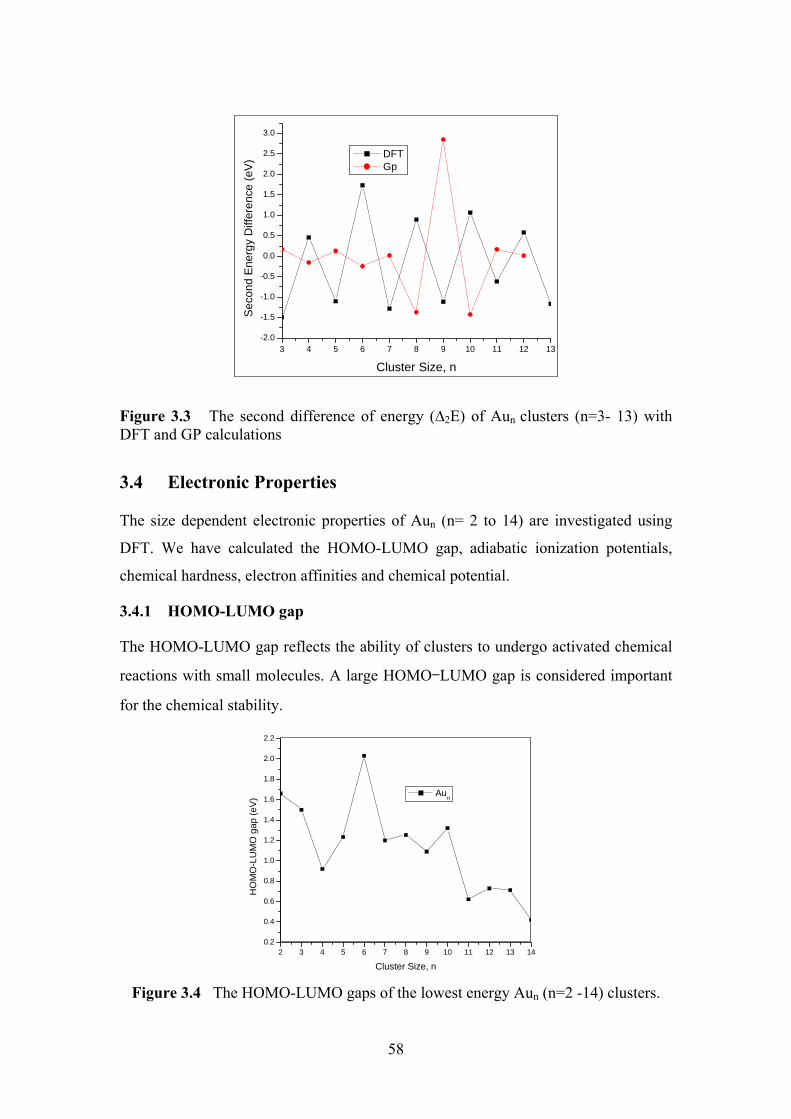
58
3 4 5 6 7 8 9 10 11 12 13-2.0
-1.5
-1.0
-0.5
0.0
0.5
1.0
1.5
2.0
2.5
3.0
Sec
ond
Ene
rgy
Diff
eren
ce (
eV)
Cluster Size, n
DFT Gp
Figure 3.3 The second difference of energy (∆2E) of Aun clusters (n=3- 13) with DFT and GP calculations
3.4 Electronic Properties
The size dependent electronic properties of Aun (n= 2 to 14) are investigated using
DFT. We have calculated the HOMO-LUMO gap, adiabatic ionization potentials,
chemical hardness, electron affinities and chemical potential.
3.4.1 HOMO-LUMO gap
The HOMO-LUMO gap reflects the ability of clusters to undergo activated chemical
reactions with small molecules. A large HOMO‰LUMO gap is considered important
for the chemical stability.
2 3 4 5 6 7 8 9 10 11 12 13 140.2
0.4
0.6
0.8
1.0
1.2
1.4
1.6
1.8
2.0
2.2
HO
MO
-LU
MO
gap
(eV
)
Cluster Size, n
Aun
Figure 3.4 The HOMO-LUMO gaps of the lowest energy Aun (n=2 -14) clusters.
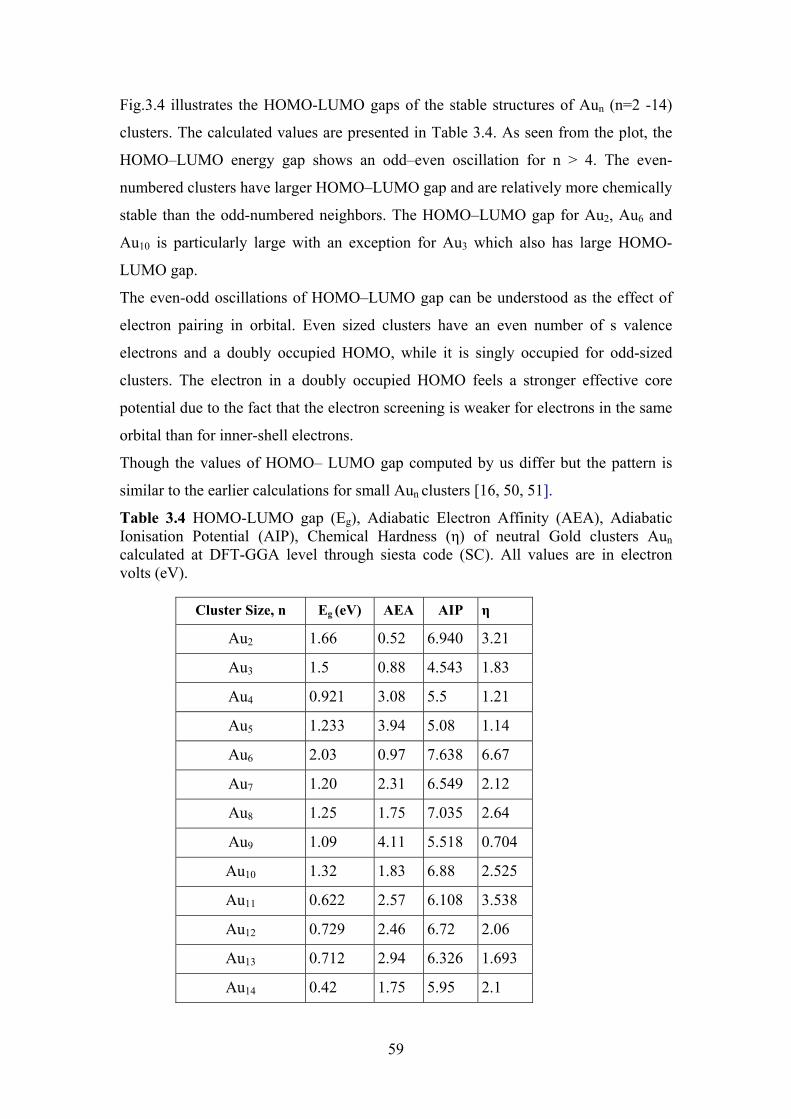
59
Fig.3.4 illustrates the HOMO-LUMO gaps of the stable structures of Aun (n=2 -14)
clusters. The calculated values are presented in Table 3.4. As seen from the plot, the
HOMO–LUMO energy gap shows an odd–even oscillation for n > 4. The even-
numbered clusters have larger HOMO–LUMO gap and are relatively more chemically
stable than the odd-numbered neighbors. The HOMO–LUMO gap for Au2, Au6 and
Au10 is particularly large with an exception for Au3 which also has large HOMO-
LUMO gap.
The even-odd oscillations of HOMO–LUMO gap can be understood as the effect of
electron pairing in orbital. Even sized clusters have an even number of s valence
electrons and a doubly occupied HOMO, while it is singly occupied for odd-sized
clusters. The electron in a doubly occupied HOMO feels a stronger effective core
potential due to the fact that the electron screening is weaker for electrons in the same
orbital than for inner-shell electrons.
Though the values of HOMO– LUMO gap computed by us differ but the pattern is
similar to the earlier calculations for small Aun clusters [16, 50, 51].
Table 3.4 HOMO-LUMO gap (Eg), Adiabatic Electron Affinity (AEA), Adiabatic Ionisation Potential (AIP), Chemical Hardness (さ) of neutral Gold clusters Aun calculated at DFT-GGA level through siesta code (SC). All values are in electron volts (eV).
Cluster Size, n Eg (eV) AEA AIP Ș
Au2 1.66 0.52 6.940 3.21
Au3 1.5 0.88 4.543 1.83
Au4 0.921 3.08 5.5 1.21
Au5 1.233 3.94 5.08 1.14
Au6 2.03 0.97 7.638 6.67
Au7 1.20 2.31 6.549 2.12
Au8 1.25 1.75 7.035 2.64
Au9 1.09 4.11 5.518 0.704
Au10 1.32 1.83 6.88 2.525
Au11 0.622 2.57 6.108 3.538
Au12 0.729 2.46 6.72 2.06
Au13 0.712 2.94 6.326 1.693
Au14 0.42 1.75 5.95 2.1
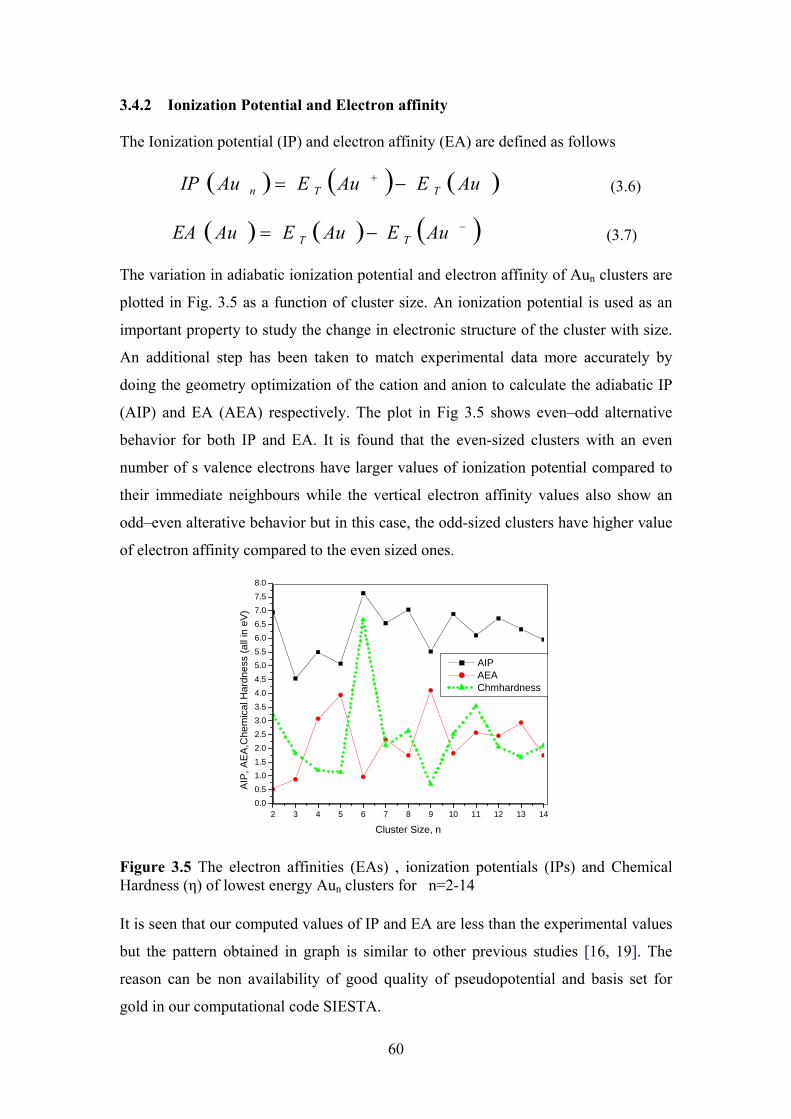
60
3.4.2 Ionization Potential and Electron affinity
The Ionization potential (IP) and electron affinity (EA) are defined as follows
( ) ( ) ( )AuEAuEAuIP TTn −= + (3.6)
( ) ( ) ( )−−= AuEAuEAuEA TT (3.7) The variation in adiabatic ionization potential and electron affinity of Aun clusters are
plotted in Fig. 3.5 as a function of cluster size. An ionization potential is used as an
important property to study the change in electronic structure of the cluster with size.
An additional step has been taken to match experimental data more accurately by
doing the geometry optimization of the cation and anion to calculate the adiabatic IP
(AIP) and EA (AEA) respectively. The plot in Fig 3.5 shows even–odd alternative
behavior for both IP and EA. It is found that the even-sized clusters with an even
number of s valence electrons have larger values of ionization potential compared to
their immediate neighbours while the vertical electron affinity values also show an
odd–even alterative behavior but in this case, the odd-sized clusters have higher value
of electron affinity compared to the even sized ones.
2 3 4 5 6 7 8 9 10 11 12 13 140.0
0.5
1.0
1.5
2.0
2.5
3.0
3.5
4.0
4.5
5.0
5.5
6.0
6.5
7.0
7.5
8.0
AIP
, AE
A,C
hem
ical
Har
dnes
s (a
ll in
eV
)
Cluster Size, n
AIP AEA Chmhardness
Figure 3.5 The electron affinities (EAs) , ionization potentials (IPs) and Chemical Hardness (さ) of lowest energy Aun clusters for n=2-14
It is seen that our computed values of IP and EA are less than the experimental values
but the pattern obtained in graph is similar to other previous studies [16, 19]. The
reason can be non availability of good quality of pseudopotential and basis set for
gold in our computational code SIESTA.
61
3.4.3 Chemical Hardness
The Chemical hardness さ is interpreted as the resistance towards change in number of
electrons and it is directly related to the stability of clusters. The chemical hardness
(さ) is defined as さ = (VIP-EA)/2, displayed in Fig. 3.5. It is an electronic property
which also signifies the relative stability of molecules. The graph shows peaks for
even number of gold atoms, n= 2, 6, 8 (except at n=11) indicating again the high
stability of even numbered Aun clusters.
3.5 Conclusion
We have investigated low-energy geometries and binding energy of gold clusters Aun,
n varying from 2 to 14 using both Gupta Potential and DFT-GGA theory. Different
initial guess geometries were considered for all the clusters which lead to a number of
structural isomers for each cluster size. Further the electronic properties such as
HOMO–LUMO gap, ionization potential, electron affinity and chemical hardness
were investigated systematically using DFT .The results can be summarized as
follows.
• The Gupta potential favors 3D geometries as the low energy structures of
Aun clusters while DFT favors 2D planar geometries as ground structures for
Aun. Our calculation from DFT predicts that the 2D to 3D transition takes
place at n=14.
• The binding energy per atom of Aun clusters increases with increase in size
of cluster for both GP and DFT. It is observed the graph exhibit odd-even
oscillations with peaks at even number clusters i.e., n = 2,4,6,8 etc. The
binding energy curve indicates exceptionally high stability of Au6 cluster.
• The variation of HOMO–LUMO gaps, chemical hardness, second energy
difference of binding energy, AIP and AEA with cluster size shows odd
even alterations. The even-numbered clusters are found to be relatively more
stable compared to the odd-numbered ones indicating that electron spin-
pairing stabilizes these cluster. Our results are in agreement with other
similar studies on gold clusters.
• GP is particularly good for larger clusters (n>10) and for 3D geometries of
gold.
62
Bibliography
1 R. L. Whetten, J. T. Khoury, M. M. Alvarez et al., Adv. Mater. 5, 8 (1996).
2 R. P. Andres, T. Bein, M. Dorogi et al. Science 272, 1323 (1996).
3 C. A. Mirkin, R. L. Letsinger, R. C. Mucic, J. J. Storhoff, Nature (London) 382, 607 (1996).
4 A.P Alivisatos, K.P Johnsson, X. Peng, T.E Wilson, C.J Loweth, M. P. Bruchez, P.G. Schultz, Nature (London) 382, 609 (1996).
5 R. P. Andres , J. D. Bielefeld, J. I. Henderson, et al. Science 273, 1690 (1996).
6 W. D. Luedtke, U. Landman, J. Phys. Chem. 100, 13, 323 (1996).
7 D. Bethell, D. J. Schiffrin, Nature (London) 382, 581 (1996).
8 C. L. Cleveland, U. Landman, M.N. Shafigullin, P.W. Stephens, R.L. Whetten, Z. Phys. D 40, 503 (1997).
9 D.W. Goodman, Nature 454, 948–949 (2008).
10 G.J. Hutchings, M. Brust, H. Schmidbaur, Chem. Soc. Rev. 37, 1759–1765(2008).
11 E. Roduner, Chem. Soc. Rev. 35, 583–592 (2006).
12 H. Hovel, I. Barke, Progress in Surface Science 81, 53–111(2006).
13 T. G. Schaaff , M. N. Shafigullin, J. T. Khoury, I. Vezmar, R. L. Whetten et al., J. Phys. Chem. 101, 7885 (1997).
14 I. L. Garzón, A. Posada-Amarillas, Phys. Rev. B 54, 11 796 (1996).
15 Y. Donga, M. Springborg, Eur. Phys. J. D 43, 15–18 (2007).
16 H. Hakkinen, B. Yoon, U. Landman, X. Li, H.-J. Zhai, L.-S. Wang, J. Phys. Chem. A 107, 6168(2003).
17 G. Bravo-Perez, I. L. Garzon, O. Novaro, J. Mol. Str. (Theochem) 493, 225 (1999).
18 H. Gronbeck and W. Andreoni, Chem. Phys. 262, 1 (2000).
19 H. Hakkinen and U. Landman, Phys. Rev. B 62, R2287 (2000).
20 J. Wang, G. Wang, and J. Zhao, Phys. Rev. B 66, 035418 (2002).
21 A. V. Walker, J. Chem. Phys. 122, 094310 (2005).
22 F. Remacle and E. S. Kryachko, J. Chem. Phys. 122, 044304 (2005).
23 N. T. Wilson and R. L. Johnston, Eur. Phys. J. D 12, 161 (2000).
24 L. Wang, L. Xiao, Chem. Phys. Lett. 392, 452-455 (2004).
25 P. Koskinen, H. Häkkinen, B. Huber, B. von Issendorff, and M.Moseler, Phys. Rev. Lett. 98, 015701 (2007).
26 S. Grimme, Angew. Chem., Int. Ed. 45, 4460 (2006).
27 P. K. Jain, Structural Chemistry, 16, 4 (2005).
63
28 S. Goel, K. A.Velizhanin,A. Piryatinski,S. Tretiak, and S. A. Ivanov, J. Phys. Chem. Lett 1, 927–931 (2010).
29 K. Michaelian, N. Rendon, and I. L.Garzon, Phys. Rev. B 60, 3 (1999).
30 X. Wu, S. Chen, Y. Sun, Y. Chen, Computational and Theoretical Chemistry 1002 43–48 (2012).
31 F. Cleri and V. Rosato, Phys. Rev. B 48, 22, 20 (1993); V. Rosato, M. Guillope, B. Legrand, Philos. Mag. A 50, 321 (1989).
32 P.Ordejon, E. Artacho and J. M. Soler, Phys. Rev. B, 53, R10441 (1996).
33 D. Sanchez-Portal, P. Ordejon, E. Artacho and J. M. Soler, Int. J.Quantum Chem, 65, 453( 1997).
34 J. M. Soler, E. Artacho, J. D. Gale, A. Garcia,J. Junquera, P. Ordejon and D. Sanchez-Portal, J. Phys. Condens. Matter 14, 2745 (2002).
35 G. P Robert and Y. Weitao, Density-Functional Theory of atoms and Molecules, Oxford University Press NewYork (1989).
36 Perdew, Burke, Ernzerhof, Phys. Rev. Lett. 77, 3865 (1996).
37 L. Kleinman and D. M. Bylander, Phys. Rev. Lett. 48, 1425(1982).
38 C. Kittle, Introduction to Solid State Physics, 7th ed. Wiley, New York (1996).
39 R. C. Weast, CRC Handbook of Chemistry and Physics, 55th ed. CRC Press,. Cleveland, OH (1974).
40 H. Hakkinen, M. Moseler,U. Landman, Phys. Rev. Lett. 89, 033401(2002).
41 P. Pyykko, Chem. Rev. 88, 563 (1988).
42 G Bravo-Perez, I. L Garzon, O. Novaro, Journal of Mol. Struct. (Theochem), 493, 225-231 (1999).
43 H. Hakkinen and U. Landman, Phys. Rev. B. 61,287 (2000).
44 H.M Lee, M. Ge, B. R. Sahu, P. Tarakeshwar and K. S. Kim, J. Phys. Chem. 107, 9994( 2003).
45 K.J. Taylor, C. Jin, J. Conceicao, O. Cheshnovsky, B.R. Johnson, P.J. Nordlander, R. E. Smalley, J. Chem. Phys. 93, 7515 (1991).
46 H. Nakashima, H. Mori, M. S. Mon, E. Miyoshi, Int. Conf. on Computational Chemsitry, Egypt (2007).
47 V. Bonacic-Koutecky, J. Burda, R. Mitric, M. Ge, G. Zampella and P. Fantucci, J. Chem. Phys. 117, 3120 (2002).
48 E. M. Fernández, J. M. Soler, I. L. Garzón, L. C. Balbás, Phys. Rev. B 70, 165403 (2004).
49 J. Zhao, J. Yang, J.G. Hou, Phys. Rev. B 67, 085404(2003).
50 A. Deka, R.C. Deka, J. Mol.Struct. : THEOCHEM 870, 83 -93 (2008).
51 J. Wang, G. Wang, J. Zhou, Phys. Rev. B 64 205411(2003).
64
Chapter 4
4. Doping of gold clusters with Si and Ge atoms
4.1 Introduction
In the previous chapter, we have discussed different geometries of the small pure gold
clusters using both Gupta potential and Density Functional Theory. It will be
interesting to see how different properties, structural as well as electronic, of gold
clusters will change with the introduction of a dopant atom. Doped clusters have
received increasing attention because of their distinctive structure and tunable
catalytic properties which change with dopant size.
There have been a large number of experimental and theoretical studies on doping of
gold clusters of different size ranges with various elements. A highly stable doped
gold cluster, icosahedral W@ Au12, was predicted by Pyykko and Runeberg [1] using
DFT calculations. In another DFT study, the geometric and electronic properties of
3d, 4d, and 5d transition-metal atom doped Au6 clusters were systematically
investigated by Meng et al. [2]. They found that doping by 3d, 4d and 5d transition-
metal atoms could stabilize the Au6 ring. Li et al. [3] have studied magnetic properties
of transition metal doped gold clusters M@Au6 and found that the Au6 ring in the
MAu6 system serves as a perfect host to store a single transition metal atom. A
combined photoelectron spectroscopy (PES) and DFT investigation performed on
MAu16− (M=Ag, Zn, In) clusters by Wang et al. [4] show that the electronic properties
of the golden buckyball can be systematically tuned through doping. A lot of
theoretical and experimental work on gold clusters doped with impurity atoms focuses
mainly on transition metal atoms as dopant [5-16]. There are relatively very few
systematic investigations done on the study of gold clusters doped with group 14
elements (C, Si, Ge).
Silicon is the most important semi conducting element in microelectronics industry. Si
clusters have been investigated both experimentally [17] and theoretically [18] for
their potential applications as building blocks to build up well controlled
nanostructures. The most intriguing finding is the structure of SiAu4 cluster, which
possess Td geometry, analogous to silane or SiH4 [19]. Walter et al. [20] conducted
theoretical study on Si doped inside neutral Au16 cage. They found that Si doped Au16
exhibits different reactivities toward oxygen. Another theoretical study by Wang et al.
[21] shows that the global minima of anion golden cage −16Au doped with Si, Ge and
Sn possess exohedral structures.
65
Germanium and silicon are isovalent, but their chemical properties are quite different.
It will be interesting to see how silicon doped gold clusters are different from
germanium doped gold clusters. Spiekermann et al. [22] have reported the synthesis
and structural characterization of the first ligand-free anionic germanium–gold cluster
and have asserted that the stability of such clusters would lead to their use both as a
catalytic seed for the growth of germanium nanowires [23] and the use of the cluster
itself as a building block for one-dimensional systems. A joint experimental and
theoretical study on the structures of gold clusters doped with a group-14 atom: MAu-
x (M = Si, Ge, Sn; x = 5-8) have shown that these doped clusters have a strong
tendency of forming planar structures [24].
In this chapter, we will study in detail the structural and electronic properties of AunSi
(n=1-12) clusters and compare them with pure gold clusters and germanium doped
gold clusters. We have calculated the equilibrium geometries, bond lengths, ionization
potentials, electron affinities and HOMO-LUMO gap of these clusters using density
functional theory. We will also present a comparative study of Germanium doped
gold clusters at the end.
The organization of the chapter is as follows. The computational details are given in
Section 4.2, results and discussions are presented in Section 4.3. The germanium
doped gold clusters are discussed in section 4.5
4.2 Computational details
We have used the well known Spanish Initiative for Electronic Simulation with
Thousands of Atoms computational code, SIESTA, [25-27] based on Density
Functional theory [28]. The electron density functional is treated by the generalized
gradient approximation (GGA) with exchange correlation functional parameterized by
Perdew, Zunger and Ernzerhof (PBE) scheme [29]. The core electrons are replaced by
non-local norm conserving relativistic pseudopotential factorized by Kleimann-
Bylander form [30]. Relativistic pseudo potential for gold is generated with atomic
valence electron configurations 5d10 6s1. The pseudo potentials for silicon and
germanium are generated with atomic valence electron 3s23p2 and 4s2 4p2 respectively.
The core radii (in units of Å) for gold are as follows: s (2.55), p (2.98), d (2.22), f
(2.00). For silicon, they are: s (1.77), p (1.96), d (2.11) and f (2.11) and for
germanium, they are: s (2.06), p (2.85), d (2.58) and f (2.58). The valence states were
described using DZP (double-zeta + polarization) basis sets. The reciprocal space

66
integrations are carried out at the gamma point. The clusters are optimized inside
simulation cell of 15 ┭ and energy cutoff of 150 Ry. The symmetry unrestricted
geometry optimization is carried using conjugate gradient method until all the forces
are less than 0.001eV/Å.
We have verified the computational procedure by calculating the ionization potential
(IP) for a gold atom and performing test calculations on Au2 and Si2 dimer. The IP of
the gold atom is found to be 8.90 eV which is in fair agreement with the experimental
value of 9.22eV [31]. The structural parameters such as binding energy per atom and
bond length for Au2 are found to be 1.43 eV and 2.55 ┭ respectively which are in
agreement with experimental values, 1.15 eV and 2.47 ┭ [32].
For Si2, the Binding energy per atom is 2.40 eV and the bond length is 2.28 ┭ which
agree with the experimental values of 1. 67 eV and 2.25 ┭ [33]. The ionization
potential of Si2 is 7.97 eV which agrees with the experimental reported values, 7.87eV
[34] and 7.97-8.08 eV [35]. The structural parameter such as bond length for Ge2 and
AuGe dimer is 2.42 ┭ and 2.37 ┭ respectively which are in fair agreement with the
experimental and theoretical reported value [36-38]
In order to obtain the lowest energy structures of AunX (X= Si, Ge), we have
considered all the possible isomeric structures obtained by placing the X atom at each
distinct position of Aun+1 clusters .The ground state geometries of AunX (X= Si, Ge)
along with their isomers reported in the literature were also considered and each
structure is relaxed to a desired convergence limit.
The harmonic vibrational frequency analysis was carried out on the ground state
structure to verify the structure.
4.3 Results and Discussions
Using the scheme mentioned in section 4.2, we have obtained the lowest energy
structures of AunX (X= Si). The simulation parameters obtained from Aun+1
calculation was used for searching the ground states of AunX (X= Si) and calculating
their equilibrium properties. The minimum energy structures as well as their isomers
for AunSi clusters are presented in Figs. 4.2 – 4.6. The Au-Au and Au-Si bond
lengths, as well as the point symmetries for all the lowest energy structures are
tabulated in Table 4.1.
In order to study the relative stabilities of the clusters, we study binding energy per
67
atom, the dissociation energy and the second difference in energies. These have been
plotted in Figs. 4.7 – 4.9. The electronic properties -- HOMO-LUMO gap, ionization
potentials, electron affinities and chemical hardness are plotted in Figs. 4.11 – 4.13.
4.3.1 Aun+1 clusters
We have first obtained the ground state (GS) structures for pure Aun+1 cluster, which
have already been discussed in Chapter 3. It was found that for n=1-12 the ground
state configurations adopt planar geometries. For Au3, Au4, Au5 and Au6 the global
minima structures are found to be a triangle with C2v symmetry, a rhombus with D2h
symmetry, a trapezoidal ‘W-shaped’ structure with C2v symmetry and a planar
triangular structure with D3h symmetry respectively. These results are in agreement
with previously reported results [39-42].
The Au7 cluster has a capped triangular structure reported by Bonacic - Koutecky and
Lee et al. The minimum energy geometries for Au8, Au9 and Au10 have D2h, C2v and
D3h symmetries respectively, all of which are planar, in agreement with other
theoretical results [42-44]. Our calculations predict Aun+1 with n =11-13 to have two
dimensional geometries as well, in agreement with other reported results [42, 45].
4.3.2 AunSi clusters
The ground state (GS) structures for Si doped Au clusters for n=1 -12 are presented in
Fig. 4.1 along with the pure gold clusters geometries to give a comparison between
the two. To obtain the low lying isomers of AunSi, we start with the pure gold cluster
Aun+1 and replace one gold atom with a Si atom and optimize the geometry. This is
repeated with replacement of Au with Si on another site and so on till all the non-
equivalent sites have been tried.
The Au1Si dimer bond length is found to be 2.29 ┭ which is smaller than the Au-Au
bond which is 2.55┭. This bond length (2.29 ┭) is in good agreement with the
theoretically reported value 2.25 ┭ [46].
Au2Si, a triangular structure (3a in Fig. 4.1) with C2v symmetry is more stable than its
linear isomer (3b) by 1.30 eV. In the triangular structure, the Au-Si bond length 2.29
┭ is in agreement with the reported value, 2.28 ┭ [40]. The Au-Au bond distance is
3.25 ┭ and has increased significantly compared to that in Au2 dimer.The angle Au-
Si-Au is found to be 89o where as the reported value is 112o [47].
For Au3Si, three different geometries are considered and are shown in Fig. 4.1 (4a -
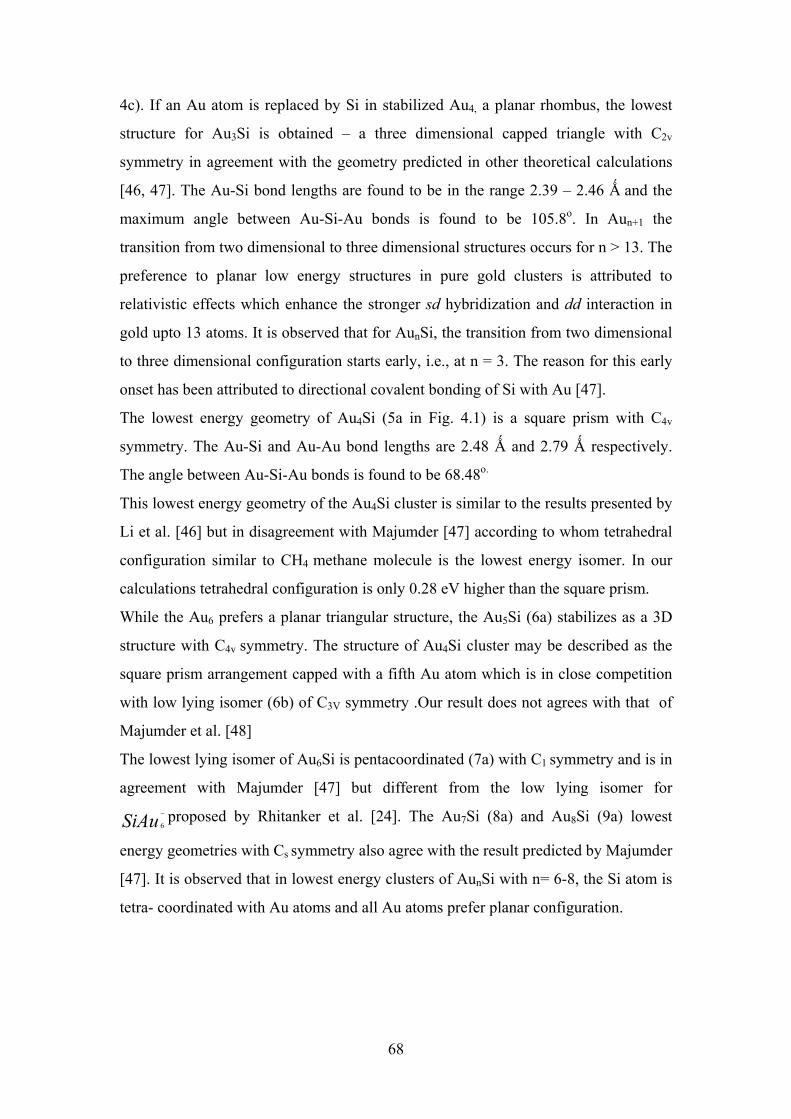
68
4c). If an Au atom is replaced by Si in stabilized Au4, a planar rhombus, the lowest
structure for Au3Si is obtained – a three dimensional capped triangle with C2v
symmetry in agreement with the geometry predicted in other theoretical calculations
[46, 47]. The Au-Si bond lengths are found to be in the range 2.39 – 2.46 ┭ and the
maximum angle between Au-Si-Au bonds is found to be 105.8o. In Aun+1 the
transition from two dimensional to three dimensional structures occurs for n > 13. The
preference to planar low energy structures in pure gold clusters is attributed to
relativistic effects which enhance the stronger sd hybridization and dd interaction in
gold upto 13 atoms. It is observed that for AunSi, the transition from two dimensional
to three dimensional configuration starts early, i.e., at n = 3. The reason for this early
onset has been attributed to directional covalent bonding of Si with Au [47].
The lowest energy geometry of Au4Si (5a in Fig. 4.1) is a square prism with C4v
symmetry. The Au-Si and Au-Au bond lengths are 2.48 ┭ and 2.79 ┭ respectively.
The angle between Au-Si-Au bonds is found to be 68.48o.
This lowest energy geometry of the Au4Si cluster is similar to the results presented by
Li et al. [46] but in disagreement with Majumder [47] according to whom tetrahedral
configuration similar to CH4 methane molecule is the lowest energy isomer. In our
calculations tetrahedral configuration is only 0.28 eV higher than the square prism.
While the Au6 prefers a planar triangular structure, the Au5Si (6a) stabilizes as a 3D
structure with C4v symmetry. The structure of Au4Si cluster may be described as the
square prism arrangement capped with a fifth Au atom which is in close competition
with low lying isomer (6b) of C3V symmetry .Our result does not agrees with that of
Majumder et al. [48]
The lowest lying isomer of Au6Si is pentacoordinated (7a) with C1 symmetry and is in
agreement with Majumder [47] but different from the low lying isomer for
SiAu−
6proposed by Rhitanker et al. [24]. The Au7Si (8a) and Au8Si (9a) lowest
energy geometries with Cs symmetry also agree with the result predicted by Majumder
[47]. It is observed that in lowest energy clusters of AunSi with n= 6-8, the Si atom is
tetra- coordinated with Au atoms and all Au atoms prefer planar configuration.
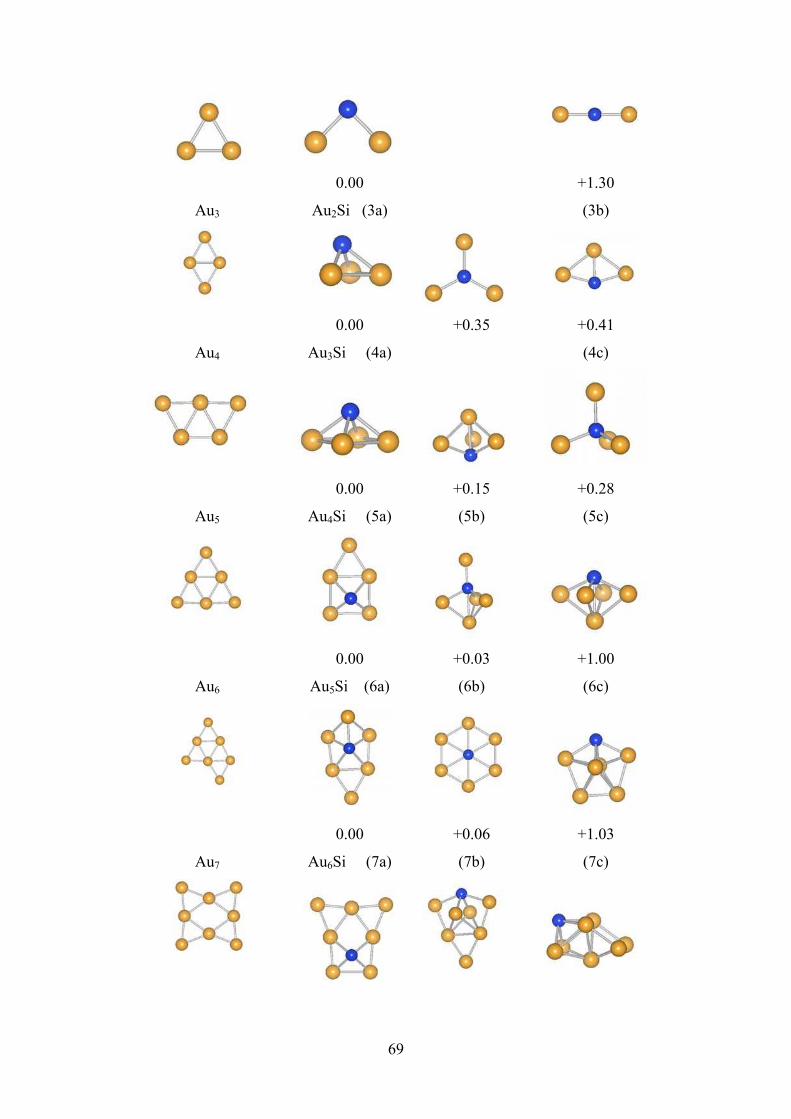
69
Au3
0.00
Au2Si (3a)
+1.30
(3b)
Au4
0.00
Au3Si (4a)
+0.35 +0.41
(4c)
Au5
0.00
Au4Si (5a)
+0.15
(5b)
+0.28
(5c)
Au6
0.00
Au5Si (6a)
+0.03
(6b)
+1.00
(6c)
Au7
0.00
Au6Si (7a)
+0.06
(7b)
+1.03
(7c)
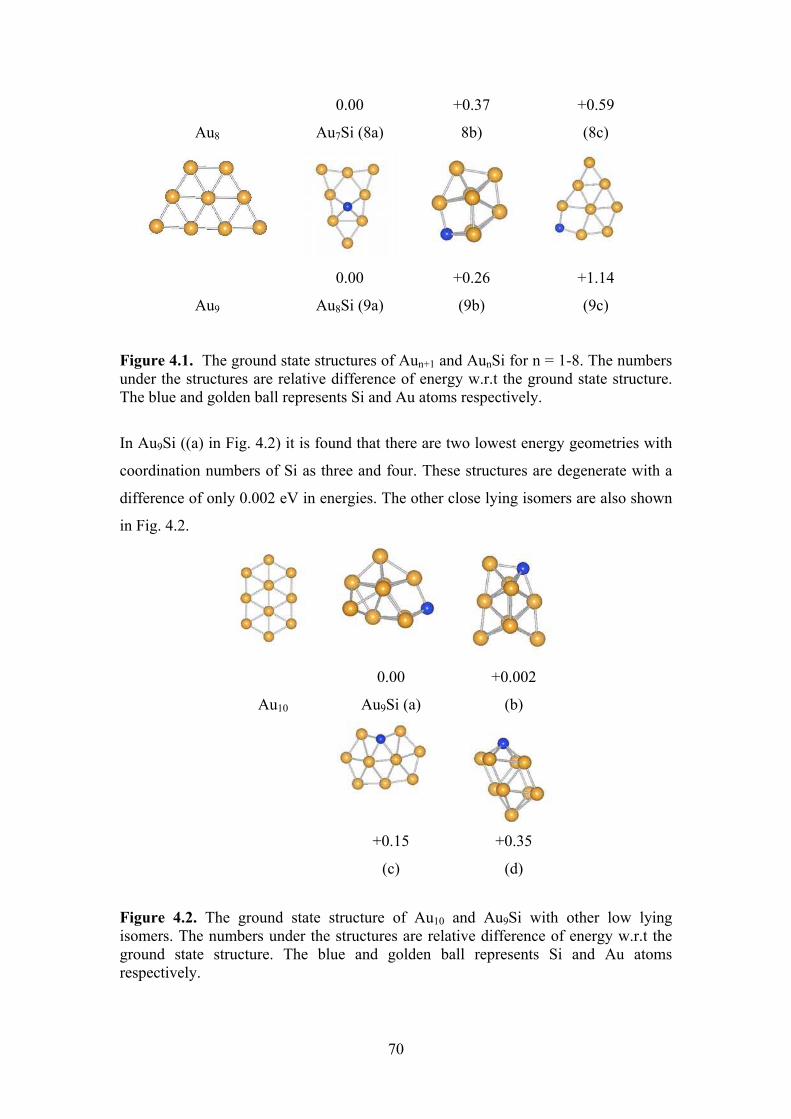
70
Au8
0.00
Au7Si (8a)
+0.37
8b)
+0.59
(8c)
Au9
0.00
Au8Si (9a)
+0.26
(9b)
+1.14
(9c)
Figure 4.1. The ground state structures of Aun+1 and AunSi for n = 1-8. The numbers under the structures are relative difference of energy w.r.t the ground state structure. The blue and golden ball represents Si and Au atoms respectively.
In Au9Si ((a) in Fig. 4.2) it is found that there are two lowest energy geometries with
coordination numbers of Si as three and four. These structures are degenerate with a
difference of only 0.002 eV in energies. The other close lying isomers are also shown
in Fig. 4.2.
Au10
0.00
Au9Si (a)
+0.002
(b)
+0.15
(c)
+0.35
(d)
Figure 4.2. The ground state structure of Au10 and Au9Si with other low lying isomers. The numbers under the structures are relative difference of energy w.r.t the ground state structure. The blue and golden ball represents Si and Au atoms respectively.
71
In Au10Si, there are two isomers ((a) and (b) of Fig. 4.3) are nearly isoenergetic with
an energy difference of 0.001 eV. Other less favored isomers are also presented in
Fig. 4.3. It can be observed that there is clear preference for clusters having Si with a
coordination number of four.
Au11 Au10Si (a) 0.00 +0.001(b)
+0.159 ( c) +0.182 (d)
Figure 4.3 The ground state structure of Au11 and Au10Si with other low lying isomers. The numbers under the structures are relative difference of energy w.r.t the ground state structure. The blue and golden ball represents Si and Au atoms respectively.
To obtain the lowest energy isomer of Au11Si ((a)-(c), Fig. 4.4), we begin with initial
geometries of Au12, such as icosahedron or cuboctahedron; out of which every atom is
replaced by a Si atom by turns. The lowest energy structure is (a) with C1 symmetry.
Au12 Au11Si (a) 0.00 +0.43 ( b)
+0.64 (c)
Figure 4.4 The ground state structure of Au12 and Au11Si with other low lying isomers. The numbers under the structures are relative difference of energy w.r.t the ground state structure. The blue and golden ball represents Si and Au atoms respectively.
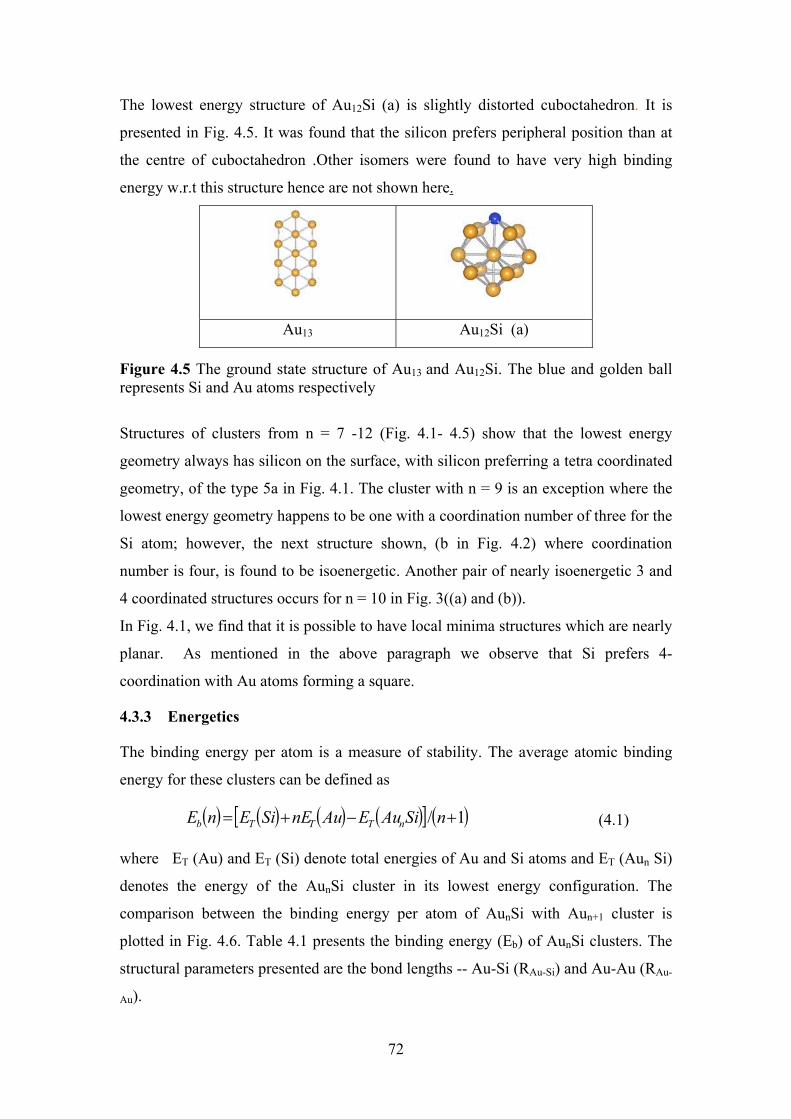
72
The lowest energy structure of Au12Si (a) is slightly distorted cuboctahedron. It is
presented in Fig. 4.5. It was found that the silicon prefers peripheral position than at
the centre of cuboctahedron .Other isomers were found to have very high binding
energy w.r.t this structure hence are not shown here.
Au13 Au12Si (a)
Figure 4.5 The ground state structure of Au13 and Au12Si. The blue and golden ball represents Si and Au atoms respectively
Structures of clusters from n = 7 -12 (Fig. 4.1- 4.5) show that the lowest energy
geometry always has silicon on the surface, with silicon preferring a tetra coordinated
geometry, of the type 5a in Fig. 4.1. The cluster with n = 9 is an exception where the
lowest energy geometry happens to be one with a coordination number of three for the
Si atom; however, the next structure shown, (b in Fig. 4.2) where coordination
number is four, is found to be isoenergetic. Another pair of nearly isoenergetic 3 and
4 coordinated structures occurs for n = 10 in Fig. 3((a) and (b)).
In Fig. 4.1, we find that it is possible to have local minima structures which are nearly
planar. As mentioned in the above paragraph we observe that Si prefers 4-
coordination with Au atoms forming a square.
4.3.3 Energetics
The binding energy per atom is a measure of stability. The average atomic binding
energy for these clusters can be defined as
( ) ( ) ( ) ( )[ ] ( )1/ +−+= nSiAuEAunESiEnE nTTTb (4.1)
where ET (Au) and ET (Si) denote total energies of Au and Si atoms and ET (Aun Si)
denotes the energy of the AunSi cluster in its lowest energy configuration. The
comparison between the binding energy per atom of AunSi with Aun+1 cluster is
plotted in Fig. 4.6. Table 4.1 presents the binding energy (Eb) of AunSi clusters. The
structural parameters presented are the bond lengths -- Au-Si (RAu-Si) and Au-Au (RAu-
Au).
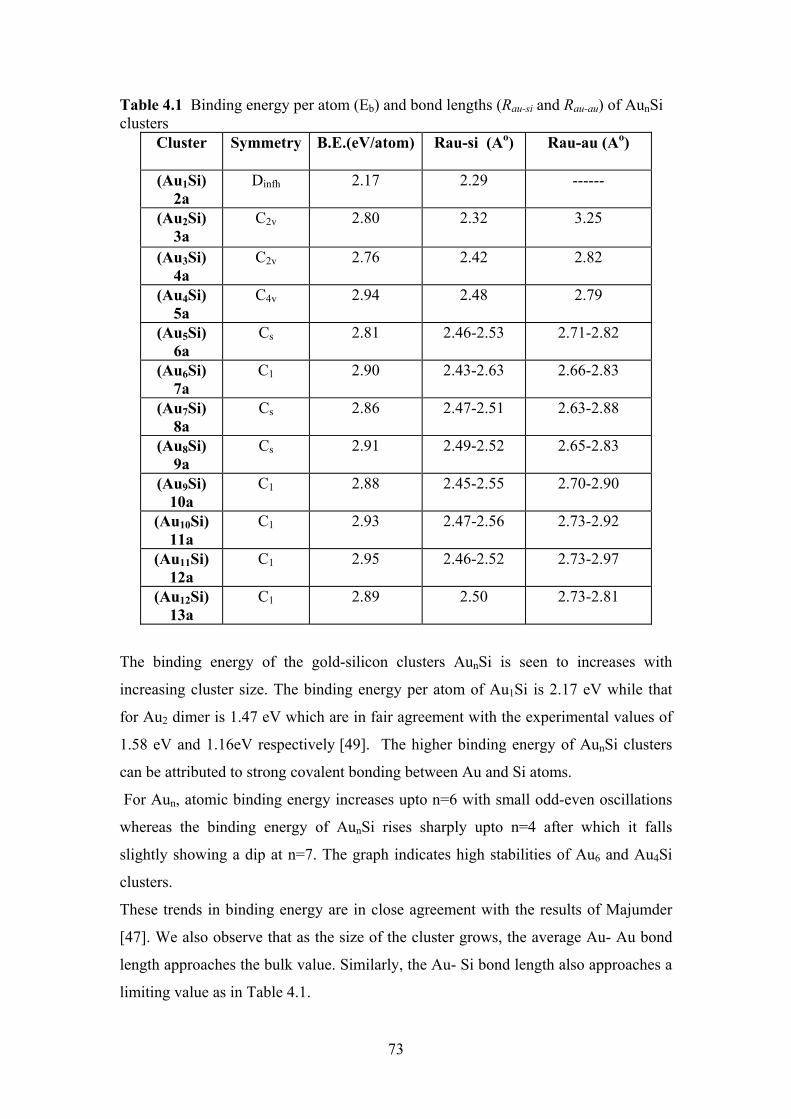
73
Table 4.1 Binding energy per atom (Eb) and bond lengths (Rau-si and Rau-au) of AunSi clusters
Cluster Symmetry B.E.(eV/atom) Rau-si (Ao) Rau-au (A
o)
(Au1Si)
2a
Dinfh 2.17 2.29 ------
(Au2Si)
3a
C2v 2.80 2.32 3.25
(Au3Si)
4a
C2v 2.76 2.42 2.82
(Au4Si)
5a
C4v 2.94 2.48 2.79
(Au5Si)
6a
Cs 2.81 2.46-2.53 2.71-2.82
(Au6Si)
7a
C1 2.90 2.43-2.63 2.66-2.83
(Au7Si)
8a
Cs 2.86 2.47-2.51 2.63-2.88
(Au8Si)
9a
Cs 2.91 2.49-2.52 2.65-2.83
(Au9Si)
10a
C1 2.88 2.45-2.55 2.70-2.90
(Au10Si)
11a
C1 2.93 2.47-2.56 2.73-2.92
(Au11Si)
12a
C1 2.95 2.46-2.52 2.73-2.97
(Au12Si)
13a
C1 2.89 2.50 2.73-2.81
The binding energy of the gold-silicon clusters AunSi is seen to increases with
increasing cluster size. The binding energy per atom of Au1Si is 2.17 eV while that
for Au2 dimer is 1.47 eV which are in fair agreement with the experimental values of
1.58 eV and 1.16eV respectively [49]. The higher binding energy of AunSi clusters
can be attributed to strong covalent bonding between Au and Si atoms.
For Aun, atomic binding energy increases upto n=6 with small odd-even oscillations
whereas the binding energy of AunSi rises sharply upto n=4 after which it falls
slightly showing a dip at n=7. The graph indicates high stabilities of Au6 and Au4Si
clusters.
These trends in binding energy are in close agreement with the results of Majumder
[47]. We also observe that as the size of the cluster grows, the average Au- Au bond
length approaches the bulk value. Similarly, the Au- Si bond length also approaches a
limiting value as in Table 4.1.
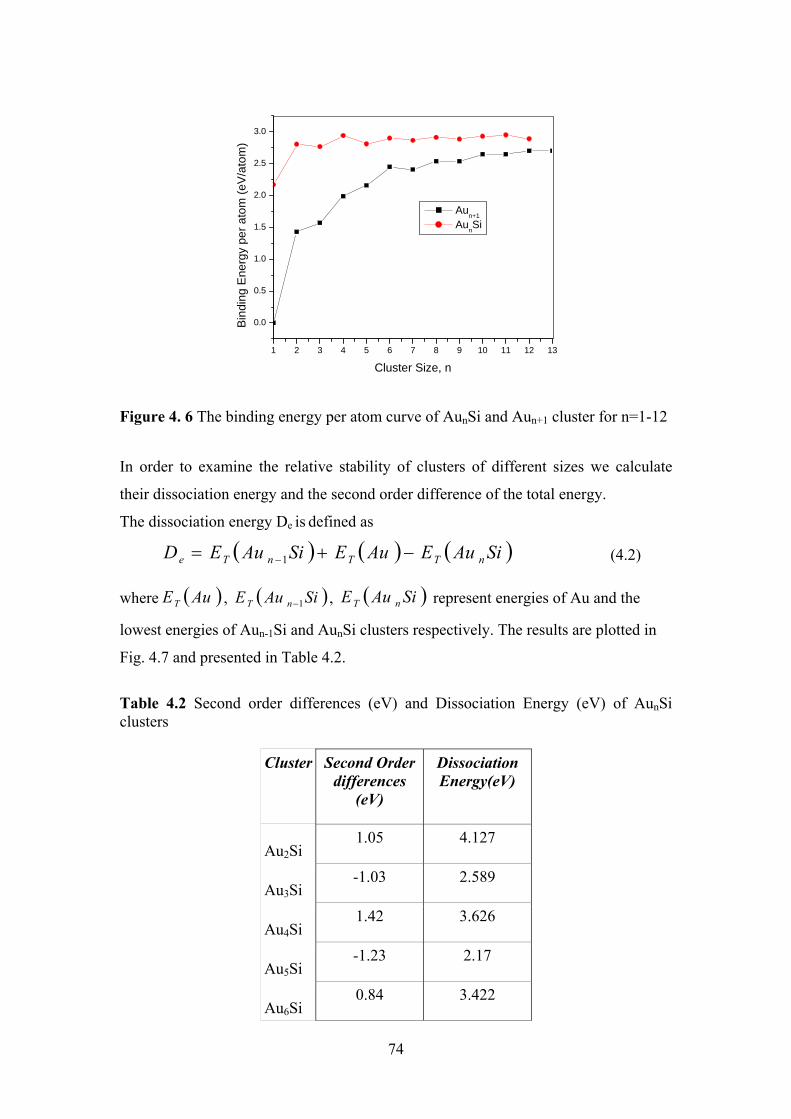
74
1 2 3 4 5 6 7 8 9 10 11 12 13
0.0
0.5
1.0
1.5
2.0
2.5
3.0
Bin
ding
Ene
rgy
per
atom
(eV
/ato
m)
Cluster Size, n
Aun+1
AunSi
Figure 4. 6 The binding energy per atom curve of AunSi and Aun+1 cluster for n=1-12
In order to examine the relative stability of clusters of different sizes we calculate
their dissociation energy and the second order difference of the total energy.
The dissociation energy De is defined as
( ) ( ) ( )SiAuEAuESiAuED nTTnTe −+= −1 (4.2)
where ( )AuET , ( )SiAuE nT 1− , ( )SiAuE nT represent energies of Au and the
lowest energies of Aun-1Si and AunSi clusters respectively. The results are plotted in
Fig. 4.7 and presented in Table 4.2.
Table 4.2 Second order differences (eV) and Dissociation Energy (eV) of AunSi clusters
Cluster Second Order
differences
(eV)
Dissociation
Energy(eV)
Au2Si 1.05 4.127
Au3Si -1.03 2.589
Au4Si 1.42 3.626
Au5Si -1.23 2.17
Au6Si 0.84 3.422
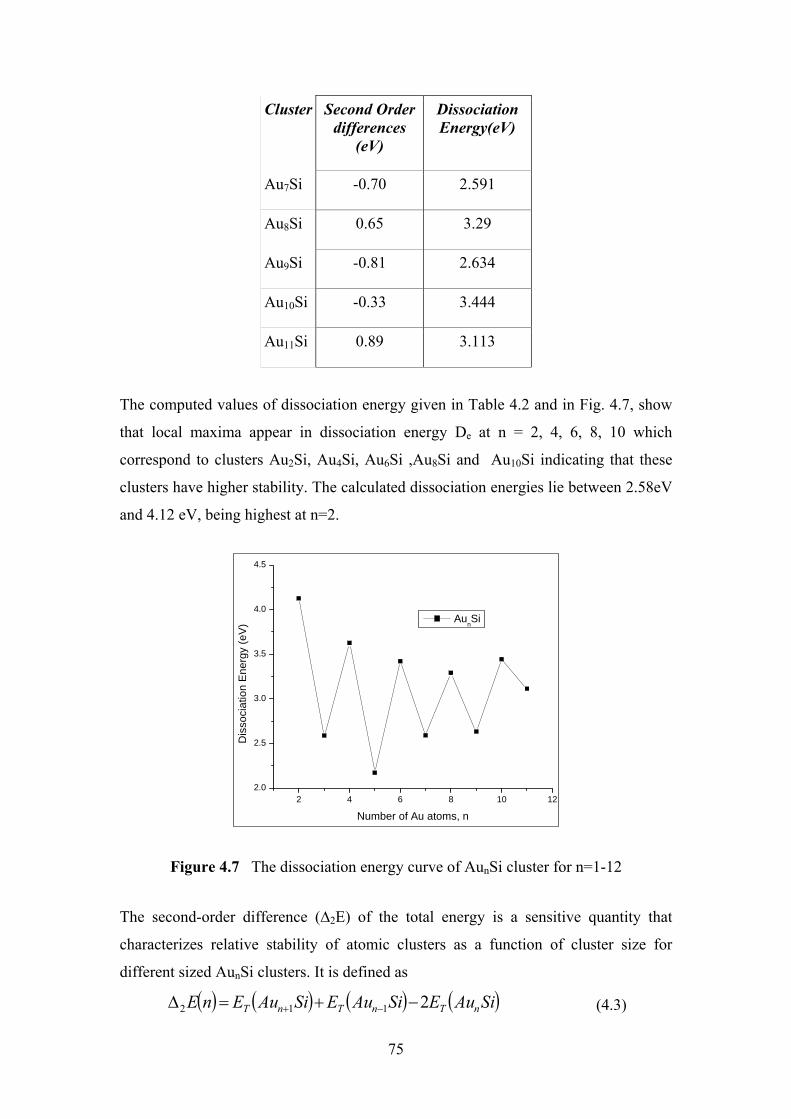
75
Cluster Second Order
differences
(eV)
Dissociation
Energy(eV)
Au7Si -0.70 2.591
Au8Si 0.65 3.29
Au9Si -0.81 2.634
Au10Si -0.33 3.444
Au11Si 0.89 3.113
The computed values of dissociation energy given in Table 4.2 and in Fig. 4.7, show
that local maxima appear in dissociation energy De at n = 2, 4, 6, 8, 10 which
correspond to clusters Au2Si, Au4Si, Au6Si ,Au8Si and Au10Si indicating that these
clusters have higher stability. The calculated dissociation energies lie between 2.58eV
and 4.12 eV, being highest at n=2.
2 4 6 8 10 122.0
2.5
3.0
3.5
4.0
4.5
Dis
soci
atio
n E
nerg
y (e
V)
Number of Au atoms, n
AunSi
Figure 4.7 The dissociation energy curve of AunSi cluster for n=1-12
The second-order difference (∆2E) of the total energy is a sensitive quantity that
characterizes relative stability of atomic clusters as a function of cluster size for
different sized AunSi clusters. It is defined as
( ) ( ) ( ) ( )SiAuESiAuESiAuEnE nTnTnT 2112 −+=∆ −+ (4.3)
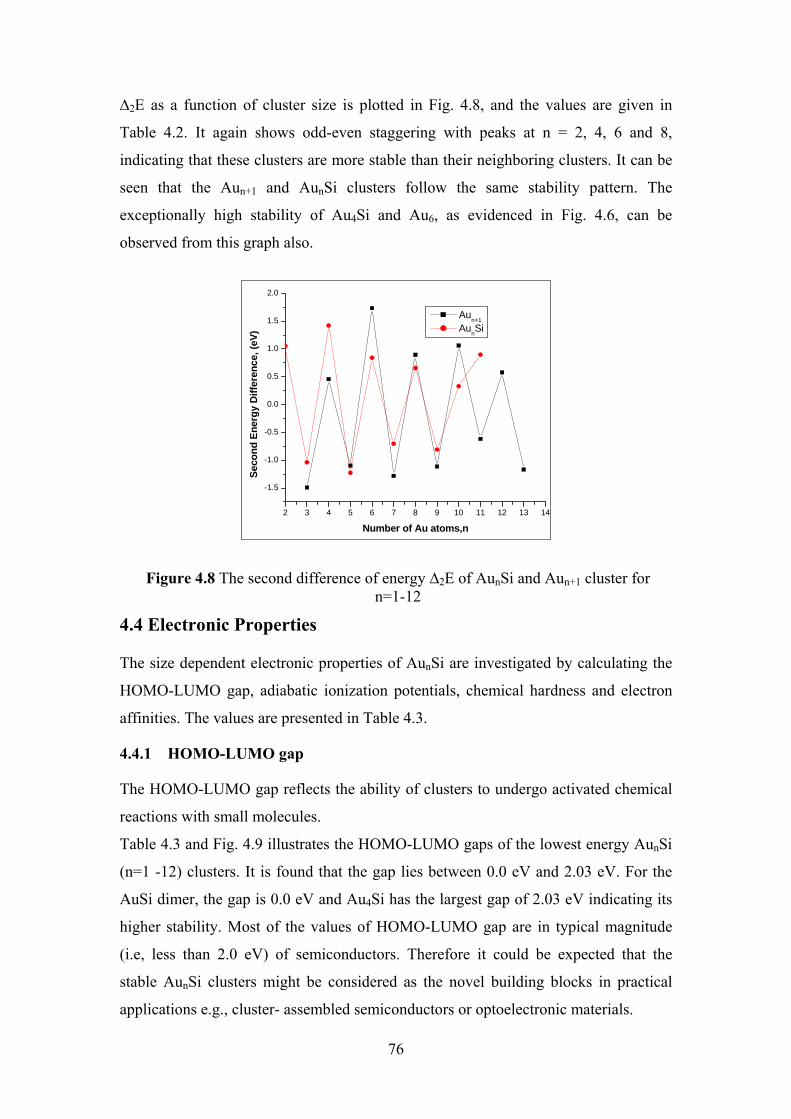
76
∆2E as a function of cluster size is plotted in Fig. 4.8, and the values are given in
Table 4.2. It again shows odd-even staggering with peaks at n = 2, 4, 6 and 8,
indicating that these clusters are more stable than their neighboring clusters. It can be
seen that the Aun+1 and AunSi clusters follow the same stability pattern. The
exceptionally high stability of Au4Si and Au6, as evidenced in Fig. 4.6, can be
observed from this graph also.
2 3 4 5 6 7 8 9 10 11 12 13 14
-1.5
-1.0
-0.5
0.0
0.5
1.0
1.5
2.0
Sec
on
d E
nerg
y D
iffer
ence
, (eV
)
Number of Au atoms,n
Aun+1
AunSi
Figure 4.8 The second difference of energy ∆2E of AunSi and Aun+1 cluster for n=1-12
4.4 Electronic Properties
The size dependent electronic properties of AunSi are investigated by calculating the
HOMO-LUMO gap, adiabatic ionization potentials, chemical hardness and electron
affinities. The values are presented in Table 4.3.
4.4.1 HOMO-LUMO gap
The HOMO-LUMO gap reflects the ability of clusters to undergo activated chemical
reactions with small molecules.
Table 4.3 and Fig. 4.9 illustrates the HOMO-LUMO gaps of the lowest energy AunSi
(n=1 -12) clusters. It is found that the gap lies between 0.0 eV and 2.03 eV. For the
AuSi dimer, the gap is 0.0 eV and Au4Si has the largest gap of 2.03 eV indicating its
higher stability. Most of the values of HOMO-LUMO gap are in typical magnitude
(i.e, less than 2.0 eV) of semiconductors. Therefore it could be expected that the
stable AunSi clusters might be considered as the novel building blocks in practical
applications e.g., cluster- assembled semiconductors or optoelectronic materials.
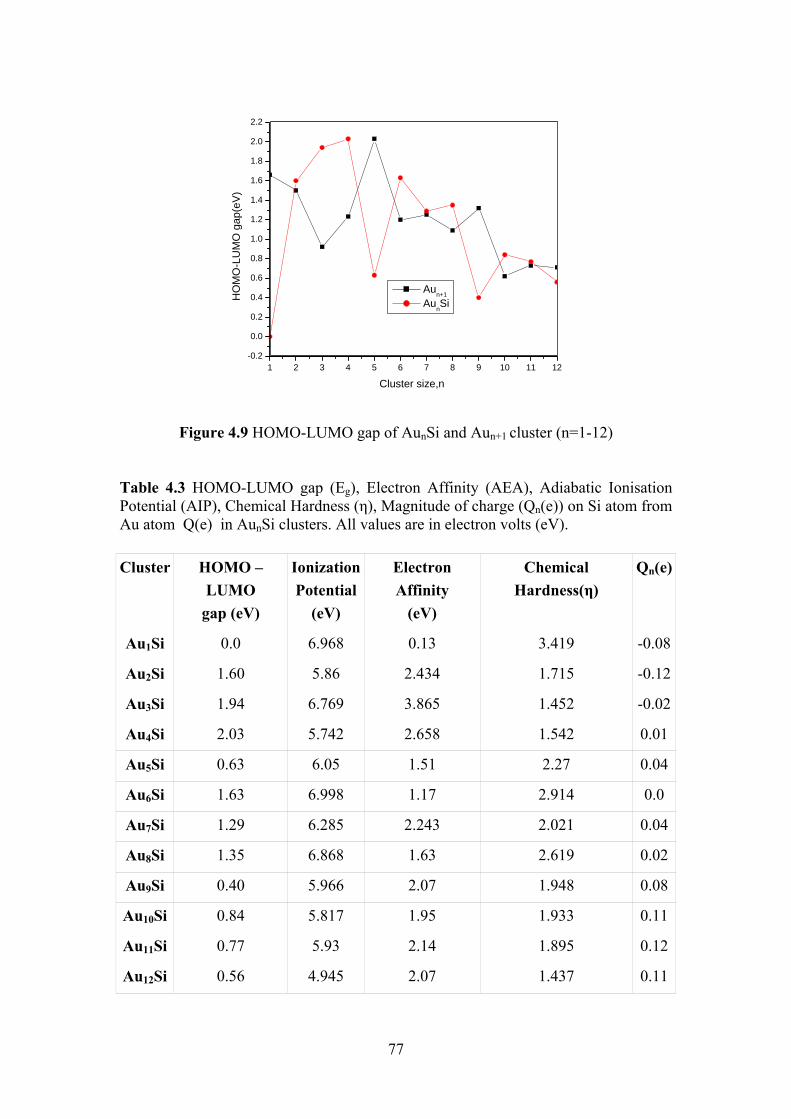
77
1 2 3 4 5 6 7 8 9 10 11 12-0.2
0.0
0.2
0.4
0.6
0.8
1.0
1.2
1.4
1.6
1.8
2.0
2.2
HO
MO
-LU
MO
gap
(eV
)
Cluster size,n
Aun+1
AunSi
Figure 4.9 HOMO-LUMO gap of AunSi and Aun+1 cluster (n=1-12)
Table 4.3 HOMO-LUMO gap (Eg), Electron Affinity (AEA), Adiabatic Ionisation Potential (AIP), Chemical Hardness (さ), Magnitude of charge (Qn(e)) on Si atom from Au atom Q(e) in AunSi clusters. All values are in electron volts (eV).
Cluster HOMO –
LUMO
gap (eV)
Ionization
Potential
(eV)
Electron
Affinity
(eV)
Chemical
Hardness(Ș)
Qn(e)
Au1Si 0.0 6.968 0.13 3.419 -0.08
Au2Si 1.60 5.86 2.434 1.715 -0.12
Au3Si 1.94 6.769 3.865 1.452 -0.02
Au4Si 2.03 5.742 2.658 1.542 0.01
Au5Si 0.63 6.05 1.51 2.27 0.04
Au6Si 1.63 6.998 1.17 2.914 0.0
Au7Si 1.29 6.285 2.243 2.021 0.04
Au8Si 1.35 6.868 1.63 2.619 0.02
Au9Si 0.40 5.966 2.07 1.948 0.08
Au10Si 0.84 5.817 1.95 1.933 0.11
Au11Si 0.77 5.93 2.14 1.895 0.12
Au12Si 0.56 4.945 2.07 1.437 0.11
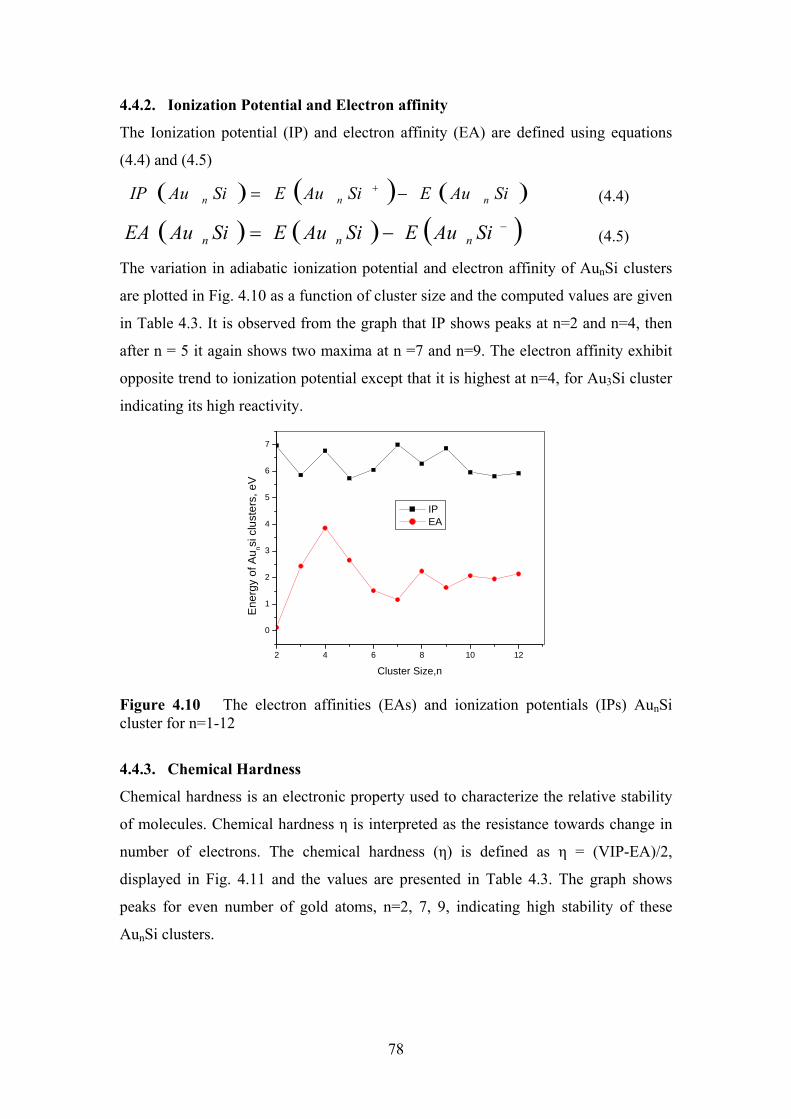
78
4.4.2. Ionization Potential and Electron affinity
The Ionization potential (IP) and electron affinity (EA) are defined using equations
(4.4) and (4.5)
( ) ( ) ( )SiAuESiAuESiAuIP nnn −= + (4.4)
( ) ( ) ( )−−= SiAuESiAuESiAuEA nnn (4.5)
The variation in adiabatic ionization potential and electron affinity of AunSi clusters
are plotted in Fig. 4.10 as a function of cluster size and the computed values are given
in Table 4.3. It is observed from the graph that IP shows peaks at n=2 and n=4, then
after n = 5 it again shows two maxima at n =7 and n=9. The electron affinity exhibit
opposite trend to ionization potential except that it is highest at n=4, for Au3Si cluster
indicating its high reactivity.
2 4 6 8 10 12
0
1
2
3
4
5
6
7
Ene
rgy
of A
u nsi c
lust
ers,
eV
Cluster Size,n
IP EA
Figure 4.10 The electron affinities (EAs) and ionization potentials (IPs) AunSi cluster for n=1-12
4.4.3. Chemical Hardness
Chemical hardness is an electronic property used to characterize the relative stability
of molecules. Chemical hardness さ is interpreted as the resistance towards change in
number of electrons. The chemical hardness (さ) is defined as さ = (VIP-EA)/2,
displayed in Fig. 4.11 and the values are presented in Table 4.3. The graph shows
peaks for even number of gold atoms, n=2, 7, 9, indicating high stability of these
AunSi clusters.
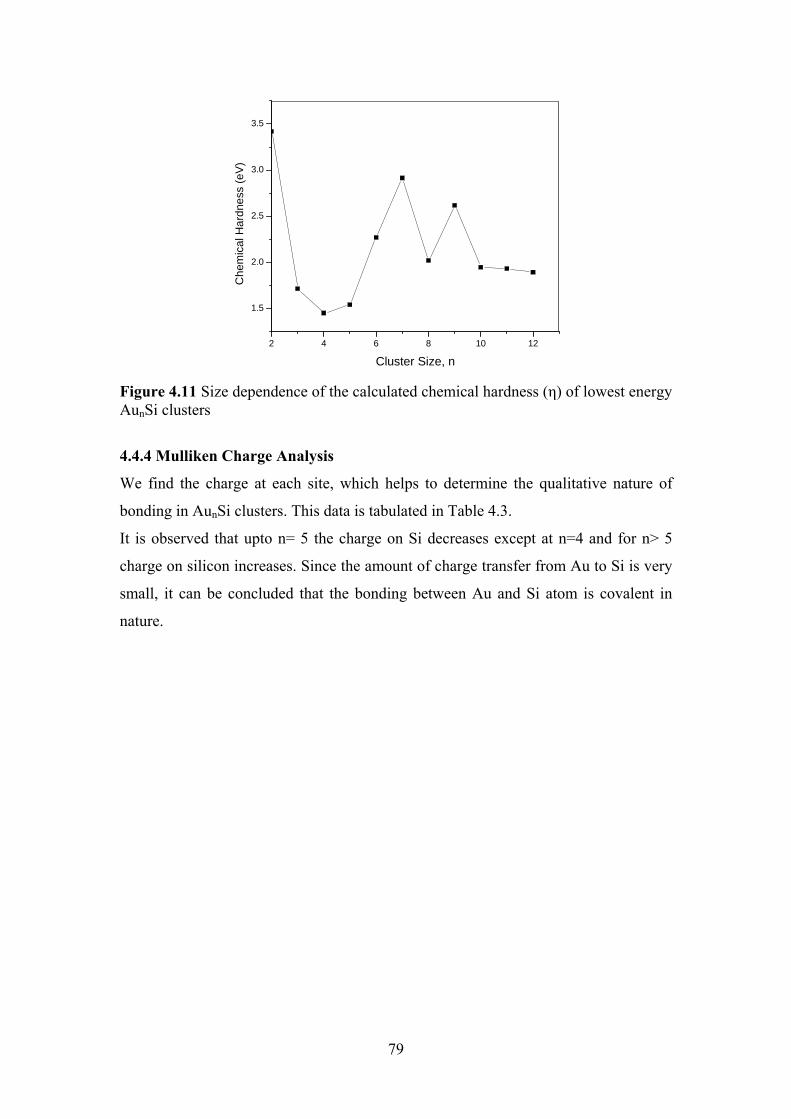
79
2 4 6 8 10 12
1.5
2.0
2.5
3.0
3.5
Che
mic
al H
ardn
ess
(eV
)
Cluster Size, n
Figure 4.11 Size dependence of the calculated chemical hardness (さ) of lowest energy AunSi clusters
4.4.4 Mulliken Charge Analysis
We find the charge at each site, which helps to determine the qualitative nature of
bonding in AunSi clusters. This data is tabulated in Table 4.3.
It is observed that upto n= 5 the charge on Si decreases except at n=4 and for n> 5
charge on silicon increases. Since the amount of charge transfer from Au to Si is very
small, it can be concluded that the bonding between Au and Si atom is covalent in
nature.
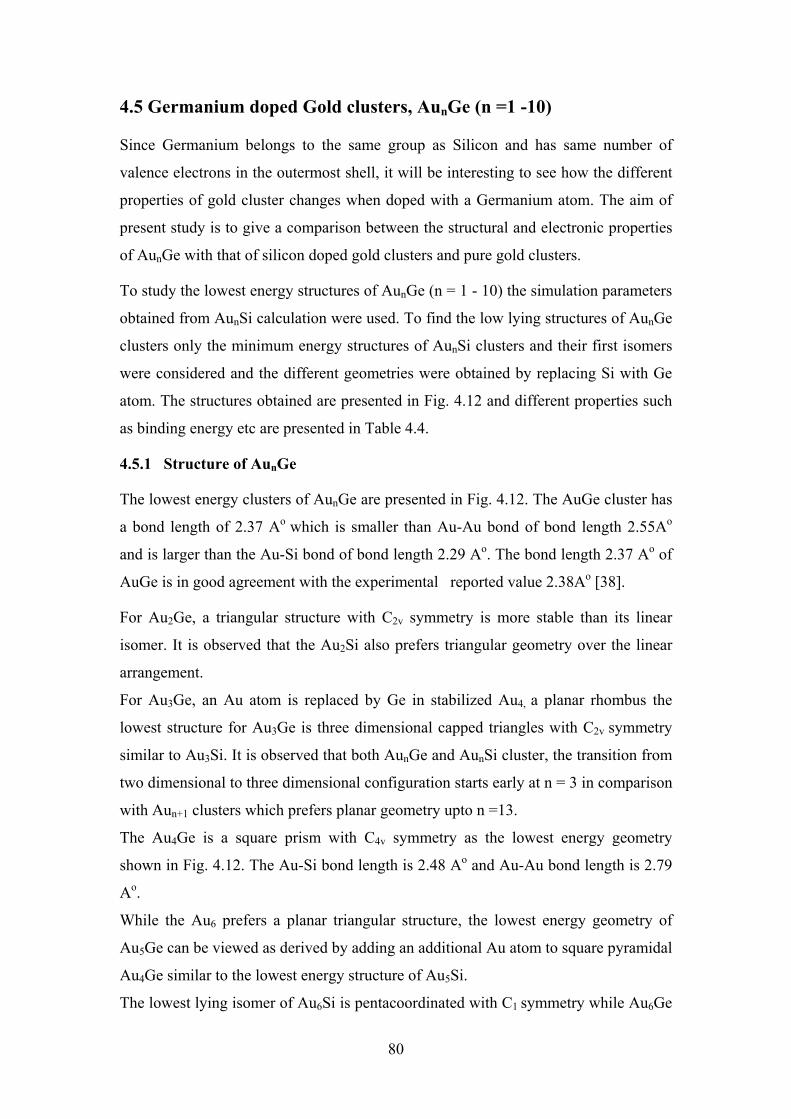
80
4.5 Germanium doped Gold clusters, AunGe (n =1 -10)
Since Germanium belongs to the same group as Silicon and has same number of
valence electrons in the outermost shell, it will be interesting to see how the different
properties of gold cluster changes when doped with a Germanium atom. The aim of
present study is to give a comparison between the structural and electronic properties
of AunGe with that of silicon doped gold clusters and pure gold clusters.
To study the lowest energy structures of AunGe (n = 1 - 10) the simulation parameters
obtained from AunSi calculation were used. To find the low lying structures of AunGe
clusters only the minimum energy structures of AunSi clusters and their first isomers
were considered and the different geometries were obtained by replacing Si with Ge
atom. The structures obtained are presented in Fig. 4.12 and different properties such
as binding energy etc are presented in Table 4.4.
4.5.1 Structure of AunGe
The lowest energy clusters of AunGe are presented in Fig. 4.12. The AuGe cluster has
a bond length of 2.37 Ao which is smaller than Au-Au bond of bond length 2.55Ao
and is larger than the Au-Si bond of bond length 2.29 Ao. The bond length 2.37 Ao of
AuGe is in good agreement with the experimental reported value 2.38Ao [38].
For Au2Ge, a triangular structure with C2v symmetry is more stable than its linear
isomer. It is observed that the Au2Si also prefers triangular geometry over the linear
arrangement.
For Au3Ge, an Au atom is replaced by Ge in stabilized Au4, a planar rhombus the
lowest structure for Au3Ge is three dimensional capped triangles with C2v symmetry
similar to Au3Si. It is observed that both AunGe and AunSi cluster, the transition from
two dimensional to three dimensional configuration starts early at n = 3 in comparison
with Aun+1 clusters which prefers planar geometry upto n =13.
The Au4Ge is a square prism with C4v symmetry as the lowest energy geometry
shown in Fig. 4.12. The Au-Si bond length is 2.48 Ao and Au-Au bond length is 2.79
Ao.
While the Au6 prefers a planar triangular structure, the lowest energy geometry of
Au5Ge can be viewed as derived by adding an additional Au atom to square pyramidal
Au4Ge similar to the lowest energy structure of Au5Si.
The lowest lying isomer of Au6Si is pentacoordinated with C1 symmetry while Au6Ge
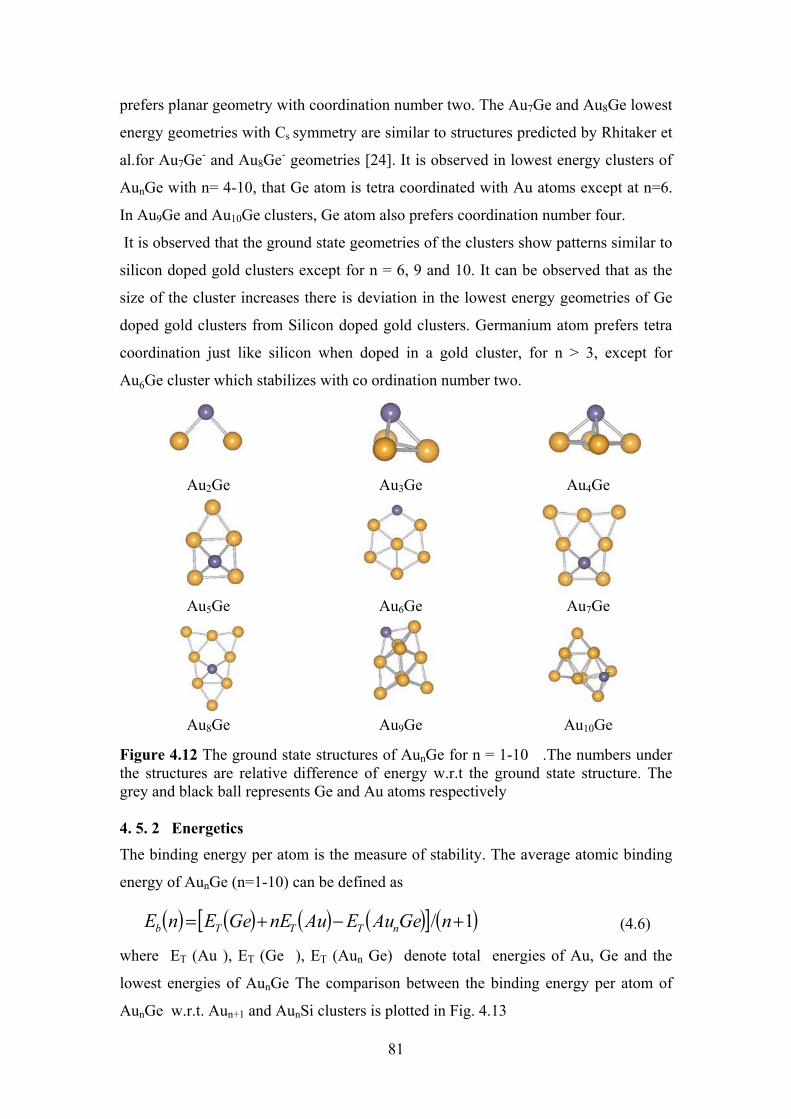
81
prefers planar geometry with coordination number two. The Au7Ge and Au8Ge lowest
energy geometries with Cs symmetry are similar to structures predicted by Rhitaker et
al.for Au7Ge- and Au8Ge- geometries [24]. It is observed in lowest energy clusters of
AunGe with n= 4-10, that Ge atom is tetra coordinated with Au atoms except at n=6.
In Au9Ge and Au10Ge clusters, Ge atom also prefers coordination number four.
It is observed that the ground state geometries of the clusters show patterns similar to
silicon doped gold clusters except for n = 6, 9 and 10. It can be observed that as the
size of the cluster increases there is deviation in the lowest energy geometries of Ge
doped gold clusters from Silicon doped gold clusters. Germanium atom prefers tetra
coordination just like silicon when doped in a gold cluster, for n > 3, except for
Au6Ge cluster which stabilizes with co ordination number two.
Au2Ge Au3Ge Au4Ge
Au5Ge Au6Ge Au7Ge
Au8Ge Au9Ge Au10Ge
Figure 4.12 The ground state structures of AunGe for n = 1-10 .The numbers under the structures are relative difference of energy w.r.t the ground state structure. The grey and black ball represents Ge and Au atoms respectively 4. 5. 2 Energetics
The binding energy per atom is the measure of stability. The average atomic binding
energy of AunGe (n=1-10) can be defined as
( ) ( ) ( ) ( )[ ] ( )1/ +−+= nGeAuEAunEGeEnE nTTTb (4.6)
where ET (Au ), ET (Ge ), ET (Aun Ge) denote total energies of Au, Ge and the
lowest energies of AunGe The comparison between the binding energy per atom of
AunGe w.r.t. Aun+1 and AunSi clusters is plotted in Fig. 4.13
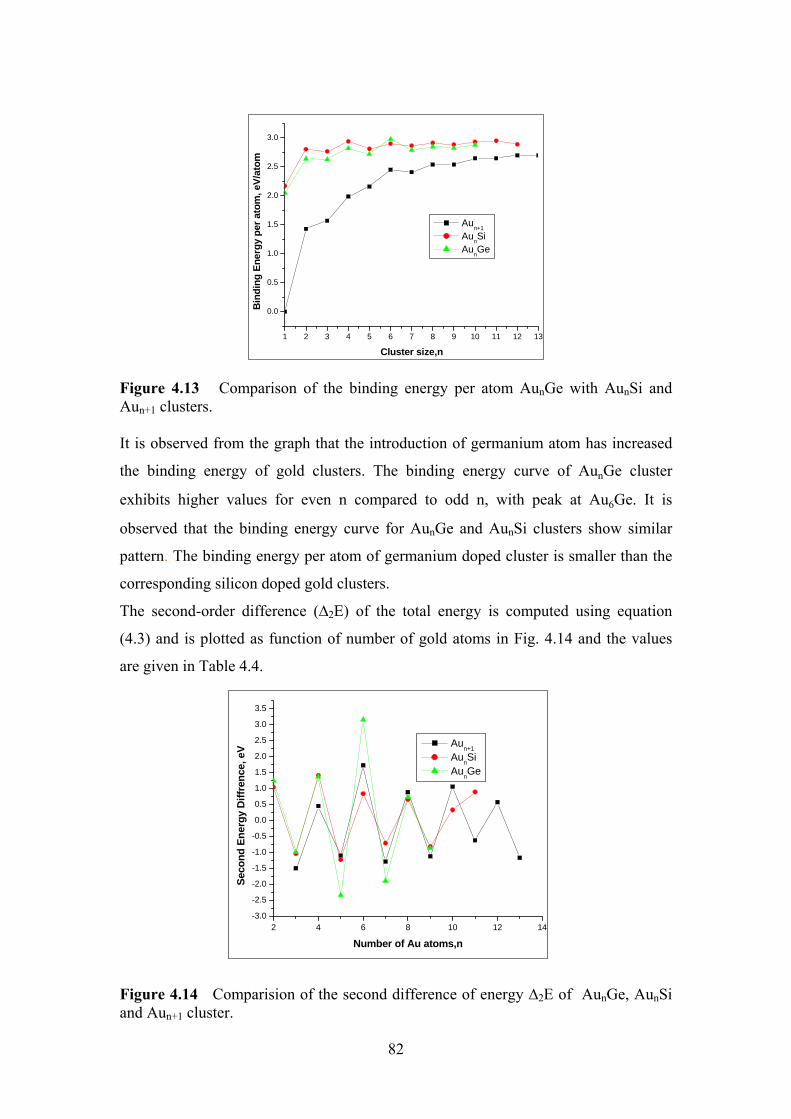
82
1 2 3 4 5 6 7 8 9 10 11 12 13
0.0
0.5
1.0
1.5
2.0
2.5
3.0
Bin
ding
Ene
rgy
per
atom
, eV
/ato
m
Cluster size,n
Aun+1
AunSi
AunGe
Figure 4.13 Comparison of the binding energy per atom AunGe with AunSi and Aun+1 clusters.
It is observed from the graph that the introduction of germanium atom has increased
the binding energy of gold clusters. The binding energy curve of AunGe cluster
exhibits higher values for even n compared to odd n, with peak at Au6Ge. It is
observed that the binding energy curve for AunGe and AunSi clusters show similar
pattern. The binding energy per atom of germanium doped cluster is smaller than the
corresponding silicon doped gold clusters.
The second-order difference (∆2E) of the total energy is computed using equation
(4.3) and is plotted as function of number of gold atoms in Fig. 4.14 and the values
are given in Table 4.4.
2 4 6 8 10 12 14-3.0
-2.5
-2.0
-1.5
-1.0
-0.5
0.0
0.5
1.0
1.5
2.0
2.5
3.0
3.5
Sec
on
d E
ner
gy
Dif
fren
ce, e
V
Number of Au atoms,n
Aun+1
AunSi
AunGe
Figure 4.14 Comparision of the second difference of energy ∆2E of AunGe, AunSi and Aun+1 cluster.
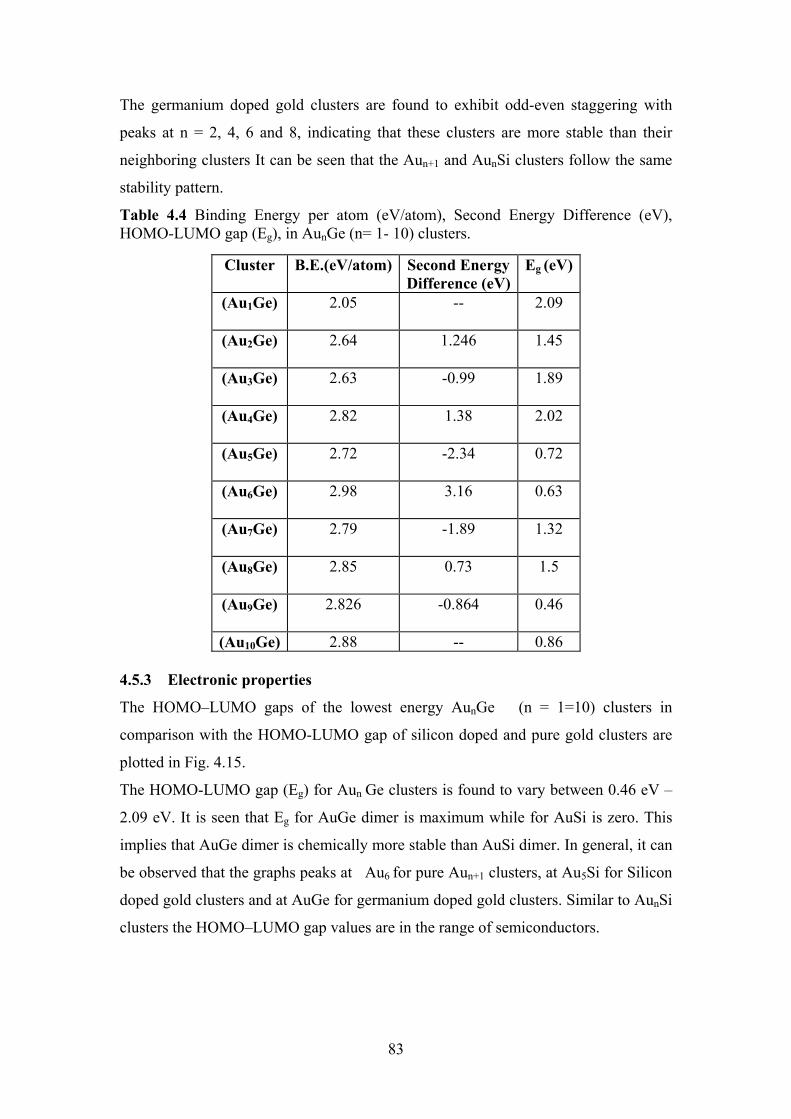
83
The germanium doped gold clusters are found to exhibit odd-even staggering with
peaks at n = 2, 4, 6 and 8, indicating that these clusters are more stable than their
neighboring clusters It can be seen that the Aun+1 and AunSi clusters follow the same
stability pattern.
Table 4.4 Binding Energy per atom (eV/atom), Second Energy Difference (eV), HOMO-LUMO gap (Eg), in AunGe (n= 1- 10) clusters.
Cluster B.E.(eV/atom) Second Energy
Difference (eV)
Eg (eV)
(Au1Ge)
2.05 -- 2.09
(Au2Ge)
2.64 1.246 1.45
(Au3Ge)
2.63 -0.99 1.89
(Au4Ge)
2.82 1.38 2.02
(Au5Ge)
2.72 -2.34 0.72
(Au6Ge)
2.98 3.16 0.63
(Au7Ge)
2.79 -1.89 1.32
(Au8Ge)
2.85 0.73 1.5
(Au9Ge)
2.826 -0.864 0.46
(Au10Ge) 2.88 -- 0.86
4.5.3 Electronic properties
The HOMO–LUMO gaps of the lowest energy AunGe (n = 1=10) clusters in
comparison with the HOMO-LUMO gap of silicon doped and pure gold clusters are
plotted in Fig. 4.15.
The HOMO-LUMO gap (Eg) for Aun Ge clusters is found to vary between 0.46 eV –
2.09 eV. It is seen that Eg for AuGe dimer is maximum while for AuSi is zero. This
implies that AuGe dimer is chemically more stable than AuSi dimer. In general, it can
be observed that the graphs peaks at Au6 for pure Aun+1 clusters, at Au5Si for Silicon
doped gold clusters and at AuGe for germanium doped gold clusters. Similar to AunSi
clusters the HOMO–LUMO gap values are in the range of semiconductors.
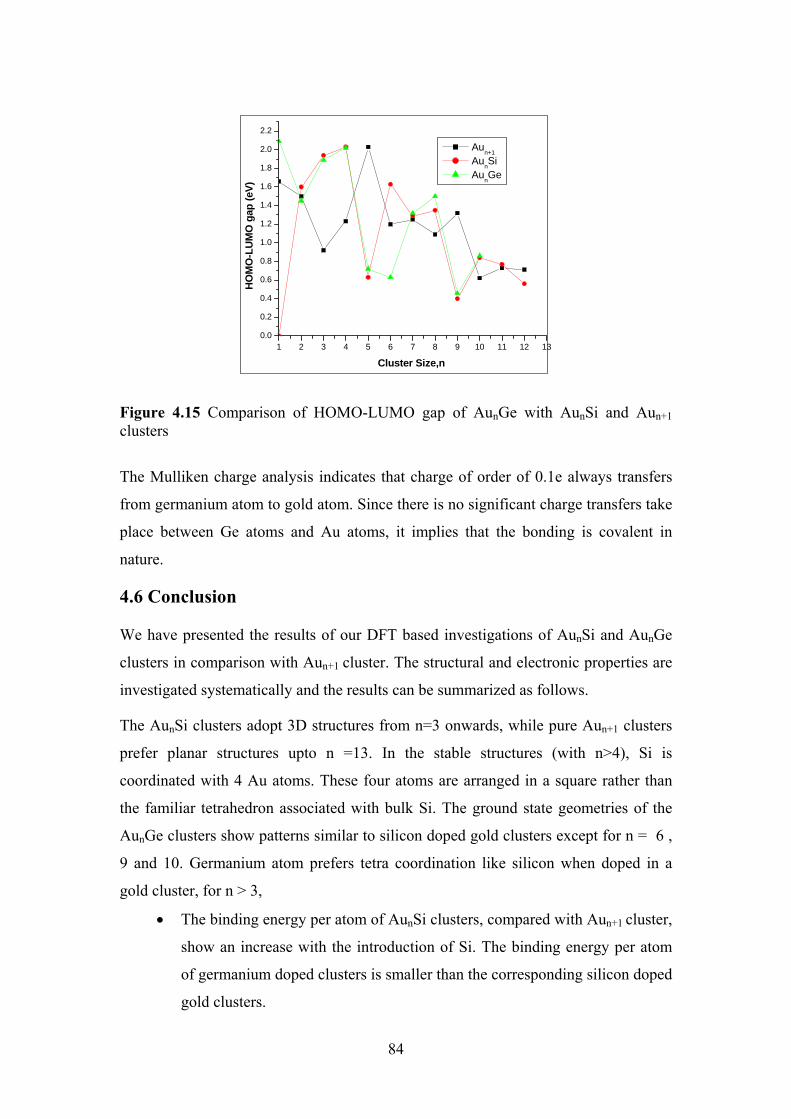
84
1 2 3 4 5 6 7 8 9 10 11 12 130.0
0.2
0.4
0.6
0.8
1.0
1.2
1.4
1.6
1.8
2.0
2.2
HO
MO
-LU
MO
gap
(eV
)
Cluster Size,n
Aun+1
AunSi
AunGe
Figure 4.15 Comparison of HOMO-LUMO gap of AunGe with AunSi and Aun+1 clusters
The Mulliken charge analysis indicates that charge of order of 0.1e always transfers
from germanium atom to gold atom. Since there is no significant charge transfers take
place between Ge atoms and Au atoms, it implies that the bonding is covalent in
nature.
4.6 Conclusion
We have presented the results of our DFT based investigations of AunSi and AunGe
clusters in comparison with Aun+1 cluster. The structural and electronic properties are
investigated systematically and the results can be summarized as follows.
The AunSi clusters adopt 3D structures from n=3 onwards, while pure Aun+1 clusters
prefer planar structures upto n =13. In the stable structures (with n>4), Si is
coordinated with 4 Au atoms. These four atoms are arranged in a square rather than
the familiar tetrahedron associated with bulk Si. The ground state geometries of the
AunGe clusters show patterns similar to silicon doped gold clusters except for n = 6 ,
9 and 10. Germanium atom prefers tetra coordination like silicon when doped in a
gold cluster, for n > 3,
• The binding energy per atom of AunSi clusters, compared with Aun+1 cluster,
show an increase with the introduction of Si. The binding energy per atom
of germanium doped clusters is smaller than the corresponding silicon doped
gold clusters.
85
• All three curves -- binding energy, second energy difference and
dissociation energy, show that even number of gold atoms in a cluster makes
it more stable compared to its odd numbered neighbours. In fact Au4Si and
Au6 are most stable in their respective classes.
• The HOMO–LUMO gap values of both Silicon and Germanium doped gold
clusters lies in the range of semiconductors.
• The Mulliken charge analysis of AunSi and AunGe clusters indicates
covalent bonding between Si and Au atoms, Ge and Au atoms.
86
Bibliography
[1] P.Pyykko, N. Runeberg, Angew. Chem., Int. Ed. 41, 2174 (2002).
[2] M. Zhang, X. J. Feng, L. X. Zhao, L. M. H. Li and Y. H. Luo, Chin. Phys. B 19, 4 043103 (2010).
[3] X Li, B. Kiran, L.F. Cui and L. S. Wang, Phys. Rev. Lett. 95, 253401(2005).
[4] L. M. Wang, R. Pal, W. Huang, X. C. Zeng, L. S. Wang, J. Chem. Phys. 130 , 051101 (2009).
[5] H. Häkkinen, S. Abbet, A. Sanchez, U. Heiz , U. Landman, Angew. Chem, Int. Ed., 42, 1297(2003).
[6] X. D. Zhang, M. L. Guo, D. Wu , P. X. Liu , Y. M. Sun , L. A. Zhang , Y. She, Q. F. Liu, F. Y. Fan, Int. J. Mol. Sci 12, 2972-2981(2011).
[7] E. Janssens, H. Tanaka, S. Neukermans, R. E. Silverans, P. Lievens, New J. Phys. 5, 46 (2003).
[8] E. Janssens, H. Tanaka, S. Neukermans, R. E. Silverans, P. Lievens, Phys. Rev. B 69, 085402 (2004).
[9] H. Tanaka, S. Neukermans, E. Janssens, R. E. Silverans, P. Lievens, J. Am. Chem. Soc. 125, 2862 (2003).
[10] L.Gagliardi, J. Am. Chem. Soc. 125, 7504 (2003).
[11] M. Heinebrodt, N. Malinowski, F. Tast, W. Branz, I. M. L. Billas, T. P. Martin, J. Chem. Phys. 110, 9915 (1999).
[12] D. W. Yuan, Y. Wang, Z. Zeng, J. Chem. Phys. 122, 114310 (2005).
[13] B. R. Sahu, G. Maofa, L. Kleinman, Phys. Rev. B 67, 115420 (2003).
[14] H. Tanaka, S. Neukermans, E. Janssens, R. E. Silverans, P. Lievens, J. Chem. Phys. 119, 7115 (2003).
[15] K. Koyasu, M. Mitsui, A. Nakajima, K. Kaya, Chem. Phys. Lett., 358, 224 (2002).
[16] M. B. Torres, E. M. Fernández, L. C. Balbás, Phys. Rev. B 71, 155412
( 2005).
[17] J. E. Elkind, J. M. Alford, F. D. Weiss, R. T. Laaksonen , R. E. Smalley, J. Chem. Phys. 87, 2397 (1987); M. F. Jarrold, Science 252, 1085 (1991).
[18] K. Raghavachari, V. Logovinsky, Phys. Rev. Lett. 55, 2853 (1985) ; K. M. Ho, A. A. Shvartsburg, B. Pan, Z. Y. Lu, C. Z. Wang, J. G. Wacker, J. L. Fye, and M. F. Jarrold, Nature 392, 582 (1998) .
[19] B. Kiran, L. X, H. J. Zhai, L.F. Cui and L. S. Wang, Angew. Chem. Int. Ed. 43, 2125 (2004).
[20] M. Walter, H. Hakkinen, Phys. Chem., Chem. Phys. 8, 5407 (2006).
[21] L. M. Wang, S. Bulusu, W. Huang, R. Pal, L. S. Wang, X. C. Zeng , J. Am. Chem. Soc., 129, 15136-15137 (2007).
87
[22] A. Spiekermann, S. D. Hoffmann, F. Kraus,T. F. Fassler, Angew. Chem. Int. Ed. 46, 1638 –1640 (2007).
[23] J. Hu, T .W. Odom, C . M. Lieber, Acc. Chem. Res. 32,435 (1999).
[24] R. Pal, L.M. Wang , W. Huang , L. S. Wang , X. C. Zeng , J Am Chem Soc. , 131, 9, 3396-3404 (2009).
[25] P Ordejon, E. Artacho, J. M. Soler, Phys. Rev. B 53, R10441 (1996).
[26] D. Sanchez-Portal, P. Ordejon, E. Artacho, J. M. Soler, Int. J.Quantum Chem 65, 453 (1997).
[27] J. M. Soler, E. Artacho, J. D. Gale, A. Garcia, J. Junquera, P. Ordejon, D. Sanchez-Portal, J. Phys. Condens. Matter 14, 2745 (2002).
[28] G. P. Robert, Y. Weitao, Density-Functional Theory of atoms and Molecules, Oxford University Press NewYork (1989).
[29] Perdew, Burke, Ernzerhof , Phys. Rev. Lett., 77, 3865 (1996).
[30] L. Kleinman, D. M. Bylander, Phys. Rev. Lett. 48, 1425 (1982).
[31] C. Kittle, Introduction to Solid State Physics, 7th ed.,Wiley, New York (1996).
[32] R. C. Weast, CRC Handbook of Chemistry and Physics, 55th ed., CRC press, Cleveland, OH (1974).
[33] K. Raghavchari, J. Chem. Phys. 84, 5672 (1986).
[34] D.J. Trevor, D.M Cox, K.C. Reichmann, R. O. Brickmann, A. Kaldor, J. Phys. Chem. 91, 2598 (1987).
[35] C. B. Winstead, S. J. Pankstis, J. L. Gole, Chem. Phys. Lett. 237, 81-85. (1995).
[36] I. Shim, M. Sai Baba, K. A. Gingerich, Chem. Phys. 277, 9 (2002).
[37] V. Pershina, J. Anton, B. Fricke, J. Chem. Phys. 127, 134310(2007).
[38] J. E. Jr Kingcade, U. V. Choudary, K. A. Gingerich, Inorg. Chem.18, 3094 (1979).
[39] G. Bravo Perez, I. L.Garzon, O. Novaro, J. Mol. Struct. (Theochem) 493, 225-231(1999).
[40] J. Wang, G.Wang, J. Zhao, Phys Rev. B. Condens. Matter 66,035418 (2002).
[41] H. Hakkinen, U. Landman, Phys. Rev. B., Condens Matter 61,287 (2000).
[42] H.M Lee, M. Ge, B. R. Sahu, P. Tarakeshwar , K. S. Kim, J. Phys. Chem. 107, 9994 (2003).
[43] V. Bonacic-Koutecky, J. Burda, R. Mitric, M. Ge, G. Zampella, P. Fantucci, J. Chem. Phys. 117,3120 (2002).
[44] L. Wang, L. Xiao, Chem. Phys. Lett. 392, 452-455 (2004).
[45] H. Hakkinen, B. Yoon, U. Landman, X. Li, H. J. Zhai, L. S. Wang, J. Phys. Chem. A 107, 6168 (2003).
88
[46] S. F. Li, X. Xue, Y. Jia, G. Zhao, M. Zhang, X. G. Gong, Phys. Rev. B 73, 165401 (2006).
[47] C. Majumder, Phys. Rev. B 75, 235409 (2007).
[48] C. Majumder, A. K. Kandalam, P. Jena, Phys. Rev. B 74, 205437 (2006).
[49] R. C. Weast, CRC Handbook of Chemistry and Physics, 49th ed. (1969).
89
Chapter 5
5. Doped Golden Fullerenes
5.1 Introduction
In previous chapters we have seen that gold clusters exhibit intriguing geometrical
structures. They favor two-dimensional planar structures up to n = 13, a perfect
tetrahedron at Au20 followed by tubular structures at Au24 and Au26. This size-
dependent evolution of geometric structure of gold for cluster size up to several
hundred atoms strongly impacts its electronic, optical, and chemical properties. For
such applications it is important to have a detailed knowledge of the cluster structures
and their identification for the controlled use in future nanotechnology.
Along with the small gold clusters, the medium-sized gold clusters have also been
extensively studied [1-3]. Lechtken et al. [4] using a combination of trapped ion
electron diffraction (TIED) method, PES, and (time dependent (TD)) density
functional theory (DFT) have shown that Au-34 cluster adopts a chiral structure. A
highly stable Au32 cage cluster with the icosahedral (Ih) symmetry same as C60 was
predicted by Johansson et al.[5] which was later confirmed by Ji et al. [6] using a
photoelectron spectroscopy (PES) experiment combined with quantum mechanical
calculations. They found that the Au32 fullerene is the most stable at zero temperature.
This structure has been reported to be synthesized using ligands [7]
As discussed in the last chapter, a suitable impurity can bring structural changes as
well as can modulate different properties of the low lying geometries of pure gold
clusters. By doping gold clusters with Si and Ge atoms, we can have early onset of 3D
geometries in gold clusters. A relativistic density functional theory (DFT) of Au32
cluster by Himadri et al. [8] have shown that the bare fullerene Au32 cluster (without
any stabilizing ligands) can be used for potential catalytic applications. In an another
theoretical study, Deng et al. [9] have doped Ag atom in the hollow cage-like and
space-filling structures of Au32 and found that the Au31Ag cluster with the hollow
cage-like configuration is highly stable. It has been recently found that coating of 20
Au atoms on an Al13 cluster leads to a highly stable and icosahedrally symmetric
endohedral Al@Al12Au20 compound fullerene [10].
Similar studies have been performed by Meng et al. [11] using first-principles
calculations on the nano golden cages M12@Au20 (M=Na, Al, Ag, Sc, Y, La, Lu, and
Au) clusters to explore their structural and electronic properties. In this chapter we
90
will perform the DFT study of effect of group 14 elements(C, Si, Ge) on the structural
stability and electronic properties of Au32 cage. We have calculated the binding
energies, bond lengths, HOMO-LUMO gaps and plotted the partial density of states
(PDOS) of these clusters.
The organization of the chapter is as follows. The computational details are given in
Section 5.2, results and discussions are presented in Section 5.3.
5.2 Computational Details
We have used the SIESTA code, based on Density Functional theory method. The
electron density functional is treated by the generalized gradient approximation
(GGA) with exchange correlation functional parameterized by Perdew, Zunger and
Ernzerhof (PBE) scheme [12-14]. The pseudo potentials for Carbon, Silicon and
Germanium atoms are generated with atomic valence electron 2s22p2, 3s23p2 and 4s2
4p2 respectively. The core radii (in units of Å) for Carbon are s (1.49), p (1.52), d
(1.52) and f (1.49): For Silicon, they are: s (1.77), p (1.96), d (2.11) and f (2.11) and
for Germanium, they are: s (2.06), p (2.85), d (2.58) and f (2.58). The valence states
were described using DZP (double-zeta + polarization) basis sets. The reciprocal
space integrations are carried out at the gamma point. The clusters are optimized
inside simulation cell of 15 ┭ and energy cutoff of 200 Ry. The symmetry
unrestricted geometry optimization is carried using conjugate gradient and quasi
Newtonian methods until all the forces are less than 0.01eV/Å.
We have already given the verification of the computational procedure for Au-Si and
Au-Ge dimer in the last chapter. The test calculation results for the bond length of the
ground state of AuC molecule is 1.875 A ˚ which is in the good agreement with the
reported values (1.88 A ˚) .The calculated value of the binding energy per atom for
AuC is 2.47 eV which higher than the other reported values(1.97eV)[15].
5.3 Results and discussions
5.3.1 Structure and Energetics of M12@Au20
The structure of the hollow golden fullerene Au32 can be regarded as Ih symmetry 12-
atom icosahedron combined with Ih symmetry Au20 dodecahedron as shown in Fig.
5.1. We have replaced Au atom at the center of each pentagon of Au32 with another
metal atom to construct M12@Au20 clusters (M= C, Si and Ge) similar to Meng et
al.[11].The initial structure and the final optimized structures of Au32 after doping are
given in Fig. 5.1 and various computed values are given in Table 5.1.
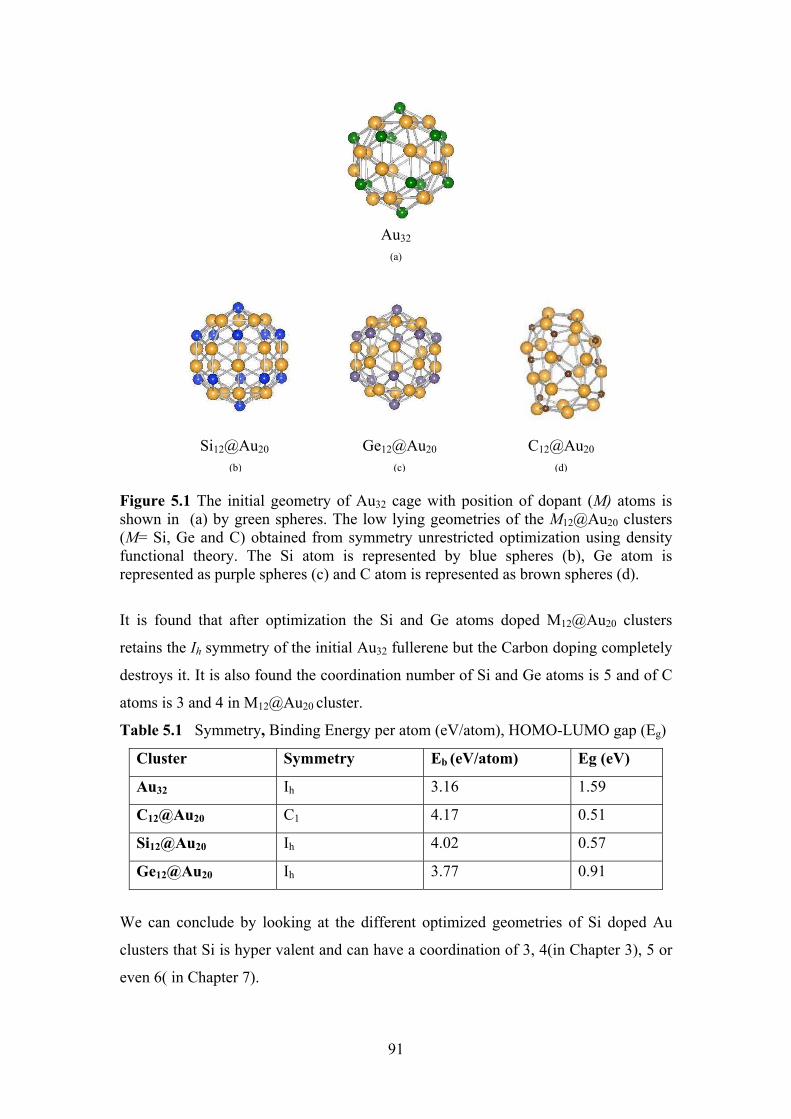
91
Au32
(a)
Si12@Au20
(b) Ge12@Au20
(c) C12@Au20
(d) Figure 5.1 The initial geometry of Au32 cage with position of dopant (M) atoms is shown in (a) by green spheres. The low lying geometries of the M12@Au20 clusters (M= Si, Ge and C) obtained from symmetry unrestricted optimization using density functional theory. The Si atom is represented by blue spheres (b), Ge atom is represented as purple spheres (c) and C atom is represented as brown spheres (d).
It is found that after optimization the Si and Ge atoms doped M12@Au20 clusters
retains the Ih symmetry of the initial Au32 fullerene but the Carbon doping completely
destroys it. It is also found the coordination number of Si and Ge atoms is 5 and of C
atoms is 3 and 4 in M12@Au20 cluster.
Table 5.1 Symmetry, Binding Energy per atom (eV/atom), HOMO-LUMO gap (Eg)
Cluster Symmetry Eb (eV/atom) Eg (eV)
Au32 Ih 3.16 1.59
C12@Au20 C1 4.17 0.51
Si12@Au20 Ih 4.02 0.57
Ge12@Au20 Ih 3.77 0.91
We can conclude by looking at the different optimized geometries of Si doped Au
clusters that Si is hyper valent and can have a coordination of 3, 4(in Chapter 3), 5 or
even 6( in Chapter 7).
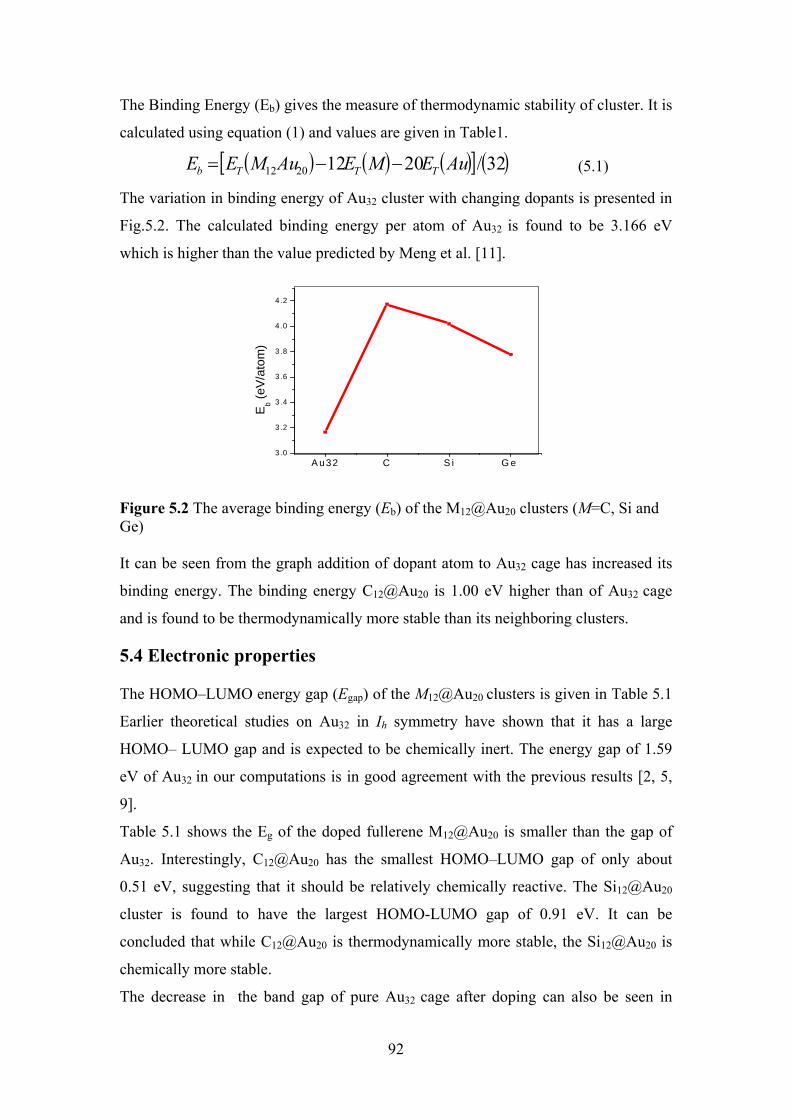
92
The Binding Energy (Eb) gives the measure of thermodynamic stability of cluster. It is
calculated using equation (1) and values are given in Table1.
( ) ( ) ( )[ ] ( )32/20122012 AuEMEAuMEE TTTb −−= (5.1)
The variation in binding energy of Au32 cluster with changing dopants is presented in
Fig.5.2. The calculated binding energy per atom of Au32 is found to be 3.166 eV
which is higher than the value predicted by Meng et al. [11].
A u32 C S i G e 3 .0
3 .2
3 .4
3 .6
3 .8
4 .0
4 .2
Eb (
eV/a
tom
)
Figure 5.2 The average binding energy (Eb) of the M12@Au20 clusters (M=C, Si and Ge) It can be seen from the graph addition of dopant atom to Au32 cage has increased its
binding energy. The binding energy C12@Au20 is 1.00 eV higher than of Au32 cage
and is found to be thermodynamically more stable than its neighboring clusters.
5.4 Electronic properties
The HOMO–LUMO energy gap (Egap) of the M12@Au20 clusters is given in Table 5.1
Earlier theoretical studies on Au32 in Ih symmetry have shown that it has a large
HOMO– LUMO gap and is expected to be chemically inert. The energy gap of 1.59
eV of Au32 in our computations is in good agreement with the previous results [2, 5,
9].
Table 5.1 shows the Eg of the doped fullerene M12@Au20 is smaller than the gap of
Au32. Interestingly, C12@Au20 has the smallest HOMO–LUMO gap of only about
0.51 eV, suggesting that it should be relatively chemically reactive. The Si12@Au20
cluster is found to have the largest HOMO-LUMO gap of 0.91 eV. It can be
concluded that while C12@Au20 is thermodynamically more stable, the Si12@Au20 is
chemically more stable.
The decrease in the band gap of pure Au32 cage after doping can also be seen in
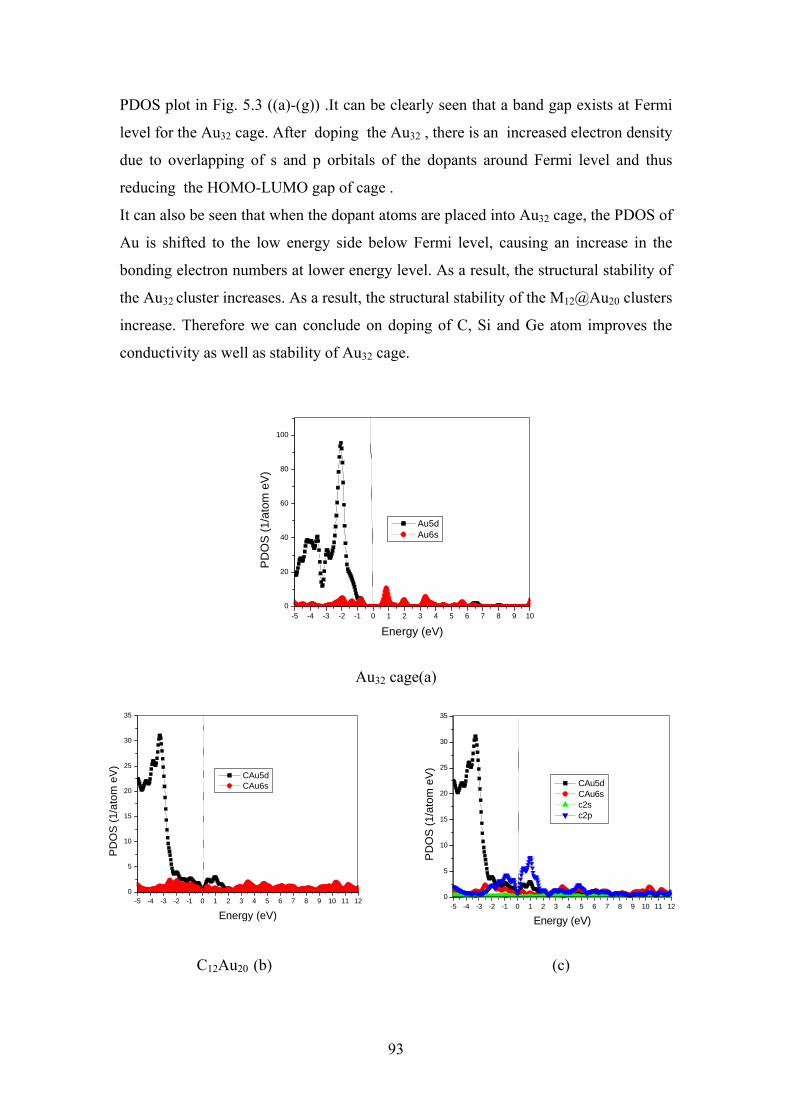
93
PDOS plot in Fig. 5.3 ((a)-(g)) .It can be clearly seen that a band gap exists at Fermi
level for the Au32 cage. After doping the Au32 , there is an increased electron density
due to overlapping of s and p orbitals of the dopants around Fermi level and thus
reducing the HOMO-LUMO gap of cage .
It can also be seen that when the dopant atoms are placed into Au32 cage, the PDOS of
Au is shifted to the low energy side below Fermi level, causing an increase in the
bonding electron numbers at lower energy level. As a result, the structural stability of
the Au32 cluster increases. As a result, the structural stability of the M12@Au20 clusters
increase. Therefore we can conclude on doping of C, Si and Ge atom improves the
conductivity as well as stability of Au32 cage.
-5 -4 -3 -2 -1 0 1 2 3 4 5 6 7 8 9 100
20
40
60
80
100
PD
OS
(1/
atom
eV
)
Energy (eV)
Au5d Au6s
Au32 cage(a)
-5 -4 -3 -2 -1 0 1 2 3 4 5 6 7 8 9 10 11 120
5
10
15
20
25
30
35
PD
OS
(1/
atom
eV
)
Energy (eV)
CAu5d CAu6s
-5 -4 -3 -2 -1 0 1 2 3 4 5 6 7 8 9 10 11 120
5
10
15
20
25
30
35
PD
OS
(1/
atom
eV
)
Energy (eV)
CAu5d CAu6s c2s c2p
C12Au20 (b) (c)
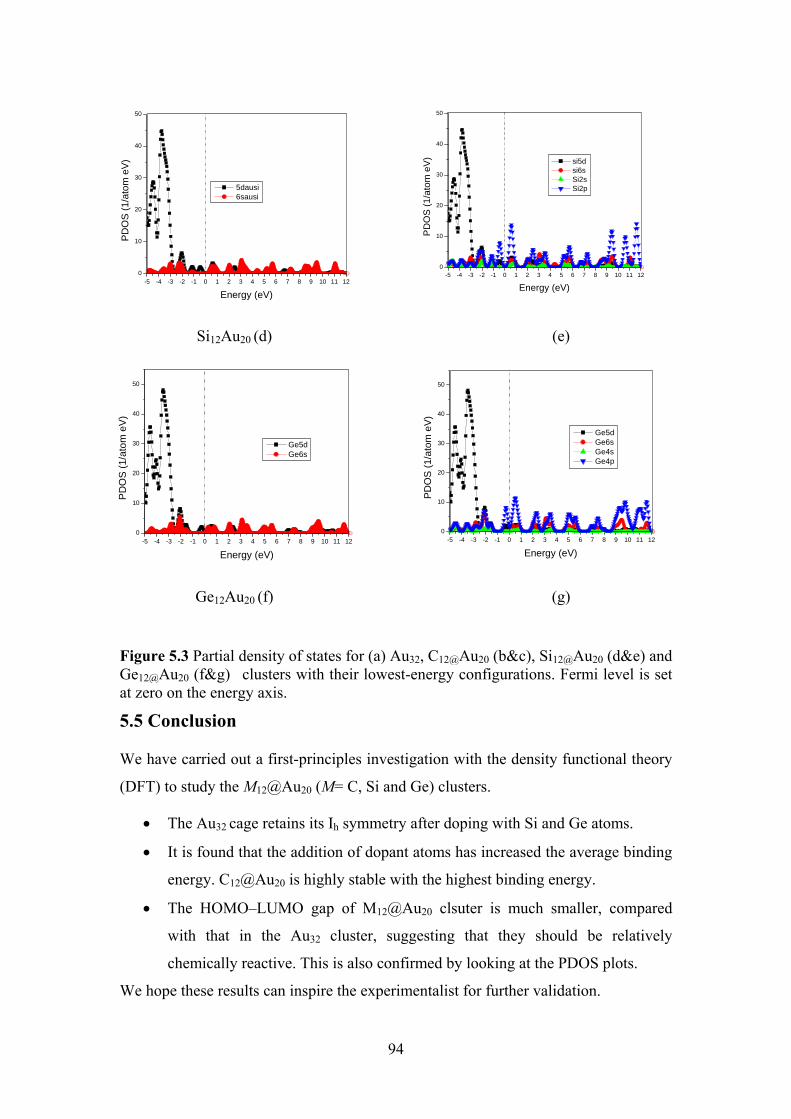
94
-5 -4 -3 -2 -1 0 1 2 3 4 5 6 7 8 9 10 11 120
10
20
30
40
50
PD
OS
(1/
atom
eV
)
Energy (eV)
5dausi 6sausi
-5 -4 -3 -2 -1 0 1 2 3 4 5 6 7 8 9 10 11 120
10
20
30
40
50
PD
OS
(1/
atom
eV
)
Energy (eV)
si5d si6s Si2s Si2p
Si12Au20 (d) (e)
-5 -4 -3 -2 -1 0 1 2 3 4 5 6 7 8 9 10 11 120
10
20
30
40
50
PD
OS
(1/
atom
eV
)
Energy (eV)
Ge5d Ge6s
-5 -4 -3 -2 -1 0 1 2 3 4 5 6 7 8 9 10 11 120
10
20
30
40
50
PD
OS
(1/
atom
eV
)
Energy (eV)
Ge5d Ge6s Ge4s Ge4p
Ge12Au20 (f) (g)
Figure 5.3 Partial density of states for (a) Au32, C12@Au20 (b&c), Si12@Au20 (d&e) and Ge12@Au20 (f&g) clusters with their lowest-energy configurations. Fermi level is set at zero on the energy axis.
5.5 Conclusion
We have carried out a first-principles investigation with the density functional theory
(DFT) to study the M12@Au20 (M= C, Si and Ge) clusters.
• The Au32 cage retains its Ih symmetry after doping with Si and Ge atoms.
• It is found that the addition of dopant atoms has increased the average binding
energy. C12@Au20 is highly stable with the highest binding energy.
• The HOMO–LUMO gap of M12@Au20 clsuter is much smaller, compared
with that in the Au32 cluster, suggesting that they should be relatively
chemically reactive. This is also confirmed by looking at the PDOS plots.
We hope these results can inspire the experimentalist for further validation.
95
Bibliography
[1] Y. Donga, M. Springborgb Eur. Phys. J. D 43, 15–18 (2007).
[2] X. Gu, M. Ji, S. H. Wei, X. G. Gong, Phys. Rev. B 70, 205401 (2004).
[3] Y. Gao, X. C. Zeng, J. Am. Chem. Soc. 127, 3698 (2005); P. Acioli, J. Jellinek, Phys. Rev. Lett. 89, 213402 (2002).
[4] A. Lechtken, D. Schooss, J. R. Stairs, M. N. Blom, F. Furche, N. Morgner,O. Kostko, B. Von Issendorff, and M. M. Kappes, Angew. Chem. Int. Ed. 46, 2944 – 2948 (2007).
[5] M. P. Johansson, D. Sundholm and J.Vaara Angew.Chem. Int. Ed. 43, 2678 (2004).
[6] M. Ji, X. Gu, X. Li , X. G. Gong, J. Li and L. S. Wang , Angew. Chem. Int. Ed. 44, 7119 (2005).
[7] M. J. Oila, A. M. P. Koskinen, ARKIVOC 15, 76 (2006)
[8] H. S. De, S. Krishnamurty, S. Pal, Catalysis Today 198, 106– 109(2012).
[9] Q. M. Deng , L. X. Zhao , X. J. Feng , M. Zhang , W. L. Zhang, B. Fang, Y. H. Luo, Comp. and Th. Chem. 976, 183–187 (2011).
[10] V. Kumar, Phys. Rev. B 79, 085423 (2009).
[11] Z. Meng, F. X. Juan, Z. L. Xia, Z. H. Yu, L. Y. Hua, Chin. Phys. B, 21, 5, 056102 (2012).
[12] J. M.Soler, E. Artacho, J. D. Gale, A. Garcia, J. Junquera, P. Ordejon, D. Sanchez-Portal, J. Phys. Condens. Matter 14, 2745 (2002).
[13] G. P. Robert, Y. Weitao, Density-Functional Theory of atoms and Molecules, Oxford University Press NewYork ( 1989).
[14] Perdew, Burke, Ernzerhof , Phys. Rev. Lett. 77, 3865 (1996).
[15] F. Naumkin, Phys. Chem. Chem. Phys. 8, 2539–2545, 2539 (2006).
96
Chapter 6
6. The Structural and Electronic Properties of Doped
Tubular Gold Cages
6.1 Introduction
In the last chapter we have studied medium sized gold clusters . Just like small sized
gold clusters the medium gold clusters also have size dependent geometries. Recent
studies have found that Au18, Au32, Au50 and Au72 clusters are icosahedron based
cages exhibiting high thermodynamic stabilities [1-4]. Although the gold cage is still
one of the focuses of attention, gold nanotubes and nanowires [5-9] have also
attracted much interest in recent years. A joint theoretical and experimental study
conducted by Bulusu et al. [10] of low-lying structures and structural transitions of
gold cluster anions Au-n in the size range of n= 21-25 suggests that the ground state
are the pyramid-based structures for n = 21-23 and at n = 24, the hollow-tubular
structures dominate the low-lying isomers while structural transition from hollow
tubular to core/shell compact structure is observed at n= 25. Other theoretical studies
also suggest the possible existence of highly symmetric hollow-cage structures Au32,
Au42, and Au50 as well as hollow-tubular structure Au26 [1, 2,11-13]. The possibility to
form a hollow tubular Aun cluster by closing ends of a SWGNT has opened the
possibilities of new stable structures in competition with other possible structures,
such as the amorphous, the bulk fragment, and the cage-like ones. The tubular
structure of Au24 has been verified both theoretically and experimentally [14,15]. It is
obvious that the tubular Au24 structure can accommodate guest atoms to form a new
kind of endohedral tubular gold cluster.
It is known that coinage metals (Cu, Ag, Au) have many similarities in their bulk
behavior and exhibit some differences at the stage of small clusters. In recent years,
the transition bimetallic clusters, particularly of Au, Ag, and Cu, have received much
attention because of their particular physical and chemical properties and potential
technological applications in solid-state chemistry, materials science, nanotechnology,
catalysis, biology, and medicine. [16-19]. A density functional study with relativistic
effective core potential by Zhao et al. [20] indicate that the stability of copper-gold
clusters is higher than that of bare gold clusters and then the bare gold clusters is more
stable than the sliver-gold isomers.
97
Another similar study by Ghanty et al. [21] on the structural and electronic properties
of Au19X clusters doped with Li, Na, K, Rb, Cs, Cu, and Ag suggests that the
endohedrally doped Au19X clusters (X = Li, Na, and Cu) have higher binding energies
comparable to those of the corresponding exohedrally doped clusters and the
endohedrally doped cage-like structures of larger atoms (X = K, Rb, Cs, and Ag) are
found to be less stable than the corresponding exohedral structures. Kanhere et
al.studied the equilibrium geometries of Au-n and Aun1-1Cu- (n=13-19) using Density
Functional Theory (DFT). They have found that the introduction of copper atom has
enhanced the binding energy per atom of gold cluster anions [22]. Haeck et al. [23]
have studied Carbon monoxide adsorption on silver doped gold clusters and observed
that inclusion of a single silver atom causes significant changes in the reactivity for a
few cluster sizes. The structural and magnetic properties of the tubular Au24 doped
with different 3d transition-metal atoms M (M = V, Cr, Mn, Fe, Co, and Ni) is studied
by Yang et al. [24] using the scalar relativistic DFT calculations. It is found that all of
the M@Au24 clusters retain their tubular structure even when the dopant atom is
located at the center of the Au24 cluster.
There are lot of studies on doping of gold clusters with Ag and Cu atoms but they
limited to smaller size range. As we have already discussed the importance of Au24
tubular cage, we would like to introduce transition metals Cu and Ag as dopant and
study their effect on structural and electronic properties of these gold tubular cages in
details.
6.2 Computational Details
The computational method is same as explained in previous chapters. The core radii
used for pseudopotential generation (in units of Å) for Cu are as follows: s (2.74), p
(2.39), d (2.13), f (2.13); for Ag: s (2.46), p (2.65), d (2.46), f (2.46). The core radii
for gold are the same as given in the previous chapter. The structures are optimized
until the forces on atoms reduce down to 0.01eV/┭ or less.
The calculated bond length from DFT for Au-Cu dimer is 2.37┭ and for Au-Ag is
2.56┭, which is in good agreement with experimental value [25, 26].
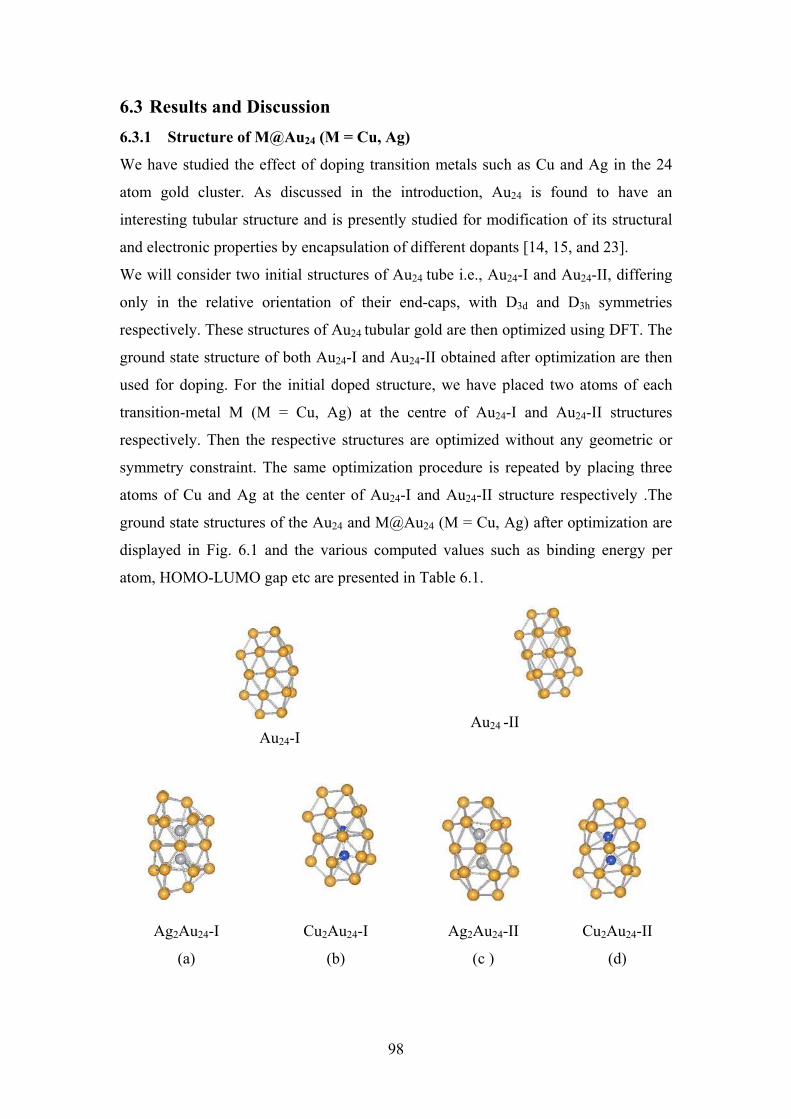
98
6.3 Results and Discussion
6.3.1 Structure of M@Au24 (M = Cu, Ag)
We have studied the effect of doping transition metals such as Cu and Ag in the 24
atom gold cluster. As discussed in the introduction, Au24 is found to have an
interesting tubular structure and is presently studied for modification of its structural
and electronic properties by encapsulation of different dopants [14, 15, and 23].
We will consider two initial structures of Au24 tube i.e., Au24-I and Au24-II, differing
only in the relative orientation of their end-caps, with D3d and D3h symmetries
respectively. These structures of Au24 tubular gold are then optimized using DFT. The
ground state structure of both Au24-I and Au24-II obtained after optimization are then
used for doping. For the initial doped structure, we have placed two atoms of each
transition-metal M (M = Cu, Ag) at the centre of Au24-I and Au24-II structures
respectively. Then the respective structures are optimized without any geometric or
symmetry constraint. The same optimization procedure is repeated by placing three
atoms of Cu and Ag at the center of Au24-I and Au24-II structure respectively .The
ground state structures of the Au24 and M@Au24 (M = Cu, Ag) after optimization are
displayed in Fig. 6.1 and the various computed values such as binding energy per
atom, HOMO-LUMO gap etc are presented in Table 6.1.
Au24-I
Au24 -II
Ag2Au24-I
(a)
Cu2Au24-I
(b)
Ag2Au24-II
(c )
Cu2Au24-II
(d)
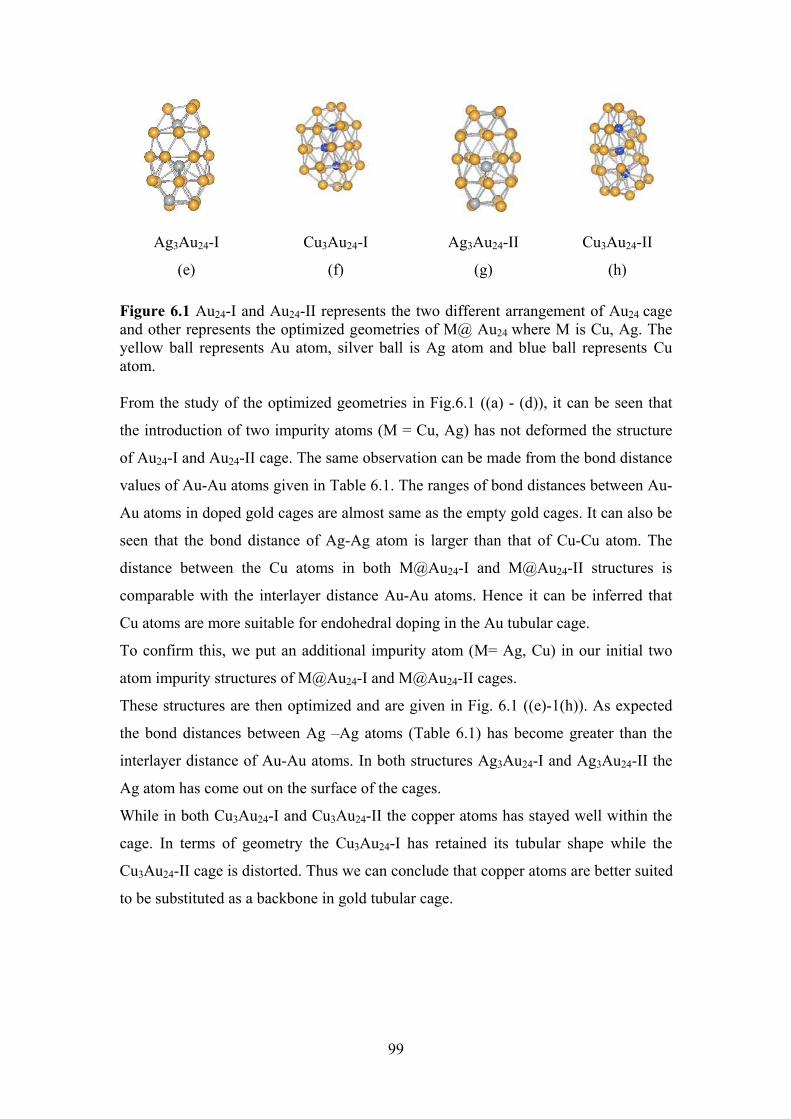
99
Ag3Au24-I
(e)
Cu3Au24-I
(f)
Ag3Au24-II
(g)
Cu3Au24-II
(h)
Figure 6.1 Au24-I and Au24-II represents the two different arrangement of Au24 cage and other represents the optimized geometries of M@ Au24 where M is Cu, Ag. The yellow ball represents Au atom, silver ball is Ag atom and blue ball represents Cu atom. From the study of the optimized geometries in Fig.6.1 ((a) - (d)), it can be seen that
the introduction of two impurity atoms (M = Cu, Ag) has not deformed the structure
of Au24-I and Au24-II cage. The same observation can be made from the bond distance
values of Au-Au atoms given in Table 6.1. The ranges of bond distances between Au-
Au atoms in doped gold cages are almost same as the empty gold cages. It can also be
seen that the bond distance of Ag-Ag atom is larger than that of Cu-Cu atom. The
distance between the Cu atoms in both M@Au24-I and M@Au24-II structures is
comparable with the interlayer distance Au-Au atoms. Hence it can be inferred that
Cu atoms are more suitable for endohedral doping in the Au tubular cage.
To confirm this, we put an additional impurity atom (M= Ag, Cu) in our initial two
atom impurity structures of M@Au24-I and M@Au24-II cages.
These structures are then optimized and are given in Fig. 6.1 ((e)-1(h)). As expected
the bond distances between Ag –Ag atoms (Table 6.1) has become greater than the
interlayer distance of Au-Au atoms. In both structures Ag3Au24-I and Ag3Au24-II the
Ag atom has come out on the surface of the cages.
While in both Cu3Au24-I and Cu3Au24-II the copper atoms has stayed well within the
cage. In terms of geometry the Cu3Au24-I has retained its tubular shape while the
Cu3Au24-II cage is distorted. Thus we can conclude that copper atoms are better suited
to be substituted as a backbone in gold tubular cage.
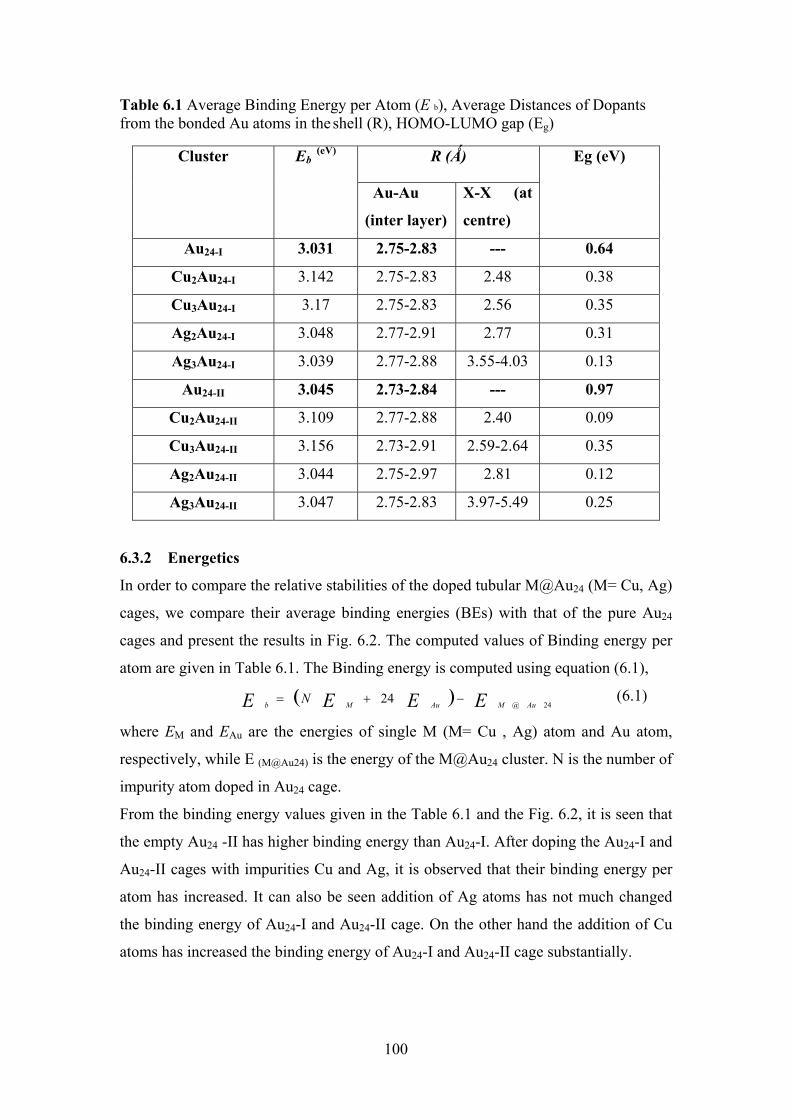
100
Table 6.1 Average Binding Energy per Atom (E b), Average Distances of Dopants from the bonded Au atoms in the shell (R), HOMO-LUMO gap (Eg)
Cluster Eb (eV)
R (ǖ) Eg (eV)
Au-Au
(inter layer)
X-X (at
centre)
Au24-I 3.031 2.75-2.83 --- 0.64
Cu2Au24-I 3.142 2.75-2.83 2.48 0.38
Cu3Au24-I 3.17 2.75-2.83 2.56 0.35
Ag2Au24-I 3.048 2.77-2.91 2.77 0.31
Ag3Au24-I 3.039 2.77-2.88 3.55-4.03 0.13
Au24-II 3.045 2.73-2.84 --- 0.97
Cu2Au24-II 3.109 2.77-2.88 2.40 0.09
Cu3Au24-II 3.156 2.73-2.91 2.59-2.64 0.35
Ag2Au24-II 3.044 2.75-2.97 2.81 0.12
Ag3Au24-II 3.047 2.75-2.83 3.97-5.49 0.25
6.3.2 Energetics
In order to compare the relative stabilities of the doped tubular M@Au24 (M= Cu, Ag)
cages, we compare their average binding energies (BEs) with that of the pure Au24
cages and present the results in Fig. 6.2. The computed values of Binding energy per
atom are given in Table 6.1. The Binding energy is computed using equation (6.1),
( ) EEEE AuMAuMbN
24@24 −+= (6.1)
where EM and EAu are the energies of single M (M= Cu , Ag) atom and Au atom,
respectively, while E (M@Au24) is the energy of the M@Au24 cluster. N is the number of
impurity atom doped in Au24 cage.
From the binding energy values given in the Table 6.1 and the Fig. 6.2, it is seen that
the empty Au24 -II has higher binding energy than Au24-I. After doping the Au24-I and
Au24-II cages with impurities Cu and Ag, it is observed that their binding energy per
atom has increased. It can also be seen addition of Ag atoms has not much changed
the binding energy of Au24-I and Au24-II cage. On the other hand the addition of Cu
atoms has increased the binding energy of Au24-I and Au24-II cage substantially.
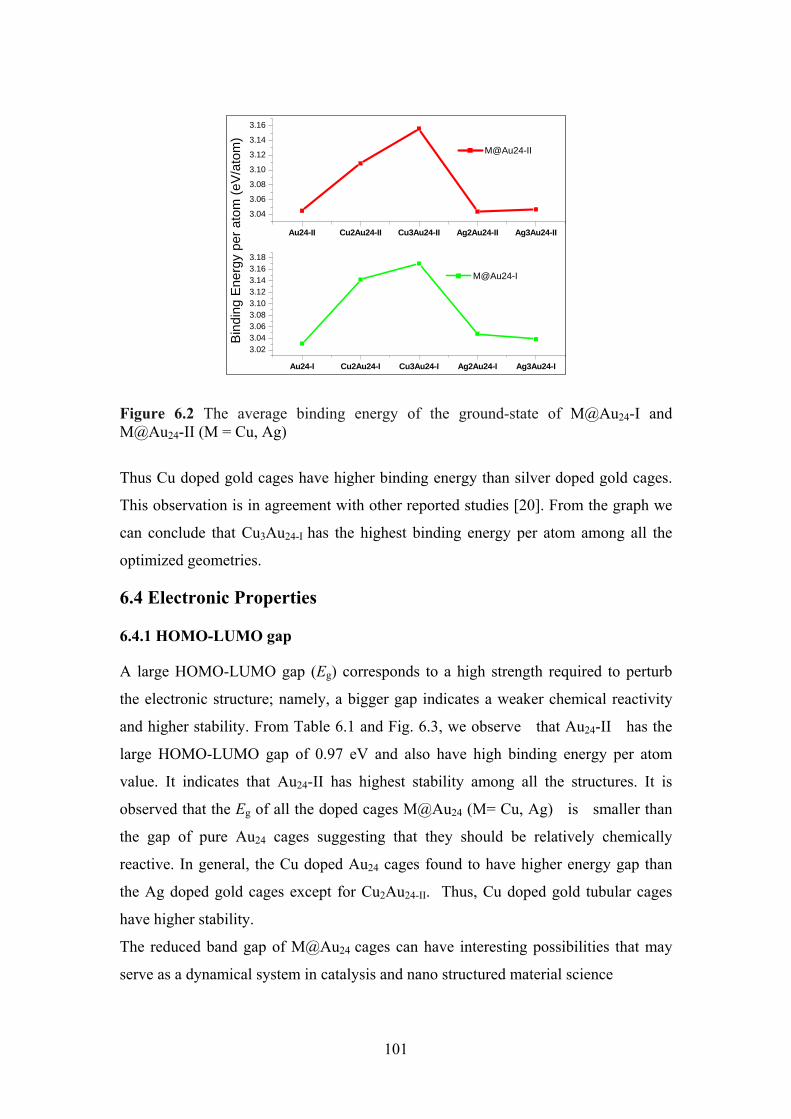
101
Au24-I Cu2Au24-I Cu3Au24-I Ag2Au24-I Ag3Au24-I
3.023.043.063.083.103.123.143.163.18
M@Au24-I
Au24-II Cu2Au24-II Cu3Au24-II Ag2Au24-II Ag3Au24-II
3.04
3.06
3.08
3.10
3.12
3.14
3.16
M@Au24-II
Bin
ding
Ene
rgy
per
atom
(eV
/ato
m)
Figure 6.2 The average binding energy of the ground-state of M@Au24-I and M@Au24-II (M = Cu, Ag)
Thus Cu doped gold cages have higher binding energy than silver doped gold cages.
This observation is in agreement with other reported studies [20]. From the graph we
can conclude that Cu3Au24-I has the highest binding energy per atom among all the
optimized geometries.
6.4 Electronic Properties
6.4.1 HOMO-LUMO gap
A large HOMO-LUMO gap (Eg) corresponds to a high strength required to perturb
the electronic structure; namely, a bigger gap indicates a weaker chemical reactivity
and higher stability. From Table 6.1 and Fig. 6.3, we observe that Au24-II has the
large HOMO-LUMO gap of 0.97 eV and also have high binding energy per atom
value. It indicates that Au24-II has highest stability among all the structures. It is
observed that the Eg of all the doped cages M@Au24 (M= Cu, Ag) is smaller than
the gap of pure Au24 cages suggesting that they should be relatively chemically
reactive. In general, the Cu doped Au24 cages found to have higher energy gap than
the Ag doped gold cages except for Cu2Au24-II. Thus, Cu doped gold tubular cages
have higher stability.
The reduced band gap of M@Au24 cages can have interesting possibilities that may
serve as a dynamical system in catalysis and nano structured material science
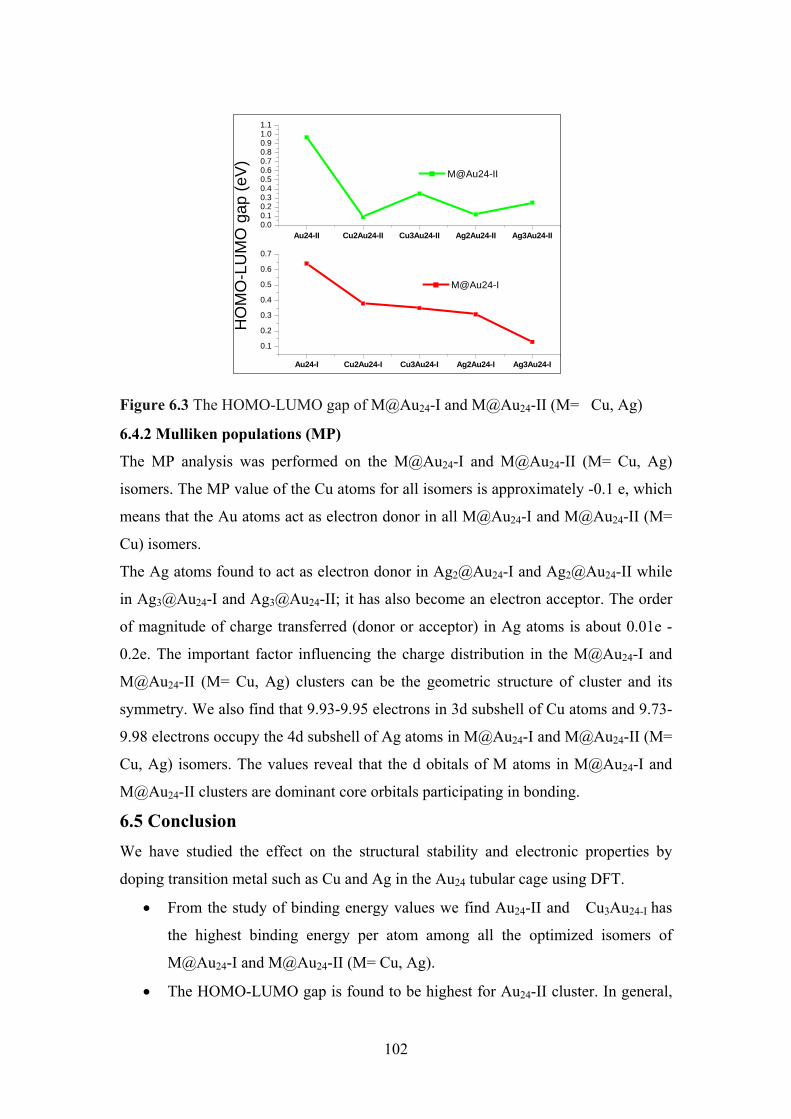
102
Au24-I Cu2Au24-I Cu3Au24-I Ag2Au24-I Ag3Au24-I
0.1
0.2
0.3
0.4
0.5
0.6
0.7
M@Au24-I
Au24-II Cu2Au24-II Cu3Au24-II Ag2Au24-II Ag3Au24-II0.00.10.20.30.40.50.60.70.80.91.01.1
M@Au24-II
HO
MO
-LU
MO
gap
(eV
)
Figure 6.3 The HOMO-LUMO gap of M@Au24-I and M@Au24-II (M= Cu, Ag)
6.4.2 Mulliken populations (MP)
The MP analysis was performed on the M@Au24-I and M@Au24-II (M= Cu, Ag)
isomers. The MP value of the Cu atoms for all isomers is approximately -0.1 e, which
means that the Au atoms act as electron donor in all M@Au24-I and M@Au24-II (M=
Cu) isomers.
The Ag atoms found to act as electron donor in Ag2@Au24-I and Ag2@Au24-II while
in Ag3@Au24-I and Ag3@Au24-II; it has also become an electron acceptor. The order
of magnitude of charge transferred (donor or acceptor) in Ag atoms is about 0.01e -
0.2e. The important factor influencing the charge distribution in the M@Au24-I and
M@Au24-II (M= Cu, Ag) clusters can be the geometric structure of cluster and its
symmetry. We also find that 9.93-9.95 electrons in 3d subshell of Cu atoms and 9.73-
9.98 electrons occupy the 4d subshell of Ag atoms in M@Au24-I and M@Au24-II (M=
Cu, Ag) isomers. The values reveal that the d obitals of M atoms in M@Au24-I and
M@Au24-II clusters are dominant core orbitals participating in bonding.
6.5 Conclusion
We have studied the effect on the structural stability and electronic properties by
doping transition metal such as Cu and Ag in the Au24 tubular cage using DFT.
• From the study of binding energy values we find Au24-II and Cu3Au24-I has
the highest binding energy per atom among all the optimized isomers of
M@Au24-I and M@Au24-II (M= Cu, Ag).
• The HOMO-LUMO gap is found to be highest for Au24-II cluster. In general,

103
the Cu doped Au24 tubular cages found to have higher energy gap than the Ag
doped cages except for Cu2Au24-II.
• On the basis of the calculated Mulliken populations, reveals that the d obitals
of M (Cu, Ag) atoms in M@Au24-I and M@Au24-II clusters are dominant core
orbital participating in bonding.
• At the end we can conclude that the Cu doped gold cages are more stable than
Ag doped.
104
Bibliography
[1] M. P.Johansson, D.Sundholm, J. Vaara, Angew.Chem.Int.Ed. 43, 2678 (2004).
[2] X. Gu, M. Ji, S. H. Wei, X. G. Gong, Phys. Rev. B 70, 205401 (2004).
[3] D. Tian, J. Zhao, B. Wang, R. B. King, J. Phys. Chem. A 111, 411 (2007).
[4] A. J. Karttumen, M. Linnolahti, T. A. Pakkanen, P. Pyykko, Chem.Comm. 465 (2008).
[5] Y. Kondo, K. Takayanag, Science 289, 606 (2000).
[6] E. Tosatti, S. Prestipino, Science, 289, 561 (2000).
[7] Y. Oshima, A. Onga, K.Takayanagi, Phys. Rev. Lett. 91, 205503 (2003).
[8] R.T.Senger, S. Dag, S. Ciraci, Phys. Rev. Lett. 93, 196807 (2004).
[9] W. Fa, J. M. Dong, J. Chem. Phys. 124, 114310 (2006).
[10] S. Bulusu, X. Li, L. S. Wang, X. C. Zeng, J. Phys. Chem. C 111, 4190- 4198. (2007).
[11] B. Soule de Bas, M. J. Ford, M. B. Cortie, J. Mol. Struct. (TheoChem) 686, 193 (2004).
[12] J. Wang , J. Jellinek, J. Zhao, Z. Chen, R. B. King, P. V. R. Schleyer, J. Phys. Chem A 109, 9265 (2005).
[13] E. M. Fernandez, J. M. Soler, L. C. Balbas, Phys. ReV. B. 73, 235433 (2006).
[14] X. P. Xing, B. Yoon, U. Landman and J. H. Parks, Phys. ReV. B 74, 165423 (2006).
[15] S. Bulusu, L. Li, L. S.Wang and X. C. Zeng, J. Phys. Chem. C 111, 190(2007).
[16] R. Pal, L. M. Wang, W. Huang, X. C. Zeng, J. Am. Chem. Soc. 131, 3396 (2009).
[17] Y. Zhao, Z. Y. Li, J. L. Yang, Phys. Chem. Chem. Phys. 11, 2329 (2009).
[18] D. W. Yuan, Y. Wang, Z. Zeng, J. Chem. Phys. 122, 114310 (2005).
[19] S. Zhao, Y. L. Ren, Y. L. Ren, J. J. Wang, W. P. Yin, J. Phys.Chem. A 114, 4917 (2010).
[20] Y. R. Zhao, X. Y. Kuang, B. B. Zheng, Y. F. Li and S. J. Wang, J. Phys. Chem. A 115, 569–576 (2011).
[21] T. K. Ghanty, A. Banerjee, A. Chakrabarti, J .Phy. Chem. C 114, 20-27 (2010).
[22] S. Zorriasatein , K. Joshi , D. G. Kanhere , J Chem Phys. 128, 18, 184314 (2008).
[23] J. De Haeck , N. Veldeman , P. Claes , E. Janssens, M. Andersson , P. Lievens , J. Phys Chem A. 115, 11, 2103-9 (2011).
105
[24] A. Yang, W. Fa and J. Dong, J. Phys. Chem. A 114, 4031–4035 (2010).
[25] G. A. Bishea, J. C. Pinegar, M. D. Morse, J. Chem. Phys. 95, 5630 (1991).
[26] J. Fabbi , J. D. Langenberg, Q. D. Morse, L. Karlsson, J. Chem. Phys. 115, 7543 (2001).
106
Chapter 7
7. Tubular Gold Clusters with Spinal Support
7.1 Introduction
In the Chapter 6 we have discussed 24 atom tubular cage like structure of gold with
hexagonal cross-section. The existence of the hollow-tubular structures dominating at
larger size range in the low-lying isomers for gold has already been pointed out in the
last chapter [1-6]. This tubular structure can be extended along z axis to form a single
wall gold nanotube (SWGNT). In our group, Veena et al. [7] have studied single wall
gold nanotube of various cross sections using Gupta Potential and found that gold
nanowires consisting of pentagonal layers are most stable among the structures
studied.
The tubular structure of Au24 has been verified both theoretically and experimentally
as discussed in the Chapter 1. The tubular Au24 structure can accommodate guest
atoms to form a core–shell structure. Properties of such a core shell system differ
from those of its all metal counterparts (empty or filled). A core–shell structure can
also be exhibited by a system whose shell is unstable by itself but can be supported by
the core. A large number of theoretical and experimental studies have been carried on
hollow gold clusters endohedrally doped with various dopants. Some recent examples
include a stable icosahedral cluster W@Au12 which was confirmed experimentally [8,
9] and gold-encapsulated fullerenes [10]. Such mixed core doping has potential
applications as catalyst [11, 12]. For catalytic applications, GNPs are usually first
affixed on a support, such as one of various kinds of oxide (e.g., silica, titania,
alumina), carbon nanotube, graphene sheet, etc. [13-16]. However, in suspensions
GNPs are susceptible to aggregation. To prevent aggregation and increase stability of
GNPs in suspension, researchers have utilized different stabilizing ligands such as
alkanethiols and alkylamines [17]. The potential use of gold clusters in catalysis ,
opto-electronic applications etc requires further understanding of the effect of ligands
and solvent on the structural and electronic properties and to compliment
experimental and theoretical studies[18].
We have discussed in details in Chapter 4 that Si doped gold clusters can form a
stable geometry. Hence it is of interest to study the interaction of Si atoms with Aun
clusters of various dimensionalities. In this chapter we place Si atoms as a backbone
107
in gold nanotube. Silicon has already been incooperated with gold atoms to form
nanowires. For example, an Au–Si alloy is used for microchip packing and
interconnection in microelectro-mechanical systems (MEMS).The Au–Si eutectic
nanowires of diameter 60nm have been generated by Lin et al. successfully. The
SEM and TEM images of the nanostructure of Au–Si eutectic nanowires show Si
nanoparticles dispersed in the Au matrix [19].
Another element we are going to dope with gold cages is Aluminum. Although Al and
Au are metals in their bulk form, the atomic states have large difference in their
electro negativity values which are 2.54 and 1.61 for Au and Al respectively [20].
Therefore, it is expected that the interaction between Al and Au would involve
significant charge transfer or, in other words, the chemical bonding will have more
ionic than covalent character. Walter and Hakkinen show that endohedral doping of
the Au16 cage by Al or Si yields a geometrically robust, tunable oxidation and
reduction agent [21]. A study on the atomic and electronic structures of Au5M
clusters, where M atom represents elements of the second period, revealed that with
the exception of S, impurities with p electrons (Al, Si, P) adopt non-planar geometries
while those with s electrons (Na, Mg) prefer planar geometries [22, 23].
The possibility to form a hollow tubular AuN cluster by closing the ends of a SWGNT
has opened the possibilities of new stable structures in competition with other possible
structures, such as the amorphous, the bulk fragment, and the cage-like ones. Though
a lot of theoretical and experimental work has been carried out recently to study the
interaction of Al or Si atoms with small gold clusters (n <16), very few studies are
available which investigate the interaction Si or Al with gold clusters of larger size.
In the present study, we have placed Al, Si and Au atoms as backbones to the AuN
tubular cages of different sizes and study their effect on the tubular structure and
electronic properties. By this we wish to evaluate some of the important features:
(1) how these impurity atoms with different numbers of 3p valence electrons
influence the ground-state properties of gold clusters; (2) how the geometrical
structures and electronic properties of 3p atom doped AuN clusters evolve with
increasing cluster size and (3) comparing the changes brought about by Si and Al
doping in AuN clusters with those of all gold clusters (core + shell). The chapter is
organized as follows. In Section 7.2 computational method is described. In Section
7.3 , the details of our work are displayed and discussed. Finally, a summary is given.
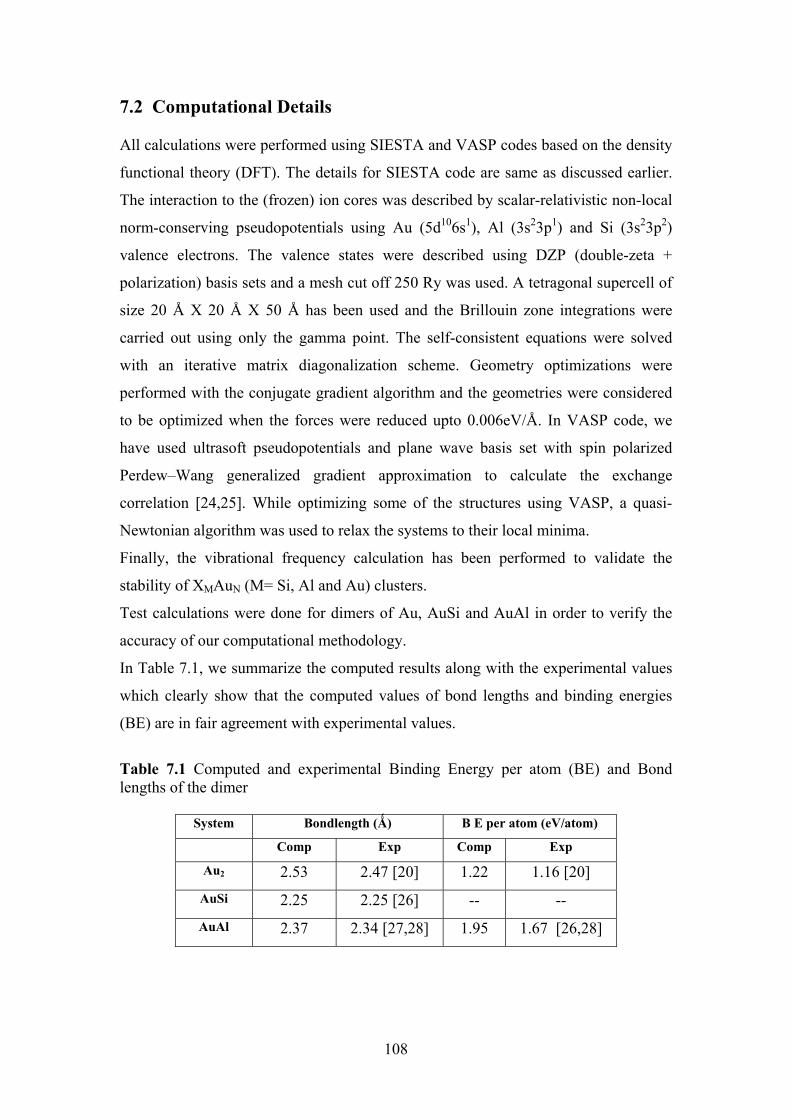
108
7.2 Computational Details
All calculations were performed using SIESTA and VASP codes based on the density
functional theory (DFT). The details for SIESTA code are same as discussed earlier.
The interaction to the (frozen) ion cores was described by scalar-relativistic non-local
norm-conserving pseudopotentials using Au (5d106s1), Al (3s23p1) and Si (3s23p2)
valence electrons. The valence states were described using DZP (double-zeta +
polarization) basis sets and a mesh cut off 250 Ry was used. A tetragonal supercell of
size 20 Å X 20 Å X 50 Å has been used and the Brillouin zone integrations were
carried out using only the gamma point. The self-consistent equations were solved
with an iterative matrix diagonalization scheme. Geometry optimizations were
performed with the conjugate gradient algorithm and the geometries were considered
to be optimized when the forces were reduced upto 0.006eV/Å. In VASP code, we
have used ultrasoft pseudopotentials and plane wave basis set with spin polarized
Perdew–Wang generalized gradient approximation to calculate the exchange
correlation [24,25]. While optimizing some of the structures using VASP, a quasi-
Newtonian algorithm was used to relax the systems to their local minima.
Finally, the vibrational frequency calculation has been performed to validate the
stability of XMAuN (M= Si, Al and Au) clusters.
Test calculations were done for dimers of Au, AuSi and AuAl in order to verify the
accuracy of our computational methodology.
In Table 7.1, we summarize the computed results along with the experimental values
which clearly show that the computed values of bond lengths and binding energies
(BE) are in fair agreement with experimental values.
Table 7.1 Computed and experimental Binding Energy per atom (BE) and Bond lengths of the dimer
System Bondlength (ǖ) B E per atom (eV/atom)
Comp Exp Comp Exp
Au2 2.53 2.47 [20] 1.22 1.16 [20]
AuSi 2.25 2.25 [26] -- --
AuAl 2.37 2.34 [27,28] 1.95 1.67 [26,28]
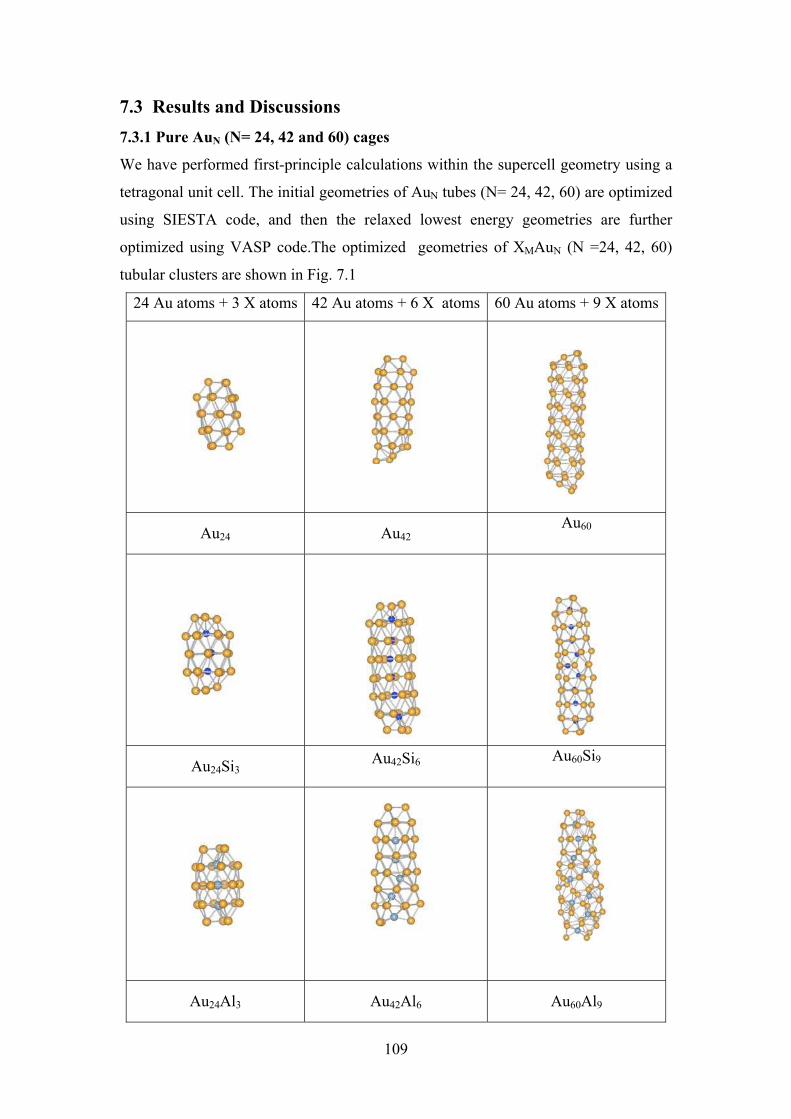
109
7.3 Results and Discussions
7.3.1 Pure AuN (N= 24, 42 and 60) cages
We have performed first-principle calculations within the supercell geometry using a
tetragonal unit cell. The initial geometries of AuN tubes (N= 24, 42, 60) are optimized
using SIESTA code, and then the relaxed lowest energy geometries are further
optimized using VASP code.The optimized geometries of XMAuN (N =24, 42, 60)
tubular clusters are shown in Fig. 7.1
24 Au atoms + 3 X atoms 42 Au atoms + 6 X atoms 60 Au atoms + 9 X atoms
Au24 Au42 Au60
Au24Si3 Au42Si6 Au60Si9
Au24Al3 Au42Al6 Au60Al9
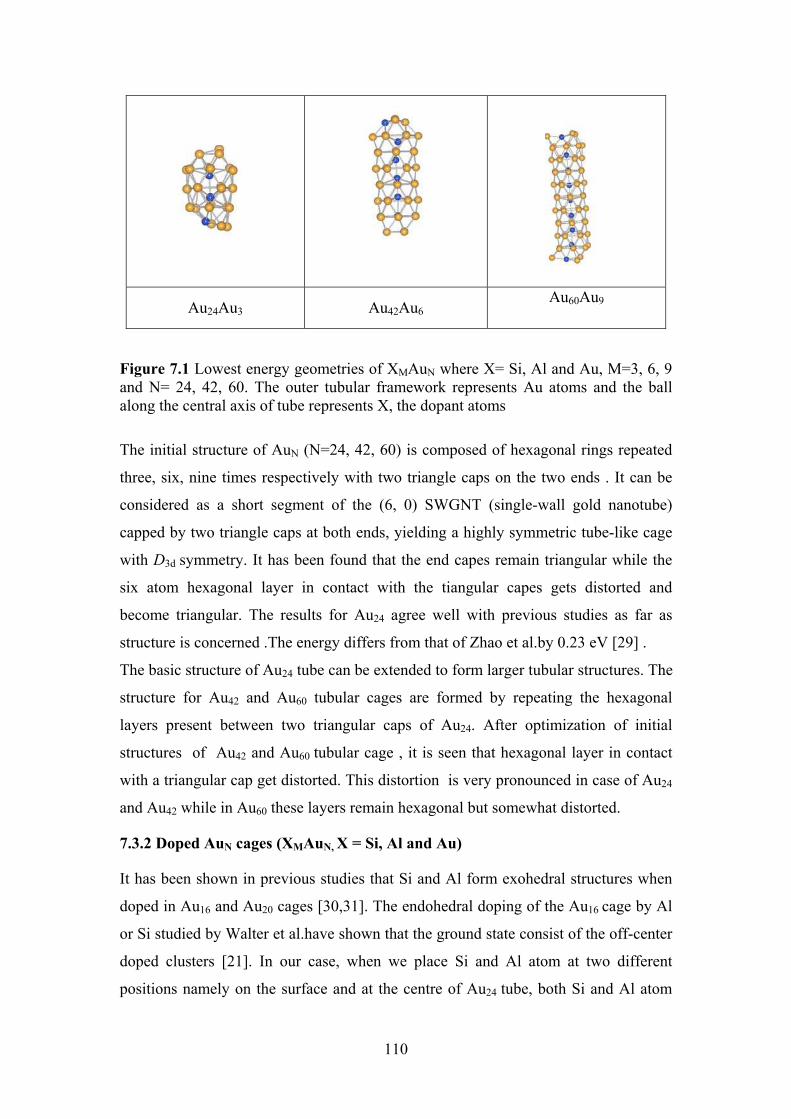
110
Au24Au3 Au42Au6 Au60Au9
Figure 7.1 Lowest energy geometries of XMAuN where X= Si, Al and Au, M=3, 6, 9 and N= 24, 42, 60. The outer tubular framework represents Au atoms and the ball along the central axis of tube represents X, the dopant atoms
The initial structure of AuN (N=24, 42, 60) is composed of hexagonal rings repeated
three, six, nine times respectively with two triangle caps on the two ends . It can be
considered as a short segment of the (6, 0) SWGNT (single-wall gold nanotube)
capped by two triangle caps at both ends, yielding a highly symmetric tube-like cage
with D3d symmetry. It has been found that the end capes remain triangular while the
six atom hexagonal layer in contact with the tiangular capes gets distorted and
become triangular. The results for Au24 agree well with previous studies as far as
structure is concerned .The energy differs from that of Zhao et al.by 0.23 eV [29] .
The basic structure of Au24 tube can be extended to form larger tubular structures. The
structure for Au42 and Au60 tubular cages are formed by repeating the hexagonal
layers present between two triangular caps of Au24. After optimization of initial
structures of Au42 and Au60 tubular cage , it is seen that hexagonal layer in contact
with a triangular cap get distorted. This distortion is very pronounced in case of Au24
and Au42 while in Au60 these layers remain hexagonal but somewhat distorted.
7.3.2 Doped AuN cages (XMAuN, X = Si, Al and Au)
It has been shown in previous studies that Si and Al form exohedral structures when
doped in Au16 and Au20 cages [30,31]. The endohedral doping of the Au16 cage by Al
or Si studied by Walter et al.have shown that the ground state consist of the off-center
doped clusters [21]. In our case, when we place Si and Al atom at two different
positions namely on the surface and at the centre of Au24 tube, both Si and Al atom
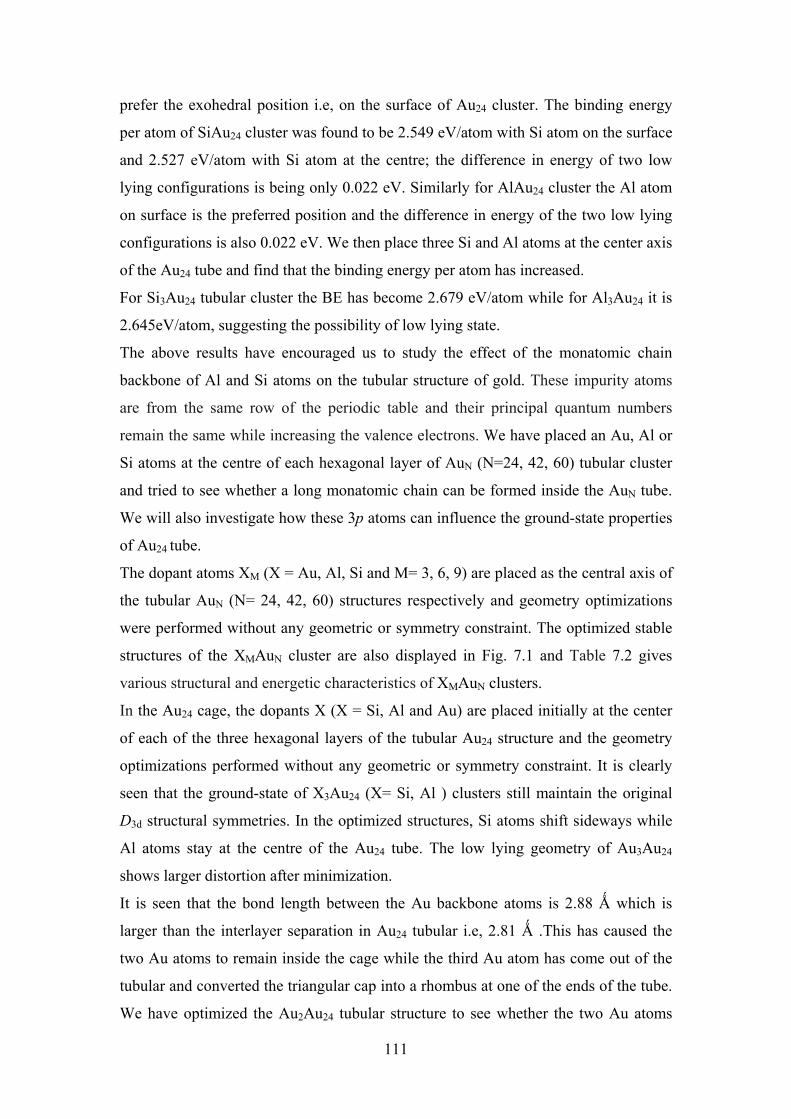
111
prefer the exohedral position i.e, on the surface of Au24 cluster. The binding energy
per atom of SiAu24 cluster was found to be 2.549 eV/atom with Si atom on the surface
and 2.527 eV/atom with Si atom at the centre; the difference in energy of two low
lying configurations is being only 0.022 eV. Similarly for AlAu24 cluster the Al atom
on surface is the preferred position and the difference in energy of the two low lying
configurations is also 0.022 eV. We then place three Si and Al atoms at the center axis
of the Au24 tube and find that the binding energy per atom has increased.
For Si3Au24 tubular cluster the BE has become 2.679 eV/atom while for Al3Au24 it is
2.645eV/atom, suggesting the possibility of low lying state.
The above results have encouraged us to study the effect of the monatomic chain
backbone of Al and Si atoms on the tubular structure of gold. These impurity atoms
are from the same row of the periodic table and their principal quantum numbers
remain the same while increasing the valence electrons. We have placed an Au, Al or
Si atoms at the centre of each hexagonal layer of AuN (N=24, 42, 60) tubular cluster
and tried to see whether a long monatomic chain can be formed inside the AuN tube.
We will also investigate how these 3p atoms can influence the ground-state properties
of Au24 tube.
The dopant atoms XM (X = Au, Al, Si and M= 3, 6, 9) are placed as the central axis of
the tubular AuN (N= 24, 42, 60) structures respectively and geometry optimizations
were performed without any geometric or symmetry constraint. The optimized stable
structures of the XMAuN cluster are also displayed in Fig. 7.1 and Table 7.2 gives
various structural and energetic characteristics of XMAuN clusters.
In the Au24 cage, the dopants X (X = Si, Al and Au) are placed initially at the center
of each of the three hexagonal layers of the tubular Au24 structure and the geometry
optimizations performed without any geometric or symmetry constraint. It is clearly
seen that the ground-state of X3Au24 (X= Si, Al ) clusters still maintain the original
D3d structural symmetries. In the optimized structures, Si atoms shift sideways while
Al atoms stay at the centre of the Au24 tube. The low lying geometry of Au3Au24
shows larger distortion after minimization.
It is seen that the bond length between the Au backbone atoms is 2.88 ┭ which is
larger than the interlayer separation in Au24 tubular i.e, 2.81 ┭ .This has caused the
two Au atoms to remain inside the cage while the third Au atom has come out of the
tubular and converted the triangular cap into a rhombus at one of the ends of the tube.
We have optimized the Au2Au24 tubular structure to see whether the two Au atoms
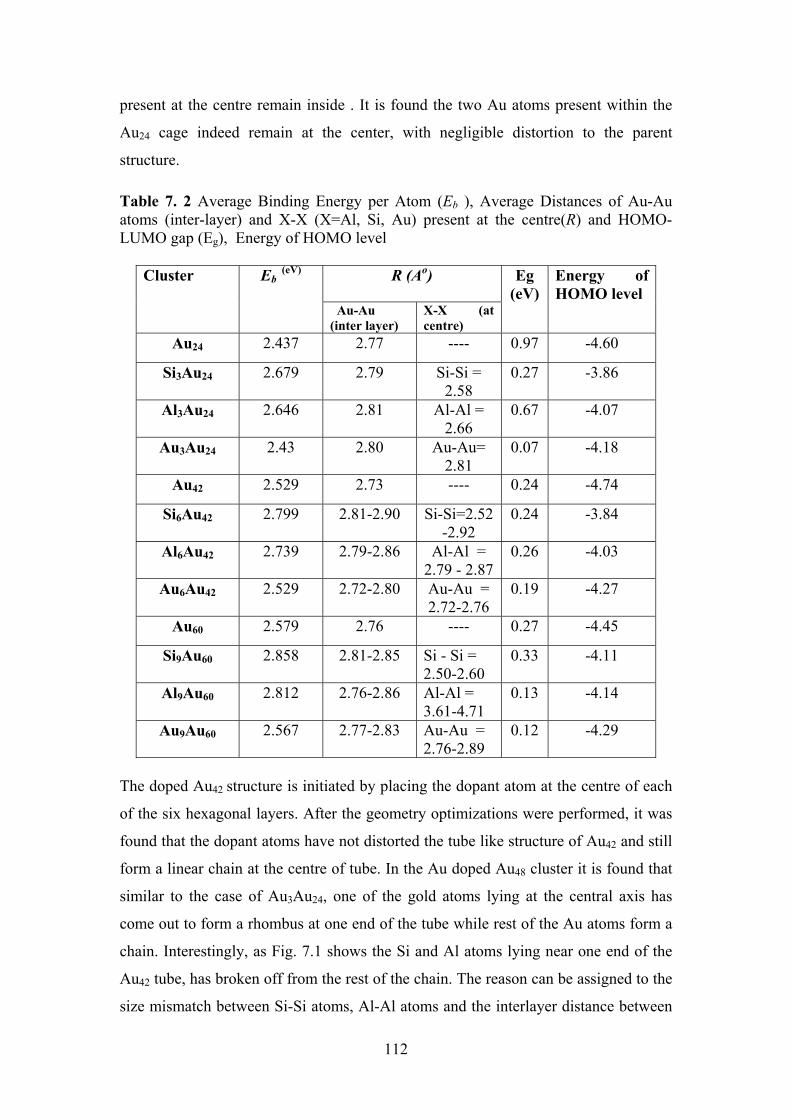
112
present at the centre remain inside . It is found the two Au atoms present within the
Au24 cage indeed remain at the center, with negligible distortion to the parent
structure.
Table 7. 2 Average Binding Energy per Atom (Eb ), Average Distances of Au-Au atoms (inter-layer) and X-X (X=Al, Si, Au) present at the centre(R) and HOMO-LUMO gap (Eg), Energy of HOMO level
Cluster Eb (eV)
R (Ao) Eg
(eV)
Energy of
HOMO level Au-Au
(inter layer)
X-X (at
centre)
Au24 2.437 2.77 ---- 0.97 -4.60
Si3Au24 2.679 2.79 Si-Si = 2.58
0.27 -3.86
Al3Au24 2.646 2.81 Al-Al = 2.66
0.67 -4.07
Au3Au24 2.43 2.80 Au-Au= 2.81
0.07 -4.18
Au42 2.529 2.73 ---- 0.24 -4.74
Si6Au42 2.799 2.81-2.90 Si-Si=2.52 -2.92
0.24 -3.84
Al6Au42 2.739 2.79-2.86 Al-Al = 2.79 - 2.87
0.26 -4.03
Au6Au42 2.529 2.72-2.80 Au-Au = 2.72-2.76
0.19 -4.27
Au60 2.579 2.76 ---- 0.27 -4.45
Si9Au60 2.858 2.81-2.85 Si - Si = 2.50-2.60
0.33 -4.11
Al9Au60 2.812 2.76-2.86 Al-Al = 3.61-4.71
0.13 -4.14
Au9Au60 2.567 2.77-2.83 Au-Au = 2.76-2.89
0.12 -4.29
The doped Au42 structure is initiated by placing the dopant atom at the centre of each
of the six hexagonal layers. After the geometry optimizations were performed, it was
found that the dopant atoms have not distorted the tube like structure of Au42 and still
form a linear chain at the centre of tube. In the Au doped Au48 cluster it is found that
similar to the case of Au3Au24, one of the gold atoms lying at the central axis has
come out to form a rhombus at one end of the tube while rest of the Au atoms form a
chain. Interestingly, as Fig. 7.1 shows the Si and Al atoms lying near one end of the
Au42 tube, has broken off from the rest of the chain. The reason can be assigned to the
size mismatch between Si-Si atoms, Al-Al atoms and the interlayer distance between
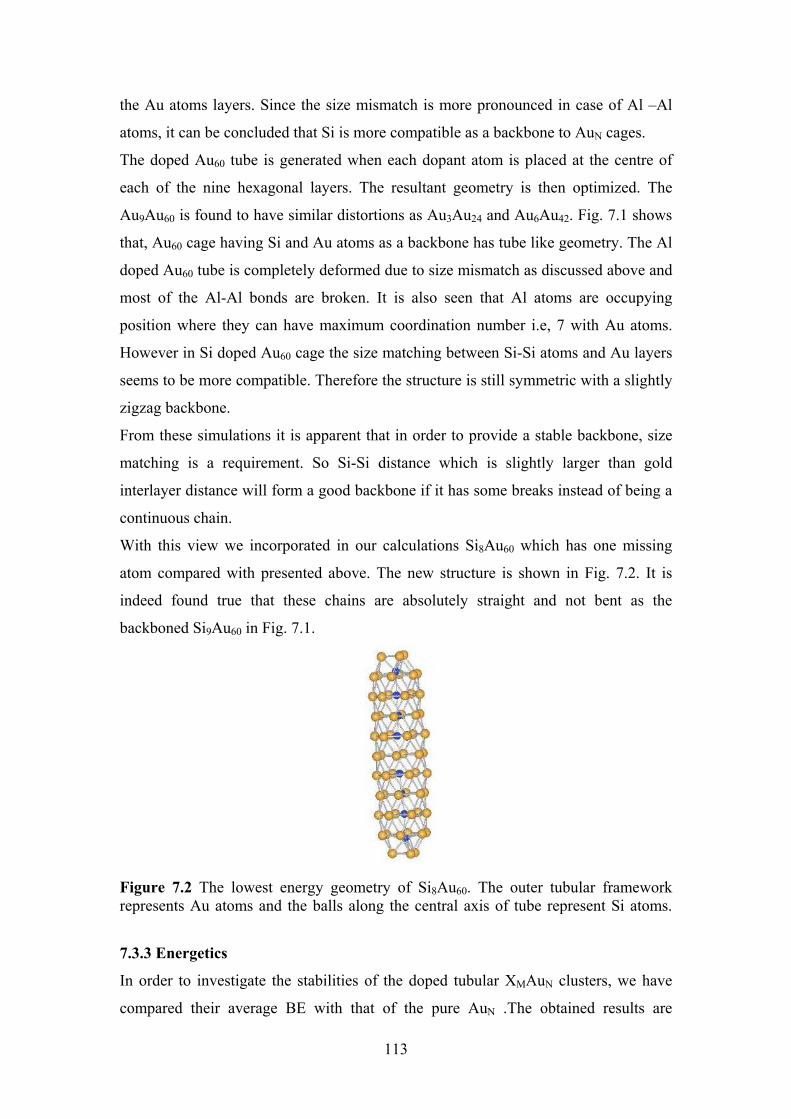
113
the Au atoms layers. Since the size mismatch is more pronounced in case of Al –Al
atoms, it can be concluded that Si is more compatible as a backbone to AuN cages.
The doped Au60 tube is generated when each dopant atom is placed at the centre of
each of the nine hexagonal layers. The resultant geometry is then optimized. The
Au9Au60 is found to have similar distortions as Au3Au24 and Au6Au42. Fig. 7.1 shows
that, Au60 cage having Si and Au atoms as a backbone has tube like geometry. The Al
doped Au60 tube is completely deformed due to size mismatch as discussed above and
most of the Al-Al bonds are broken. It is also seen that Al atoms are occupying
position where they can have maximum coordination number i.e, 7 with Au atoms.
However in Si doped Au60 cage the size matching between Si-Si atoms and Au layers
seems to be more compatible. Therefore the structure is still symmetric with a slightly
zigzag backbone.
From these simulations it is apparent that in order to provide a stable backbone, size
matching is a requirement. So Si-Si distance which is slightly larger than gold
interlayer distance will form a good backbone if it has some breaks instead of being a
continuous chain.
With this view we incorporated in our calculations Si8Au60 which has one missing
atom compared with presented above. The new structure is shown in Fig. 7.2. It is
indeed found true that these chains are absolutely straight and not bent as the
backboned Si9Au60 in Fig. 7.1.
Figure 7.2 The lowest energy geometry of Si8Au60. The outer tubular framework represents Au atoms and the balls along the central axis of tube represent Si atoms.
7.3.3 Energetics
In order to investigate the stabilities of the doped tubular XMAuN clusters, we have
compared their average BE with that of the pure AuN .The obtained results are
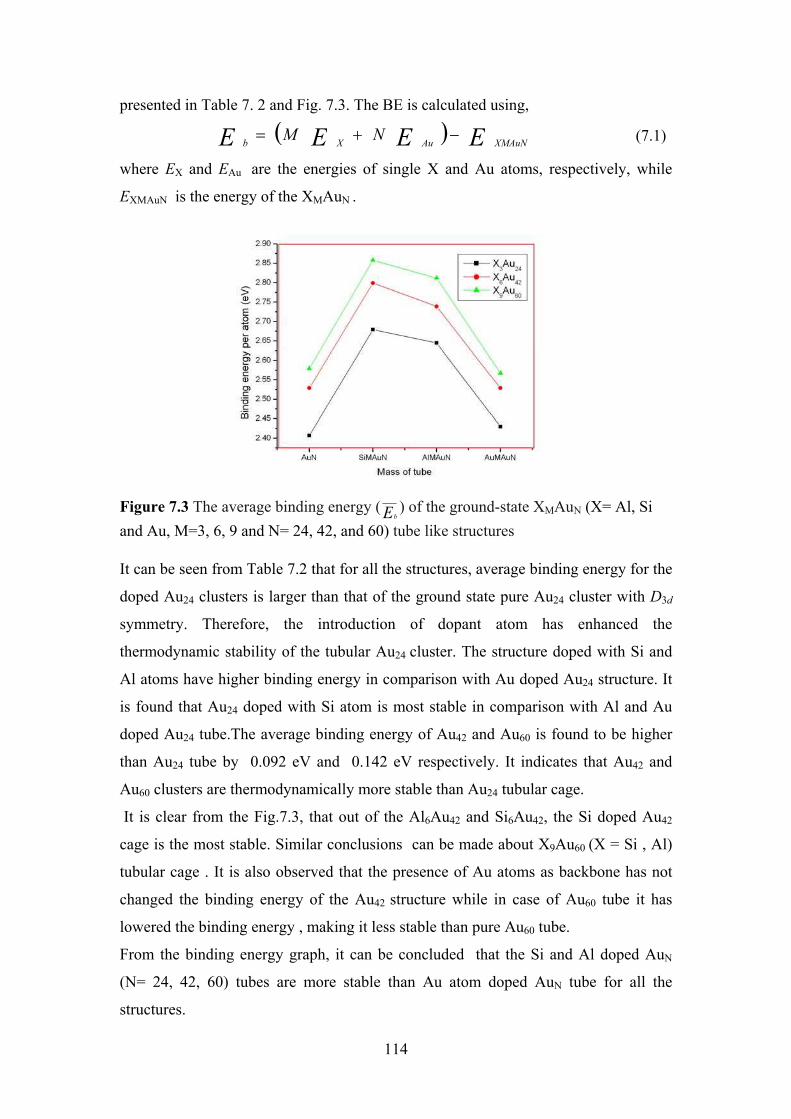
114
presented in Table 7. 2 and Fig. 7.3. The BE is calculated using,
( ) EEEE XMAuNAuXbNM −+= (7.1)
where EX and EAu are the energies of single X and Au atoms, respectively, while
EXMAuN is the energy of the XMAuN .
Figure 7.3 The average binding energy ( Eb) of the ground-state XMAuN (X= Al, Si
and Au, M=3, 6, 9 and N= 24, 42, and 60) tube like structures
It can be seen from Table 7.2 that for all the structures, average binding energy for the
doped Au24 clusters is larger than that of the ground state pure Au24 cluster with D3d
symmetry. Therefore, the introduction of dopant atom has enhanced the
thermodynamic stability of the tubular Au24 cluster. The structure doped with Si and
Al atoms have higher binding energy in comparison with Au doped Au24 structure. It
is found that Au24 doped with Si atom is most stable in comparison with Al and Au
doped Au24 tube.The average binding energy of Au42 and Au60 is found to be higher
than Au24 tube by 0.092 eV and 0.142 eV respectively. It indicates that Au42 and
Au60 clusters are thermodynamically more stable than Au24 tubular cage.
It is clear from the Fig.7.3, that out of the Al6Au42 and Si6Au42, the Si doped Au42
cage is the most stable. Similar conclusions can be made about X9Au60 (X = Si , Al)
tubular cage . It is also observed that the presence of Au atoms as backbone has not
changed the binding energy of the Au42 structure while in case of Au60 tube it has
lowered the binding energy , making it less stable than pure Au60 tube.
From the binding energy graph, it can be concluded that the Si and Al doped AuN
(N= 24, 42, 60) tubes are more stable than Au atom doped AuN tube for all the
structures.
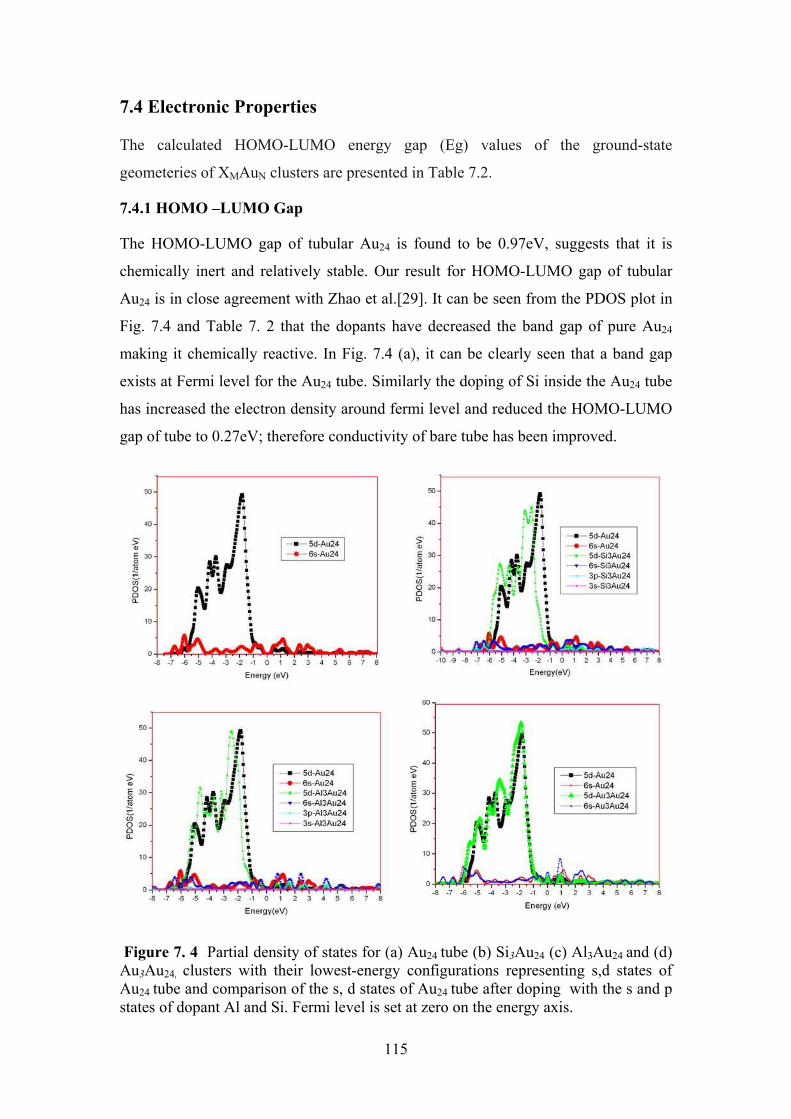
115
7.4 Electronic Properties
The calculated HOMO-LUMO energy gap (Eg) values of the ground-state
geometeries of XMAuN clusters are presented in Table 7.2.
7.4.1 HOMO –LUMO Gap
The HOMO-LUMO gap of tubular Au24 is found to be 0.97eV, suggests that it is
chemically inert and relatively stable. Our result for HOMO-LUMO gap of tubular
Au24 is in close agreement with Zhao et al.[29]. It can be seen from the PDOS plot in
Fig. 7.4 and Table 7. 2 that the dopants have decreased the band gap of pure Au24
making it chemically reactive. In Fig. 7.4 (a), it can be clearly seen that a band gap
exists at Fermi level for the Au24 tube. Similarly the doping of Si inside the Au24 tube
has increased the electron density around fermi level and reduced the HOMO-LUMO
gap of tube to 0.27eV; therefore conductivity of bare tube has been improved.
Figure 7. 4 Partial density of states for (a) Au24 tube (b) Si3Au24 (c) Al3Au24 and (d) Au3Au24, clusters with their lowest-energy configurations representing s,d states of Au24 tube and comparison of the s, d states of Au24 tube after doping with the s and p states of dopant Al and Si. Fermi level is set at zero on the energy axis.
116
This observation is further strengthened by plot of density of the states. In PDOS plot
Fig. 7. 4 (b), there is a clear shift of d-energy levels to deeper energy levels on silicon
doping. It can also be seen from Table 7.2, the HOMO level of Au24 tube on doping
with Si shifts from -4.60eV to -3.86eV. In Fig. 7.4 (d), PDOS of Au3Au24 tube is
plotted. The placing of Au atoms within Au24 has increased the electron density at
Fermi level reducing the band gap to 0.07eV but has not produced any significant
shift in the d-orbitals towards lower energy.Thus it can be concluded that Si doping
enhances the conductivity and stability of the Au24 tube. Similar observations can be
made for the Al doped Au24 tube. However the effect of Al doping on the shifting of d
orbitals of Au24 tube and in reducing the HOMO-LUMO gap is less in comparison
with Si.
For higher AuN tubes, the similar trend can be observed. Table 7.2 shows, that the
HOMO energy levels of the AlMAuN and SiMAuN (where M=6, 9 and N= 42, 60)
clusters are shifted upwards (less −ve) with respect to that of pure AuN spectrum.
7.4.2 Mulliken Charge Analysis
The Mulliken Charge analysis of silicon doped Au24 shows systematic charge transfer
from the ends of the tube towards the centre. No such trend is followed by Al atoms
doped within AuN tubular cage. In general the effect of Si doping is more pronounced
than Al and Au atoms within AuN tube.
7.5 Conclusion
In summary, we have made relativistic DFT studies on the stability and electronic
properties of the tubular XMAuN (X= Si, Al and Au, M=3, 6, 9 and N= 24, 42, 60)
clusters. It was found that the encapsulations of Si and Al atoms do not destroy the
tubular frameworks of the gold host though they change the energy hierarchy of the
pure AuN isomers, showing a high possibility to form a novel binary cluster with gold
providing tubular structures.
• The ground states of Al3Au24 and Si3Au24 still possess the D3d structural
symmetry of the host tubular Au24, but Au3Au24 have the lower symmetries of
C1 and C2V, respectively, because Au atoms have induced the structural
distortions.
• As the size of the AuN tube increases, the tubular structure of AuN is retained
in presence of Si and Au atoms while it get distorted due to Al atoms.
117
• The Si and Al atoms can form long chains within Au nanotube if a gap is
given after every 4-6 layers of Au atoms to accommodate the size mismatch
between Si-Si, Al-Al and Au layers. The Si doping within AuN tube is more
compatible than the Al doping.
• The PDOS of the tubular AuN tube has been significantly changed by the
dopant atoms.The dopant atoms have increased the electron density around
fermi level and shifted the d-energy levels to deeper energy levels thus
reducing the HOMO-LUMO gap of AuN tube. The effect is more pronounced
in Si doped AuN than Al and Au atoms doped AuN tube.
118
Bibliography
[1] S. Bulusu, X. Li, L.S.Wang, X. C. Zeng, J. Phys. Chem. C 111, 4190- 4198 (2007).
[2] X. Gu, M. Ji, S.H. Wei, X.G. Gong Phys. Rev. B 70, 205401 (2004).
[3] D. Tian, J. Zhao, B. Wang, R.B. King, J. Phys. Chem. A 111, 411(2007).
[4] B.Soule de Bas, , Ford, M. J., Cortie, M. B. J. Mol. Struct. (THEOCHEM) 686, 193 (2004).
[5] J. Wang , J. Jellinek, J. Zhao, Z. Chen, R. B. King, P. V. R. Schleyer, J. Phys.
Chem A 109, 9265 (2005).
[6] E. M. Fernandez, J. M. Soler, L.C. Balbas , Phys. Rev. B, 73, 235433( 2006).
[7] V. Verma, K. Dharamvir, J. Nano Research 4, 65- 77 (2008).
[8] (a) P. Pyykko,N. Runeberg, Angew. Chem. 114, 2278 (2002) ( b) P. Pyykko, N. Runeberg, Angew. Chem., Int. Ed., 41, 2174 (2002).
[9] X. Li, B. Kiran, J. Li, H. J. Zhai, L. S. Wang, Angew. Chem. Int. Ed., 41, 4786 (2002).
[10] R. J. C. Batista, M. S. C. Mazzoni, L.O. Ladeira, H. Chacham, Phys. Rev. B 72, 085447 (2005).
[11] M. C. Daniel, D. Astruct, Chem. Rev. 104, 293 (2004).
[12] Chem. Soc. Rev. 37 , 9 (2008).
[13] W. H. Fang, J. S. Chen, Q. H. Zhang , Deng, W. P. Y. Wang ,Chem. Eur. J. 17, 1247 (2011).
[14] Y. C. Chang, Chen , D. H. Hazard, J. Mater. 165, 664 (2009).
[15] X. Chen, D. Y. Zhao ,Y. L An , Y. Zhang , J. Cheng, B.L. Wang , L.Q. Shi, J. Colloid Interface Sci., 322, 414 (2008).
[16] H. K. He, C. Gao, Sci. China-Chem., 54 , 397 (2011).
[17] G. Zaupa, C. Mora , R. Bonomi, L. J. Prins , P. Scrimin, Chem. Eur. J., 17,4879 (2011).
[18] S. Goel, K. A. Velizhanin, A. Piryatinski, S. A.Ivanov,S. Tretiak, J. Phys. Chem. C 116, 3242−3249 (2012).
[19] J. S. Lin, C.C. Chen, E. W.G Diau, T. F. Liu, J. Mat. Proc. Tech. 206 , 425–430 (2008).
[20] R.C. Weast, CRC Handbook of Chemistry and Physics, CRC,Cleveland 49th ed. (1969).
[21] M. Walter, H. Hakkinen, Phys. Chem. Chem. Phys. 8, 5407–5411(2006).
[22] C. Majumder, A. K. Kandalam, P. Jena, P. Phys. Rev. B 74, 20543 (2006).
[23] C. Majumder, S. K. Kulshreshtha Phys. Rev. B 73, 155427 (2006).
[24] (a) G. Kresse, J. Hafner, Phys. Rev. B 47, 558 (1993); (b)G. Kresse, Furthmuller, J. Phys. Rev. B 54, 11169 (1996).
119
[25] P. Perdew, Electronic Structure of Solids ’91, edited by P. Ziesche and H. Eschrig Akademie, Berlin (1991).
[26] J. J. Scherer, J. B. Paul, C. P. Collier, A. O’Keeffe, R. J. Saykally, J Chem.Phys. 103, 9187 (1995).
[27] K. P. Huber, G. Herzberg, Constants of Diatomic Molecules, van Nostrand Reinhold , New York ( 1979).
[28] K. A. Gingerich, G. D. Blue, J. Chem. Phys. 59, 185 (1973).
[29] D. X. Tian, J. J. Zhao, J. Phys. Chem. A 112, 3141 (2008).
[30] Q. Sun, Q. Wang, G. Chen, P. Jena, J. Chem. Phy. 127, 214706 (2007).
[31] R. Chinagandham, C. Majumder, J. Chem. Phy. 130, 234309 (2009).
120
Chapter-8
8. Gold Monoatomic Chains
8.1 Introduction
Nanoscale materials have peculiar properties different from crystalline structures due
to the quantum confinement of electrons. Among the nanostructured materials,
nanowires have emerged as one of the important structural components in future
nanomaterials, mainly due to their high strength and ductility as compared to bulk
materials. Metal nanowires display interesting quantum behavior, quantization of
conductance, even at room temperature due to large energy level separation of the
transport channels unlike in semiconductors. To simulate these structures a series of
wire geometries are studied containing different number of atoms and under varying
stretching conditions. The formation of these atomic wires has been supported by
many theoretical and experimental calculations [1-4]
Among the metals, Gold nanowires (GNW) exhibit very interesting properties such as
quantized conductance and the ability of evolution into linear gold chains which
display large Au-Au interatomic distances before breaking as well as great potential in
applied fields such as nanoelectronic [5-8].
The evolution, formation, and breaking of atomically thin gold nanowires with
diameters of a few atoms, is another important aspect of theoretical and experimental
studies. In the case of gold nanowires large interatomic distances for one atom thick
nanowires have been reported by various experimental groups. Ohnishi et al. [9] using
transmission electron microscopy (TEM) technique reported results of Au−Au
distances in the range of 3.5 to 4.0Å for gold chain. Yanson et al. using a
mechanically controllable break junction (MCBJ) on a scanning tunneling microscope
(STM), reported distances for Au −Au of 3.6Å inferred from histograms of chain
lengths and have recently re-analyzed those results and argued that a precise
calibration gives Au−Au distances of 2.6 ± 0.2Å [6, 10].
The simulation methods, ranging from effective potentials to tight binding based, up
to ab initio electronic structure, have helped to aid the understanding of experiments
as well as stimulate new experiments, since these techniques have the predictive
power.
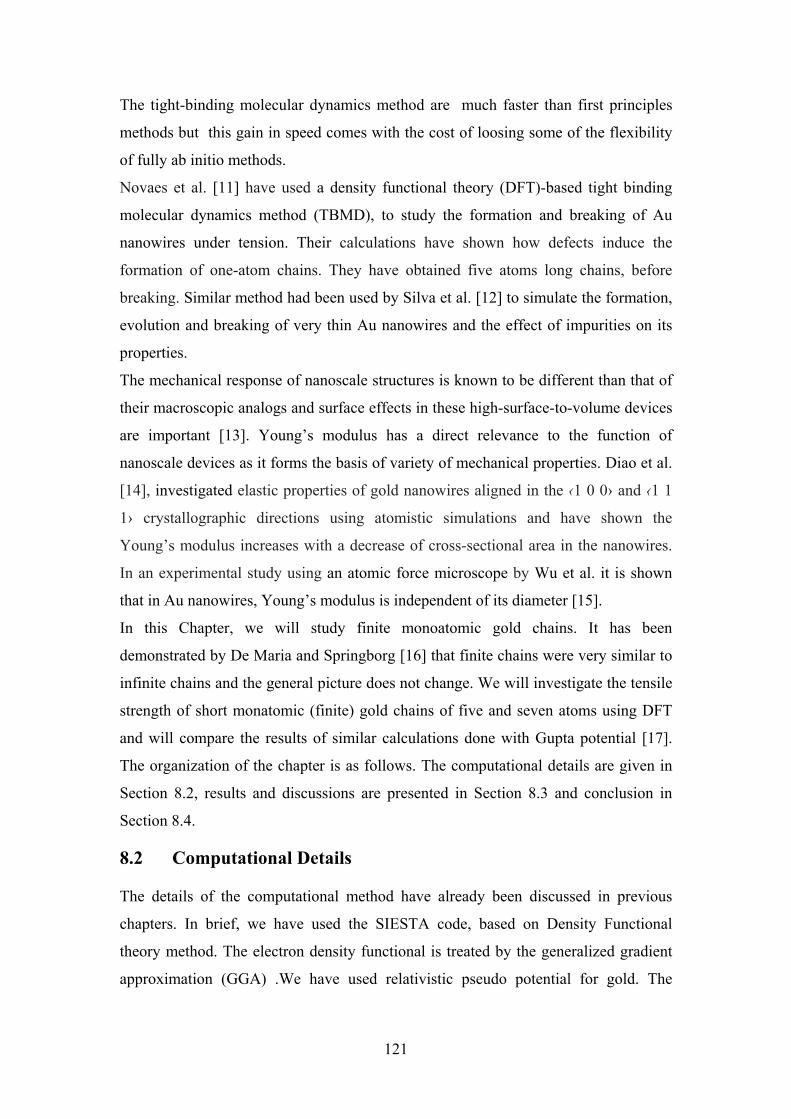
121
The tight-binding molecular dynamics method are much faster than first principles
methods but this gain in speed comes with the cost of loosing some of the flexibility
of fully ab initio methods.
Novaes et al. [11] have used a density functional theory (DFT)-based tight binding
molecular dynamics method (TBMD), to study the formation and breaking of Au
nanowires under tension. Their calculations have shown how defects induce the
formation of one-atom chains. They have obtained five atoms long chains, before
breaking. Similar method had been used by Silva et al. [12] to simulate the formation,
evolution and breaking of very thin Au nanowires and the effect of impurities on its
properties.
The mechanical response of nanoscale structures is known to be different than that of
their macroscopic analogs and surface effects in these high-surface-to-volume devices
are important [13]. Young’s modulus has a direct relevance to the function of
nanoscale devices as it forms the basis of variety of mechanical properties. Diao et al.
[14], investigated elastic properties of gold nanowires aligned in the ‹1 0 0› and ‹1 1
1› crystallographic directions using atomistic simulations and have shown the
Young’s modulus increases with a decrease of cross-sectional area in the nanowires.
In an experimental study using an atomic force microscope by Wu et al. it is shown
that in Au nanowires, Young’s modulus is independent of its diameter [15].
In this Chapter, we will study finite monoatomic gold chains. It has been
demonstrated by De Maria and Springborg [16] that finite chains were very similar to
infinite chains and the general picture does not change. We will investigate the tensile
strength of short monatomic (finite) gold chains of five and seven atoms using DFT
and will compare the results of similar calculations done with Gupta potential [17].
The organization of the chapter is as follows. The computational details are given in
Section 8.2, results and discussions are presented in Section 8.3 and conclusion in
Section 8.4.
8.2 Computational Details
The details of the computational method have already been discussed in previous
chapters. In brief, we have used the SIESTA code, based on Density Functional
theory method. The electron density functional is treated by the generalized gradient
approximation (GGA) .We have used relativistic pseudo potential for gold. The
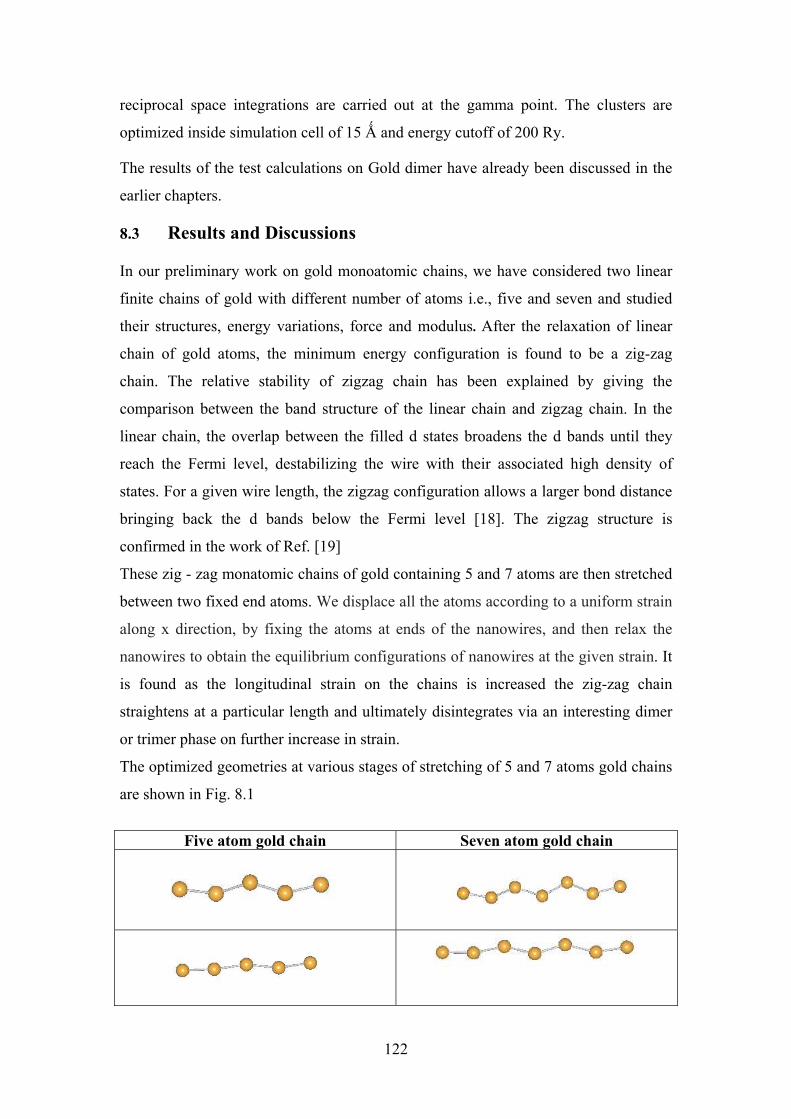
122
reciprocal space integrations are carried out at the gamma point. The clusters are
optimized inside simulation cell of 15 ┭ and energy cutoff of 200 Ry.
The results of the test calculations on Gold dimer have already been discussed in the
earlier chapters.
8.3 Results and Discussions
In our preliminary work on gold monoatomic chains, we have considered two linear
finite chains of gold with different number of atoms i.e., five and seven and studied
their structures, energy variations, force and modulus. After the relaxation of linear
chain of gold atoms, the minimum energy configuration is found to be a zig-zag
chain. The relative stability of zigzag chain has been explained by giving the
comparison between the band structure of the linear chain and zigzag chain. In the
linear chain, the overlap between the filled d states broadens the d bands until they
reach the Fermi level, destabilizing the wire with their associated high density of
states. For a given wire length, the zigzag configuration allows a larger bond distance
bringing back the d bands below the Fermi level [18]. The zigzag structure is
confirmed in the work of Ref. [19]
These zig - zag monatomic chains of gold containing 5 and 7 atoms are then stretched
between two fixed end atoms. We displace all the atoms according to a uniform strain
along x direction, by fixing the atoms at ends of the nanowires, and then relax the
nanowires to obtain the equilibrium configurations of nanowires at the given strain. It
is found as the longitudinal strain on the chains is increased the zig-zag chain
straightens at a particular length and ultimately disintegrates via an interesting dimer
or trimer phase on further increase in strain.
The optimized geometries at various stages of stretching of 5 and 7 atoms gold chains
are shown in Fig. 8.1
Five atom gold chain Seven atom gold chain

123
Figure 8.1 Various stages of stretching for pure monatomic Au chain containing 5 and 7 atoms.
8.3.1 Energy vs Length of chain
The variation in total energy (U) of the chain with the increase in total length of the
chain for five and seven gold atoms is plotted in Fig. 8.2. The plot shows the
comparison of results with the similar calculations done through Gupta Potential (GP)
[17].
It can be seen in Fig. 8.2, the total energy is a monotonic function of chain length.
From the DFT calculations, the potential energy curve shows the expected minimum
while in GP results a plateau is seen where crossover from zig-zag to straight
character takes place. In DFT calculations, the minimum in the energy is quite evident
for five atoms gold chain than in seven atoms chain. At minimum (or at the plateau in
case of GP) the energies are at variance in the two methods, but the chain lengths
agree very well.
0.9 1.0 1.1 1.2 1.3 1.4 1.5 1.6 1.7
-0.02
0.00
0.02
0.04
0.06
0.08
0.10
0.12
0.14
0.16
0.18
0.20
0.22
0.24
0.26
0.28
Ene
rgy
(eV
)
Length of Chain (nm)
5 atom GP 7 atom GP 7 atom DFT 5 atom DFT
Figure 8.2 Comparison of variation in total energy with the total length of gold chain from different approaches DFT and GP.
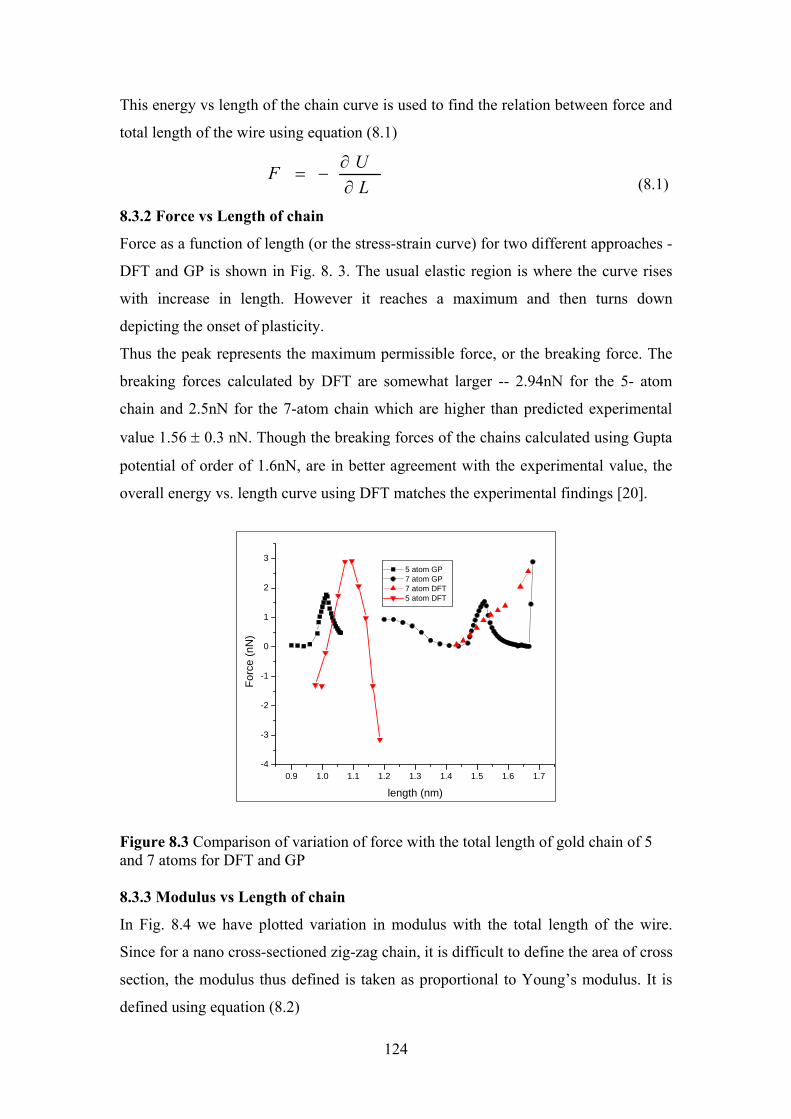
124
This energy vs length of the chain curve is used to find the relation between force and
total length of the wire using equation (8.1)
L
UF
∂∂
−= (8.1)
8.3.2 Force vs Length of chain
Force as a function of length (or the stress-strain curve) for two different approaches -
DFT and GP is shown in Fig. 8. 3. The usual elastic region is where the curve rises
with increase in length. However it reaches a maximum and then turns down
depicting the onset of plasticity.
Thus the peak represents the maximum permissible force, or the breaking force. The
breaking forces calculated by DFT are somewhat larger -- 2.94nN for the 5- atom
chain and 2.5nN for the 7-atom chain which are higher than predicted experimental
value 1.56 ± 0.3 nN. Though the breaking forces of the chains calculated using Gupta
potential of order of 1.6nN, are in better agreement with the experimental value, the
overall energy vs. length curve using DFT matches the experimental findings [20].
0.9 1.0 1.1 1.2 1.3 1.4 1.5 1.6 1.7-4
-3
-2
-1
0
1
2
3
For
ce (
nN)
length (nm)
5 atom GP 7 atom GP 7 atom DFT 5 atom DFT
Figure 8.3 Comparison of variation of force with the total length of gold chain of 5 and 7 atoms for DFT and GP 8.3.3 Modulus vs Length of chain
In Fig. 8.4 we have plotted variation in modulus with the total length of the wire.
Since for a nano cross-sectioned zig-zag chain, it is difficult to define the area of cross
section, the modulus thus defined is taken as proportional to Young’s modulus. It is
defined using equation (8.2)
125
l
FModulus
∂∂
= (8.2)
The ‘unphysical’ regions in Fig. 8. 4, where the stress-strain curves have negative
slopes moduli are negative, cannot exist as stable states of the wire. However in a
dynamic situation (e.g., when the wire is being pulled continuously) they may well
exist. These plastic regions are more clearly seen in GP calculations than in DFT.
0.9 1.0 1.1 1.2 1.3 1.4 1.5 1.6 1.7-110-100-90-80-70-60-50-40-30-20-10
0102030405060708090
Mod
ulus
length(nm)
5 atom GP 7 atom GP 7 atom DFT 5 atom DFT
Figure 8.4 Comparison of variation of modulus with total length of gold chain of 5 and 7 atoms for DFT and GP 8.4 Conclusion
We have studied the structures, energy variations, force and modulus of two linear
finite chains of gold with five and seven atoms and compared the results with similar
calculations done through Gupta Potential.
• It is seen that a given monatomic gold wire which has a zig-zag shape can
assume structures containing qualitatively different regions for different
strains. Interestingly, such regions of strain are separated by plastic regions
which can be accessed by applying the strain dynamically. These plastic
regions are more clearly seen in GP calculations than in DFT results.
• The breaking force more or less agrees with experimentally observed values.
126
Bibliography
[1] J. A. Torres, E. Tosatti, A. D. Corso, F. Ercolessi, J. J. Kohanoff, F. D. D. Tolla, J. M. Soler, Surface Science 426, L441–L446 (1999).
[2] H. Hakkinen, R. N. Barnett, A. G. Scherbakov, and U. Landman, J. Phys.Chem. B 104, 9063–9066( 2000).
[3] L. D. Maria and M. Springborg, Chem. Phys. Lett., vol. 323, 293–299 (2000).
[4] T. Kizuka, Phy. Rev. B 77, 155401 (2008).
[5] E. Z. da Silva, A. J. R. da Silva, A. Fazzio, Phys. Rev. Lett. 87, 256102 (2001).
[6] A. I. Yanson, G. R. Bollinger, H. E. van den Brom, N. Agrait, J. M. van. Ruitenbeek, Nature(London) 395, 783 (1998).
[7] Y. Kondo, K. Takayanagi, Science 289, 606 (2000).
[8] E. Tosatti, S. Prestipino, S. Kostlmeier, A. Dal Corso, F. D. Di Tolla, Science 291, 288 (2001).
[9] H. Ohnishi, Y. Kondo, K. Takayanagi, Nature (London) 395, 780 (1998).
[10] N. Agrait, C. Untiedt, G. R. Bollinger,S. Vieira, Phys. Rev. B 66, 085, 418 (2002).
[11] F. D. Novaes, A. J. R. Da Silva, A. Fazzio1, Edison Z. Da Silva, Appl. Phys. A 81, 1551–1558 (2005).
[12] E. Z. da Silva, F. D. Novaes, A. J. R. da Silva, A. Fazzio, Nanoscale Res. Lett. 1:91–98 (2006).
[13] J. W. Cahn, Acta Metall. 28, 1333 (1980).
[14] J. Diao, K. Gall, M. L.Dunn, J. Mech. Phys. of Solids 52, 1935 – 1962(2004).
[15] B. Wu, A. Heidelberg, J. J. Boland, Lett. Nature Mat. 4 (2005).
[16] L. De Maria,M. Springborg, Chem. Phys. Lett. 323, 293-299 (2000).
[17] Sumali, Priyanka , V. Verma , K. Dharamvir, AIP Conf. Proc. 1447, 335-336 (2012).
[18] D. Sanchez-Portal, E. Artacho, J. Junquera, P. Ordejon, A. Garcia, J. M. Soler, Phys. Rev. Lett. 83, 3884 (1998).
[19] L. De Maria, M. Springborg, Chem. Phys. Lett. 323, 293-299 (2000).
[20] G. Rubio-Bollinger, S. R. Bahn, N. Agrait, K.W. Jacobsen, S. Vieira, Phys. Rev. Lett. 87, 026101 (2001).
127
Chapter 9
9. Phonon Dispersion Of Gold Nanotube
9.1 Introduction
The developments of nanoscale devices require the understanding of nanoscale
phenomena. At such scale, properties like electrical, optical, vibrational and
mechanical become distinctly different from bulk behavior. For example,
nanostructures have been observed to exhibit sharper density of states, reduced
electron-phonon coupling [1-6]. Nanowires and nanotubes have been widely studied
because of their importance in the fundamental physics and the potential applications
in the future nanodevices e.g. gold and carbon nanowires and nanotubes [7, 8].
However, the gold nanotubes and nanowires in comparison with the carbon nanotubes
CNTs, had been found much later and relatively less studied. A finest gold nanowires
of about 0.6 nm in diameter and 6 nm in length were synthesized by Kondo et al.in an
ultrahigh-vacuum (UHV) transmission electron microscope with the electron-beam
thinning technique. They found using high-resolution electron microscopy that the
gold nanowires had a coaxial helical multishell structure, which was similar to that of
the multiwalled carbon nanotube [7]. Recently, Oshima et al. have experimentally
found a single-walled (5, 3) gold nanotube (SWGT) which composed of five atomic
rows coiling around the tube axis [8]. The formation of experimentally observed (5, 3)
gold tube was explained by Senger et al. [9]. Theoretically, the gold nanowires were
studied by Bilalbegović using the molecular-dynamics simulations and the embedded-
atom potential. They found that the gold atoms could form the concentric cylindrical
sheets and even have a double-walled gold nanotube like structure. In the vibrational
density of states (VDOS) study of two cylindrical gold nanowires they found that
maximal vibration frequency is about 6 THz (200 cm−1), higher than that of the bulk
gold, being 4.7 THz (157 cm−1) [10, 11].
Most of the studies focus on the electronic structures and transport properties of the
gold nanowires and nanotubes [12-15] but there are relatively very few studies are
available on the vibrational properties of SWGTs and gold nanowires. Most of the
vibrational analysis studies focus on finding VDOS; a few studies involve the
calculation of vibrational modes of nanowires. The behavior of a material depends on
phonon dynamics, and these dynamics are change substantially as nanostructure
dimensions approach the phonon mean-free path length. A phonon is a quantized
128
mode of vibration occurring in a rigid crystal lattice, such as the atomic lattice of the
solid. The study of phonons is an important in solid state physics as they play a major
role in determining the physical properties of solids such as thermal and electrical
conductivities. In a lattice dynamics calculations of gold using phenomenological
model Thapa has computed the phonon frequencies, Lattice specific heats,
compressibility and Poission’s ratio. They have evaluated force constants and phonon
dispersion relations of bulk gold along symmetry directions [100], [110] and [111]
[16]. The phonon dispersions calculations have been made using both empirical
methods and the accuracy ab initio calculations [17-21].
Phonons are a quantum mechanical version of type of vibrational motion, known as
normal modes in classical mechanics. The normal modes are the elementary
vibrations of the lattice and any arbitrary vibrational motion of the lattice can be
represented as a superposition of normal modes with various frequencies. Although
normal modes are wave like phenomenon in classical mechanics, they acquire particle
like character in quantum mechanics. They are then known as phonons. There are two
types of phonons: Acoustic and Optical phonons.The Lattice dynamics (LD) deals
with problem of finding the normal modes of vibration of a crystal i.e, calculating the
energies (or frequencies ) of the phonons as a function of their wave vector's k .
The relationship between and k is called phonon dispersion.
Optical phonons are found in crystal with more than one atom in the unit cell and
have non zero frequency of vibration, even when the wavelength is large. They are
called optical because in ionic crystal they are easily excited by light (infrared light)
and therefore are called infrared active. The Longitudinal and Transverse optical
phonons phonons are abbreviated as LO and TO respectively.
Acoustic phonons have frequencies that become small at long wavelengths and
correspond to sound waves in the lattice. Longitudinal and Transverse acoustic
phonons are abbreviated as LA and TA respectively. For system with one atom per
unit cell the phonon dispersion curves are represented only by acoustical branches and
if the numbers of atoms in a unit cell are more than one, the optical branches will also
appear. In acoustic modes the atoms moves in phase with each other while in optical
modes the atoms moves out of phase. In general for a system containing N atoms per
unit cell there will be 3 acoustical branches (1 longitudinal and 2 transverse) and 3N-3
optical branches (N-1 longitudinal and 2N-2 transverse).
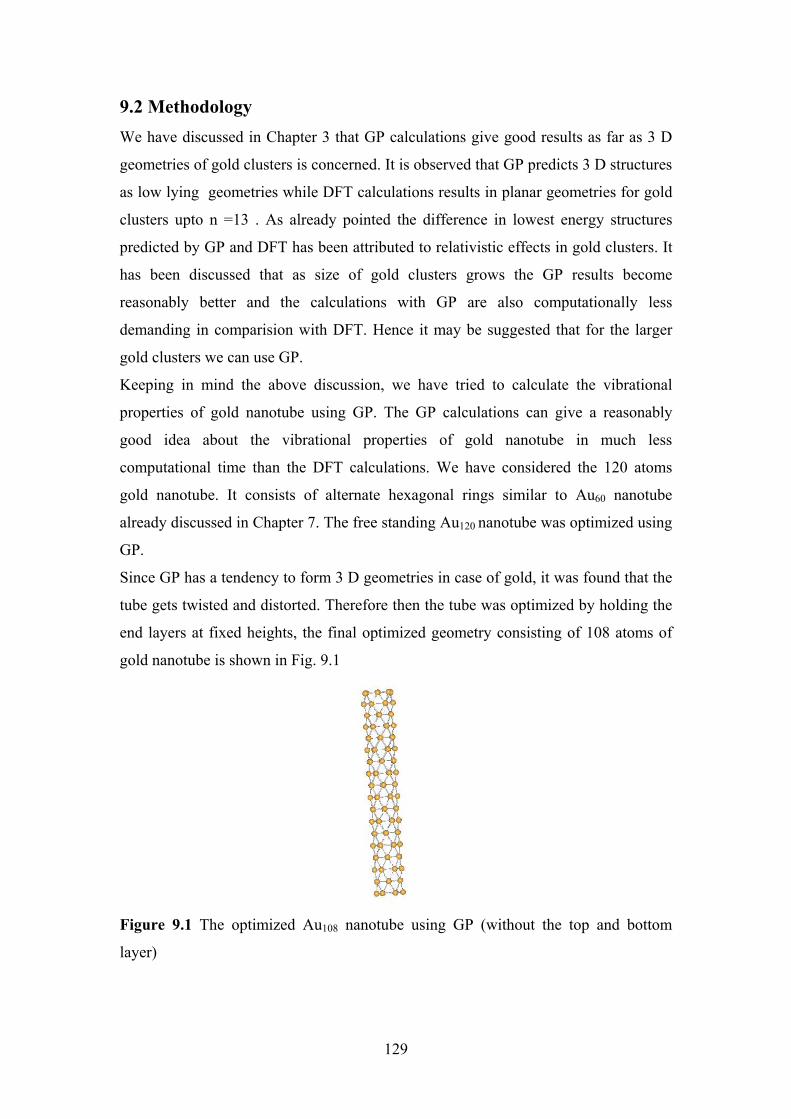
129
9.2 Methodology
We have discussed in Chapter 3 that GP calculations give good results as far as 3 D
geometries of gold clusters is concerned. It is observed that GP predicts 3 D structures
as low lying geometries while DFT calculations results in planar geometries for gold
clusters upto n =13 . As already pointed the difference in lowest energy structures
predicted by GP and DFT has been attributed to relativistic effects in gold clusters. It
has been discussed that as size of gold clusters grows the GP results become
reasonably better and the calculations with GP are also computationally less
demanding in comparision with DFT. Hence it may be suggested that for the larger
gold clusters we can use GP.
Keeping in mind the above discussion, we have tried to calculate the vibrational
properties of gold nanotube using GP. The GP calculations can give a reasonably
good idea about the vibrational properties of gold nanotube in much less
computational time than the DFT calculations. We have considered the 120 atoms
gold nanotube. It consists of alternate hexagonal rings similar to Au60 nanotube
already discussed in Chapter 7. The free standing Au120 nanotube was optimized using
GP.
Since GP has a tendency to form 3 D geometries in case of gold, it was found that the
tube gets twisted and distorted. Therefore then the tube was optimized by holding the
end layers at fixed heights, the final optimized geometry consisting of 108 atoms of
gold nanotube is shown in Fig. 9.1
Figure 9.1 The optimized Au108 nanotube using GP (without the top and bottom
layer)
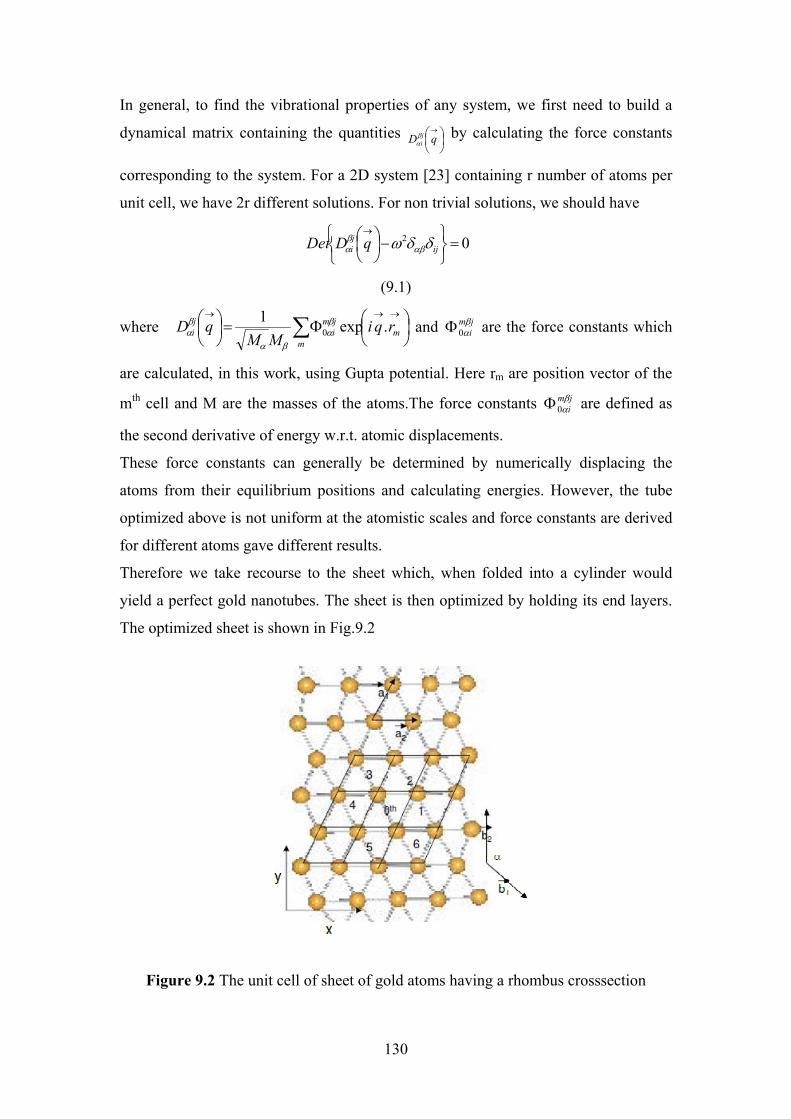
130
In general, to find the vibrational properties of any system, we first need to build a
dynamical matrix containing the quantities ⎟⎠⎞
⎜⎝⎛→
qD j
i
βα
by calculating the force constants
corresponding to the system. For a 2D system [23] containing r number of atoms per
unit cell, we have 2r different solutions. For non trivial solutions, we should have
02 =⎭⎬⎫
⎩⎨⎧ −⎟
⎠⎞
⎜⎝⎛→
ij
j
i qDDet δδω αββα
(9.1)
where ⎟⎠⎞
⎜⎝⎛Φ=⎟
⎠⎞
⎜⎝⎛ →→→
∑ m
m
jm
i
j
i rqiMM
qD .exp1
0βα
βα
βα and jm
i
βα0Φ are the force constants which
are calculated, in this work, using Gupta potential. Here rm are position vector of the
mth cell and M are the masses of the atoms.The force constants jm
i
βα0Φ are defined as
the second derivative of energy w.r.t. atomic displacements.
These force constants can generally be determined by numerically displacing the
atoms from their equilibrium positions and calculating energies. However, the tube
optimized above is not uniform at the atomistic scales and force constants are derived
for different atoms gave different results.
Therefore we take recourse to the sheet which, when folded into a cylinder would
yield a perfect gold nanotubes. The sheet is then optimized by holding its end layers.
The optimized sheet is shown in Fig.9.2
Figure 9.2 The unit cell of sheet of gold atoms having a rhombus crosssection
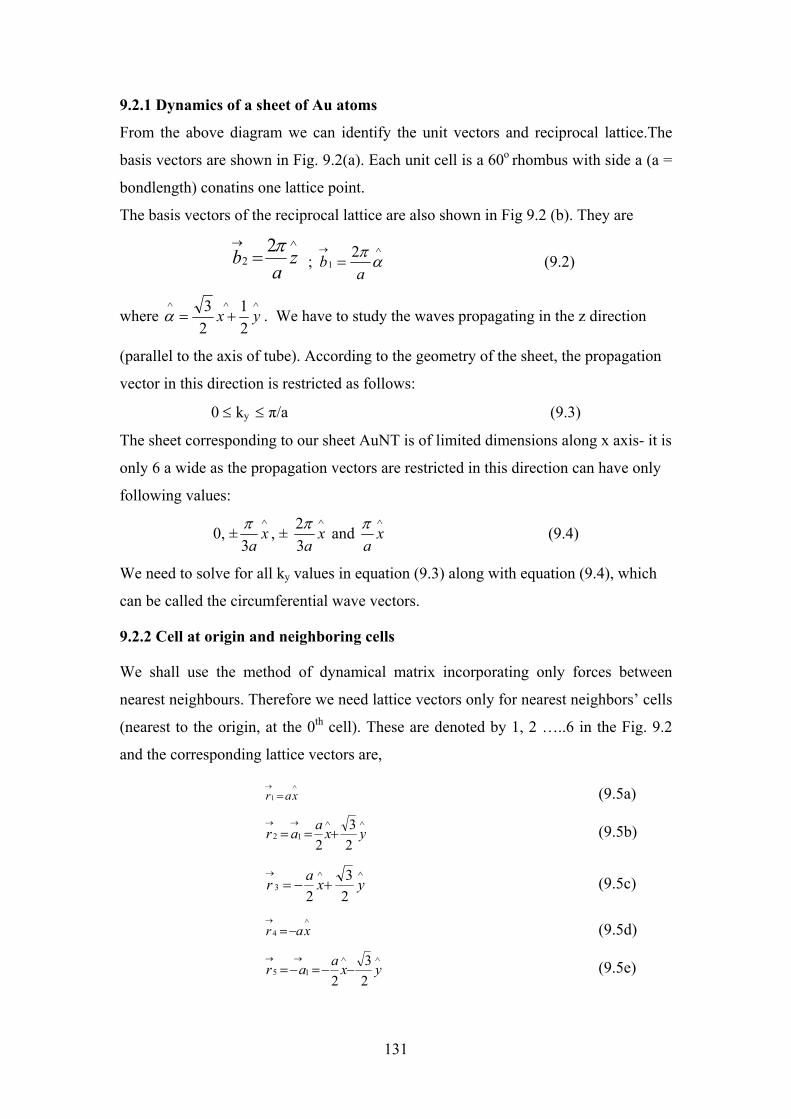
131
9.2.1 Dynamics of a sheet of Au atoms
From the above diagram we can identify the unit vectors and reciprocal lattice.The
basis vectors are shown in Fig. 9.2(a). Each unit cell is a 60o rhombus with side a (a =
bondlength) conatins one lattice point.
The basis vectors of the reciprocal lattice are also shown in Fig 9.2 (b). They are
∧→
= za
bπ2
2 ; ∧→
= απa
b2
1 (9.2)
where ∧∧∧
+= yx2
1
2
3α . We have to study the waves propagating in the z direction
(parallel to the axis of tube). According to the geometry of the sheet, the propagation
vector in this direction is restricted as follows:
0 ≤ ky ≤ ヾ/a (9.3)
The sheet corresponding to our sheet AuNT is of limited dimensions along x axis- it is
only 6 a wide as the propagation vectors are restricted in this direction can have only
following values:
0, ±∧
xa3
π, ±
∧
xa3
2π and
∧
xa
π (9.4)
We need to solve for all ky values in equation (9.3) along with equation (9.4), which
can be called the circumferential wave vectors.
9.2.2 Cell at origin and neighboring cells
We shall use the method of dynamical matrix incorporating only forces between
nearest neighbours. Therefore we need lattice vectors only for nearest neighbors’ cells
(nearest to the origin, at the 0th cell). These are denoted by 1, 2 …..6 in the Fig. 9.2
and the corresponding lattice vectors are,
∧→
= xar1 (9.5a)
∧∧→→
+== yxa
ar2
3
212 (9.5b)
∧∧→
+−= yxa
r2
3
23 (9.5c)
∧→
−= xar 4 (9.5d)
∧∧→→
−−=−= yxa
ar2
3
215 (9.5e)
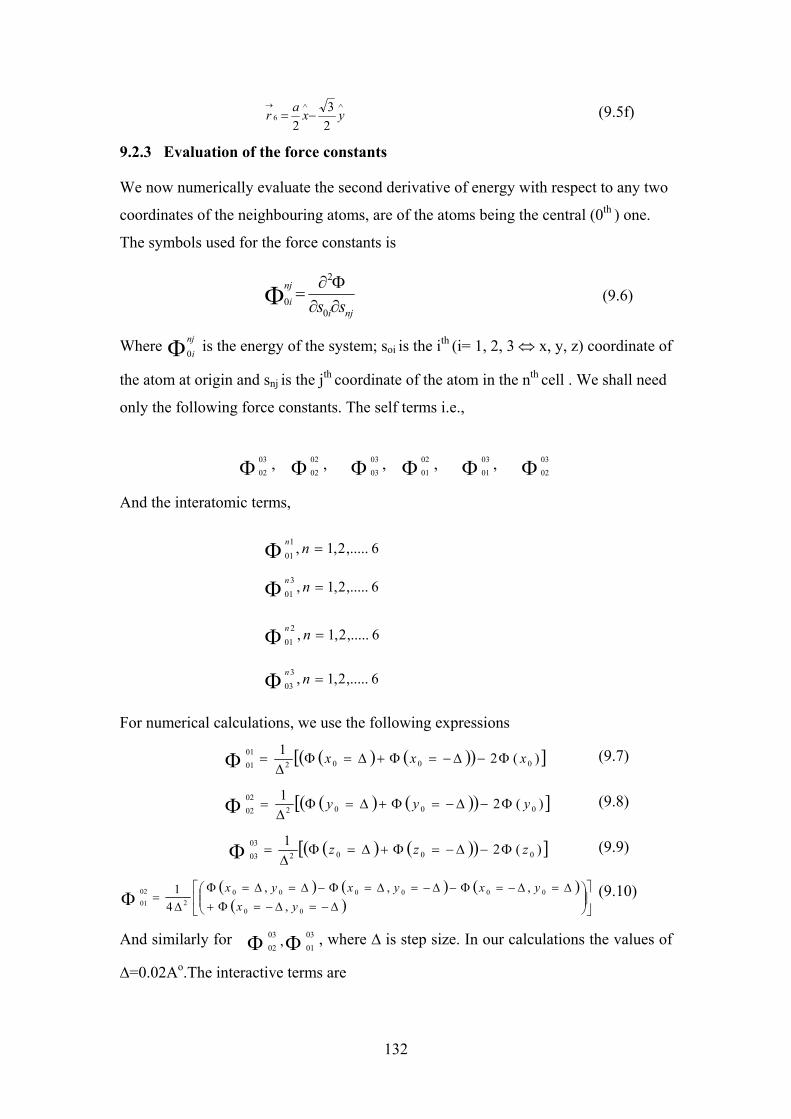
132
∧∧→
−= yxa
r2
3
26 (9.5f)
9.2.3 Evaluation of the force constants
We now numerically evaluate the second derivative of energy with respect to any two
coordinates of the neighbouring atoms, are of the atoms being the central (0th ) one.
The symbols used for the force constants is
nji
nj
i ss ∂∂Φ∂
=Φ0
2
0 (9.6)
Where Φnj
i0 is the energy of the system; soi is the ith (i= 1, 2, 3 ⇔ x, y, z) coordinate of
the atom at origin and snj is the jth coordinate of the atom in the nth cell . We shall need
only the following force constants. The self terms i.e.,
Φ 03
02, Φ 02
02, Φ 03
03, Φ 02
01, Φ 03
01, Φ 03
02
And the interatomic terms,
For numerical calculations, we use the following expressions
( ) ( )( )[ ])(21
0002
01
01xxx Φ−∆−=Φ+∆=Φ
∆=Φ (9.7)
( ) ( )( )[ ])(21
0002
02
02yyy Φ−∆−=Φ+∆=Φ
∆=Φ (9.8)
( ) ( )( )[ ])(21
0002
03
03zzz Φ−∆−=Φ+∆=Φ
∆=Φ (9.9)
( ) ( ) ( )( ) ⎥
⎦
⎤⎢⎣
⎡⎟⎟⎠
⎞⎜⎜⎝
⎛∆−=∆−=Φ+
∆=∆−=Φ−∆−=∆=Φ−∆=∆=Φ
∆=Φ
00
000000
2
02
01 ,
,,,
4
1
yx
yxyxyx (9.10)
And similarly for ΦΦ 03
01
03
02, , where ∆ is step size. In our calculations the values of
∆=0.02Ao.The interactive terms are
6,.....2,1,1
01=Φ n
n
6,.....2,1,2
01=Φ n
n
6,.....2,1,3
01=Φ n
n
6,.....2,1,3
03=Φ n
n
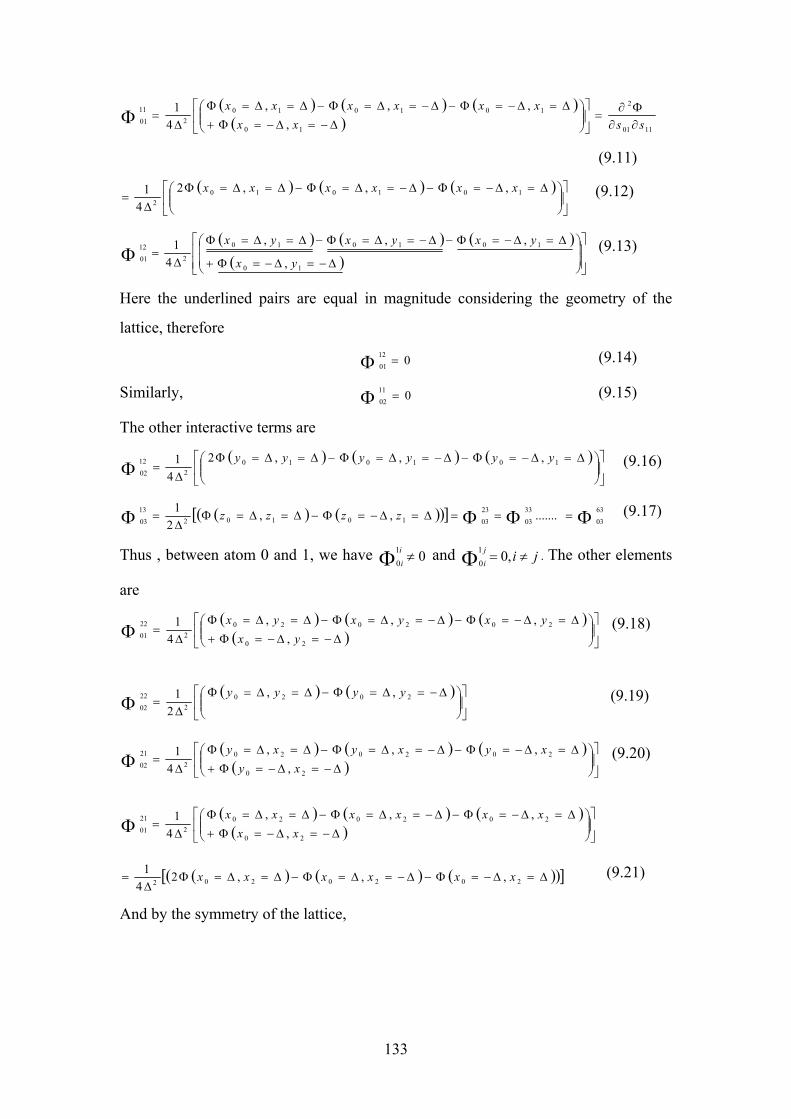
133
( ) ( ) ( )( ) 1101
2
10
101010
2
11
01 ,
,,,
4
1
ssxx
xxxxxx
∂∂Φ∂
=⎥⎦
⎤⎢⎣
⎡⎟⎟⎠
⎞⎜⎜⎝
⎛∆−=∆−=Φ+
∆=∆−=Φ−∆−=∆=Φ−∆=∆=Φ
∆=Φ
(9.11)
( ) ( ) ( )⎥⎦
⎤⎢⎣
⎡⎟⎟⎠
⎞⎜⎜⎝
⎛ ∆=∆−=Φ−∆−=∆=Φ−∆=∆=Φ∆
= 101010
2
,,,2
4
1 xxxxxx (9.12)
( ) ( ) ( )( ) ⎥
⎥⎦
⎤
⎢⎢⎣
⎡
⎟⎟
⎠
⎞
⎜⎜
⎝
⎛
∆−=∆−=Φ+
∆=∆−=Φ−∆−=∆=Φ−∆=∆=Φ
∆=Φ
10
101010
2
12
01 ,
,,,
4
1
yx
yxyxyx (9.13)
Here the underlined pairs are equal in magnitude considering the geometry of the
lattice, therefore
012
01=Φ (9.14)
Similarly, 011
02=Φ (9.15)
The other interactive terms are
( ) ( ) ( )⎥⎦
⎤⎢⎣
⎡⎟⎟⎠
⎞⎜⎜⎝
⎛ ∆=∆−=Φ−∆−=∆=Φ−∆=∆=Φ∆
=Φ 101010
2
12
02
,,,2
4
1 yyyyyy (9.16)
( ) ( )( )[ ] ΦΦΦΦ ===∆=∆−=Φ−∆=∆=Φ∆
= 63
03
33
03
23
0310102
13
03.......,,
2
1zzzz (9.17)
Thus , between atom 0 and 1, we have 01
0≠Φ i
i and ji
j
i≠=Φ ,0
1
0. The other elements
are
( ) ( ) ( )( ) ⎥
⎦
⎤⎢⎣
⎡⎟⎟⎠
⎞⎜⎜⎝
⎛∆−=∆−=Φ+
∆=∆−=Φ−∆−=∆=Φ−∆=∆=Φ
∆=Φ
20
202020
2
22
01 ,
,,,
4
1
yx
yxyxyx (9.18)
( ) ( )⎥⎦
⎤⎢⎣
⎡⎟⎟⎠
⎞⎜⎜⎝
⎛ ∆−=∆=Φ−∆=∆=Φ∆
=Φ 2020
2
22
02
,,
2
1 yyyy (9.19)
( ) ( ) ( )( ) ⎥
⎦
⎤⎢⎣
⎡⎟⎟⎠
⎞⎜⎜⎝
⎛∆−=∆−=Φ+
∆=∆−=Φ−∆−=∆=Φ−∆=∆=Φ
∆=Φ
20
202020
2
21
02 ,
,,,
4
1
xy
xyxyxy (9.20)
( ) ( ) ( )( ) ⎥
⎦
⎤⎢⎣
⎡⎟⎟⎠
⎞⎜⎜⎝
⎛∆−=∆−=Φ+
∆=∆−=Φ−∆−=∆=Φ−∆=∆=Φ
∆=Φ
20
202020
2
21
01 ,
,,,
4
1
xx
xxxxxx
( ) ( ) ( )( )[ ]∆=∆−=Φ−∆−=∆=Φ−∆=∆=Φ∆
= 2020202,,,2
4
1xxxxxx (9.21)
And by the symmetry of the lattice,
134
ΦΦ
ΦΦ
ΦΦ
ΦΦ
−=
=
−=
=
22
01
32
01
22
02
32
02
21
02
31
02
21
01
31
01
The force constant between 0 and 2,3,…..6 can be found by rotation symmetry of the
matrix . (Φ 3
03
n are all equal as already shown).
Choose a primed coordinate system x’,y’ such that x’ connects atoms 0 and 2 and y’
is normal to it. Then in the rotated coordinate system the new coordinates are
⎥⎦
⎤⎢⎣
⎡
⎥⎥⎦
⎤
⎢⎢⎣
⎡ −=⎥
⎦
⎤⎢⎣
⎡′′
°°
°°
y
x
y
x
60cos60sin
60sin60cos (9.22)
where
yxx2
3
2
1+=′ (9.23)
yxy2
1
2
3+−=′ (9.24)
The relation between 0 and 1 in original coordinate system is same as that between 0
and 2 in new coordinate sysytem.Therefore
′∂′∂
Φ∂=
∂∂Φ∂
2101
2
1101
2
ssss (9.25)
′∂
Φ∂−′∂
Φ∂=
∂
′∂′∂
Φ∂+
∂
′∂′∂
Φ∂=
∂Φ∂
2221
21
22
2221
21
2121
2
3
2
1
ss
s
s
ss
s
ss (9.26)
where ′21s =
′2x ,
′22s =
′2y , 21s = 2x . Similary we can also write
1202
1201
1102
1101
2202
2
2201
2
2102
2
2101
2
2101
2
4
3
4
3
4
3
4
1
4
3
4
3
4
3
4
1
Φ+Φ−−Φ−Φ=
′∂′∂
Φ∂+′∂′∂
Φ∂−′∂′∂
Φ∂−′∂′∂
Φ∂=
∂∂Φ∂
ssssssssss (9.27)
135
In equation (9.27), the underlined term will vanish . In general we can write
ijijjoiji s
s
sss
s
ssssss 0
02
2020
01
201220
2
..∂
′∂
∂Φ∂
′∂
∂+
∂
′∂
∂Φ∂
′∂
∂=
∂Φ∂
∂∂
=∂∂Φ∂
(9.28)
Expanding the equation (9.28) and using
jijissss 10
2
20
2
∂∂Φ∂
=′∂′∂
Φ∂
ΦΦ == 21
02
12
010
We can rewrite the equation (9.28)
1202
2
2
2202
1101
2
2
2101
20
2
..sss
s
s
s
sss
s
s
s
ss joijoiji ∂∂Φ∂
∂
′∂∂
′∂+
∂∂Φ∂
∂
′∂∂
′∂=
∂∂Φ∂
(9.29)
or
122
2
2202111
2
21012 .. o
joi
o
joi
j
ois
s
s
s
s
s
s
sΦ
∂
′∂∂
′∂+Φ
∂
′∂∂
′∂=Φ (9.30)
Applying the above formulation , we get the following terms
122
111
122
2
111
2211 4
3
4
1
2
3
2
1ooooo Φ+Φ=Φ⎟⎟
⎠
⎞⎜⎜⎝
⎛−+Φ⎟
⎠⎞
⎜⎝⎛=Φ (9.31)
222
122
111
122
111
221 4
3
4
3
2
1.
2
3
2
3.
2
1oooooo Φ=Φ−Φ=Φ⎟
⎠⎞
⎜⎝⎛⎟⎟⎠
⎞⎜⎜⎝
⎛−+Φ=Φ (9.32)
122
111
122
211
1
2
222 4
1
4
3
2
1
2
3ooooo Φ+Φ=Φ⎟
⎠⎞
⎜⎝⎛+Φ⎟⎟
⎠
⎞⎜⎜⎝
⎛=Φ (9.33)
Again using the symmetry of lattice we can write the force constants between 0 and 3
ΦΦ
ΦΦ
ΦΦ
ΦΦ
−=
=
−=
=
22
01
32
01
22
02
32
02
21
02
31
02
21
01
31
01
By the translational symmetry of the lattice (atom # 0→1 and atom # 4→0 everything
remain same) . Hence we can write
136
ΦΦ
ΦΦ
ΦΦΦ
=
−=
==
12
02
42
02
11
01
41
01
4
0
0
4
1
0
and
i
j
j
i
j
i
And the rest are zero.Similary writing the force constants for between atom# 0 and 5,
ΦΦ
ΦΦΦΦΦΦ
=
===
22
02
52
02
21
02
51
02
22
01
52
01
21
01
51
01;;
For atom # 0 and 6 ( atom 6 is opposite to atom 3)
ΦΦ = j
i
j
i
3
0
6
0
The calculated values of the required force constants of the optimized two
dimensional gold sheet for the nearest neighbours are
2303
03
202
02
01
01
/1025.1
/1025.4
−°−
−°
×−=
==
ΦΦΦ
AeV
AeV
(9.34)
The other force constants are
1485.0
632526.0
632526.0
0
3123.1
216695.0
42
02
12
02
62
02
32
02
61
02
31
02
52
01
22
01
51
02
21
02
12
01
42
01
41
02
11
02
41
01
11
01
61
01
51
01
31
01
21
01
−==
−===
====
====
==
====
ΦΦΦΦΦΦΦΦΦΦΦΦΦΦ
ΦΦΦΦΦΦ
9471.062
02
52
02
32
02
22
02==== ΦΦΦΦ (9.35g)
9.2.4 Evalution of Dynamical Matrix
The secular determinent of the dynamical matrix to be solved as
( )( )( )( )⎥⎥⎦
⎤
⎢⎢⎣
⎡
−
−22
22
1
21
211
ω
ω
DD
DD = 0 (9.36)
(9.35a)
(9.35b)
(9.35c)
(9.35d)
(9.35e)
(9.35f)
137
On solving the above 2 X 2 matrix we get the frequency as,
( ) ( )221
222
11
22
112
2
1
2DDD
DD+−±
+=ω (9.37)
where the dynamical matrix elements can be solved as
⎥⎦
⎤⎢⎣
⎡Φ+Φ=
=⎥⎦
⎤⎢⎣
⎡Φ+Φ=
⎥⎦
⎤⎢⎣
⎡Φ+Φ=
∑
∑
∑
→→
→→
→→
∗
n
rqin
n
rqin
n
rqin
n
n
n
eM
D
DeM
D
eM
D
.202
0202
22
12
.201
0201
21
.101
0101
11
1
1
1
For expanding equations (9.38 – 9.40) , we have used the rn values from equations
9.5 (a-f) and we take ∧→
= nqq . Then the on simplification above equations become
( )
( ) ⎥⎦
⎤⎢⎣
⎡⎟⎟⎠
⎞⎜⎜⎝
⎛⎟⎠⎞
⎜⎝⎛Φ+Φ+Φ=
=⎥⎦
⎤⎢⎣
⎡⎟⎟⎠
⎞⎜⎜⎝
⎛⎟⎠⎞
⎜⎝⎛Φ−Φ=
⎥⎦
⎤⎢⎣
⎡⎟⎟⎠
⎞⎜⎜⎝
⎛⎟⎠⎞
⎜⎝⎛Φ+Φ+Φ=
∗
32
cos2
cos4cos21
32
sin2
sin41
32
cos2
cos4cos21
2202
1202
0202
22
12
2201
0201
21
2101
1101
0101
11
aqaqaq
MD
Daqaq
MD
aqaqaq
MD
yxx
yx
yxx
These elements of the dynamical matrix are solved for the different values of qx and
qy.The allowed values of qx are 0, aaa
πππ,
6
4,
6
2±± and for each value of qx , we have
taken the values of qy lying between 0<qy<a
π. After finding the value of elements of
the dynamical matrix, we diagonalise it using equation 9.36 and frequencies are
calculated using equation 9.37. The calculated dispersion curve is plotted in Fig. 9.3.
The dispersion curve shows six branches corresponding to each atom in hexagonal
layer of Au60 nanotube.
(9.38)
(9.39)
(9.40)
(9.41)
(9.42)
(9.43)
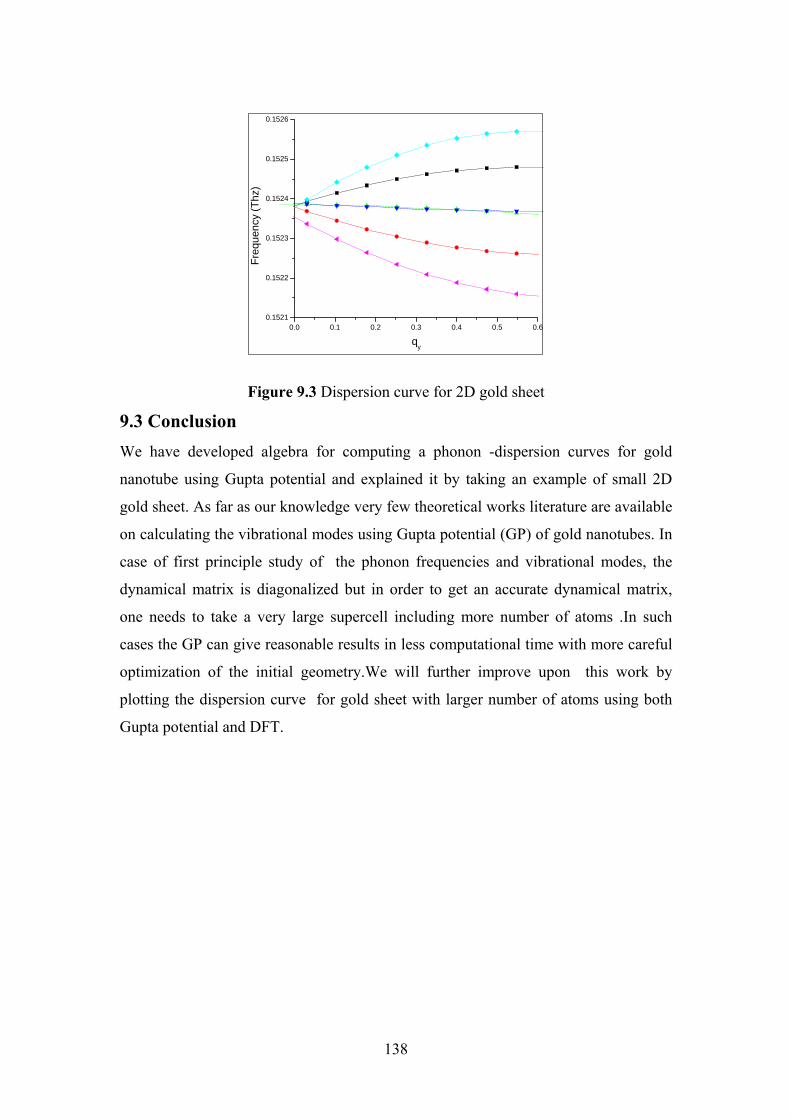
138
0.0 0.1 0.2 0.3 0.4 0.5 0.60.1521
0.1522
0.1523
0.1524
0.1525
0.1526
Fre
quen
cy (
Thz
)
qy
Figure 9.3 Dispersion curve for 2D gold sheet
9.3 Conclusion
We have developed algebra for computing a phonon -dispersion curves for gold
nanotube using Gupta potential and explained it by taking an example of small 2D
gold sheet. As far as our knowledge very few theoretical works literature are available
on calculating the vibrational modes using Gupta potential (GP) of gold nanotubes. In
case of first principle study of the phonon frequencies and vibrational modes, the
dynamical matrix is diagonalized but in order to get an accurate dynamical matrix,
one needs to take a very large supercell including more number of atoms .In such
cases the GP can give reasonable results in less computational time with more careful
optimization of the initial geometry.We will further improve upon this work by
plotting the dispersion curve for gold sheet with larger number of atoms using both
Gupta potential and DFT.
139
Bibliography
[1] D. A. B. Miller, D. S. Chemla, S. Schmitt-Rink, Appl. Phys. Lett. 52, 2154, (1988).
[2] H. Sakaki, Jpn. J. Appl. Phys. Part 2, 28, L314 (1989).
[3] U. Bockelmann, G. Bastard, Phys. Rev. B 42, 8947 (1990).
[4] J. Diao, K. Gall, M. L. Dunn, J. Mech. Phys. Solids 52, 1935 (2004).
[5] J. Diao, K. Gall, M. L. Dunn, Nat. Mater. 2, 656 (2003).
[6] J. Zou , A. Balandin, J. Appl. Phys. 89, 2932 (2001); A. Khitun, A. Balandin, K. L. Wang, G. Chen , Physica E (Amsterdam) 8, 13 ( 2000); B. Yang , G. Chen, Phys. Low-Dimens. Semicond. Struct. 5–6, 37 (2000).
[7] Y. Kondo, K. Takayanagi, Science 289, 606(2000).
[8] Y. Oshima, A. Onga, K. Takayanagi, Phys. Rev. Lett. 91, 205503 (2003).
[9] R. T. Senger, S. Dag, S. Ciraci, Phys. Rev. Lett. 93, 196807 (2004).
[10] G. Bilalbegović, Phys. Rev. B 58, 15412 (1998).
[11] G. Bilalbegović, Vacuum 71, 165 (2003).
[12] T. Ono, K. Hirose, Phys. Rev. Lett. 94, 206806 (2005); M. Zhuang, M.Ernzerhof, J. Chem. Phys. 120, 4921 (2004).
[13] Y. Mokrousov, G. Bihlmayer, S. Blügel, Phys. Rev. B 72, 045402 (2005).
[14] M. Okamoto, T. Uda, K. Takayanagi Phys. Rev. B 64, 033303 (2001).
[15] C. K. Yang, Appl. Phys. Lett. 85, 2923 (2004 ).
[16] S.R.B.Thapa, The Himalayan Physics 1, 1 (2010).
[17] D. Sánchez-Portal, E. Artacho, J. M. Soler, A. Rubio ,P. Ordejón, Physical Review B 59, 19 (1999).
[18] L. H. Ye, B. G. Liu, D. S. Wang, R. Han, Physical Review B 69,23 (2004)
[19] D. Kumar, V. Verma, K. Dharamvir, H.S.Bhatti, Pramana, 81, 6, 1021-1035 (2013).
[20] A. D. Corso, J. Phys.: Condens. Matter 25, 145401(2013).
[21] Li Yang, M Y Chou, Nano Letters 11, 7, 2618-21(2011).
[22] R. Ma, Y. Bando, T Sato, Adv. Mater. 14, 366(2002).
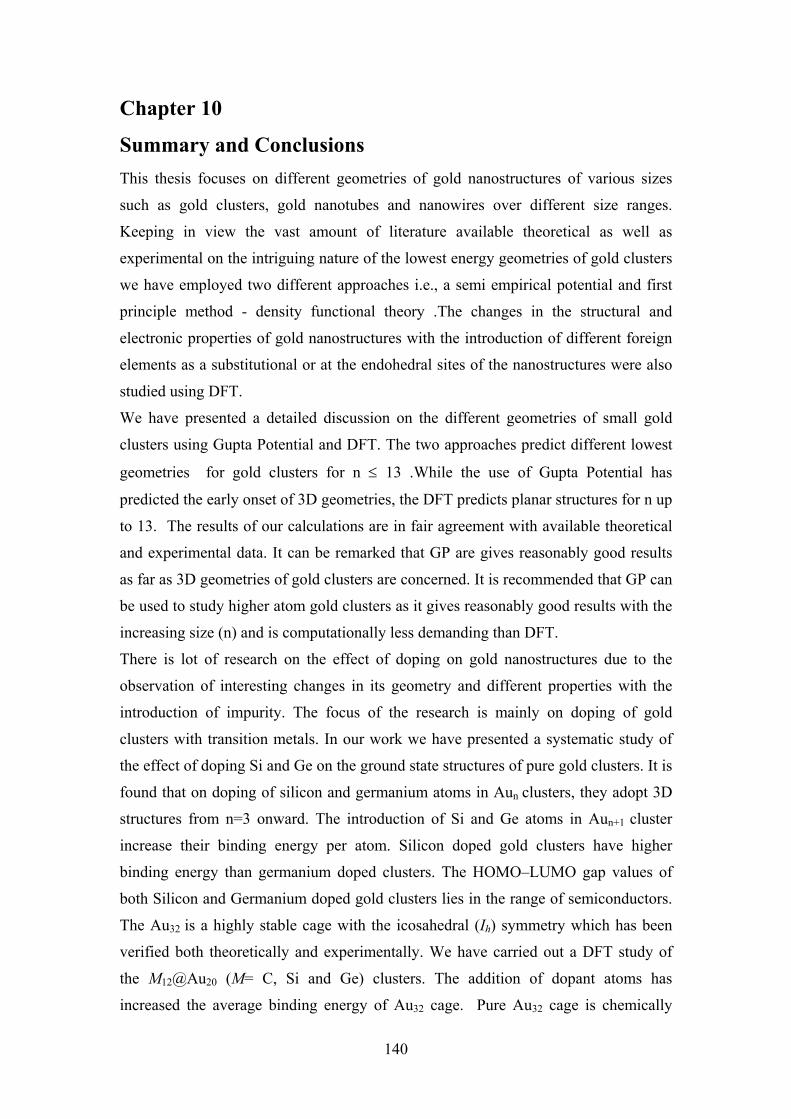
140
Chapter 10
Summary and Conclusions
This thesis focuses on different geometries of gold nanostructures of various sizes
such as gold clusters, gold nanotubes and nanowires over different size ranges.
Keeping in view the vast amount of literature available theoretical as well as
experimental on the intriguing nature of the lowest energy geometries of gold clusters
we have employed two different approaches i.e., a semi empirical potential and first
principle method - density functional theory .The changes in the structural and
electronic properties of gold nanostructures with the introduction of different foreign
elements as a substitutional or at the endohedral sites of the nanostructures were also
studied using DFT.
We have presented a detailed discussion on the different geometries of small gold
clusters using Gupta Potential and DFT. The two approaches predict different lowest
geometries for gold clusters for n ≤ 13 .While the use of Gupta Potential has
predicted the early onset of 3D geometries, the DFT predicts planar structures for n up
to 13. The results of our calculations are in fair agreement with available theoretical
and experimental data. It can be remarked that GP are gives reasonably good results
as far as 3D geometries of gold clusters are concerned. It is recommended that GP can
be used to study higher atom gold clusters as it gives reasonably good results with the
increasing size (n) and is computationally less demanding than DFT.
There is lot of research on the effect of doping on gold nanostructures due to the
observation of interesting changes in its geometry and different properties with the
introduction of impurity. The focus of the research is mainly on doping of gold
clusters with transition metals. In our work we have presented a systematic study of
the effect of doping Si and Ge on the ground state structures of pure gold clusters. It is
found that on doping of silicon and germanium atoms in Aun clusters, they adopt 3D
structures from n=3 onward. The introduction of Si and Ge atoms in Aun+1 cluster
increase their binding energy per atom. Silicon doped gold clusters have higher
binding energy than germanium doped clusters. The HOMO–LUMO gap values of
both Silicon and Germanium doped gold clusters lies in the range of semiconductors.
The Au32 is a highly stable cage with the icosahedral (Ih) symmetry which has been
verified both theoretically and experimentally. We have carried out a DFT study of
the M12@Au20 (M= C, Si and Ge) clusters. The addition of dopant atoms has
increased the average binding energy of Au32 cage. Pure Au32 cage is chemically
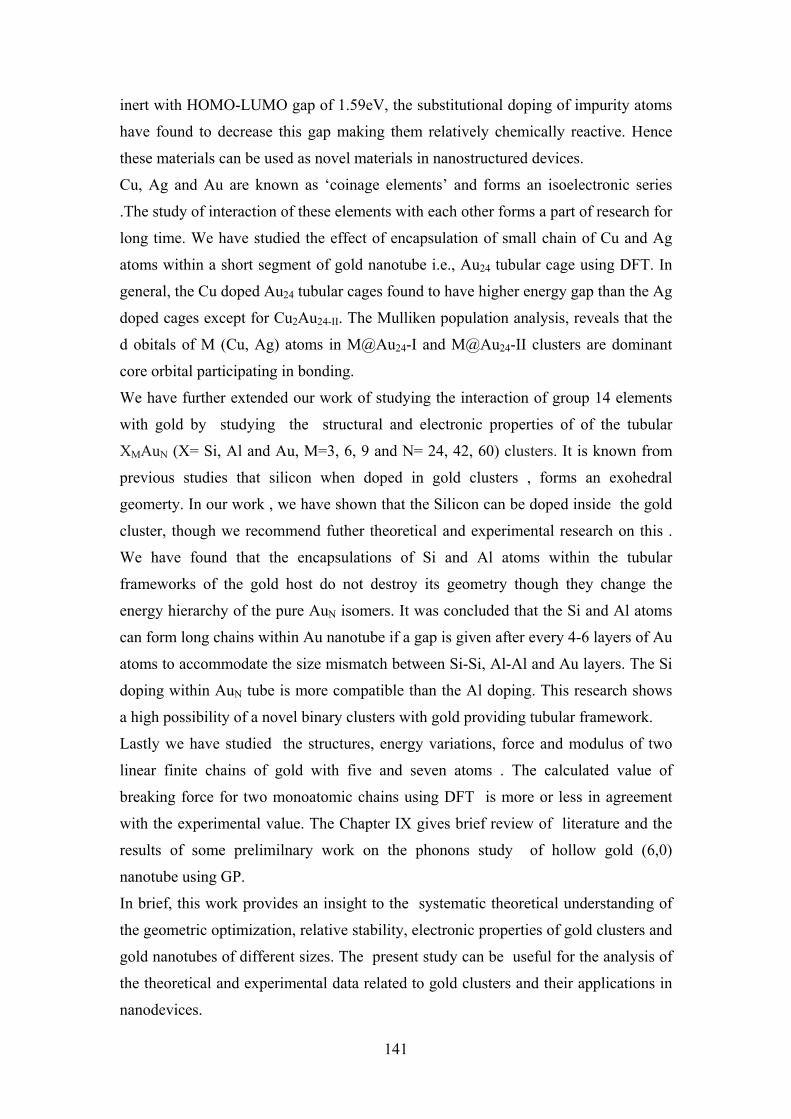
141
inert with HOMO-LUMO gap of 1.59eV, the substitutional doping of impurity atoms
have found to decrease this gap making them relatively chemically reactive. Hence
these materials can be used as novel materials in nanostructured devices.
Cu, Ag and Au are known as ‘coinage elements’ and forms an isoelectronic series
.The study of interaction of these elements with each other forms a part of research for
long time. We have studied the effect of encapsulation of small chain of Cu and Ag
atoms within a short segment of gold nanotube i.e., Au24 tubular cage using DFT. In
general, the Cu doped Au24 tubular cages found to have higher energy gap than the Ag
doped cages except for Cu2Au24-II. The Mulliken population analysis, reveals that the
d obitals of M (Cu, Ag) atoms in M@Au24-I and M@Au24-II clusters are dominant
core orbital participating in bonding.
We have further extended our work of studying the interaction of group 14 elements
with gold by studying the structural and electronic properties of of the tubular
XMAuN (X= Si, Al and Au, M=3, 6, 9 and N= 24, 42, 60) clusters. It is known from
previous studies that silicon when doped in gold clusters , forms an exohedral
geomerty. In our work , we have shown that the Silicon can be doped inside the gold
cluster, though we recommend futher theoretical and experimental research on this .
We have found that the encapsulations of Si and Al atoms within the tubular
frameworks of the gold host do not destroy its geometry though they change the
energy hierarchy of the pure AuN isomers. It was concluded that the Si and Al atoms
can form long chains within Au nanotube if a gap is given after every 4-6 layers of Au
atoms to accommodate the size mismatch between Si-Si, Al-Al and Au layers. The Si
doping within AuN tube is more compatible than the Al doping. This research shows
a high possibility of a novel binary clusters with gold providing tubular framework.
Lastly we have studied the structures, energy variations, force and modulus of two
linear finite chains of gold with five and seven atoms . The calculated value of
breaking force for two monoatomic chains using DFT is more or less in agreement
with the experimental value. The Chapter IX gives brief review of literature and the
results of some prelimilnary work on the phonons study of hollow gold (6,0)
nanotube using GP.
In brief, this work provides an insight to the systematic theoretical understanding of
the geometric optimization, relative stability, electronic properties of gold clusters and
gold nanotubes of different sizes. The present study can be useful for the analysis of
the theoretical and experimental data related to gold clusters and their applications in
nanodevices.

List of Publications
Papers in Journals
1. The structural and electronic properties of tubular gold clusters with a spinal support,
Priyanka and Keya Dharamvir, Phys. Chem. Chem. Phys., 15, 12340 (2013).
2. Structure of Small Gold Clusters with Si Doping Using DFT (AunSi, n=1- 10, 19),
Priyanka, Sumali Bansal and Keya Dharamvir, Journal of Nano Research Vol. 24,
203-212 (2013).
3. Structure, electronic and optical properties of doped Golden Fullerenes, Priyanka,
Keya Dharamvir (Communicated)
Papers in Conference Proceedings
1. A study of various geometries of gold nanowires and effect of doping, Priyanka,
Sumali Bansal, Rajiv Bhandari, and Keya Dharamvir, AIP Conf. Proc. 1591, 417
(2014).
2. A comparative study of transition metal doped tubular gold cages: M@Au24 (M =
Au, Cu, Ag), Sumali, Priyanka, and Keya Dharamvir, AIP Conf. Proc. 1512, 282-
283 (2013).
3. Stretching of short monatomic gold chains-some model calculations, Sumali,
Priyanka, Veena Verma, and Keya Dharamvir, AIP Conf. Proc. 1447, 335 (2012).
4. Comparison of Cluster Calculation with Different Software-The Case of Small
Clusters, Neetu Goel, Seema Gautam, Priyanka and Keya Dharmavir, AIP Conf.
Proc. 1393, 289-290 (2011).
5. Structure and Stability of GeAun, n=1-10 clusters: A Density Functional Study,
Priyanka, Hitesh Sharma and Keya Dharamvir, AIP Conf. Proc., 1393, 189( 2011).
Papers presented and Conferences attended
1. International Seminar on Current Trends in Quantum Gases, BEC and Solitions,
Department of Physics, Panjab University, Chandigarh, 3-6 Mar 2014.
2. A study of various geometries of gold nanowires and effect of doping, Priyanka, Sumali
Bansal, Rajiv Bhandari, and Keya Dharamvir 58th DAE-Symposium, at Thapar
University from 17- 21 Dec 2013.
3. Structure of Small Gold Clusters with Si Doping Using DFT (AunSi, n=1-10, 19),
Priyanka, Sumali Bansal, and Keya Dharamvir, International Conference on
Nanotechnolgy “Nanocon 2012”, Bharti Vidyapeeth University, Pune, 18, 19 Oct 2012.
4. Structure and Stability of GeAun, n=1-10 clusters: A Density Functional Study,
Priyanka, Hitesh Sharma and Keya Dharamvir, International Conference on
advances in condensed and nano materials, Department of Physics, Panjab
University, Chandigarh, 23- 26 Feb 2011.
5. Ionisation potential and electron affinity of silicon doped gold clusters, Priyanka, Keya
Dharamvir, 3rd International Symposium on Material Chemistry BARC, Mumbai, 7-11
Dec 2010.
6. Density Functional Calculation for the structural and stability of silicon doped gold
clusters, Priyanka, Keya Dharamvir, National Conference on Advance trends in Engg.
and Technology (ATET-09), GGSCMT, Kharar, 6-7th Nov 2009
7. National Seminar on ‘Advances in Physics , Department of Physics, Panjab University,
Chandigarh, 28 Feb –Mar 2008.
8. National Seminar on ‘Theoretical and Experimental Techniques in Nanoscience and
Nanotechnology’, Department of Physics, Panjab University, Chandigarh, 29-30 Mar,
2007