Embed Size (px)
Citation preview
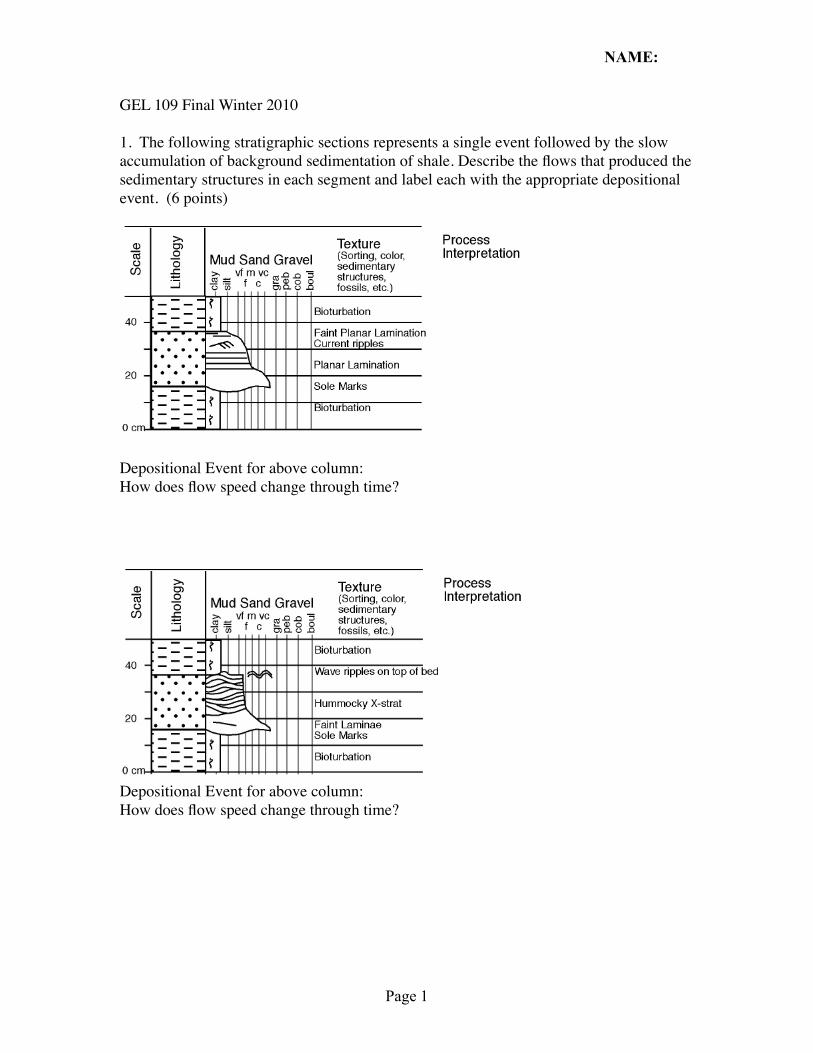
GEL 109 Final Winter 2010
1. The following stratigraphic sections represents a single event followed by the slow accumulation of background sedimentation of shale. Describe the flows that produced the sedimentary structures in each segment and label each with the appropriate depositional event. (6 points)
Depositional Event for above column:How does flow speed change through time?
Depositional Event for above column:How does flow speed change through time?
NAME:
Page 1

2. The following photo and sketch shows sediments deposited during an event. Describe the flow and processes that created the erosion surface, deposited the pebble to silt-sides sediment, and then deposited the fine sand. (4 points)
3. a) The following photo has a feature characteristic of tidal environments. Show the flow direction(s) indicated by the cross stratification, and name the resulting cross stratification type. (2 points)
b) In the previous photo, could the structures in it be ripple cross lamination? Why or why not? (2 points)
NAME:
Page 2
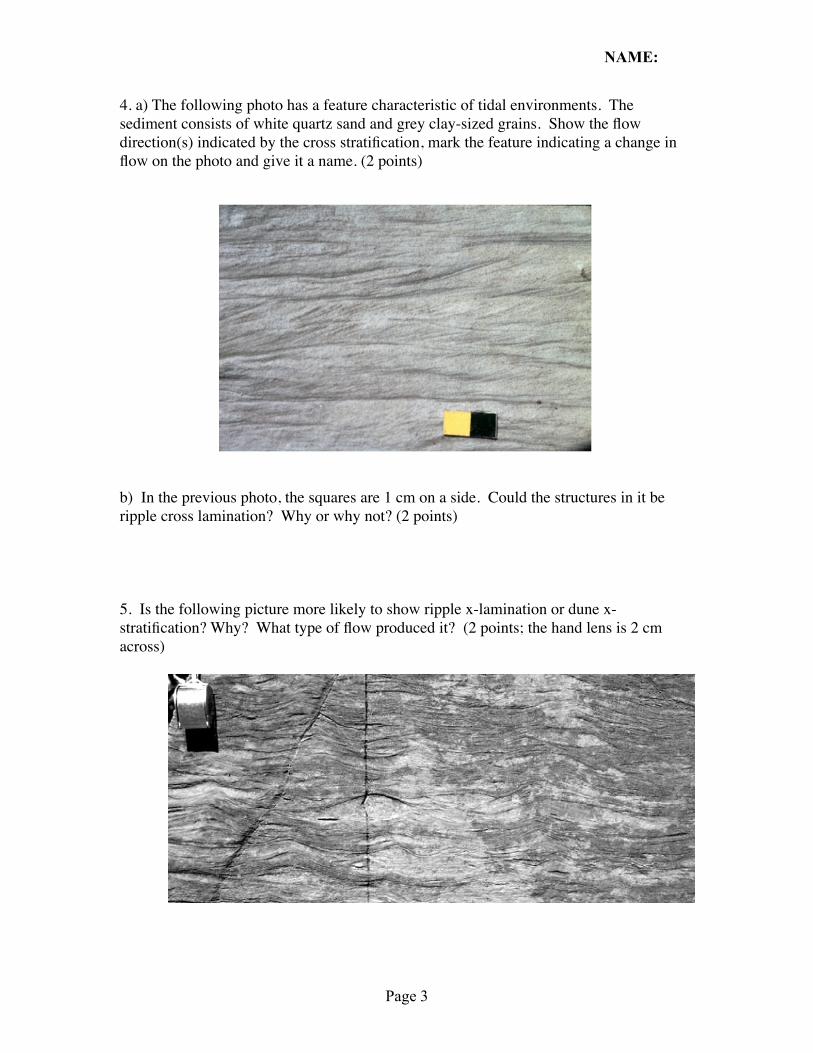
4. a) The following photo has a feature characteristic of tidal environments. The sediment consists of white quartz sand and grey clay-sized grains. Show the flow direction(s) indicated by the cross stratification, mark the feature indicating a change in flow on the photo and give it a name. (2 points)
b) In the previous photo, the squares are 1 cm on a side. Could the structures in it be ripple cross lamination? Why or why not? (2 points)
5. Is the following picture more likely to show ripple x-lamination or dune x-stratification? Why? What type of flow produced it? (2 points; the hand lens is 2 cm across)
NAME:
Page 3
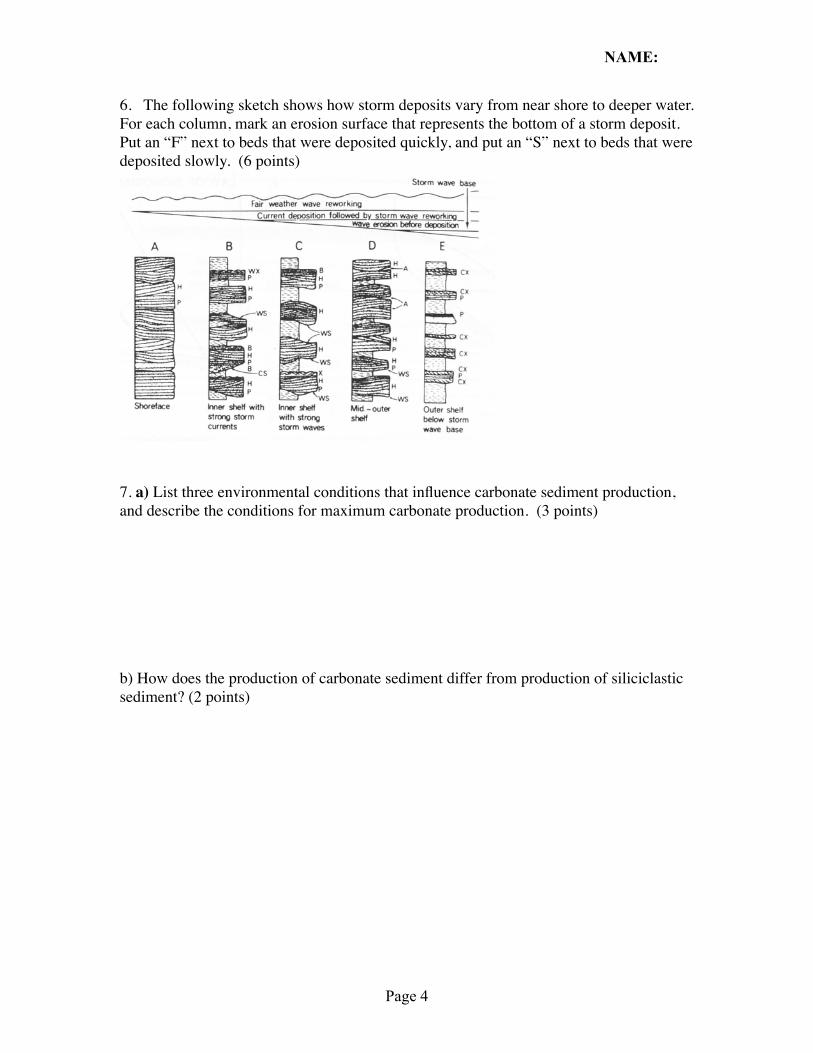
6. The following sketch shows how storm deposits vary from near shore to deeper water. For each column, mark an erosion surface that represents the bottom of a storm deposit. Put an “F” next to beds that were deposited quickly, and put an “S” next to beds that were deposited slowly. (6 points)
7. a) List three environmental conditions that influence carbonate sediment production, and describe the conditions for maximum carbonate production. (3 points)
b) How does the production of carbonate sediment differ from production of siliciclastic sediment? (2 points)
NAME:
Page 4
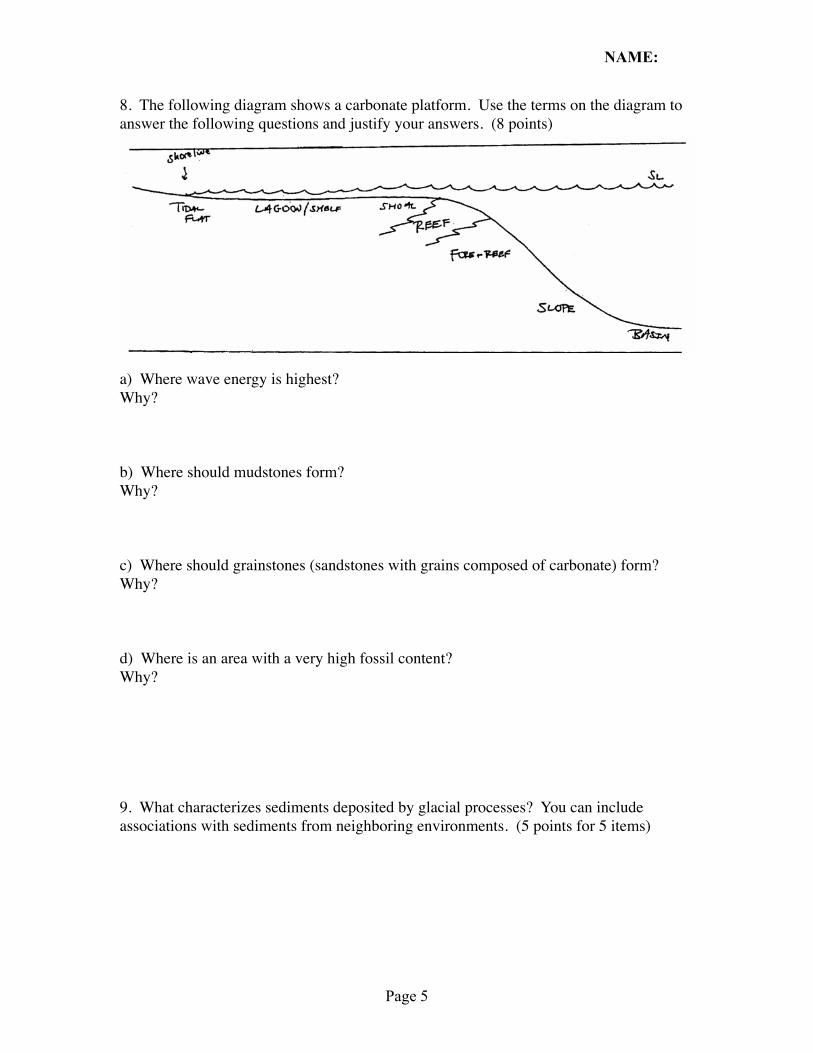
8. The following diagram shows a carbonate platform. Use the terms on the diagram to answer the following questions and justify your answers. (8 points)
a) Where wave energy is highest? Why?
b) Where should mudstones form? Why?
c) Where should grainstones (sandstones with grains composed of carbonate) form?Why?
d) Where is an area with a very high fossil content?Why?
9. What characterizes sediments deposited by glacial processes? You can include associations with sediments from neighboring environments. (5 points for 5 items)
NAME:
Page 5

10. What are three sedimentary structures characteristic of tidal environments. Sketch each one and describe the variations in flow that create it. (9 points).
11. Sketch a map view of three types of deltas showing the differences in river, wave and tidal influences on delta morphology. Label the features that make them different or describe them in a list. List 3 types of cross stratification you would see in each and use arrows to indicate where each is likely to form. (9 points) You can use the back of the page for more room.
NAME:
Page 6
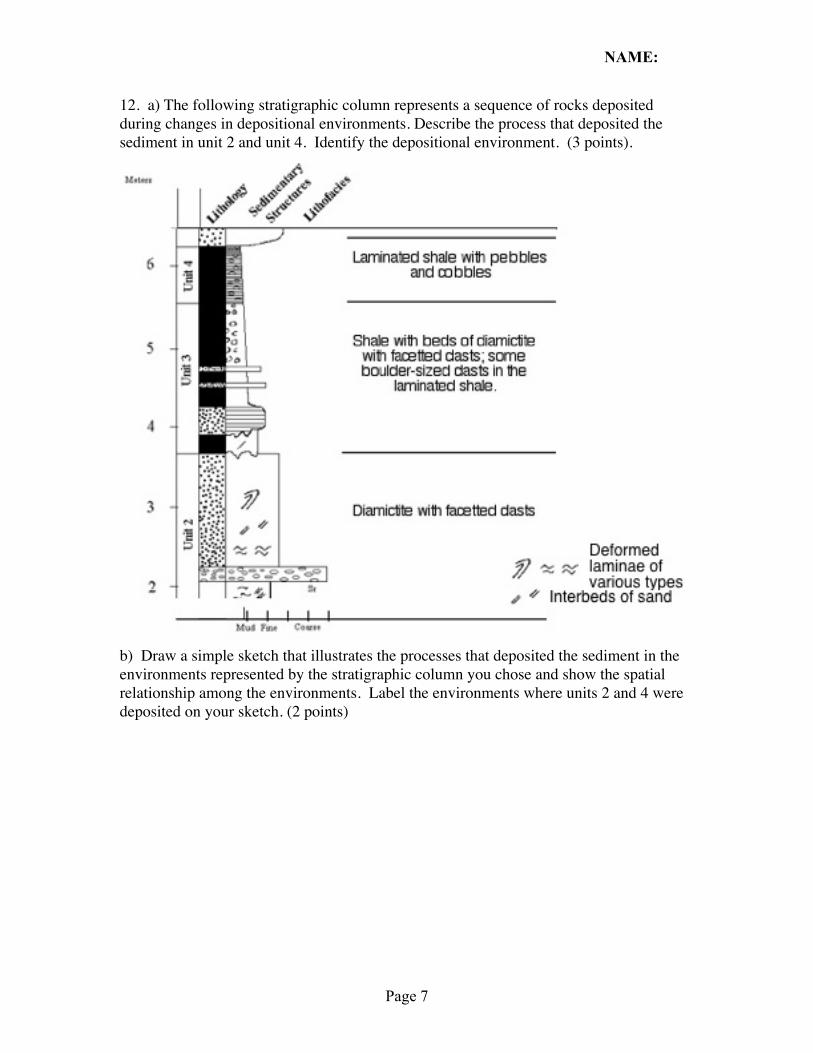
12. a) The following stratigraphic column represents a sequence of rocks deposited during changes in depositional environments. Describe the process that deposited the sediment in unit 2 and unit 4. Identify the depositional environment. (3 points).
b) Draw a simple sketch that illustrates the processes that deposited the sediment in the environments represented by the stratigraphic column you chose and show the spatial relationship among the environments. Label the environments where units 2 and 4 were deposited on your sketch. (2 points)
NAME:
Page 7
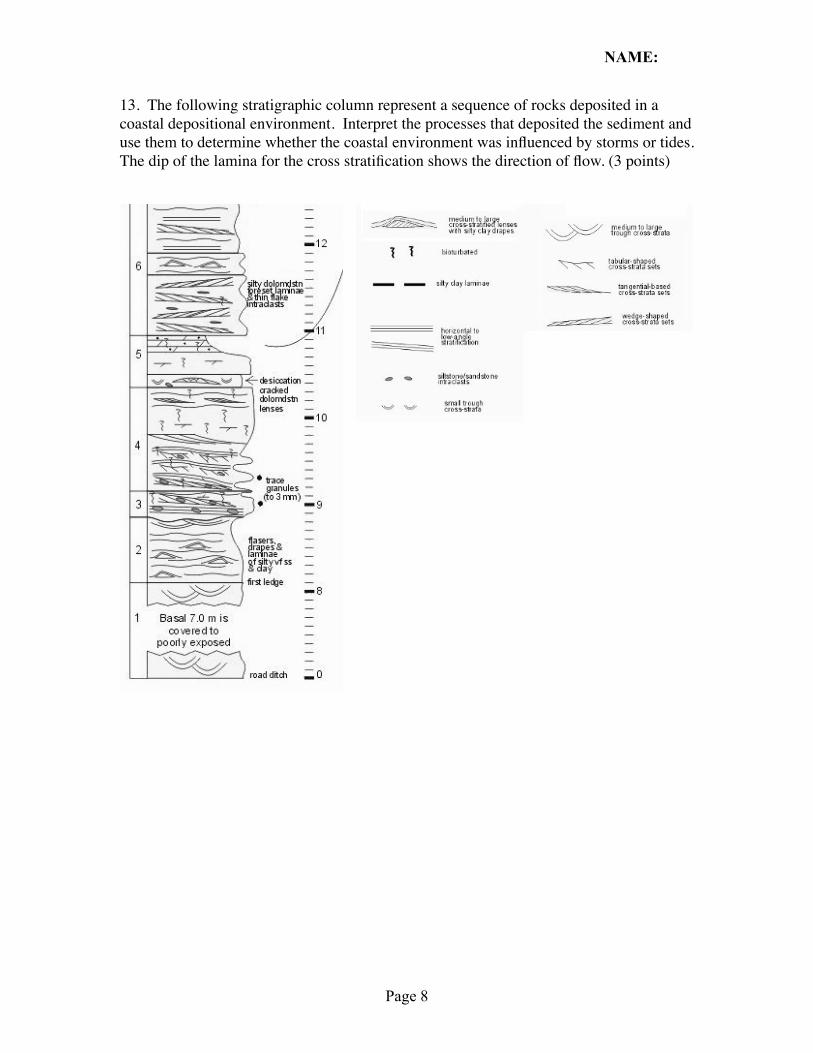
13. The following stratigraphic column represent a sequence of rocks deposited in a coastal depositional environment. Interpret the processes that deposited the sediment and use them to determine whether the coastal environment was influenced by storms or tides. The dip of the lamina for the cross stratification shows the direction of flow. (3 points)
NAME:
Page 8
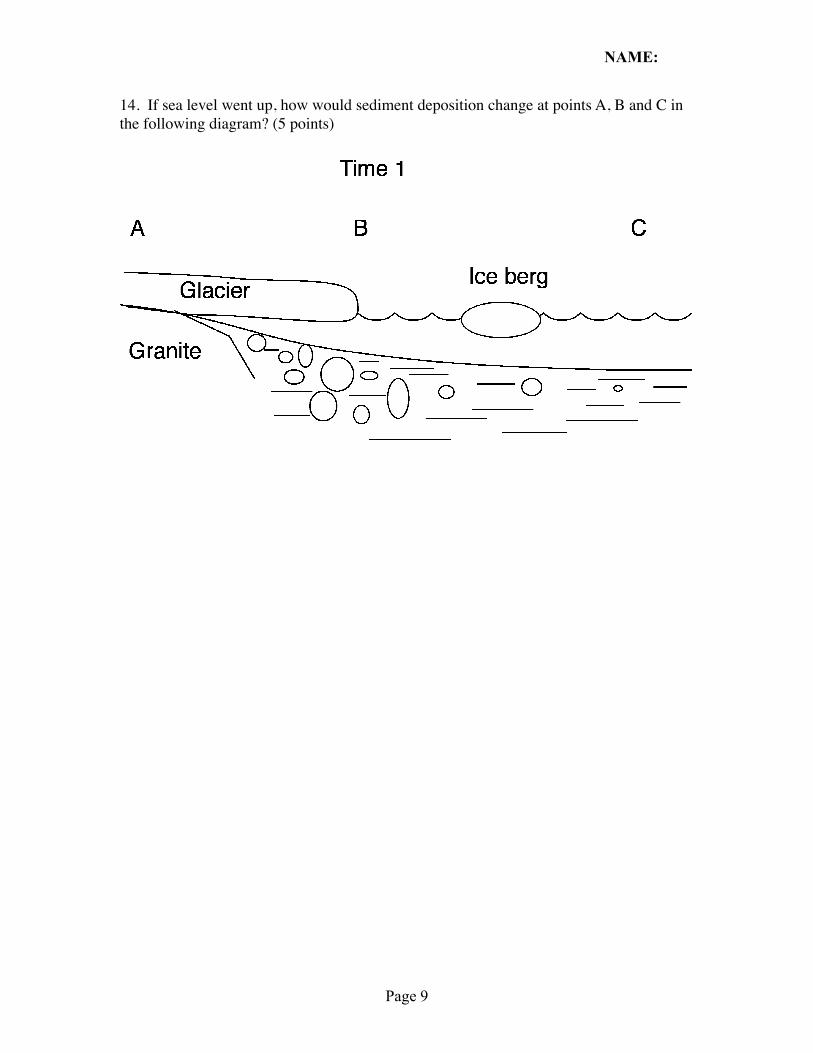
14. If sea level went up, how would sediment deposition change at points A, B and C in the following diagram? (5 points)
NAME:
Page 9

15. a) The following stratigraphic columns start during Cretaceous time and end during Tertiary time based on the fossils present in the sediments. A comet impacted the Earth and caused a mass extinction that caused extinction of the dinosaurs (except those that evolved into birds) along with many other organisms. Use magnetostratigraphy and event stratigraphy to correlate these stratigraphic columns by drawing lines between them. You should have 2 time lines between each of the columns and a third time line between the Gulf of Mexico, Tethys, and Pacific columns. (3 points)
(Marl = a mix of clay-sized clay mineral grains and clay-sized carbonate mineral grains. The grey “Clay” is clay-sized clay mineral grains that were deposited immediately after the impact. Don’t worry about the sedimentary structures in the column on the left; they represent shallow marine storm and tidal deposits.)
b) Of the stratigraphic columns above, which had the highest sedimentation rate and which had the lowest sedimentation rate? How can you tell? (2 points)
NAME:
Page 10
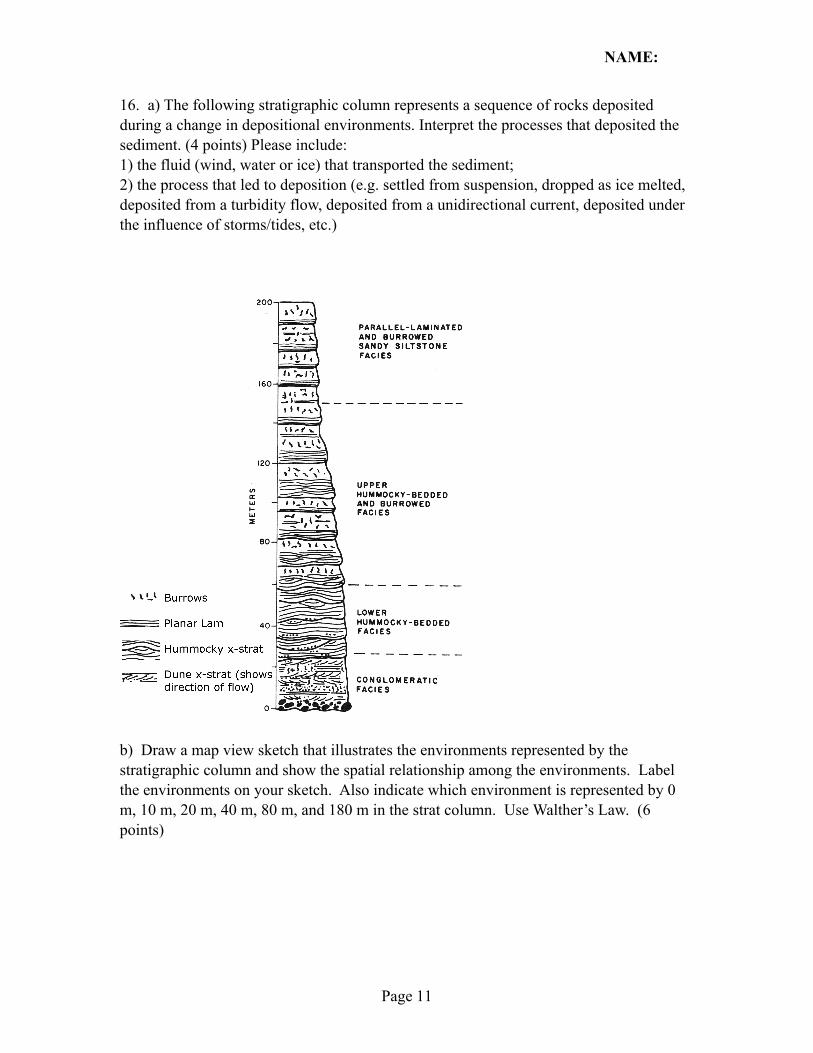
16. a) The following stratigraphic column represents a sequence of rocks deposited during a change in depositional environments. Interpret the processes that deposited the sediment. (4 points) Please include:1) the fluid (wind, water or ice) that transported the sediment; 2) the process that led to deposition (e.g. settled from suspension, dropped as ice melted, deposited from a turbidity flow, deposited from a unidirectional current, deposited under the influence of storms/tides, etc.)
b) Draw a map view sketch that illustrates the environments represented by the stratigraphic column and show the spatial relationship among the environments. Label the environments on your sketch. Also indicate which environment is represented by 0 m, 10 m, 20 m, 40 m, 80 m, and 180 m in the strat column. Use Walther’s Law. (6 points)
NAME:
Page 11
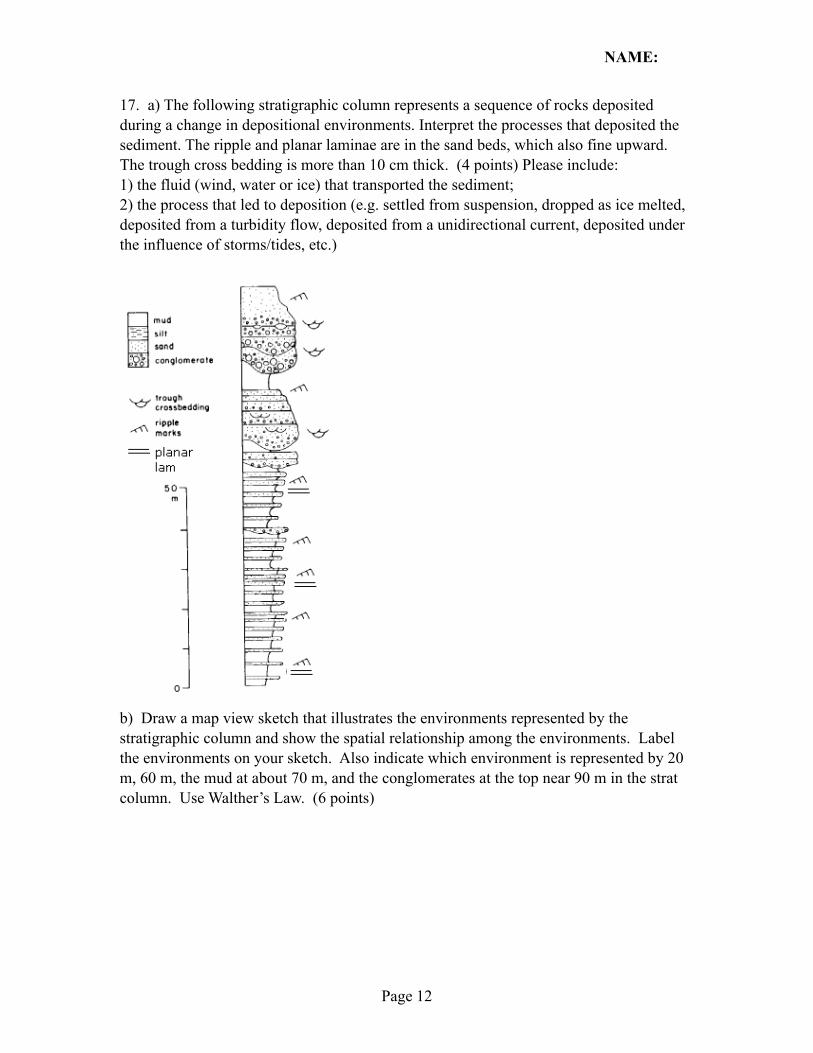
17. a) The following stratigraphic column represents a sequence of rocks deposited during a change in depositional environments. Interpret the processes that deposited the sediment. The ripple and planar laminae are in the sand beds, which also fine upward. The trough cross bedding is more than 10 cm thick. (4 points) Please include:1) the fluid (wind, water or ice) that transported the sediment; 2) the process that led to deposition (e.g. settled from suspension, dropped as ice melted, deposited from a turbidity flow, deposited from a unidirectional current, deposited under the influence of storms/tides, etc.)
b) Draw a map view sketch that illustrates the environments represented by the stratigraphic column and show the spatial relationship among the environments. Label the environments on your sketch. Also indicate which environment is represented by 20 m, 60 m, the mud at about 70 m, and the conglomerates at the top near 90 m in the strat column. Use Walther’s Law. (6 points)
NAME:
Page 12


![Personal Statement FINAL10[1]](https://img.pdfslide.net/doc/110x75/577cc2121a28aba711941f86/personal-statement-final101.jpg)


![Ss[1].science of self_realisation-final10](https://img.pdfslide.net/doc/110x75/547dea77b37959822b8b5321/ss1science-of-selfrealisation-final10.jpg)