Embed Size (px)
Citation preview
Structuring effects of mesozooplankton
on freshwater and marine microbial food webs
Dissertation
zur Erlangung des Doktorgrades
der Mathematisch-Naturwissenschaftlichen Fakultät
der Christian-Albrechts-Universität
zu Kiel
vorgelegt von
Eckart Zöllner
Kiel, März 2004

Referent: Prof. Dr. K. Jürgens Korreferent: Prof. Dr. W. Lampert ............................................................ Tag der mündlichen Prüfung: 28.04.2004................................................. Zum Druck genehmigt: Kiel, den.........................................................
Der Dekan

TABLE OF CONTENTS
1
TABLE OF CONTENTS Page
GENERAL INTRODUCTION AND OUTLINE......................................................... 31. Prokaryotic and eukaryotic microorganisms in aquatic systems...................... 3
2. Microbial diversity and function........................................................................ 7
3. Linking classical and microbial food web models............................................. 10
4. Thesis outline.................................................................................................... 14
CHAPTER I................................................................................................... 17Cascading predation effects of Daphnia and copepodson microbial food web components
Abstract............................................................................................................... 17Introduction......................................................................................................... 18Methods.............................................................................................................. 19Results................................................................................................................ 24Discussion........................................................................................................... 35
CHAPTER II.................................................................................................. 41Effects of zooplankton regime on spring microbial community dynamics and a bloom of filamentous bacteria
Abstract................................................................................................................ 41Introduction.......................................................................................................... 42Methods............................................................................................................... 44Results................................................................................................................. 47Discussion............................................................................................................ 57
CHAPTER III................................................................................................. 62Mesozooplankton (copepods, appendicularians) impact on microbial food web structure in a coastal marine system
- I. Cascading predation effects on protists and bacteriaAbstract................................................................................................................ 62Introduction.......................................................................................................... 63Methods............................................................................................................... 64Results................................................................................................................. 68Discussion............................................................................................................ 81
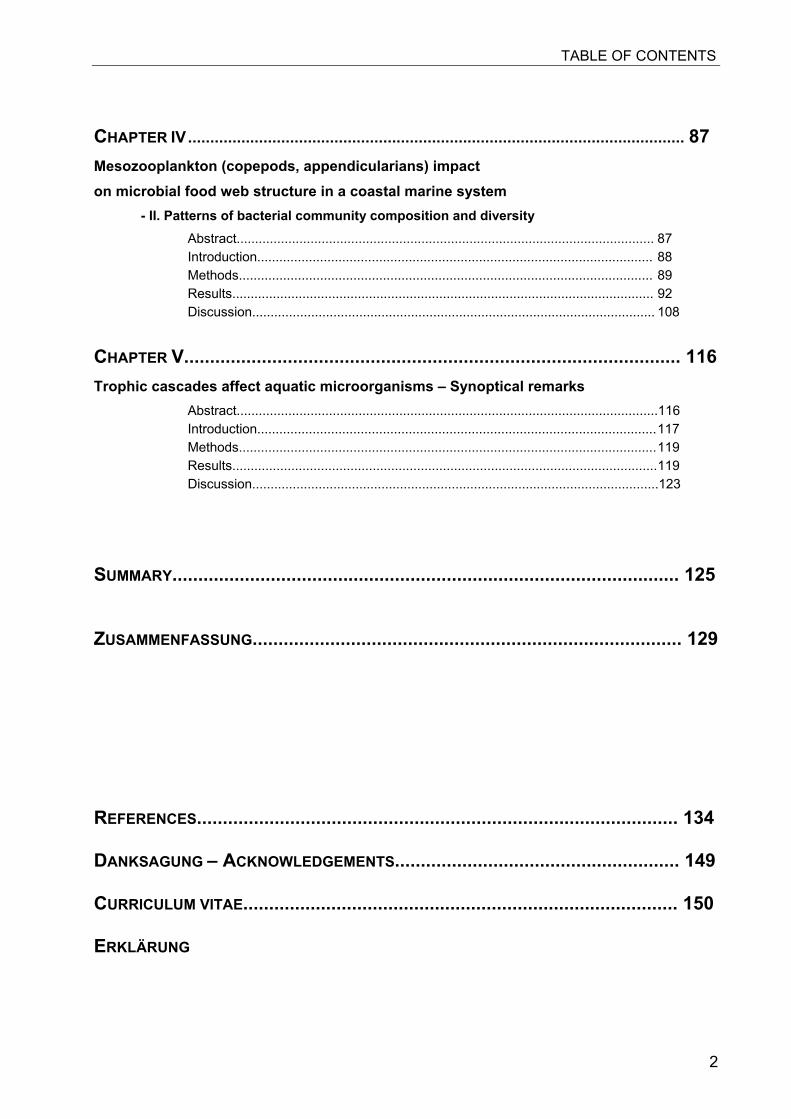
TABLE OF CONTENTS
2
CHAPTER IV................................................................................................................ 87
Mesozooplankton (copepods, appendicularians) impact on microbial food web structure in a coastal marine system
- II. Patterns of bacterial community composition and diversity Abstract................................................................................................................. 87Introduction........................................................................................................... 88Methods................................................................................................................ 89Results.................................................................................................................. 92Discussion............................................................................................................. 108
CHAPTER V................................................................................................ 116Trophic cascades affect aquatic microorganisms – Synoptical remarks
Abstract..................................................................................................................116Introduction............................................................................................................117Methods.................................................................................................................119Results...................................................................................................................119Discussion..............................................................................................................123
SUMMARY.................................................................................................. 125
ZUSAMMENFASSUNG................................................................................... 129
REFERENCES............................................................................................. 134
DANKSAGUNG – ACKNOWLEDGEMENTS....................................................... 149
CURRICULUM VITAE.................................................................................... 150
ERKLÄRUNG

Gen
eral
Intr
oduc
tion
&Th
esis
Out
line
GENERAL INTRODUCTION AND OUTLINE
3
GENERAL INTRODUCTION AND OUTLINE
1. Prokaryotic and eukaryotic microorganisms in aquatic systemsBacteria are an important and integral component in all aquatic ecosystems, their metabolism
accounts for large proportions of energy flux and matter turnover, they are recycling
dissolved chemical components and channel them up to higher trophic levels.
The number of prokaryotes on earth was estimated to range between 4-6x1030 cells, thereby
forming 350-550 pg of carbon (1pg=1015g) which equals 60-100% of the estimated total
carbon in plants (Whitman et al. 1998). This already points at the importance of prokaryotes
for the global carbon budget. Bacterial production can often comprise 30-50% of the
simultaneous particulate primary production (Ducklow et al. 2002) and their respiration rates
can even exceed phytoplankton production in unproductive aquatic systems (Del Giorgio et
al. 1997).
Since Pomeroy (1974) recognized the potential importance of microbes in the ocean´s
biogeochemical cycling and Azam et al. (1983) first formulated the concept of the “microbial
loop”, our view and understanding of microbially mediated processes has deepened and
many of the complex interactions within the microbial food web have been elucidated.
Traditionally, the view of the microbial loop was based on the mediation of biogeochemical
pathways (Cho and Azam 1988) and its role in carbon flux and transfer efficiencies.
Nowadays, for more and more components black boxes were opened and a variety of
microbial key players were identified. However, we are just beginning to understand the
shaping forces and regulating factors of bacterial communities and the underlying complexity
and mechanisms of temporal and spatial dynamics within the microbial food web. Being able
to consume dissolved organic (and inorganic) substrates, bacteria are the central microbial
food web component for the energy and matter transfer to higher trophic levels. The
extraordinary diversity of metabolic pathways found in prokaryotic organisms suggest that
their abundance and composition has profound implication for matter fluxes and ecosystem
functioning.
Aquatic microbial food webs can be characterized by a variety of functional
compartments, whereof each meanwhile has been further elucidated and consists of a large
number of species, ecological niches and evolutionary strategies. Despite the numerical
importance and enormous species richness, bacterial abundances in most aquatic natural
habitat are astonishingly constant and show an overall amplitude of approximately 0.1-
10x106 cells per ml, not exceeding one order of magnitude within a given system (Jürgens
and Güde 1994). Besides heterotrophic bacteria (see also 2.), autotrophic taxa can be of
cardinal importance for energy and matter fluxes mainly in oceanic food webs (e.g. Ting et al.
2002). The most dominant cyanobacterial taxa are Synechococcus and Prochlorococcus, of
GENERAL INTRODUCTION AND OUTLINE
4
which the former is also a common freshwater component (Vörös et al. 1998). Usually,
autotrophic forms are around ten times less abundant than heterotrophic bacteria, but, in
turn, numerically more important than eukaryotic ultraphytoplankton. Nevertheless, the latter
group often dominates in terms of primary production (Li 1995). Recent studies discovered
that ocean cyanobacteria (Prochlorococcus and Synechococcus) exhibit distinct niche
adaptations (Ferris and Palenik 1998), utilize different nitrogen sources (Moore et al. 2002)
and possess very different photosynthetic light-harvesting antennas (Ting et al. 2002). Similar
as their heterotrophic relatives, they are subject to viral infection (Suttle and Chan 1993) and
grazing by heterotrophic nanoflagellates (Dolan and Simek 1998) and ciliates (Christaki et al.
1999).
In general, auto- and heterotrophic bacteria are embedded in a complex web of
interactions with numerous taxa of ciliated and flagellated protists of the micro- and nano-
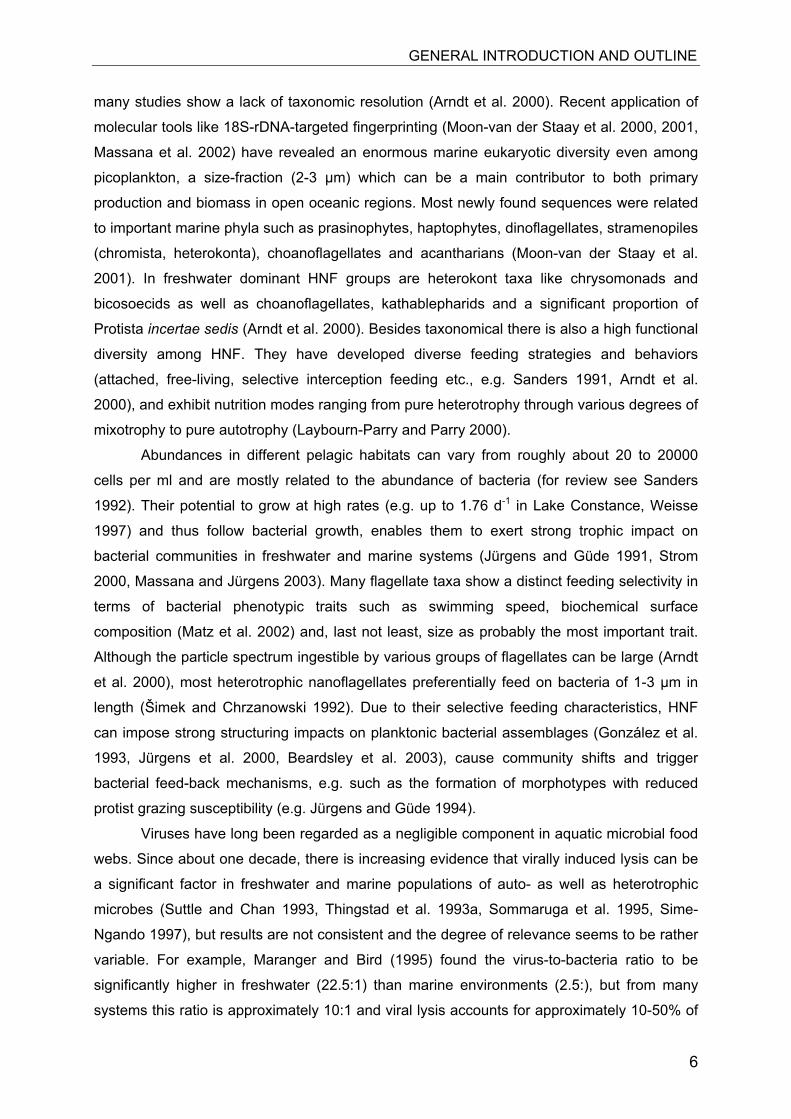
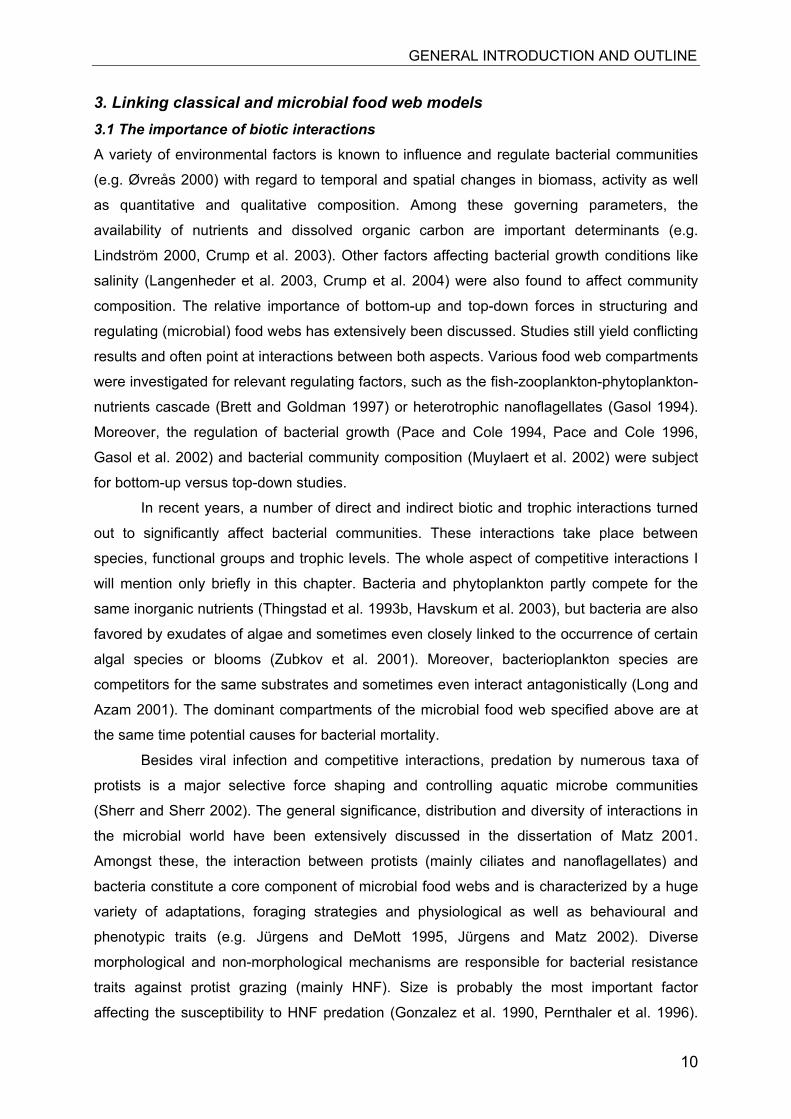
sized fraction as well as with phytoplankton and viruses (see Fig. 1).
Figure 1: Simplified scheme of a pelagic microbial food web. The experimental manipulation ofmesozooplankton communities (APP=appendicularians, COP=copepods, DAP=Daphnia) is shown astriangles. Components coloured light grey were analyzed in this thesis, arrow means “C-transfer byuptake”, dotted arrow means “releases”.
Global protist biodiversity is almost impossible to assess with the present knowledge
(Foissner 1999) and is still a matter of debate. Foissner (2000) points out that local ciliate
BacteriaPicocyanobacteria
Heterotrophicnanoflagellates
(HNF)
Mixotrophicnanoflagellates
(MNF)
„Microzooplankton“ciliates,(dino-)flagellates
phytoplankton
piscivores
planktivores
zooplankton
M e s o z o o p l a n k t o n
Macrozooplankton
��������������������������������������������������������������������������������������������������������������������������������������������������������������������������������������������������������������������������������������������������������������������������������������������������������������������������������������������������������������������������������������������������������������������������������������������������������������������������������������������������������������������������������������������������������������������������������������������������������������������������������������������������������
������������������������������������������������������������������������������������������������������������������������������������������������������������������������������������������������������������������������������������������������������������������������������������������������������������������������������������������������������������������������������������������������������������������������������������������������������������������������������������������������������������������������������������������������������������������������������������������������������������������������
FRESHWATERMARINECOP DAPAPP
DOM
nanociliates
inorganicnutrients
Viruses
GENERAL INTRODUCTION AND OUTLINE
5
diversity can not be used for estimating global diversity, as many regions are only poorly
investigated and many taxa are still undescribed, whereas Fenchel et al. (1997) as well as
Finlay (2002) have a contrasting point of view. Due to nearly unlimited protist dispersal and
the existence of many ubiquitous species they assume global species number to be relatively
low and local species richness to be always sufficient to drive ecosystem functions.
Nevertheless, ciliates are an abundant and species-rich component of most microbial
food webs. Diversity of free-living ciliates is still intensely debated and estimates vary
between approximately 3000 (Finlay et al. 1998) and probably about 30000 morphospecies
(Foissner 1999). Doubtlessly, they occupy important positions in most freshwater and marine
pelagic habitats, where they can exhibit conspicuous seasonal successions (Müller et al.
1991) or distinct spatial patches in their fine- to mesoscale (m-km) distribution (Montagnes et
al. 1999). Aquatic ciliates form a functionally and ecologically diverse assemblage as different
ciliate species may be autotrophic, mixotrophic, or primary and/or secondary consumers
(Pierce and Turner 1992). They can be the dominant group (up to 100 %) of
microzooplankton in temperate coastal waters (Pierce and Turner 1992) and act as a link
between small phytoplankton and larger zooplankton (Reid et al. 1991). Ciliates are able to
graze large proportions of primary production in many aquatic systems. For example, 32-55%
and 20-60% of the annual primary production was consumed by ciliates in Disko Bay and the
Kattegat, respectively (Levinsen and Nielsen 2002). In the Baltic Sea small planktonic ciliates
(less or equal to 30 µm) cleared 50-125% of the water volume per day in summer (Setälä
and Kivi 2003). The trophic role of ciliates can be further extended from algivory to
bacterivory. Pelagic ciliates from marine and freshwater systems were observed to feed on
bacteria at high rates (Sherr and Sherr 1987) and are sometimes even the dominant bacterial
grazers (Kisand and Zingel 2000, Šimek et al. 2000).
Oligotrichida probably constitute the numerically most important group within the
pelagic ciliate community. These filter-feeders mostly belong to the microzooplankton and are
well known as voracious feeders on nanoplanktonic but also on picoplanktonic organisms
(Šimek et al. 2000). A mass occurrence of planktonic oligotrichous ciliates, for example, was
reported from a bay in southern Norway (Dale and Dahl 1987).
Flagellate protozoa, in particular nanoflagellates, are ubiquitous in all aquatic
environments (in Laybourn-Parry and Parry 2000) and by feeding on heterotrophic and
phototrophic bacteria (phagotrophy) they play a cardinal role in planktonic carbon and
nutrient fluxes. This importance further increases as they can also take up dissolved and
particulate organic carbon (osmotrophy) of mainly colloidal sizes (Christoffersen et al. 1996).
Presently, there is no consensus on the geographic distribution and the overall diversity of
HNF. Patterson and Lee (2000) estimated no more than 3000 mostly cosmopolitan species.
As HNF are morphologically difficult to distinguish and due to methodological constraints
GENERAL INTRODUCTION AND OUTLINE
6
many studies show a lack of taxonomic resolution (Arndt et al. 2000). Recent application of
molecular tools like 18S-rDNA-targeted fingerprinting (Moon-van der Staay et al. 2000, 2001,
Massana et al. 2002) have revealed an enormous marine eukaryotic diversity even among
picoplankton, a size-fraction (2-3 µm) which can be a main contributor to both primary
production and biomass in open oceanic regions. Most newly found sequences were related
to important marine phyla such as prasinophytes, haptophytes, dinoflagellates, stramenopiles
(chromista, heterokonta), choanoflagellates and acantharians (Moon-van der Staay et al.
2001). In freshwater dominant HNF groups are heterokont taxa like chrysomonads and
bicosoecids as well as choanoflagellates, kathablepharids and a significant proportion of
Protista incertae sedis (Arndt et al. 2000). Besides taxonomical there is also a high functional
diversity among HNF. They have developed diverse feeding strategies and behaviors
(attached, free-living, selective interception feeding etc., e.g. Sanders 1991, Arndt et al.
2000), and exhibit nutrition modes ranging from pure heterotrophy through various degrees of
mixotrophy to pure autotrophy (Laybourn-Parry and Parry 2000).
Abundances in different pelagic habitats can vary from roughly about 20 to 20000
cells per ml and are mostly related to the abundance of bacteria (for review see Sanders
1992). Their potential to grow at high rates (e.g. up to 1.76 d-1 in Lake Constance, Weisse
1997) and thus follow bacterial growth, enables them to exert strong trophic impact on
bacterial communities in freshwater and marine systems (Jürgens and Güde 1991, Strom
2000, Massana and Jürgens 2003). Many flagellate taxa show a distinct feeding selectivity in
terms of bacterial phenotypic traits such as swimming speed, biochemical surface
composition (Matz et al. 2002) and, last not least, size as probably the most important trait.
Although the particle spectrum ingestible by various groups of flagellates can be large (Arndt
et al. 2000), most heterotrophic nanoflagellates preferentially feed on bacteria of 1-3 µm in
length (Šimek and Chrzanowski 1992). Due to their selective feeding characteristics, HNF
can impose strong structuring impacts on planktonic bacterial assemblages (González et al.
1993, Jürgens et al. 2000, Beardsley et al. 2003), cause community shifts and trigger
bacterial feed-back mechanisms, e.g. such as the formation of morphotypes with reduced
protist grazing susceptibility (e.g. Jürgens and Güde 1994).
Viruses have long been regarded as a negligible component in aquatic microbial food
webs. Since about one decade, there is increasing evidence that virally induced lysis can be
a significant factor in freshwater and marine populations of auto- as well as heterotrophic
microbes (Suttle and Chan 1993, Thingstad et al. 1993a, Sommaruga et al. 1995, Sime-
Ngando 1997), but results are not consistent and the degree of relevance seems to be rather
variable. For example, Maranger and Bird (1995) found the virus-to-bacteria ratio to be
significantly higher in freshwater (22.5:1) than marine environments (2.5:), but from many
systems this ratio is approximately 10:1 and viral lysis accounts for approximately 10-50% of
GENERAL INTRODUCTION AND OUTLINE
7
bacterial mortality (Guixa-Boixereu et al. 1999, Thingstad 2000b). The relative importance of
protozoan predation and viral lysis as causes for bacterial mortality has been examined in
several studies (e.g. Weinbauer and Höfle 1998, Tuomi and Kuuppo 1999, Šimek et al. 2001)
and the constraints and implications evaluated by models (e.g. Thingstad 2000b).
Differential viral impact was observed at different spatial and temporal scales as well
as in terms of bacterial community composition. Weinbauer and Höfle (1998) found depth-
dependent changes in the partitioning of virus- and grazing-induced bacterial mortality and
Šimek et al. (2001) even assumed protistan grazing to stimulate viral activity. Apparently, the
overall density of bacteria was either not affected by phages (Middelboe et al. 2001) or their
quantitative impact was much smaller than their functional importance (Sime-Ngando 1997).
At the level of individual bacterial host species or strains, viruses often show temporary
effects and can strongly influence the clonal diversity (Middelboe et al. 2001). Recent
investigations using pulsed-field gel electrophoresis fingerprinting showed some annual viral
community changes (Wommack et al. 1999), but a general community stability over shorter
time periods of days to months (Riemann and Middelboe 2002). Other studies proved virus
dynamics in the NW Mediterranean Sea to be more closely related to Synechococcus than to
heterotrophic bacteria. Viral-induced bacterial mortality turned out to be rather low (approx.
10% of production) (Bettarel et al. 2002) and flagellates were ascribed a larger importance in
consuming bacterial production (Bettarel et al. 2003).
2. Microbial diversity and function Understanding microbial diversity, the number of species, their patterns of substrate
utilization and the underlying mechanisms driving population dynamics constitute a main
objective in microbial ecology. However, the lack of diverse external characters and
difficulties in classifying microorganisms has hampered our understanding for a long time.
Early attempts to enumerate and cultivate heterotrophic microorganisms (Jannasch
and Jones 1959, Kogure et al. 1979) yielded large discrepancies between numbers
countable by microscopy and those producing colonies by standard plating techniques (only
0.01 to 0.1% of oceanic marine bacterial cells) and led Staley and Konopka (1985) to coin the
expression of “the great plate count anomaly". Moreover, the imitation of optimal growth
conditions in vitro remained difficult and conflicted for a long time with the complex bacterial
demands in terms of substrates, temperature and other biotic and abiotic factors. Of course,
the development of new techniques and high-throughput cultivation approaches have
considerably improved bacterial culturability and increased the number of cultured species
(e.g. in Connon and Giovannoni 2002).
Within the last two decades a variety of new invaluable tools and methodological
approaches based on bacterial 16S-RNA genes have been developed and applied in order to
GENERAL INTRODUCTION AND OUTLINE
8
unveil the diversity of complex natural microbial communities not yet able to be cultured.
These new molecular methods are generally culture-independent, have allowed for
remarkable progress and have fundamentally impacted the emerging phylogenetic view of
bacterial diversity (Hugenholtz et al. 1998).
The most revealing methods have been cloning and sequencing of 16S rRNA genes,
community fingerprinting and fluorescent in situ hybridization (FISH) (Fuhrman et al. 2002).
The latter technique even allows for relating phenotype with genotype (Amann et al. 1995).
While cloning and sequencing approaches normally yield the maximal number of taxa per
investigated unit, fingerprinting methods are comparably fast tools which are more
appropriate to monitor community changes, e.g. due to environmental perturbations. DNA
fingerprinting techniques which were applied to investigate bacterial community composition
were Amplified Ribosomal DNA Restriction Analysis (ARDRA, e.g. Tiedje et al. 1999,
Denaturing Gradient Gel Electrophoresis (DGGE, e.g. Muyzer et al. 1993, Muyzer and
Smalla 1998), Automated Ribosomal Intergenic Spacer Analysis (ARISA, e.g. Yu and Mohn
2001), Single Strand Conformation Polymorphism (SSCP, e.g. Schwieger and Tebbe 1998)
and Terminal Restriction Fragment Length Polymorphism (T-RFLP, e.g. Liu et al. 1997,
Moeseneder et al. 1999, Dollhopf et al. 2001).
Amongst these, DGGE is probably the most widespread and most often used
approach of genetic fingerprinting of microbial assemblages. Genomic DNA is extracted from
a complex microbial assemblage and PCR-amplified with primers specific for a molecular
marker (e.g. 16S rRNA gene). The obtained PCR product is separated in a polyacrylamide
gel containing a linear gradient of DNA denaturants (Urea, Formamide). Sequence variation
among the different DNA molecules influences the melting behaviour, and therefore
molecules with different sequences will stop migrating at different positions in the gel.
Since Woese (1987) presented a new phylogenetic classification based on rRNA and
containing the 3 domains Bacteria, Archaea and Eukarya, an enormous number of new taxa
and lineages has been described, of which a vast majority still remains uncultivable. In
addition to the 12 bacterial phyla distinguished in 1987, another 14 phyla with cultivated
representatives and another 26 phyla not containing any known cultivated representative
have been recognized (Rappe and Giovannoni 2003).f
The magnitude of prokaryotic species richness (domains Bacteria and Archaea) is still
intensely discussed and also a question of scales and the respective methods applied in
diversity analysis (e.g. Curtis et al. 2002). Maximal diversity estimates peaked in the range of
millions of species (Torsvik et al. 2002). However, prokaryotic diversity can range over four
orders of magnitude among habitats (Nee 2003) and thereby is orders of magnitude less in
aquatic environments than in sediments and soils (Torsvik et al. 2002). Although maximal
numbers of bacterioplankton taxa in one water sample measures by T-RFLP can reach up to
GENERAL INTRODUCTION AND OUTLINE
9
about 100 (Philippine coral reef, Fuhrman et al. 2002) and would have been likely higher
when including molecular cloning, a dereplication of GenBank sequences yielded “only”
1,117 unique ribotypes of marine bacteria and led Hagström et al. (2002) to the conclusion
that the apparent marine bacterioplankton species richness is relatively low. These
statements are consistent with the finding of often very widespread taxa (Fuhrman et al.
2002) and the global distribution of several marine planktonic prokaryote SSU rRNA gene
phylotypes (Rappé et al. 2000).
Although some subgroups seemed to be mostly restricted to freshwater systems (e.g.
Beta-proteobacteria) and others dominate in marine habitats (Glöckner et al. 1999), there
were also numerous overlaps, where e.g. coastal bacterioplankton communities contained
SSU rRNA gene lineages shown previously to be prevalent in freshwater habitats (Rappé et
al. 2000). Nevertheless, Zwart et al. (2002) found specific planktonic bacterial communities in
rivers and lakes distinct from bacteria in neighbouring environments such as soil and
sediments and pointed out that these planktonic bacteria are distributed in diverse freshwater
ecosystems around the world (Zwart et al. 1998).
Amongst heterotrophic marine bacteria, alpha-Proteobacteria comprise one of the
largest fractions (e.g. Hagström et al. 2002) and include two clades, SAR11 and
Roseobacter, which account for 26 and 16% of 16S ribosomal RNA gene clones retrieved
from marine bacterioplankton (Giovannoni and Rappé 2000). 16S rRNA gene clones The
related to the SAR11 clade were among the first groups organisms to be identified by
cultivation-independent approaches based on rRNA gene cloning and sequencing
(Giovannoni et al. 1990). They can represent as much as 50% of subtropical surface
bacterioplankton communities and among the most successful organisms on Earth (Morris et
al. 2002) and Rappé et al. (2002) recently succeeded in cultivating members of this clade.
Also just lately, a cluster affiliated to the Roseobacter clade was newly discovered and
turned out to be numerically very important from temperate to polar regions (Selje et al.
2004).
The relationship between diversity and ecosystem functioning is still far from being
understood (e.g. Finlay et al. 1997, Hulot et al. 2000). Bacterial biodiversity can potentially
impact on ecosystem stability, food web structure and biogeochemical dynamics in terms of
process magnitude and maintenance. However, at least for soil microbial communities there
is evidence of a high functional redundancy, and evidence for low impact of bacterial diversity
on the magnitude of ecosystem processes came from studies by Yin et al. (2000), but this
topic should be also addressed in aquatic microbes. The development of recent promising
and successful techniques to link between bacterial function and diversity (MICROFISH:
Ouverney 1999, STARFISH: Fuhrman 2002), should enable to approach this question, but
respective methods are rather difficult to apply and data basis is still scarce.
GENERAL INTRODUCTION AND OUTLINE
10
3. Linking classical and microbial food web models 3.1 The importance of biotic interactions A variety of environmental factors is known to influence and regulate bacterial communities
(e.g. Øvreås 2000) with regard to temporal and spatial changes in biomass, activity as well
as quantitative and qualitative composition. Among these governing parameters, the
availability of nutrients and dissolved organic carbon are important determinants (e.g.
Lindström 2000, Crump et al. 2003). Other factors affecting bacterial growth conditions like
salinity (Langenheder et al. 2003, Crump et al. 2004) were also found to affect community
composition. The relative importance of bottom-up and top-down forces in structuring and
regulating (microbial) food webs has extensively been discussed. Studies still yield conflicting
results and often point at interactions between both aspects. Various food web compartments
were investigated for relevant regulating factors, such as the fish-zooplankton-phytoplankton-
nutrients cascade (Brett and Goldman 1997) or heterotrophic nanoflagellates (Gasol 1994).
Moreover, the regulation of bacterial growth (Pace and Cole 1994, Pace and Cole 1996,
Gasol et al. 2002) and bacterial community composition (Muylaert et al. 2002) were subject
for bottom-up versus top-down studies.
In recent years, a number of direct and indirect biotic and trophic interactions turned
out to significantly affect bacterial communities. These interactions take place between
species, functional groups and trophic levels. The whole aspect of competitive interactions I
will mention only briefly in this chapter. Bacteria and phytoplankton partly compete for the
same inorganic nutrients (Thingstad et al. 1993b, Havskum et al. 2003), but bacteria are also
favored by exudates of algae and sometimes even closely linked to the occurrence of certain
algal species or blooms (Zubkov et al. 2001). Moreover, bacterioplankton species are
competitors for the same substrates and sometimes even interact antagonistically (Long and
Azam 2001). The dominant compartments of the microbial food web specified above are at
the same time potential causes for bacterial mortality.
Besides viral infection and competitive interactions, predation by numerous taxa of
protists is a major selective force shaping and controlling aquatic microbe communities
(Sherr and Sherr 2002). The general significance, distribution and diversity of interactions in
the microbial world have been extensively discussed in the dissertation of Matz 2001.
Amongst these, the interaction between protists (mainly ciliates and nanoflagellates) and
bacteria constitute a core component of microbial food webs and is characterized by a huge
variety of adaptations, foraging strategies and physiological as well as behavioural and
phenotypic traits (e.g. Jürgens and DeMott 1995, Jürgens and Matz 2002). Diverse
morphological and non-morphological mechanisms are responsible for bacterial resistance
traits against protist grazing (mainly HNF). Size is probably the most important factor
affecting the susceptibility to HNF predation (Gonzalez et al. 1990, Pernthaler et al. 1996).

GENERAL INTRODUCTION AND OUTLINE
11
When bacterial cells are below or above a certain threshold characterizing the optimal prey
item size for grazing-selective flagellates, they become less vulnerable due to increasing
handling time or ingestion being impossible.
In recent years, other modes of grazing resistance and size-independent resistance
traits such as cell surface properties, motility, capsules and exopolymers received more
attention (Matz and Jürgens 2001, Matz et al. 2002) and even differential digestion and
toxicity (Boenigk et al. 2001, Matz 2001) turned out to be relevant determinants for the
coexistence of bacteria and their predators. The regulation of grazing resistance is still
extensively discussed, such as the impact of resources on resistance traits (Matz and
Jürgens 2003) and the relative contribution of polymorphism and induction to the adaptive
responses of bacterial communities towards protist grazing (Šimek et al. 1997, Hahn et al.
1999, Hahn and Höfle 2001).
Differential feed-back mechanisms at the level of bacteria thus further complicate the
patterns of community dynamics and the response to top-down effects of other planktonic
organisms belonging to higher trophic levels. These patterns can contribute to explain why
plankton communities do not settle to equilibrium in a rather constant environment. Apart
from the fact that even apparently homogeneous environments like the pelagic habitat show
some spatial complexity, various competition and predation models suggest that interactions
between multiple species will give rise to oscillations and chaotic population dynamics
(Huisman and Weissing 1999, Huisman and Weissing 2001, Scheffer et al. 2003).
In many studies of planktonic food webs bacteria are still treated as a “black box”, not
accounting for the heterogeneous structure and dynamics within the bacterial assemblage.
Among the current concepts and models dealing with aquatic pelagic food webs, the focus
often was on production mechanisms of dissolved organic carbon and the carbon flow
through food webs (Nagata 2000). For such approaches, it was mostly inevitable to integrate
over major food web components as “total bacteria” or “total protozoa”. This bottom-up
perspective in the conceptual view of food web control is more common (Thingstad 2000a),
for example in order to estimate how much of the available carbon pool would be transferred
to fish production. In general, top-down approaches have rarely been applied with respect to
marine planktonic systems (Verity and Smetacek 1996) and, for example, marine ecologists
have almost never attempted top-down explanations of phytoplankton size structure
(Sommer and Stibor 2002). The same holds for heterotrophic paths of the (especially marine)
pelagic food web, where cascading top-down impact of higher trophic level organisms such
as mesozooplankton has rarely been investigated. This could be taken as an example for
advances made in freshwater aquatic ecology and a probably more progressive view on
mechanisms of food web structuring when being compared with the marine counterpart of
this discipline.
GENERAL INTRODUCTION AND OUTLINE
12
3.2 The role of higher trophic levels – mesozooplankton as a pelagic interfaceZooplankton organisms of the size-fraction 0.2 - 2 mm are referred to as mesozooplankton
and constitute a major component of all aquatic pelagic systems. While copepods and
cladocerans occur in freshwater as well as marine habitats, tunicates such as
appendicularians and salps are restricted to marine waters. These organisms directly link
phytoplankton with larger zooplankton and fish and thus have long been regarded as
exclusively herbivorous. So far, many studies focussed on zooplankton-phytoplankton-
interactions (Calbet 2001), which formed the basis for most food web concepts from early
food chain models (Steele 1974) to the extended view including the microbial loop (Azam
1983). In order to further characterise and compare the trophic impact of dominant
mesozooplankton groups on lower trophic levels, their ecophysiological peculiarities and
feeding characteristics should be of central interest. Key features of these dominant
zooplankton groups are summarised more in detail in Sommer and Stibor (2002).
Planktonic copepods are primary consumers in the ocean and are perhaps the most
numerous metazoans on earth, directly affecting pelagic fish populations and the biological
pump of carbon into the deep ocean (Ohman and Hirche 2001). Also in freshwater systems
they can temporarily contribute significantly to mesozooplankton. The two most important
subgroups, calanoids and cyclopoids copepods, are characterized by a complicated life-cycle
(obligate sexuality, larval nauplius stages, subadult copepodid stages), slow somatic growth
and distinct feeding modes. In marine systems, calanoid copepods normally constitute the
majority within the copepod assemblage. Despite differences in foraging strategies with
respect to swimming behaviour (Tiselius and Jonsson 1990), copepods prey on larger
particles and thereby show conspicuous feeding selectivity in terms of size and chemical
properties. All copepod groups can strongly affect lower trophic levels (e.g. Kiørboe 1997), on
one hand by producing substrates (sloppy feeding, excretion, defecation) (Møller and Nielsen
2001, Møller et al. 2003), but mainly by direct predation. There is more and more evidence
that copepods, previously regarded as herbivorous, can be rather considered omnivorous
(Kleppel 1993) and that there exists a strong coupling between copepods and protists in
fresh waters (Wickham 1995, Burns and Schallenberg 2001b, Yoshida et al. 2001) as well as
in marine systems (Hansen et al. 2000, Levinsen et al. 2000).
Cladocerans are likely the most well-studied group of zooplankton. They are
characterized by high metabolic rates (sexual maturity within a few days under optimal
conditions) and simple life cycles without larval stages and with parthenogenetic reproduction
through most of the year (Sommer and Stibor 2002). Freshwater cladocerans of the dominant
genus Daphnia are unselective filter-feeders (DeMott 1982, Brendelberger et al. 1986), which
feed on prey items ranging from ~1 to 30 µm in size (e.g. Geller and Müller 1981). Daphnids
performs diel vertical migrations (Lampert and Taylor 1985) and can efficiently control
GENERAL INTRODUCTION AND OUTLINE
13
phytoplankton (Lampert et al. 1986). Furthermore, Daphnia can be the main reason for
mortality of protozoans and rotifers in lakes (Jack and Gilbert 1994, Pace and Vaqué 1994)
and even impact bacterial communities (e.g. for review see Jürgens 1994, Jürgens et al.
1994b, Degans et al. 2002) phytoplankton species composition (Sommer et al. 2003b).
There are no real counterparts of Daphnia in marine systems, and much less is known about
the only three marine cladoceran genera Evadne, Podon and Penilia, of which only the last
one resembles Daphnia in terms of nutrition. Slow escape reaction from visually oriented
predators is suggested to explain why cladocerans in general are of minor importance in
marine food webs (Verity and Smetacek 1996).
Pelagic tunicates (salps, appendicularians, pyrosomas and doliolids) are restricted to
marine systems and are referred to as gelatinous zooplankton (e.g. Sommer and Stibor
2002). They are ubiquitous filter-feeders (wide range of particle sizes, depending on body
size, filtering structure and taxonomic group, Acuña 2001) and are generally characterized by
a complex life cycle and very high potential growth rates (e.g. Nakamura et al. 1997). The
knowledge on the importance of appendicularians in marine planktonic food webs is still
limited (Calbet 2001, Lopez-Urrutia et al. 2003) and more measurements of their feeding at
different temporal and spatial scales are required to ascertain their role as grazers in pelagic
food webs (Lopez-Urrutia et al. 2003).
However, by high clearance rates at maximal population densities, appendicularians
like Oikopleura dioica can exert significant grazing pressure (Alldredge 1981).
Microphageous appendicularians revealed high retention efficiencies for very small particles
(0.2 – 6 µm) (Fernandez et al. 2004), thus, by feeding on prokaryotes and colloidal particles,
suggesting a crucial role in marine carbon fluxes. Interestingly, recent studies found calanoid
copepods to prey directly on Oikopleura dioica (Lopez-Urrutia et al. 2004), indicating further
complicated direct and indirect interactions between these two mesozooplankton groups and
their microbial prey organisms. For future marine zooplankton research, Bathmann et al.
(2001) emphasised the importance to focus on elucidating the trophic role of certain key
species like Calanus finmarchicus and Oikopleura dioica.
Interactions of producers and consumers can have profound consequences for the
biogeochemistry of the oceans and also of lakes. Hence, numerous studies have discussed
the underlying mechanisms structuring food webs and have compared the relative
importance of top-down vs. bottom-up forces and factors (e.g. Brett and Goldman 1997,
Gasol et al. 2002, Muylaert et al. 2002). As the central role of protozoa in the aquatic food
chain not only consists of being a predator of bacteria and other protists, but also a prey item
for larger zooplankton, one should assume qualitative and quantify alterations at higher
trophic levels to cascade down to lower food web components.
GENERAL INTRODUCTION AND OUTLINE
14
Describing a special case of indirect biotic interactions with important implication at
the ecosystem level, the trophic cascades concept (Paine 1980, Carpenter et al. 1985,
Shurin et al. 2002) gained substantial attention and proved to hold true for diverse but mainly
aquatic food webs (Pace et al. 1999, see also Chapter V). This indirect trophic interaction can
be regarded as the inverse patterns of abundance or biomass across more than one trophic
link in a food web (Pace et al. 1999). There is some experimental evidence that complex
cascading influences of higher-order consumers can elicit indirect responses of lower trophic
levels, e.g. fish affected phytoplankton via zooplankton (Brett and Goldman 1996). However,
there were also strong indications that mesozooplankton impact on microbial food webs and
bacteria via predatory cascades (e.g. Calbet and Landry 1999, Katechakis et al. 2002).
Interestingly, various factors can prevent or modify trophic cascades, such as high trophic
level heterogeneity and the substitutability of species (Strong 1992, Persson 1999) or cause
effects on composition rather than on biomass (Tessier and Woodruff 2002). Consequently,
one could expect various possible species and community level scenarios depending on food
web structure, the degree of omnivory, feeding selectivity and potential feed-back
mechanisms (e.g. reduced grazing susceptibility).
4. Thesis outline Only few studies exist from marine habitats conducting experimental food web manipulations
on a larger scale (Koshikawa et al. 1999, Graneli and Turner 2002), mostly dealing with
changes in the nutrient regime (Lebaron et al. 2001b, Schäfer et al. 2001, Jacquet et al. 2002
Joint et al. 2002). Up to now there has been no study directly comparing freshwater and
marine microbial food webs in response to mesozooplankton grazing impact using the same
basic experimental setup and methodological approaches. Thus, one major aim of this thesis
is to gain general evidence from freshwater and marine systems on the structuring effects of
different mesozooplankton groups on population dynamics, activity and diversity of lower
trophic levels and functional components. In order to elucidate general unifying or differing
patterns in mesozooplankton impact, large-scale mesocosm experiments were performed in
selected marine and freshwater habitats using the same experimental design, manipulations
of mesozooplankton composition and density, as well as the same set of methods. In these
experiments, ecologically very relevant and abundant taxa were included, such as Daphnia
and Eudiaptomus in freshwater and key species like Calanus finmarchicus and Oikopleura
dioica in marine systems.
One major emphasis was put on the comparison of mesozooplankton groups with
differing feeding selectivity and foraging strategies (e.g. filter feeder versus selective
predator). According to these differences, one would expect differently cascading direct and
GENERAL INTRODUCTION AND OUTLINE
15
indirect impacts on functional components of the respective microbial food webs. Extending
this hypothesis further, one would assume mesozooplankton with similar nutrition strategies,
like filter-feeding Daphnia sp. in lakes and appendicularians in the marine habitat or
omnivorous copepods in both systems, to be comparable in terms of their trophic effects.
The main focus within the presented mesocosm studies I put on temporal responses
as well as changes along gradients of zooplankton density. Thereby, by performing
experiments in spring and summer food web scenarios, the aspect of seasonal differences
and plankton peculiarities within the same system was accounted for. For reasons of clarity,
several additional experiments and mesocosm treatments were not included in this thesis or
were only partly touched, such as the impact of nutrient additions, the shift of nutrient ratios
(N:P, marine summer experiment) or the impact of food web alterations on dynamics of DOC
(dissolved organic carbon) and DOC degradation. Furthermore, some functional groups
within the microbial food webs were either of minor numerical importance within the studied
systems at the time of investigation (like heterotrophic dinoflagellates and sarcodines), were
not sampled (viruses) or counted, but not included for reasons of a reduction of food web
complexity (eukaryotic picoplankton).
The chosen systems and study sites (mesotrophic Schöhsee and a fully marine
Norwegian fjord, for closer descriptions and images, see chapters I and III) provided very
different constellations of nutrient regime and plankton composition. Figure 1 displays a
simplified scheme of the main functional microbial food web compartments with those
components marked in light grey whose response to mesozooplankton constituted the central
issue of this thesis. My aim in this thesis was to comprehensively illustrate the impact modes
of different mesozooplankton groups on freshwater and marine microbial food webs and to
characterise their complex interactions and response characteristics to alterations at higher
trophic levels. In a variety of evaluation approaches and by applying diverse analyses on a
broad methodological basis, I will elucidate patterns of microbial food web dynamics ranging
from single-taxon to community level responses. The first two chapters will deal with
freshwater experiments performed in summer and spring, while the next two will present
results obtained from marine experiments.
In chapter I, I will demonstrate major outcomes of a detailed enclosure study in
mesotrophic Schöhsee, comparing the contrasting effects of Daphnia and copepods on the
microbial food web during the summer plankton situation. Besides a more detailed view on
the ciliate community, this investigation focussed on the density-dependent effects of filter-
feeding versus selective particle-catching mesozooplankton and attempted to include not
only quantitative variations in bacterioplankton, but also bacterial function, activity and
community composition.
GENERAL INTRODUCTION AND OUTLINE
16
Chapter II deals with a mesocosm experiment in the same lake (Schöhsee) in spring
and puts the aspect of temporal microbial food web succession and the phenomenon of a
mass development of grazing-resistant heterotrophic filamentous bacteria in the focus of
investigation. The unmanipulated lake as well as selected zooplankton treatments with
experimentally induced Daphnia and protozoan dominance were monitored over a period of
25 days and under phosphorus-depleted conditions. Besides tracing filament formation at the
general level of bacterial morphotypes, the application of a newly-designed taxon-specific
oligonucleotide probe made it possible to better resolve the heterogeneity inherent in
filamentous bacterial communities. The emergence of potentially grazing-resistant bacterial
filaments will be discussed in the light of predation and abiotic factors.
In chapter III, I seek to demonstrate temporal and density-dependent dynamics within
marine microbial food webs due to mesozooplankton manipulation in a set of 3 independent
large-scale mesocosm experiments (5 copepod density gradients) in spring and summer,
thereby including functional groups of protists, the abundance of auto- and heterotrophic
picoplankton as well as bacterial activity. The cascading trophic impact of copepod
communities composed of small and large (Calanus finmarchicus) will be shown as well as
the aspect of dominance of either filter-feeding Oikopleura dioica or copepods. Finally, as a
side aspect, effects of enrichment with inorganic nutrients will be discussed in the context of
food web constellation.
In chapter IV, I will further extend the view on marine microbial food web responses
and extensively analyse qualitative and quantitative changes in marine bacterial community
composition. Moreover, I will elucidate patterns of bacterial diversity and community similarity
in relation to the observed food web responses described in chapter III, at the level of both
community subgroups and single taxonomic units.
Finally, chapter V synoptically summarises the importance of copepod-mediated trophic
cascades for composition and function of marine and freshwater microbial food webs.
IChapter 1
Lake
– microbial food
web in summer
Daphnia vs. copepods
CHAPTER I - Abstract
17
Cascading predation effects of Daphnia and copepodson microbial food web components
ABSTRACT We performed a mesocosm experiment to investigate the structuring and cascading effects
of two predominant crustacean mesozooplankton groups on microbial food web components.
The natural summer plankton community of a mesotrophic lake was exposed to density
gradients of Daphnia and copepods. Regression analysis was used to reveal top-down
impacts of mesozooplankton on protists and bacteria after days 9 and 15.
Selective grazing by copepods caused a clear trophic cascade via ciliates to
nanoplankton. Medium-sized (20-40 µm) ciliates (mainly Oligotrichida) were particularly
negatively affected by copepods whereas nanociliates (mainly Prostomatida) became more
abundant. Phototrophic and heterotrophic nanoflagellates increased significantly with
increasing copepod biomass, which we interpreted as an indirect response to reduced
grazing pressure from the medium-sized ciliates.
In Daphnia-treatments ciliates of all size classes as well as nanoflagellates were
reduced directly but the overall predation effect became most strongly visible after 15 days at
higher Daphnia biomass.
The response in bacterioplankton involved only modest changes in bacterial biomass
and cell-size distribution along the zooplankton gradients. Increasing zooplankton biomass
resulted either in a reduction (with Daphnia) or in an increase (with copepods) of bacterial
biovolume, activity and production. Patterns of bacterial diversity as measured by PCR-
DGGE (Denaturing Gradient Gel Electrophoresis) showed no distinct grouping after 9 days,
whereas a clear treatment-coupled similarity clustering occurred after 15 days.
The experiment demonstrated that zooplankton-mediated predatory interactions
cascade down to the bacterial level but also revealed that changes occurred rather slowly in
this summer plankton community and were most pronounced with respect to bacterial activity
and composition.
CHAPTER I - Introduction
18
INTRODUCTIONPlanktonic bacteria are regulated by the availability of inorganic and organic nutrients
(“bottom-up-control”), by bacterivorous protists (“top-down-control”), and by viral lysis
(Thingstad and Lignell 1997). In recent years it has become evident that the classical grazer-
food chain and the microbial food web are linked by several direct and indirect interactions.
Most planktonic protists are within the prey size spectrum of different metazooplankton
groups (Carrick et al. 1991, Arndt 1993, Sanders and Wickham 1993). Moreover,
cladocerans, especially Daphnia spp., can sometimes replace protozoans as the major
bacterial consumer in freshwater lakes (Pace 1990, Jürgens 1994). Because bacteria
mediate key pathways in global biogeochemical cycles we should assume that factors
controlling biomass, production and turnover rates of microorganisms are also factors that
regulate key functions at the ecosystem level (Cotner and Biddanda 2002).
Grazing by different mesozooplankton groups (zooplankton with a body size of 0.2-2
mm), consisting of crustacean taxa like cladocerans and copepods, is an important factor
shaping the autotrophic and heterotrophic communities at lower trophic levels. In particular,
filter-feeding cladocerans (e.g. Daphnia spp.) can cause order-of-magnitude biomass
reductions in phytoplankton (Lampert et al. 1986) and both can affect phytoplankton species
composition (Vanni and Temte 1990, Sarnelle 1993).
Although a wide overlap in the food spectrum of cladocerans and copepods is
generally found, the minimal sizes for food particles ingested by most copepods are clearly
larger than for cladocerans (Gliwicz 1980) and copepods can select easily between food
items (DeMott 1988). Consequently, these mesozooplankton guilds are expected to exert
different predation impacts on heterotrophic microorganisms. Although both copepods and
cladocerans occur in most lakes, there have been only a few direct comparisons of their
consumer effects on microbial food webs (Wickham 1998, Burns and Schallenberg 2001a;
Yoshida et al. 2001). Because of the overwhelming predation effects of large-sized
cladocerans, particularly daphnids, Daphnia-based studies constitute the basis of most
current models of metazoan effects on microorganisms in freshwater systems (see reviews in
Porter et al. 1988, Riemann and Christoffersen 1993, Jürgens 1994). Being a relatively
unselective filter feeder, Daphnia can exert strong top-down impact on phytoplankton as well
as on the protozoan and bacterial assemblages. In contrast, relatively little is known about
the potential cascading trophic interactions proceeding, via direct and indirect effects, from
copepods to bacteria. The selective predatory impact of cyclopoid and calanoid copepods
has been demonstrated with ciliates as prey (e.g. Burns and Gilbert 1993, Wickham 1995),
but few investigations have also examined possible cascading trophic effects from copepod-
dominated zooplankton down to the bacterial community (e.g. Burns and Schallenberg 1996,
Burns and Schallenberg 1998, Burns and Schallenberg 2001b, Yoshida et al. 2001).
CHAPTER I - Methods
19
However, whereas experimental manipulations of crustacean zooplankton generally
resulted in clear predation-mediated effects on planktonic protists, changes in bacterial
biomass have only rarely been detected (Pace 1991, Wickham 1998, Adrian et al. 2001) and
studies in oligo- to mesotrophic lakes generated somewhat conflicting results. This is possibly
due to the importance of the actual zooplankton densities used in the experiments and also
due to the fact that previous studies have focussed almost exclusively on the numerical
response of the bacterioplankton to the different zooplankton treatments. Therefore, in this
mesocosm study we set out to assess and refine the differential effects of cladocerans and
copepods on microbial food web components, while other information on the response of the
plankton community, derived from the same study, can be obtained from Sommer et al.
(2001, 2003b). In this mesocosm experiment, we used gradients of realistic cladoceran and
copepod densities in order to account for zooplankton density effects. We measured the
response of bacterial biomass, but also considered changes in bacterial activity, morphology
and diversity.
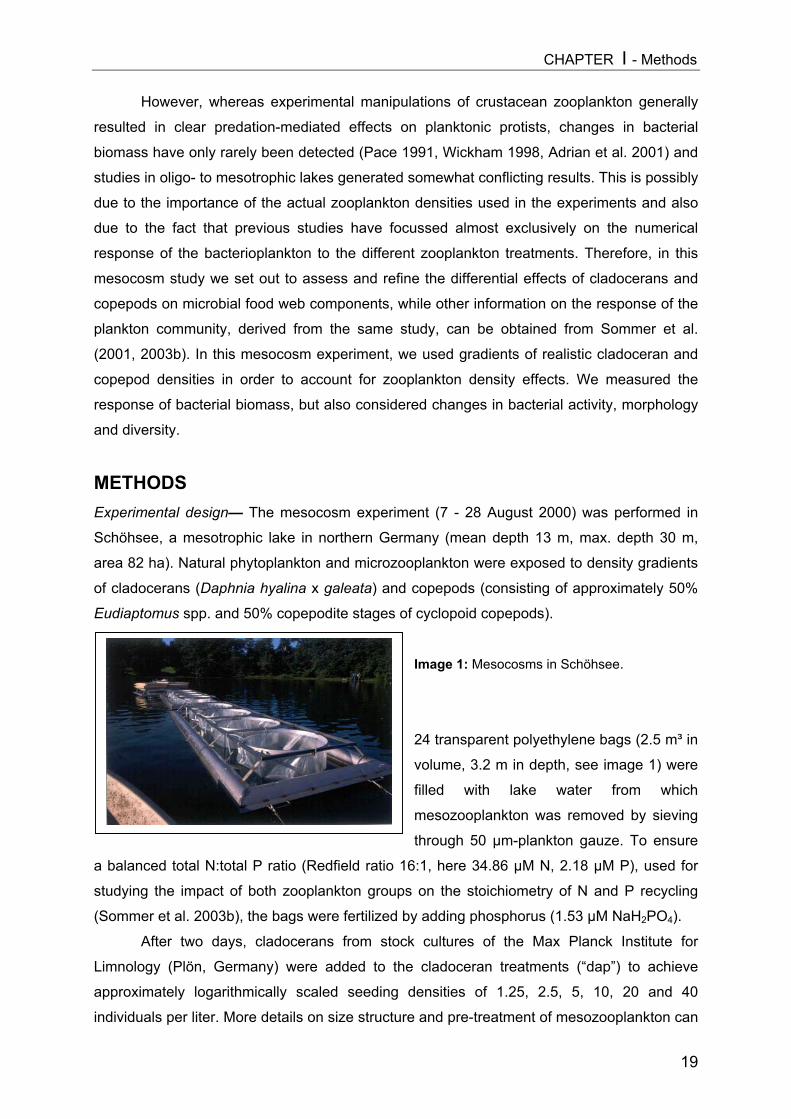
METHODSExperimental design— The mesocosm experiment (7 - 28 August 2000) was performed in
Schöhsee, a mesotrophic lake in northern Germany (mean depth 13 m, max. depth 30 m,
area 82 ha). Natural phytoplankton and microzooplankton were exposed to density gradients
of cladocerans (Daphnia hyalina x galeata) and copepods (consisting of approximately 50%
Eudiaptomus spp. and 50% copepodite stages of cyclopoid copepods).
Image 1: Mesocosms in Schöhsee.
24 transparent polyethylene bags (2.5 m³ in
volume, 3.2 m in depth, see image 1) were
filled with lake water from which
mesozooplankton was removed by sieving
through 50 µm-plankton gauze. To ensure
a balanced total N:total P ratio (Redfield ratio 16:1, here 34.86 µM N, 2.18 µM P), used for
studying the impact of both zooplankton groups on the stoichiometry of N and P recycling
(Sommer et al. 2003b), the bags were fertilized by adding phosphorus (1.53 µM NaH2PO4).
After two days, cladocerans from stock cultures of the Max Planck Institute for
Limnology (Plön, Germany) were added to the cladoceran treatments (“dap”) to achieve
approximately logarithmically scaled seeding densities of 1.25, 2.5, 5, 10, 20 and 40
individuals per liter. More details on size structure and pre-treatment of mesozooplankton can
CHAPTER I - Methods
20
be found in Sommer et al. 2001, Sommer et al. 2003b). Copepods derived from wild catches
from the same lake 2 days prior to the experiment were added in logarithmically scaled
seeding densities of approximately 5, 10, 20, 40, 80 and 160 individuals per liter to the
copepod treatments (“cop”). Apart from lowest density enclosures (dap 1.25, cop 5) all
mesozooplankton seeding density treatments were replicated. Two mesocosms without the
addition of zooplankton served as controls. For data evaluation we used the actual
zooplankton biomass in each bag, so that each gradient consisted of 13 data points.
Throughout the course of the experiment, we measured chlorophyll a daily, determined
zooplankton densities every three to four days, and used these data to select appropriate
dates for our in-depth analysis of the microbial communities. Days 9 and 15 were chosen
according to the development of the zooplankton gradient: after 9 days with rather low
numbers and a narrow biomass range, and after 15 days with a wider range and higher
maximal biomass values. On days 9 and 15 we determined the concentrations of protists and
bacteria, evaluated bacterial diversity using DGGE, and measured bacterial activity using 3H-
thymidine and 3H-leucine incorporation as well as exoenzyme (protease) hydrolysis
measurements (see below). Sampling and enumeration of organisms. Sampling of the mesocosms for
microbial components (picoplankton, protozoans) was done using a 10 L-can after gently
mixing the water column up to 2 m depth with a Secchi disc. Zooplankton sampling was
carried out every 3rd to 4th day by towing a 50 µm-mesh plankton net with a reducing cone
diameter of 9 cm from a depth of 3 m to the surface. Zooplankton was fixed with
formaldehyde (4 % final concentration) and counted and sized under a dissecting
microscope. Zooplankton biomass was calculated from length measurements using
published length-biomass-regressions (Bottrell et al. 1976). Chlorophyll a measurements
were performed with a submersible fluorometer (Fluoroprobe, BBE Moldaenke, Kiel,
Germany) that is able to register in vivo fluorescence of phytoplankton (e.g. Beutler et al.
2002).
Ciliates were fixed with acid Lugol´s solution (final concentration 1%) and counted and
sized in sedimenting chambers with an inverted microscope (Zeiss Axiovert 35). Ciliate
groups were distinguished according to Foissner and Berger 1996. Three size classes of
ciliates were differentiated (largest dimension): ciliates < 20 µm (referred to as nanociliates),
20-40 µm and > 40 µm. Samples for enumeration of bacteria, of chroococcal cyanobacteria
(autotrophic picoplankton, APP, mainly Synechococcus-like cells) and nanoflagellates were
preserved in formalin (final concentration 2%) and stored at 4°C until further processing
(usually within the next 24 h). Subsamples were filtered onto black polycarbonate filters, 1 ml
for counting of picoplankton (25 mm, pore size 0.2 µm), 5 ml for enumeration of
nanoflagellates (25 mm, pore size 0.8 µm), and stained with DAPI (4´,6-Diamidino-2-
CHAPTER I - Methods
21
Phenylindole, Sigma-Aldrich Chemie GmbH, Steinheim, Germany) at a final concentration of
4 µg ml-1 and stored at -20°C until microscopical enumeration. DAPI preparations were
analyzed in an epifluorescence microscope (Zeiss Axiophot, Carl Zeiss Jena GmbH, Jena,
Germany) at 1250x magnification. APP were enumerated under green light excitation.
Heterotrophic flagellates were distinguished from phototrophic (auto and mixotrophic
nanoflagellates, AMNF) ones by checking for chlorophyll a autofluorescence under blue light
excitation.
Bacterial abundances and biovolumes were determined by using an automated
imaging system (analySIS 3.0, Soft Imaging Systems GmbH, Münster, Germany).
Epifluorescence images (10 per sample with a total of 500-700 cells) were digitized and
automatically processed including filtering, threshold setting and binarization as described in
Massana et al. 1997). Cell volumes (V) were calculated according to: V = 8.5 x A2.5 x P-2,
where A is the area and P the perimeter of the cell (Björnsen 1986).
Bacterial diversity. For the extraction of bacterial DNA, 100 ml of samples fixed with
formalin for up to 12 h were filtered onto Durapore filters (47 mm, pore size 0.2 µm,
Millipore) and stored in Petri-dishes at –80°C until DNA extraction. Extraction of DNA
followed the protocol reported by (Schauer et al. 2000), which includes the addition of
lysozyme, sodium dodecyl sulfate and proteinase K, followed by extraction with phenol-
chloroform-isoamyl alcohol (25:24:1, pH 8) and chloroform-isoamyl alcohol (24:1) and
subsequent concentration and rinsing steps. After quantifying spectrofluorometrically the
extracted microbial DNA with a Hoechst fluorescence assay (Paul and Myers 1982), 1-8 ng
of DNA was used as template for PCR (polymerase chain reaction) amplification of bacterial
16S rDNA. The reactions (50 µl volume) contained 200 µM of each of the desoxynucleoside
triphosphates, 0.3 µM of each of the primers, 1.5 mM MgCl2, 10x PCR buffer and 1.25 U Taq
DNA polymerase (Biozym Diagnostik GmbH, Hessisch Oldendorf, Germany).
We used the bacterial specific primer 358f, with a 40-bp GC clamp, and the universal
primer 907r, which amplifies a 550-bp DNA fragment of bacterial 16S rDNA (Muyzer et al.
1998). The PCR was performed with an iCycler (Bio-Rad Laboratories GmbH, München,
Germany) thermal cycler using the following program: initial denaturation at 94°C for 5 min;
10 touchdown cycles of denaturation (at 94 °C for 1 min), annealing (at 65-55 °C for 1 min,
decreasing 1 °C each cycle) and extension (at 72 °C for 3 min); 20 standard cycles of
denaturation (at 94 °C for 1 min), annealing (at 55°C for 1 min) and extension (at 72 °C for 3
min) and a final extension at 72 °C for 7 min. PCR products were verified by agarose gel
electrophoresis with a standard in the gel (Low DNA Mass Ladder, Gibco BRL) and
quantified again (see above).
DGGE was carried out with a D-Code system (Biorad) as described in Muyzer et al.
1998. A 6% polyacrylamide gel with a gradient of a DNA-denaturing agent was cast by
CHAPTER I - Methods
22
mixing solutions of 40% and 80% denaturant agent (100% denaturant agent is 7 M urea and
40% deionised formamide) with a gradient former (Biorad). Equal amounts of PCR product
were loaded and the gel was run at 100 V for 16 h at 60°C in 1x TAE buffer (40 mM Tris, pH
7.4, 20 mM sodium acetate, 1 mM EDTA). The gel was stained with the nucleic acid stain
SYBR Gold (Molecular Probes) for 30 min, rinsed with Milli-Q water, removed from the glass
plate to a UV-transparent gel scoop and visualised with UV. By using the software GeneSnap
4.00. (SynGene, Cambridge, England) high-resolution images were saved as computer files.
To obtain quantitative information from DGGE fingerprints, digitized DGGE images were
analyzed with the software GeneTools 3.00.22 (SynGene, Cambridge, England). The
software performs a density profile through each lane, detects the bands (regarded as
operational taxonomic units, OTUs) and calculates the relative contribution of each band to
the total band signal in the lane after applying a rolling disk as background subtraction.
Bands with a relative intensity of less than 0.2 % of the total intensity of the lane were
disregarded. The bands occupying the same position in the different lanes of the gel were
identified by visual inspection. A matrix was compiled based upon the presence or absence
of individual bands in each lane and the relative contribution of the band to the total band
signal.
Bacterial production and physiological activity. On days 8 and 15, production of
heterotrophic bacterioplankton was measured as ³H-thymidine incorporation into cold-TCA-
insoluble material following a slightly modified protocol given by Bell 1993. ³H-thymidine
(specific activity 87 or 90 Ci/mmol, Amersham Biosciences Europe GmbH, Freiburg,
Germany) was added at a saturating concentration (40 nmol L-1 final concentration). As a
measure of metabolic activity and protein synthesis, incorporation of ³H-labeled leucine (80
nmol L-1 final concentration, 145 Ci/mmol, Amersham) into cold-TCA-insoluble material was
registered according to a slightly modified protocol described by Kirchman 1993. All samples
were incubated for 1 h at in-situ-temperature. Formalin-killed controls were used to correct for
background absorption of radioactivity. For an estimation of bacterial doubling times we used
the empirical conversion factors of 2 x 10¹⁸ cells mol-1 thymidine (Smits and Riemann 1988)
and 0.18 x 10¹⁸ cells mol-1 leucine (Ducklow et al. 1992).
To determine shifts in size distribution of bacterial activity, fractionated ³H-thymidine
uptake was measured for selected enclosures on days 10 and 15. Samples were incubated
with ³H-thymidine (20 nmol L-1 final concentration) for 1h at in situ temperature. Subsamples
were filtered with low pressure (gravity filtration) on 0.2 µm, 1 µm and 3 µm filters. Filters
were rinsed with MQ-water only to avoid disruption of cells, and then they were put into
scintillation cocktail and radioassayed.
Enzymatic protease hydrolysis was determined on days 8 and 15 by using Leu-MCA
(Leucine-methylcoumarinyl-amide) as a fluorogenic substrate analogue (Hoppe 1993). The
CHAPTER I - Methods
23
concentrations of added substrates were 1 µmol L-1 for determining the turnover rate (TR)
and 250 µmol L-1 for determining the maximal velocity of hydrolysis (Vmax). These
concentrations were successfully applied in gradients of eutrophication (Hoppe et al. 1998).
This approach was adopted from the two concentration methods used in the determination of
turnover time and Vmax in substrate uptake studies (Gocke 1977). Samples were incubated
in microtiterplates (four parallels for each concentration). Readings of fluorescence at the
beginning and end of the incubation period (3h) were made in an automatic Titertek
Fluoroskan II fluorometer. The factor necessary for converting fluorescence units to units of
µmol L-1 h-1 (µmol of substrate hydrolyzed per unit of volume and time) was derived from
standard additions of the fluorescing compound AMC (Amidomethylcoumarin).
Statistical analysis. The binary matrix (presence/absence of bands) obtained from
the DGGE gel was used to calculate a distance matrix using Euclidean distances (root-mean-
squared differences). A dendrogram comparing samples was obtained by UPGMA
(Unweighted Pair-Group Method with Arithmetic averages) in cluster analysis. To analyse the
effects of mesozooplankton on the abundances, biovolumes and incorporation rates of pico-
and nanoplankton, regression analyses were performed. Since the dependent parameters at
the sampling dates are a time integrated response of the period prior to sampling, time
averaged zooplankton densities (geometric means of day 6 and 9 for day 9, and of day 13
and 16 for day 15) were multiplied with a mean biomass value for each enclosure obtained
from length measurements (see above). Frequency data were arcsin-transformed before
regression analysis. In order to test if the same regression relationship might fit data from
both days, we combined the data from days 9 and 15, and conducted multiple linear
regression (MLR) with zooplankton biomass (geometric means), a binary dummy variable for
time and an interaction term for these two as independent variables. This last term was
tested for significance to see if there really was a time-related change in the quantitative
response to zooplankton density between days 9 and 15.

CHAPTER I - Results
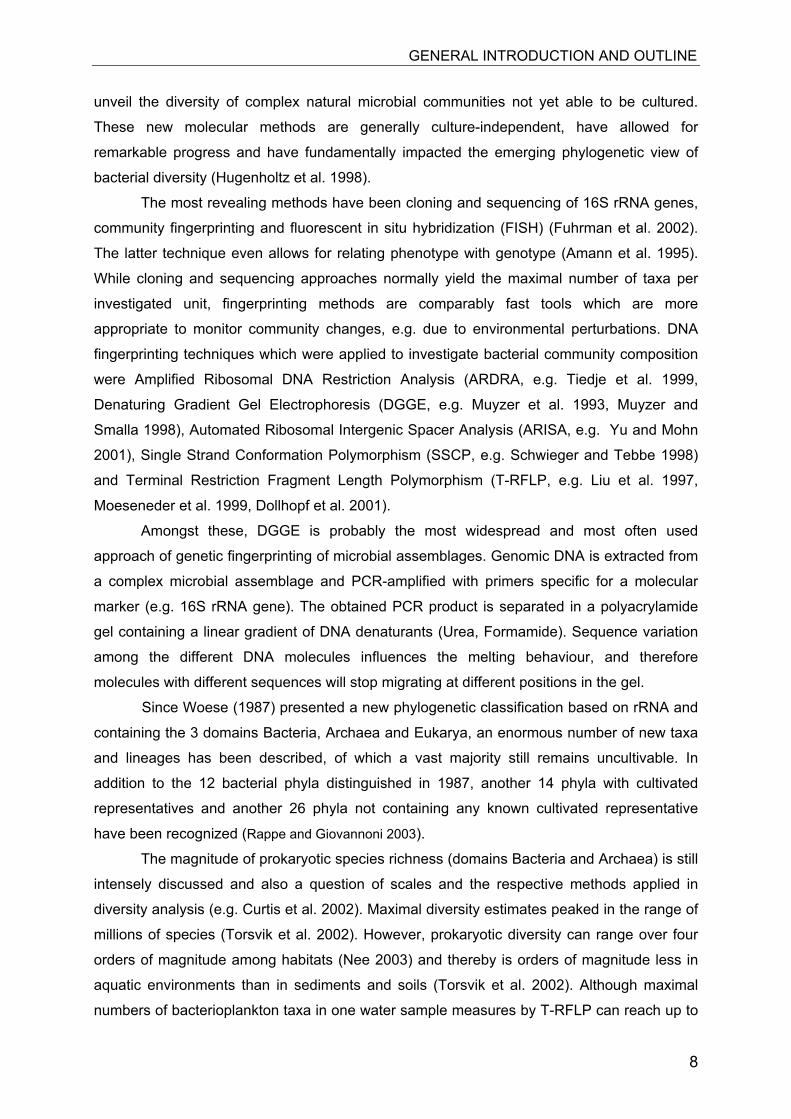
RESULTS General development of zooplankton and chlorophyll a— During the course of the experiment, mesozooplankton gradients were established with
abundances mostly lower than the calculated seeding densities. Daphnia densities showed a
distinct gradient with a strong population increase in the higher density treatments in the
second half of the experiment (Fig. 1A). The Daphnia biomass gradient after 9 days ranged
between 0 and 155 µg DW L-1 (here and thereafter as geometric means, see above), while
that after 15 days varied between 0.3 and 489 µg DW L-1. The copepod gradient persisted
more constantly in the course of the experimental period, with a less intense population
increase in the highest density treatment (Fig. 1B). Here analogous biomass values were 0 to
584 µg DW L-1 on day 9 and 2.4 to 683 µg DW L-1 on day 15, respectively.
The date for the first in-depth analysis, performed at day 9, wa
analysis reported by Sommer et al. (2001, 2003b) and was mainly
development. Both zooplankton gradients were well established
their biomass range. However, the population densities, pa
enclosures, were lower than expected from the calculated seedin
range 1-23 ind L-1). Therefore, day 15 was chosen as a seco
analysis, where zooplankton gradients were still distinct with incre
DAYS0 5 10 15 20
Dap
hnia
spp
. (in
d L-1
)
0
20
40
60
80
dap 1.25dap 2.5dap 5dap 10dap 20dap 40
DAYS0 5 10 15 20
Cop
epod
s (in
d L-1
)
0
40
80
120
160
cop 5cop 10cop 20cop 40cop 80cop 160
A
B
Figure 1:Zooplankton development[ind L-1] in Daphniaenclosures (A, upper graph)and copepod enclosures (B)in the course of theexperiment. The first datapoint of each plot representsthe calculated nominalseeding density of thedifferent treatments and wasnot determined by samplecounts. The two selectedsampling dates are markedby arrows.
24
s chosen according to the
based on the zooplankton
and showed an overlap in
rticularly in the Daphnia
g densities (mean 9 ind L-1,
nd time point for in-depth
ased zooplankton numbers
CHAPTER I - Results
in highest density treatments (Daphnia: mean 16.9 ind L-1, range 0.2-80.8 ind L-1) and thus a
wider biomass range. Sommer et al. (2001, 2003b) reported that contamination of copepod
enclosures with Daphnia occurred towards the end of the experiment. Detailed zooplankton
analysis revealed a marked increase of Daphnia in copepod enclosures after day 16. Up to
then, contaminating Daphnia were mostly small juvenile stages. Daphnia biomass calculated
from length measurements of selected samples using a length-biomass-regression in Bottrell
et al. (1976) indicated a comparably small biomass contribution of Daphnia to total
mesozooplankton biomass in the copepod enclosures with a mean value of 11.2%.
As zooplankton were sampled with a 50 µm net, rotifers (Keratella sp.) were not
quantitatively measured. Rotifers show generally low abundances in summer (Fussmann
1996) and were monitored roughly together with zooplankton counts and Utermöhl counts of
Lugol samples. Only in control enclosures (after 15 days) without Daphnia or copepods were
estimated rotifer densities high, ranging from 600 to 1200 ind L-1. Rotifers like Keratella sp.
can strongly reduce ciliate growth rate due to direct predation and mechanical interference
(Arndt 1993; Weisse and Frahm 2002). Therefore, those two mesocosms were not included
in the regression analysis for day 15.
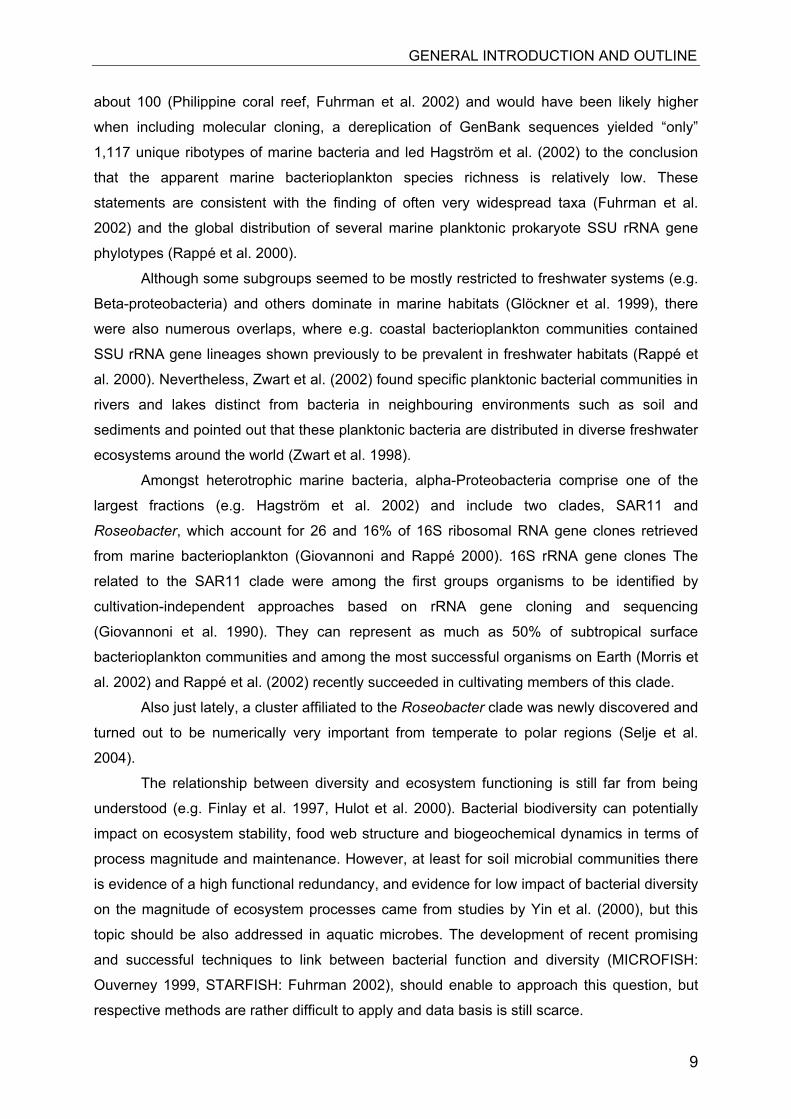
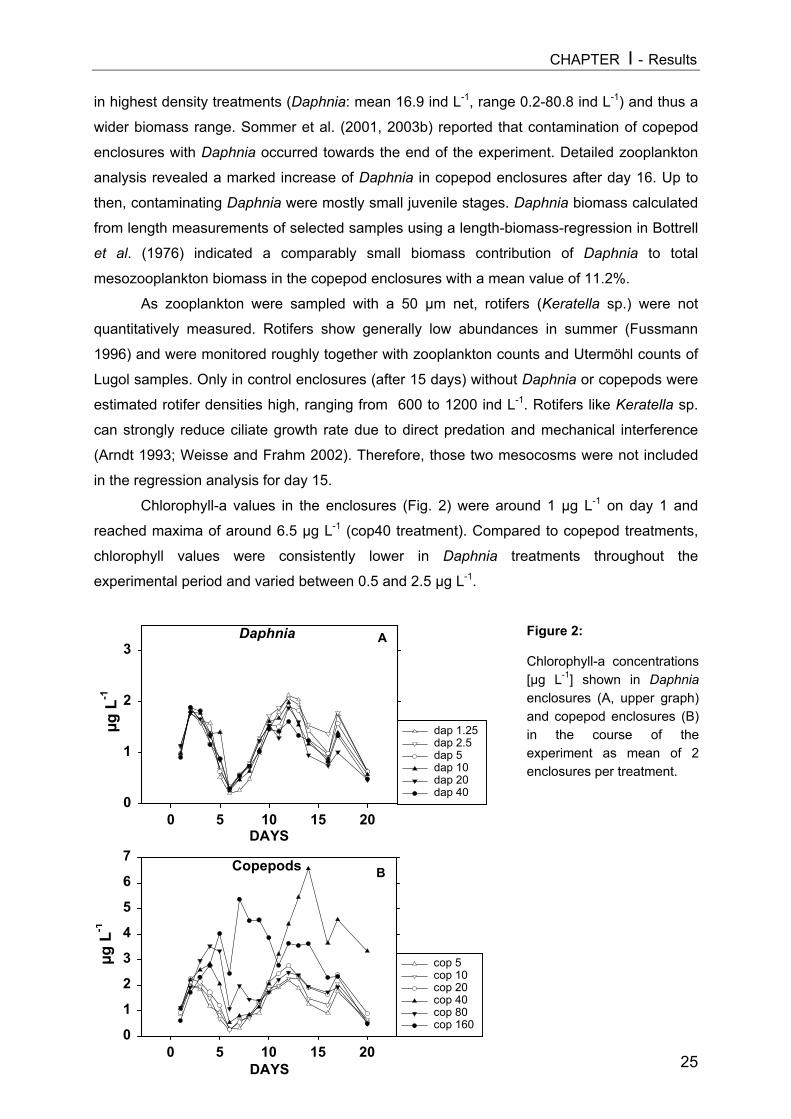
Chlorophyll-a values in the enclosures (Fig. 2) were around 1 µg L-1 on day 1 and
reached maxima of around 6.5 µg L-1 (cop40 treatment). Compared to copepod treatments,
chlorophyll values were consistently lower in Daphnia treatments throughout the
experimental period and varied between 0.5 and 2.5 µg L-1.
Daphnia
DAYS0 5 10 15 20
µg L
-1
0
1
2
3
dap 1.25 dap 2.5 dap 5 dap 10 dap 20 dap 40
Copepods
DAYS0 5 10 15 20
µg L
-1
0
1
2
3
4
5
6
7
cop 5 cop 10 cop 20 cop 40 cop 80 cop 160
A
B
Figure 2:
Chlorophyll-a concentrations[µg L-1] shown in Daphniaenclosures (A, upper graph)and copepod enclosures (B)in the course of theexperiment as mean of 2enclosures per treatment.
25
CHAPTER I - Results
26
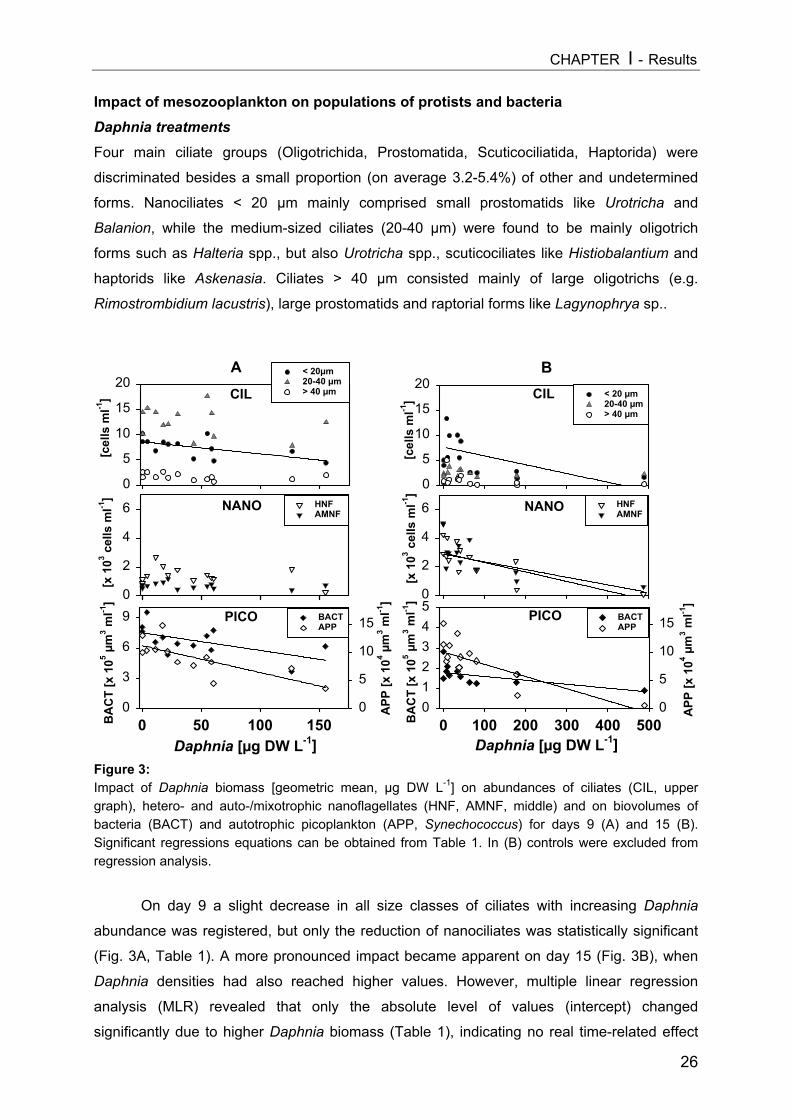
Impact of mesozooplankton on populations of protists and bacteria Daphnia treatmentsFour main ciliate groups (Oligotrichida, Prostomatida, Scuticociliatida, Haptorida) were
discriminated besides a small proportion (on average 3.2-5.4%) of other and undetermined
forms. Nanociliates < 20 µm mainly comprised small prostomatids like Urotricha and
Balanion, while the medium-sized ciliates (20-40 µm) were found to be mainly oligotrich
forms such as Halteria spp., but also Urotricha spp., scuticociliates like Histiobalantium and
haptorids like Askenasia. Ciliates > 40 µm consisted mainly of large oligotrichs (e.g.
Rimostrombidium lacustris), large prostomatids and raptorial forms like Lagynophrya sp..
Figure 3: Impact of Daphnia biomass [geometric mean, µg DW L-1] on abundances of ciliates (CIL, uppergraph), hetero- and auto-/mixotrophic nanoflagellates (HNF, AMNF, middle) and on biovolumes ofbacteria (BACT) and autotrophic picoplankton (APP, Synechococcus) for days 9 (A) and 15 (B).Significant regressions equations can be obtained from Table 1. In (B) controls were excluded fromregression analysis.
On day 9 a slight decrease in all size classes of ciliates with increasing Daphnia
abundance was registered, but only the reduction of nanociliates was statistically significant
(Fig. 3A, Table 1). A more pronounced impact became apparent on day 15 (Fig. 3B), when
Daphnia densities had also reached higher values. However, multiple linear regression
analysis (MLR) revealed that only the absolute level of values (intercept) changed
significantly due to higher Daphnia biomass (Table 1), indicating no real time-related effect
[cel
ls m
l-1]
0
5
10
15
20< 20µm 20-40 µm > 40 µm
[x 1
03 cel
ls m
l-1]
0
2
4
6 HNFAMNF
Daphnia [µg DW L-1]0 50 100 150B
AC
T [x
105 µ
m3 m
l-1]
0
3
6
9
APP
[x 1
04 µm
3 ml-1
]
0
5
10
15BACTAPP
ACIL
NANO
PICO
B
[cel
ls m
l-1]
0
5
10
15
20< 20 µm20-40 µm> 40 µm
NANO
[x 1
03 cel
ls m
l-1]
0
2
4
6 HNFAMNF
PICO
Daphnia [µg DW L-1]0 100 200 300 400 500B
AC
T [x
105 µ
m3 m
l-1]
012345
APP
[x 1
04 µm
3 ml-1
]0
5
10
15BACTAPP
CIL
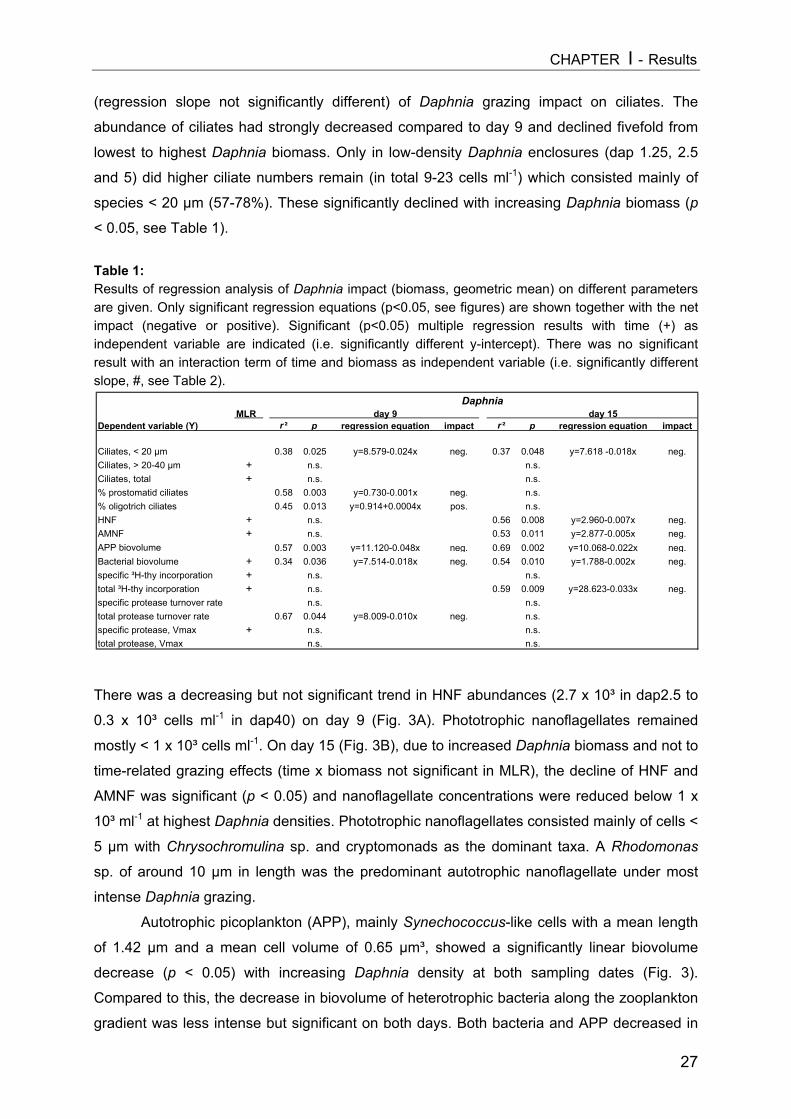
CHAPTER I - Results
27
(regression slope not significantly different) of Daphnia grazing impact on ciliates. The
abundance of ciliates had strongly decreased compared to day 9 and declined fivefold from
lowest to highest Daphnia biomass. Only in low-density Daphnia enclosures (dap 1.25, 2.5
and 5) did higher ciliate numbers remain (in total 9-23 cells ml-1) which consisted mainly of
species < 20 µm (57-78%). These significantly declined with increasing Daphnia biomass (p
< 0.05, see Table 1).
Table 1:Results of regression analysis of Daphnia impact (biomass, geometric mean) on different parametersare given. Only significant regression equations (p<0.05, see figures) are shown together with the netimpact (negative or positive). Significant (p<0.05) multiple regression results with time (+) asindependent variable are indicated (i.e. significantly different y-intercept). There was no significantresult with an interaction term of time and biomass as independent variable (i.e. significantly differentslope, #, see Table 2).
There was a decreasing but not significant trend in HNF abundances (2.7 x 10³ in dap2.5 to
0.3 x 10³ cells ml-1 in dap40) on day 9 (Fig. 3A). Phototrophic nanoflagellates remained
mostly < 1 x 10³ cells ml-1. On day 15 (Fig. 3B), due to increased Daphnia biomass and not to
time-related grazing effects (time x biomass not significant in MLR), the decline of HNF and
AMNF was significant (p < 0.05) and nanoflagellate concentrations were reduced below 1 x
10³ ml-1 at highest Daphnia densities. Phototrophic nanoflagellates consisted mainly of cells <
5 µm with Chrysochromulina sp. and cryptomonads as the dominant taxa. A Rhodomonas
sp. of around 10 µm in length was the predominant autotrophic nanoflagellate under most
intense Daphnia grazing.
Autotrophic picoplankton (APP), mainly Synechococcus-like cells with a mean length
of 1.42 µm and a mean cell volume of 0.65 µm³, showed a significantly linear biovolume
decrease (p < 0.05) with increasing Daphnia density at both sampling dates (Fig. 3).
Compared to this, the decrease in biovolume of heterotrophic bacteria along the zooplankton
gradient was less intense but significant on both days. Both bacteria and APP decreased in
DaphniaMLR day 9 day 15
Dependent variable (Y) r ² p regression equation impact r ² p regression equation impact
Ciliates, < 20 µm 0.38 0.025 y=8.579-0.024x neg. 0.37 0.048 y=7.618 -0.018x neg.Ciliates, > 20-40 µm + n.s. n.s.Ciliates, total + n.s. n.s.% prostomatid ciliates 0.58 0.003 y=0.730-0.001x neg. n.s.% oligotrich ciliates 0.45 0.013 y=0.914+0.0004x pos. n.s.HNF + n.s. 0.56 0.008 y=2.960-0.007x neg.AMNF + n.s. 0.53 0.011 y=2.877-0.005x neg.APP biovolume 0.57 0.003 y=11.120-0.048x neg. 0.69 0.002 y=10.068-0.022x neg.Bacterial biovolume + 0.34 0.036 y=7.514-0.018x neg. 0.54 0.010 y=1.788-0.002x neg.specific ³H-thy incorporation + n.s. n.s.total ³H-thy incorporation + n.s. 0.59 0.009 y=28.623-0.033x neg.specific protease turnover rate n.s. n.s.total protease turnover rate 0.67 0.044 y=8.009-0.010x neg. n.s.specific protease, Vmax + n.s. n.s.total protease, Vmax n.s. n.s.
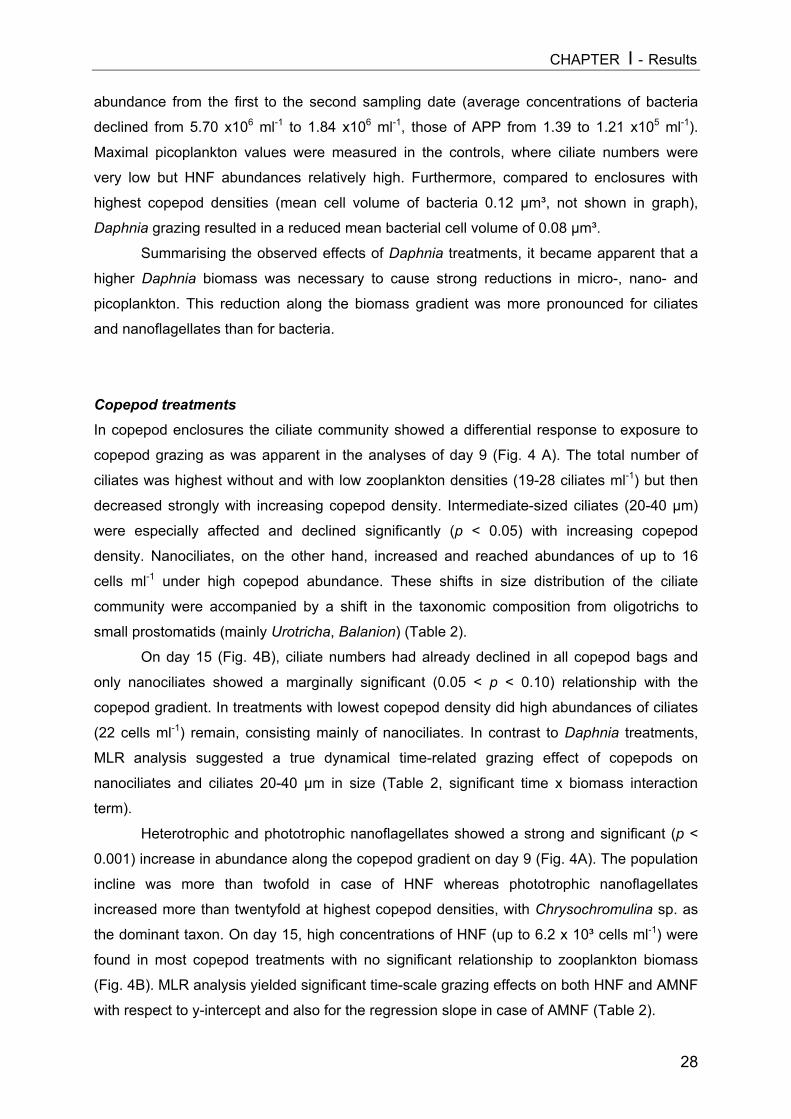
CHAPTER I - Results
28
abundance from the first to the second sampling date (average concentrations of bacteria
declined from 5.70 x10⁶ ml-1 to 1.84 x10⁶ ml-1, those of APP from 1.39 to 1.21 x10⁵ ml-1).
Maximal picoplankton values were measured in the controls, where ciliate numbers were
very low but HNF abundances relatively high. Furthermore, compared to enclosures with
highest copepod densities (mean cell volume of bacteria 0.12 µm³, not shown in graph),
Daphnia grazing resulted in a reduced mean bacterial cell volume of 0.08 µm³.
Summarising the observed effects of Daphnia treatments, it became apparent that a
higher Daphnia biomass was necessary to cause strong reductions in micro-, nano- and
picoplankton. This reduction along the biomass gradient was more pronounced for ciliates
and nanoflagellates than for bacteria.
Copepod treatments
In copepod enclosures the ciliate community showed a differential response to exposure to
copepod grazing as was apparent in the analyses of day 9 (Fig. 4 A). The total number of
ciliates was highest without and with low zooplankton densities (19-28 ciliates ml-1) but then
decreased strongly with increasing copepod density. Intermediate-sized ciliates (20-40 µm)
were especially affected and declined significantly (p < 0.05) with increasing copepod
density. Nanociliates, on the other hand, increased and reached abundances of up to 16
cells ml-1 under high copepod abundance. These shifts in size distribution of the ciliate
community were accompanied by a shift in the taxonomic composition from oligotrichs to
small prostomatids (mainly Urotricha, Balanion) (Table 2).
On day 15 (Fig. 4B), ciliate numbers had already declined in all copepod bags and
only nanociliates showed a marginally significant (0.05 < p < 0.10) relationship with the
copepod gradient. In treatments with lowest copepod density did high abundances of ciliates
(22 cells ml-1) remain, consisting mainly of nanociliates. In contrast to Daphnia treatments,
MLR analysis suggested a true dynamical time-related grazing effect of copepods on
nanociliates and ciliates 20-40 µm in size (Table 2, significant time x biomass interaction
term).
Heterotrophic and phototrophic nanoflagellates showed a strong and significant (p <
0.001) increase in abundance along the copepod gradient on day 9 (Fig. 4A). The population
incline was more than twofold in case of HNF whereas phototrophic nanoflagellates
increased more than twentyfold at highest copepod densities, with Chrysochromulina sp. as
the dominant taxon. On day 15, high concentrations of HNF (up to 6.2 x 10³ cells ml-1) were
found in most copepod treatments with no significant relationship to zooplankton biomass
(Fig. 4B). MLR analysis yielded significant time-scale grazing effects on both HNF and AMNF
with respect to y-intercept and also for the regression slope in case of AMNF (Table 2).
CHAPTER I - Results
29
Figure 4: Impact of copepod biomass [geometric mean µg DW L-1] on abundances of ciliates (CIL, upper graph),hetero- and auto-/mixotrophic nanoflagellates (HNF, AMNF, middle) and on biovolumes of bacteria(BACT) and autotrophic picoplankton (APP, Synechococcus) for days 9 (A) and 15 (B). Significantregressions equations can be obtained from Table 2. In (B) controls were excluded from regressionanalysis.
Table 2: Results of regression analysis of copepod impact (biomass, geometric mean) on different parametersare given. Only significant regression equations (p<0.05, see figures) are shown together with the netimpact (negative or positive). Significant (p<0.05) multiple regression results with time (+) and aninteraction term of time and biomass (#) as independent variables are indicated.
[cel
ls m
l-1]
0
5
10
15
20< 20 µm20-40 µm> 40 µm
NANO
[x 1
03 cel
ls m
l-1]
0
2
4
6
AM
NF
[x 1
03 ce
lls m
l-1]
0
5
10
15HNF AMNF
PICO
copepod biomass [µg DW L-1]0 100 200 300 400 500 600B
AC
T [x
105 µ
m3 m
l-1]
0
3
6
9
12
APP
[x 1
04 µm
3 ml-1
]
0
5
10
15
20
BACTAPP
CIL
[cel
ls m
l-1]
0
5
10
15
20< 20 µm20-40 µm> 40 µm
[x 1
03 cel
ls m
l-1]
0
2
4
6
AM
NF
[x 1
03 ce
lls m
l-1]
0
5
10
15HNF AMNF
PICO
copepod biomass [µg DW L-1]0 100 200 300 400 500 600 700B
AC
T [x
105 µ
m3 m
l-1]
0
2
4
6
APP
[x 1
04 µm
3 ml-1
]
0
5
10
15
20BACTAPP
NANO
CILA B
CopepodsMLR day 9 day 15
Dependent variable (Y) r ² p regression equation impact r ² p regression equation impact
Ciliates, < 20 µm # n.s. 0.35 0.053 y=9.288-0.011x neg.Ciliates, > 20-40 µm + # 0.63 0.001 y=10.258-0.015x neg. n.s.Ciliates, total n.s. n.s.% prostomatid ciliates n.s. n.s.% oligotrich ciliates + # 0.33 0.040 y=0.916-0.0001x neg. n.s.HNF + 0.71 0.000 y=1.136+0.004x pos. n.s.AMNF + # 0.78 <0.0001 y=-1.451+0.026x pos. n.s.APP biovolume + 0.92 <0.0001 y=12.010-0.019x neg. 0.61 0.005 y=16.390- 0.022x neg.Bacterial biovolume + n.s. 0.39 0.040 y=1.617+ 0.002x pos.specific ³H-thy incorporation + n.s. n.s.total ³H-thy incorporation n.s. 0.51 0.014 y= 23.992+0.035x pos.specific protease turnover rate + 0.82 0.012 y=1.128+0.003x pos. n.s.total protease turnover rate 0.89 0.005 y=7.432+0.014x pos. n.s.specific protease, Vmax 0.79 0.017 y=26.415+0.065x pos. n.s.total protease, Vmax 0.85 0.010 y=173.836+0.302x pos. n.s.
CHAPTER I - Results
30
Within the picoplankton fraction, APP and heterotrophic bacteria responded differently on day
9 (Fig. 4A). Biovolume of APP decreased significantly with increasing copepod density (p <
0.001), whereas bacteria remained relatively constant. Bacterial biovolume varied between
5.1 and 11.7 x105 µm3 ml-1 with a peak in intermediate copepod density treatments.
A differential response in picoplankton, including a decrease in APP and an increase
in heterotrophic bacteria (p < 0.05), along the zooplankton density gradient was noted also
on day 15 (Fig. 4B). Biovolume of APP ranged between 2.4 and 19.5 x104 µm3 ml-1 and
decreased significantly with increasing copepod density (p < 0.05). The range of bacterial
biovolume (1.4-4.1 x105 µm3 ml-1) on day 15 was much lower compared to day 9, but still
above values found in Daphnia treatments and with highest values at maximal copepod
densities. On day 15, also mean volume of bacterial cells increased significantly (not shown
in graph). Here, the biovolume of cells >2 µm in length ranged from 18 to 33 x103 µm3 ml-1 in
cop160 treatments, thereby differing considerably from values found in dap40 treatments (0-6
x103 µm3 ml-1). Filamentous bacteria (>5 µm) generally were of minor importance (around 6
x103 cells ml-1 in cop160, not shown in graph), but still almost twice as high as in enclosures
with highest Daphnia biomass.
To summarise, selective copepod grazing resulted in a reduction of intermediate-
sized ciliates and in a strong increase in nanoflagellates accompanied by a significant
decrease in APP, but no significant response in heterotrophic bacteria. Persistent copepod
grazing further reduced ciliate densities, raised the level of nanoplankton and caused an
increasing trend in bacterial biovolume and cell size along the copepod gradient.
Impact of mesozooplankton on bacterial community compositionThe DGGE profile of enclosures with Daphnia and copepods revealed 20 different OTUs of
bacteria on day 9 (Fig. 5A). The highest number of OTUs (19) was found in treatments
without zooplankton (0 ZP), in the others the number of OTUs varied between 8 and 16. The
enclosures deviated slightly from the lake situation on day 9 with respect to number, position
and intensity of bands. Results obtained from a UPGMA cluster analysis of a distance matrix
using only the presence and absence of bands did not show any distinct grouping patterns or
separation of Daphnia and copepod treatments on day 9 (Fig. 5B). Also when including
relative DGGE band intensities, no treatment coupled clustering of OTU composition could
be observed (not shown).
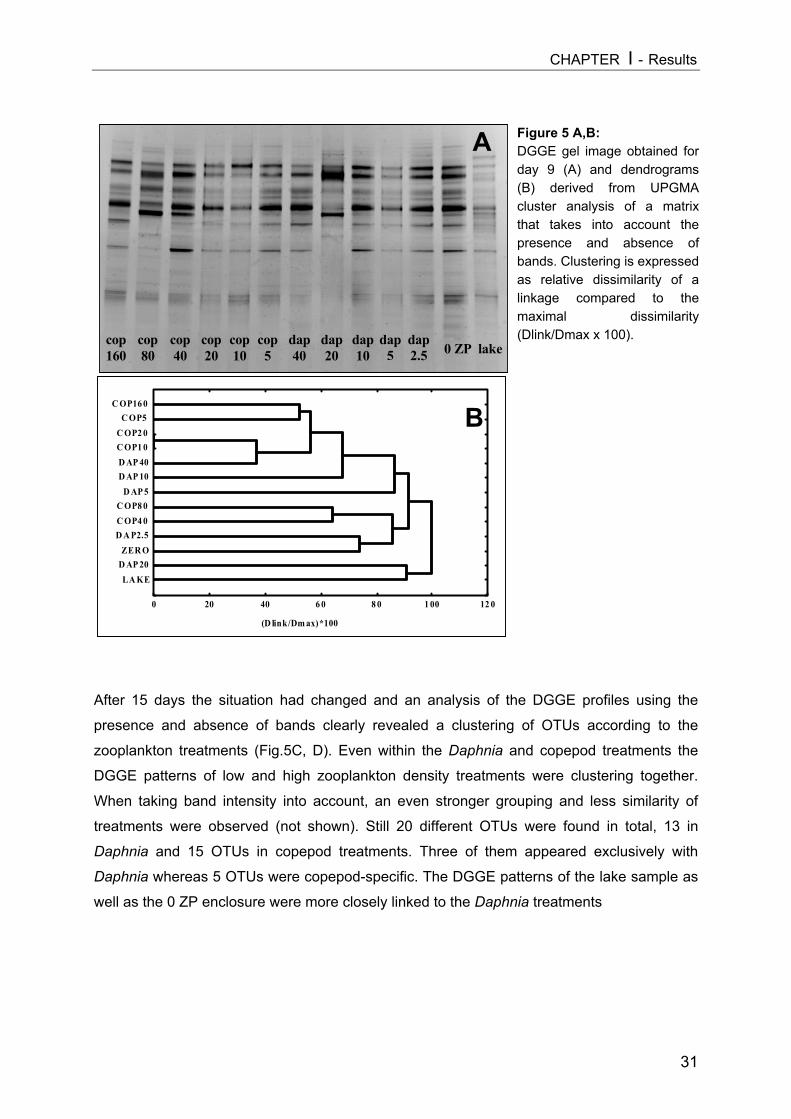
CHAPTER I - Results
31
After 15 days the situation had changed and an analysis of the DGGE profiles using the
presence and absence of bands clearly revealed a clustering of OTUs according to the
zooplankton treatments (Fig.5C, D). Even within the Daphnia and copepod treatments the
DGGE patterns of low and high zooplankton density treatments were clustering together.
When taking band intensity into account, an even stronger grouping and less similarity of
treatments were observed (not shown). Still 20 different OTUs were found in total, 13 in
Daphnia and 15 OTUs in copepod treatments. Three of them appeared exclusively with
Daphnia whereas 5 OTUs were copepod-specific. The DGGE patterns of the lake sample as
well as the 0 ZP enclosure were more closely linked to the Daphnia treatments
(D link/Dm ax)*100
LA KE D AP 20 ZER O D A P2.5 C OP4 0 C OP8 0 D AP 5
D AP 10 D AP 40 C OP1 0 C OP2 0 C OP5
C OP16 0
0 20 40 6 0 8 0 1 00 12 0
0 ZP dap 2.5
dap 5
dap 10
dap 20
dap 40
cop 5
cop 10
cop 20
cop 40
cop 80
cop 160 lake
A
B
Figure 5 A,B:DGGE gel image obtained forday 9 (A) and dendrograms(B) derived from UPGMAcluster analysis of a matrixthat takes into account thepresence and absence ofbands. Clustering is expressedas relative dissimilarity of alinkage compared to themaximal dissimilarity(Dlink/Dmax x 100).
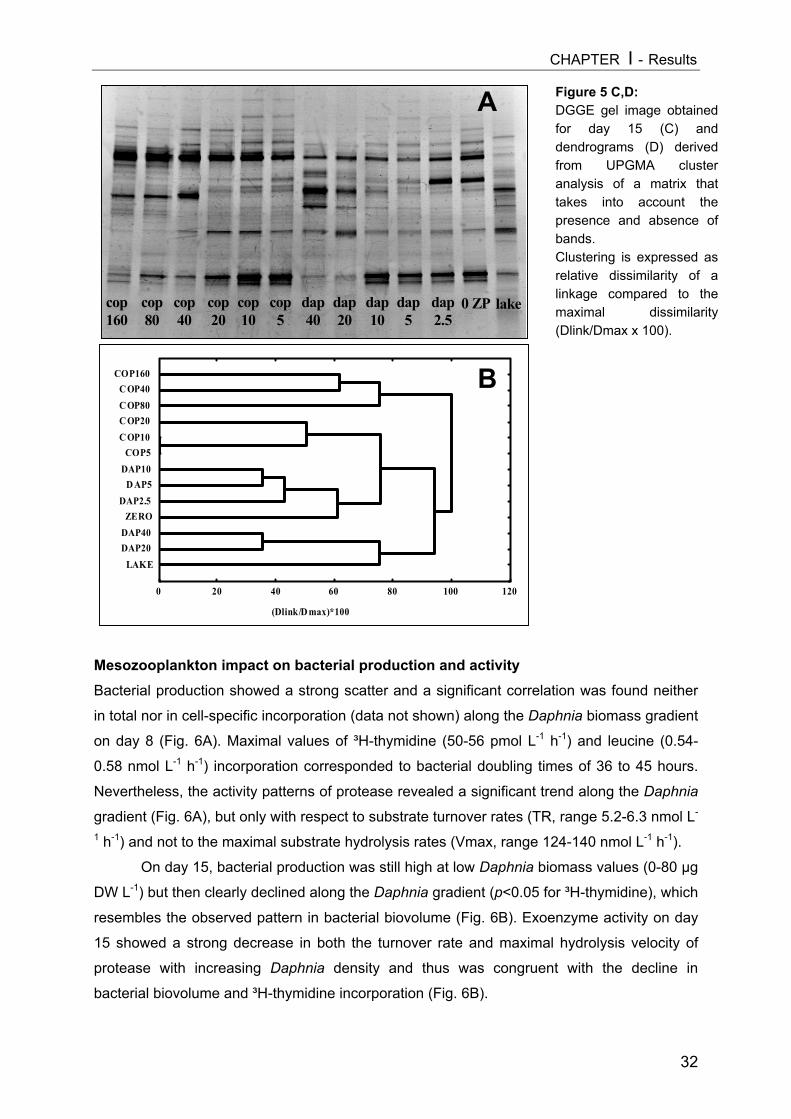
CHAPTER I - Results
32
Mesozooplankton impact on bacterial production and activityBacterial production showed a strong scatter and a significant correlation was found neither
in total nor in cell-specific incorporation (data not shown) along the Daphnia biomass gradient
on day 8 (Fig. 6A). Maximal values of ³H-thymidine (50-56 pmol L-1 h-1) and leucine (0.54-
0.58 nmol L-1 h-1) incorporation corresponded to bacterial doubling times of 36 to 45 hours.
Nevertheless, the activity patterns of protease revealed a significant trend along the Daphnia
gradient (Fig. 6A), but only with respect to substrate turnover rates (TR, range 5.2-6.3 nmol L-
1 h-1) and not to the maximal substrate hydrolysis rates (Vmax, range 124-140 nmol L-1 h-1).
On day 15, bacterial production was still high at low Daphnia biomass values (0-80 µg
DW L-1) but then clearly declined along the Daphnia gradient (p<0.05 for ³H-thymidine), which
resembles the observed pattern in bacterial biovolume (Fig. 6B). Exoenzyme activity on day
15 showed a strong decrease in both the turnover rate and maximal hydrolysis velocity of
protease with increasing Daphnia density and thus was congruent with the decline in
bacterial biovolume and ³H-thymidine incorporation (Fig. 6B).
cop160
cop80
cop40
cop20
cop10
cop5
dap40
dap20
dap10
dap5
dap2.5
0 ZP lake
(Dlink/D max)*100
LAKE DAP20 DAP40 ZERO DAP2.5 D AP5
DAP10 COP5 C OP10 C OP20 C OP80 C OP40
COP160
0 20 40 60 80 100 120
B
A Figure 5 C,D:DGGE gel image obtainedfor day 15 (C) anddendrograms (D) derivedfrom UPGMA clusteranalysis of a matrix thattakes into account thepresence and absence ofbands.Clustering is expressed asrelative dissimilarity of alinkage compared to themaximal dissimilarity(Dlink/Dmax x 100).
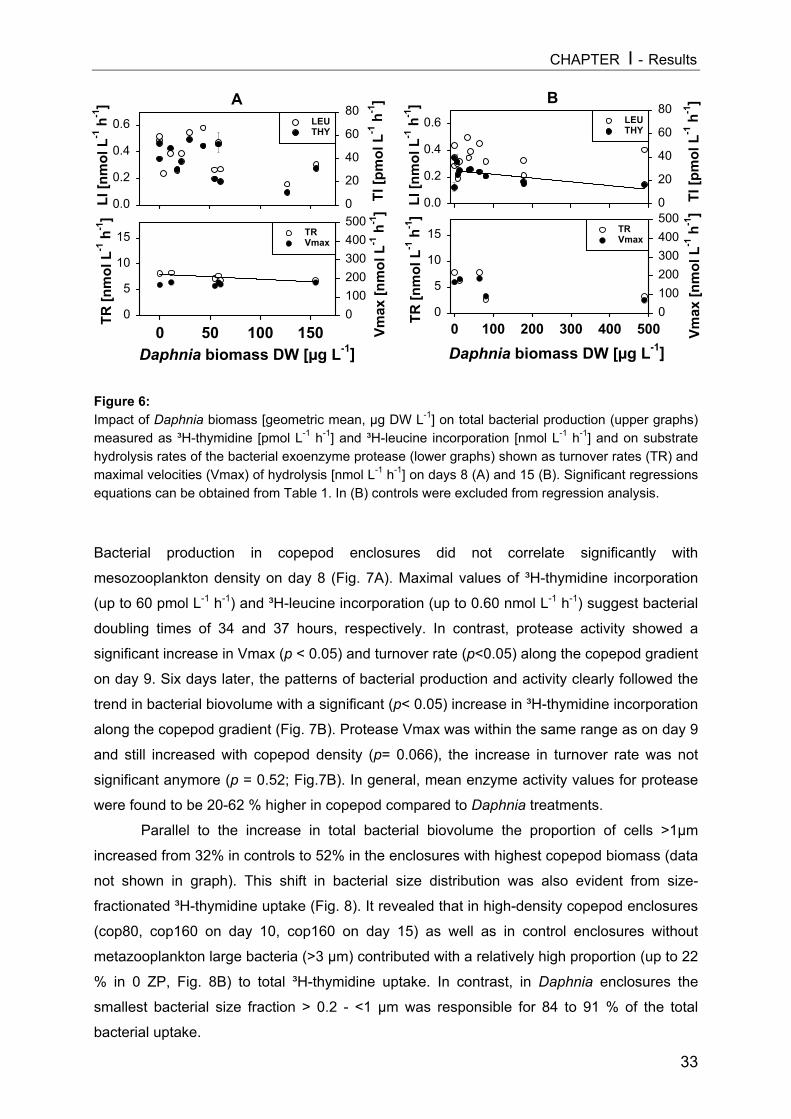
CHAPTER I - Results
33
Figure 6: Impact of Daphnia biomass [geometric mean, µg DW L-1] on total bacterial production (upper graphs)measured as ³H-thymidine [pmol L-1 h-1] and ³H-leucine incorporation [nmol L-1 h-1] and on substratehydrolysis rates of the bacterial exoenzyme protease (lower graphs) shown as turnover rates (TR) andmaximal velocities (Vmax) of hydrolysis [nmol L-1 h-1] on days 8 (A) and 15 (B). Significant regressionsequations can be obtained from Table 1. In (B) controls were excluded from regression analysis.
Bacterial production in copepod enclosures did not correlate significantly with
mesozooplankton density on day 8 (Fig. 7A). Maximal values of ³H-thymidine incorporation
(up to 60 pmol L-1 h-1) and ³H-leucine incorporation (up to 0.60 nmol L-1 h-1) suggest bacterial
doubling times of 34 and 37 hours, respectively. In contrast, protease activity showed a
significant increase in Vmax (p < 0.05) and turnover rate (p<0.05) along the copepod gradient
on day 9. Six days later, the patterns of bacterial production and activity clearly followed the
trend in bacterial biovolume with a significant (p< 0.05) increase in ³H-thymidine incorporation
along the copepod gradient (Fig. 7B). Protease Vmax was within the same range as on day 9
and still increased with copepod density (p= 0.066), the increase in turnover rate was not
significant anymore (p = 0.52; Fig.7B). In general, mean enzyme activity values for protease
were found to be 20-62 % higher in copepod compared to Daphnia treatments.
Parallel to the increase in total bacterial biovolume the proportion of cells >1µm
increased from 32% in controls to 52% in the enclosures with highest copepod biomass (data
not shown in graph). This shift in bacterial size distribution was also evident from size-
fractionated ³H-thymidine uptake (Fig. 8). It revealed that in high-density copepod enclosures
(cop80, cop160 on day 10, cop160 on day 15) as well as in control enclosures without
metazooplankton large bacteria (>3 µm) contributed with a relatively high proportion (up to 22
% in 0 ZP, Fig. 8B) to total ³H-thymidine uptake. In contrast, in Daphnia enclosures the
smallest bacterial size fraction > 0.2 - <1 µm was responsible for 84 to 91 % of the total
bacterial uptake.
ALI
[nm
ol L
-1 h
-1]
0.0
0.2
0.4
0.6
TI [p
mol
L-1
h-1
]
0
20
40
60
80LEUTHY
B
LI [n
mol
L-1
h-1
]
0.0
0.2
0.4
0.6
TI [p
mol
L-1
h-1
]
0
20
40
60
80
Daphnia biomass DW [µg L-1]0 50 100 150
TR [n
mol
L-1
h-1
]
0
5
10
15
Vmax
[nm
ol L
-1 h
-1]
0100200300400500
Daphnia biomass DW [µg L-1]0 100 200 300 400 500
TR [n
mol
L-1
h-1
]
0
5
10
15
Vmax
[nm
ol L
-1 h
-1]
0100200300400500
TRVmax
LEUTHY
TRVmax
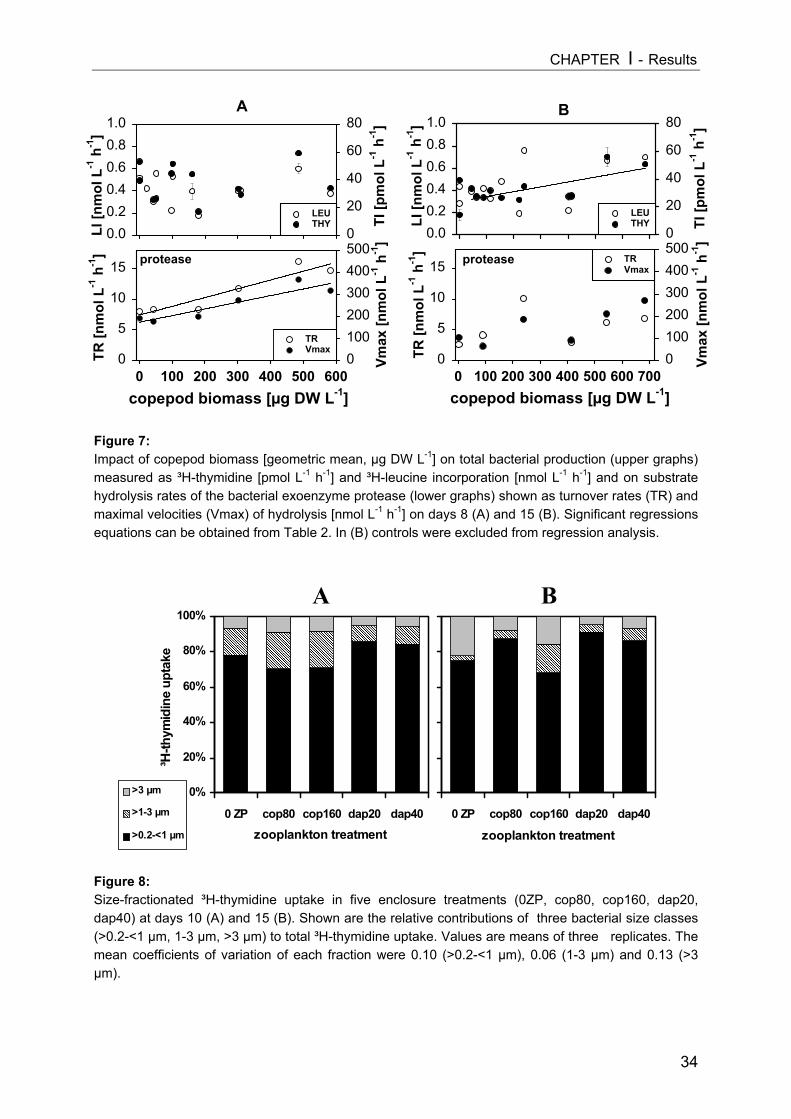
CHAPTER I - Results
34
Figure 7: Impact of copepod biomass [geometric mean, µg DW L-1] on total bacterial production (upper graphs)measured as ³H-thymidine [pmol L-1 h-1] and ³H-leucine incorporation [nmol L-1 h-1] and on substratehydrolysis rates of the bacterial exoenzyme protease (lower graphs) shown as turnover rates (TR) andmaximal velocities (Vmax) of hydrolysis [nmol L-1 h-1] on days 8 (A) and 15 (B). Significant regressionsequations can be obtained from Table 2. In (B) controls were excluded from regression analysis.
Figure 8: Size-fractionated ³H-thymidine uptake in five enclosure treatments (0ZP, cop80, cop160, dap20,dap40) at days 10 (A) and 15 (B). Shown are the relative contributions of three bacterial size classes(>0.2-<1 µm, 1-3 µm, >3 µm) to total ³H-thymidine uptake. Values are means of three replicates. Themean coefficients of variation of each fraction were 0.10 (>0.2-<1 µm), 0.06 (1-3 µm) and 0.13 (>3µm).
��������������������
���������� ������������������������������
����������������������
����������������������
0%
20%
40%
60%
80%
100%
0 ZP cop80 cop160 dap20 dap40
zooplankton treatment
������������������������������
������������������������������
������������������������������
����������������������
����������������������
0%
20%
40%
60%
80%
100%
0 ZP cop80 cop160 dap20 dap40zooplankton treatment
³H-th
ymid
ine
upta
ke
>3 µm������ >1-3 µm
>0.2-<1 µm
A B
A BLI
[nm
ol L
-1 h
-1]
0.00.20.40.60.81.0
TI [p
mol
L-1
h-1
]
0
20
40
60
80
LEUTHY LI
[nm
ol L
-1 h
-1]
0.00.20.40.60.81.0
TI [p
mol
L-1
h-1
]
0
20
40
60
80
LEUTHY
protease
copepod biomass [µg DW L-1]0 100 200 300 400 500 600
TR [n
mol
L-1
h-1
]
0
5
10
15
Vmax
[nm
ol L
-1 h
-1]
0100200300400500
TRVmax
protease
copepod biomass [µg DW L-1]0 100 200 300 400 500 600 700
TR [n
mol
L-1
h-1
]
0
5
10
15
Vmax
[nm
ol L
-1 h
-1]
0100200300400500
TRVmax
CHAPTER I - Discussion
35
DISCUSSION While many previous studies used small-scale microcosms for food web experiments, here
the effects of different mesozooplankton guilds were analyzed on a larger scale by using
enclosures of a sufficiently large volume to provide more reliable predictions of whole-lake
phenomena (Sarnelle 1997). Furthermore, this mesocosm experiment was based on a
gradient design of mesozooplankton concentrations and so allowed a finer resolution of
critical densities, which are able to cause significant responses in the microbial components.
The zooplankton concentrations which developed in the enclosures were, with the exception
of the highest densities at the end of the experiment, within the range reported from the study
lake (Fussmann 1996). Also, the observed protozoan and bacterial concentrations in the
different enclosures, as well as bacterial growth rates, were within the range found normally
in this mesotrophic lake (Jürgens et al. 1994a). Therefore, the extent of the observed
responses can be considered realistic for the lake situation. The chosen time-points for a
detailed analysis of the microbial community structure (9 and 15 days of experimental
duration) corresponded to approximately 3-8 generations of bacteria and of the different
functional groups of protozoans. Previous experiments at this study site suggest that this
scale is appropriate to demonstrate both direct short-term predation impacts of the
metazooplankton, cascading effects via protozoans to bacteria as well as bacterial
adaptations towards changes in predation pressure (Jürgens et al. 1994a).
Contrasting effects of Daphnia and copepods on protozooplanktonStudies on the effect of cladocerans and copepods on populations of protozoa in lakes have
mostly shown significant impacts of both crustacean groups on ciliates and other
microplankton (Adrian and Schneider-Olt 1999; Burns and Schallenberg 2001a; Yoshida et
al. 2001). Our experiment also found that both zooplankton guilds affected the ciliate
community. By the second time point higher Daphnia densities had strongly reduced the total
ciliate abundance, thereby confirming other studies, which have proved that Daphnia exerts
efficient top-down control on ciliate assemblages (Wickham 1998, Burns & Schallenberg,
2001a). For ciliates it is known that their species and size composition influences their
vulnerability to Daphnia and calanoid copepods (Burns and Gilbert 1993, Jack and Gilbert
1993, Wiackowski et al. 1994). This is mainly due to the fact that a number of species have
jumping behavior that reduces their vulnerability to predators (Gilbert 1994). In our
experiments medium-sized Oligotrichida with bristles for jumping, such as Halteria spp. (or
Pelagohalteria spp.), also remained in highest Daphnia density treatments.
In contrast to Daphnia, differential and selective grazing of copepods induced a shift
in size and composition of the ciliate assemblage. The ciliate size-fraction 20-40 µm was
most efficiently reduced by copepod predation. This fraction comprised important oligotrich
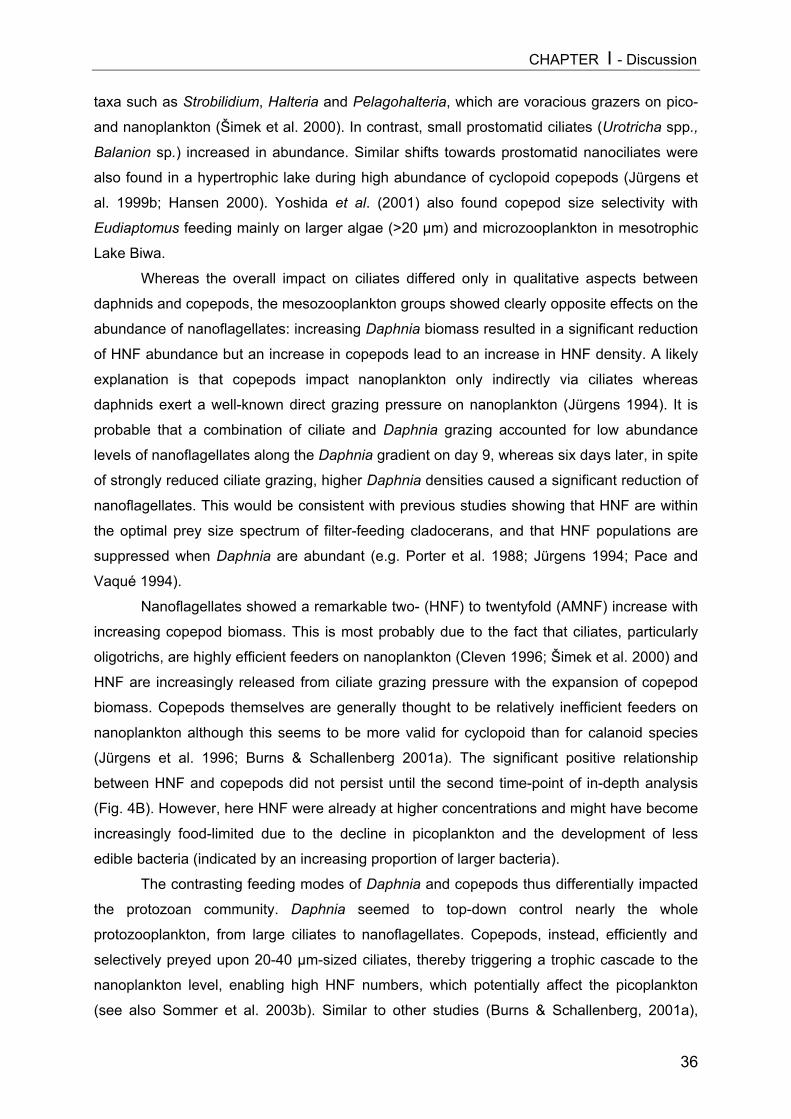
CHAPTER I - Discussion
36
taxa such as Strobilidium, Halteria and Pelagohalteria, which are voracious grazers on pico-
and nanoplankton (Šimek et al. 2000). In contrast, small prostomatid ciliates (Urotricha spp.,
Balanion sp.) increased in abundance. Similar shifts towards prostomatid nanociliates were
also found in a hypertrophic lake during high abundance of cyclopoid copepods (Jürgens et
al. 1999b; Hansen 2000). Yoshida et al. (2001) also found copepod size selectivity with
Eudiaptomus feeding mainly on larger algae (>20 µm) and microzooplankton in mesotrophic
Lake Biwa.
Whereas the overall impact on ciliates differed only in qualitative aspects between
daphnids and copepods, the mesozooplankton groups showed clearly opposite effects on the
abundance of nanoflagellates: increasing Daphnia biomass resulted in a significant reduction
of HNF abundance but an increase in copepods lead to an increase in HNF density. A likely
explanation is that copepods impact nanoplankton only indirectly via ciliates whereas
daphnids exert a well-known direct grazing pressure on nanoplankton (Jürgens 1994). It is
probable that a combination of ciliate and Daphnia grazing accounted for low abundance
levels of nanoflagellates along the Daphnia gradient on day 9, whereas six days later, in spite
of strongly reduced ciliate grazing, higher Daphnia densities caused a significant reduction of
nanoflagellates. This would be consistent with previous studies showing that HNF are within
the optimal prey size spectrum of filter-feeding cladocerans, and that HNF populations are
suppressed when Daphnia are abundant (e.g. Porter et al. 1988; Jürgens 1994; Pace and
Vaqué 1994).
Nanoflagellates showed a remarkable two- (HNF) to twentyfold (AMNF) increase with
increasing copepod biomass. This is most probably due to the fact that ciliates, particularly
oligotrichs, are highly efficient feeders on nanoplankton (Cleven 1996; Šimek et al. 2000) and
HNF are increasingly released from ciliate grazing pressure with the expansion of copepod
biomass. Copepods themselves are generally thought to be relatively inefficient feeders on
nanoplankton although this seems to be more valid for cyclopoid than for calanoid species
(Jürgens et al. 1996; Burns & Schallenberg 2001a). The significant positive relationship
between HNF and copepods did not persist until the second time-point of in-depth analysis
(Fig. 4B). However, here HNF were already at higher concentrations and might have become
increasingly food-limited due to the decline in picoplankton and the development of less
edible bacteria (indicated by an increasing proportion of larger bacteria).
The contrasting feeding modes of Daphnia and copepods thus differentially impacted
the protozoan community. Daphnia seemed to top-down control nearly the whole
protozooplankton, from large ciliates to nanoflagellates. Copepods, instead, efficiently and
selectively preyed upon 20-40 µm-sized ciliates, thereby triggering a trophic cascade to the
nanoplankton level, enabling high HNF numbers, which potentially affect the picoplankton
(see also Sommer et al. 2003b). Similar to other studies (Burns & Schallenberg, 2001a),
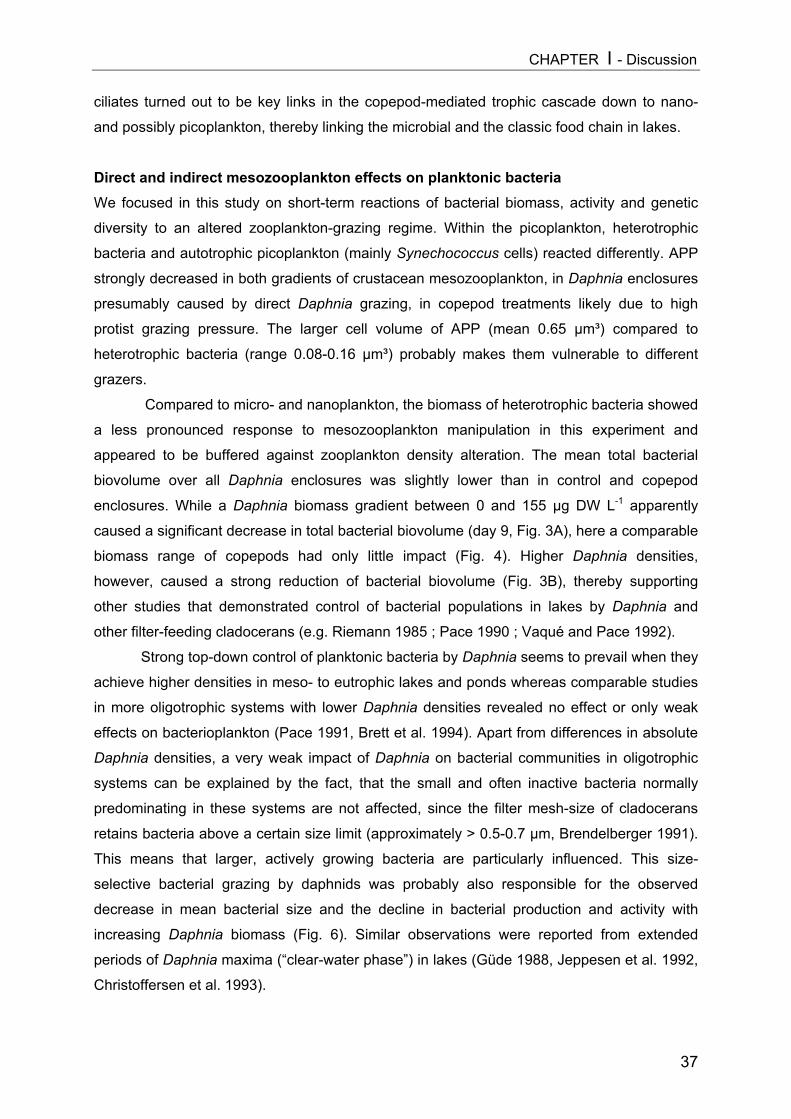
CHAPTER I - Discussion
37
ciliates turned out to be key links in the copepod-mediated trophic cascade down to nano-
and possibly picoplankton, thereby linking the microbial and the classic food chain in lakes.
Direct and indirect mesozooplankton effects on planktonic bacteria We focused in this study on short-term reactions of bacterial biomass, activity and genetic
diversity to an altered zooplankton-grazing regime. Within the picoplankton, heterotrophic
bacteria and autotrophic picoplankton (mainly Synechococcus cells) reacted differently. APP
strongly decreased in both gradients of crustacean mesozooplankton, in Daphnia enclosures
presumably caused by direct Daphnia grazing, in copepod treatments likely due to high
protist grazing pressure. The larger cell volume of APP (mean 0.65 µm³) compared to
heterotrophic bacteria (range 0.08-0.16 µm³) probably makes them vulnerable to different
grazers.
Compared to micro- and nanoplankton, the biomass of heterotrophic bacteria showed
a less pronounced response to mesozooplankton manipulation in this experiment and
appeared to be buffered against zooplankton density alteration. The mean total bacterial
biovolume over all Daphnia enclosures was slightly lower than in control and copepod
enclosures. While a Daphnia biomass gradient between 0 and 155 µg DW L-1 apparently
caused a significant decrease in total bacterial biovolume (day 9, Fig. 3A), here a comparable
biomass range of copepods had only little impact (Fig. 4). Higher Daphnia densities,
however, caused a strong reduction of bacterial biovolume (Fig. 3B), thereby supporting
other studies that demonstrated control of bacterial populations in lakes by Daphnia and
other filter-feeding cladocerans (e.g. Riemann 1985 ; Pace 1990 ; Vaqué and Pace 1992).
Strong top-down control of planktonic bacteria by Daphnia seems to prevail when they
achieve higher densities in meso- to eutrophic lakes and ponds whereas comparable studies
in more oligotrophic systems with lower Daphnia densities revealed no effect or only weak
effects on bacterioplankton (Pace 1991, Brett et al. 1994). Apart from differences in absolute
Daphnia densities, a very weak impact of Daphnia on bacterial communities in oligotrophic
systems can be explained by the fact, that the small and often inactive bacteria normally
predominating in these systems are not affected, since the filter mesh-size of cladocerans
retains bacteria above a certain size limit (approximately > 0.5-0.7 µm, Brendelberger 1991).
This means that larger, actively growing bacteria are particularly influenced. This size-
selective bacterial grazing by daphnids was probably also responsible for the observed
decrease in mean bacterial size and the decline in bacterial production and activity with
increasing Daphnia biomass (Fig. 6). Similar observations were reported from extended
periods of Daphnia maxima (“clear-water phase”) in lakes (Güde 1988, Jeppesen et al. 1992,
Christoffersen et al. 1993).
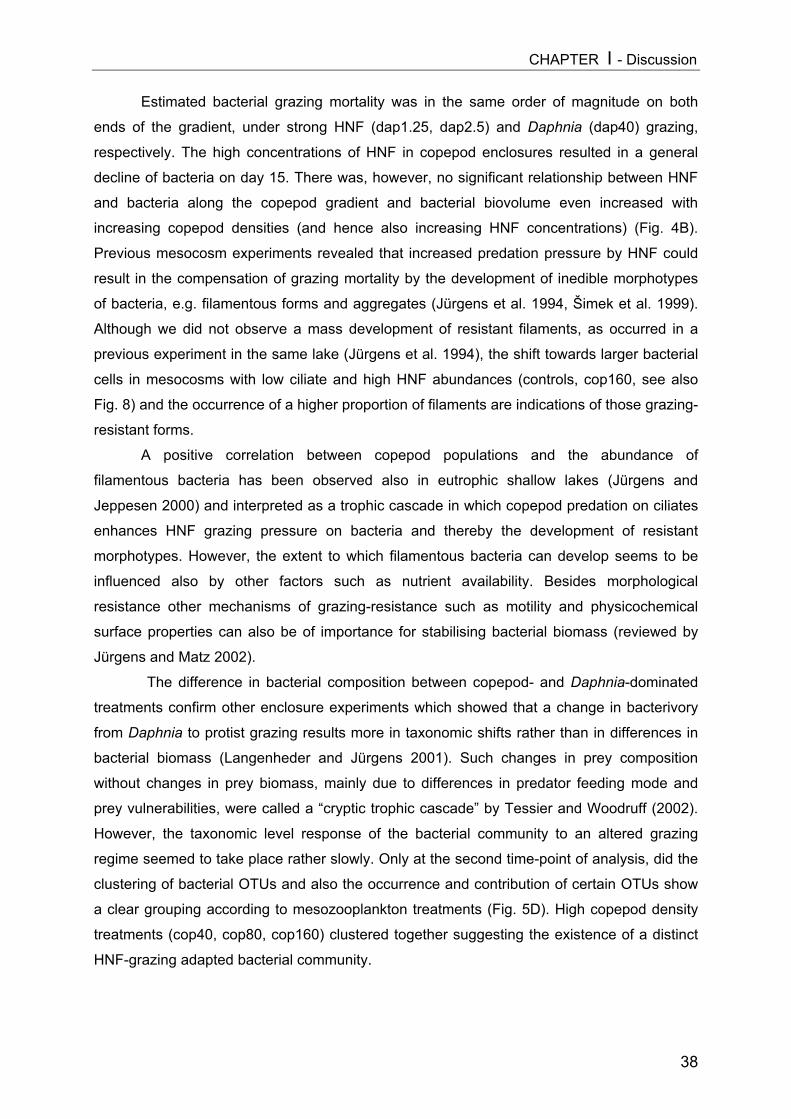
CHAPTER I - Discussion
38
Estimated bacterial grazing mortality was in the same order of magnitude on both
ends of the gradient, under strong HNF (dap1.25, dap2.5) and Daphnia (dap40) grazing,
respectively. The high concentrations of HNF in copepod enclosures resulted in a general
decline of bacteria on day 15. There was, however, no significant relationship between HNF
and bacteria along the copepod gradient and bacterial biovolume even increased with
increasing copepod densities (and hence also increasing HNF concentrations) (Fig. 4B).
Previous mesocosm experiments revealed that increased predation pressure by HNF could
result in the compensation of grazing mortality by the development of inedible morphotypes
of bacteria, e.g. filamentous forms and aggregates (Jürgens et al. 1994, Šimek et al. 1999).
Although we did not observe a mass development of resistant filaments, as occurred in a
previous experiment in the same lake (Jürgens et al. 1994), the shift towards larger bacterial
cells in mesocosms with low ciliate and high HNF abundances (controls, cop160, see also
Fig. 8) and the occurrence of a higher proportion of filaments are indications of those grazing-
resistant forms.
A positive correlation between copepod populations and the abundance of
filamentous bacteria has been observed also in eutrophic shallow lakes (Jürgens and
Jeppesen 2000) and interpreted as a trophic cascade in which copepod predation on ciliates
enhances HNF grazing pressure on bacteria and thereby the development of resistant
morphotypes. However, the extent to which filamentous bacteria can develop seems to be
influenced also by other factors such as nutrient availability. Besides morphological
resistance other mechanisms of grazing-resistance such as motility and physicochemical
surface properties can also be of importance for stabilising bacterial biomass (reviewed by
Jürgens and Matz 2002).
The difference in bacterial composition between copepod- and Daphnia-dominated
treatments confirm other enclosure experiments which showed that a change in bacterivory
from Daphnia to protist grazing results more in taxonomic shifts rather than in differences in
bacterial biomass (Langenheder and Jürgens 2001). Such changes in prey composition
without changes in prey biomass, mainly due to differences in predator feeding mode and
prey vulnerabilities, were called a “cryptic trophic cascade” by Tessier and Woodruff (2002).
However, the taxonomic level response of the bacterial community to an altered grazing
regime seemed to take place rather slowly. Only at the second time-point of analysis, did the
clustering of bacterial OTUs and also the occurrence and contribution of certain OTUs show
a clear grouping according to mesozooplankton treatments (Fig. 5D). High copepod density
treatments (cop40, cop80, cop160) clustered together suggesting the existence of a distinct
HNF-grazing adapted bacterial community.
CHAPTER I - Discussion
39
The increasing bacterial activity and production, as seen from thymidine and leucine
incorporation as well as from exoenzymatic activity (Fig. 7) along the copepod gradient points
to stimulation of bacteria by protist grazing. The level of protease activity in copepod
treatments was considerably higher than in Daphnia treatments. This can be attributed to an
increase in bacterial biomass as well as enhanced bacterial substrate demand. Furthermore,
protease excretions of HNF and AMNF can contribute to the extracellular enzyme pool
(Karner et al. 1994). Aquatic bacteria are subject to a range of potential impact modes, and
could also have been affected by varying substrate supply due to differences in algal
communities and different metazoan and protozoan DOC (dissolved organic carbon) release
(sloppy feeding, excretion, Nagata 2000). Nevertheless, we think that the different predation
impacts by metazoans (Daphnia bags) and protozoans (copepod bags) were probably major
factors shaping the structure of the bacterial assemblages in this experiment.
While the existence of clear trophic cascades has been shown between various
components in aquatic systems, most often from fish via zooplankton to phytoplankton
(Carpenter et al. 1985, Pace et al. 1999), there is considerably less knowledge about the
extent of cascading effects on heterotrophic microorganisms, and bacterial assemblages in
particular are difficult to integrate into food web patterns. We found clear differences with
respect to mesozooplankton effects in Daphnia versus copepod-dominated communities on
the microbial food web structure. Our results confirm the general concept that microbial food
webs differ markedly between systems with and without abundant Daphnia populations
(Stockner and Porter 1988; Pace 1990; Riemann and Christoffersen 1993). The fate of
bacterial production in freshwater systems is determined by the composition of higher trophic
levels and the dominant selective pressure can be exerted by protist or Daphnia grazing. Our
study additionally revealed that copepod-dominated zooplankton can trigger a clear predatory
cascade involving strong and opposing fluctuations in micro- and nanoplankton.
Our results also confirm previous studies that strong effects of planktonic food web
structure are mainly found for populations of ciliates and flagellates. The regulation of
bacterioplankton seems to function quite differently, judged from the weak effects of an
altered grazer community on bacteria in enclosure experiments (Pace 1991; Wickham 1998;
Adrian et al. 2001) and whole lake studies (Pace and Cole 1996). Also in this study the
heterotrophic bacterial assemblage proved quite stable, reacted slowly towards an altered
grazing regime and showed strongest biomass responses in treatments with lowest and
highest mesozooplankton biomass. Weak food web effects on planktonic bacteria have been
interpreted as truncation of the trophic cascade at the level of protozoans (Pace 1991;
Wickham 1998). However, by considering several bacterial response variables, such as
bacterial community composition and activity, it became obvious in our experiment that
significant effects did occur at the bacterial level. Evidence for trophic effects on bacterial
CHAPTER I - Discussion
40
composition comes also from other studies, which considered bacterial community structure
(Cochran-Stafira and von Ende 1998; Šimek et al. 1999; Langenheder and Jürgens 2001).
These results confirm the importance of heterogeneity within bacterial communities and imply
that true trophic cascades in the community sense (Strong 1992) are the exception rather
than the rule for planktonic bacteria. Instead, there presumably occur, in response to altered
biological interactions, shifts and adaptations within bacterial assemblages, which involve
changes in species composition, phenotypic characters and physiological activities.
IIChapter 2
Lake
– microbial food
web in spring
Daphnia
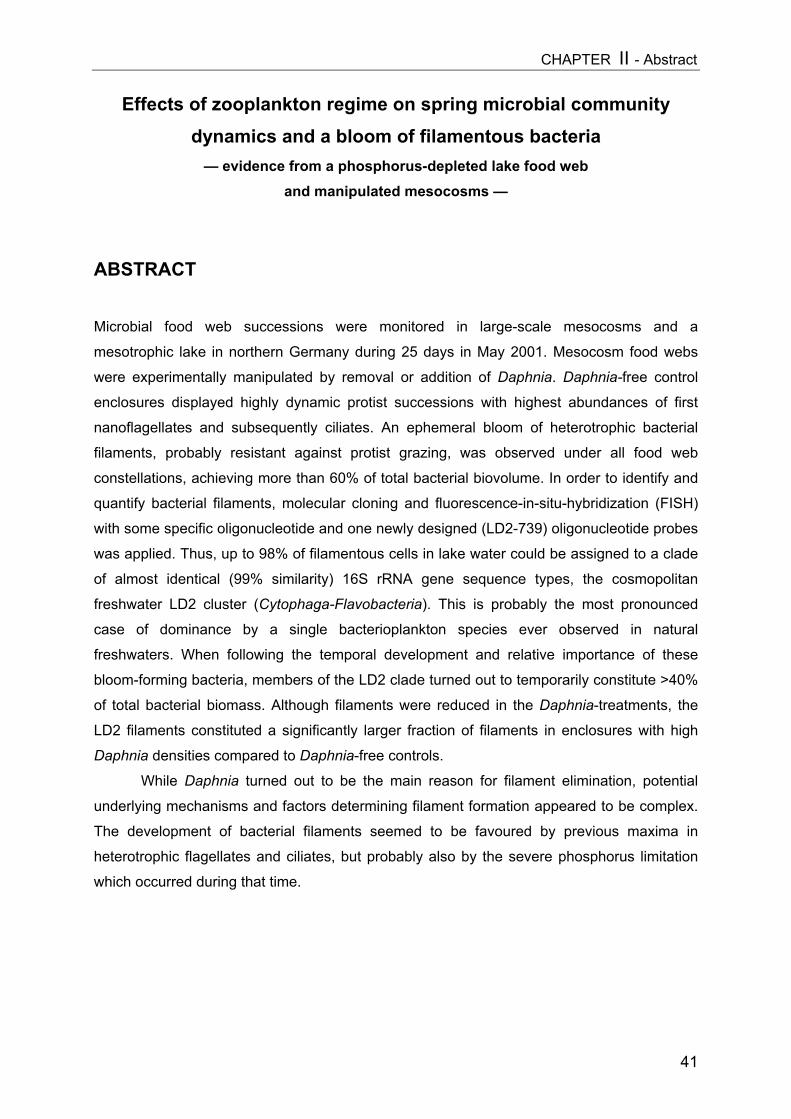
CHAPTER II - Abstract
41
Effects of zooplankton regime on spring microbial communitydynamics and a bloom of filamentous bacteria
— evidence from a phosphorus-depleted lake food weband manipulated mesocosms —
ABSTRACT
Microbial food web successions were monitored in large-scale mesocosms and a
mesotrophic lake in northern Germany during 25 days in May 2001. Mesocosm food webs
were experimentally manipulated by removal or addition of Daphnia. Daphnia-free control
enclosures displayed highly dynamic protist successions with highest abundances of first
nanoflagellates and subsequently ciliates. An ephemeral bloom of heterotrophic bacterial
filaments, probably resistant against protist grazing, was observed under all food web
constellations, achieving more than 60% of total bacterial biovolume. In order to identify and
quantify bacterial filaments, molecular cloning and fluorescence-in-situ-hybridization (FISH)
with some specific oligonucleotide and one newly designed (LD2-739) oligonucleotide probes
was applied. Thus, up to 98% of filamentous cells in lake water could be assigned to a clade
of almost identical (99% similarity) 16S rRNA gene sequence types, the cosmopolitan
freshwater LD2 cluster (Cytophaga-Flavobacteria). This is probably the most pronounced
case of dominance by a single bacterioplankton species ever observed in natural
freshwaters. When following the temporal development and relative importance of these
bloom-forming bacteria, members of the LD2 clade turned out to temporarily constitute >40%
of total bacterial biomass. Although filaments were reduced in the Daphnia-treatments, the
LD2 filaments constituted a significantly larger fraction of filaments in enclosures with high
Daphnia densities compared to Daphnia-free controls.
While Daphnia turned out to be the main reason for filament elimination, potential
underlying mechanisms and factors determining filament formation appeared to be complex.
The development of bacterial filaments seemed to be favoured by previous maxima in
heterotrophic flagellates and ciliates, but probably also by the severe phosphorus limitation
which occurred during that time.
CHAPTER II - Introduction
42
INTRODUCTIONCladocerans and copepods as the dominant freshwater mesozooplankton groups with
differing feeding selectivity can exert contrasting trophic and structuring impact on the
autotrophic and heterotrophic communities of lower trophic levels (see chapter I). In the
summer experiment, Daphnia grazing top-down impacted all microbial food web components
and reduced ciliates, nanoplankton as well as auto- and heterotrophic picoplankton.
Among the variety of factors tightly regulating bacterial production and mortality
(reviewed by Fuhrman and Noble 1999), predation is a major shaping force for the
phenotypic and genotypic composition of bacterial communities (reviewed by Jürgens and
Matz 2002). The response mode of bacterioplankton to top-down effects of mesozooplankton
and increasing numbers of protozoans can be largely affected by the phenotypic and
genotypic composition of the bacterial assemblage and the existence or development of
resistance traits against protist grazing (Jürgens and Güde 1994, Hahn and Höfle 2001).
Besides motility and physicochemical surface properties (Matz and Jürgens 2001, Matz et al.
2002) the aspect of size, e.g. the development of very small cells (ultramicrobacteria, passive
resistance, Torrella and Morita 1981, Hahn et al. 2003) or long filaments and aggregates, is
among the most commonly observed morphological adaptations influencing the susceptibility
of bacteria mainly to HNF grazing (Jürgens and Güde 1994).
Most small protists preferentially feed on bacteria of 1-3 µm in length Gonzalez et al.
1990, Šimek and Chrzanowski 1992). Heterotrophic nanoflagellates (HNF), the most
important bacterivores in plank tonic systems, have an upper prey size limit in the range 4-10
µm (Hahn et al. 1999, Wu et al. 2004). Thus, filamentous bacterioplankton can be considered
as protozoan grazing-resistant bacteria and are clearly favoured under intense grazing by
hetero- or mixotrophic nanoflagellates (e.g. Jürgens and Güde 1994, Šimek et al. 2001,
Jürgens and Matz 2002) or bacterivorous ciliates (Shikano et al. 1990, Posch et al. 2001).
Due to their size, on the other hand, filamentous bacteria are susceptible to direct removal by
filter-feeding zooplankton (in particular cladocerans) and reduced Daphnia-related mortality
of small bacterial competitors (Güde 1988, Jürgens 1994).
The occurrence of filamentous or threadlike bacteria as an ecologically distinct and
often dominant microbial component is documented mostly from meso- and eutrophic
freshwater systems (Jürgens and Güde 1994, Langenheder and Jürgens 2001, Hahn and
Höfle 2001). They have also been reported from ultraoligotrophic (Pernthaler et al. 1998),
hypertrophic (Sommaruga and Psenner 1995) and acidified (Vrba et al. 2003) freshwater
habitats, but have only rarely been found in marine systems (e.g. Caron et al. 1988,
Engström-Öst et al. 2002). Phenotypic plasticity can be involved in filament formation (Hahn
et al. 1999) but some bacteria also have a permanently filamentous morphotype (e.g.
Ancalomicrobium sp., Bianchi 1989).
CHAPTER II - Introduction
43
However, the regulating mechanisms of filament formation and the importance of top-down
and bottom-up factors remain unclear. Of course, the extent to which trophic impact can
cascade down to bacterial level is dependent also on other factors like seasonal differences
in food web structure (e.g. predator composition) and abiotic conditions, mainly characterized
by different scenarios of nutrient limitation and temperature regime. Recent findings obtained
from a chemostat study (Matz and Jürgens 2003) revealed combined effects of nutrient
limitation and grazing as major determinants of bacterial community structure. Thereby,
filamentous bacterial forms have been observed to dominate in laboratory chemostats under
conditions of P-limitation and grazing.
However, high numbers of filamentous bacteria have earlier been observed in
Schöhsee in spring (Jürgens, unpubl.), but the overall patterns of their occurrence and their
trophic implications are still poorly understood and investigated. In this context, Langenheder
and Jürgens (2001) emphasised the need for species-specific probes in order to follow the
population dynamics of filament-forming bacteria in situ and to reveal the contribution of
phenotypic plasticity of certain taxa and real compositional changes in bacterial morphotype
shifts.
To distinguish between key populations of filamentous bacteria in different freshwater
systems and to elucidate their ecological role, it is necessary to develop identification
systems. Hence, the so-called "full-cycle rRNA approach" (Amann et al. 1995) was applied, a
combination of molecular tools including PCR amplification, cloning and sequencing of an
environmental sample and subsequent phylogenetic analysis of environmental sequence
types (Pernthaler et al. 2004). This procedure is followed by the design of specific rRNA-
targeted DNA probes, which can be used for whole-cell fluorescence in situ hybridization
(FISH) and microscopic visualization of selected bacterial subgroups, thereby allowing for the
distinction of bacterial morphotypes (Pernthaler et al. 1997a, Pernthaler et al. 1998).
In both the lake water column and the mesocosms a conspicuous bloom of these
filamentous bacteria was observed. A preliminary FISH analysis revealed that the majority of
these filaments were members of the Cytophaga-Flavobacterium cluster of the Bacteroidetes
(Pernthaler et al. 2004) and by application of the procedures named above dominant
filamentous phylotypes within this lineage could be identified and traced in their in situ
development under various food web scenarios (Pernthaler et al. 2004).
This study focuses on the structuring impact of cladoceran mesozooplankton on the
longer-term (25 days in spring) temporal performance of microbial food web components in
mesotrophic Schöhsee and zooplankton-manipulated mesocosms. In particular, patterns and
regulating factors of bacterial filament development (single taxon and morphotype level) will
be elucidated in the context of these planktonic food web successions and dynamics.
CHAPTER II - Methods
44
METHODSSamples were collected in May 2001 from the surface waters of Schöhsee, a mesotrophic
dimictic lake in northern Germany (area, 82 ha, maximum depth 30 m). In parallel, the spring
mesocosm experiment was maintained in Schöhsee (see chapter I) for 25 days (03.-
28.05.2001), again by establishing 24 enclosures with logarithmically scaled zooplankton
additions (copepods and cladocerans). This time, mesocosms were slightly smaller (2.5 m
length, 1.7 m³ volume) and did not have a conical end with a sediment trap. The filling of the
enclosures took place as described in chapter I.
However, in this experiment highest seeding densities of copepods and Daphnia were
80 and 20 individuals per liter, respectively. Instead of the cop160 and dap40 treatments (see
chapter I), lowest density treatments were replicated and 2 bags with a mixed zooplankton
community (“mix-enclosures”) consisting of 5 Daphnia and 20 copepods per liter (nominal
seeding densities) were introduced. Furthermore, there was no addition of phosphorus in the
beginning.
This chapter deals with the microbial food web succession in the lake, in Daphnia-free
controls (with protist grazing only; sometimes abbreviated with E10 and E24) and in
mesocosms with a strong development of Daphnia (dap5, seeding density 5 ind. L-1;
sometimes abbreviated with E12 and E19). Chapter V contains microbial food web
responses to copepod density gradients after 1 week.
The sampling of zooplankton and microbial food web organisms as well as the
measurement of chlorophyll a took place as described in chapter I. The fixation and
enumeration of ciliates and nanoflagellates, the preparation of DAPI slides and the
measurements of bacterial production (bacterial thymidine and leucine incorporation and
size-fractionated thymidine uptake) also followed the protocols given in chapter I. Respiratory
activity of bacteria in all mesocosms was determined two times (day 13 and 19) via the CTC-
method as described in chapter III). Abundances of bacteria and autotrophic picoplankton
(Synechococcus, data not shown in graph for reasons of clarity) were determined by flow
cytometry. More detailed information on fixation and measurement settings can be obtained
from chapter III.
Mean cell sizes of non-filamentous bacteria were determined for selected samples with a
semi-automated image analysis system (analySIS 3.0, Soft Imaging Systems, Münster,
Germany) linked to the epifluorescence microscope. Images were captured with a cooled
slow-scan charge-coupled device (CCD) camera (resolution, 1276 x 1008 pixel, 1 pixel =
0.05 µm in the microscopic image) at 1250x magnification, and filtered and binarized as
described in (Massana et al. 1997). Cell volumes were estimated according to Björnsen
(1986). Filamentous bacteria were counted in 4 size classes (<5 µm, 5-10 µm, 10-20 µm, >20
µm) from DAPI-stained slides (0.2 µm, see chapter I) using an ocular micrometer.
CHAPTER II - Methods
45
Total filament biovolume was estimated by multiplying the cell numbers within each size
class with a mean cell biovolume empirically determined by measuring at least 30 cells of
each size class at 1250 x magnification with an automated image analysis system (SIS,
Münster, Germany; see chapter I) and by assuming cylindrical geometry and a mean cell
width of 0.65 µm.
For fluorescence in situ hybridization (FISH) subsamples of 10-30 ml were fixed with
formaldehyde solution (final concentration, 2%) for <24 h at room temperature, filtered onto
white membrane filters (Type GTTP, diameter, 47 mm, pore size 0.2 µm, Millipore, Bedford,
Ma), rinsed with sterile Millipore water and stored at –20°C until further processing.
Nutrient analysis and TN:TP measurements were conducted by T. Hansen (IfM Kiel)
as described in chapters I and III. For DOC analysis, replicate water samples were filtered
through GF/F filters (Whatman, at 550°C for 24 h), collected in acid-rinsed (1M HCl) vials
(Packard) and immediately frozen. Measurements were performed at the Institute for Baltic
Research (Warnemünde) with a Shimadzu TOC5000 carbon analyser.
16S rRNA gene clone libraries (Pernthaler et al. 2004). For the construction of a 16S
rDNA clone library, 100 ml of formalin-fixed, unfiltered lake water obtained on May 19th was
filtered onto Durapore membrane filters (pore size, 0.2 µm, Millipore) and stored at -80°C
until further processing. DNA was extracted according to previously published protocols
(Schauer et al. 2000). Briefly, samples were pre-treated with sodium dodecyl sulfate,
lysozyme and proteinase K. Extraction was performed by phenol-chloroform-isoamyl alcohol
(25:24:1) followed by chloroform-isoamyl alcohol (24:1) and subsequent concentration and
rinsing. DNA concentration was quantified by agarose gel electrophoresis. 2 ng of extracted
DNA was used as template for the amplification of environmental 16s rRNA genes by
polymerase chain reaction (PCR). For PCR, 5 µl of bovine serum albumin (BSA) (stock
concentration, 3 mg ml-1), 5µl 10 x PCR buffer, 2µl dNTPs (stock concentration, 2.5 mM), 0.5
µl of the general bacterial primers GM3F and GM4R (Muyzer et al. 1993) (stock
concentration, 15 µM) and 0.25 µl of TaKaRa-Taq DNA polymerase (TaKaRa BIO Inc.,
Shiga, Japan) (stock concentration, 5 units per reaction) were adjusted to a final volume of
48 µl with sterile water.
The PCR was run on an Eppendorf Mastercycler (Eppendorf, Hamburg, Germany) at
the following conditions: 1 cycle at 94°C for 5min; 35 cycles at 94°C for 30 sec.; 47°C for 45
sec; 74°C for 1min 30 sec and 74°C for 10 min. The amplified rDNAs were purified using the
QIAquick PCR purification kit (QIAGEN, Hilden, Germany), inserted into the TOPO vector
(TOPO TA cloning kit, Invitrogen, Karlsruhe, Germany) and cloned into competent cells of E.
coli as described by the manufacturer. The transformed cells were plated on LB agar plates
containing 50 µg ml-1 ampicillin and incubated overnight at 37 ºC. The clones were screened
for right-sized inserts and plasmid preparations were done with the QIAprep Spin Miniprep Kit

CHAPTER II - Methods
46
(QIAGEN). For a first screening the plasmid DNAs were sequenced with the vector primer
M13F (5’-GTA AAA CGA CGG CCA G -3'). The obtained partial sequences were submitted
to the BLAST queuing system (http://www.ncbi.nlm.nih.gov/blast/blast.cgi) for a tentative
phylogenetic positioning. Nearly full-length sequences were obtained from those inserts that
were related to the Bacteroidetes by additional sequencing with the primers GM1F (Muyzer
et al. 1993) and M13R (5’-CAG GAA ACA GCT ATG AC -3').
Phylogenetic analysis and probe design was performed by Jakob Pernthaler (MPI
for Marine Microbiology, Bremen, Pernthaler et al. 2004). Partial sequences were assembled
manually using the software Sequencher (Gene Codes Corp., Ann Arbor, USA) and tested
for chimeras through the Ribosomal Database Project CHIMERA_CHECK program. All
sequences were again analyzed via BLAST to identify their closest relatives. Phylogenetic
analyses were performed using the ARB software package (www.arb-home.de). The ARB
database (release June 2002) was complemented with sequences from GenBank that were
related to freshwater lineages of Cytophaga-Flavobacteria (Glöckner et al. 2000, Zwart et al.
2002). For the reconstruction of a phylogenetic tree only nearly complete (i.e. longer than
1,300 nucleotides) 16S rRNA gene sequences affiliated with this subphylum were
considered. A 50% base frequency filter was applied on these sequences to exclude highly
variable positions. The respective ARB tools were used to perform maximum parsimony,
neighbour-joining and maximum likelihood analyses. Downloaded partial sequences of
closely related sequence types from freshwaters were subsequently added to the consensus
tree according to maximum parsimony criteria, without introducing changes in the topology
based on the complete sequences. Newly generated sequences that were included in the
phylogenetic analysis have been submitted to GenBank (accession numbers: AJ697697-
AJ697708, Pernthaler et al. 2004).
Specific oligonucleotide probes for new and available sequences within the freshwater
LD2 and CL500-6 clusters as defined by Zwart et al. (2002), as well as for two other groups
of newly obtained sequences within the Cytophaga-Flavobacteria were designed using the
ARB software package and the 16S rRNA accessibility information provided by Fuchs et al.
(1998). Stringent conditions for FISH were established by analysis of fluorescence intensities
of the target cells from hybridizations at increasing concentrations of formamide in the
hybridization buffer (Pernthaler et al. 2001).
Fluorescence in situ hybridization (FISH). Whole cell in situ hybridizations on
sections from the polycarbonate filters were performed by Jakob Pernthaler (MPI for Marine
Microbiology, Bremen; Pernthaler et al. 2004) using the 16S rRNA targeted oligonucleotide
probes EUB I-III (Daims et al. 1999), CF319a (many groups of the Cytophaga-
Flavobacterium cluster of the Bacteroidetes) (Manz et al. 1996), R-FL615 for the freshwater
cfIII (Flectobacillus sp.) lineage (Šimek et al. 2001), and the newly designed specific probes.
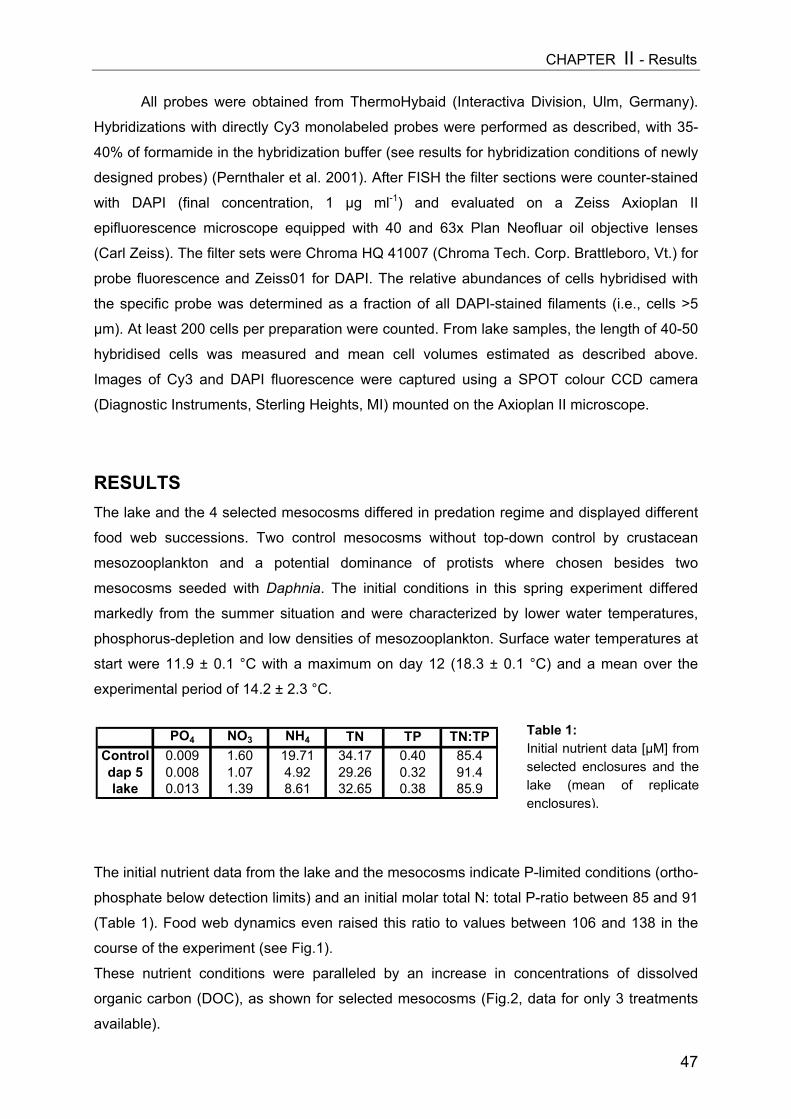
CHAPTER II - Results
All probes were obtained from ThermoHybaid (Interactiva Division, Ulm, Germany).
Hybridizations with directly Cy3 monolabeled probes were performed as described, with 35-
40% of formamide in the hybridization buffer (see results for hybridization conditions of newly
designed probes) (Pernthaler et al. 2001). After FISH the filter sections were counter-stained
with DAPI (final concentration, 1 µg ml-1) and evaluated on a Zeiss Axioplan II
epifluorescence microscope equipped with 40 and 63x Plan Neofluar oil objective lenses
(Carl Zeiss). The filter sets were Chroma HQ 41007 (Chroma Tech. Corp. Brattleboro, Vt.) for
probe fluorescence and Zeiss01 for DAPI. The relative abundances of cells hybridised with
the specific probe was determined as a fraction of all DAPI-stained filaments (i.e., cells >5
µm). At least 200 cells per preparation were counted. From lake samples, the length of 40-50
hybridised cells was measured and mean cell volumes estimated as described above.
Images of Cy3 and DAPI fluorescence were captured using a SPOT colour CCD camera
(Diagnostic Instruments, Sterling Heights, MI) mounted on the Axioplan II microscope.
RESULTS The lake and the 4 selected mesocosms differed in predation regime and displayed different
food web successions. Two control mesocosms without top-down control by crustacean
mesozooplankton and a potential dominance of protists where chosen besides two
mesocosms seeded with Daphnia. The initial conditions in this spring experiment differed
markedly from the summer situation and were characterized by lower water temperatures,
phosphorus-depletion and low densities of mesozooplankton. Surface water temperatures at
start were 11.9 ± 0.1 °C with a maximum on day 12 (18.3 ± 0.1 °C) and a mean over the
experimental period of 14.2 ± 2.3 °C.
The initial nutrient data from the lake and the mesocosms indicate
phosphate below detection limits) and an initial molar total N: tota
(Table 1). Food web dynamics even raised this ratio to values b
course of the experiment (see Fig.1).
These nutrient conditions were paralleled by an increase in c
organic carbon (DOC), as shown for selected mesocosms (Fig.2
available).
PO4 NO3 NH4 TN TP TN:TPControl 0.009 1.60 19.71 34.17 0.40 85.4dap 5 0.008 1.07 4.92 29.26 0.32 91.4lake 0.013 1.39 8.61 32.65 0.38 85.9
Table 1:Initial nutrient data [µM] fromselected enclosures and thelake (mean of replicateenclosures).
47
P-limited conditions (ortho-
l P-ratio between 85 and 91
etween 106 and 138 in the
oncentrations of dissolved
, data for only 3 treatments
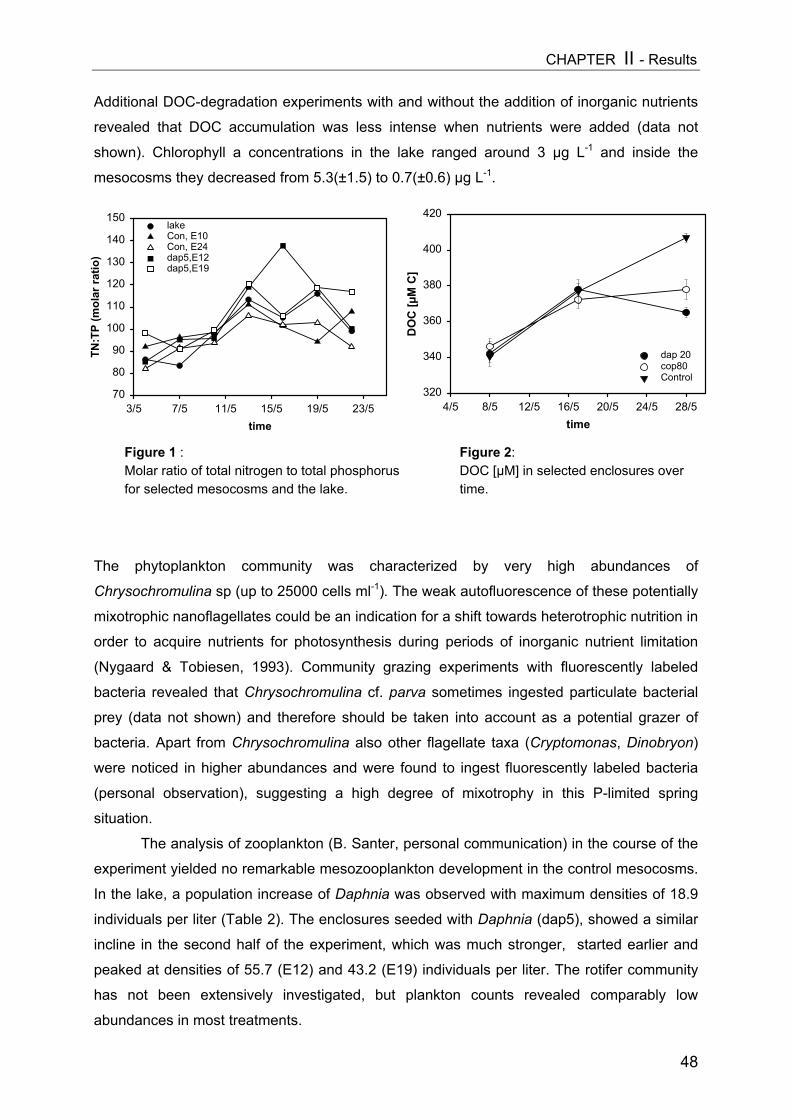
CHAPTER II - Results
48
Additional DOC-degradation experiments with and without the addition of inorganic nutrients
revealed that DOC accumulation was less intense when nutrients were added (data not
shown). Chlorophyll a concentrations in the lake ranged around 3 µg L-1 and inside the
mesocosms they decreased from 5.3(±1.5) to 0.7(±0.6) µg L-1.
The phytoplankton community was characterized by very high abundances of
Chrysochromulina sp (up to 25000 cells ml-1). The weak autofluorescence of these potentially
mixotrophic nanoflagellates could be an indication for a shift towards heterotrophic nutrition in
order to acquire nutrients for photosynthesis during periods of inorganic nutrient limitation
(Nygaard & Tobiesen, 1993). Community grazing experiments with fluorescently labeled
bacteria revealed that Chrysochromulina cf. parva sometimes ingested particulate bacterial
prey (data not shown) and therefore should be taken into account as a potential grazer of
bacteria. Apart from Chrysochromulina also other flagellate taxa (Cryptomonas, Dinobryon)
were noticed in higher abundances and were found to ingest fluorescently labeled bacteria
(personal observation), suggesting a high degree of mixotrophy in this P-limited spring
situation.
The analysis of zooplankton (B. Santer, personal communication) in the course of the
experiment yielded no remarkable mesozooplankton development in the control mesocosms.
In the lake, a population increase of Daphnia was observed with maximum densities of 18.9
individuals per liter (Table 2). The enclosures seeded with Daphnia (dap5), showed a similar
incline in the second half of the experiment, which was much stronger, started earlier and
peaked at densities of 55.7 (E12) and 43.2 (E19) individuals per liter. The rotifer community
has not been extensively investigated, but plankton counts revealed comparably low
abundances in most treatments.
time3/5 7/5 11/5 15/5 19/5 23/5
TN:T
P (m
olar
ratio
)
70
80
90
100
110
120
130
140
150lake Con, E10 Con, E24 dap5,E12 dap5,E19
time4/5 8/5 12/5 16/5 20/5 24/5 28/5
DO
C [µ
M C
]320
340
360
380
400
420
dap 20 cop80 Control
Figure 1 :Molar ratio of total nitrogen to total phosphorusfor selected mesocosms and the lake.
Figure 2:DOC [µM] in selected enclosures overtime.
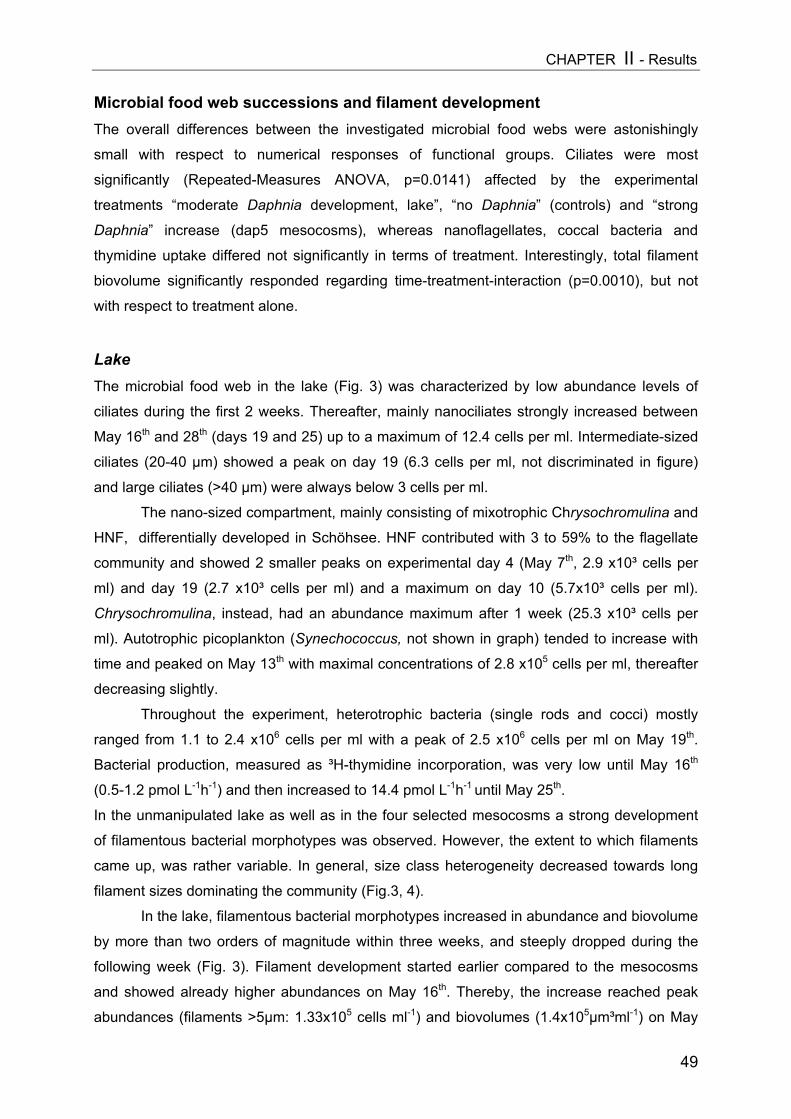
CHAPTER II - Results
49
Microbial food web successions and filament development The overall differences between the investigated microbial food webs were astonishingly
small with respect to numerical responses of functional groups. Ciliates were most
significantly (Repeated-Measures ANOVA, p=0.0141) affected by the experimental
treatments “moderate Daphnia development, lake”, “no Daphnia” (controls) and “strong
Daphnia” increase (dap5 mesocosms), whereas nanoflagellates, coccal bacteria and
thymidine uptake differed not significantly in terms of treatment. Interestingly, total filament
biovolume significantly responded regarding time-treatment-interaction (p=0.0010), but not
with respect to treatment alone.
Lake The microbial food web in the lake (Fig. 3) was characterized by low abundance levels of
ciliates during the first 2 weeks. Thereafter, mainly nanociliates strongly increased between
May 16th and 28th (days 19 and 25) up to a maximum of 12.4 cells per ml. Intermediate-sized
ciliates (20-40 µm) showed a peak on day 19 (6.3 cells per ml, not discriminated in figure)
and large ciliates (>40 µm) were always below 3 cells per ml.
The nano-sized compartment, mainly consisting of mixotrophic Chrysochromulina and
HNF, differentially developed in Schöhsee. HNF contributed with 3 to 59% to the flagellate
community and showed 2 smaller peaks on experimental day 4 (May 7th, 2.9 x10³ cells per
ml) and day 19 (2.7 x10³ cells per ml) and a maximum on day 10 (5.7x10³ cells per ml).
Chrysochromulina, instead, had an abundance maximum after 1 week (25.3 x10³ cells per
ml). Autotrophic picoplankton (Synechococcus, not shown in graph) tended to increase with
time and peaked on May 13th with maximal concentrations of 2.8 x10⁵ cells per ml, thereafter
decreasing slightly.
Throughout the experiment, heterotrophic bacteria (single rods and cocci) mostly
ranged from 1.1 to 2.4 x10⁶ cells per ml with a peak of 2.5 x10⁶ cells per ml on May 19th.
Bacterial production, measured as ³H-thymidine incorporation, was very low until May 16th
(0.5-1.2 pmol L-1h-1) and then increased to 14.4 pmol L-1h-1 until May 25th.
In the unmanipulated lake as well as in the four selected mesocosms a strong development
of filamentous bacterial morphotypes was observed. However, the extent to which filaments
came up, was rather variable. In general, size class heterogeneity decreased towards long
filament sizes dominating the community (Fig.3, 4).
In the lake, filamentous bacterial morphotypes increased in abundance and biovolume
by more than two orders of magnitude within three weeks, and steeply dropped during the
following week (Fig. 3). Filament development started earlier compared to the mesocosms
and showed already higher abundances on May 16th. Thereby, the increase reached peak
abundances (filaments >5µm: 1.33x10⁵ cells ml-1) and biovolumes (1.4x105µm³ml-1) on May
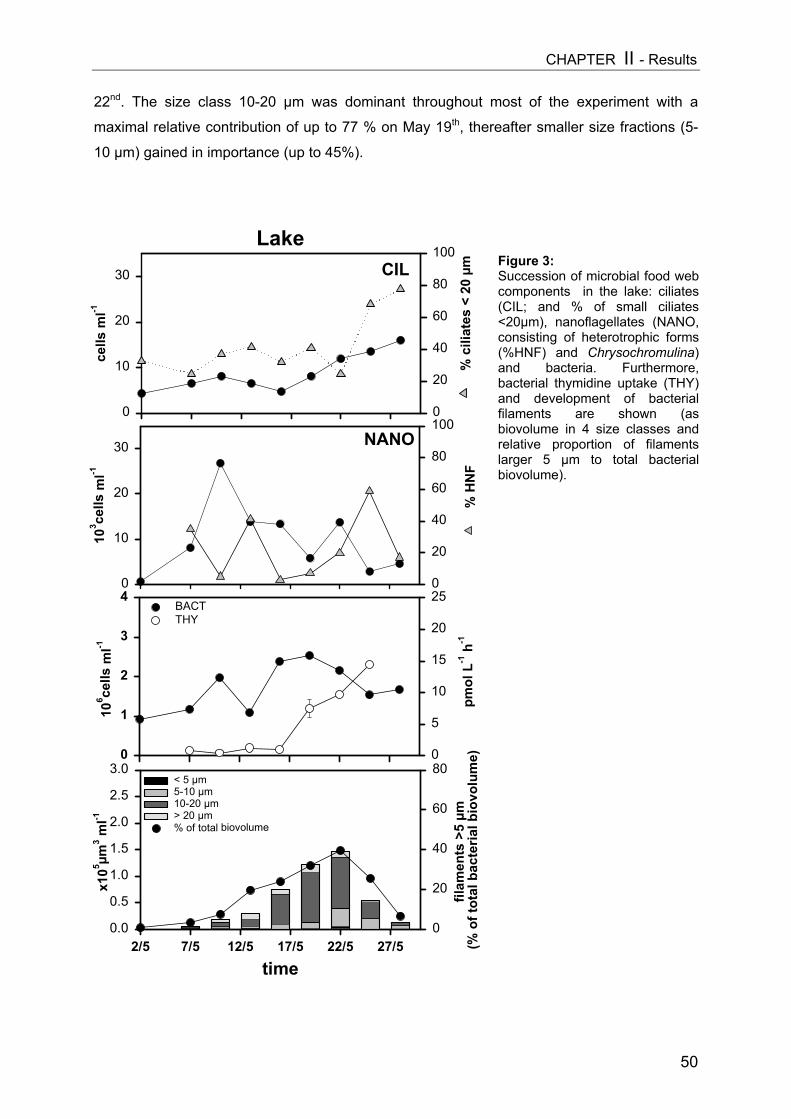
CHAPTER II - Results
50
22nd. The size class 10-20 µm was dominant throughout most of the experiment with a
maximal relative contribution of up to 77 % on May 19th, thereafter smaller size fractions (5-
10 µm) gained in importance (up to 45%).
103 ce
lls m
l-1
0
10
20
30%
HN
F
0
20
40
60
80
100
106 ce
lls m
l-1
0
1
2
3
4
pmol
L-1
h-1
0
5
10
15
20
25BACTTHY
Lake
time2/5 7/5 12/5 17/5 22/5 27/5
x105 µm
3 ml-1
0.0
0.5
1.0
1.5
2.0
2.5
3.0
filam
ents
>5
µm
(% o
f tot
al b
acte
rial b
iovo
lum
e)
0
20
40
60
80< 5 µm5-10 µm10-20 µm> 20 µm% of total biovolume
NANO
cells
ml-1
0
10
20
30
% c
iliat
es <
20
µm
0
20
40
60
80
100CIL Figure 3:
Succession of microbial food webcomponents in the lake: ciliates(CIL; and % of small ciliates<20µm), nanoflagellates (NANO,consisting of heterotrophic forms(%HNF) and Chrysochromulina)and bacteria. Furthermore,bacterial thymidine uptake (THY)and development of bacterialfilaments are shown (asbiovolume in 4 size classes andrelative proportion of filamentslarger 5 µm to total bacterialbiovolume).
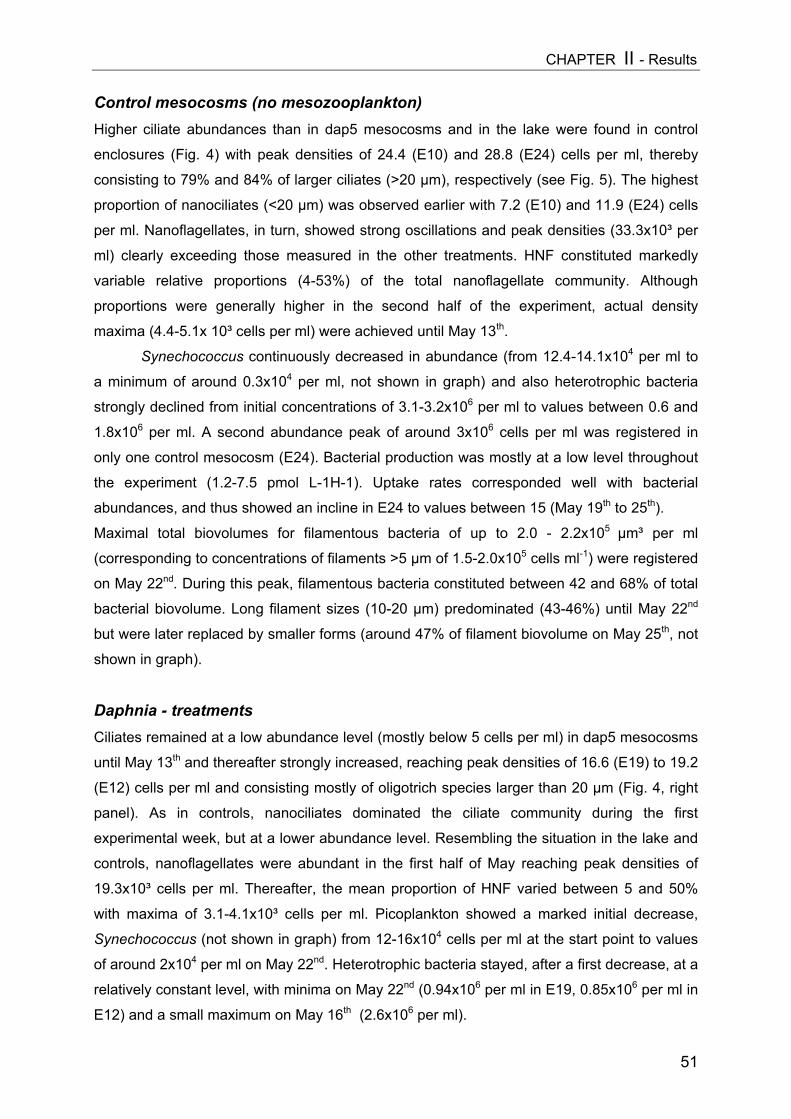
CHAPTER II - Results
51
Control mesocosms (no mesozooplankton)Higher ciliate abundances than in dap5 mesocosms and in the lake were found in control
enclosures (Fig. 4) with peak densities of 24.4 (E10) and 28.8 (E24) cells per ml, thereby
consisting to 79% and 84% of larger ciliates (>20 µm), respectively (see Fig. 5). The highest
proportion of nanociliates (<20 µm) was observed earlier with 7.2 (E10) and 11.9 (E24) cells
per ml. Nanoflagellates, in turn, showed strong oscillations and peak densities (33.3x10³ per
ml) clearly exceeding those measured in the other treatments. HNF constituted markedly
variable relative proportions (4-53%) of the total nanoflagellate community. Although
proportions were generally higher in the second half of the experiment, actual density
maxima (4.4-5.1x 10³ cells per ml) were achieved until May 13th.
Synechococcus continuously decreased in abundance (from 12.4-14.1x10⁴ per ml to
a minimum of around 0.3x10⁴ per ml, not shown in graph) and also heterotrophic bacteria
strongly declined from initial concentrations of 3.1-3.2x10⁶ per ml to values between 0.6 and
1.8x10⁶ per ml. A second abundance peak of around 3x10⁶ cells per ml was registered in
only one control mesocosm (E24). Bacterial production was mostly at a low level throughout
the experiment (1.2-7.5 pmol L-1H-1). Uptake rates corresponded well with bacterial
abundances, and thus showed an incline in E24 to values between 15 (May 19th to 25th).
Maximal total biovolumes for filamentous bacteria of up to 2.0 - 2.2x105 µm³ per ml
(corresponding to concentrations of filaments >5 µm of 1.5-2.0x10⁵ cells ml-1) were registered
on May 22nd. During this peak, filamentous bacteria constituted between 42 and 68% of total
bacterial biovolume. Long filament sizes (10-20 µm) predominated (43-46%) until May 22nd
but were later replaced by smaller forms (around 47% of filament biovolume on May 25th, not
shown in graph).
Daphnia - treatmentsCiliates remained at a low abundance level (mostly below 5 cells per ml) in dap5 mesocosms
until May 13th and thereafter strongly increased, reaching peak densities of 16.6 (E19) to 19.2
(E12) cells per ml and consisting mostly of oligotrich species larger than 20 µm (Fig. 4, right
panel). As in controls, nanociliates dominated the ciliate community during the first
experimental week, but at a lower abundance level. Resembling the situation in the lake and
controls, nanoflagellates were abundant in the first half of May reaching peak densities of
19.3x10³ cells per ml. Thereafter, the mean proportion of HNF varied between 5 and 50%
with maxima of 3.1-4.1x10³ cells per ml. Picoplankton showed a marked initial decrease,
Synechococcus (not shown in graph) from 12-16x104 cells per ml at the start point to values
of around 2x10⁴ per ml on May 22nd. Heterotrophic bacteria stayed, after a first decrease, at a
relatively constant level, with minima on May 22nd (0.94x10⁶ per ml in E19, 0.85x10⁶ per ml in
E12) and a small maximum on May 16th (2.6x10⁶ per ml).
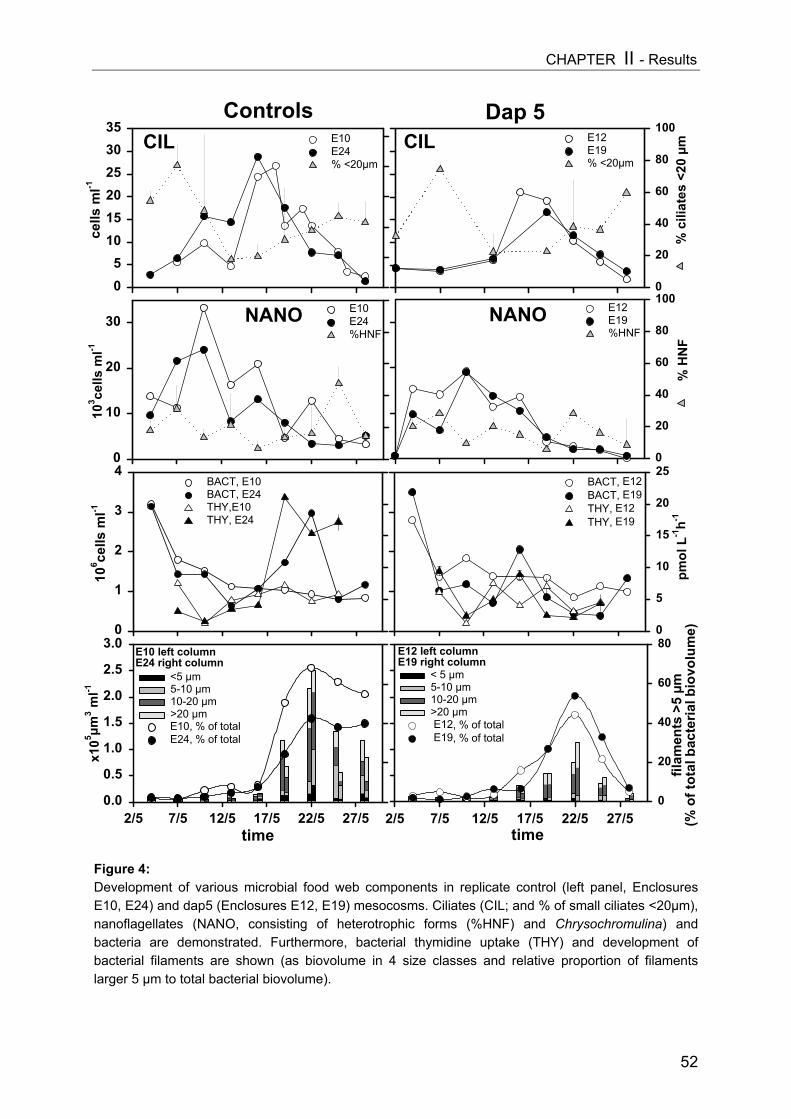
CHAPTER II - Results
52
Figure 4: Development of various microbial food web components in replicate control (left panel, EnclosuresE10, E24) and dap5 (Enclosures E12, E19) mesocosms. Ciliates (CIL; and % of small ciliates <20µm),nanoflagellates (NANO, consisting of heterotrophic forms (%HNF) and Chrysochromulina) andbacteria are demonstrated. Furthermore, bacterial thymidine uptake (THY) and development ofbacterial filaments are shown (as biovolume in 4 size classes and relative proportion of filamentslarger 5 µm to total bacterial biovolume).
cells
ml-1
05
101520253035
E10 E24 % <20µm
HNF
103 ce
lls m
l-1
0
10
20
30E10 E24 %HNF
106 ce
lls m
l-1
0
1
2
3
4BACT, E10 BACT, E24THY,E10 THY, E24
Controls
E10 left columnE24 right column
time2/5 7/5 12/5 17/5 22/5 27/5
x105 µm
3 ml-1
0.0
0.5
1.0
1.5
2.0
2.5
3.0
<5 µm5-10 µm10-20 µm >20 µmE10, % of totalE24, % of total
% c
iliat
es <
20 µ
m
0
20
40
60
80
100E12 E19 % <20µm
% H
NF
0
20
40
60
80
100E12 E19 %HNF
pmol
L-1
h-1
0
5
10
15
20
25BACT, E12 BACT, E19 THY, E12 THY, E19
Dap 5
time2/5 7/5 12/5 17/5 22/5 27/5
filam
ents
>5
µm(%
of t
otal
bac
teria
l bio
volu
me)
0
20
40
60
80
< 5 µm 5-10 µm10-20 µm >20 µm E12, % of total E19, % of total
E12 left columnE19 right column
NANONANO
CILCIL
CHAPTER II - Results
53
Accordingly, low ³H-thymidine uptake rates with values persistently below 10 pmol L-1h-1 were
noted. In the dap5 mesocosms, filament development was far less intense than in controls
and in the lake, but showed the same general pattern with a maximum on May 22nd. At that
time filamentous bacteria (>5 µm) dominated the community and accounted for 44-54% of
total bacterial biovolume. Temporal dynamics of filament formation and filament size class
composition proved to be similar to the other treatments, but absolute maximal cells numbers
(0.76x10⁵ cells ml-1) and biovolumes (1.1x105µm³ml-1) were by far lower than in the control
mesocosms and the lake.
Other activity parametersA selection of other bacterial activity indicators gave support to numerical succession
patterns of the investigated microbial food webs and further characterized the different
scenarios, under which filamentous bacterial morphotypes could develop. The proportion of
HNA bacteria (high nucleic acid, not shown in graphs) slightly increased with time until May
22nd. Time-averaged percentages of selected treatments differed markedly, with the highest
value found in the lake and a significantly lower average in dap5 treatments (Fig. 5).
Correspondingly, bacterial communities of dap5 mesocosms showed the lowest proportions
of actively respiring (CTC-positive) cells (5.6±2.7%), while values for controls (7.0±5.2%) and
especially for the lake (25.4%) were considerably higher. Higher CTC+ values were
measured earlier in the dap5 and control bags (May 16th, 13.6±1%, 12.3±0.4, respectively).
Interestingly, the determination of ³H-leucine uptake as a measure for protein synthesis (data
not shown in graph) yielded earlier maxima and stronger increases than the measurement of
thymidine uptake. From May 10th to 16th, when thymidine incorporation rates were still low
and the filament bloom was about to start, leucine uptake rates strongly increased (maxima
in controls 73-86 pmol L-1h-1) and proved to show increasing scatter until May 19th, apparently
corresponding to the extent of the subsequent development of filamentous bacteria.
Increases in leucine uptake during that period was 3.2-7.8-fold in controls, 3.4-fold in the lake
and 2.3-2.7-fold in dap5 mesocosms, respectively.
lake controls dap5
% H
NA
bac
teria
(mea
n ov
er ti
me)
0
10
20
30
40
50
60
70Figure 5:Time-averaged relativeproportions of high nucleicacid bacteria (HNA) of totalcells (single, non-filamentouscells), calculated from meansof replicate mesocosms).Only differences betweenlake and dap5 enclosureswere significant, ANOVA,p=0.0213)
CHAPTER II - Results
Furthermore, the increasing proportion of large filamentous morphotypes was reflected by
results obtained from a size-fractionated bacterial production measurement (not shown in
graph). From May 17th to 23rd, the contribution of bacteria >3µm to total bacterial thymidine
uptake was high and further increased from 33.9 to 42.9% in the selected control mesocosm
(E10). In Daphnia-dominated enclosures, instead, very small cells (<1.2µm) contributed with
approximately 77-90% to total bacterial production.
Filamentous bacteria LD2-739
FP
(
F
a
h
b
2
w
c
f
igure 6: hotomicrographs of filamentous bacteria stained
same microscopic field, scale bar = 10 µm). (Prov
ilamentous morphotypes constituted a subs
nd obviously belonged to different taxonom
ybridised filament-forming bacteria in lake w
y probe CF319a (Cytophaga-Flavobacteriu
004). However, comparably high but variab
ith the new specific probe LD2-739 (Fig. 6
lade and the other clones belonging to the C
rom Figure 7 (Pernthaler et al. 2004).
54
with DAPI (left) and hybridised with Probe LD2-739
ided by Jakob Pernthaler, MPI Bremen.)
tantial component of the bacterial assemblage
ic subgroups. Between 33% and 100% of all
ater and in the mesocosms could be detected
m cluster, data not shown, Pernthaler et al.
le proportions of bacterial filaments hybridised
). A detailed phylogenetic affiliation of the LD2
ytophaga-Flavobacteria cluster can be obtained
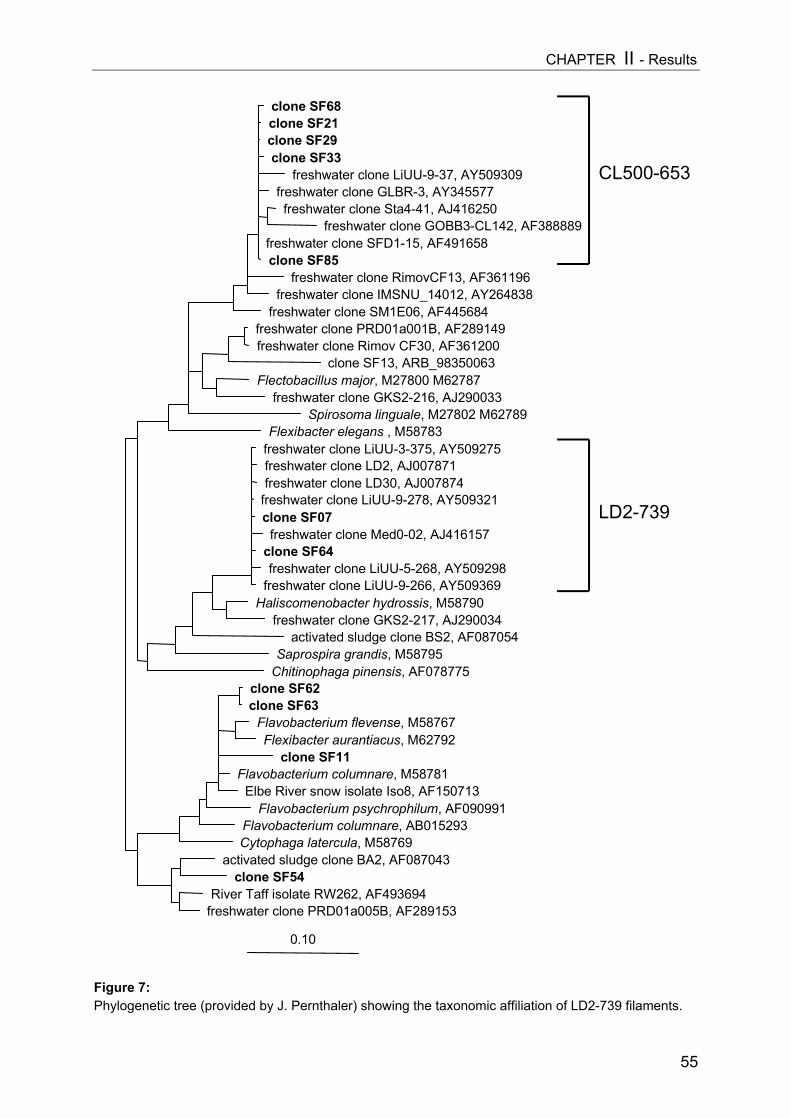
CHAPTER II - Results
55
Figure 7: Phylogenetic tree (provided by J. Pernthaler) showing the taxonomic affiliation of LD2-739 filaments.
CL500-653
clone SF68clone SF21clone SF29clone SF33
freshwater clone LiUU-9-37, AY509309freshwater clone GLBR-3, AY345577freshwater clone Sta4-41, AJ416250
freshwater clone GOBB3-CL142, AF388889freshwater clone SFD1-15, AF491658clone SF85
freshwater clone RimovCF13, AF361196freshwater clone IMSNU_14012, AY264838
freshwater clone SM1E06, AF445684freshwater clone PRD01a001B, AF289149freshwater clone Rimov CF30, AF361200
clone SF13, ARB_98350063Flectobacillus major, M27800 M62787
freshwater clone GKS2-216, AJ290033Spirosoma linguale, M27802 M62789
Flexibacter elegans , M58783freshwater clone LiUU-3-375, AY509275freshwater clone LD2, AJ007871freshwater clone LD30, AJ007874
freshwater clone LiUU-9-278, AY509321clone SF07
freshwater clone Med0-02, AJ416157clone SF64freshwater clone LiUU-5-268, AY509298
freshwater clone LiUU-9-266, AY509369Haliscomenobacter hydrossis, M58790
freshwater clone GKS2-217, AJ290034activated sludge clone BS2, AF087054
Saprospira grandis, M58795Chitinophaga pinensis, AF078775
clone SF62clone SF63
Flavobacterium flevense, M58767Flexibacter aurantiacus, M62792
clone SF11Flavobacterium columnare, M58781
Elbe River snow isolate Iso8, AF150713Flavobacterium psychrophilum, AF090991
Flavobacterium columnare, AB015293Cytophaga latercula, M58769
activated sludge clone BA2, AF087043clone SF54
River Taff isolate RW262, AF493694freshwater clone PRD01a005B, AF289153
0.10
LD2-739
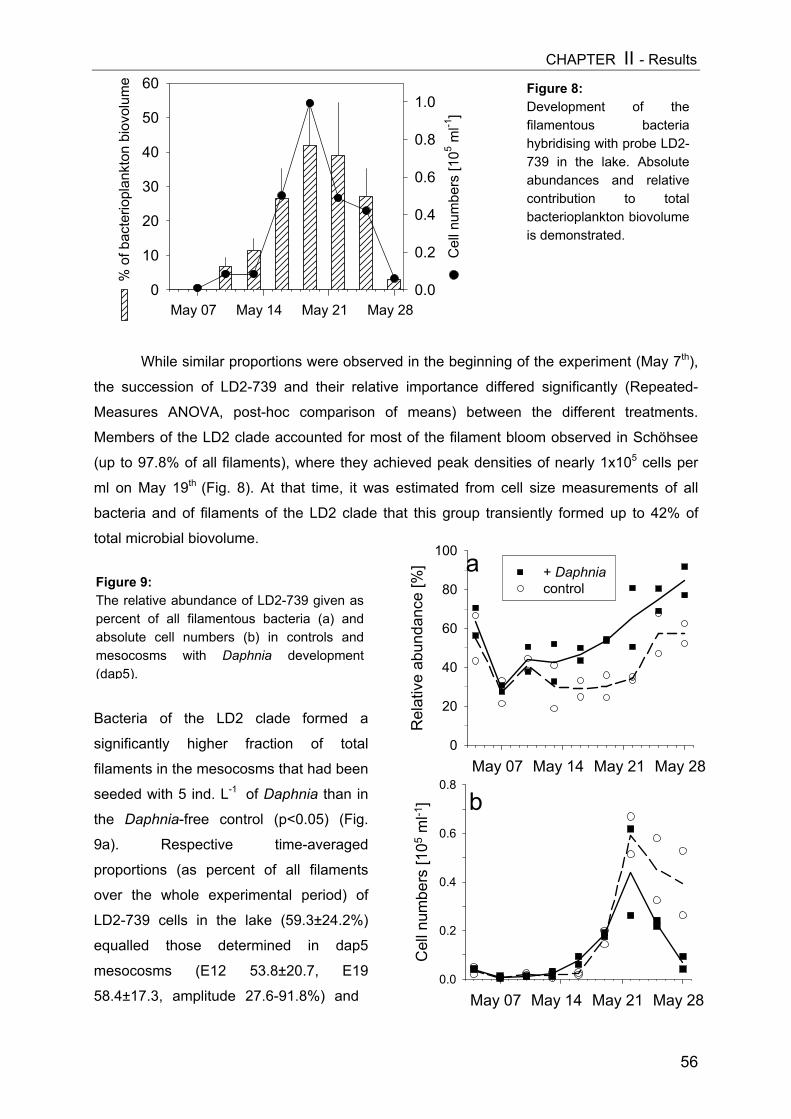
CHAPTER II - Results
While similar proportions were observed in the beginning of the experiment (May 7th),
the succession of LD2-739 and their relative importance differed significantly (Repeated-
Measures ANOVA, post-hoc comparison of means) between the different treatments.
Members of the LD2 clade accounted for most of the filament bloom observed in Schöhsee
(up to 97.8% of all filaments), where they achieved peak densities of nearly 1x10⁵ cells per
ml on May 19th (Fig. 8). At that time, it was estimated from cell size measurements of all
bacteria and of filaments of the LD2 clade that this group transiently formed up to 42% of
total microbial biovolume.
May 07 May 14 May 21 May 28
% o
f bac
terio
plan
kton
bio
volu
me
0
10
20
30
40
50
60
Cel
l num
bers
[105 m
l-1]
0.0
0.2
0.4
0.6
0.8
1.0Figure 8:Development of thefilamentous bacteriahybridising with probe LD2-739 in the lake. Absoluteabundances and relativecontribution to totalbacterioplankton biovolumeis demonstrated.
a
e ab
unda
nce
[%]
40
60
80
100+ Daphniacontrol
Figure 9:The relative abundance of LD2-739 given aspercent of all filamentous bacteria (a) andabsolute cell numbers (b) in controls andmesocosms with Daphnia development(dap5).
56
Bacteria of the LD2 clade formed a
significantly higher fraction of total
filaments in the mesocosms that had been
seeded with 5 ind. L-1 of Daphnia than in
the Daphnia-free control (p<0.05) (Fig.
9a). Respective time-averaged
proportions (as percent of all filaments
over the whole experimental period) of
LD2-739 cells in the lake (59.3±24.2%)
equalled those determined in dap5
mesocosms (E12 53.8±20.7, E19
58.4±17.3, amplitude 27.6-91.8%) and
b
May 07 May 14 May 21 May 28
Cel
l num
bers
[105 m
l-1]
0.0
0.2
0.4
0.6
0.8May 07 May 14 May 21 May 28
Rel
ativ
0
20
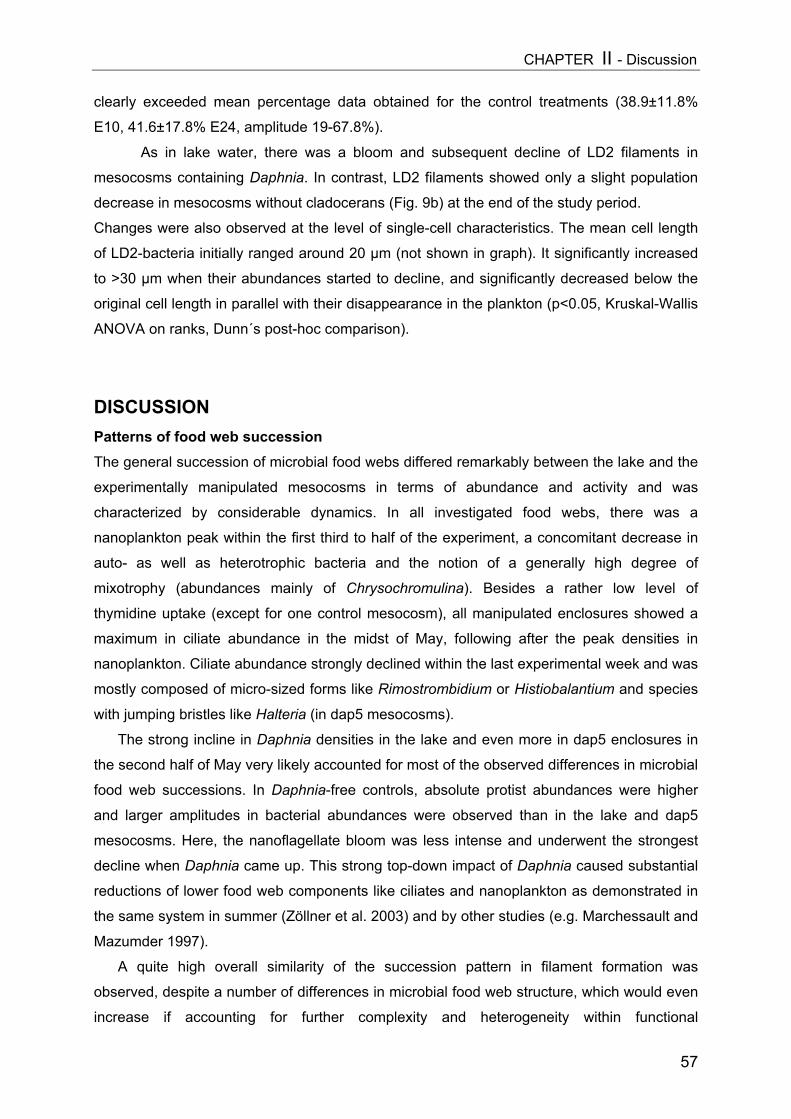
CHAPTER II - Discussion
57
clearly exceeded mean percentage data obtained for the control treatments (38.9±11.8%
E10, 41.6±17.8% E24, amplitude 19-67.8%).
As in lake water, there was a bloom and subsequent decline of LD2 filaments in
mesocosms containing Daphnia. In contrast, LD2 filaments showed only a slight population
decrease in mesocosms without cladocerans (Fig. 9b) at the end of the study period.
Changes were also observed at the level of single-cell characteristics. The mean cell length
of LD2-bacteria initially ranged around 20 µm (not shown in graph). It significantly increased
to >30 µm when their abundances started to decline, and significantly decreased below the
original cell length in parallel with their disappearance in the plankton (p<0.05, Kruskal-Wallis
ANOVA on ranks, Dunn´s post-hoc comparison).
DISCUSSIONPatterns of food web succession The general succession of microbial food webs differed remarkably between the lake and the
experimentally manipulated mesocosms in terms of abundance and activity and was
characterized by considerable dynamics. In all investigated food webs, there was a
nanoplankton peak within the first third to half of the experiment, a concomitant decrease in
auto- as well as heterotrophic bacteria and the notion of a generally high degree of
mixotrophy (abundances mainly of Chrysochromulina). Besides a rather low level of
thymidine uptake (except for one control mesocosm), all manipulated enclosures showed a
maximum in ciliate abundance in the midst of May, following after the peak densities in
nanoplankton. Ciliate abundance strongly declined within the last experimental week and was
mostly composed of micro-sized forms like Rimostrombidium or Histiobalantium and species
with jumping bristles like Halteria (in dap5 mesocosms).
The strong incline in Daphnia densities in the lake and even more in dap5 enclosures in
the second half of May very likely accounted for most of the observed differences in microbial
food web successions. In Daphnia-free controls, absolute protist abundances were higher
and larger amplitudes in bacterial abundances were observed than in the lake and dap5
mesocosms. Here, the nanoflagellate bloom was less intense and underwent the strongest
decline when Daphnia came up. This strong top-down impact of Daphnia caused substantial
reductions of lower food web components like ciliates and nanoplankton as demonstrated in
the same system in summer (Zöllner et al. 2003) and by other studies (e.g. Marchessault and
Mazumder 1997).
A quite high overall similarity of the succession pattern in filament formation was
observed, despite a number of differences in microbial food web structure, which would even
increase if accounting for further complexity and heterogeneity within functional
CHAPTER II - Discussion
58
compartments such as HNF. However, by means of a highly specific probe, not only the
threadlike morphotype itself could be traced. By following the dynamics of a phylogenetic
subgroup a much higher resolution of this filament blooming event could be achieved.
The formation of a filamentous morphotype obviously is a common strategy in various
bacterial phylogenetic groups (e.g. Jürgens et al. 1999a). They can constitute very important
components in aquatic microbial assemblages and have been documented in a number of
studies (Pernthaler et al. 1997, Hahn and Höfle 2001). Few investigations also reported their
massive occurrence, for example they accounted for more than 50% of total heterotrophic
microbial biomass in the pelagic zone of acidified lakes (Vrba et al. 2003). As the more
closely investigated LD2-739 filaments, filamentous bacteria affiliating with the Cytophaga-
Flavobacterium cluster constituted seasonally even the largest pool of bacterioplankton
biomass in Gossenköllesee (Pernthaler et al. 1998). Remarkably, the general occurrence of
filaments seems to be restricted to limnic and brackish habitats and almost never observed in
marine systems.
In general, bacterial community shifts can be triggered by a number of different
factors, of which predation belongs to the most important ones (e.g. Šimek et al. 2002).
However, strong and rapid shifts in bacterial community composition mostly occurred when
very pronounced alterations in predation regime took place, for example the experimental
shift from protist to Daphnia grazing (Langenheder and Jürgens 2001, Degans et al. 2002). In
other studies on bacterioplankton over different temporal and spatial scales, bacterial
community composition proved to be rather stable (Höfle et al. 1999, Riemann and
Middelboe 2002, see also chapter 1). Additional factors (e.g. poor nutrient conditions) might
set the limits for physiological variability and diversity changes in aquatic bacterial
communities. Finally, there is evidence that the observed increases of total filament
biovolume (phenotypic diversity shift) to a certain extent can also be enhanced by phenotypic
plasticity of individual taxa, as supported by increasing mean cell length in LD2-739 on May
22nd (not shown in graph). The mechanisms of filament formation are extensively discussed
in Jürgens and Matz (2002).
Potential causes for filament emergence and elimination and the special case of LD2PredationAmong the major determinants of filaments occurrence, size-selective predation by protists
(mainly HNF) appears to be best investigated (e.g. Pernthaler et al. 1997b, Šimek et al.
1997). In most previous studies, the development of HNF and filamentous bacteria was
positively correlated (Jürgens et al. 1994a, Jürgens and Stolpe 1995, Sommaruga and
Psenner 1995), indicating that filaments benefit from high grazing pressure. Although the
exact protist grazing pressure is hard to predict and the significance of inter- and intraspecific
CHAPTER II - Discussion
59
variation in bacterivorous and herbivorous protists (Weisse 2002) should be underlined,
bacterial size matters in terms of grazing susceptibility. Already slightly larger bacteria (2-5
µm) proved to be less vulnerable to HNF grazing (Šimek et al. 1997, Jürgens et al. 1999a).
Also in a previous study in Schöhsee, bacterial filaments and not aggregates were
considered the main grazing refuge (Jürgens et al. 1994a).
Bacterial beyond a certain length are probably resistant against most types of protist
grazers but not all. Recent experiments by Wu et al. (2004) proved that the direct-
interception-feeding nanoflagellate Ochromonas sp. strain DS successfully preyed on
filamentous bacteria and some ciliates are specialised to ingest filamentous bacteria
(Shikano et al. 1990). More important are metazoan filter feeders as potential consumers of
filaments and other complex morphologies (Güde 1988, Jürgens et al. 1994a).
The mass emergence of bacterial filaments was initiated between May 10th (lake) and
May 13th to 16th (mesocosms), subsequent to very high abundances of nanoflagellates. It
was paralleled by low concentrations of small bacteria (cocci, rods) and minimal thymidine
uptake rates. Although the difference between treatments in terms of total nanoflagellate
abundance over time was not significant, peak densities of filamentous bacteria were
observed when high proportions of HNF prevailed in the nano-sized community.
Additionally, significant concentrations of Chrysochromulina as well as the occurrence
of Dinobryon spp. indicate a potentially high level of mixotrophy. Grazing by mixotrophic
flagellates (Dinobryon spp.) mainly induced and maintained seasonal filament formation in
acidified lakes (Vrba et al. 2003).
According to other studies, this nutrition strategy is favoured under nutrient poor
conditions (Samuelsson et al. 2002, Domaizon et al. 2003, Samuelsson 2003). For a close
marine relative (Chrysochromulina polylepis) Stibor and Sommer (2003) even found that
selectivity in uptake of both dissolved and bacterial P followed the ideas of optimal foraging.
Consequently, Chrysochromulina might have influenced filament development by enhancing
P-depletion on one hand and grazing pressure on bacteria on the other hand (supported by
low chloroplast fluorescence and uptake of fluorescently labeled bacteria).
The observed food web successions suggest that strongly increasing densities of
Daphnia are the most important reason for the termination of the filament mass occurrence.
In Daphnia-free control mesocosm, in contrast, filament densities and contributions to total
bacterial biovolume remained high. Treatments with highest Daphnia densities (dap5) not
only showed lowest averages in bacterial abundance, production and relative proportions of
HNA bacteria, but also lowest absolute concentrations of filamentous bacteria. Filter-feeding
daphnids came up in the lake as well and preferentially eliminated larger-sized bacteria. A
similar negative correlation between biomasses of cladocerans and filaments were also
reported by Vrba et al. (2003).
CHAPTER II - Discussion
60
Interestingly, the LD2-739 type of bacterial filaments reacted less sensitive to
Daphnia-grazing and achieved larger proportions in the lake and dap5 mesocosms. The few
studies examining the impact of unselective Daphnia grazing on bacterial community
composition found diversity changes in the form of overall diversity reduction (Höfle et al.
1999) or shifts in relative proportions of taxa (Degans et al. 2002). The latter study could
provide evidence for differential sensitivity to daphnids by community fingerprinting. However,
King et al. (1991) found bacteria to survive Daphnia gut passage, suggesting reduced
population susceptibility to Daphnia grazing and thus a potential selective advantage. To
assume a similar strategy of pre-adaptation for LD2-739 cells could help to explain the
relative success of these filaments and their ability to develop such amazingly high
biomasses, even during periods of Daphnia predominance. Sequence types of the apparently
widespread LD2 clade have so far been collected from various meso- to eutrophic freshwater
systems (Zwart et al. 2002, Pernthaler et al. 2004).
Other factors potentially inducing and indicating filament emergence Other factors than protist predation might also be of importance in driving filament formation
and contribute to explaining succession patterns of heterotrophic bacterial filaments. For
example, Holmquist and Kjelleberg (1993) found single bacterial strains to display
morphological variability in response to different nutrient conditions, while Tuomi et al. (1995)
reported on morphological shifts in bacterial communities due to changes in nutrient
availability. Moreover, bacterioplankton community shifts were found to correlate with
seasonal changes in dissolved organic matter (Crump et al. 2003).
In all investigated food web scenarios we observed strong filament increases, with
differing intensities and, compared to the lake, slightly delayed in experimental treatments.
This could suggest on one hand that the absolute intensity of this event is favoured or
suppressed by different grazers and grazing intensities. On the other hand this could imply
that the underlying mechanisms governing filament emergence are much more complex and
dependent also on other factors, although explanations remain speculative to a certain
extent.
These findings are consistent with results obtained for eutrophic ponds in a study of
Langenheder and Jürgens (2001), who concluded that the dynamics of filamentous bacteria
cannot clearly be explained by trophic interactions. The fact that filaments were of minor
importance in their study ponds with high input of allochthonous matter, led the authors to the
assumption that attached bacteria might be favoured as predation-resistant growth forms. At
the same time this could imply that the availability of nutrients and DOC as well as elemental
ratios are potential determinants of filament mass occurrences. In the present study, no
ortho-phosphate was detectable and total phosphorus concentrations (TP) were minimal
CHAPTER II - Discussion
61
between 13th and 16th of May (6.2-8.5µg L-1 in dap5, in controls 8.7-10µg L-1 and the lake 8.5-
8.7µg L-1), concomitant with the temporal increase in the TN:TP-ratio as well as in DOC
concentrations. Bacterial filaments at very P-depleted conditions were also found in the lakes
studied by Vrba et al. (2003). Moreover, there is numerous evidence of a tight coupling
between the use of DOC by lake bacterial communities and phosphorus availability (Smith
and Prairie 2004). An accumulation of degradable dissolved organic carbon is often due to
phosphorus limitation (Olsen et al. 2002, Vadstein and al. 2003).
In addition to that, this period was paralleled by very sunny weather and thus clearly
increasing water temperatures. According to Chrzanowski and Grover (2001) and the light-
nutrient-hypothesis (Sterner et al. 1997), this could have further contributed to driving
bacteria towards phosphorus limitation. This coincidence of biotic and abiotic phenomena
provides a fairly good indication that the resulting conditions could have induced or at least
favoured the mass development of filamentous bacteria.
Finally, the observed patterns of bacterial activity could be also interpreted in terms of
metabolic responses to the external triggers mentioned above. During the period of beginning
filament emergence (May 10th to 13th in the lake, May 13th to 16th in mesocosms), thymidine
uptake rates were very low (approximately one seventh of summer values) and filament
biovolume increases were not reflected by inclines in relative contribution to total bacterial
thymidine uptake. This points at a potentially lower cell-specific activity of threadlike cell, at
least with respect to thymidine. These findings were supported by Vrba et al. (2003), who
found filaments to be apparently less active in terms of thymidine uptake.
Remarkably, the increase in bacterial leucine uptake during the respective period very
likely was due to enhanced protein synthesis, which could be a prerequisite or by-product of
filament formation. Recent evidence from chemostat studies by Matz and Jürgens (2003)
give some support to this hypothesis as P-limited cells were found to be larger and mainly
filamentous with a distinctly higher protein content (two times more).
This present study of natural and experimentally manipulated microbial food web
successions revealed resembling and diverging patterns in terms of abundance and activity
as a background for a massive development of filamentous bacteria. By means of a specific
rRNA-targeted DNA probe, the relative importance of a dominant and apparently widespread
group of filaments could be traced. Thus, their functional ecological niche was better defined
and the complexity of the underlying succession mechanisms further unveiled. Filament
formation varied in intensity and apparently followed a general temporal scheme. In view of
the experimental evidence, the development was less tightly linked to protist grazing than
previously expected and influenced also by other factors. Finally, Daphnia turned out to play
a key role in suppressing filamentous bacteria.
IIIChapter 3
Fjord
- microbial food web inspring and summer
-Dynamics ofabundance and activity -
CHAPTER III - Abstract
62
Mesozooplankton (copepods, appendicularians) impact on microbial food web structure in a coastal marine system.
I. Cascading predation effects on protists and bacteria
ABSTRACT We examined the impact of copepods and appendicularians on the marine microbial food
web structure and microbial activity in the Trondheimsfjord (Norway) by manipulating
mesozooplankton abundance and composition in large-scale mesocosm experiments
performed in spring (2 experiments in April and May) and summer (1 experiment in July). The
response of ciliates, nanoflagellates, heterotrophic bacteria and picocyanobacteria was
followed to gradients of mesozooplankton density. Despite seasonal differences with
deviating initial biotic and abiotic conditions we found a similar general pattern of a copepod-
mediated cascading predation impact on microzooplankton and nanoplankton. Ciliates were
reduced significantly by increasing copepod density which in turn enabled nanoflagellates to
increase in abundance. This cascading predation effect also became obvious under
conditions of nutrient enrichment.
Bacterioplankton responded heterogeneously to this clear 3-level trophic cascade and
was rather stimulated at low copepod densities and in copepod-free controls. Mainly in the
spring experiment, increased HNF-grazing at high copepod densities resulted in a decrease
of bacteria and bacterial production after 1 week (4-link trophic cascade) and an increase in
potentially grazing-resistant morphotypes. In the summer experiment, increasing copepod
and hence nanoflagellate abundances caused decreasing but less clear trends in bacterial
concentrations. However, at very high copepod densities (almost 80 ind.L-1) bacterial
responses were rather positive.
In contrast, blooming appendicularians (summer experiment) mainly reduced bacterial
abundance and production 3- to 5-fold.
Thus, direct and indirect effects of mesozooplankton groups propagated down to
heterotrophic and autotrophic bacterioplankton and induced numerical changes as well as
shifts in the activity patterns of the lower trophic levels. Remarkably, while protists were
similarly affected by copepod predation (ciliates decrease, HNF increase), the more complex
and heterogeneous response at the bacterial level could indicate the existence of buffering
and compensatory mechanisms.
CHAPTER III - Introduction
63
INTRODUCTIONIn marine pelagic ecosystems mesozooplankton link fish and macrozooplankton with primary
producers and microbial food web components. All of them can exert direct predation impact
on different microbial functional groups but also indirectly stimulate bacterial growth by
producing nutrients through sloppy feeding, excretion and leakage from fecal pellets (e.g.
Hygum et al. 1997, Møller and Nielsen 2001, Katechakis et al. 2002, Zubkov and López-
Urrutia 2003).
The way in which changes in the mesozooplankton community affect lower trophic
levels in marine ecosystems is still poorly understood. Most approaches focussed mainly on
extrinsic resource regulation of plankton dynamics (Verity and Smetacek 1996) lack the
consideration of intrinsic biotic and abiotic interactions to explain the magnitude and temporal
dynamics of zooplankton communities (Sipura et al. 2003). The importance of trophic
cascades and their ecosystem-level implications have been shown mainly for higher trophic
levels (Pace et al. 1999) or with respect to phytoplankton blooms (Carpenter et al. 1985),
whereas their impact on microbial food web components remains rather scarcely investigated
(Carpenter et al. 2001, Katechakis et al. 2002, Zöllner et al. 2003).
While cladocerans which often dominate in freshwater systems, can directly regulate
bacterioplankton as well as protists (e.g. Jürgens 1994), copepods and tunicates are the
dominant mesozooplankton guilds in marine environments. Pelagic tunicates (i.e.
appendicularians, salps, doliolids and pirosomids) potentially feed on bacteria but also affect
their protist predators by direct ingestion (e.g. King et al. 1980, Sommer and Stibor 2002) or
clearance by mucous houses (Vargas and Gonzalez 2004a). In contrast, adult copepods can
not feed directly on bacteria (e.g. Vargas and Gonzalez 2004b) but can cause an indirect
predation impact by grazing on protozoans (e.g. Calbet and Landry 1999, Zöllner et al. 2003).
Studies on short-term impact (1-3 days) in microcosms (Sipura et al. 2003, Zubkov
and López-Urrutia 2003) found copepods (single species) to stimulate bacterial growth by
excretion. However, the response of protist grazers was not included in that study (Zubkov
and López-Urrutia 2003) and limited experimental duration did not take bacterial feedback
mechanisms into account as a response to propagating trophic interactions cascading from
copepods via ciliates to heterotrophic nanoflagellates and bacteria. So far, results obtained
from microcosm studies suggest complexity in the trophic effect of mesozooplankton and the
existence of non-linear response patterns and indirect effects.
In the present study we investigated by means of large-scale enclosure experiments
how copepods and appendicularians as mesozooplankton groups with contrasting feeding
modes top-down impact the structure of the microbial food web.
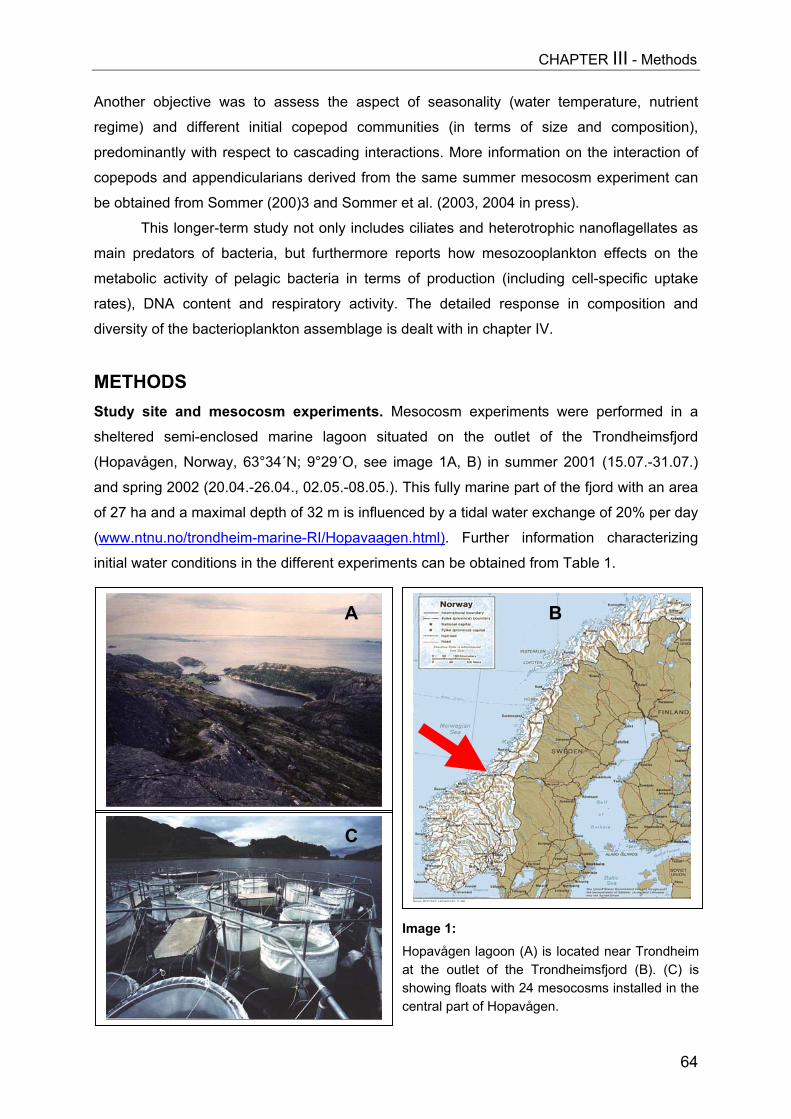
CHAPTER III - Methods
Another objective was to assess the aspect of seasonality (water temperature, nutrient
regime) and different initial copepod communities (in terms of size and composition),
predominantly with respect to cascading interactions. More information on the interaction of
copepods and appendicularians derived from the same summer mesocosm experiment can
be obtained from Sommer (200)3 and Sommer et al. (2003, 2004 in press).
This longer-term study not only includes ciliates and heterotrophic nanoflagellates as
main predators of bacteria, but furthermore reports how mesozooplankton effects on the
metabolic activity of pelagic bacteria in terms of production (including cell-specific uptake
rates), DNA content and respiratory activity. The detailed response in composition and
diversity of the bacterioplankton assemblage is dealt with in chapter IV.
METHODSStudy site and mesocosm experiments. Mesocosm experiments were performed in a
sheltered semi-enclosed marine lagoon situated on the outlet of the Trondheimsfjord
(Hopavågen, Norway, 63°34´N; 9°29´O, see image 1A, B) in summer 2001 (15.07.-31.07.)
and spring 2002 (20.04.-26.04., 02.05.-08.05.). This fully marine part of the fjord with an area
of 27 ha and a maximal depth of 32 m is influenced by a tidal water exchange of 20% per day
(www.ntnu.no/trondheim-marine-RI/Hopavaagen.html). Further information characterizing
initial water conditions in the different experiments can be obtained from Table 1.
IHasc
B
Amage 1:opavågen lagoon (A) t the outlet of the Thowing floats with 24 mentral part of Hopavåg
C
64
is located near Trondheimrondheimsfjord (B). (C) is
esocosms installed in theen.
CHAPTER III - Methods
65
The 24 transparent polyethylene enclosure bags (~1.5 m³ volume, 1.7 m³ in spring, see
image 1C) were filled by hauling the submerged bags to the water surface from around 3 m
depth. Mesozooplankton were removed by vertical net holes with plankton nets of 250 µm (Ø
80 cm) and 150 µm mesh size.
For the subsequent addition of zooplankton in defined seeding densities to the enclosures,
copepods were caught close to the surface by towing a 250 µm plankton net and transferred
into a 300 L container. Dead animals were allowed to sink to the bottom and were removed
before adding copepods.
Experimental treatments. In the two consecutive spring experiments (April and May
2002), the experimental treatments comprised a copepod-free control and copepod density
gradients with replicated treatments (see also Table 1). In addition to a community consisting
mainly of small copepod species (Temora longicornis, Centropages sp., Pseudocalanus
elongatus, copepodite stages I-III of Calanus finmarchicus and Oithona sp., net fraction
>250-500 µm, abbreviated with S1 to S4 and referred to as S-gradient) with nominal seeding
densities ranging from 0 to 27 individuals per liter, a gradient dominated by Calanus
finmarchicus (= L-gradient) was established with larger animals being collected with a net of
500 µm mesh size (70-80% C. finmarchicus copepodite stages III-V, see also chapter V and
Saage 2003). Because of a biomass being approximately three to four times higher, here
seeding densities were lower and ranged from 0 to 8.1. Seeding densities in the May
experiment were 0-40 (S-gradient) and 0-10 ind L-1 (L-gradient), respectively. In general,
applied copepod densities included the naturally occurring density amplitude of the
investigated systems.
The copepod density gradient in summer consisted of replicated treatments with 5
nominal seeding densities (5, 10, 20, 40 and 80 copepods per liter, named Cop1, Cop2,
Cop3, Cop4, Cop5, respectively). Additionally, two copepod-free controls (named Con) were
established, in which 10 hauls with a 250 µm net (every 3 days) were carried out to suppress
regrowth of zooplankton populations from the residual populations that survived the initial
removal. The copepod community consisted mainly of calanoid species (Temora longicornis
(45±5%), Centropages hamatus and Centropages typicus (together: 24±4%), as well as
Pseudocalanus elongatus (24±6%) and few Acartia longiremis (5±2%), see Sommer et al.
2003, 2004 in press). In all copepod bags a basic stock of the cyclopoid copepod Oithona
similis (6.0±0.7 ind L-1) was present whose densities were not increased by the addition of
copepods (Sommer et al. 2003).
As appendicularians were not possible to being concentrated by net catches (Sommer
et al. 2003), a procedure previously applied to obtain appendicularian treatments was used
(Stibor et al., 2003 in press). In order to release appendicularians from predation pressure,
copepods (nearly exclusively calanoid copepods, Sommer et al. 2003) were removed with a

CHAPTER III - Methods
66
250 µm net (10 hauls) from six bags, which then received no further manipulation. In those
bags the appendicularian Oikopleura dioica showed a mass development after around 9
days, which lasted for almost one week and peaked at densities of 24 and 35 individuals per
liter mainly in two mesocosms. Copepods were initially present at ~7 ind. L–1 and generally
increased in abundance to >20 to 30 ind. L–1 during the course of the experiment. Notably,
the highest densities of O. dioica on day 9 were observed in the bags with the lowest (<10
ind. L–1) copepod abundance (Sommer et al. 2003). Mainly those two mesocosms were
selected for investigation of the microbial food web response over time. In the spring
experiments no bloom of appendicularians was observed. More details on sampling and
population development of O. dioica in the investigated enclosures can also be found in
Sommer et al. (2003).
In order to assess the impact of nutrients on the food web structure dominated by
either copepods or appendicularians, six mesocosms were equally enriched with inorganic
nutrients (8 µmol N, 0.5 µmol PO43). Half of them received an addition of copepods (seeding
density 40 ind. per liter, EUCOP bags), whereas copepods were removed from the other
three bags by net hauls to allow appendicularians to develop (EUAPP bags). In those
mesocosms the appendicularian Oikopleura dioica showed a mass development after around
12 days (Sommer et al. 2003). The direct comparison with non-enriched mesocosms was
maintained over two weeks for appendicularians and over one week for copepods.
Sampling, enumerations and measurements. Samples for zooplankton counts
were taken every 3 days with a 50 µm plankton net (contents of 12 l water volume) and
preserved with formalin (4% final concentration). Subsamples of at least 200 total individuals
were counted to determine zooplankton densities. To account for the time-integrated impact
of copepod grazing, copepod densities in the gradient figures (after 1 week, Fig. 2) were
shown as geometric means calculated from 3 sampling counts.
Sampling of the mesocosms for microbial components (picoplankton, protozoans)
was done every 1 to 3 days using a 10 L-can after gently mixing the water column up to 2 m
depth with a Secchi disc. Chlorophyll a measurements were performed with a submersible
fluorometer (Fluoroprobe, BBE Moldaenke, Kiel, Germany) that is able to register in vivo
fluorescence of phytoplankton (e.g. Beutler et al. 2002). Pre-screened (<100 µm)
subsamples for the analysis of inorganic dissolved nutrients as well as total nitrogen (TN) and
total phosphorus (TP) were measured immediately after sampling by an autoanalyzer (Skalar
SANplus, Skalar, Breda, the Netherlands) according to standard procedures (Grasshoff et al.
1999). Sampling, fixation and enumeration of ciliates and heterotrophic nanoflagellates as
well as bacterial biovolume determinations and production measurements of heterotrophic
bacterioplankton were performed as described in chapter I. Ciliate identification followed the
CHAPTER III - Methods
67
“user-friendly guide to coastal planktonic ciliates” by Strüder-Kypke et al., which is available
in the internet at www.liv.ac.uk/ciliate/index.htm.
Flow cytometric measurements of abundances of heterotrophic bacteria,
autotrophic pico- (Synechococcus, data for autotrophic picoeukaryotes not shown) and
nanoplankton were based on the method published by Del Giorgio et al. (1996) and Gasol et
al. (1999) as discussed in Gasol and Del Giorgio (2000). Samples were fixed with 1%
paraformaldehyde + 0.05% glutaraldehyde (final concentration), then after 15 min. deep
frozen in liquid nitrogen and stored frozen at –80°C. For analysis, the samples of bacteria
were unfrozen and stained with SYTO 13 (Molecular Probes, final concentration 5 µM,
diluted in DMS) for 15 min. in the dark and run through a FACScalibur flow cytometer (Becton
& Dickinson, San José, CA, USA) with a laser emitting at 488 nm until around 10000 events
have been acquired (log mode).
According to their cellular DNA content, 3 different subgroups (LNA, MNA, HNA) of
bacteria were discriminated by their signature in a plot of Side Scatter (SSC) vs. FL1
parameters. Picocyanobacteria (Synechococcus) were detected by their signature in a plot of
orange fluorescence (FL2) vs. red fluorescence (FL3). Yellow green 0.92 µm latex beads
(Polysciences) calibrated with TRUCOUNTTM controls (Becton & Dickinson) were used as
internal standard in all measurements.
The analysis of actively respiring bacteria is based on the use of the redox dye 5-
Cyano-2,3-ditolyl tetrazolium chloride (CTC, Polysciences) which was applied according to
Del Giorgio et al. (1997) and Sieracki et al. (1999). After preparation of a 50 mM CTC stock
solution (filtered by 0.2 µm, stored at 4°C), for experimental measurement at two time points,
0.9 ml of sample (+ 1 fixed control) and 0.1 ml of this stock solution (5 mM final) were
incubated in a 2 ml cryovial for 45 minutes at in situ temperature. Incubation was stopped by
addition of 1% paraformaldehyde + 0.05% glutaraldehyde (final concentration) followed by
freezing in liquid nitrogen (after 15 minutes) and storage in a freezer (-80°C). Later the
samples were measured with a FACScalibur (Becton & Dickinson) flow cytometer with the
following settings: FSC: E01, SSC: 400, FL1: 500, FL2: 675, FL3: 629, threshold in FL3: 90.
Acquisition and analysis of all flow cytometric data was done using Cell-Quest software
(Becton Dickinson).
Determination of bacterial grazing losses. For estimation of protist community
grazing impact on bacterioplankton, a microcosm grazing experiment using fluorescently
labeled bacteria (FLB, Sherr et al. 1987) was performed with water of selected enclosures
(S1, S3, S4, L1, L3, L4) on day 5 of the second spring experiment. 500 ml Duran bottles (3
replicates + GF/F-filtered control) were filled with enclosure water, which was prefiltered by
100 µm mesh size to remove larger zooplankton. DTAF-stained bacteria (cultured bacteria
with a mean size of 1.15 µm, biovolume of 0.20 µm³, similar to measured mean cell volume

CHAPTER III - Results
68
of 0.18 µm³ obtained from bacterial communities in copepod mesocosms after 1 week) were
added at a final concentration of 4 x 10⁵ ml-1 to the bottles, which were then incubated in
cages in situ at around 1 m depth. Subsamples of 10 ml, taken immediately after the addition
of FLB (T0) and after 24 h, were fixed with formalin (2 % final concentration), filtered onto 0.2
µm polycarbonate filters, stained with DAPI and stored at –20°C until enumeration. At least
500 FLB were counted per sample under blue light excitation.
Grazing losses (after 24 h, t0-t24) for each selected community, shown as cell loss of initial
FLB concentration Nt0 (means), were calculated according to :
Here values of GF/F-filtered controls (Ft0,t24) without protists were subtracted from means of
treatment bottles to correct for non-grazing losses e.g. due to adsorption of FLB.
Statistical analyses. In order to analyse the effects of mesozooplankton on the
abundances and incorporation rates of pico- and nanoplankton regression analyses were
performed. Thereby, each dependent parameter (Y) was tested against zooplankton biomass
as an independent parameter (X) and regression models using first and second order
polynomial equations or power regressions (y = axb) were calculated. For analysis of
changes and treatment effects over time, 1- and 2-way Repeated-Measures ANOVAs and
post-hoc comparisons were performed (means and Tukey HSD in Statistica 6.0).
RESULTS Mesocosm experimental conditionsThe general initial situations differed markedly among the five independent copepod
gradients regarding abiotic and biotic parameters (Tab.1). Averaged water temperatures
were 4-5°C higher in summer than in spring, but varied only slightly during the experiments.
Initial salinity values were comparable during the first spring experiment (around 31 PSU)
and in summer, and slightly higher in the second spring experiment (33 PSU). More
differences were due to nutrient conditions. While the initial summer TN:TP ratio of 28.5:1
exceeded those in spring, the starting concentrations of dissolved nutrients (P, N) were much
lower (sometimes at the detection limit) than those measured in spring, especially when
compared with the May experiment. In terms of chlorophyll a, initial values were found to be
in a similar range in all experiments with spring concentrations achieving a slightly higher
level (Tab. 1).
Nt0
(Nt0-Nt24) -(Ft0-Ft24) x 100% of Nt0 =
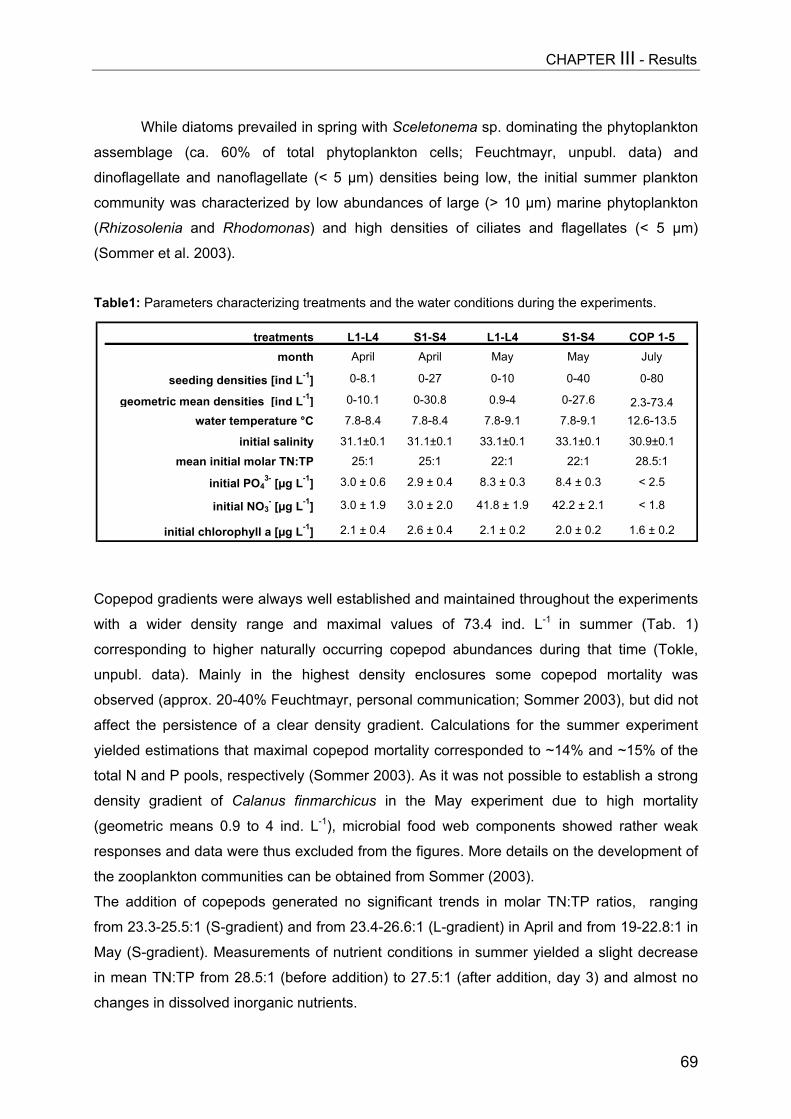
CHAPTER III - Results
69
While diatoms prevailed in spring with Sceletonema sp. dominating the phytoplankton
assemblage (ca. 60% of total phytoplankton cells; Feuchtmayr, unpubl. data) and
dinoflagellate and nanoflagellate (< 5 µm) densities being low, the initial summer plankton
community was characterized by low abundances of large (> 10 µm) marine phytoplankton
(Rhizosolenia and Rhodomonas) and high densities of ciliates and flagellates (< 5 µm)
(Sommer et al. 2003).
Table1: Parameters characterizing treatments and the water conditions during the experiments.
Copepod gradients were always well established and maintained throughout the experiments
with a wider density range and maximal values of 73.4 ind. L-1 in summer (Tab. 1)
corresponding to higher naturally occurring copepod abundances during that time (Tokle,
unpubl. data). Mainly in the highest density enclosures some copepod mortality was
observed (approx. 20-40% Feuchtmayr, personal communication; Sommer 2003), but did not
affect the persistence of a clear density gradient. Calculations for the summer experiment
yielded estimations that maximal copepod mortality corresponded to ~14% and ~15% of the
total N and P pools, respectively (Sommer 2003). As it was not possible to establish a strong
density gradient of Calanus finmarchicus in the May experiment due to high mortality
(geometric means 0.9 to 4 ind. L-1), microbial food web components showed rather weak
responses and data were thus excluded from the figures. More details on the development of
the zooplankton communities can be obtained from Sommer (2003).
The addition of copepods generated no significant trends in molar TN:TP ratios, ranging
from 23.3-25.5:1 (S-gradient) and from 23.4-26.6:1 (L-gradient) in April and from 19-22.8:1 in
May (S-gradient). Measurements of nutrient conditions in summer yielded a slight decrease
in mean TN:TP from 28.5:1 (before addition) to 27.5:1 (after addition, day 3) and almost no
changes in dissolved inorganic nutrients.
treatments L1-L4 S1-S4 L1-L4 S1-S4 COP 1-5month April April May May July
seeding densities [ind L-1] 0-8.1 0-27 0-10 0-40 0-80
geometric mean densities [ind L-1] 0-10.1 0-30.8 0.9-4 0-27.6 2.3-73.4water temperature °C 7.8-8.4 7.8-8.4 7.8-9.1 7.8-9.1 12.6-13.5
initial salinity 31.1±0.1 31.1±0.1 33.1±0.1 33.1±0.1 30.9±0.1
mean initial molar TN:TP 25:1 25:1 22:1 22:1 28.5:1
initial PO43- [µg L-1] 3.0 ± 0.6 2.9 ± 0.4 8.3 ± 0.3 8.4 ± 0.3 < 2.5
initial NO3- [µg L-1] 3.0 ± 1.9 3.0 ± 2.0 41.8 ± 1.9 42.2 ± 2.1 < 1.8
initial chlorophyll a [µg L-1] 2.1 ± 0.4 2.6 ± 0.4 2.1 ± 0.2 2.0 ± 0.2 1.6 ± 0.2
CHAPTER III - Results
70
Copepod effects on microbial food webs in spring and summerTemporal development of microbial componentsIn terms of the development of microbial food webs in selected mesocosms (controls, lowest
and highest copepod densities) over time, similar patterns were observed at the protist level
during both seasons. In the first spring experiment, total ciliate numbers showed a significant
treatment-dependent abundance alteration (Fig. 1A) and substantially increased in
mesocosms without copepods and with lowest copepod densities (S1, L1) and remained on a
high level (25-40 cells ml-1).
The initial ciliate community consisted mainly of cells smaller than 40 µm and a high
proportion of ciliates <20 µm (50%). Absolute densities showed a wide range from 0.02 to 43
cells ml-1 (means of enclosure replicates) in the course of the experiment. Apart from mostly
oligotrich species like Strombidium spp., Lohmanniella sp., Leegaardiella sp. and Laboea sp.,
Myrionecta rubra was the predominant non-oligotrich ciliate in spring. In mesocosms with
high copepod abundances (S4, L4), ciliate numbers clearly declined and showed an order-of-
magnitude reduction after 1 week.
Similarly, in the summer situation with higher initial ciliate numbers (25.4 cells ml-1),
ciliates were significantly affected over time and significantly responded to the selected
copepod treatments (see Fig 1 E, Table 2A,B). The increase in ciliate abundance observed in
the low density copepod treatments (Cop1) was even stronger than in the control
mesocosms (Fig. 1E), while ciliate densities in the Cop5 bags strongly declined (p<0.0001).
The summer ciliate community consisted mainly of small oligotrich species (>80%) like
Strombidium dalum. Conversely, heterotrophic as well as auto-/mixotrophic (data not shown)
nanoflagellates (Fig. 1B, F) mostly consisted of forms <5 µm (>88%) and increased over
experimental time in high density copepod treatments (S4, L4, cop5) in spring and summer,
thereby reaching maximal spring abundances of 19.4x10³ cells ml-1. In contrast, they
decreased in the control and lowest cop-density mesocosms to numbers below 1x10³ cells
ml-1 (Fig. 1B) in spring or remained at low level in summer (Fig. 1F). Thus, besides significant
time-dependent changes, HNF abundance significantly responded to copepod treatments in
spring (F4,5=27.24; p<.0014) as well as in summer (F2,3=9.82, p<0.0483, post-hoc comparison
of means, Table 2B).
For bacterial abundances significant time-dependent and time-treatment interaction
effects became obvious in spring, but treatment effect alone was not significant (p=0.0972;
Table 2B). Abundances decreased (Fig. 1C, Table 2B) and remained low in S1 and L1 until
day 4 (0.52-0.87x10⁶ ml-1). In the S4 mesocosms, they decreased only slightly and remained
at a comparably low level until day 3, whereas they increased in the L4 bags during that time.
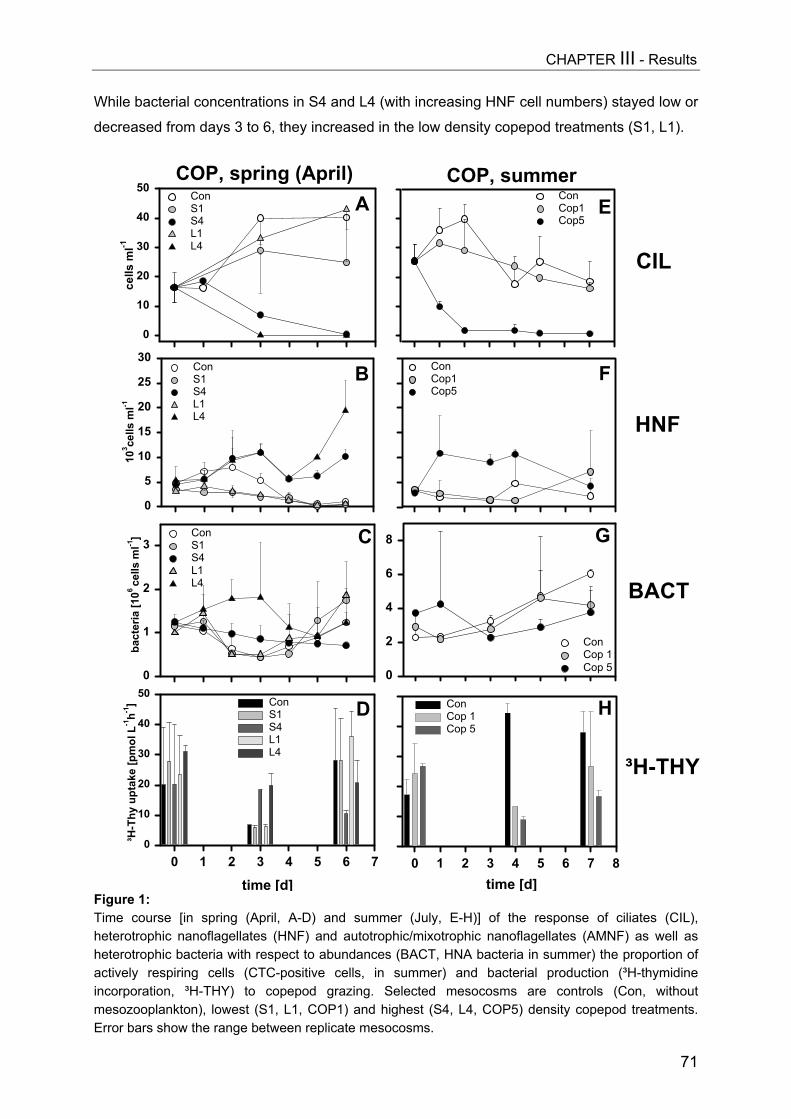
CHAPTER III - Results
71
While bacterial concentrations in S4 and L4 (with increasing HNF cell numbers) stayed low or
decreased from days 3 to 6, they increased in the low density copepod treatments (S1, L1).
Figure 1:Time course [in spring (April, A-D) and summer (July, E-H)] of the response of ciliates (CIL),heterotrophic nanoflagellates (HNF) and autotrophic/mixotrophic nanoflagellates (AMNF) as well asheterotrophic bacteria with respect to abundances (BACT, HNA bacteria in summer) the proportion ofactively respiring cells (CTC-positive cells, in summer) and bacterial production (³H-thymidineincorporation, ³H-THY) to copepod grazing. Selected mesocosms are controls (Con, withoutmesozooplankton), lowest (S1, L1, COP1) and highest (S4, L4, COP5) density copepod treatments.Error bars show the range between replicate mesocosms.
COP, summer
CIL
HNF
0
2
4
6
8
ConCop 1Cop 5
COP, spring (April)ConCop1Cop5
BACT
³H-THY
bact
eria
[106
cells
ml-1
]
0
1
2
3ConS1S4L1L4
time [d]0 1 2 3 4 5 6 7 8
ConCop 1Cop 5
time [d]0 1 2 3 4 5 6 7
³H-T
hy u
ptak
e [p
mol
L-1
h-1]
0
10
20
30
40
50Con S1S4L1L4
cells
ml-1
0
10
20
30
40
50ConS1S4L1L4
A
C
D
E
G
H
103 ce
lls m
l-1
0
5
10
15
20
25
30ConS1S4L1L4
B ConCop1Cop5
F
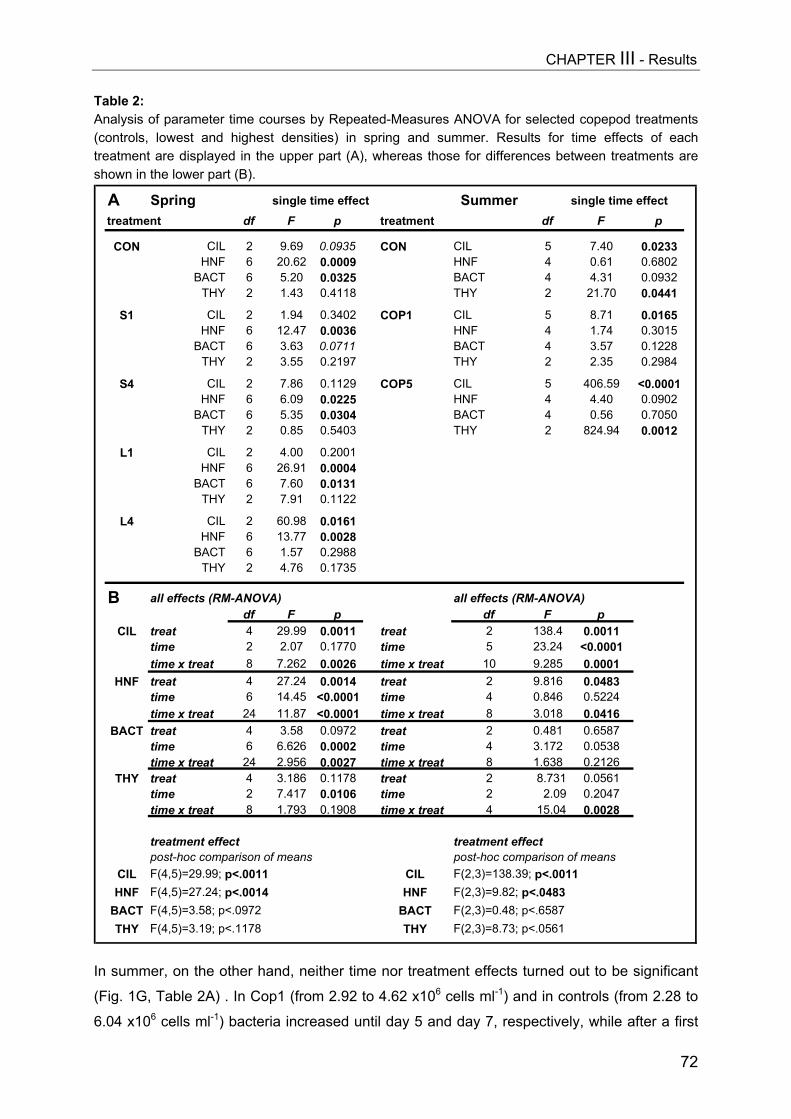
CHAPTER III - Results
72
Table 2:Analysis of parameter time courses by Repeated-Measures ANOVA for selected copepod treatments(controls, lowest and highest densities) in spring and summer. Results for time effects of eachtreatment are displayed in the upper part (A), whereas those for differences between treatments areshown in the lower part (B).
In summer, on the other hand, neither time nor treatment effects turned out to be significant
(Fig. 1G, Table 2A) . In Cop1 (from 2.92 to 4.62 x10⁶ cells ml-1) and in controls (from 2.28 to
6.04 x10⁶ cells ml-1) bacteria increased until day 5 and day 7, respectively, while after a first
A Spring single time effect Summer single time effecttreatment df F p treatment df F p
CON CIL 2 9.69 0.0935 CON CIL 5 7.40 0.0233HNF 6 20.62 0.0009 HNF 4 0.61 0.6802
BACT 6 5.20 0.0325 BACT 4 4.31 0.0932THY 2 1.43 0.4118 THY 2 21.70 0.0441
S1 CIL 2 1.94 0.3402 COP1 CIL 5 8.71 0.0165HNF 6 12.47 0.0036 HNF 4 1.74 0.3015
BACT 6 3.63 0.0711 BACT 4 3.57 0.1228THY 2 3.55 0.2197 THY 2 2.35 0.2984
S4 CIL 2 7.86 0.1129 COP5 CIL 5 406.59 <0.0001HNF 6 6.09 0.0225 HNF 4 4.40 0.0902
BACT 6 5.35 0.0304 BACT 4 0.56 0.7050THY 2 0.85 0.5403 THY 2 824.94 0.0012
L1 CIL 2 4.00 0.2001HNF 6 26.91 0.0004
BACT 6 7.60 0.0131THY 2 7.91 0.1122
L4 CIL 2 60.98 0.0161HNF 6 13.77 0.0028
BACT 6 1.57 0.2988THY 2 4.76 0.1735
B all effects (RM-ANOVA) all effects (RM-ANOVA)df F p df F p
CIL treat 4 29.99 0.0011 treat 2 138.4 0.0011time 2 2.07 0.1770 time 5 23.24 <0.0001time x treat 8 7.262 0.0026 time x treat 10 9.285 0.0001
HNF treat 4 27.24 0.0014 treat 2 9.816 0.0483time 6 14.45 <0.0001 time 4 0.846 0.5224time x treat 24 11.87 <0.0001 time x treat 8 3.018 0.0416
BACT treat 4 3.58 0.0972 treat 2 0.481 0.6587time 6 6.626 0.0002 time 4 3.172 0.0538time x treat 24 2.956 0.0027 time x treat 8 1.638 0.2126
THY treat 4 3.186 0.1178 treat 2 8.731 0.0561time 2 7.417 0.0106 time 2 2.09 0.2047time x treat 8 1.793 0.1908 time x treat 4 15.04 0.0028
treatment effect treatment effect post-hoc comparison of means post-hoc comparison of means
CIL F(4,5)=29.99; p<.0011 CIL F(2,3)=138.39; p<.0011HNF F(4,5)=27.24; p<.0014 HNF F(2,3)=9.82; p<.0483
BACT F(4,5)=3.58; p<.0972 BACT F(2,3)=0.48; p<.6587THY F(4,5)=3.19; p<.1178 THY F(2,3)=8.73; p<.0561

CHAPTER III - Results
73
substantial increase they remained at lower concentrations in the Cop5 treatments (2.89 to
3.77 x10⁶ cells ml-1). In the experimental time course, significant changes were noted for
bacterial ³H-thymidine uptake (Table 2A) in spring and summer (Fig.1H), ranging from 6.1 to
36.1 pmol L-1h-1. Values for this production parameter were roughly in accordance with
bacterial abundances, showing first a decrease (day 3) then an increase (to day 6) in the
controls and low copepod density treatments. In high density treatments (S4, L4), instead,
thymidine uptake rates decreased in the course of the experiment (Fig. 1D). In spring as well
as in summer, amplitudes for thymidine uptake were greater in magnitude than for
abundances. Summer maxima on day 4 in the control mesocosms reached 44.4 pmol L-1h-1,
thereby clearly exceeding those from copepod treatments. Here, the interaction effect of time
and treatment yielded a significant response (Table 2A).
Abundances of autotrophic picoplankton were clearly lower than 104 cells per ml in
spring and were thus considered as rather negligible, whereas higher densities were found in
summer (data not shown in graph). Here, Synechococcus densities decreased to 41% of
their initial values in controls (from 7.95 - 3.28x10⁴ ml-1, whereas they were reduced less in
the cop1 and cop5 mesocosms (77 and 89% of initial densities, respectively).
Response to gradients of copepod abundanceMicrobial food webs displayed distinct responses after being exposed to copepod density
gradients (shown as geometric means) for 1 week (Fig. 2, Table 3). Among the investigated
components, ciliates and nanoflagellates revealed very similar patterns in the two spring and
one summer experiments (Fig. 2, A-L, Table 3), while more complex response characteristics
were noted at the picoplankton level. Compared to the spring experiments, the response of
the microbial community in summer (Fig. 2I-L) took place over a wider range of copepod
densities with maximal values of 73.4 copepods per liter (geometric mean).
After 1 week of copepod grazing, ciliates of all size classes showed a significant
decrease with increasing copepod abundances in spring and summer. Along the Calanus
finmarchicus (L) gradient, this reduction was even more pronounced than in small copepod
(S) gradients (Fig. 2A, E) and showed a density range of more than one order of magnitude
(Fig.2A). An opposite response pattern with a highly significant and nearly exponential
increase was found for heterotrophic (p<0.0001, p<0.01 in May) and even more pronounced
for auto-/mixotrophic (AMNF) nanoflagellates (Fig. 2 B, F, J). HNF spring densities ranged
from 0.19 to 10.9x10³ cells ml-1along the small copepod density gradient and from 0.47 to
22.5x10³ cells ml-1 along the Calanus gradient (Fig. 2B). Thus, the HNF incline was even
more distinct in the latter gradient. In summer, autotrophic and heterotrophic nanoflagellates
responded differentially with increasing copepod density (Fig. 2J). While AMNF showed a
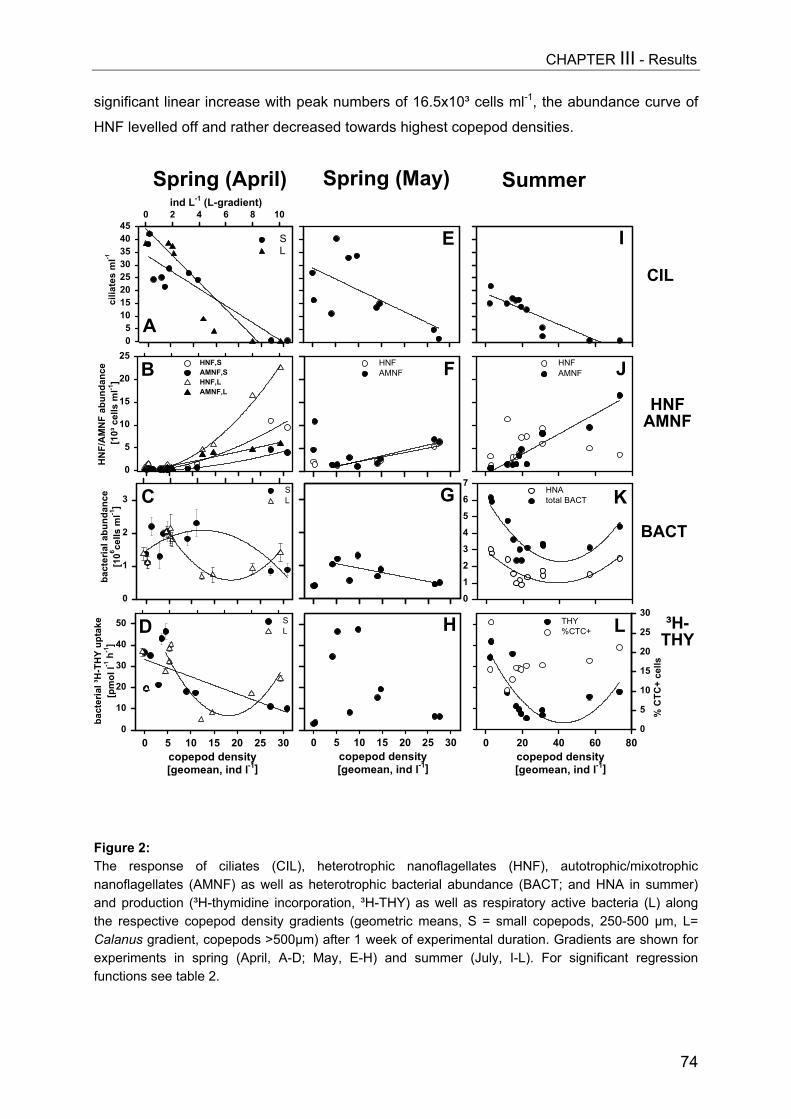
CHAPTER III - Results
74
significant linear increase with peak numbers of 16.5x10³ cells ml-1, the abundance curve of
HNF levelled off and rather decreased towards highest copepod densities.
Figure 2:The response of ciliates (CIL), heterotrophic nanoflagellates (HNF), autotrophic/mixotrophicnanoflagellates (AMNF) as well as heterotrophic bacterial abundance (BACT; and HNA in summer)and production (³H-thymidine incorporation, ³H-THY) as well as respiratory active bacteria (L) alongthe respective copepod density gradients (geometric means, S = small copepods, 250-500 µm, L=Calanus gradient, copepods >500µm) after 1 week of experimental duration. Gradients are shown forexperiments in spring (April, A-D; May, E-H) and summer (July, I-L). For significant regressionfunctions see table 2.
cilia
tes
ml-1
05
1015202530354045
ind L-1 (L-gradient)0 2 4 6 8 10
SL
Spring (April)
bact
eria
l abu
ndan
ce[1
06 cells
ml-1
]
0
1
2
3SL
copepod density[geomean, ind l-1]
0 5 10 15 20 25 30
bact
eria
l ³H
-TH
Y up
take
[pm
ol l-1
h-1
]
0
10
20
30
40
50 SL
HNF AMNF
Summer
01234567
HNA total BACT
copepod density[geomean, ind l-1]
0 20 40 60 80
% C
TC+
cells
0
5
10
15
20
25
30THY%CTC+
Spring (May)
HNFAMNF
copepod density[geomean, ind l-1]
0 5 10 15 20 25 30
CIL
HNFAMNF
BACT
³H-THY
HN
F/A
MN
F ab
unda
nce
[10³
cel
ls m
l-1]
0
5
10
15
20
25HNF,S AMNF,SHNF,L AMNF,L
A
B
C
D
E
F
G
H
I
J
K
L
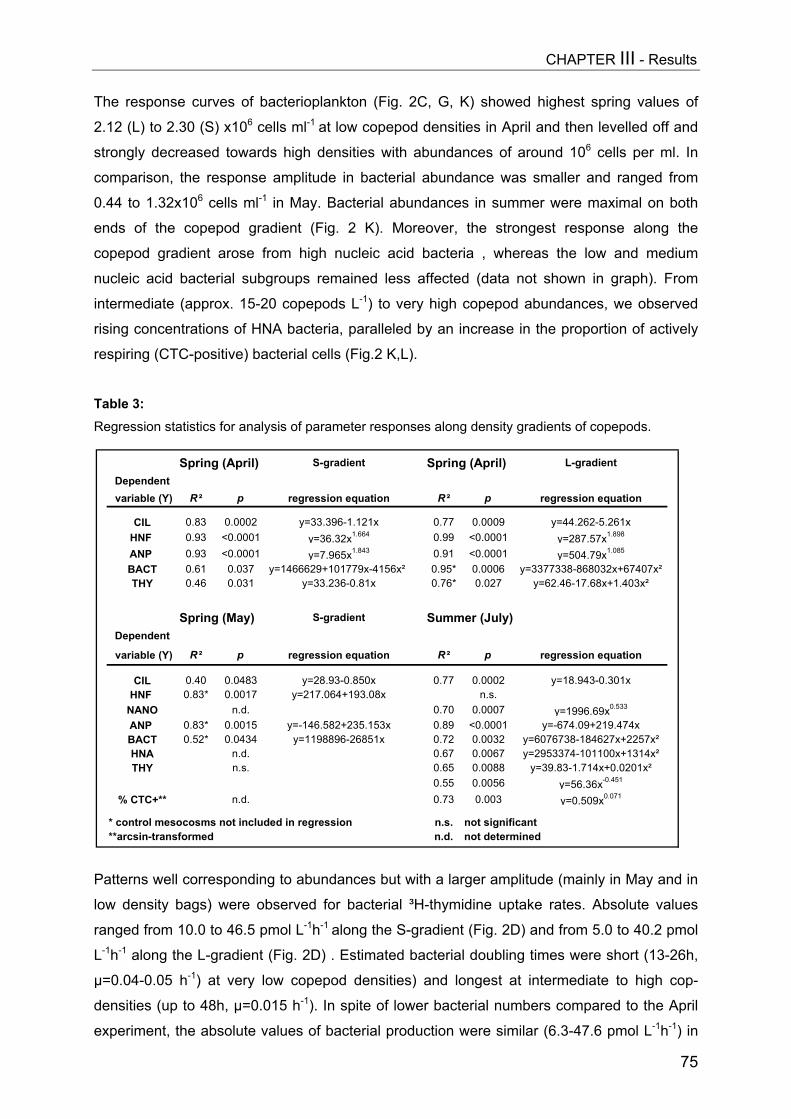
CHAPTER III - Results
75
The response curves of bacterioplankton (Fig. 2C, G, K) showed highest spring values of
2.12 (L) to 2.30 (S) x106 cells ml-1 at low copepod densities in April and then levelled off and
strongly decreased towards high densities with abundances of around 106 cells per ml. In
comparison, the response amplitude in bacterial abundance was smaller and ranged from
0.44 to 1.32x10⁶ cells ml-1 in May. Bacterial abundances in summer were maximal on both
ends of the copepod gradient (Fig. 2 K). Moreover, the strongest response along the
copepod gradient arose from high nucleic acid bacteria , whereas the low and medium
nucleic acid bacterial subgroups remained less affected (data not shown in graph). From
intermediate (approx. 15-20 copepods L-1) to very high copepod abundances, we observed
rising concentrations of HNA bacteria, paralleled by an increase in the proportion of actively
respiring (CTC-positive) bacterial cells (Fig.2 K,L).
Table 3:Regression statistics for analysis of parameter responses along density gradients of copepods.
Patterns well corresponding to abundances but with a larger amplitude (mainly in May and in
low density bags) were observed for bacterial ³H-thymidine uptake rates. Absolute values
ranged from 10.0 to 46.5 pmol L-1h-1 along the S-gradient (Fig. 2D) and from 5.0 to 40.2 pmol
L-1h-1 along the L-gradient (Fig. 2D) . Estimated bacterial doubling times were short (13-26h,
µ=0.04-0.05 h-1) at very low copepod densities) and longest at intermediate to high cop-
densities (up to 48h, µ=0.015 h-1). In spite of lower bacterial numbers compared to the April
experiment, the absolute values of bacterial production were similar (6.3-47.6 pmol L-1h-1) in
Spring (April) S-gradient Spring (April) L-gradientDependent variable (Y) R ² p regression equation R ² p regression equation
CIL 0.83 0.0002 y=33.396-1.121x 0.77 0.0009 y=44.262-5.261xHNF 0.93 <0.0001 y=36.32x1.664 0.99 <0.0001 y=287.57x1.898
ANP 0.93 <0.0001 y=7.965x1.843 0.91 <0.0001 y=504.79x1.085
BACT 0.61 0.037 y=1466629+101779x-4156x² 0.95* 0.0006 y=3377338-868032x+67407x²THY 0.46 0.031 y=33.236-0.81x 0.76* 0.027 y=62.46-17.68x+1.403x²
Spring (May) S-gradient Summer (July)Dependent
variable (Y) R ² p regression equation R ² p regression equation
CIL 0.40 0.0483 y=28.93-0.850x 0.77 0.0002 y=18.943-0.301xHNF 0.83* 0.0017 y=217.064+193.08x n.s.
NANO n.d. 0.70 0.0007 y=1996.69x0.533
ANP 0.83* 0.0015 y=-146.582+235.153x 0.89 <0.0001 y=-674.09+219.474xBACT 0.52* 0.0434 y=1198896-26851x 0.72 0.0032 y=6076738-184627x+2257x²HNA n.d. 0.67 0.0067 y=2953374-101100x+1314x²THY n.s. 0.65 0.0088 y=39.83-1.714x+0.0201x²
0.55 0.0056 y=56.36x-0.451
% CTC+** n.d. 0.73 0.003 y=0.509x0.071
* control mesocosms not included in regression n.s. not significant **arcsin-transformed n.d. not determined
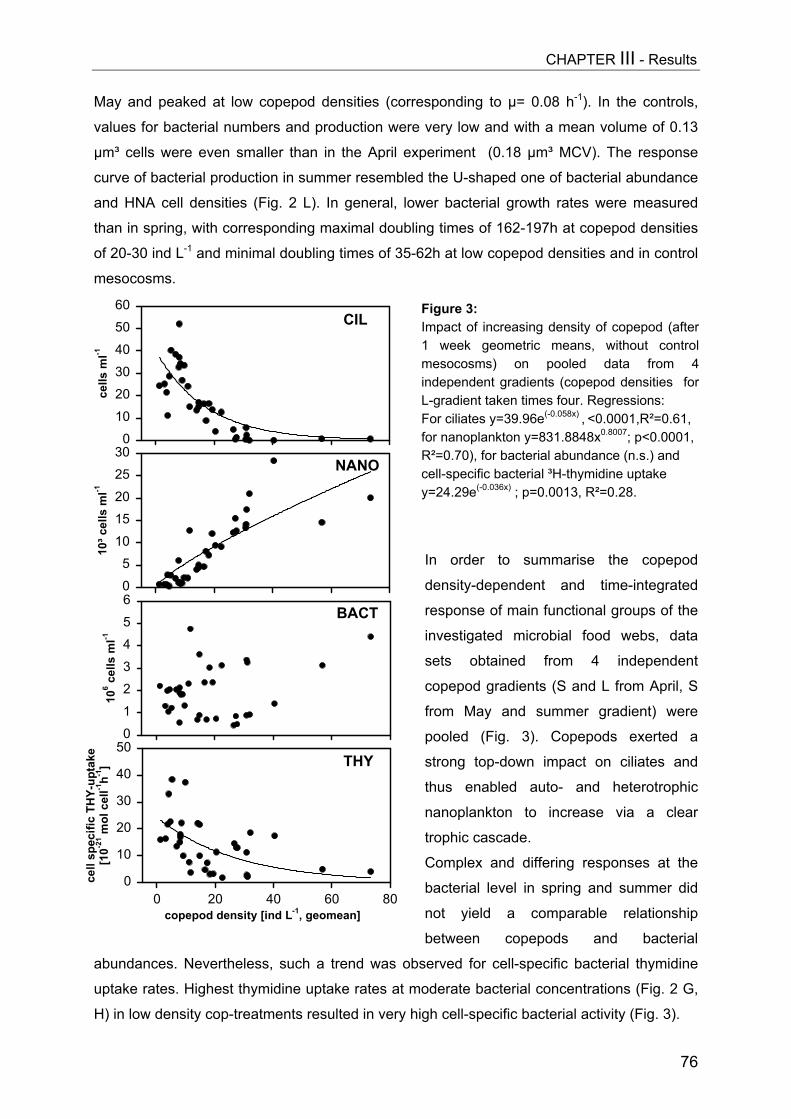
CHAPTER III - Results
76
May and peaked at low copepod densities (corresponding to µ= 0.08 h-1). In the controls,
values for bacterial numbers and production were very low and with a mean volume of 0.13
µm³ cells were even smaller than in the April experiment (0.18 µm³ MCV). The response
curve of bacterial production in summer resembled the U-shaped one of bacterial abundance
and HNA cell densities (Fig. 2 L). In general, lower bacterial growth rates were measured
than in spring, with corresponding maximal doubling times of 162-197h at copepod densities
of 20-30 ind L-1 and minimal doubling times of 35-62h at low copepod densities and in control
mesocosms.
In order to summarise the copepod
density-dependent and time-integrated
response of main functional groups of the
investigated microbial food webs, data
sets obtained from 4 independent
copepod gradients (S and L from April, S
from May and summer gradient) were
pooled (Fig. 3). Copepods exerted a
strong top-down impact on ciliates and
thus enabled auto- and heterotrophic
nanoplankton to increase via a clear
trophic cascade.
Complex and differing responses at the
bacterial level in spring and summer did
not yield a comparable relationship
between copepods and bacterial
abundances. Nevertheless, such a trend was observed for cell-specific bacterial thymidine
uptake rates. Highest thymidine uptake rates at moderate bacterial concentrations (Fig. 2 G,
H) in low density cop-treatments resulted in very high cell-specific bacterial activity (Fig. 3).
CIL
cells
ml-1
0102030405060
NANO
10³ c
ells
ml-1
05
1015202530
copepod density [ind L-1, geomean]0 20 40 60 80
cell
spec
ific
THY-
upta
ke[1
0-21 m
ol c
ell-1
h-1]
0
10
20
30
40
50
THY
BACT
106 c
ells
ml-1
0123456
THY
Figure 3:Impact of increasing density of copepod (after1 week geometric means, without controlmesocosms) on pooled data from 4independent gradients (copepod densities forL-gradient taken times four. Regressions:For ciliates y=39.96e(-0.058x) , <0.0001,R²=0.61,for nanoplankton y=831.8848x0.8007; p<0.0001,R²=0.70), for bacterial abundance (n.s.) andcell-specific bacterial ³H-thymidine uptakey=24.29e(-0.036x) ; p=0.0013, R²=0.28.
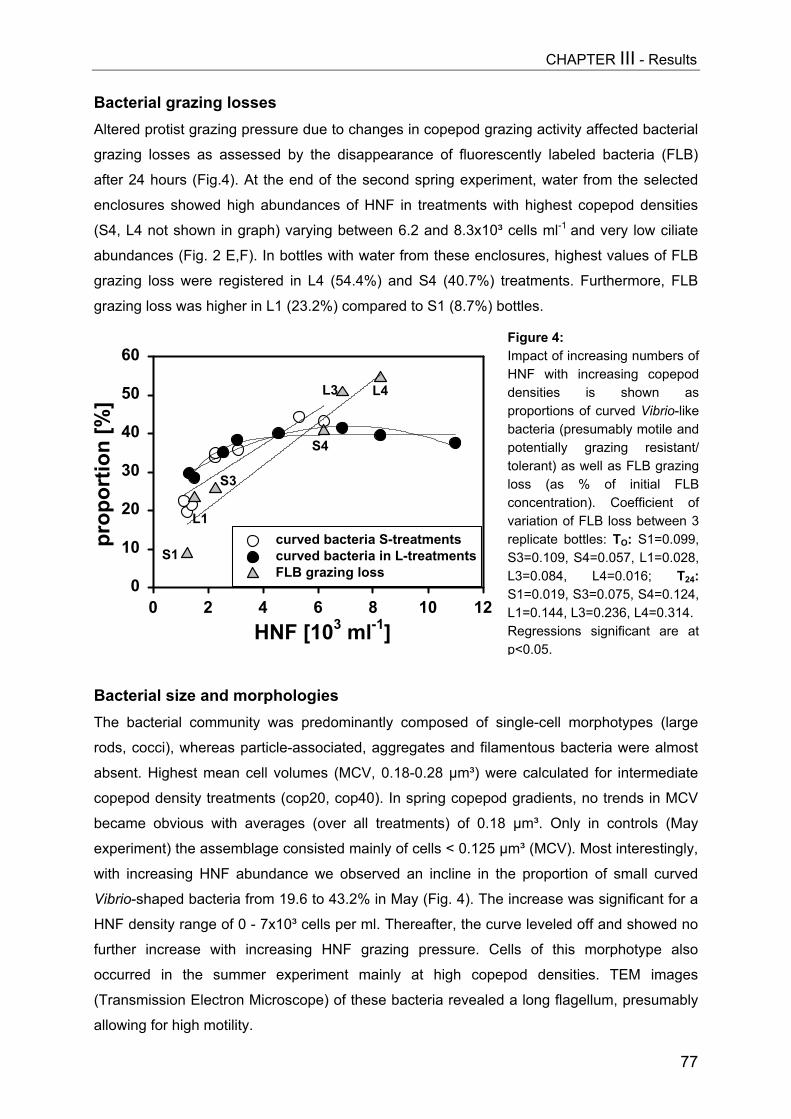
CHAPTER III - Results
Bacterial grazing lossesAltered protist grazing pressure due to changes in copepod grazing activity affected bacterial
grazing losses as assessed by the disappearance of fluorescently labeled bacteria (FLB)
after 24 hours (Fig.4). At the end of the second spring experiment, water from the selected
enclosures showed high abundances of HNF in treatments with highest copepod densities
(S4, L4 not shown in graph) varying between 6.2 and 8.3x10³ cells ml-1 and very low ciliate
abundances (Fig. 2 E,F). In bottles with water from these enclosures, highest values of FLB
grazing loss were registered in L4 (54.4%) and S4 (40.7%) treatments. Furthermore, FLB
grazing loss was higher in L1 (23.2%) compared to S1 (8.7%) bottles.
Bacterial size and morphologiesThe bacterial community was predominantly composed of s
rods, cocci), whereas particle-associated, aggregates and fila
absent. Highest mean cell volumes (MCV, 0.18-0.28 µm³) we
copepod density treatments (cop20, cop40). In spring copepo
became obvious with averages (over all treatments) of 0.18
experiment) the assemblage consisted mainly of cells < 0.125
with increasing HNF abundance we observed an incline in t
Vibrio-shaped bacteria from 19.6 to 43.2% in May (Fig. 4). The
HNF density range of 0 - 7x10³ cells per ml. Thereafter, the cu
further increase with increasing HNF grazing pressure. C
occurred in the summer experiment mainly at high cope
(Transmission Electron Microscope) of these bacteria revealed
allowing for high motility.
HNF [103 ml-1]0 2 4 6 8 10 12
prop
ortio
n [%
]
0
10
20
30
40
50
60
curved bacteria S-treatments curved bacteria in L-treatmentsFLB grazing loss
S1
L1
S3
S4
L3 L4
Figure 4:Impact of increasing numbers ofHNF with increasing copepoddensities is shown asproportions of curved Vibrio-likebacteria (presumably motile andpotentially grazing resistant/tolerant) as well as FLB grazingloss (as % of initial FLBconcentration). Coefficient ofvariation of FLB loss between 3replicate bottles: TO: S1=0.099,S3=0.109, S4=0.057, L1=0.028,L3=0.084, L4=0.016; T24:S1=0.019, S3=0.075, S4=0.124,L1=0.144, L3=0.236, L4=0.314.Regressions significant are atp<0.05.
77
ingle-cell morphotypes (large
mentous bacteria were almost
re calculated for intermediate
d gradients, no trends in MCV
µm³. Only in controls (May
µm³ (MCV). Most interestingly,
he proportion of small curved
increase was significant for a
rve leveled off and showed no
ells of this morphotype also
pod densities. TEM images
a long flagellum, presumably
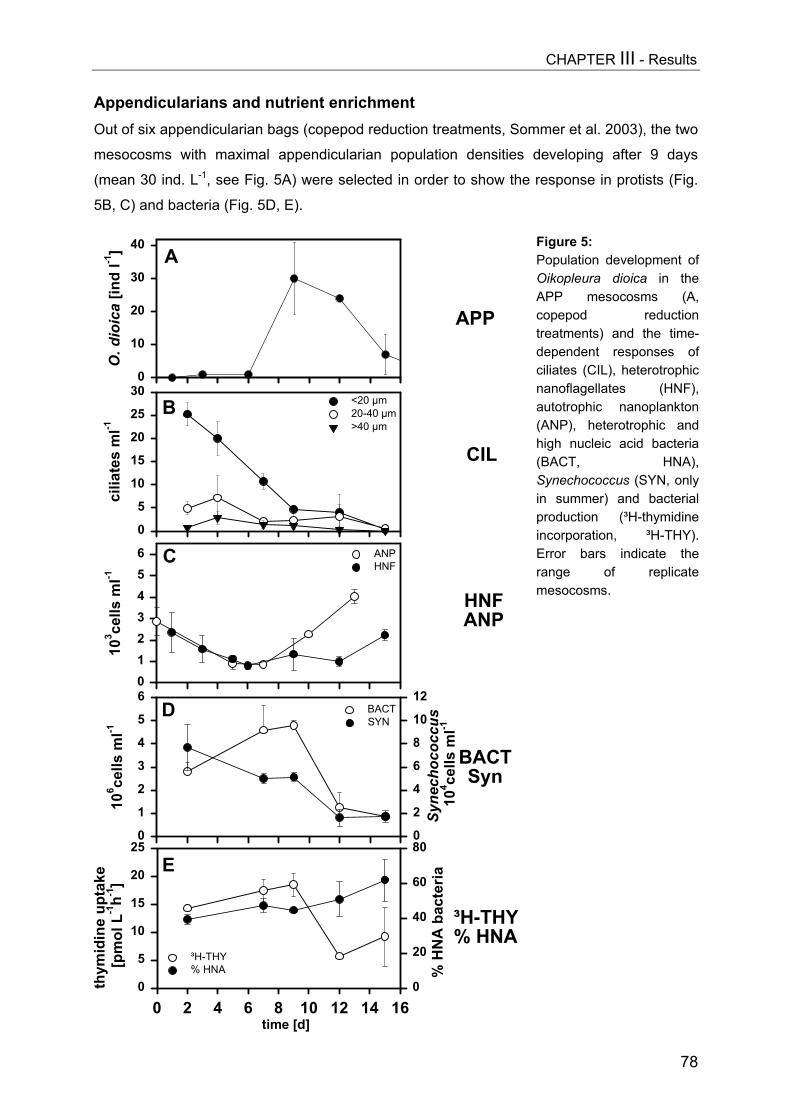
CHAPTER III - Results
Appendicularians and nutrient enrichmentOut of six appendicularian bags (copepod reduction treatments, Sommer et al. 2003), the two
mesocosms with maximal appendicularian population densities developing after 9 days
(mean 30 ind. L-1, see Fig. 5A) were selected in order to show the response in protists (Fig.
5B, C) and bacteria (Fig. 5D, E).
CIL
HNFANP
BACTSyn
³H-THY% HNA
106 ce
lls m
l-1
0
1
2
3
4
5
6
Syne
choc
occu
s 10
4 cells
ml-1
0
2
4
6
8
10
12BACTSYN
time [d]0 2 4 6 8 10 12 14 16
thym
idin
e up
take
[p
mol
L-1
h-1]
0
5
10
15
20
25
% H
NA
bac
teria
0
20
40
60
80
³H-THY% HNA
103 ce
lls m
l-1
0123456 ANP
HNF
cilia
tes
ml-1
0
5
10
15
20
25
30<20 µm20-40 µm>40 µm
B
C
D
O. d
ioic
a [in
d l-1
]
0
10
20
30
40
APP
E
A
Figure 5:Population development ofOikopleura dioica in theAPP mesocosms (A,copepod reductiontreatments) and the time-dependent responses ofciliates (CIL), heterotrophicnanoflagellates (HNF),autotrophic nanoplankton(ANP), heterotrophic andhigh nucleic acid bacteria(BACT, HNA),Synechococcus (SYN, onlyin summer) and bacterialproduction (³H-thymidineincorporation, ³H-THY).Error bars indicate therange of replicatemesocosms.78

CHAPTER III - Results
79
Unfortunately, a contamination with copepods occurred within the second half of the
experiment, which affected the phytoplankton community (Sommer 2003) and likely impacted
also on the protist assemblage. For all investigated microbial food web components as well
as for bacterial activity significant time-dependent changes were observed (Table 4). While
the abundances of larger-sized ciliates showed only few changes until day 12, nanociliates
were more intensely reduced over time (Fig. 5B). Simultaneously, auto-/mixotrophic
nanoflagellates first decreased until day 7 and thereafter increased up to 4x10³ cells ml-1 (see
Fig. 5C). A very similar population development was noted for HNF, but with slightly lower
abundances and a delayed and less intense increase after day 12. In addition to that, HNF
numbers were much lower than in high density copepod enclosures.
In response to the appendicularian bloom registered on day 9, the picoplankton
fraction showed the most pronounced numerical reduction, whereby Synechococcus cells
declined continuously from 7.7 to 1.7x10⁴ cells ml-1. Heterotrophic bacteria, after a first
increase, were reduced 1.6 to 3.8-fold from day 9 to day 12 (Fig. 5D). Simultaneously,
bacterial production values followed the same pattern and decreased from 18.5 to 5.7 pmol L-
1h-1 after the appendicularian bloom (Fig. 5E). Corresponding bacterial doubling times
increased from 68h (day 2) to 92h on day 7 and thereafter decreased from 90h (day 9) to 33h
(day 15). The numerical decline in bacteria was paralleled by a constant increase in the
mean proportion of the HNA bacterial subgroup from 38.8±1.8 % (day 2) to 56.6±10.9 % (day
15) and an incline in the mean proportion of CTC-positive cells from 12.6±3 to 19.5±3.4%
between days 7 and 15.
Nutrient enriched mesocosms should demonstrate whether eutrophication effects on
the microbial functional groups would be modified under the given mesozooplankton
dominance (Fig. 6, Table 4). Therefore, all six appendicularian treatments were pooled and
time series (over two weeks) of lower trophic level parameters were tested against pooled
data obtained from the respective enriched bags (EUAPP). Functional groups in both
mesocosm sets were subjected to comparable Oikopleura blooming events. Samplings
time effectAPP df F p
CIL 5 40.65 0.0005HNF 6 4.408 0.0470ANP 4 105.3 0.0003
BACT 4 47.28 0.0013SYN 4 21.54 0.0057THY 4 13.06 0.0145
%HNA 4 9.445 0.0257
Table 4:
Analysis of parameter time courses byRepeated-Measures ANOVA for treatments(APP) with highest appendicularian densities(abbreviations as in figures).
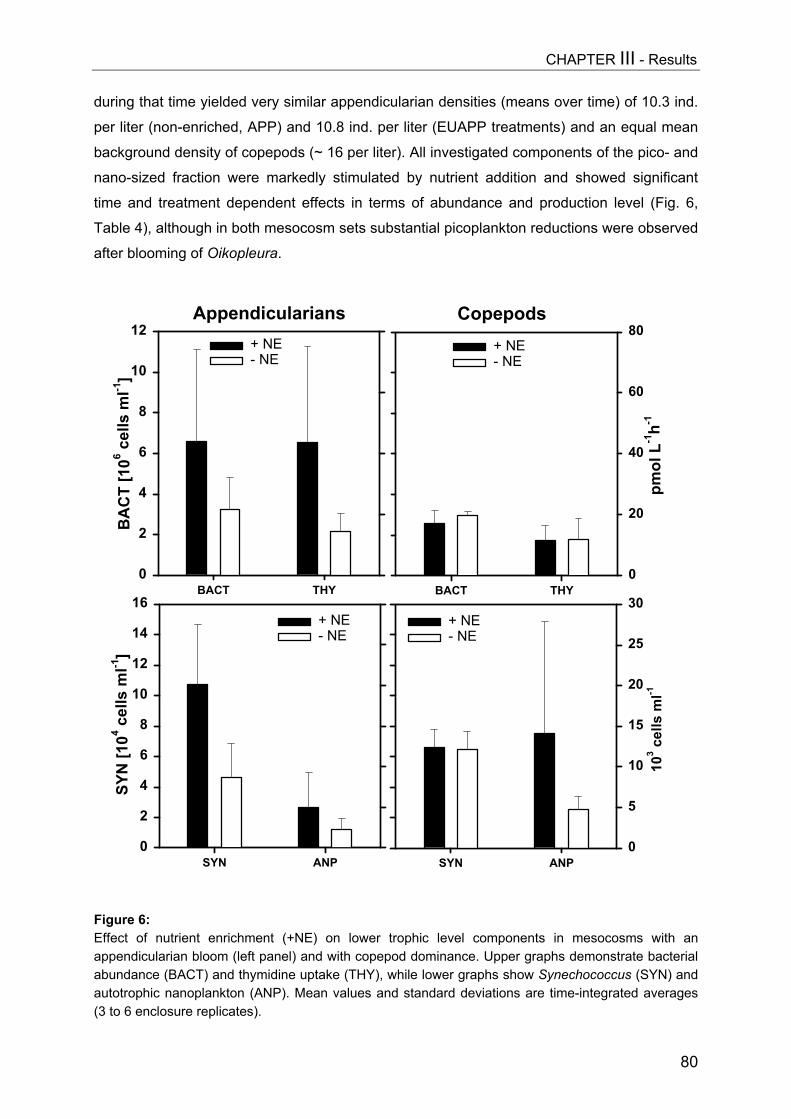
CHAPTER III - Results
80
during that time yielded very similar appendicularian densities (means over time) of 10.3 ind.
per liter (non-enriched, APP) and 10.8 ind. per liter (EUAPP treatments) and an equal mean
background density of copepods (~ 16 per liter). All investigated components of the pico- and
nano-sized fraction were markedly stimulated by nutrient addition and showed significant
time and treatment dependent effects in terms of abundance and production level (Fig. 6,
Table 4), although in both mesocosm sets substantial picoplankton reductions were observed
after blooming of Oikopleura.
Figure 6: Effect of nutrient enrichment (+NE) on lower trophic level components in mesocosms with anappendicularian bloom (left panel) and with copepod dominance. Upper graphs demonstrate bacterialabundance (BACT) and thymidine uptake (THY), while lower graphs show Synechococcus (SYN) andautotrophic nanoplankton (ANP). Mean values and standard deviations are time-integrated averages(3 to 6 enclosure replicates).
BACT THY
BA
CT
[106 c
ells
ml-1
]
0
2
4
6
8
10
12+ NE - NE
SYN ANP
SYN
[104 c
ells
ml-1
]
0
2
4
6
8
10
12
14
16+ NE- NE
Appendicularians
BACT THY
pmol
L-1
h-1
0
20
40
60
80+ NE- NE
Copepods
SYN ANP
103 c
ells
ml-1
0
5
10
15
20
25
30+ NE- NE
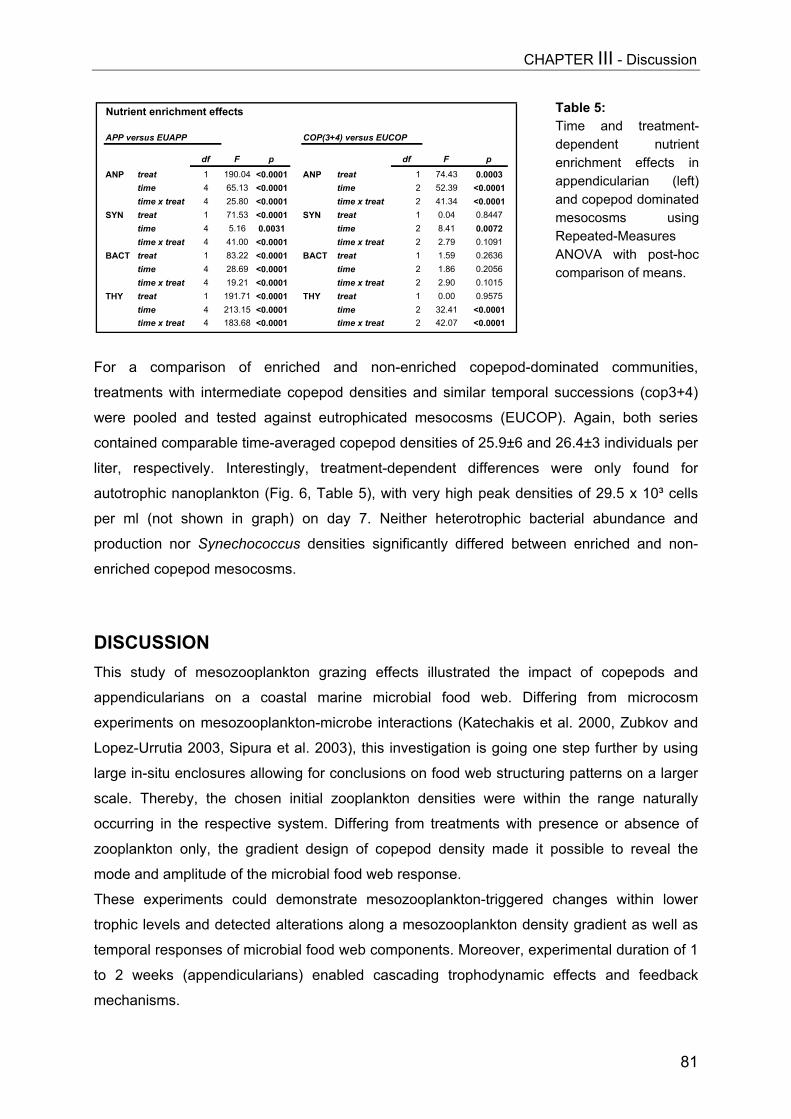
CHAPTER III - Discussion
For a comparison of enriched and non-enriched copepod-do
treatments with intermediate copepod densities and similar temporal
were pooled and tested against eutrophicated mesocosms (EUCO
contained comparable time-averaged copepod densities of 25.9±6 and
liter, respectively. Interestingly, treatment-dependent differences
autotrophic nanoplankton (Fig. 6, Table 5), with very high peak dens
per ml (not shown in graph) on day 7. Neither heterotrophic bac
production nor Synechococcus densities significantly differed betwe
enriched copepod mesocosms.
DISCUSSION This study of mesozooplankton grazing effects illustrated the imp
appendicularians on a coastal marine microbial food web. Diffe
experiments on mesozooplankton-microbe interactions (Katechakis e
Lopez-Urrutia 2003, Sipura et al. 2003), this investigation is going on
large in-situ enclosures allowing for conclusions on food web structuri
scale. Thereby, the chosen initial zooplankton densities were with
occurring in the respective system. Differing from treatments with pr
zooplankton only, the gradient design of copepod density made it
mode and amplitude of the microbial food web response.
These experiments could demonstrate mesozooplankton-triggered
trophic levels and detected alterations along a mesozooplankton dens
temporal responses of microbial food web components. Moreover, exp
to 2 weeks (appendicularians) enabled cascading trophodynamic
mechanisms.
Nutrient enrichment effects
APP versus EUAPP COP(3+4) versus EUCOP
df F p df F pANP treat 1 190.04 <0.0001 ANP treat 1 74.43 0.0003
time 4 65.13 <0.0001 time 2 52.39 <0.0001time x treat 4 25.80 <0.0001 time x treat 2 41.34 <0.0001
SYN treat 1 71.53 <0.0001 SYN treat 1 0.04 0.8447time 4 5.16 0.0031 time 2 8.41 0.0072time x treat 4 41.00 <0.0001 time x treat 2 2.79 0.1091
BACT treat 1 83.22 <0.0001 BACT treat 1 1.59 0.2636time 4 28.69 <0.0001 time 2 1.86 0.2056time x treat 4 19.21 <0.0001 time x treat 2 2.90 0.1015
THY treat 1 191.71 <0.0001 THY treat 1 0.00 0.9575time 4 213.15 <0.0001 time 2 32.41 <0.0001time x treat 4 183.68 <0.0001 time x treat 2 42.07 <0.0001
Table 5:Time and treatment-dependent nutrientenrichment effects inappendicularian (left)and copepod dominatedmesocosms usingRepeated-MeasuresANOVA with post-hoccomparison of means.
81
minated communities,
successions (cop3+4)
P). Again, both series
26.4±3 individuals per
were only found for
ities of 29.5 x 10³ cells
terial abundance and
en enriched and non-
act of copepods and
ring from microcosm
t al. 2000, Zubkov and
e step further by using
ng patterns on a larger
in the range naturally
esence or absence of
possible to reveal the
changes within lower
ity gradient as well as
erimental duration of 1
effects and feedback
CHAPTER III - Discussion
82
The investigated systems proved to be highly dynamic revealing a large response amplitude.
However, despite different initial conditions and spring as well as summer plankton
scenarios, the experiments displayed general structuring effects of copepods on the protist
assemblage and illustrated the importance of trophic cascades for structuring pelagic
microbial food webs. As initial nutrient conditions differed and copepod addition led only to
minor changes in the overall nutrient regime and did not create significant trends after 1 week
of copepod grazing (via recycling etc.), we assume the occurrence of these general
structuring patterns and the observed order-of-magnitude responses mainly to be a result of
direct and indirect predation effects.
Trophic impact of copepods on microbial food webs
Effects on functional protist groupsAlthough some copepod mortality occurred (mainly in the second spring experiment), the
remaining abundances were still high and the gradient design was maintained throughout the
experiments. Independent of the initial plankton situation and composition of the copepod
communities, copepods exerted highly significant trophic impact on the protist level and
contrastingly affected both ciliates and HNF (e.g. Table 2). The “small copepod communities”
as well as Calanus finmarchicus preferentially preyed upon larger-sized prey and significantly
reduced ciliates. Likely due to ciliate grazing pressure relief, nanoflagellates were enabled to
increase significantly. The more pronounced increase in autotrophic compared to
heterotrophic forms might be explained by more nutrients being available, as copepods
potentially removed the larger-sized competing algae. Calculated HNF net growth rates in
spring (not shown in graph, estimated from abundance data) revealed mostly positive values
in S4 and L4 treatments (µ = 0.01d-1, time averaged), whereas ciliate-rich mesocosms
(controls, S1, L1) caused mostly negative rates with maximal values of µ = -0.1d-1. The size-
shift towards nanoplankton proved more rapid at high copepod densities and comprised
orders-of-magnitude changes in protist abundances.
The evolving inverse patterns of ciliate and nanoflagellate abundance can be
interpreted as a clear 3-link trophic cascade. Changes of that type were revealed also in
some other studies performed in freshwater (Adrian and Schneider-Olt 1999, Zöllner et al.
2003) and marine systems, whereby the marine studies were mostly based on microcosm
experiments (Katechakis et al. 2002, Sipura et al. 2003). In general, such community level
trophic cascades (Paine 1980, Pace et al. 1999) which we found during both seasons are
supposed to occur rather rarely and point at a uniform size-class preference and a rather low
level of heterogeneity (Strong 1992, Polis 1999, Sipura et al. 2003). Ciliate escape behaviour
can be efficient in reducing copepod grazing susceptibility (Jonsson and Tiselius 1990,
CHAPTER III - Discussion
83
Broglio et al. 2001), but apparently was not successful at high copepod densities used in the
present study.
The resulting differences in HNF concentrations likely accounted for marked differences in
the grazing pressure on bacteria as shown by clearly differing proportions of FLB
disappearance. Thereby, treatments with high HNF abundances caused much stronger FLB
grazing loss than those with high ciliate densities.
Effects on bacterioplanktonPredation by protists is known to be a structuring and shaping force for the heterogeneous
community consisting of autotrophic and heterotrophic prokaryotes (Jürgens and Matz 2002).
In this bacterial compartment we found complex time- and treatment-dependent responses to
changes in the mesozooplankton and thus protist grazing regime with considerable and partly
significant fluctuations in bacterial densities over experimental time.
Interestingly, bacterial abundances and production did not show significant
differences in terms of treatment effects (post-hoc comparison of means over experimental
time, Table 2B). This strikingly contrasts to results obtained for higher trophic level protists,
demonstrating highly significant treatment-dependent changes. While combined effects of
time and treatment yielded significant differences between spring mesocosms, bacterial
communities in summer displayed enhanced stability in terms of both aspects.
This could suggest that bacteria were more buffered against food web shifts and
relatively more impacted by bottom-up forces. These could at least partly account for the
observed stimulating effects of copepod addition during the first 1-3 days (L4, cop5), resulting
in an increase in bacterial numbers and production. A stimulatory impact of copepods with
positively responding bacteria is consistent with short-term effects found in different
microcosm experiments (Sipura et al. 2003, Zubkov and Lopez-Urrutia 2003). This fuelling of
bacterial activity is mostly due to DOC release by copepod sloppy feeding and faecal pellet
leakage (e.g. Møller et al. 2003). In this context, a relatively wide amplitude in bacterial
abundance and activity at low copepod densities could indicate the existence of alternative
stable states and different successions or scenarios being possible.
A further increasing and shaping predation stress due to cascading trophodynamic
effects, might force bacterial populations into a certain direction. This conspicuous negative
impact on bacterial abundance and activity at very high HNF densities in spring (S4, L4
mesocosms after 1 week) even suggests a community-wide 4-link trophic cascade. This
cascading HNF predation effect thus contributed to explain the more dynamic response of
spring bacteria mentioned above.
Remarkably, HNF also could have influenced patterns of bacterial activity. While low
HNF numbers accounted for high bacterial abundances as well as a high cell-specific activity
CHAPTER III - Discussion
84
S1, L1 after 1 week), high ambient protist abundances (at approx. 15-40 copepods L-1)
caused low bacterial numbers and growth rate estimates. Here, the significant decrease in
cell-specific activity towards higher copepod and thus HNF densities could result from the
fact that large active cells were preferentially preyed upon in the course of the experiments.
In summer, the bacterial community response was apparently less clear. At least after
1 week, rather a 3-link trophic cascade can be assumed, since bacterial abundances are
higher at highest copepod densities. Results from the summer experiment further suggest
that mesozooplankton directly and indirectly (trophic cascade) triggered shifts in bacterial
production and respiration, thereby very likely affecting mineralization rates and carbon
dynamics. The experiments revealed a considerable variability in actively respiring bacteria
with proportions ranging from 9.7 to 27.8%. Moreover, the proportion of CTC+ cells and of
HNA bacteria as the most active part of the bacterial assemblage (Lebaron et al. 2001a) as
well as bacterial production clearly corresponded.
Various studies proved CTC to be an ecologically meaningful measure of active
bacterial abundance in aquatic systems, and that CTC-active bacteria are likely responsible
for the bulk of community metabolic activity (Smith 1998, Sherr et al. 1999). Furthermore,
quite huge variations in CTC-positive cells were found in other aquatic systems, ranging from
3.5-47.4% of the total bacterial population activity (Smith 1998). As bacteria are responsible
for 50 to >90% of the total community respiration (Jahnke and Craven 1995, Sherr and Sherr
1996), conspicuous shifts in actively respiring bacteria due to altered mesozooplankton
grazing regime could significantly impact carbon-flux and the ratio of net heterotrophy to net
autotrophy of the respective system.
In cop5 mesocosms, bacterial abundances slightly increased, whereas HNF numbers
declined, although ciliate predation pressure was obviously low. This converse development
led to comparably high numbers of HNA bacteria in these two mesocosms, coinciding with
high thymidine uptake and elevated proportions of CTC-positive cells. The fact that these
apparently very active cells were not effectively controlled by HNF, could be interpreted as an
indication of bacterial feed-back mechanisms and reduced grazing susceptibility.
High proportions of a small and curved bacterial morphotype were observed under
intense HNF grazing pressure in spring (S4, L4) as well as in summer. Here, TEM images
(Transmission Electron Microscope) revealed a long flagellum, presumably allowing for high
motility. Other studies on marine microbial food webs reported only a modest development of
grazing-resistant bacteria (Massana and Jürgens 2003). As no obvious and typical
morphological responses were noted such as the development of long filamentous bacteria
commonly observed in freshwater microbial communities (see chapter II), high motility, also
useful for resource exploration, could be a potential mechanism to reduce grazing
susceptibility (Grossart et al. 2001, Jürgens and Matz 2002).
CHAPTER III - Discussion
85
Effects of the appendicularian Oikopleura dioica Appendicularians as most abundant marine microphage metazoans (Fernandez and Acuña
2003) are capable of capturing particles in the colloidal and bacterial size fractions (King et
al. 1980, Deibel and Lee 1992, Fernandez et al. 2004) and can significantly contribute to
carbon fluxes (Vargas et al. 2002). Due to their high fecundity they are able to reach high
densities within short time periods (Acuña and Kiefer 2000). The highest densities of
Oikopleura dioica (ca. 35 ind l-1) developing after 9 days in our mesocosms in the summer
experiment are comparable to peak values found in other studies (Fernandez and Acuña
2003). Nevertheless, in most periods throughout the year appendicularian biomass in
Hopavågen is an order of magnitude lower than copepod biomass (COMWEB 1999).
In our experiment, the strong increase of appendicularians was followed by a
significant reduction of bacterial abundance and production. All DNA-subgroups of bacteria
were reduced by the increase in appendicularians, but the relative proportion of HNA bacteria
stayed constant or even increased. Moreover, a temporal decrease of ciliates and also
nanoflagellates was noted in Oikopleura-mesocosms. After day 10, densities of autotrophic
nanoplankton increased again. Contrasting to the copepod-mediated cascade, heterotrophic
forms stayed at a very low abundance level, presumably due to low bacterial numbers.
A reduction of bacterial abundances and growth by appendicularians was also
reported by Zubkov and Lopez-Urrutia (2003) from the English Channel. Moreover,
measured transfer efficiencies (contribution ratio of bacterial to photosynthetic production as
mesozooplankton food resources) were reported to be highly variable (from 6 to 41%),
thereby being lower in the community dominated by copepods and higher when pelagic
tunicates are more abundant (Koshikawa et al. 1996, 1999). The low numbers of bacteria
competing with phytoplankton for nutrients after bloom events of appendicularians as well as
low numbers of copepods could contribute to explain the observation that appendicularians
can rather enhance phytoplankton blooms (Fernandez and Acuña 2003).
The temporal decrease of ciliates and also nanoflagellates in Oikopleura-mesocosms
could be at least partly due to increasing appendicularians, as according to (Vargas and
Gonzalez 2004a) ciliates were not directly ingested but trapped in houses of Oikopleura and
thus cleared from the water column. Nanoplanktonic organisms, in turn, could have been
ingested directly (King et al. 1980, Urban et al. 1992). However, the observed specimen of
Oikopleura from the enclosures were rather small (Sommer et al. 2003). So, at least for
ciliates more likely, the remaining copepods in these bags accounted for their decline and
thereby released nanoflagellates from predation pressure.
Although appendicularian bloom events in general are apparently rather transient
scenarios (roughly 1 week in our case), during these periods of mass development they can
exert significant trophic impact mainly on the pico- and nanoplankton size fraction
CHAPTER III - Discussion
86
(Koshikawa et al. 1996, Koshikawa et al. 1999). The decrease of appendicularian density in
the mesocosms after day 12 very likely was due to suppression by the copepods still
remaining in the APP-treatments (Sommer et al. 2003). This phenomenon finally could
provide field evidence for recent results by Lopez-Urrutia et al. (2004) proving calanoid
copepods to directly prey on Oikopleura dioica in bottle experiments.
Eutrophication and food web structureEnrichment of mesocosms with inorganic nutrients differentially affected microbial food web
structure. Besides differences between appendicularian and copepod-dominated
mesocosms, also the nutrient addition itself caused significant effects when
mesozooplankton of the same type was present. Mostly, effects turned out to be related to
the absolute level of abundance and production, which was higher in enriched bags.
However, according to mesozooplankton-mediated food web structure, nutrients were
channelled into different compartments. While in mesocosms with Oikopleura blooms
picoplankton was favoured, fertilized systems permanently dominated by copepods revealed
strong increases in nanoplankton organisms, significantly exceeding those of non-fertilized
bags (e.g. up to 29.5x10³ ml-1 ANP and 13.8x10³ ml-1 HNF on day 7). Here, contrasting to
EUAPP-enclosures, micro-sized ciliates strongly decreased and allowed nanoplankton to
increase (not shown in graph). Apparently, this cascading predatory effect seemed to be a
rather stable phenomenon under enriched and non-enriched conditions. Heterotrophic
bacteria, in turn, stayed at a constantly low level and were preyed upon by increasing
numbers of HNF. At the same time, they also could have been outcompeted by ANP taking
advantage out of the food web constellation during that week. According to Jacquet et al.
(2002), the favouring of larger autotrophic plankton by the addition of mineral nutrients could
also point at a potential carbon limitation of bacteria in EUCOP-mesocosms.
Altogether there is still comparably little known about the biogeochemical
consequences of bacterial grazing (Strom 2000). However, cascading direct and indirect
effects on bacteria and order-of-magnitude responses in bacterial activity as well as
differential responses of bacterial community subgroups indicate the importance of biotic
interactions at higher trophic levels for bacterial function and turnover rates (C-demand, C-
flux, nutrient and DOC-uptake). As bacteria can contribute ~50->90% to total community
respiration (in Rivkin and Legendre 2001), strong alterations in bacterial activity due to shifts
in food web structure can have major implications for various matter fluxes. A challenge for
future research will be to find out how close the linkage between bacterial community
structure and function is (e.g. by STARFISH, Fuhrman 2002) and how the trophic and
biogeochemical contribution of individual bacterial taxa changes due to shifts in the
composition of higher trophic levels.
IVChapter 4
Fjord
- microbial food web inspring and summer
- Bacterial diversity andcommunity composition -
CHAPTER IV - Abstract
87
Mesozooplankton (copepods, appendicularians) impact on microbial food web structure in a coastal marine system
II. Patterns of bacterial community composition and diversity
ABSTRACTThe impact of copepods and appendicularians on bacterial diversity, community composition
and dynamics was studied based on the same large-scale mesocosm experiments that were
analysed in chapter III for microbial food web responses. I investigated the composition,
qualitative and partly quantitative responses of bacteria to changes in mesozooplankton
regime by Denaturing Gradient Gel Electrophoresis (DGGE) combined with sequencing of
excised bands. From DGGE-derived data, I calculated Shannon´s diversity index H´,
Evenness and richness of operational taxonomic units (OTUs) and analysed patterns of
community similarity by non-metric multidimensional scaling (NMDS).
41 DGGE bands were sequenced, of which 25 were of bacterial origin. The
communities were dominated by members of the alpha- (mainly Roseobacter) and gamma-
Proteobacteria as well as taxa belonging to the Cytophaga-Flavobacterium cluster of the
Bacteroidetes.
Bacterial community composition (BCC) proved to be remarkably stable in time and
across copepod density gradients with most OTUs found in all experimental treatments.
Thereby, eukaryotic bands contributed to a large extent to deviations in community profiles.
Nevertheless, I noted increases in bacterial OTU richness and Shannon’s diversity index H´
over time and across gradients in spring and in summer, whereby the spring communities,
according to numerical and activity changes of microbial food webs (chapter III), showed
pronounced dynamics and amplitudes (H´ ranging from 1.8 to 2.4 in spring and 2.1-2.4 in
summer, after 1 week ). BCC proved to be more dynamic in mesocosms without copepods or
lowest copepod densities, whereas treatments with highest copepod abundances deviated
with a generally higher and more persistent bacterial diversity. Furthermore, relative
frequencies of selected OTUs significantly correlated with environmental variables and food
web parameters. During growth of Oikopleura dioica, bacterial communities showed only
modest changes, while a shift towards copepod-dominated mesozooplankton triggered
pronounced alterations in bacterial assemblages (range of H´ 1.3 - 2.3).
Equal enrichment with inorganic nutrients of both appendicularian- and copepod-
dominated mesocosms yielded different temporal successions of bacterial communities.
Again, a transient dominance shift in mesozooplankton caused conspicuous deviations in
overall similarity of bacterial communities.
CHAPTER IV - Introduction
88
INTRODUCTIONRecent studies in microbial ecology are about to characterise bacterial diversity in various
pelagic aquatic ecosystems and put considerable effort in approaching one of the big aims of
linking function and diversity in marine bacterial communities (Fuhrman 2002). Although
bacteria are of an apparently ubiquitous nature only a limited number of bacterial species
seems to be abundant at a given time and space (e.g. Chapter II). As there is a general
assumption of functional diversity correlating with taxonomical composition in
bacterioplankton communities, it appears to be crucial to elucidate patterns of bacterial
diversity change or shifts in relative contributions of most abundant bacterial species in order
to assess their biogeochemical implications. Under certain situations like algal blooms (α-
proteobacteria, DMSP uptake) single species can dominate bacterioplankton and can
contribute 30-50% to total bacterial biomass (Zubkov et al. 2001). There are still impediments
to the understanding of bacterial biogeochemical impact, based mainly on a lack of
knowledge of the temporal and spatial scales at which bacterial populations vary (Riemann
and Middelboe 2002). These authors stated that large variations between the community
changes had been observed in various recent studies.
Most investigations of marine bacterial community dynamics have attended to large
temporal (Murray et al. 1998, Riemann et al. 1999, Pinhassi and Hagström 2000) and spatial
(Ferrari and Hollibaugh 1999, Schauer et al. 2000) scales or both (Acinas et al. 1997,
Riemann and Middelboe 2002), or the bacterial communities have been studied in response
to environmental disturbance events like strong dinoflagellate blooms (Fandino et al. 2001).
Experimental studies by means of mesocosms have focused mostly on diversity changes
due to nutrient enrichment (Schäfer et al. 2001, Øvreås et al. 2003) or DOC (protein, starch)
manipulation (Pinhassi et al. 1999). Comparably few experimental studies in marine systems
have addressed trophically induced bacterial community dynamics (e.g. Zubkov and Lopez-
Urrutia 2003).
Copepods, tunicates and to a smaller extent cladocerans are the main
mesozooplankton grazers in marine pelagic ecosystems and impact directly (predation) and
indirectly (nutrient release, DOC from sloppy feeding and leakage from faecal pellets) (Møller
et al. 2003) lower trophic levels. Drastic shifts in BCC due to changes in the predation regime
were mostly documented from freshwater systems and were most significant when a
dominant grazers from Daphnia to small protists (or vice versa) (Jürgens et al. 1994,
Langenheder and Jürgens 2001, Degans et al. 2002, Posch et al. 1999). However, there is
much less known how interactions at higher trophic levels and bacterial diversity correspond
in marine systems. Here, experimental evidence is rather scarce since food web
manipulation studies with marine microbial communities are comparably rare.
CHAPTER IV - Methods
89
Massana and Jürgens (2003) investigated the impact of HNF grazers on bacterial
community composition and population dynamics by means of chemostats. Only very few
studies focused on the trophic impact of mesozooplankton like copepods (Sipura et al. 2003)
or both copepods and appendicularians (Zubkov and Lopez-Urrutia 2003) on lower trophic
levels. These experiments were performed in short-term microcosm experiments, were
restricted to bacterial abundance and activity (Sipura 2003) or excluded intermediate
consumers and trophic feedback effects (Zubkov and Lopez-Urrutia 2003).
As in the present marine food web study significant order-of-magnitude responses in
abundance and physiological activity as well as shifts in protist grazing pressure on bacteria
were noted (as described in chapter III), this chapter goes even one step further in gaining
insight in the bacterial response and investigates how mesozooplankton affects bacterial
community composition and diversity dynamics. Propagating trophodynamic impact of
copepods and appendicularians was followed at the level of the whole bacterial assemblage
(community similarity, Shannon diversity) and with respect to individual bacterial taxa by
means of DNA-fingerprinting and sequencing.
METHODS
Study site, experimental set-up and measurements. This study is based upon the same
marine mesocosm experiments described in chapter III, performed in the Trondheimsfjord
(Norway) in spring and summer. Mesocosm treatments (small and large copepods,
appendicularians, nutrient enrichment) and sampling intervals resemble those explained in
chapter III and results obtained for numerical and activity responses of the microbial food
web constitute the basis for the following investigations on diversity and composition of the
bacterial community.
PCR-DGGE. For investigation of bacterial diversity, 250 ml of samples (prefiltered by
3 µm in spring and 5 µm in summer) were filtered onto 0.2 µm Durapore filters (25 mm,
Millipore), covered with 1 ml lysis buffer (40 mM EDTA, 50 mM Tris-HCl, 0.75 M Sucrose)
and stored at –80°C until DNA extraction. Phenol-chloroform extraction of total DNA followed
the protocol reported by Schauer et al. (2000). It started by incubating the filters with
lysozyme (1 mg ml-1 final concentration) at 37°C for 45 min. Then sodium dodecyl sulfate
(1% final concentration) and proteinase K (0.2 mg ml-1 final concentration) were added before
the filters were incubated at 55°C for 60 min. The lysate was extracted with an equal volume
of phenol-chloroform-isoamyl alcohol (25:24:1), and the residual phenol was removed by
extraction of an equal volume of chloroform-isoamyl alcohol (24:1). DNA was further purified,
desalted and concentrated with a Centricon-100 concentrator (Millipore). The integrity of the
DNA extract was checked on a 0.8% agarose gel stained with ethidium bromide. After
quantifying spectrofluorometrically the extracted microbial DNA with a Hoechst fluorescence
CHAPTER IV - Methods
90
assay (Paul and Myers 1982), equal amounts of template DNA were used for each PCR
(polymerase chain reaction) amplification of bacterial 16S rDNA. I used the bacterial specific
primer 358f (5’-CCT ACG GGA GGC AGC AG-3’), with a 40 bp GC-clamp and primer 907rM
(5’-CCG TCA ATT CMT TTG AGT TT-3’), which amplifies a 550 bp DNA fragment of
bacterial 16S rDNA (Muyzer et al. 1998). Deviating from previous DGGE analyses of
freshwater samples from enclosure experiments of the same project (see chapter I), primer
907rM was used instead of primer 907rC (5’-CCG TCA ATT CCT TTR AGT TT-3‘), since the
latter one may not result in efficient amplification of 16S rRNA gene fragments of some
marine representatives of the γ–Proteobacteria (e.g. the genera Alteromonas,
Pseudoalteromonas, Aeromonas, and Shewanella) due to a mismatch in the target site
(Schäfer et al. 2001).
PCR was performed with a Biorad thermal cycler using the following programme:
initial denaturation at 94°C for 5 min; 10 touchdown cycles of denaturation (at 94 °C for 1
min), annealing (at 65-55 °C for 1 min, decreasing 1 °C each cycle) and extension (at 72 °C
for 3 min); 20 standard cycles of denaturation (at 94 °C for 1 min), annealing (at 55°C for 1
min) and extension (at 72 °C for 3 min) and a final extension at 72 °C for 7 min. PCR
products were verified by agarose gel electrophoresis (1.2% agarose) with a standard in the
gel and quantified again spectrofluorometrically (see above).
DGGE was carried out with a D-Code Universal Mutation Detection System (Biorad)
as described in Muyzer and Smalla (1998) and Schauer et al. (2000, 2003). A 6%
polyacrylamide gel with a gradient of a DNA-denaturing agent was cast by mixing solutions of
40% and 80% denaturant agent (100% denaturant agent is 7 M urea and 40% deionised
formamide) with a gradient former (Biorad). Equal amounts of PCR product (600 ng) were
loaded and the gel was run at 100 V for 16 h at 60°C in 1x TAE buffer (40 mM Tris, pH 7.4,
20 mM sodium acetate, 1 mM EDTA). The gel was stained with the nucleic acid stain SYBR
Gold (Molecular Probes) for 45 min, rinsed with Milli-Q water, removed from the glass plate to
a UV-transparent gel scoop and visualised with UV. By using the software GeneSnap 4.00.
(SynGene, Cambridge, England) high-resolution images were saved as computer files.
To obtain quantitative information from DGGE fingerprints, digitized DGGE images
were analyzed with the software GeneTools 3.00.22 (SynGene, Cambridge, England). The
software performs a density profile through each lane, detects the bands (defined as
operational taxonomic units, OTUs) and calculates the relative contribution of each band to
the total band signal in the lane after applying a rolling disk as background subtraction.
Bands with a relative intensity of less than 1% of the total intensity of the lane were
disregarded. The bands occupying the same position in the different lanes of the gel were
identified by visual inspection. To allow for a direct comparison of different gels (in one case
only), a multi-band-standard was run on every denaturing gel.
CHAPTER IV - Methods
91
Sequencing of bands and phylogenetic analysis. For sequencing, individual DNA
bands were excised from DGGE gels with a sterile scalpel and stored in 50 µl of sterilised
HPLC water overnight at 4°C. Subsequently, 1µl of eluted DNA was taken as template in a
PCR using the same temperature programme and primers 358f-GC and 907rM (see above).
The PCR product was checked in another DGGE to reconfirm the relative position of the
respective band and primarily to ensure that only one single band has been excised. If this
was the case, duplicate 50 µl PCRs were performed with the same primers, except that the
primer 358f did not contain a GC-clamp (MWG Biotech-AG). Afterwards, the size and quality
of the PCR product was verified on 1.2% agarose gels and the pooled PCR products were
purified with a QIAquick PCR Purification Kit (QIAGEN, Hilden, Germany) and quantified with
a Hoechst fluorescence assay (Paul and Myers 1982). Sequencing reactions were performed
by MWG Biotech-AG (Ebersberg, Germany). The obtained partial (up to 550bp) 16S rDNA
sequences were aligned, and a consensus sequence was assembled using the Seqman II
software (Lasergene, DNAStar) These consensus sequences were compared to available
16S rRNA sequences in GenBank database using the NCBI BLAST programme.
Statistical analysis of PCR-DGGE. The gel was inspected visually on a computer
screen and presence and absence of individual bands in each lane was recorded. Based
upon this information, a binary matrix (1/0 matrix) was compiled. Alternatively, the relative
contribution of each band to the total band signal was used to obtain quantitative information
on the banding patterns. From the binary matrix I calculated a distance matrix using the
single linkage method with Euclidean distances (root-mean-squared differences). To assess
changes of the genetic diversity (fingerprint profile) of the bacterial assemblages in selected
mesocosms over time, the complex DGGE banding patterns were analyzed by a powerful
data reduction method, the so-called non-metric multidimensional scaling (NMDS) as
described in van Hannen et al. (1998).
A complex DGGE pattern is reduced to one point in a two dimensional space. Thus,
relative changes in the community structure can be visualised by connecting the consecutive
points (e.g. Schäfer et al. 2001). The closer the points are to each other, the more similar are
the DGGE banding patterns. Various distance matrices obtained from 0/1- data and in one
case also from relative intensities (expression used tantamount to relative frequency)
constituted the basis for NMDS analysis, which was computed in STATISTICA 6.0 using two
dimensions and a minimum number of 200 iterations. In a second step, these NMDS
analyses were repeated after excluding OTUs derived from eukaryotic plastid DNA (see
sequencing results). Therefore, presence/absence matrices were adjusted and relative band
frequencies newly calculated. To reveal relationship to food web parameters, Pearson´s
product-moment correlations and regression analyses were performed (relative OTU
frequencies were arcsin-square-root transformed before regression analysis).
CHAPTER IV - Results
92
On the basis of position and relative intensities of DGGE bands, the Shannon
diversity index H´ and Evenness E of the bacterial communities were calculated (Shannon
1948, see also Schauer et al. 2000).
RESULTS
PCR-DGGE analysis
Analysis of BCC by means of PCR-DGGE displayed both temporal and density dependent
effects, thereby corresponding manifold to numerical and activity responses of the microbial
food web (see chapter III). Banding patterns obtained from several DGGEs were highly
reproducible (see Fig. 1 A-D, exemplary selected DGGE images), as seen from samples
repeatedly amplified and run on different gels. DGGE bands were referred to as operational
taxonomic unit (OTU) when contributing more than 1% to total gel lane intensity, which was
the case for 9 to 22 bands per lane. Most bands occurring in various gels and dominating the
bacterial community were sequenced in order to exclude non-bacterial OTUs from
community analysis (see Table 1). Bacterial community shifts observed in the assemblage
were compared with DGGEs regarding all OTUs. All sequencing results are listed in table 1.
From the 45 sequenced DGGE bands 4 bands gave only poor sequence quality and were not
used at all. 25 bands were of bacterial origin, whereof 3 sequence affiliations were based
upon a single strand sequence and not a consensus. 15 bands turned out to derive from
eukaryotic plastid DNA or from autotrophic picoplankton (1 band, Synechococcus). Bacterial
sequences showed a similarity between 77 and 100% with already known sequences
obtained from GenBank, thereby roughly two third of the affiliations yielded a similarity of
97% or higher.
Bacterial OTUs primarily belonged to alpha- and gamma-proteobacteria with
Roseobacter as a predominant taxon. The position and identity of Roseobacter bands 4 and
5 were reconfirmed on independent gels showing gradients and time series. In the course of
the experiment from day 0 to day 3 and 6, one single band seemed to split into two closely
related bands (NAC11-3, NAC 11-7). Sequencing results obtained from two independent gels
led to identical results. As these two bands were not always discernible, bands 4 and 5 were
regarded as one Roseobacter band in further analyses. Moreover, three DGGE-bands with
identical sequence affiliation were found in the spring and summer experiments, whereby
band 5 equalled band 16, 2 equalled 14 and 13 was equivalent to 17. Although sequences of
two OTUs (no. 34 and 28) yielded the same matching similarity with bacteria (90, 97%
respectively), but with 1% instead of 0% gaps, they were conservatively considered as
chloroplasts.
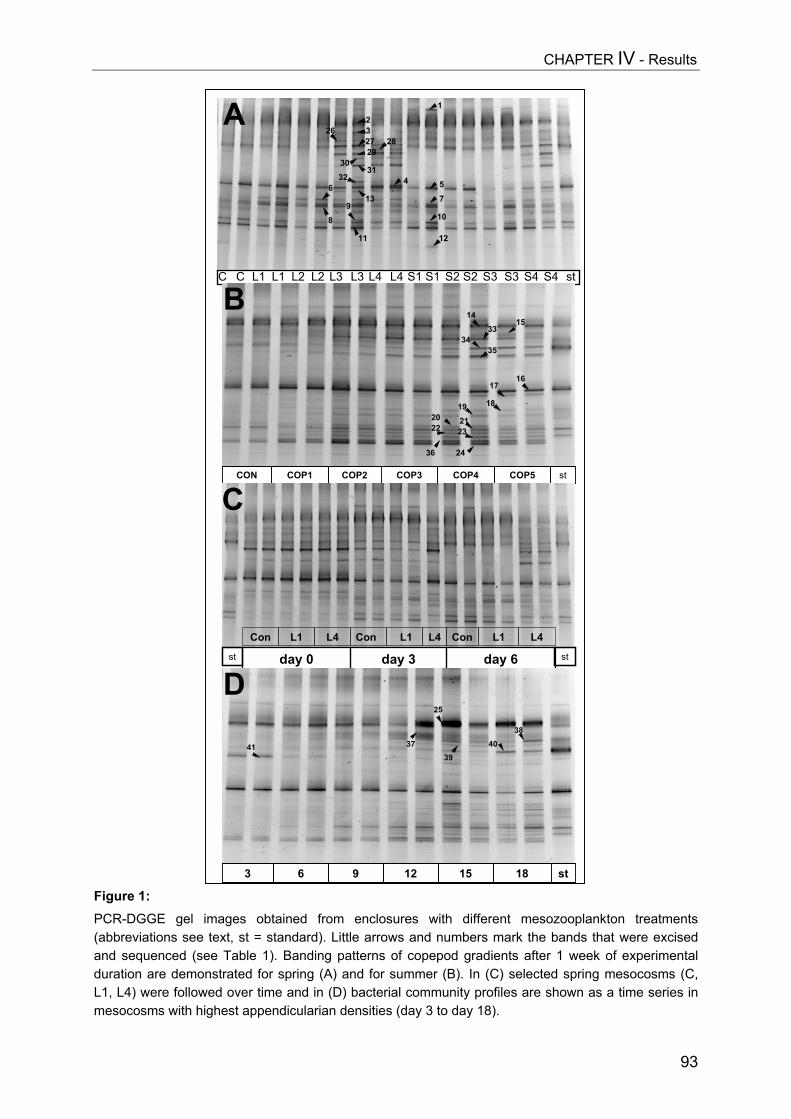
CHAPTER IV - Results
93
Figure 1:PCR-DGGE gel images obtained from enclosures with different mesozooplankton treatments(abbreviations see text, st = standard). Little arrows and numbers mark the bands that were excisedand sequenced (see Table 1). Banding patterns of copepod gradients after 1 week of experimentalduration are demonstrated for spring (A) and for summer (B). In (C) selected spring mesocosms (C,L1, L4) were followed over time and in (D) bacterial community profiles are shown as a time series inmesocosms with highest appendicularian densities (day 3 to day 18).
32
1
10
75
12
27 2829
3031
32 4
136
89
11
26
C S1 S2 S3 S4L1 L3L2 L4C L1 L2 L3 L4 S1 S2 S4S3 st
CON COP5COP2 COP3 COP4COP1 st
14
3433
15
1920 2122 23
36 24
35
1617
18
day 0Con L1 L4 Con L1 L4 Con L1 L4
st day 3 day 6 st
63 9 12 15 18
25
4139
3738
40
st
A
B
C
D
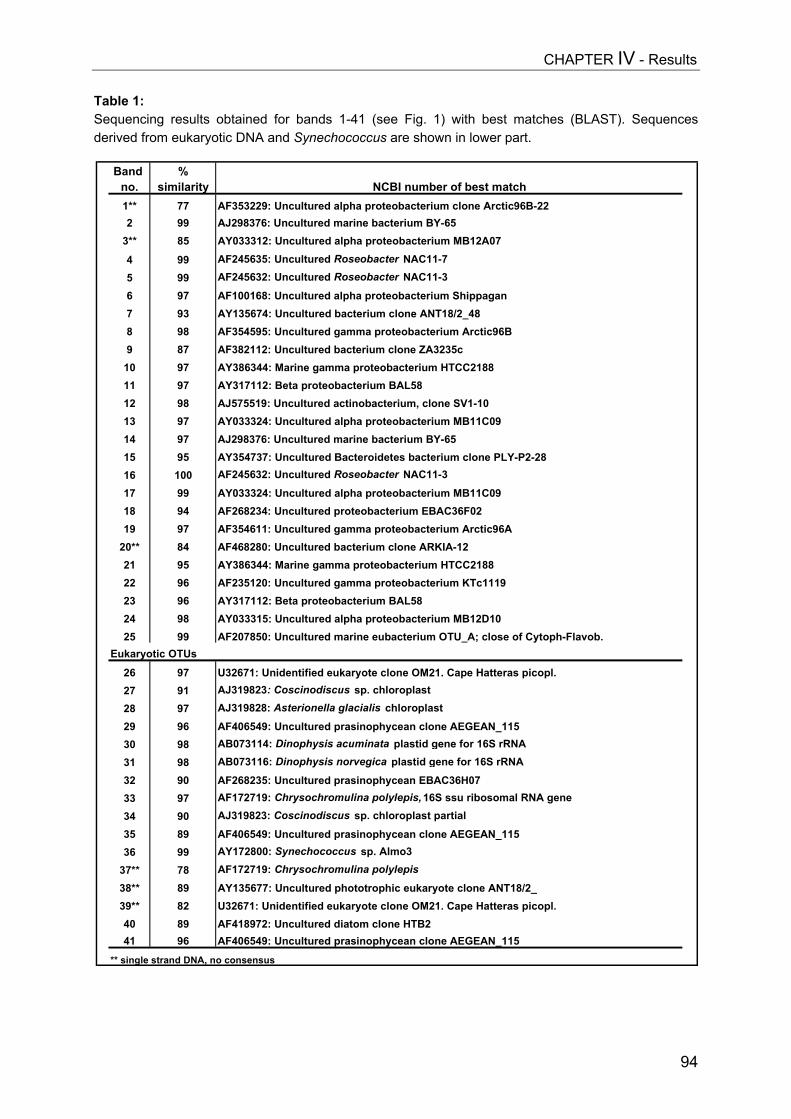
CHAPTER IV - Results
94
Table 1:Sequencing results obtained for bands 1-41 (see Fig. 1) with best matches (BLAST). Sequencesderived from eukaryotic DNA and Synechococcus are shown in lower part.
Band %no. similarity NCBI number of best match1** 77 AF353229: Uncultured alpha proteobacterium clone Arctic96B-22 2 99 AJ298376: Uncultured marine bacterium BY-65
3** 85 AY033312: Uncultured alpha proteobacterium MB12A07 4 99 AF245635: Uncultured Roseobacter NAC11-7 5 99 AF245632: Uncultured Roseobacter NAC11-3 6 97 AF100168: Uncultured alpha proteobacterium Shippagan 7 93 AY135674: Uncultured bacterium clone ANT18/2_48 8 98 AF354595: Uncultured gamma proteobacterium Arctic96B9 87 AF382112: Uncultured bacterium clone ZA3235c
10 97 AY386344: Marine gamma proteobacterium HTCC2188 11 97 AY317112: Beta proteobacterium BAL58 12 98 AJ575519: Uncultured actinobacterium, clone SV1-1013 97 AY033324: Uncultured alpha proteobacterium MB11C09 14 97 AJ298376: Uncultured marine bacterium BY-65 15 95 AY354737: Uncultured Bacteroidetes bacterium clone PLY-P2-28 16 100 AF245632: Uncultured Roseobacter NAC11-3 17 99 AY033324: Uncultured alpha proteobacterium MB11C09 18 94 AF268234: Uncultured proteobacterium EBAC36F02 19 97 AF354611: Uncultured gamma proteobacterium Arctic96A
20** 84 AF468280: Uncultured bacterium clone ARKIA-12 21 95 AY386344: Marine gamma proteobacterium HTCC2188 22 96 AF235120: Uncultured gamma proteobacterium KTc1119 23 96 AY317112: Beta proteobacterium BAL58 24 98 AY033315: Uncultured alpha proteobacterium MB12D1025 99 AF207850: Uncultured marine eubacterium OTU_A; close of Cytoph-Flavob.
Eukaryotic OTUs26 97 U32671: Unidentified eukaryote clone OM21. Cape Hatteras picopl.27 91 AJ319823: Coscinodiscus sp. chloroplast28 97 AJ319828: Asterionella glacialis chloroplast 29 96 AF406549: Uncultured prasinophycean clone AEGEAN_115 30 98 AB073114: Dinophysis acuminata plastid gene for 16S rRNA31 98 AB073116: Dinophysis norvegica plastid gene for 16S rRNA32 90 AF268235: Uncultured prasinophycean EBAC36H07 33 97 AF172719: Chrysochromulina polylepis, 16S ssu ribosomal RNA gene 34 90 AJ319823: Coscinodiscus sp. chloroplast partial 35 89 AF406549: Uncultured prasinophycean clone AEGEAN_115 36 99 AY172800: Synechococcus sp. Almo3
37** 78 AF172719: Chrysochromulina polylepis
38** 89 AY135677: Uncultured phototrophic eukaryote clone ANT18/2_39** 82 U32671: Unidentified eukaryote clone OM21. Cape Hatteras picopl.40 89 AF418972: Uncultured diatom clone HTB2 41 96 AF406549: Uncultured prasinophycean clone AEGEAN_115
** single strand DNA, no consensus
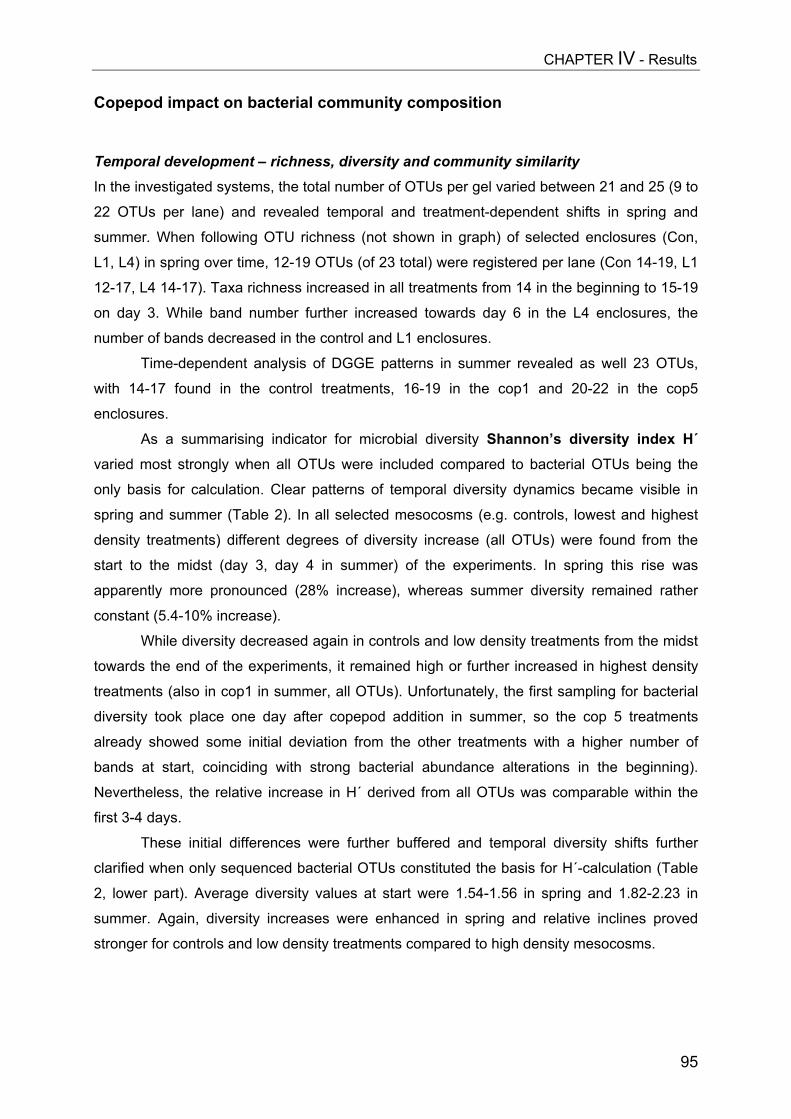
CHAPTER IV - Results
95
Copepod impact on bacterial community composition
Temporal development – richness, diversity and community similarity In the investigated systems, the total number of OTUs per gel varied between 21 and 25 (9 to
22 OTUs per lane) and revealed temporal and treatment-dependent shifts in spring and
summer. When following OTU richness (not shown in graph) of selected enclosures (Con,
L1, L4) in spring over time, 12-19 OTUs (of 23 total) were registered per lane (Con 14-19, L1
12-17, L4 14-17). Taxa richness increased in all treatments from 14 in the beginning to 15-19
on day 3. While band number further increased towards day 6 in the L4 enclosures, the
number of bands decreased in the control and L1 enclosures.
Time-dependent analysis of DGGE patterns in summer revealed as well 23 OTUs,
with 14-17 found in the control treatments, 16-19 in the cop1 and 20-22 in the cop5
enclosures.
As a summarising indicator for microbial diversity Shannon’s diversity index H´varied most strongly when all OTUs were included compared to bacterial OTUs being the
only basis for calculation. Clear patterns of temporal diversity dynamics became visible in
spring and summer (Table 2). In all selected mesocosms (e.g. controls, lowest and highest
density treatments) different degrees of diversity increase (all OTUs) were found from the
start to the midst (day 3, day 4 in summer) of the experiments. In spring this rise was
apparently more pronounced (28% increase), whereas summer diversity remained rather
constant (5.4-10% increase).
While diversity decreased again in controls and low density treatments from the midst
towards the end of the experiments, it remained high or further increased in highest density
treatments (also in cop1 in summer, all OTUs). Unfortunately, the first sampling for bacterial
diversity took place one day after copepod addition in summer, so the cop 5 treatments
already showed some initial deviation from the other treatments with a higher number of
bands at start, coinciding with strong bacterial abundance alterations in the beginning).
Nevertheless, the relative increase in H´ derived from all OTUs was comparable within the
first 3-4 days.
These initial differences were further buffered and temporal diversity shifts further
clarified when only sequenced bacterial OTUs constituted the basis for H´-calculation (Table
2, lower part). Average diversity values at start were 1.54-1.56 in spring and 1.82-2.23 in
summer. Again, diversity increases were enhanced in spring and relative inclines proved
stronger for controls and low density treatments compared to high density mesocosms.
CHAPTER IV - Results
96
Table 2:Mean (± range of replicate enclosures) values for Shannon diversity index H´ and evenness E forselected copepod treatments in spring and summer. Temporal shifts of H´ are demonstrated (for bothall OTUs and sequenced bacterial OTUs only) and relative increases in bacterial diversity indicated.
A decrease in bacterial diversity took place in the former and an increase or level
maintenance in the latter mesocosms in the second half of the experiment. However, the
level of bacterial diversity in general was elevated at the end compared to assemblages in
the beginning and the increase more pronounced in spring than in summer. Interestingly, the
increase in H´ and E was similar in controls, L1 and L4 mesocosm, indicating that treatment
had nearly no effect on the development of overall bacterial diversity over time (Tab. 2, upper
part, BACT OTUs). In summer, instead, some more differences became obvious.
In terms of community similarity, bacterial assemblages turned out to be
comparably stable with most community members being present in all investigated food web
constellations. Over time and across gradients, the maximal distances between communities
based on all OTUs (with potential plastid DNA included) were generally larger than those
based exclusively on bacterial OTUs (e.g. Fig. 2). Although changes were less intense and
apparently more buffered when OTUs derived from eukaryotic plastid DNA were excluded,
shifts in bacterial community dynamics and similarity were noted in response to
Time effect: Shannon diversity H´ and EvennessSpring
All OTUsCon L1 L4
days H´ E H´ E H´ E0 2.07 ± 0.01 0.78 ± 0.002 2.08 ± 0.01 0.79 ± 0.004 2.10 ± 0.04 0.80 ± 0.023 2.62 ± 0.05 0.90 ± 0.03 2.55 ± 0.08 0.90 ± 0.03 2.39 0.886 2.43 ± 0.01 0.92 ± 0.01 2.37 ± 0.18 0.92 ± 0.02 2.56 ± 0.04 0.91 ± 0.02
BACT OTUs 0 1.50 ± 0.03 0.65 ± 0.01 1.55 ± 0.01 0.67 ± 0.01 1.54 ± 0.02 0.67 ± 0.013 1.96 ± 0.14 0.76 ± 0.07 1.99 ± 0.14 0.78 ± 0.05 1.97 0.866 2.02 ± 0.02 0.89 ± 0.03 2.04 ± 0.06 0.93 ± 0.03 2.05 ± 0.03 0.89 ± 0.01
SummerAll OTUs
Con COP1 COP5days H´ E H´ E H´ E
1 2.26 ± 0.04 0.83 ± 0.02 2.43 ± 0.15 0.84 ± 0.02 2.78 ± 0.01 0.90 ± 0.0024 2.45 ± 0.17 0.86 ± 0.06 2.48 ± 0.02 0.88 ± 0.01 2.88 ± 0.06 0.93 ± 0.027 2.26 ± 0.09 0.86 ± 0.03 2.49 ± 0.01 0.89 ± 0.02 2.80 ± 0.05 0.94 ± 0.02
BACT OTUs 1 1.82 ± 0.09 0.79 ± 0.04 1.95 ± 0.15 0.80 ± 0.03 2.23 ± 0.05 0.87 ± 0.024 2.13 ± 0.17 0.83 ± 0.07 2.14 ± 0.02 0.86 ± 0.01 2.35 ± 0.06 0.91 ± 0.027 1.87 ± 0.09 0.81 ± 0.04 2.09 ± 0.01 0.85 ± 0.03 2.35 ± 0.09 0.81 ± 0.03
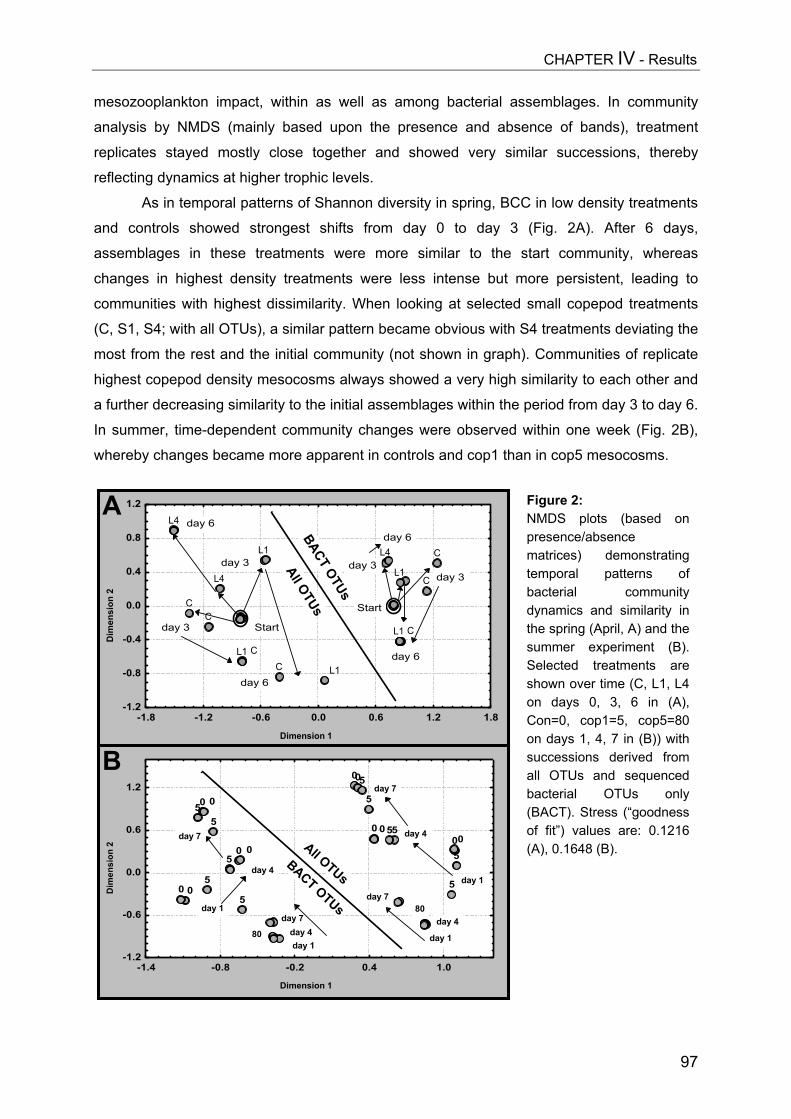
CHAPTER IV - Results
mesozooplankton impact, within as well as among bacterial assemblages. In community
analysis by NMDS (mainly based upon the presence and absence of bands), treatment
replicates stayed mostly close together and showed very similar successions, thereby
reflecting dynamics at higher trophic levels.
As in temporal patterns of Shannon diversity in spring, BCC in low density treatments
and controls showed strongest shifts from day 0 to day 3 (Fig. 2A). After 6 days,
assemblages in these treatments were more similar to the start community, whereas
changes in highest density treatments were less intense but more persistent, leading to
communities with highest dissimilarity. When looking at selected small copepod treatments
(C, S1, S4; with all OTUs), a similar pattern became obvious with S4 treatments deviating the
most from the rest and the initial community (not shown in graph). Communities of replicate
highest copepod density mesocosms always showed a very high similarity to each other and
a further decreasing similarity to the initial assemblages within the period from day 3 to day 6.
In summer, time-dependent community changes were observed within one week (Fig. 2B),
whereby changes became more apparent in controls and cop1 than in cop5 mesocosms.
Dimension 1
Dim
ensi
on 2
CC
L1
L4
CC
L1
L1
L4
C
C
L1
CL1
L4
-1.2
-0.8
-0.4
0.0
0.4
0.8
1.2
-1.8 -1.2 -0.6 0.0 0.6 1.2 1.8
BACT OTUs
All OTUs
Start
Start
day 3day 3
day 6
day 6
day 3
day 3
day 6
day 6
A
Dimension 1
Dim
ensi
on 2
0 00 0
00
5
5
55
5
5
00
0 0
0 0
5
5
5
55
-1.2
-0.6
0.0
0.6
1.2
-1.4 -0.8 -0.2 0.4 1.0
All OTUsBACT OTUsday 1
day 7
day 4
day 7day 4day 1
80day 4
day 1
day 780
day 1
day 4
day 7
B
Figure 2:NMDS plots (based onpresence/absencematrices) demonstratingtemporal patterns ofbacterial communitydynamics and similarity inthe spring (April, A) and thesummer experiment (B).Selected treatments areshown over time (C, L1, L4on days 0, 3, 6 in (A),Con=0, cop1=5, cop5=80on days 1, 4, 7 in (B)) withsuccessions derived fromall OTUs and sequencedbacterial OTUs only(BACT). Stress (“goodnessof fit”) values are: 0.1216(A), 0.1648 (B).
97
CHAPTER IV - Results
98
Copepod gradient effects – richness, diversity and community similarityAlong the copepod gradients in spring (Fig. 1A) 21 different OTUs were found in total after 1
week of experimental incubation, of which 12-20 occurred in the Calanus bags (L-gradient)
and 12-19 in the S-gradient (small copepods, >250-500 µm) treatments.
Various OTUs were found in all treatments and remained during the whole
experimental period and along the complete copepod gradients, although their relative
contribution to the community was variable. Out of the 14 sequenced bacterial bands
obtained from the L-gradient, 5 bands (corresponding ~ 36%) changed regarding presence or
absence across the gradient, i.e. they disappeared or became detectable. Similar values
were measured for the S-gradient (4 out of 13, ~ 31%). In the summer community, 23 OTUs
were observed in total, of which 17-21 occurred per lane. Out of the 13 sequenced bacterial
OTUs, 3 disappear or become detectable (~23%), whereas the rest was present along the
whole gradient. Four weak bands were not successfully sequenced.
Gradients in spring as well as in summer showed an increase in taxa richness with
increasing copepod abundance, which was clearly less intense, when eukaryotic OTUs were
excluded from regression (shown for the S-gradient in spring, Fig.3).
Copepod density-dependent effects on Shannon’s diversity index H´ after one week of
experiment resulted in a larger range (from 2.10 to 2.80, minimal and maximal values found
in single mesocosms) in spring than in summer (from 2.45 to 2.87) along the copepod density
gradients (Table 3), when all OTUs were considered. In spring and summer, increases were
significant or nearly significant.
The range between minimal and maximal diversity was reduced (1.93-2.42 in S and
1.83-2.28 in L-gradient; more strongly in spring than in summer 2.05-2.46) when eukaryotic
DGGE-bands were excluded, leading to a significant linear increase in bacterial diversity
along the summer gradient (Fig.3).
copepod density [ind.L-1, geom. mean], summer0 20 40 60 80
Shan
non
dive
rsity
H´ (
BA
CT,
sum
mer
)
1.0
1.5
2.0
2.5
3.0
copepod density [ind.L-1, geom. mean], spring0 10 20 30
Bac
teria
l OTU
rich
ness
(spr
ing)
8
10
12
14
16
18
20Figure 3:OTU richness (bacterialOTUs only = white circles, allOTUs = black circles (S-gradient, in spring) andShannon´s index H´(summer) across copepodgradients after 1 week(geometric means).Linear regressions aresignificant at p<0.05
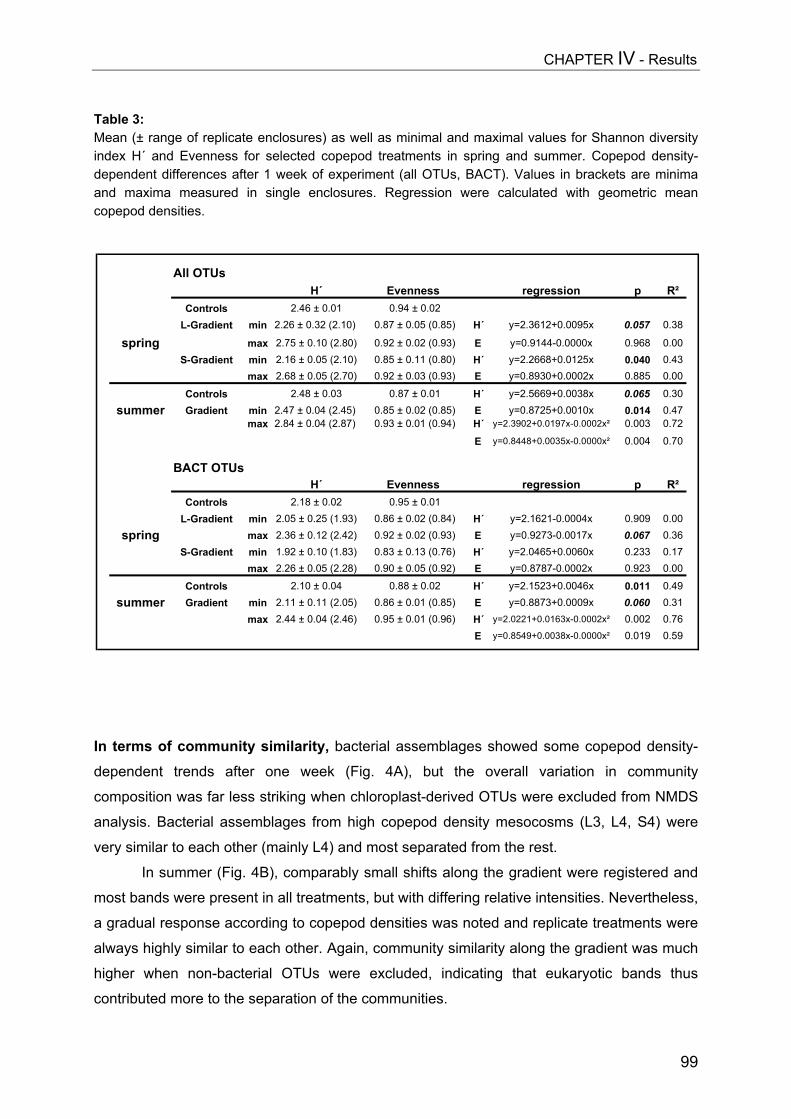
CHAPTER IV - Results
99
Table 3:Mean (± range of replicate enclosures) as well as minimal and maximal values for Shannon diversityindex H´ and Evenness for selected copepod treatments in spring and summer. Copepod density-dependent differences after 1 week of experiment (all OTUs, BACT). Values in brackets are minimaand maxima measured in single enclosures. Regression were calculated with geometric meancopepod densities.
In terms of community similarity, bacterial assemblages showed some copepod density-
dependent trends after one week (Fig. 4A), but the overall variation in community
composition was far less striking when chloroplast-derived OTUs were excluded from NMDS
analysis. Bacterial assemblages from high copepod density mesocosms (L3, L4, S4) were
very similar to each other (mainly L4) and most separated from the rest.
In summer (Fig. 4B), comparably small shifts along the gradient were registered and
most bands were present in all treatments, but with differing relative intensities. Nevertheless,
a gradual response according to copepod densities was noted and replicate treatments were
always highly similar to each other. Again, community similarity along the gradient was much
higher when non-bacterial OTUs were excluded, indicating that eukaryotic bands thus
contributed more to the separation of the communities.
All OTUsH´ Evenness regression p R²
Controls 2.46 ± 0.01 0.94 ± 0.02L-Gradient min 2.26 ± 0.32 (2.10) 0.87 ± 0.05 (0.85) H´ y=2.3612+0.0095x 0.057 0.38
spring max 2.75 ± 0.10 (2.80) 0.92 ± 0.02 (0.93) E y=0.9144-0.0000x 0.968 0.00S-Gradient min 2.16 ± 0.05 (2.10) 0.85 ± 0.11 (0.80) H´ y=2.2668+0.0125x 0.040 0.43
max 2.68 ± 0.05 (2.70) 0.92 ± 0.03 (0.93) E y=0.8930+0.0002x 0.885 0.00
Controls 2.48 ± 0.03 0.87 ± 0.01 H´ y=2.5669+0.0038x 0.065 0.30summer Gradient min 2.47 ± 0.04 (2.45) 0.85 ± 0.02 (0.85) E y=0.8725+0.0010x 0.014 0.47
max 2.84 ± 0.04 (2.87) 0.93 ± 0.01 (0.94) H´ y=2.3902+0.0197x-0.0002x² 0.003 0.72
E y=0.8448+0.0035x-0.0000x² 0.004 0.70
BACT OTUsH´ Evenness regression p R²
Controls 2.18 ± 0.02 0.95 ± 0.01L-Gradient min 2.05 ± 0.25 (1.93) 0.86 ± 0.02 (0.84) H´ y=2.1621-0.0004x 0.909 0.00
spring max 2.36 ± 0.12 (2.42) 0.92 ± 0.02 (0.93) E y=0.9273-0.0017x 0.067 0.36S-Gradient min 1.92 ± 0.10 (1.83) 0.83 ± 0.13 (0.76) H´ y=2.0465+0.0060x 0.233 0.17
max 2.26 ± 0.05 (2.28) 0.90 ± 0.05 (0.92) E y=0.8787-0.0002x 0.923 0.00
Controls 2.10 ± 0.04 0.88 ± 0.02 H´ y=2.1523+0.0046x 0.011 0.49summer Gradient min 2.11 ± 0.11 (2.05) 0.86 ± 0.01 (0.85) E y=0.8873+0.0009x 0.060 0.31
max 2.44 ± 0.04 (2.46) 0.95 ± 0.01 (0.96) H´ y=2.0221+0.0163x-0.0002x² 0.002 0.76E y=0.8549+0.0038x-0.0000x² 0.019 0.59
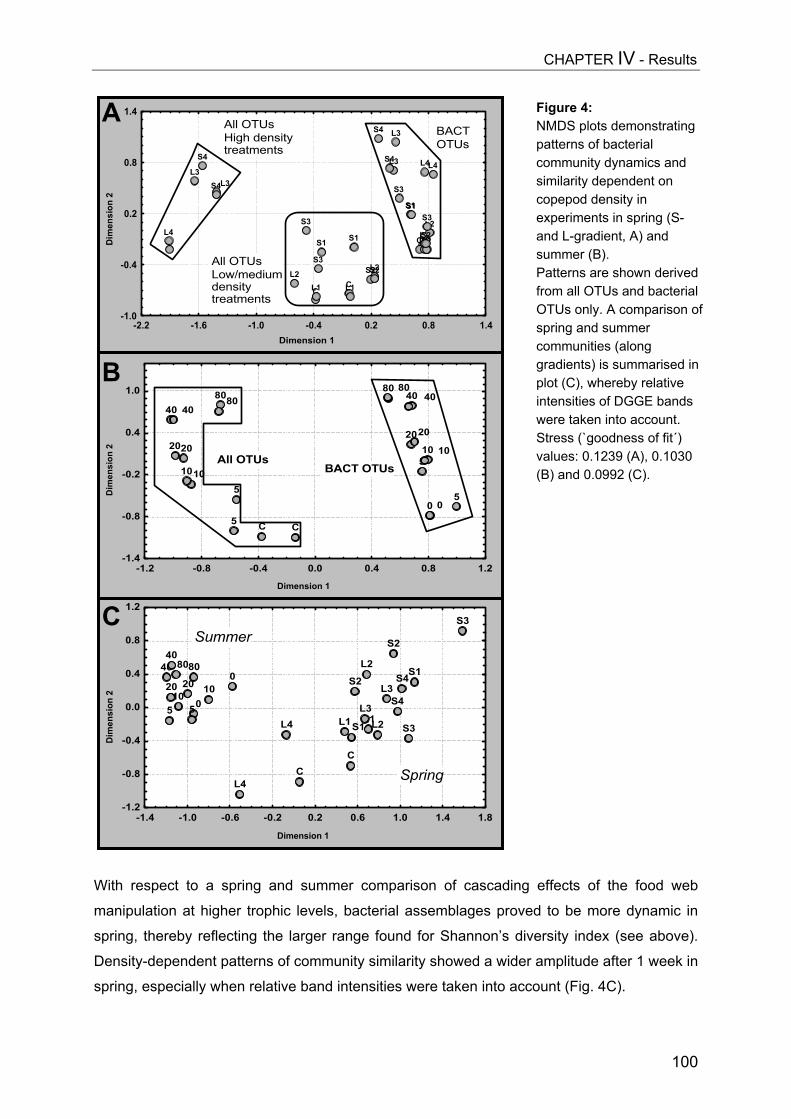
CHAPTER IV - Results
With respect to a spring and summer comparison of cascading
manipulation at higher trophic levels, bacterial assemblages prove
spring, thereby reflecting the larger range found for Shannon’s div
Density-dependent patterns of community similarity showed a wider
spring, especially when relative band intensities were taken into acc
Dimension 1
Dim
ensi
on 2
CC
L1L1
L2
L2
L3
L3L4
L4
S1
S1
S2
S2
S3
S3
S4
S4
0
05 510
1020 204040 8080
-1.2
-0.8
-0.4
0.0
0.4
0.8
1.2
-1.4 -1.0 -0.6 -0.2 0.2 0.6 1.0 1.4 1.8
Spring
Summer
Dimension 1
Dim
ensi
on 2
C C5
5 1010
20 20
40 4080 80
005
510 10
20 20
40 4080 80
-1.4
-0.8
-0.2
0.4
1.0
-1.2 -0.8 -0.4 0.0 0.4 0.8 1.2
BACT OTUsAll OTUs
B
C
Dimension 1
Dim
ensi
on 2
CC L1L1
L2L2
L3L3
L4 S1S1
S2S2S3
S3
S4
S4
CCL1L1L2L2
L3
L3
L4L4
S1S1
S2S2
S3
S3
S4
S4
-1.0
-0.4
0.2
0.8
1.4
-2.2 -1.6 -1.0 -0.4 0.2 0.8 1.4
All OTUsHigh densitytreatments
All OTUsLow/mediumdensitytreatments
BACTOTUs
A
Figure 4:NMDS plots demonstratingpatterns of bacterialcommunity dynamics andsimilarity dependent oncopepod density inexperiments in spring (S-and L-gradient, A) andsummer (B).Patterns are shown derivedfrom all OTUs and bacterialOTUs only. A comparison ofspring and summercommunities (alonggradients) is summarised inplot (C), whereby relativeintensities of DGGE bandswere taken into account.Stress (`goodness of fit´)values: 0.1239 (A), 0.1030(B) and 0.0992 (C).100
effects of the food web
d to be more dynamic in
ersity index (see above).
amplitude after 1 week in
ount (Fig. 4C).

CHAPTER IV - Results
101
Relative frequencies of OTUs and relationships to food web parametersSpring bacterial communities appeared to be more dynamic over time than assemblages in
summer mesocosms, as already shown by NMDS analysis (Fig. 4). These dynamics were
underlined by shifts in relative frequencies of dominant OTUs (Fig. 5). Thereby most OTUs
could be taxonomically assigned and only a small proportion (average 6%) remained
undetermined. Communities in selected spring enclosures (Con, L1) and especially in L4
were dominated by Roseobacter (OTU 4/5).
����������� ���������� ��������������������������������� ���������� ����������� ����������� ����������
���������������������� �����������
���������������������� ����������
���������������������
�����������
���������������������� ����������
����������
����������������������
����������������������
����������������������
��������������������
����������������������
����������������������
��������������������
����������������������
���������������������
���������������������������������
����������������������
��������������������
���������������������������������
����������������������
��������������������
���������������������������������
��������������������������������� ����������
����������
����������������������
����������������������
����������������������
��������������������
���������������������������������
���������������������������������
�������������������� �����������
����������������������
���������������������� ����������
��������������������
����������������������
�����������
����������������������
������������������������������
����������������������
����������������������
�������������������� �����������
����������������������
��������������������
����������������������
���������������������������������
����������������������
������������������������������
����������������������
����������������������
��������������������
���������������������������������
����������������������
������������������������������
����������������������
���������������������������������
���������������������
���������������������� �����������
���������� ����������� ���������������������� ����������
0
0.1
0.2
0.3
0.4
0.5
0.6
0.7
0.8
0.9
1
C C L1 L1 L2 L2 L3 L3 L4 L4
n.d.������ 12���
11���
10
9������ 8��� 7���
6���13
4+5������ 3
2���1
���������� ����������� ����������� ���������� ����������� ����������� ���������� ����������� �����������
����������������������
��������������������������������
����������� ��������������������
���������������������� ��������������������
��������������������������������
�������������������������������
����������� ����������������������
��������������������
�����������
����������� ��������������������
��������������������
����������������������
��������������������������������� ����������
����������
����������������������
����������������������
��������������������
���������������������������������
���������������������������������
��������������������
��������������������
����������������������
�������������������������������
����������������������
����������������������
��������������������
����������������������
����������� ��������������������
��������������������
���������������������������������
����������������������
������������������������������
����������������������
����������������������
�������������������� �����������
�����������
���������������������� ����������
����������
������������������������������
���������������������������������
���������������������������������
������������������������������
����������������������
����������������������
������������������������������
���������������������������������
���������������������� ����������
��������������������
����������� ����������� ��������������������������������
����������������������
���������� ����������������������
���������������������� ����������
����������
0
0.1
0.2
0.3
0.4
0.5
0.6
0.7
0.8
0.9
1
C C S1 S1 S2 S2 S3 S3 S4 S4
n.d.���
12���
11���10
9������ 8���
7���
6���13
4+5������ 3
2���1
A
B
C
Rel
ativ
e O
TU fr
eque
ncy
���������� �����������������������������
��������� ������������������ ���������� ��������� ���������
���������
������������������
������������������
������������������
���������� ������������������� ��������� ��������� ����������
���������������������������� ���������
��������� ������������������ ������������������
�������������������
������������������ ��������� ���������� ��������� ���������
���������
������������������ ���������
������������������
������������������
��������������������
������������������ ����������
������������������� ���������
�����������������������������
������������������ ���������
��������� ������������������
������������������
������������������ ����������
������������������ ����������
���������������������������� ���������
��������������������
������������������
���������������������������
������������������
������������������
������������������
������������������ ����������
����������
������������������
���������������������������� ���������
���������
��������������������
������������������ ���������
������������������
������������������
��������� ��������� ��������������������
�����������������������������
������������������ ���������
������������������� ��������� ���������
���������
������������������ ���������
������������������
������������������
��������������������
������������������
������������������������������
������������������ ���������
���������
������������������������������
���������������������������
���������������������������
��������� ������������������
0
0.1
0.2
0.3
0.4
0.5
0.6
0.7
0.8
0.9
1
0 0 5 5 10 10 20 20 40 40 80 80
n.d.
12����24����23����22����21����20����19����18����17
16
15
14
1
Figure 5:Relative frequencies ofsequenced OTUs along3 copepod densitygradients in spring (L-gradient (A) and S-gradient (B)) andsummer (C). Taxonomicaffiliations of numberedOTUs can be obtainedfrom table 1.
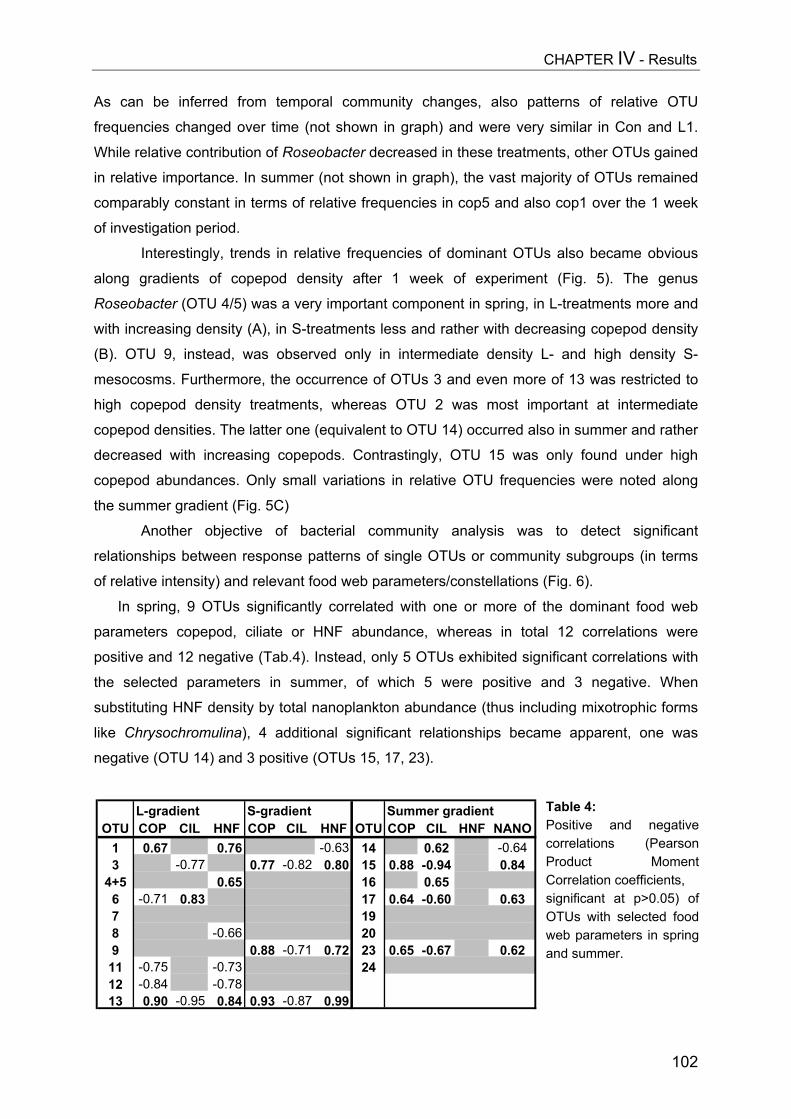
CHAPTER IV - Results
102
As can be inferred from temporal community changes, also patterns of relative OTU
frequencies changed over time (not shown in graph) and were very similar in Con and L1.
While relative contribution of Roseobacter decreased in these treatments, other OTUs gained
in relative importance. In summer (not shown in graph), the vast majority of OTUs remained
comparably constant in terms of relative frequencies in cop5 and also cop1 over the 1 week
of investigation period.
Interestingly, trends in relative frequencies of dominant OTUs also became obvious
along gradients of copepod density after 1 week of experiment (Fig. 5). The genus
Roseobacter (OTU 4/5) was a very important component in spring, in L-treatments more and
with increasing density (A), in S-treatments less and rather with decreasing copepod density
(B). OTU 9, instead, was observed only in intermediate density L- and high density S-
mesocosms. Furthermore, the occurrence of OTUs 3 and even more of 13 was restricted to
high copepod density treatments, whereas OTU 2 was most important at intermediate
copepod densities. The latter one (equivalent to OTU 14) occurred also in summer and rather
decreased with increasing copepods. Contrastingly, OTU 15 was only found under high
copepod abundances. Only small variations in relative OTU frequencies were noted along
the summer gradient (Fig. 5C)
Another objective of bacterial community analysis was to detect significant
relationships between response patterns of single OTUs or community subgroups (in terms
of relative intensity) and relevant food web parameters/constellations (Fig. 6).
In spring, 9 OTUs significantly correlated with one or more of the dominant food web
parameters copepod, ciliate or HNF abundance, whereas in total 12 correlations were
positive and 12 negative (Tab.4). Instead, only 5 OTUs exhibited significant correlations with
the selected parameters in summer, of which 5 were positive and 3 negative. When
substituting HNF density by total nanoplankton abundance (thus including mixotrophic forms
like Chrysochromulina), 4 additional significant relationships became apparent, one was
negative (OTU 14) and 3 positive (OTUs 15, 17, 23).
Table 4:Positive and negativecorrelations (PearsonProduct MomentCorrelation coefficients,significant at p>0.05) ofOTUs with selected foodweb parameters in springand summer.
L-gradient S-gradient Summer gradientOTU COP CIL HNF COP CIL HNF OTU COP CIL HNF NANO
1 0.67 0.76 -0.63 14 0.62 -0.643 -0.77 0.77 -0.82 0.80 15 0.88 -0.94 0.84
4+5 0.65 16 0.656 -0.71 0.83 17 0.64 -0.60 0.637 198 -0.66 209 0.88 -0.71 0.72 23 0.65 -0.67 0.6211 -0.75 -0.73 2412 -0.84 -0.7813 0.90 -0.95 0.84 0.93 -0.87 0.99
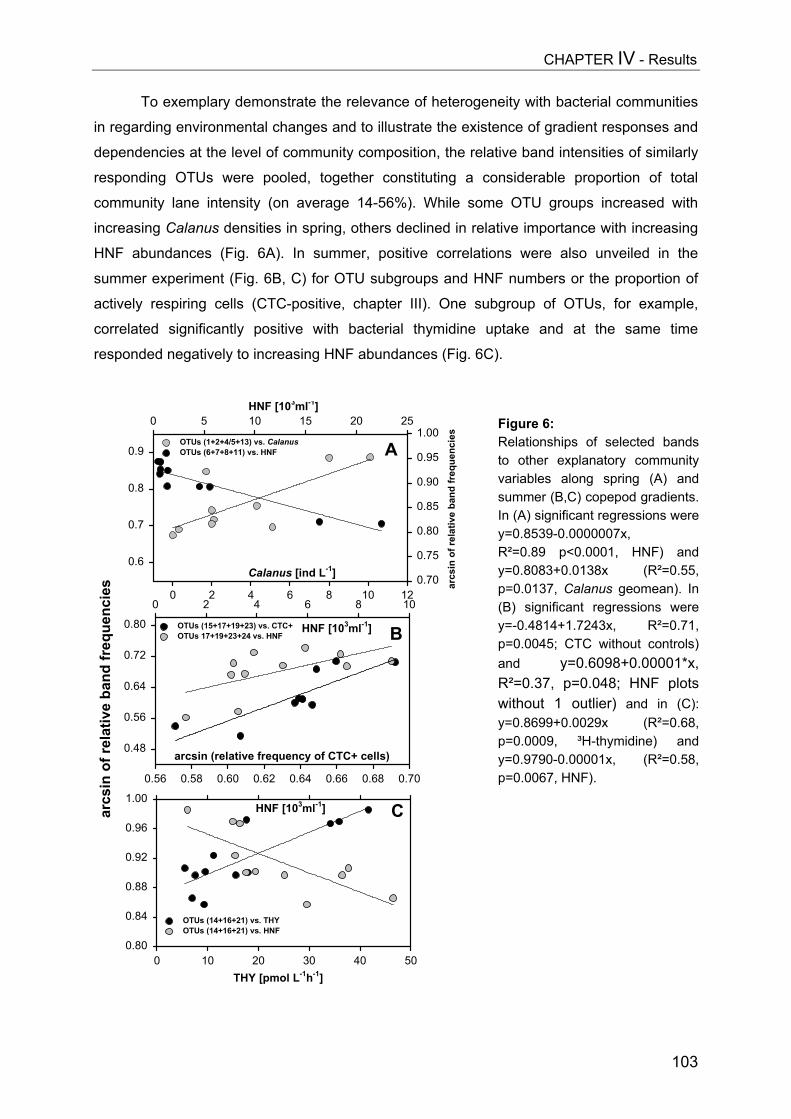
CHAPTER IV - Results
103
To exemplary demonstrate the relevance of heterogeneity with bacterial communities
in regarding environmental changes and to illustrate the existence of gradient responses and
dependencies at the level of community composition, the relative band intensities of similarly
responding OTUs were pooled, together constituting a considerable proportion of total
community lane intensity (on average 14-56%). While some OTU groups increased with
increasing Calanus densities in spring, others declined in relative importance with increasing
HNF abundances (Fig. 6A). In summer, positive correlations were also unveiled in the
summer experiment (Fig. 6B, C) for OTU subgroups and HNF numbers or the proportion of
actively respiring cells (CTC-positive, chapter III). One subgroup of OTUs, for example,
correlated significantly positive with bacterial thymidine uptake and at the same time
responded negatively to increasing HNF abundances (Fig. 6C).
Figure 6:Relationships of selected bandsto other explanatory communityvariables along spring (A) andsummer (B,C) copepod gradients.In (A) significant regressions werey=0.8539-0.0000007x,R²=0.89 p<0.0001, HNF) andy=0.8083+0.0138x (R²=0.55,p=0.0137, Calanus geomean). In(B) significant regressions werey=-0.4814+1.7243x, R²=0.71,p=0.0045; CTC without controls)and y=0.6098+0.00001*x,R²=0.37, p=0.048; HNF plotswithout 1 outlier) and in (C):y=0.8699+0.0029x (R²=0.68,p=0.0009, ³H-thymidine) andy=0.9790-0.00001x, (R²=0.58,p=0.0067, HNF).
arcsin (relative frequency of CTC+ cells)
0.56 0.58 0.60 0.62 0.64 0.66 0.68 0.70
0.48
0.56
0.64
0.72
0.80 HNF [103ml-1]
0 2 4 6 8 10
OTUs (15+17+19+23) vs. CTC+ OTUs 17+19+23+24 vs. HNF
THY [pmol L-1h-1]0 10 20 30 40 50
arcs
in o
f rel
ativ
e ba
nd fr
eque
ncie
s
0.80
0.84
0.88
0.92
0.96
1.00HNF [103ml-1]
OTUs (14+16+21) vs. THY OTUs (14+16+21) vs. HNF
Calanus [ind L-1]
0 2 4 6 8 10 12
arcs
in o
f rel
ativ
e ba
nd fr
eque
ncie
s
0.70
0.75
0.80
0.85
0.90
0.95
1.00
HNF [103ml-1]0 5 10 15 20 25
0.6
0.7
0.8
0.9OTUs (1+2+4/5+13) vs. Calanus OTUs (6+7+8+11) vs. HNF A
B
C
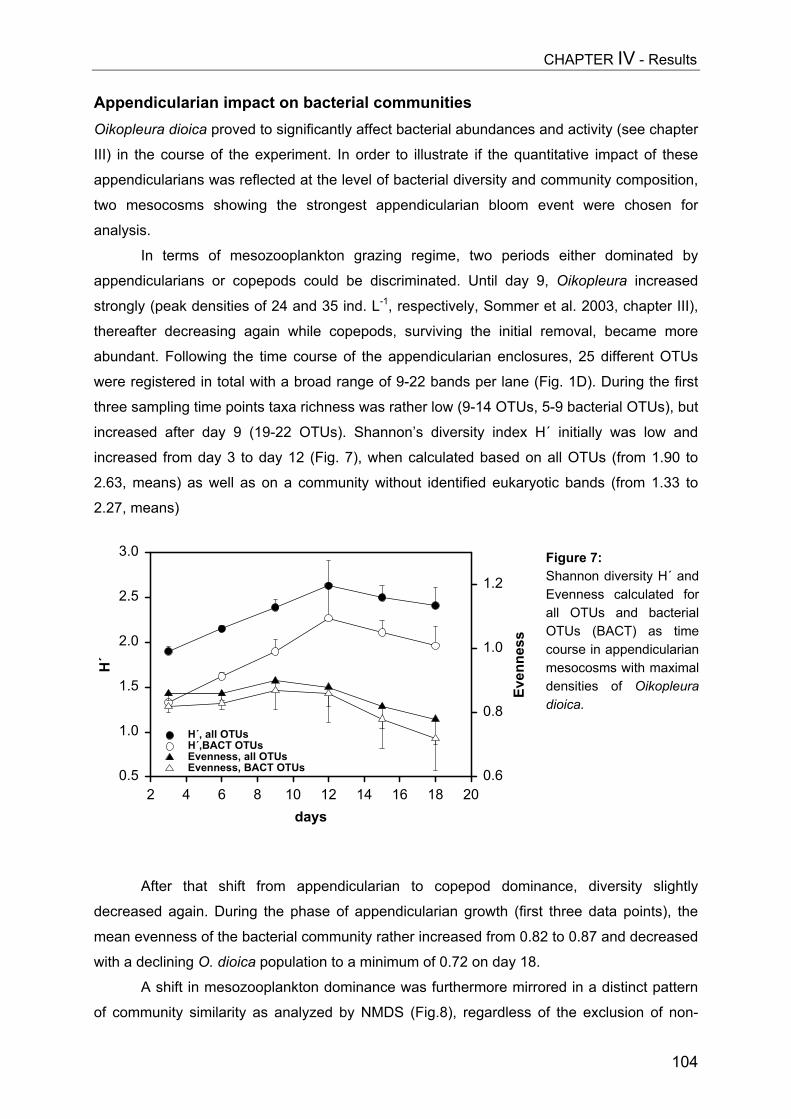
CHAPTER IV - Results
104
Appendicularian impact on bacterial communitiesOikopleura dioica proved to significantly affect bacterial abundances and activity (see chapter
III) in the course of the experiment. In order to illustrate if the quantitative impact of these
appendicularians was reflected at the level of bacterial diversity and community composition,
two mesocosms showing the strongest appendicularian bloom event were chosen for
analysis.
In terms of mesozooplankton grazing regime, two periods either dominated by
appendicularians or copepods could be discriminated. Until day 9, Oikopleura increased
strongly (peak densities of 24 and 35 ind. L-1, respectively, Sommer et al. 2003, chapter III),
thereafter decreasing again while copepods, surviving the initial removal, became more
abundant. Following the time course of the appendicularian enclosures, 25 different OTUs
were registered in total with a broad range of 9-22 bands per lane (Fig. 1D). During the first
three sampling time points taxa richness was rather low (9-14 OTUs, 5-9 bacterial OTUs), but
increased after day 9 (19-22 OTUs). Shannon’s diversity index H´ initially was low and
increased from day 3 to day 12 (Fig. 7), when calculated based on all OTUs (from 1.90 to
2.63, means) as well as on a community without identified eukaryotic bands (from 1.33 to
2.27, means)
After that shift from appendicularian to copepod dominance, diversity slightly
decreased again. During the phase of appendicularian growth (first three data points), the
mean evenness of the bacterial community rather increased from 0.82 to 0.87 and decreased
with a declining O. dioica population to a minimum of 0.72 on day 18.
A shift in mesozooplankton dominance was furthermore mirrored in a distinct pattern
of community similarity as analyzed by NMDS (Fig.8), regardless of the exclusion of non-
days2 4 6 8 10 12 14 16 18 20
H´
0.5
1.0
1.5
2.0
2.5
3.0
Even
ness
0.6
0.8
1.0
1.2
H´, all OTUsH´,BACT OTUs Evenness, all OTUsEvenness, BACT OTUs
Figure 7:Shannon diversity H´ andEvenness calculated forall OTUs and bacterialOTUs (BACT) as timecourse in appendicularianmesocosms with maximaldensities of Oikopleuradioica.
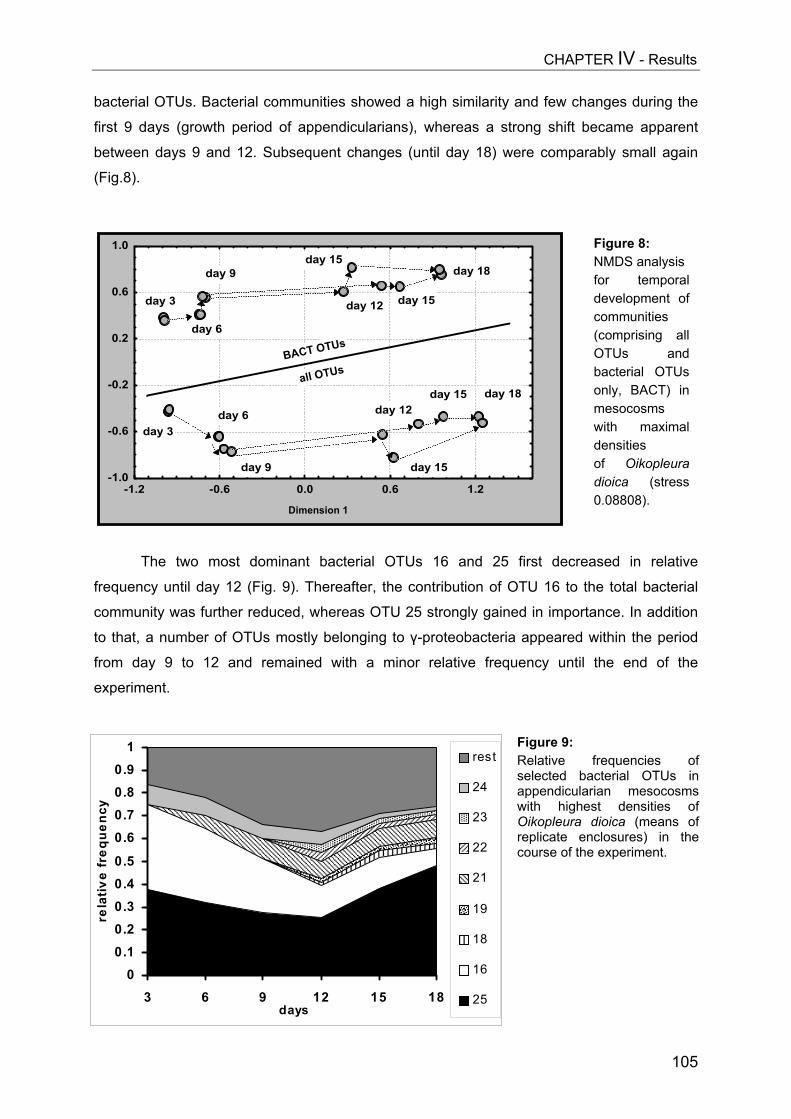
CHAPTER IV - Results
bacterial OTUs. Bacterial communities showed a high similarity and few changes during the
first 9 days (growth period of appendicularians), whereas a strong shift became apparent
between days 9 and 12. Subsequent changes (until day 18) were comparably small again
(Fig.8).
The two most dominant bacterial OTUs 16 and 25 first decreased in relative
frequency until day 12 (Fig. 9). Thereafter, the contribution of OTU 16 to the total bacterial
community was further reduced, whereas OTU 25 strongly gained in importance. In addition
to that, a number of OTUs mostly belonging to γ-proteobacteria appeared within the period
from day 9 to 12 and remained with a minor relative frequency until the end of the
experiment.
Dimension 1
-1.0
-0.6
-0.2
0.2
0.6
1.0
-1.2 -0.6 0.0 0.6 1.2
day 3
day 3
BACT OTUs
�������������
all OTUs
day 6
day 9���������������������������������������������������
���������������������������������������������������������������������������������������������������������������������������������������
����������������������������������
�������������
day 12
day 15
day 15
day 18
������������������������������������������������
�����������������������������������������������������������������������������������������������������������������
���������������������������������������������������������������������������������������������������������������������������������������������������������������������������������������������������������������������
��������
������ �����������������������������������������������������������������������������������������������������������������������������������������������
day 18day 15
day 15
day 12
day 9
day 6
Figure 8:NMDS analysisfor temporaldevelopment ofcommunities(comprising allOTUs andbacterial OTUsonly, BACT) inmesocosmswith maximaldensitiesof Oikopleuradioica (stress0.08808).
������������������������������������������������������������������������������������������������������������������������������������������������������������������������������������������������������������������������������������������������������������������������������������������������������������������������������������������������������������������������������������������������������������������������������������������������������������������������������������������������������������������������������������������������������������������������������������������������������������������������������������������������������������������������������������������������������������
������������������������������������������������������������������������������������������������������������������������������������������������������������������������������������������������������������������������������������������������������������������������������������������������������������������������������������������������������������������������������������������������������������������������������������������������������������������������������������������������������������������������������������������������������������������������������������������������������������������������������������������������������������������������������������������������������������
������������������������������������������������������������������������������������������������������������������������������������������������������������������������������������������������������������������������������������������������������������������������������������������������������������������������������������������������������������������������������������������������������������������������������������������������������������������������������������������������������������������������������������������������������������������������������������������������������������������������������������������������������������������������������������������������������������
������������������������������������������������������������������������������������������������������������������������������������������������������������������������������������������������������������������������������������������������������������������������������������������������������������������������������������������������������������������������������������������������������������������������������������������������������������������������������������������������������������������������������������������������������������������������������������������
������������������������������������������������������������������������������������������������������������������������������������������������������������������������������������������������������������������������������������������������������������������������������������������������������������������������������������������������������������������������������������������������������������������������������������������������������������������������
00.10.20.30.40.5
0.60.70.80.9
1
3 6 9 12 15 18days
rela
tive
freq
uenc
y
rest
24�����
23
����� 22
����� 21
����� 19
����� 18
16
25
Figure 9:Relative frequencies ofselected bacterial OTUs inappendicularian mesocosmswith highest densities ofOikopleura dioica (means ofreplicate enclosures) in thecourse of the experiment.
105
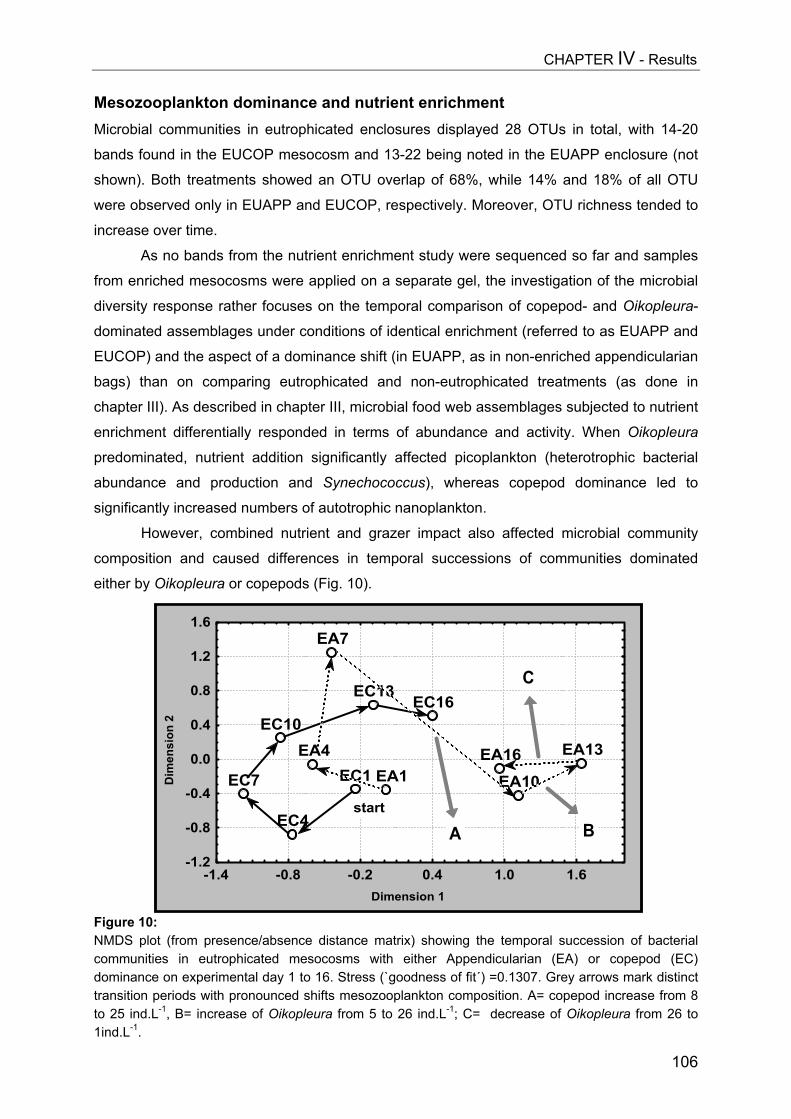
CHAPTER IV - Results
106
Mesozooplankton dominance and nutrient enrichmentMicrobial communities in eutrophicated enclosures displayed 28 OTUs in total, with 14-20
bands found in the EUCOP mesocosm and 13-22 being noted in the EUAPP enclosure (not
shown). Both treatments showed an OTU overlap of 68%, while 14% and 18% of all OTU
were observed only in EUAPP and EUCOP, respectively. Moreover, OTU richness tended to
increase over time.
As no bands from the nutrient enrichment study were sequenced so far and samples
from enriched mesocosms were applied on a separate gel, the investigation of the microbial
diversity response rather focuses on the temporal comparison of copepod- and Oikopleura-
dominated assemblages under conditions of identical enrichment (referred to as EUAPP and
EUCOP) and the aspect of a dominance shift (in EUAPP, as in non-enriched appendicularian
bags) than on comparing eutrophicated and non-eutrophicated treatments (as done in
chapter III). As described in chapter III, microbial food web assemblages subjected to nutrient
enrichment differentially responded in terms of abundance and activity. When Oikopleura
predominated, nutrient addition significantly affected picoplankton (heterotrophic bacterial
abundance and production and Synechococcus), whereas copepod dominance led to
significantly increased numbers of autotrophic nanoplankton.
However, combined nutrient and grazer impact also affected microbial community
composition and caused differences in temporal successions of communities dominated
either by Oikopleura or copepods (Fig. 10).
Figure 10:NMDS plot (from presence/absence distance matrix) showing the temporal succession of bacterialcommunities in eutrophicated mesocosms with either Appendicularian (EA) or copepod (EC)dominance on experimental day 1 to 16. Stress (`goodness of fit´) =0.1307. Grey arrows mark distincttransition periods with pronounced shifts mesozooplankton composition. A= copepod increase from 8to 25 ind.L-1, B= increase of Oikopleura from 5 to 26 ind.L-1; C= decrease of Oikopleura from 26 to1ind.L-1.
Dimension 1
Dim
ensi
on 2
EC1
EC4
EC7
EC10
EC13 EC16
EA1EA4
EA7
EA10
EA13EA16
-1.2
-0.8
-0.4
0.0
0.4
0.8
1.2
1.6
-1.4 -0.8 -0.2 0.4 1.0 1.6
������������������������������������������������
������������������������������������
������������������������������������������������������������������������������������������������������������������������������������������������������������������������������������������������������������������������������������������������������������������������������������������������������������������������������������������������������������������������������������������������������������������������������������������������������������������������������������������������������������������������������������������������������������������������������������������������������������������������������������������������������������������������������������������������������������������
����������������������������������������
��������������������������
start
A B
C
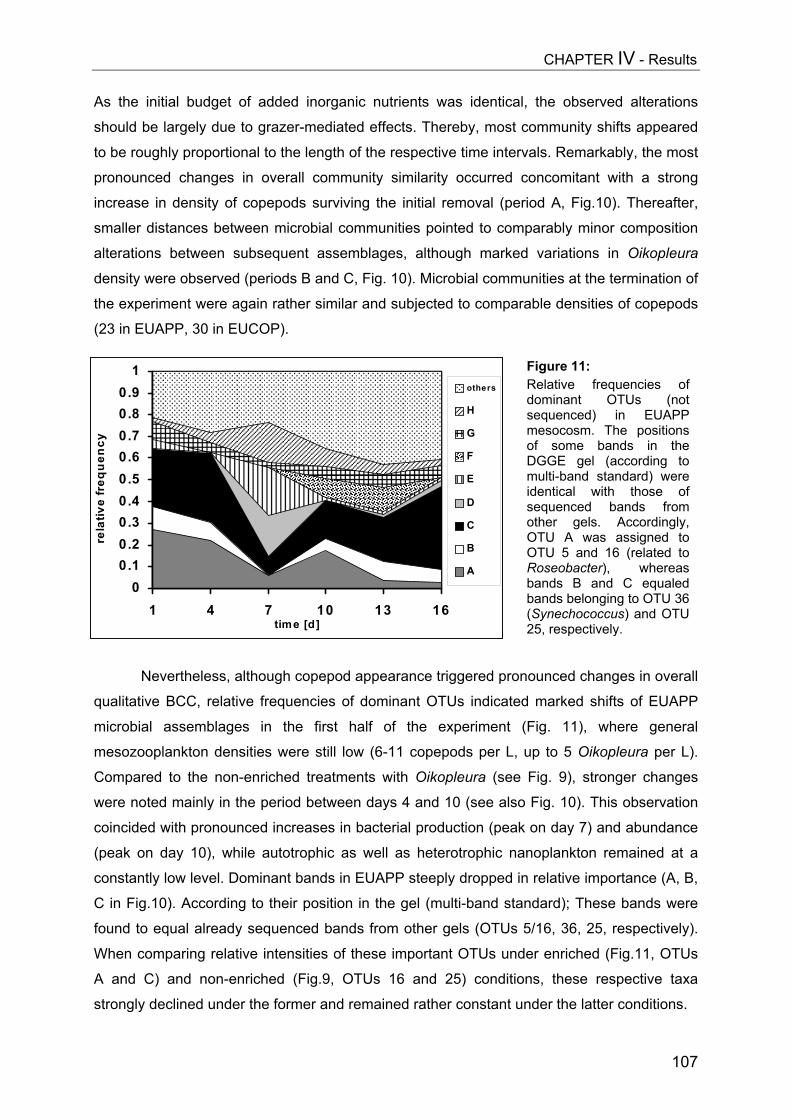
CHAPTER IV - Results
As the initial budget of added inorganic nutrients was identical, the observed alterations
should be largely due to grazer-mediated effects. Thereby, most community shifts appeared
to be roughly proportional to the length of the respective time intervals. Remarkably, the most
pronounced changes in overall community similarity occurred concomitant with a strong
increase in density of copepods surviving the initial removal (period A, Fig.10). Thereafter,
smaller distances between microbial communities pointed to comparably minor composition
alterations between subsequent assemblages, although marked variations in Oikopleura
density were observed (periods B and C, Fig. 10). Microbial communities at the termination of
the experiment were again rather similar and subjected to comparable densities of copepods
(23 in EUAPP, 30 in EUCOP).
Nevertheless, although copepod appearance triggered pro
qualitative BCC, relative frequencies of dominant OTUs indicate
microbial assemblages in the first half of the experiment
mesozooplankton densities were still low (6-11 copepods per L,
Compared to the non-enriched treatments with Oikopleura (see
were noted mainly in the period between days 4 and 10 (see als
coincided with pronounced increases in bacterial production (pea
(peak on day 10), while autotrophic as well as heterotrophic na
constantly low level. Dominant bands in EUAPP steeply dropped i
C in Fig.10). According to their position in the gel (multi-band sta
found to equal already sequenced bands from other gels (OTUs
When comparing relative intensities of these important OTUs un
A and C) and non-enriched (Fig.9, OTUs 16 and 25) conditio
strongly declined under the former and remained rather constant u
������������������������������������������������������������������������������������������������������������������������������������������������������������������������������������������������������������������������������������������������������������������������������������������������������������������������������������������������������������������������������������������������������������������������������������������������������������������������������������������������������������������������������������������������������������������������������������������������������������������������������������������������������������������������������������������������������������
������������������������������������������������������������������������������������������������������������������������������������������������������������������������������������������������������������������������������������������������������������������������������������������������������������������������������������������������������������������������������������������������������������������������������������������������������������������������������������������������������������������������������������������������������������������������������������������������������������������������������������������������������������������������������������������������������������
������������������������������������������������������������������������������������������������������������������������������������������������������������������������������������������������������������������������������������������������������������������������������������������������������������������������������������������������������������������������������������������������������������������������������������������������������������������������������������������������������������������������������������������������������������������������������������������
������������������������������������������������������������������������������������������������������������������������������������������������������������������������������������������������������������������������������������������������������������������������������������������������������������������������������������������������������������������������������������������������������������������������������������������������������������������������
������������������������������������������������������������������������������������������������������������������������������������������������������������������������������������������������������������������������������������������������������������������������������������������������������������������������������������������������������������������������������������������������������������������������������������������������������������������������������������������������������������������������������������������������������������������������������������������������������������������������������������������������������������������������������������������������������������������������������������������������������������������������������������������������������������������������������
00.10.20.30.40.50.60.70.80.9
1
1 4 7 10 13 16time [d]
rela
tive
freq
uenc
y
����others
�������� H���� G�������� F���� E
D
C
B
A
Figure 11:Relative frequencies ofdominant OTUs (notsequenced) in EUAPPmesocosm. The positionsof some bands in theDGGE gel (according tomulti-band standard) wereidentical with those ofsequenced bands fromother gels. Accordingly,OTU A was assigned toOTU 5 and 16 (related toRoseobacter), whereasbands B and C equaledbands belonging to OTU 36(Synechococcus) and OTU25, respectively.
107
nounced changes in overall
d marked shifts of EUAPP
(Fig. 11), where general
up to 5 Oikopleura per L).
Fig. 9), stronger changes
o Fig. 10). This observation
k on day 7) and abundance
noplankton remained at a
n relative importance (A, B,
ndard); These bands were
5/16, 36, 25, respectively).
der enriched (Fig.11, OTUs
ns, these respective taxa
nder the latter conditions.
CHAPTER IV - Discussion
108
DISCUSSION General aspects and methodologyMarine bacterioplankton communities are regulated by nutrients (Ducklow 2000), protist
predation (e.g. Del Giorgio et al. 1996, Zubkov et al. 2000) and viral infections (Fuhrman
1999). The presence of copepods can increase bacterial abundance and growth (e.g. Møller
and Nielsen 2001, Maar et al. 2002) or alternatively trigger a 4-link trophic cascade
negatively affecting bacterioplankton (chapter III). Appendicularians, in contrast, can reduce
bacterial concentrations and activity by direct predation (King et al. 1980, Zubkov and Lopez-
Urrutia 2003, chapter III). Consequently, I expected both mesozooplankton groups to cause
shifts in bacterioplankton community composition. The study objectives were to investigate
trophodynamic effects of different mesozooplankton on microbial food web components,
thereby including key zooplankton organisms (Calanus finmarchicus, Oikopleura dioica) and
allowing for longer-term (more than 1-3 days) cascading temporal and density–dependent
effects. This detailed and comprehensive analysis was composed of independent large-scale
experiments in different seasons and food web scenarios. While many studies end at the
level of protists (Broglio et al. 2001) or of bacterial biomass and activity (Hansen et al. 2000),
my primary goal was to link patterns of numerical and/or activity responses of functional
microbial food web components to patterns of BCC using 16S-DNA fingerprinting and
sequencing.
Constraints of the semi-quantitative PCR-DGGE are well known (Muyzer et al. 1993,
Muyzer et al. 1998, Riemann et al. 1999), amongst those the fact that only more abundant
species are detected. Cloning approaches should be involved to resolve total bacterial
diversity (Fuhrman and Ouverney 1998, Kerkhof et al. 1999, Fuhrman 2002). Another
potential obstacle could be that ecologically different bacterial groups might not show
differences in 16S-DNA.
Nevertheless, PCR-DGGE, especially when combined with sequencing, is a often
used and highly reproducible method (Schauer et al. 2000, Diez et al. 2001) to trace
changes within microbial communities on temporal and spatial scales (e.g. Riemann et al.
1999) or after various environmental perturbations like dinoflagellate bloom events (Fandino
et al. 2001).
Conscious of the constraints mentioned above and potential PCR biases (e.g.
selective/differential amplification, (von Wintzingerode et al. 1997) also affecting final ratios of
PCR amplicons (Suzuki and Giovannoni 1996), quantitative interpretations using relative
DGGE band intensities should be done rather cautiously (discussed in Schauer et al. 2003).
For that reason I never attempted to give absolute values for the presence of the different
phylogenetic groups, and for comparison of community similarity I conservatively focused
mainly on the presence and absence of bands, although integrating relative values did not
CHAPTER IV - Discussion
109
change general patterns (not shown). Nevertheless, in order to further elucidate community
dynamics, the additional consideration of relative OTU frequencies can be useful.
Meanwhile, many studies include relative band frequencies (Massana et al. 2001,
Massana and Jürgens 2003, Schauer et al. 2003, Larsen 2004), argue that according to the
high reproducibility of DGGE fingerprints (Schauer et al. 2000) changes in band intensities
are likely due to relative changes in the abundances of the corresponding populations.
Furthermore, several authors have shown a correlation between the abundance of
morphologically distinct organisms and the corresponding DGGE signal e.g. (Nübel et al.
1999 and some even yielded better correlations with environmental variables (Muylaert et al.
2002).
Before all analyses, I reduced potential biases as much as possible and highly
standardised the method (equal template amount in PCR, equal amount of PCR product in
DGGE, automated image analysis, multi-band-standard in the gel), which I expect to make
the analyses of relative frequency changes over time and along gradients more reliable.
Richness, diversity and taxonomic composition Although total microbial diversity is estimated to be very high, a compilation of current
research demonstrated the consistent finding of a low or moderate diversity in the marine
environment (Pinhassi and Hagström 2000, Hagström et al. 2002). Samples of pelagic
bacterioplankton mostly yielded astonishingly low richness estimates and small numbers of
dominant taxa for a given time and space, at least when fingerprinting and no cloning
approaches were applied. The number of OTUs detected in spring and summer mesocosm experiments
corresponds well to richness values documented by studies from other marine systems
(Riemann and Middelboe 2002, Massana and Jürgens 2003), Larsen 2004,12 bands). Many
investigations from coastal marine habitat report 2-15 numerically dominant bacterial taxa (in
Pinhassi and Hagström 2000). Also values for Shannon’s diversity index H´ of 1.8-2.4 in
spring and 2.1-2.4 (1.3-2.3 in appendicularian mesocosms) in summer were well within the
range described from other aquatic habitats. While values were slightly lower than those
reported from the north-western Mediterranean coast (2.5–3.1; Schauer et al. 2000) and
higher than diversity indices reported from a seasonal study in a eutrophic lake (0.2–0.9;
Höfle et al. 1999, based on direct analysis of 5S rRNA), they perfectly matched with other
data for Norwegian coastal waters (1.8 to 2.4, Larsen 2004, based on DGGE).
The taxonomic/phylogenetic community composition found in the experiments could
be considered typical for a coastal pelagic habitat. Dominant bacterial OTU groups in the
experiments affiliated with the Cytophaga-Flavobacterium cluster of the Bacteroidetes (see
Eilers et al. 2001) (27-28% mean relative frequency along spring and summer copepod

CHAPTER IV - Discussion
110
gradients) as well as the alpha-(26% spring, 38% summer) and gamma- (26% spring, 20%
summer) Proteobacteria. Only a minor proportion of the communities was related to other
groups like Actinobacteria and beta-Proteobacteria, showing higher frequencies in spring
(3.2%, 11%) than in summer (1.4%, 4.7%), respectively.
Alpha-Proteobacteria comprise one of the largest fractions of heterotrophic marine
bacteria (Hagström et al. 2002) and their dominant clades SAR11 and Roseobacter were
found to be an abundant and ecologically important bacterioplankton component in coastal
and near surface waters (Gonzalez and Moran 1997, Acinas et al. 1999, Morris et al. 2002,
Selje et al. 2004). Also within North Sea bacterioplankton assemblages alpha-Proteobacteria
were a predominant group (Zubkov et al. 2001, 2002). These were cells with high nucleic
acid and high protein content were mainly affiliated to the genus Roseobacter.
OTUs related to the Roseobacter lineage were also dominant members of all
assemblages in spring and summer. OTUs 5 and 16 (99-100% similarity with Roseobacter
NAC11-3) could be even assigned to the newly discovered RCA (Roseobacter-clade-
affiliated) cluster (Selje et al. 2004).
In terms of community composition, I found a higher average proportion of alpha-
Proteobacteria under relatively nutrient-poor conditions in summer. Similar evidence comes
from Pinhassi and Hagström (2000), who discovered a significant contribution of certain
alpha-Proteobacteria (Sphingomonas and Caulobacter species) possessing the capacity to
successfully cope with oligotrophic growth conditions and low phosphate concentrations.
These community differences could indicate a different physiological predisposition of the
dominant bacteria in both seasons probably leading to the observed differences when
comparing spring and summer community dynamics.
Bacterial community patterns – stability versus dynamicsThe overall qualitative changes within the investigated bacterial communities were
comparably small and a high proportion of OTUs was present in all treatments thus indicating
a stable bacterial community very robust towards changes in food web configurations and
grazing pressure.
When comparing relative increases and decreases of bacterial diversity with those of
microbial food web parameters in highest and lowest copepod density treatments between
start and termination of the experiment (after 1week), amplitudes were remarkably smaller in
terms of diversity in both spring and summer (Tab.5). Relative changes in abundances and
activity (means of enclosure replicates) varied most strongly in spring (ciliates: –99 to +85%,
HNF: –82 to +88%, bacteria: +1 to +46%, bacterial thymidine uptake: –33 to +188%) and
were often even larger between the start and the midst of the experiment. Contrastingly,
average bacterial diversity increases over this period were less distinct (approximately 32%).
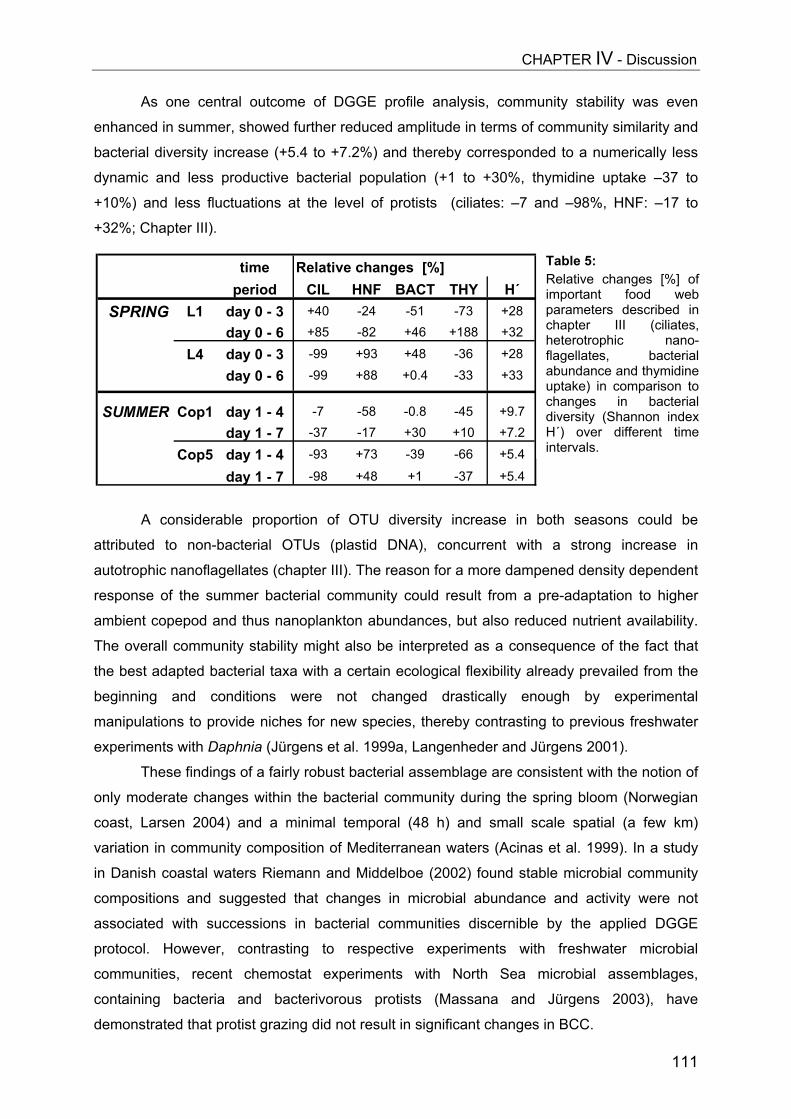
CHAPTER IV - Discussion
As one central outcome of DGGE profile analysis, community stability was even
enhanced in summer, showed further reduced amplitude in terms of community similarity and
bacterial diversity increase (+5.4 to +7.2%) and thereby corresponded to a numerically less
dynamic and less productive bacterial population (+1 to +30%, thymidine uptake –37 to
+10%) and less fluctuations at the level of protists (ciliates: –7 and –98%, HNF: –17 to
+32%; Chapter III).
A considerable proportion of OTU diversity increase in b
attributed to non-bacterial OTUs (plastid DNA), concurrent with
autotrophic nanoflagellates (chapter III). The reason for a more damp
response of the summer bacterial community could result from a
ambient copepod and thus nanoplankton abundances, but also redu
The overall community stability might also be interpreted as a cons
the best adapted bacterial taxa with a certain ecological flexibility al
beginning and conditions were not changed drastically en
manipulations to provide niches for new species, thereby contrastin
experiments with Daphnia (Jürgens et al. 1999a, Langenheder and J
These findings of a fairly robust bacterial assemblage are con
only moderate changes within the bacterial community during the s
coast, Larsen 2004) and a minimal temporal (48 h) and small s
variation in community composition of Mediterranean waters (Acinas
in Danish coastal waters Riemann and Middelboe (2002) found sta
compositions and suggested that changes in microbial abundanc
associated with successions in bacterial communities discernible
protocol. However, contrasting to respective experiments with
communities, recent chemostat experiments with North Sea
containing bacteria and bacterivorous protists (Massana and
demonstrated that protist grazing did not result in significant changes
time Relative changes [%]period CIL HNF BACT THY H´
SPRING L1 day 0 - 3 +40 -24 -51 -73 +28day 0 - 6 +85 -82 +46 +188 +32
L4 day 0 - 3 -99 +93 +48 -36 +28
day 0 - 6 -99 +88 +0.4 -33 +33
SUMMER Cop1 day 1 - 4 -7 -58 -0.8 -45 +9.7day 1 - 7 -37 -17 +30 +10 +7.2
Cop5 day 1 - 4 -93 +73 -39 -66 +5.4
day 1 - 7 -98 +48 +1 -37 +5.4
Table 5:Relative changes [%] ofimportant food webparameters described inchapter III (ciliates,heterotrophic nano-flagellates, bacterialabundance and thymidineuptake) in comparison tochanges in bacterialdiversity (Shannon indexH´) over different timeintervals.
111
oth seasons could be
a strong increase in
ened density dependent
pre-adaptation to higher
ced nutrient availability.
equence of the fact that
ready prevailed from the
ough by experimental
g to previous freshwater
ürgens 2001).
sistent with the notion of
pring bloom (Norwegian
cale spatial (a few km)
et al. 1999). In a study
ble microbial community
e and activity were not
by the applied DGGE
freshwater microbial
microbial assemblages,
Jürgens 2003), have
in BCC.
CHAPTER IV - Discussion
112
Furthermore, in seawater enclosures Larsen et al. (2001) observed that the total
bacterial number decreased markedly during the flagellate bloom but the community
composition was maintained and the diversity remained high, as found in the highest density
copepod treatments. With respect to the impact of higher trophic levels, Zubkov and Lopez-
Urrutia (2003) also found a robustness of the bacterioplankton community structure in short-
term experiments. The presence of both crustacean and gelatinous mesozooplankton did not
affect bacterioplankton composition (as analysed by group-specific oligonucleotide probes)
but showed opposite effects on bacterioplankton growth. This stability is in contrast to many
food web manipulation effects in freshwater (e.g. Šimek et al. 1999, Jürgens et al. 1999a).
Nevertheless, despite a marked qualitative stability (mainly in summer) I revealed
copepod-mediated time- as well as density-dependent bacterial community changes and
dynamics. Thereby, it can not be completely excluded that indirect and non-predatory effects
(DOC release by copepods, fishing of controls) might have stimulated bacterial growth or
contributed to community changes.
Interestingly, two aspects of community dynamics and treatment-dependent changes
were distinguishable, on one hand the degree to which communities separated dependent on
copepod density after one week of experiment, on the other hand the extent to which
assemblages changed in the first half of the experiment (diversity maintenance or switch-
back).
In terms of community similarity, the highest density copepod treatments (L4, S4,
Cop5) were always most separated after one week of experiment, over time and across
gradients. Furthermore, a higher level of diversity was found in those treatments, that at the
same time contained highest numbers of HNF grazers. Diversity increase was slower but
persisted longest in those highest density mesocosms. Mainly in spring, very high HNF
densities (and potentially high diversity of HNF feeding strategies) caused lower bacterial
abundances and might have stimulated bacterial diversity by avoiding the predominance of
single species. So, this could suggest that the predatory cascade from high copepod to low
ciliate and high HNF abundances triggered microbial community changes.
In general, temporal dynamics and relative incline in diversity with diversity peaks on
day 3 (4) were higher in controls and lowest density treatments in both seasons. Here, high
ciliate and very low HNF abundances prevailed (and in addition potential stimulation by
copepod fishing in controls and DOC by copepods). Concomitant with a clear temporal
diversity increase in lowest density treatments and controls I observed even pronounced
inclines in production and very high single-cell activities of bacteria in all experiments,
probably indicating fast growing cells to take advantage of a potentially good substrate supply
(grazing-derived DOC) and constantly low HNF abundances (see chapter III). Especially for
the summer experiment with high ambient natural copepod abundances in the Fjord (28-55
CHAPTER IV - Discussion
113
ind.L-1, Saage 2003), one might assume that an experimental initial reduction in copepod
densities in lowest density treatments and controls caused a stronger disturbance and larger
changes in grazing pressure regime than an increase in copepod density. Few other studies
determined whether the phylogenetic succession is accompanied by detectable changes in
metabolic activity both at the bulk community level and at the level of single cells as at
present it is still difficult to assess the level of activity of the various phylogenetic groups
directly (del Giorgio and Bouvier 2002).
Moreover, the present study revealed differential and heterogeneous
(increase/decrease) responses of community subgroups. Correlations with other community
parameters and environmental variables thus give support to other recent studies that found
a covariance of bacterioplankton composition and environmental variables and a partitioning
of ecological roles at the genus or species level (Stepanauskas et al. 2003). Horner-Devine
et al. (2003) showed for the first time certain response patterns of richness of whole
freshwater bacterial subgroups to a gradient of primary productivity, with a U-shaped
relationship for alpha- and a hump-shaped one for beta-Proteobacteria. In contrast, Zubkov
et al. (2002) found that the distribution of bacterioplankton groups did not correlate with the
distribution of either chlorophyll a (chl a), or phytoplankton groups or physical parameters
such as temperature and salinity. The analyses revealed various correlations between the
relative frequencies of OTU subgroups to gradients of HNF-grazing resulting, for example, in
a dominance of some alpha-Proteobacteria (mainly Roseobacter-affiliated OTUs) under very
high HNF densities (e.g. L4 mesocosms). This could be an indication for a reduced
susceptibility to HNF grazing. Other investigations also found evidence for selective grazing
on taxonomically different components of the bacterial community and alpha-Proteobacteria
showing less grazing susceptibility (Lebaron et al. 2001b, Beardsley et al. 2003).
However, it is still hard to discriminate between the ultimate factors of bacterial
community shifts and to obtain an even better resolution of the interaction of factors
governing the distribution of bacterial taxa. So, correlations remain speculative to a certain
extent and trends along copepod gradients might not only be a result of direct grazing, but of
course might be influenced additionally by the occurrence of certain taxa of algae, the
abundance of host-specific viruses or the selective favouring of bacterial subgroups by in- or
decreasing substrate diversity and concentrations of inorganic nutrients and DOC/DON
excreted by copepods. More information on the phenotypic and physiological properties of
the different bacterial taxa is needed to understand their dynamics.
Aspects of predominance – Oikopleura dioica versus copepods This study not only provided clear evidence for changes in bacterial community composition
and diversity due to copepod-triggered trophic cascades, but furthermore also for bacterial
CHAPTER IV - Discussion
114
assemblage alterations caused by a community shifts at higher trophic levels from
appendicularian to copepod dominance. The observed blooming event of the
appendicularian Oikopleura dioica reached its maximum on experimental day 9 and persisted
until day 12, resulting in a strong reduction of bacterial abundance and production (see
chapter III). The initial species-poor community increased in abundance until day 9,
paralleled by increasing numbers and sizes of Oikopleura.
During this first period, Oikopleura only weakly affected BCC as shown by high
similarity in NMDS analysis. Besides, some increase in Shannon’s diversity index H´ and an
increase in evenness until the peak of the appendicularian bloom was observed, indicating
that filter-feeding zooplankton could enhance community homogeneity. These results
obtained from the first experimental week could therefore provide larger-scale field evidence
for a weak impact of Oikopleura dioica on BCC, supporting findings from short-term bottle
experiments (Zubkov and Lopez-Urrutia 2003).
The second period between days 9 and 12, was characterized by a marked shift in
mesozooplankton community. While the Oikopleura population already decreased, copepod
increases from below 10 to approx. 30 per liter (Sommer et al. 2003) were noted. This
experimental phase caused considerable alterations in BCC (see Figs.8, 9) with a further
increase in diversity and new bacterial taxa, which became detectable and gained in relative
frequency. Probably a combination of underlying mechanisms interacts, which are difficult to
resolve. Still high numbers of now larger Oikopleura individuals caused a significant
quantitative reduction of bacteria and could have affected bacterial diversity by favouring fast
growing bacteria, maybe supported by a continuous increase in the percentage of HNA
bacteria (see chapter III). On the other hand, increasing copepods reduced appendicularian
and ciliate grazing pressure and potentially provided more substrate diversity. Subsequent
changes (until day 18) were comparably small again, characterized mainly by an increase in
chloroplast-derived OTUs due to increasing densities in autotrophic nanoplankton.
A very similar phenomenon became obvious under nutrient-enriched conditions, and
patterns in BCC change could be linked to succession periods of mesozooplankton (Fig. 10).
Microbial community shifts turned out to be most pronounced during the transition period of
strongly increasing copepods, whereas striking changes in Oikopleura density caused no
alterations of similar intensity. This could suggest that copepods more distinctly shape
microbial community composition by reducing ciliate predators and by indirectly enhancing
HNF densities.
Despite the same initial nutrient addition, bacterial community shifts differed according
to deviating mesozooplankton successions. However, the degree to which nutrient regime
accounted for bacterial community development remained speculative. Øvreås et al. (2003)
found only moderate changes within the bacterial community in response to manipulation of
CHAPTER IV - Discussion
115
inorganic nutrients, which became more pronounced when glucose was added additionally.
Also protein addition can trigger marked community changes (Pinhassi et al. 1999).
Nevertheless, changes in relative frequencies of some dominant OTUs were much more
intense under enriched conditions (EUAPP, Fig.11) than in non-enriched mesocosms with
Oikopleura, although both mesocosm sets had comparable background densities of
copepods during the first week before strong copepod inclines (on average approx. 8 ind.L-1).
Possibly, high and even increasing densities of ciliates (data not shown) could have been
responsible for changes in EUAPP during that period. Alternatively, an earlier appearance of
Oikopleura dioica in the non-eutrophicated mesocosms, compared with the delayed bloom in
EUAPP (roughly 2 weeks after start), could have exerted an equalising effect on the bacterial
community allowing for only very modest community changes.
In general, bacterioplankton communities proved quite well-buffered across a wide
gradient of food web scenarios, but at the same time several temporal and copepod density-
dependent trends in trophically induced changes of BCC were elucidated in the present
study. Bacterial community shifts could be assigned to changes in mesozooplankton
configurations and copepod-mediated cascading effects became visible at bacterial level and
caused increasing trends in taxa richness and diversity. Correlations with food web
parameters were observed and differential responses noted in various bacterial taxa. Finally,
according to more pronounced food web dynamics in spring also bacterial communities
displayed larger response amplitudes.
Up to now, this study comprises the most detailed investigations in this field and
enables to judge changes within the bacterial community in relation to trophic interactions.
Further examinations of the degree of interaction between top-down and bottom-up
determinants are needed in order to understand the linkage between zooplankton-induced
bacterial community shifts, bacterial substrate utilisation patterns and dynamics at the
species level and their implications for functional redundancy and biogeochemical cycles on
a larger scale.
VChapter 5
Trophic cascades
–
Synoptical remarks
CHAPTER V - Abstract
116
Trophic cascades affect aquatic microorganisms
- Synoptical remarks -
ABSTRACTMicroorganisms (bacteria, fungi, protists) rule the most important processes and matter
fluxes within the ocean as well as in lakes, and their biogeochemical activity mediates
element cycling and climate on a global scale (Cotner and Biddanda 2002, del Giorgio and
Duarte 2002). Even though recent research in aquatic microbial ecology has been successful
in identifying key players and novel metabolic pathways in bacterial communities, the impact
of biotic interactions on microbial assemblages is only poorly understood. The importance of
top-down regulation and cascading trophic interactions for primary producers and herbivores
has been demonstrated in marine and freshwater systems (Brett and Goldman 1996, Micheli
1999). Here I show that similar mechanisms are effective in structuring aquatic heterotrophic
microbial communities. Mesocosm experiments, performed during different seasons at one
freshwater and one marine site, revealed that copepods, as a dominant zooplankton group,
trigger a community-level trophic cascade which strongly affects the microbial food web
structure. Despite variability in the physico-chemical conditions and the dominating copepod
species, a similar general pattern could be observed which included an inverse relationship
of mesozooplankton to microzooplankton (ciliates) and an inverse relationship of
microzooplankton to nanoplankton (bacterivorous flagellates). The copepod predation impact
propagated even to the bacterial level and affected bacterial abundance, production and
diversity in all systems. However, the bacterial response was more dampened and variable
between the different experiments, indicating the existence of stabilising feed-back
mechanisms.
CHAPTER V - Introduction
117
INTRODUCTIONWithin aquatic pelagic habitats, predation of mesozooplankton on microbial food web
organisms can be considered the most direct form of their interaction. In various studies, the
importance of filter-feeding cladocerans, and here mainly of the genus Daphnia, for top-down
regulation of lower trophic levels has been emphasised (e.g. Jürgens 1994, Langenheder
and Jürgens 2001, Degans et al. 2002). Also in the present thesis, the trophic effects of
daphnids on ciliates, nanoflagellates, auto- and heterotrophic bacterioplankton were
analyzed in detail. Moreover, I investigated their ability to affect bacterial composition, activity
patterns, substrate turnover and even their potential to suppress bloom events of filamentous
bacteria and thus extended the view of their overall impact (Chapter I and II).
Analogous to their freshwater counterparts, marine filter-feeders like the
appendicularian Oikopleura dioica (Chapter III) proved to significantly reduce at least the
picoplankton size-class. Due to their rather small body size and a background population of
simultaneously feeding copepods (see Chapter III) their impact on protists was difficult to
estimate, but probably not as effective as freshwater cladocerans. Furthermore,
appendicularian blooming events are rather short-lived scenarios and their grazing impact
thus is not as long-lasting.
In the study of food web interactions, the discovery of trophic cascades has rendered
substantial popularity and the concept is still intensely debated in community and ecosystem
ecology (Shurin et al. 2002, Chase 2003). A trophic cascade, as one of the most prominent
indirect interactions, can be defined as the inverse patterns of abundance or biomass across
more than one trophic link in a food web (Pace et al. 1999). Trophic cascades have first been
described for marine intertidal (Paine 1980) and lake plankton communities (Carpenter et al.
1985) but are meanwhile documented for a variety of marine and terrestrial ecosystems from
the tropics to the Arctic (Pace et al. 1999). Generally, carnivores, herbivores and primary
producers are involved in trophic cascades. Prominent examples in which food web effects
propagate across four trophic levels were documented for freshwater lakes where
piscivorous fish reduce planktivores which in turn allow abundant large-size zooplankton to
control phytoplankton biomass and improve water clarity (Carpenter et al. 1985). Besides
community organisation, trophic cascades and food web structures can impact on a variety of
ecosystem functions such as community respiration and total ecosystem production
(Carpenter et al. 2001, Pace et al. 1999).
The importance of cascades is, however, quite variable among different ecosystems
and within a given ecosystem trophic interactions do not always cascade (Strong 1992). This
is also true for the pelagic fish-zooplankton-phytoplankton food chain, for which the largest
number of studies exist. Meta-analysis of published experiments suggested that cascading
effects of fish on phytoplankton are uncommon in marine pelagic (Micheli 1999) but common

CHAPTER V - Introduction
118
in freshwater plankton (Brett and Goldman 1996). Predatory effects might not cascade due to
buffering mechanisms such as omnivory, substitutability of species and development of
inedible prey (Strong 1992, Persson 1999). Moreover, the strength of trophic cascades may
decrease along a gradient of productivity (Chase 2003). To account for the heterogeneity
within trophic levels, recent studies differentiate trophic cascades into “species cascades”,
whereby changes in predators affect only a subset of the community, and “community-level
cascades” in which the biomass of whole trophic levels is changed (Polis 1999). Only
community-level cascades are expected to cause significant changes in biomass distribution
and effects on ecosystem processes. It is argued that such “true” trophic cascades are rather
the exception than the rule, and are found mainly in aquatic ecosystems (Power 1992, Strong
1992).
Trophic cascades should be of particular importance when microorganisms are
affected because their activity mediates most of the important biogeochemical processes.
Heterotrophic and autotrophic prokaryotes constitute a significant biomass in planktonic
ecosystems and have been recognized as an integral component of aquatic food webs.
Multiple trophic levels (bacteria, autotrophic picoplankton, flagellates, ciliates) are organised
within a microbial food web, in which a major part of planktonic nutrient recycling, respiration
and production is taking place (e.g. Blackburn et al. 1996, Rivkin and Legendre 2001, del
Giorgio and Duarte 2002. The main predators on planktonic prokaryotes are small
heterotrophic and mixotrophic protists (flagellates, ciliates) which in turn are grazed by
metazoan zooplankton. Therefore it is conceivable that cascading predatory effects can
propagate from mesozooplankton via protists to bacteria. Such a cascade should have
profound effects on the general structure and function of microbial communities because
bacterial assemblages respond rapidly to changes in predation regime by shifts at the
taxonomical, morphological and physiological level.
Copepods constitute the majority of the mesozooplankton in the oceans and
temporarily also in many lakes, and they are the most important link between phytoplankton
and fish production in marine systems. Although copepods depend mainly on phytoplankton
as prey, they are generally omnivorous and have evolved mechanosensory systems to detect
and efficiently capture motile prey such as ciliates (Tiselius and Jonsson 1990, Kiørboe
1997). It has been demonstrated in various systems that copepod populations have the
capability to control planktonic ciliates, thereby linking the microbial food web to higher
trophic levels (Stoecker and Capuzzo 1990, Levinsen et al. 2000, Zöllner et al. 2003).
Cascading predation effects exerted by planktonic copepods should be a widespread and
important factor for structuring pelagic food webs and influencing microbially mediated
processes.
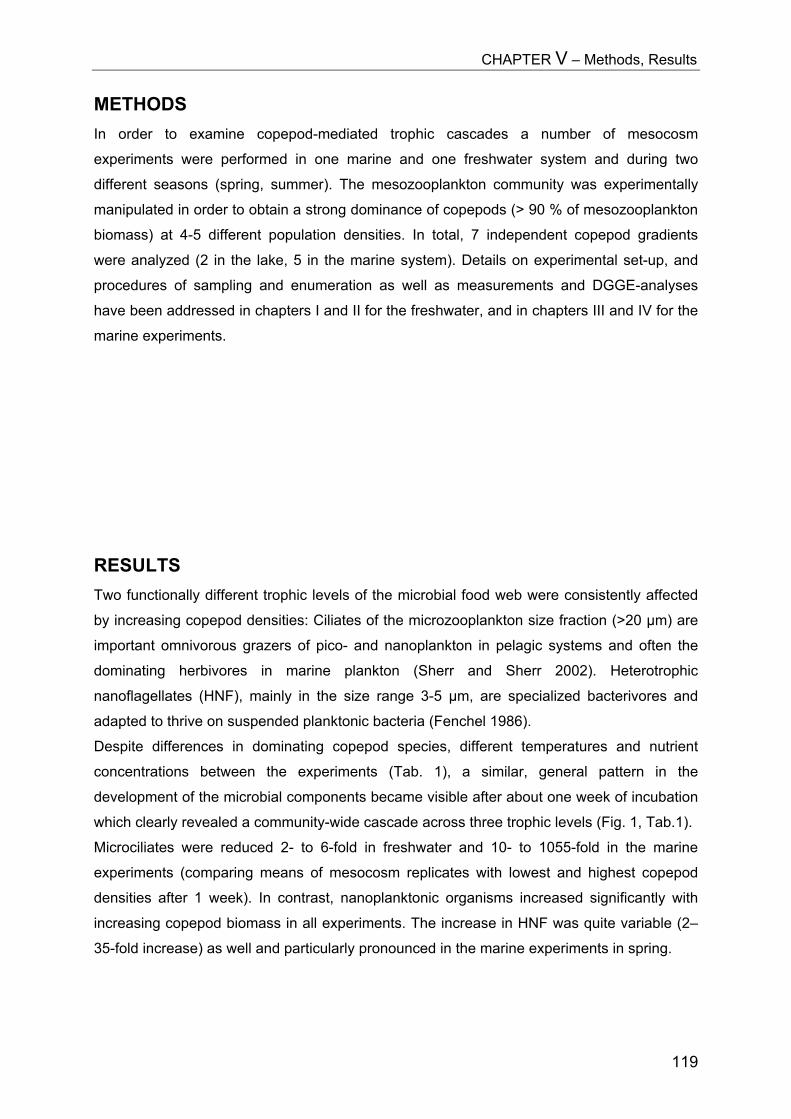
CHAPTER V – Methods, Results
119
METHODSIn order to examine copepod-mediated trophic cascades a number of mesocosm
experiments were performed in one marine and one freshwater system and during two
different seasons (spring, summer). The mesozooplankton community was experimentally
manipulated in order to obtain a strong dominance of copepods (> 90 % of mesozooplankton
biomass) at 4-5 different population densities. In total, 7 independent copepod gradients
were analyzed (2 in the lake, 5 in the marine system). Details on experimental set-up, and
procedures of sampling and enumeration as well as measurements and DGGE-analyses
have been addressed in chapters I and II for the freshwater, and in chapters III and IV for the
marine experiments.
RESULTSTwo functionally different trophic levels of the microbial food web were consistently affected
by increasing copepod densities: Ciliates of the microzooplankton size fraction (>20 µm) are
important omnivorous grazers of pico- and nanoplankton in pelagic systems and often the
dominating herbivores in marine plankton (Sherr and Sherr 2002). Heterotrophic
nanoflagellates (HNF), mainly in the size range 3-5 µm, are specialized bacterivores and
adapted to thrive on suspended planktonic bacteria (Fenchel 1986).
Despite differences in dominating copepod species, different temperatures and nutrient
concentrations between the experiments (Tab. 1), a similar, general pattern in the
development of the microbial components became visible after about one week of incubation
which clearly revealed a community-wide cascade across three trophic levels (Fig. 1, Tab.1).
Microciliates were reduced 2- to 6-fold in freshwater and 10- to 1055-fold in the marine
experiments (comparing means of mesocosm replicates with lowest and highest copepod
densities after 1 week). In contrast, nanoplanktonic organisms increased significantly with
increasing copepod biomass in all experiments. The increase in HNF was quite variable (2–
35-fold increase) as well and particularly pronounced in the marine experiments in spring.
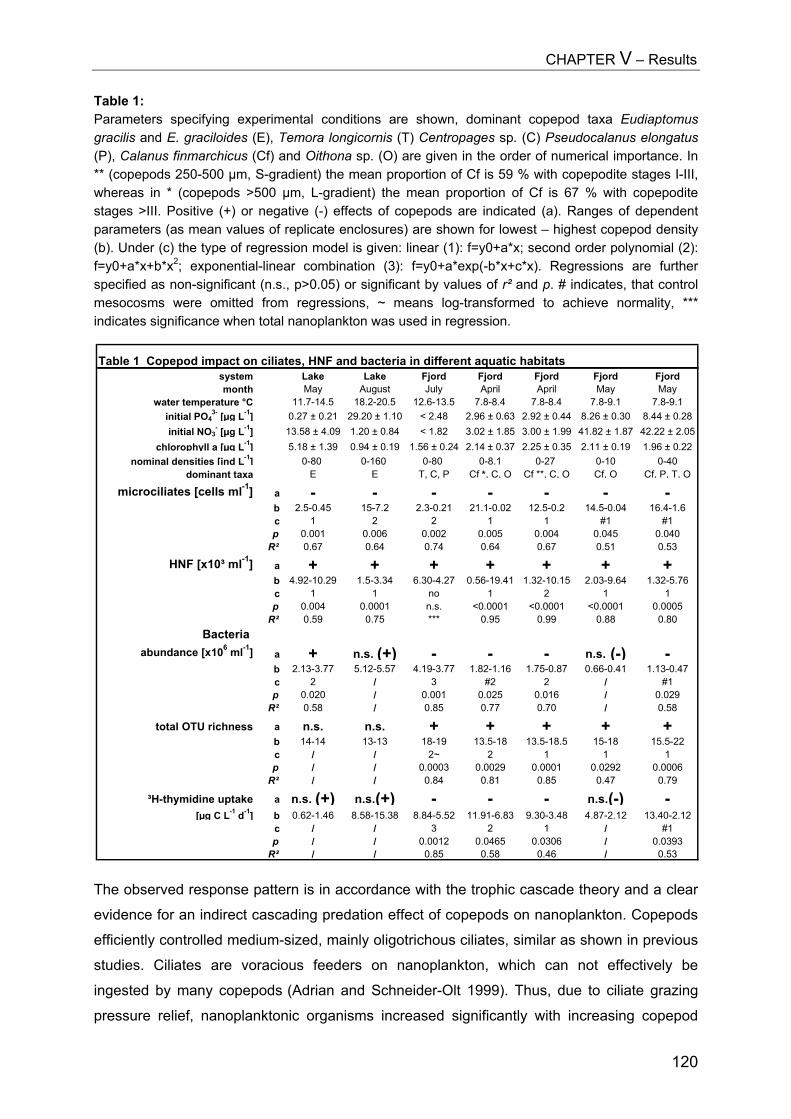
CHAPTER V – Results
120
Table 1:Parameters specifying experimental conditions are shown, dominant copepod taxa Eudiaptomusgracilis and E. graciloides (E), Temora longicornis (T) Centropages sp. (C) Pseudocalanus elongatus(P), Calanus finmarchicus (Cf) and Oithona sp. (O) are given in the order of numerical importance. In** (copepods 250-500 µm, S-gradient) the mean proportion of Cf is 59 % with copepodite stages I-III,whereas in * (copepods >500 µm, L-gradient) the mean proportion of Cf is 67 % with copepoditestages >III. Positive (+) or negative (-) effects of copepods are indicated (a). Ranges of dependentparameters (as mean values of replicate enclosures) are shown for lowest – highest copepod density(b). Under (c) the type of regression model is given: linear (1): f=y0+a*x; second order polynomial (2):f=y0+a*x+b*x2; exponential-linear combination (3): f=y0+a*exp(-b*x+c*x). Regressions are furtherspecified as non-significant (n.s., p>0.05) or significant by values of r² and p. # indicates, that controlmesocosms were omitted from regressions, ~ means log-transformed to achieve normality, ***indicates significance when total nanoplankton was used in regression.
The observed response pattern is in accordance with the trophic cascade theory and a clear
evidence for an indirect cascading predation effect of copepods on nanoplankton. Copepods
efficiently controlled medium-sized, mainly oligotrichous ciliates, similar as shown in previous
studies. Ciliates are voracious feeders on nanoplankton, which can not effectively be
ingested by many copepods (Adrian and Schneider-Olt 1999). Thus, due to ciliate grazing
pressure relief, nanoplanktonic organisms increased significantly with increasing copepod
Table 1 Copepod impact on ciliates, HNF and bacteria in different aquatic habitatssystem Lake Lake Fjord Fjord Fjord Fjord Fjordmonth May August July April April May May
water temperature °C 11.7-14.5 18.2-20.5 12.6-13.5 7.8-8.4 7.8-8.4 7.8-9.1 7.8-9.1initial PO4
3- [µg L-1] 0.27 ± 0.21 29.20 ± 1.10 < 2.48 2.96 ± 0.63 2.92 ± 0.44 8.26 ± 0.30 8.44 ± 0.28initial NO3
- [µg L-1] 13.58 ± 4.09 1.20 ± 0.84 < 1.82 3.02 ± 1.85 3.00 ± 1.99 41.82 ± 1.87 42.22 ± 2.05chlorophyll a [µg L-1] 5.18 ± 1.39 0.94 ± 0.19 1.56 ± 0.24 2.14 ± 0.37 2.25 ± 0.35 2.11 ± 0.19 1.96 ± 0.22
nominal densities [ind L-1] 0-80 0-160 0-80 0-8.1 0-27 0-10 0-40dominant taxa E E T, C, P Cf *, C, O Cf **, C, O Cf, O Cf, P, T, O
microciliates [cells ml-1] a - - - - - - -b 2.5-0.45 15-7.2 2.3-0.21 21.1-0.02 12.5-0.2 14.5-0.04 16.4-1.6c 1 2 2 1 1 #1 #1p 0.001 0.006 0.002 0.005 0.004 0.045 0.040
R² 0.67 0.64 0.74 0.64 0.67 0.51 0.53
HNF [x10³ ml-1] a + + + + + + +b 4.92-10.29 1.5-3.34 6.30-4.27 0.56-19.41 1.32-10.15 2.03-9.64 1.32-5.76c 1 1 no 1 2 1 1p 0.004 0.0001 n.s. <0.0001 <0.0001 <0.0001 0.0005
R² 0.59 0.75 *** 0.95 0.99 0.88 0.80Bacteria
abundance [x106 ml-1] a + n.s. (+) - - - n.s. (-) -b 2.13-3.77 5.12-5.57 4.19-3.77 1.82-1.16 1.75-0.87 0.66-0.41 1.13-0.47c 2 / 3 #2 2 / #1p 0.020 / 0.001 0.025 0.016 / 0.029
R² 0.58 / 0.85 0.77 0.70 / 0.58
total OTU richness a n.s. n.s. + + + + +b 14-14 13-13 18-19 13.5-18 13.5-18.5 15-18 15.5-22c / / 2~ 2 1 1 1p / / 0.0003 0.0029 0.0001 0.0292 0.0006
R² / / 0.84 0.81 0.85 0.47 0.79
³H-thymidine uptake a n.s. (+) n.s.(+) - - - n.s.(-) -[µg C L-1 d-1] b 0.62-1.46 8.58-15.38 8.84-5.52 11.91-6.83 9.30-3.48 4.87-2.12 13.40-2.12
c / / 3 2 1 / #1p / / 0.0012 0.0465 0.0306 / 0.0393
R² / / 0.85 0.58 0.46 / 0.53
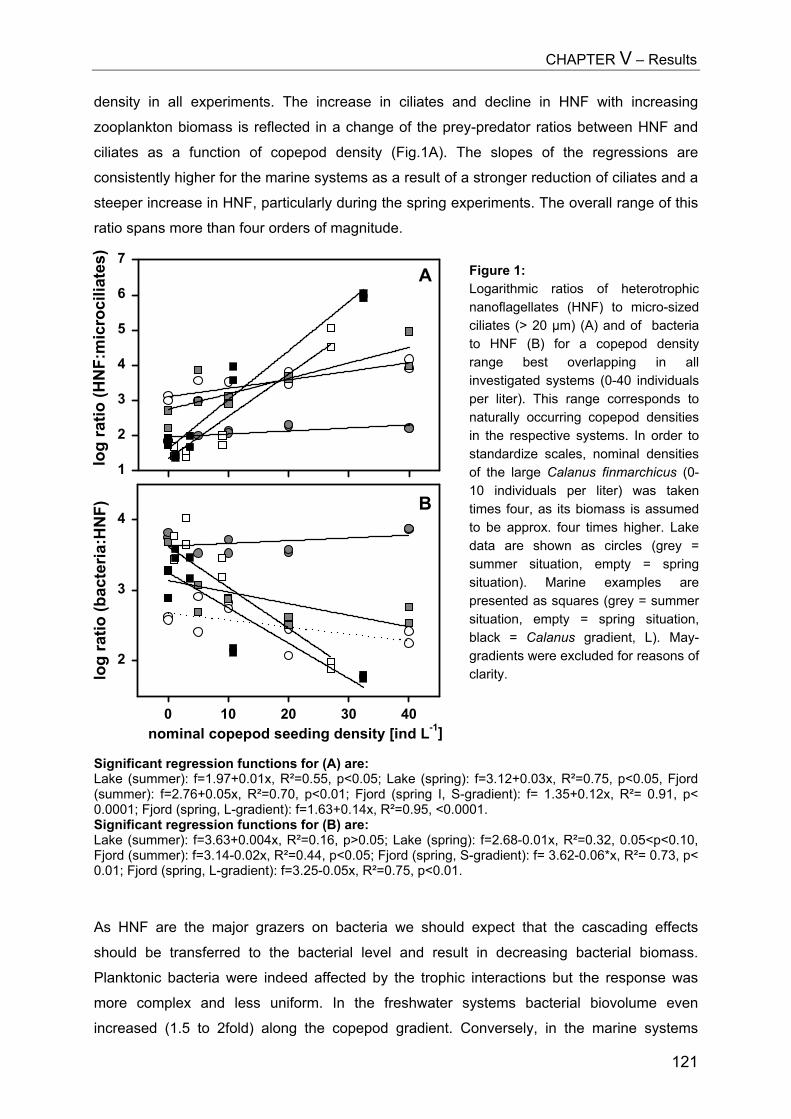
CHAPTER V – Results
density in all experiments. The increase in ciliates and decline in HNF with increasing
zooplankton biomass is reflected in a change of the prey-predator ratios between HNF and
ciliates as a function of copepod density (Fig.1A). The slopes of the regressions are
consistently higher for the marine systems as a result of a stronger reduction of ciliates and a
steeper increase in HNF, particularly during the spring experiments. The overall range of this
ratio spans more than four orders of magnitude.
Significant regression functions for (A) are: Lake (summer): f=1.97+0.01x, R²=0.55, p<0.05; Lake (spring(summer): f=2.76+0.05x, R²=0.70, p<0.01; Fjord (spring I, S-0.0001; Fjord (spring, L-gradient): f=1.63+0.14x, R²=0.95, <0.0Significant regression functions for (B) are: Lake (summer): f=3.63+0.004x, R²=0.16, p>0.05; Lake (springFjord (summer): f=3.14-0.02x, R²=0.44, p<0.05; Fjord (spring, S0.01; Fjord (spring, L-gradient): f=3.25-0.05x, R²=0.75, p<0.01.
As HNF are the major grazers on bacteria we should
should be transferred to the bacterial level and resu
Planktonic bacteria were indeed affected by the trophic
more complex and less uniform. In the freshwater
increased (1.5 to 2fold) along the copepod gradient.
log
ratio
(HN
F:m
icro
cilia
tes)
1
2
3
4
5
6
7
nominal copepod seeding density [ind L-1]0 10 20 30 40
log
ratio
(bac
teria
:HN
F)
2
3
4
A
B
Figure 1:Logarithmic ratios of heterotrophicnanoflagellates (HNF) to micro-sizedciliates (> 20 µm) (A) and of bacteriato HNF (B) for a copepod densityrange best overlapping in allinvestigated systems (0-40 individualsper liter). This range corresponds tonaturally occurring copepod densitiesin the respective systems. In order tostandardize scales, nominal densitiesof the large Calanus finmarchicus (0-10 individuals per liter) was takentimes four, as its biomass is assumedto be approx. four times higher. Lakedata are shown as circles (grey =summer situation, empty = springsituation). Marine examples arepresented as squares (grey = summersituation, empty = spring situation,black = Calanus gradient, L). May-gradients were excluded for reasons ofclarity.
121
): f=3.12+0.03x, R²=0.75, p<0.05, Fjordgradient): f= 1.35+0.12x, R²= 0.91, p<001.
): f=2.68-0.01x, R²=0.32, 0.05<p<0.10,-gradient): f= 3.62-0.06*x, R²= 0.73, p<
expect that the cascading effects
lt in decreasing bacterial biomass.
interactions but the response was
systems bacterial biovolume even
Conversely, in the marine systems

CHAPTER V – Results
122
bacterial biomass did either not change (summer experiment) or decrease (spring
experiments; 1.6 to 2.4fold) with increasing copepod density, thus indicating an even 4-link
trophic cascade in spring. However, due to the strongly increasing HNF numbers, the prey-
predator ratios between bacteria and HNF were significantly decreasing along the copepod
gradient for the marine experiments whereas they remain rather constant for the lake
experiments (Fig. 1B). Due to the dampened response of bacterioplankton the overall range
of the values is much more narrow than for the HNF:microciliate ratio.
Changes in mesozooplankton abundance not only affected the numerical response of protists
and bacteria but impacted also qualitative features of the bacterial assemblage. Bacterial
production as well as bacterial taxa richness consistently changed as a function of copepod
density but the effects again differed in the freshwater and the marine mesocosms (Tab.1):
While in the lake increasing copepod densities caused a stimulation of bacterial production
after 1 week, copepods negatively effected on bacterial uptake rates in the marine systems
according to the reduction of bacterial numbers. OTU richness rather increased in the marine
assemblages (all OTUs as well as sequenced bacterial OTUs, see Chapter IV) and showed
no significant response in the freshwater communities.
CHAPTER V – Discussion
123
DISCUSSION
The uniform pattern in the response of ciliates and HNF to increasing copepod predation
suggests that the link between copepods, ciliates and HNF is a true community-level 3-link
trophic cascade, common to marine and freshwater pelagic systems (Fig. 2).
Although there is emerging evidence that inter- and intraspecific variation in bacterivorous
and herbivorous protists in terms of feeding strategies and differential digestion can be a
significant factor for the analysis of food webs and trophic interactions (Weisse 2002), the
present study revealed trophic cascades even at the community level. Underlying reasons for
such a clear cascade are size-structured predator-prey interactions between meso-, micro-
and nanoplankton, a rather simple heterotrophic food chain with functionally different trophic
levels, a homogenous habitat and the fact that both ciliates and flagellates are relatively
uniformly edible for their predators. Only few protist species have evolved efficient escape or
resistance mechanisms (Wiackowski et al. 1994).
Copepods
FishMacrozooplankton
Ciliates4/4
HNF(AMNF)
4/4
BacteriaAbundance
Biovolume
Production
Richness
2/2
2/2
2/2 4/4
4/4
4/4
4/4
2/2
2/2
2/2
freshwater marine Figure 2:Conceptual scheme of thecopepod mediated trophiccascade: the observed responses(positive/negative) are indicatedby arrows in independent marine(4) and freshwater (2) copepodgradients (after 1 week). Numbersindicate in how many of the 2-4gradients positive or negativeresults were obtained.
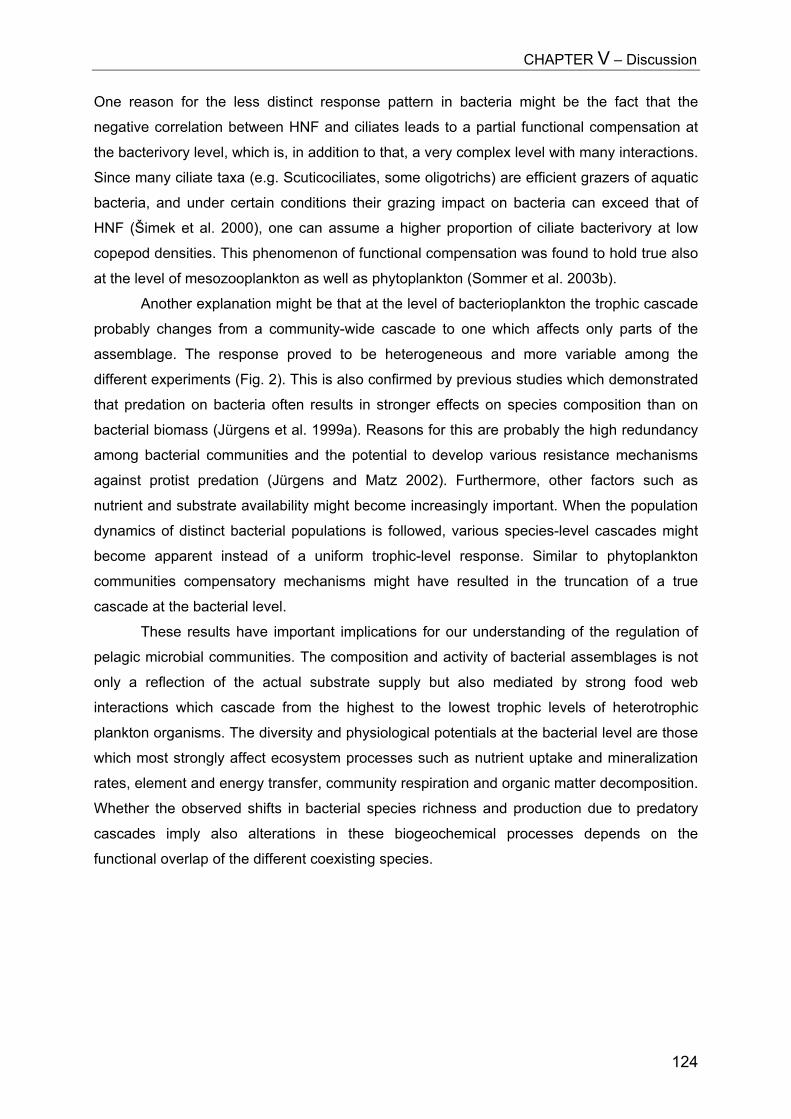
CHAPTER V – Discussion
124
One reason for the less distinct response pattern in bacteria might be the fact that the
negative correlation between HNF and ciliates leads to a partial functional compensation at
the bacterivory level, which is, in addition to that, a very complex level with many interactions.
Since many ciliate taxa (e.g. Scuticociliates, some oligotrichs) are efficient grazers of aquatic
bacteria, and under certain conditions their grazing impact on bacteria can exceed that of
HNF (Šimek et al. 2000), one can assume a higher proportion of ciliate bacterivory at low
copepod densities. This phenomenon of functional compensation was found to hold true also
at the level of mesozooplankton as well as phytoplankton (Sommer et al. 2003b).
Another explanation might be that at the level of bacterioplankton the trophic cascade
probably changes from a community-wide cascade to one which affects only parts of the
assemblage. The response proved to be heterogeneous and more variable among the
different experiments (Fig. 2). This is also confirmed by previous studies which demonstrated
that predation on bacteria often results in stronger effects on species composition than on
bacterial biomass (Jürgens et al. 1999a). Reasons for this are probably the high redundancy
among bacterial communities and the potential to develop various resistance mechanisms
against protist predation (Jürgens and Matz 2002). Furthermore, other factors such as
nutrient and substrate availability might become increasingly important. When the population
dynamics of distinct bacterial populations is followed, various species-level cascades might
become apparent instead of a uniform trophic-level response. Similar to phytoplankton
communities compensatory mechanisms might have resulted in the truncation of a true
cascade at the bacterial level.
These results have important implications for our understanding of the regulation of
pelagic microbial communities. The composition and activity of bacterial assemblages is not
only a reflection of the actual substrate supply but also mediated by strong food web
interactions which cascade from the highest to the lowest trophic levels of heterotrophic
plankton organisms. The diversity and physiological potentials at the bacterial level are those
which most strongly affect ecosystem processes such as nutrient uptake and mineralization
rates, element and energy transfer, community respiration and organic matter decomposition.
Whether the observed shifts in bacterial species richness and production due to predatory
cascades imply also alterations in these biogeochemical processes depends on the
functional overlap of the different coexisting species.

125
Sum
mar
y&
Zusa
mm
enfa
ssun
g
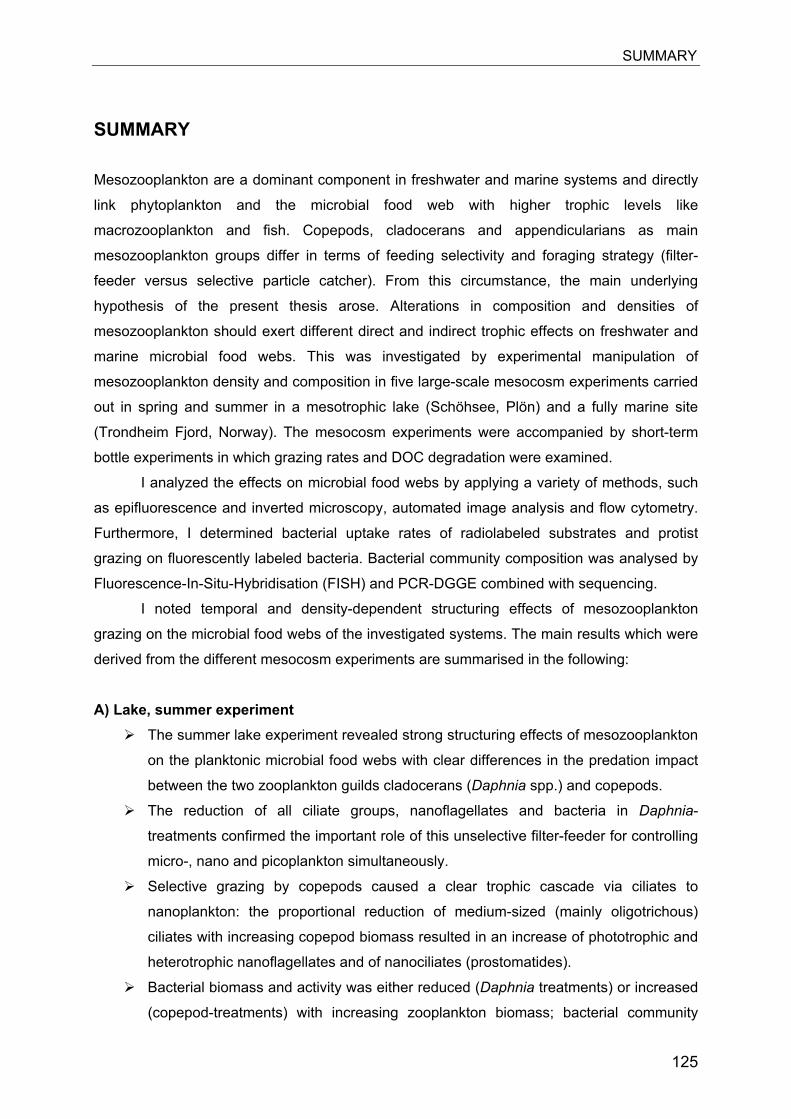
SUMMARY
125
SUMMARY
Mesozooplankton are a dominant component in freshwater and marine systems and directly
link phytoplankton and the microbial food web with higher trophic levels like
macrozooplankton and fish. Copepods, cladocerans and appendicularians as main
mesozooplankton groups differ in terms of feeding selectivity and foraging strategy (filter-
feeder versus selective particle catcher). From this circumstance, the main underlying
hypothesis of the present thesis arose. Alterations in composition and densities of
mesozooplankton should exert different direct and indirect trophic effects on freshwater and
marine microbial food webs. This was investigated by experimental manipulation of
mesozooplankton density and composition in five large-scale mesocosm experiments carried
out in spring and summer in a mesotrophic lake (Schöhsee, Plön) and a fully marine site
(Trondheim Fjord, Norway). The mesocosm experiments were accompanied by short-term
bottle experiments in which grazing rates and DOC degradation were examined.
I analyzed the effects on microbial food webs by applying a variety of methods, such
as epifluorescence and inverted microscopy, automated image analysis and flow cytometry.
Furthermore, I determined bacterial uptake rates of radiolabeled substrates and protist
grazing on fluorescently labeled bacteria. Bacterial community composition was analysed by
Fluorescence-In-Situ-Hybridisation (FISH) and PCR-DGGE combined with sequencing.
I noted temporal and density-dependent structuring effects of mesozooplankton
grazing on the microbial food webs of the investigated systems. The main results which were
derived from the different mesocosm experiments are summarised in the following:
A) Lake, summer experiment The summer lake experiment revealed strong structuring effects of mesozooplankton
on the planktonic microbial food webs with clear differences in the predation impact
between the two zooplankton guilds cladocerans (Daphnia spp.) and copepods.
The reduction of all ciliate groups, nanoflagellates and bacteria in Daphnia-
treatments confirmed the important role of this unselective filter-feeder for controlling
micro-, nano and picoplankton simultaneously.
Selective grazing by copepods caused a clear trophic cascade via ciliates to
nanoplankton: the proportional reduction of medium-sized (mainly oligotrichous)
ciliates with increasing copepod biomass resulted in an increase of phototrophic and
heterotrophic nanoflagellates and of nanociliates (prostomatides).
Bacterial biomass and activity was either reduced (Daphnia treatments) or increased
(copepod-treatments) with increasing zooplankton biomass; bacterial community
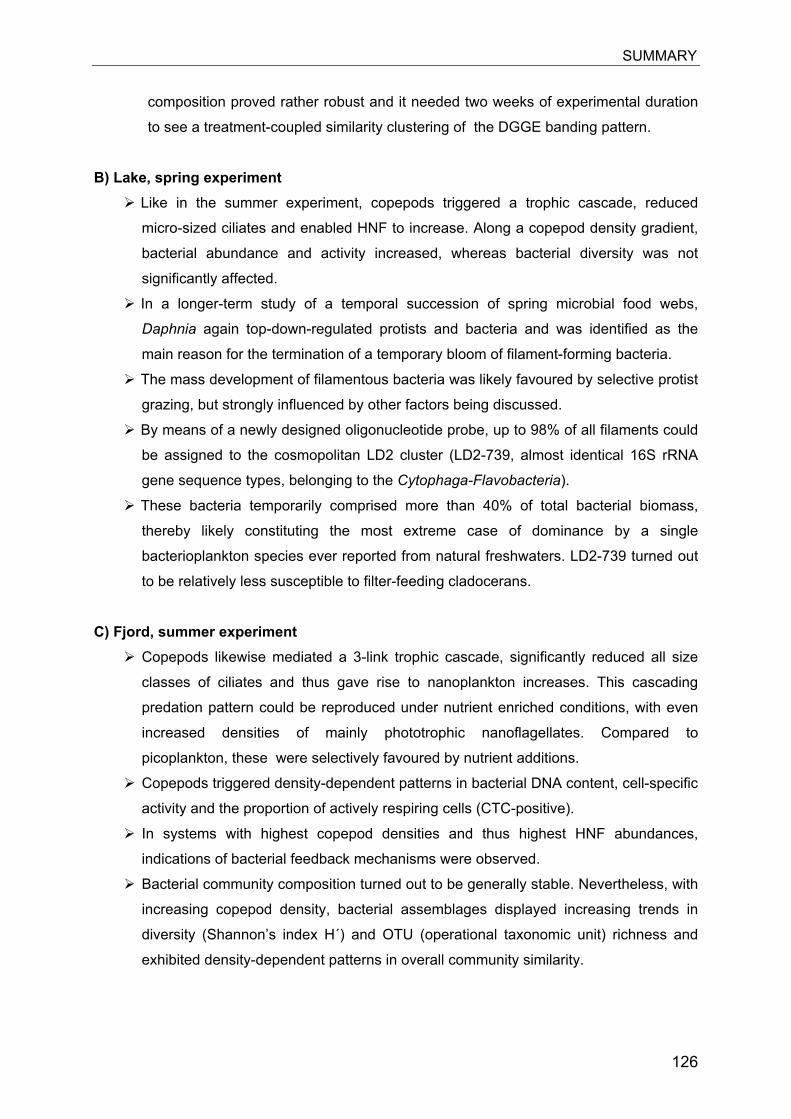
SUMMARY
126
composition proved rather robust and it needed two weeks of experimental duration
to see a treatment-coupled similarity clustering of the DGGE banding pattern.
B) Lake, spring experiment Like in the summer experiment, copepods triggered a trophic cascade, reduced
micro-sized ciliates and enabled HNF to increase. Along a copepod density gradient,
bacterial abundance and activity increased, whereas bacterial diversity was not
significantly affected.
In a longer-term study of a temporal succession of spring microbial food webs,
Daphnia again top-down-regulated protists and bacteria and was identified as the
main reason for the termination of a temporary bloom of filament-forming bacteria.
The mass development of filamentous bacteria was likely favoured by selective protist
grazing, but strongly influenced by other factors being discussed.
By means of a newly designed oligonucleotide probe, up to 98% of all filaments could
be assigned to the cosmopolitan LD2 cluster (LD2-739, almost identical 16S rRNA
gene sequence types, belonging to the Cytophaga-Flavobacteria).
These bacteria temporarily comprised more than 40% of total bacterial biomass,
thereby likely constituting the most extreme case of dominance by a single
bacterioplankton species ever reported from natural freshwaters. LD2-739 turned out
to be relatively less susceptible to filter-feeding cladocerans.
C) Fjord, summer experiment Copepods likewise mediated a 3-link trophic cascade, significantly reduced all size
classes of ciliates and thus gave rise to nanoplankton increases. This cascading
predation pattern could be reproduced under nutrient enriched conditions, with even
increased densities of mainly phototrophic nanoflagellates. Compared to
picoplankton, these were selectively favoured by nutrient additions.
Copepods triggered density-dependent patterns in bacterial DNA content, cell-specific
activity and the proportion of actively respiring cells (CTC-positive).
In systems with highest copepod densities and thus highest HNF abundances,
indications of bacterial feedback mechanisms were observed.
Bacterial community composition turned out to be generally stable. Nevertheless, with
increasing copepod density, bacterial assemblages displayed increasing trends in
diversity (Shannon’s index H´) and OTU (operational taxonomic unit) richness and
exhibited density-dependent patterns in overall community similarity.
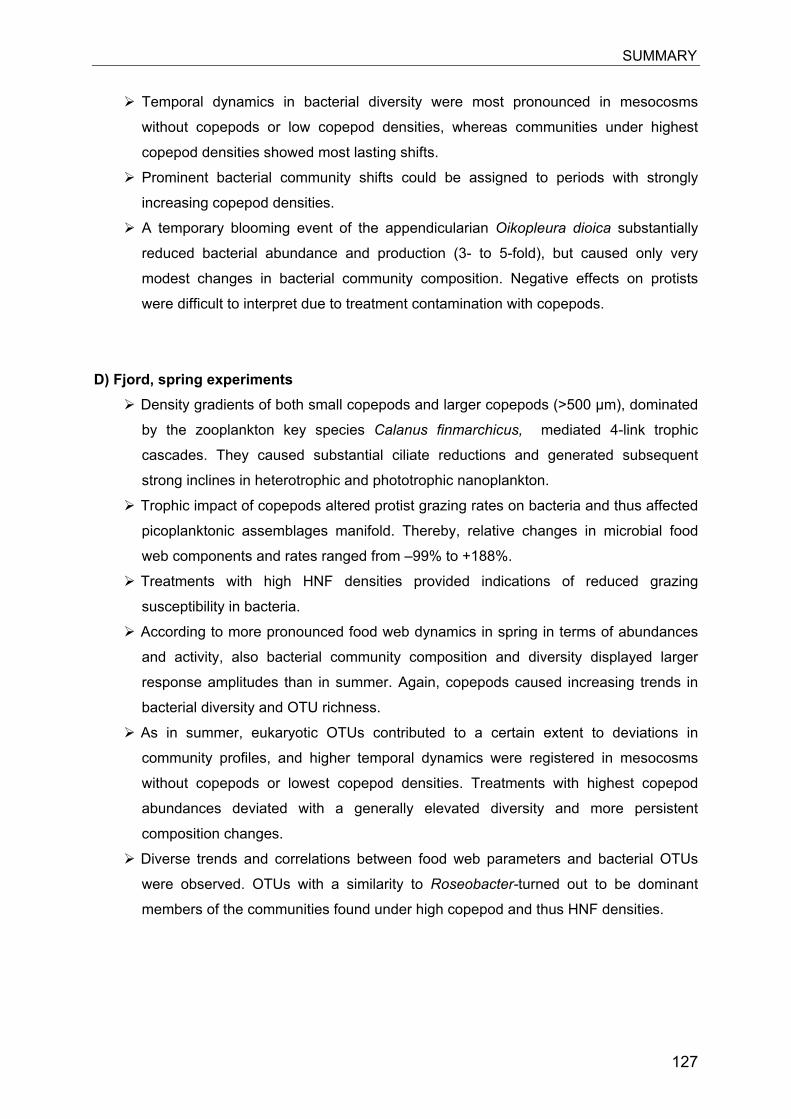
SUMMARY
127
Temporal dynamics in bacterial diversity were most pronounced in mesocosms
without copepods or low copepod densities, whereas communities under highest
copepod densities showed most lasting shifts.
Prominent bacterial community shifts could be assigned to periods with strongly
increasing copepod densities.
A temporary blooming event of the appendicularian Oikopleura dioica substantially
reduced bacterial abundance and production (3- to 5-fold), but caused only very
modest changes in bacterial community composition. Negative effects on protists
were difficult to interpret due to treatment contamination with copepods.
D) Fjord, spring experiments Density gradients of both small copepods and larger copepods (>500 µm), dominated
by the zooplankton key species Calanus finmarchicus, mediated 4-link trophic
cascades. They caused substantial ciliate reductions and generated subsequent
strong inclines in heterotrophic and phototrophic nanoplankton.
Trophic impact of copepods altered protist grazing rates on bacteria and thus affected
picoplanktonic assemblages manifold. Thereby, relative changes in microbial food
web components and rates ranged from –99% to +188%.
Treatments with high HNF densities provided indications of reduced grazing
susceptibility in bacteria.
According to more pronounced food web dynamics in spring in terms of abundances
and activity, also bacterial community composition and diversity displayed larger
response amplitudes than in summer. Again, copepods caused increasing trends in
bacterial diversity and OTU richness.
As in summer, eukaryotic OTUs contributed to a certain extent to deviations in
community profiles, and higher temporal dynamics were registered in mesocosms
without copepods or lowest copepod densities. Treatments with highest copepod
abundances deviated with a generally elevated diversity and more persistent
composition changes.
Diverse trends and correlations between food web parameters and bacterial OTUs
were observed. OTUs with a similarity to Roseobacter-turned out to be dominant
members of the communities found under high copepod and thus HNF densities.
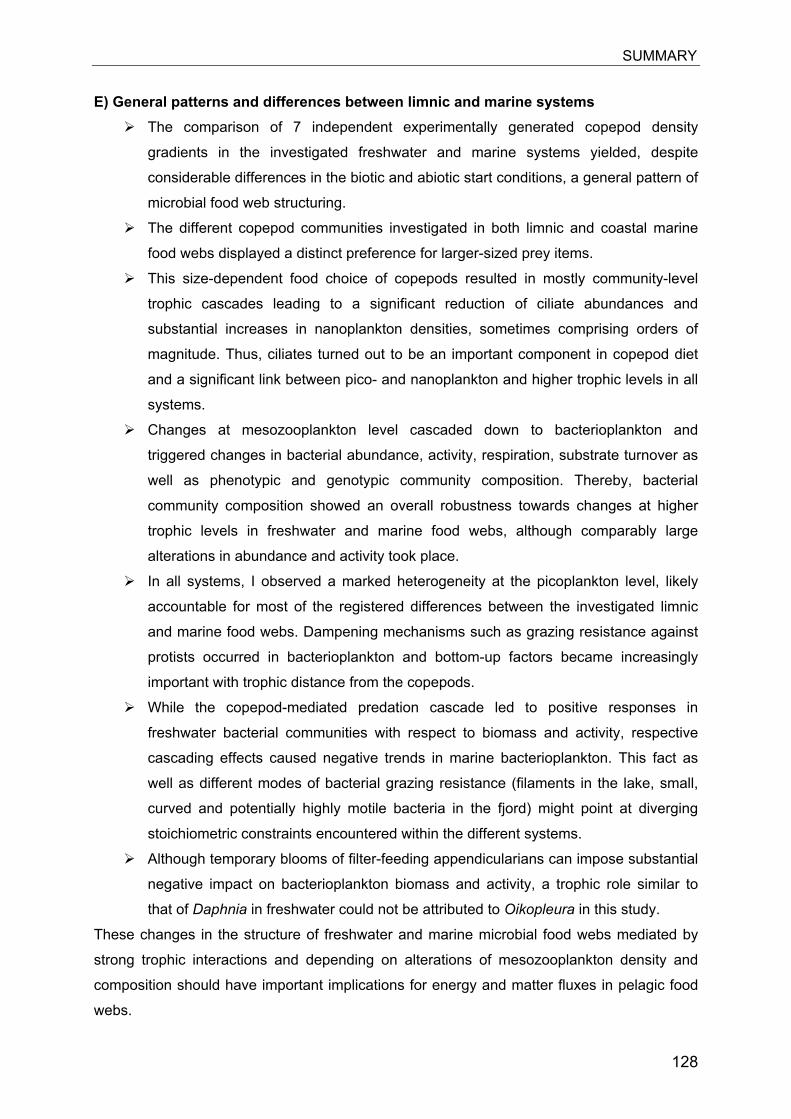
SUMMARY
128
E) General patterns and differences between limnic and marine systems The comparison of 7 independent experimentally generated copepod density
gradients in the investigated freshwater and marine systems yielded, despite
considerable differences in the biotic and abiotic start conditions, a general pattern of
microbial food web structuring.
The different copepod communities investigated in both limnic and coastal marine
food webs displayed a distinct preference for larger-sized prey items.
This size-dependent food choice of copepods resulted in mostly community-level
trophic cascades leading to a significant reduction of ciliate abundances and
substantial increases in nanoplankton densities, sometimes comprising orders of
magnitude. Thus, ciliates turned out to be an important component in copepod diet
and a significant link between pico- and nanoplankton and higher trophic levels in all
systems.
Changes at mesozooplankton level cascaded down to bacterioplankton and
triggered changes in bacterial abundance, activity, respiration, substrate turnover as
well as phenotypic and genotypic community composition. Thereby, bacterial
community composition showed an overall robustness towards changes at higher
trophic levels in freshwater and marine food webs, although comparably large
alterations in abundance and activity took place.
In all systems, I observed a marked heterogeneity at the picoplankton level, likely
accountable for most of the registered differences between the investigated limnic
and marine food webs. Dampening mechanisms such as grazing resistance against
protists occurred in bacterioplankton and bottom-up factors became increasingly
important with trophic distance from the copepods.
While the copepod-mediated predation cascade led to positive responses in
freshwater bacterial communities with respect to biomass and activity, respective
cascading effects caused negative trends in marine bacterioplankton. This fact as
well as different modes of bacterial grazing resistance (filaments in the lake, small,
curved and potentially highly motile bacteria in the fjord) might point at diverging
stoichiometric constraints encountered within the different systems.
Although temporary blooms of filter-feeding appendicularians can impose substantial
negative impact on bacterioplankton biomass and activity, a trophic role similar to
that of Daphnia in freshwater could not be attributed to Oikopleura in this study.
These changes in the structure of freshwater and marine microbial food webs mediated by
strong trophic interactions and depending on alterations of mesozooplankton density and
composition should have important implications for energy and matter fluxes in pelagic food
webs.
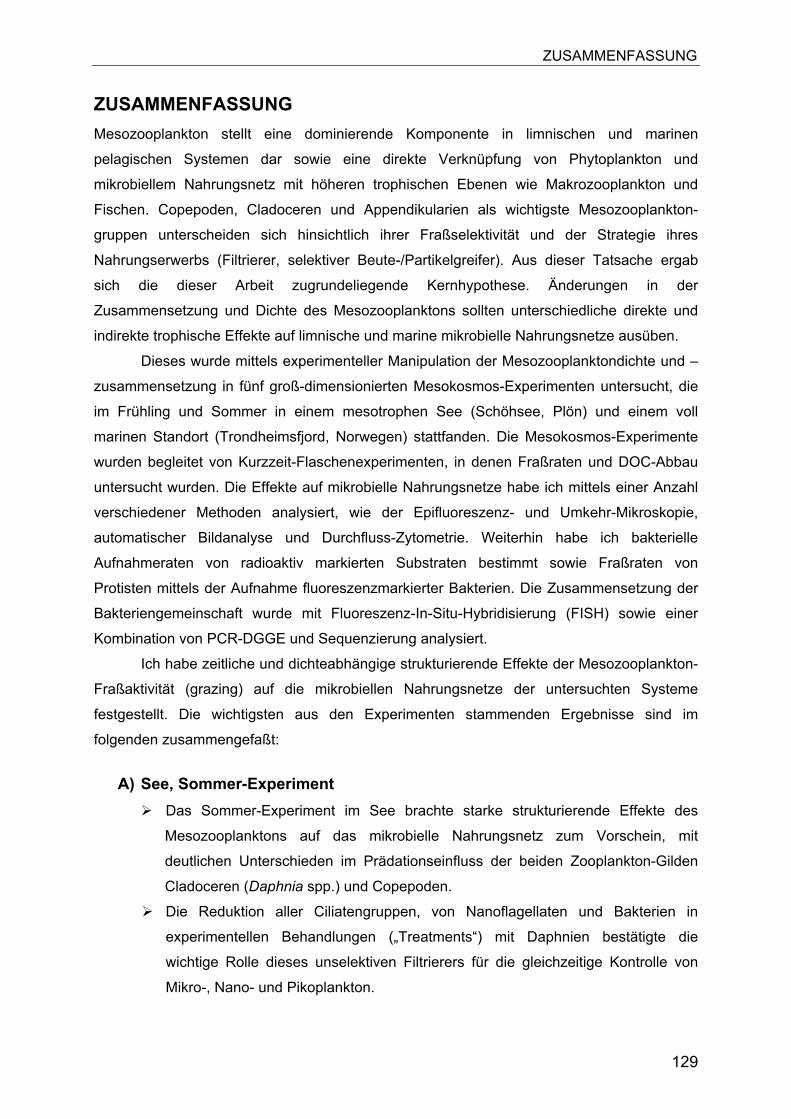
ZUSAMMENFASSUNG
129
ZUSAMMENFASSUNGMesozooplankton stellt eine dominierende Komponente in limnischen und marinen
pelagischen Systemen dar sowie eine direkte Verknüpfung von Phytoplankton und
mikrobiellem Nahrungsnetz mit höheren trophischen Ebenen wie Makrozooplankton und
Fischen. Copepoden, Cladoceren und Appendikularien als wichtigste Mesozooplankton-
gruppen unterscheiden sich hinsichtlich ihrer Fraßselektivität und der Strategie ihres
Nahrungserwerbs (Filtrierer, selektiver Beute-/Partikelgreifer). Aus dieser Tatsache ergab
sich die dieser Arbeit zugrundeliegende Kernhypothese. Änderungen in der
Zusammensetzung und Dichte des Mesozooplanktons sollten unterschiedliche direkte und
indirekte trophische Effekte auf limnische und marine mikrobielle Nahrungsnetze ausüben.
Dieses wurde mittels experimenteller Manipulation der Mesozooplanktondichte und –
zusammensetzung in fünf groß-dimensionierten Mesokosmos-Experimenten untersucht, die
im Frühling und Sommer in einem mesotrophen See (Schöhsee, Plön) und einem voll
marinen Standort (Trondheimsfjord, Norwegen) stattfanden. Die Mesokosmos-Experimente
wurden begleitet von Kurzzeit-Flaschenexperimenten, in denen Fraßraten und DOC-Abbau
untersucht wurden. Die Effekte auf mikrobielle Nahrungsnetze habe ich mittels einer Anzahl
verschiedener Methoden analysiert, wie der Epifluoreszenz- und Umkehr-Mikroskopie,
automatischer Bildanalyse und Durchfluss-Zytometrie. Weiterhin habe ich bakterielle
Aufnahmeraten von radioaktiv markierten Substraten bestimmt sowie Fraßraten von
Protisten mittels der Aufnahme fluoreszenzmarkierter Bakterien. Die Zusammensetzung der
Bakteriengemeinschaft wurde mit Fluoreszenz-In-Situ-Hybridisierung (FISH) sowie einer
Kombination von PCR-DGGE und Sequenzierung analysiert.
Ich habe zeitliche und dichteabhängige strukturierende Effekte der Mesozooplankton-
Fraßaktivität (grazing) auf die mikrobiellen Nahrungsnetze der untersuchten Systeme
festgestellt. Die wichtigsten aus den Experimenten stammenden Ergebnisse sind im
folgenden zusammengefaßt:
A) See, Sommer-Experiment Das Sommer-Experiment im See brachte starke strukturierende Effekte des
Mesozooplanktons auf das mikrobielle Nahrungsnetz zum Vorschein, mit
deutlichen Unterschieden im Prädationseinfluss der beiden Zooplankton-Gilden
Cladoceren (Daphnia spp.) und Copepoden.
Die Reduktion aller Ciliatengruppen, von Nanoflagellaten und Bakterien in
experimentellen Behandlungen („Treatments“) mit Daphnien bestätigte die
wichtige Rolle dieses unselektiven Filtrierers für die gleichzeitige Kontrolle von
Mikro-, Nano- und Pikoplankton.

ZUSAMMENFASSUNG
130
Selektiver Fraß der Copepoden verursachte eine deutliche trophische Kaskade
über Ciliaten zum Nanoplankton: die entsprechende Reduktion mittelgroßer
(hauptsächlich oligotricher) Ciliaten mit zunehmender Copepodenbiomasse
resultierte in einem Anstieg von phototrophen und heterotrophen Nanoflagellaten
sowie von Nanociliaten (Prostomatiden).
Die bakterielle Biomasse wurde mit ansteigender Zooplankton-Biomasse
entweder reduziert (Daphnien-Treatments) oder nahm zu (Copepoden-
Treatments); die Zusammensetzung der Bakteriengemeinschaft erwies sich als
eher robust and benötigte eine Experiment-Dauer von zwei Wochen, um eine der
experimentellen Behandlung entsprechende Ähnlichkeitsgruppierung des DGGE-
Bandenmusters erkennen zu lassen.
B) See, Frühjahrs-Experiment Wie im Sommer-Experiment, lösten die Copepoden ein trophische Kaskade aus,
reduzierten Mikro-Ciliaten und ermöglichten es HNF zuzunehmen. Entlang des
Copepoden-Dichtegradienten stiegen Bakterienabundanz und –aktivität an,
wogegen die Bakteriendiversität nicht signifikant beeinflusst wurde.
In einer längerfristigen Studie zur Sukzession mikrobieller Nahrungsnetze im
Frühjahr, wurde eine top-down-Regulation von Protisten und Bakterien durch
Daphnien festgestellt und Daphnien als Hauptursache für die Beendigung einer
Blüte filamentbildender Bakterien ausgemacht.
Diese Massenentwicklung filamentöser Bakterien wurde wahrscheinlich
begünstigt durch selektiven Protozoenfraß, aber auch stark beeinflußt durch
andere hier diskutierte Faktoren.
Mit Hilfe einer neuentwickelten Oligonukleotidsonde konnten bis zu 98% dem
kosmopolitisch verbreiteten LD2-Cluster zugeordnet werden (LD2-739, fast
identische Typen von 16S rRNA Gensequenzen, zu Cytophaga-Flavobacteria
gehörend).
Diese Bakterien stellten zeitweise mehr als 40% der gesamten
Bakterienbiomasse und bildeten dabei wahrscheinlich den extremsten Fall von
Dominanz einer einzelnen Bakterienart, der jemals aus natürlichen
Süßwasserhabitaten berichtet wurde. LD2-739 erwies sich als weniger anfällig
gegenüber filtrierenden Cladoceren.
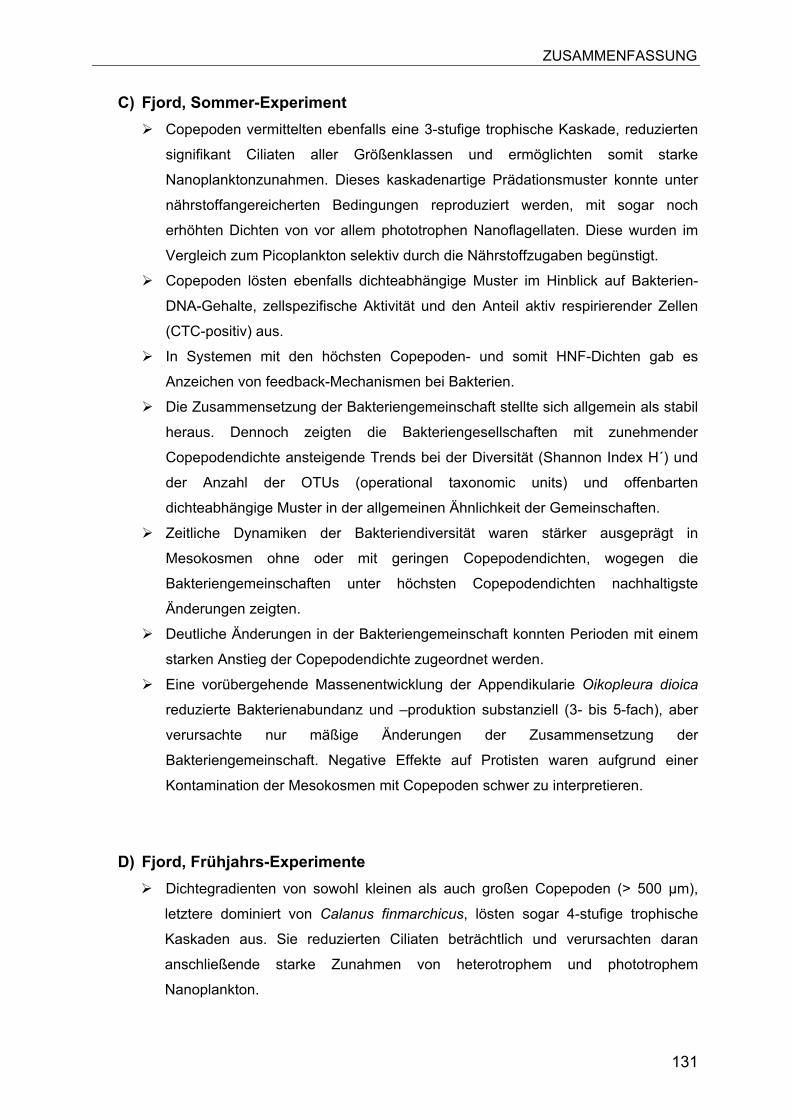
ZUSAMMENFASSUNG
131
C) Fjord, Sommer-Experiment Copepoden vermittelten ebenfalls eine 3-stufige trophische Kaskade, reduzierten
signifikant Ciliaten aller Größenklassen und ermöglichten somit starke
Nanoplanktonzunahmen. Dieses kaskadenartige Prädationsmuster konnte unter
nährstoffangereicherten Bedingungen reproduziert werden, mit sogar noch
erhöhten Dichten von vor allem phototrophen Nanoflagellaten. Diese wurden im
Vergleich zum Picoplankton selektiv durch die Nährstoffzugaben begünstigt.
Copepoden lösten ebenfalls dichteabhängige Muster im Hinblick auf Bakterien-
DNA-Gehalte, zellspezifische Aktivität und den Anteil aktiv respirierender Zellen
(CTC-positiv) aus.
In Systemen mit den höchsten Copepoden- und somit HNF-Dichten gab es
Anzeichen von feedback-Mechanismen bei Bakterien.
Die Zusammensetzung der Bakteriengemeinschaft stellte sich allgemein als stabil
heraus. Dennoch zeigten die Bakteriengesellschaften mit zunehmender
Copepodendichte ansteigende Trends bei der Diversität (Shannon Index H´) und
der Anzahl der OTUs (operational taxonomic units) und offenbarten
dichteabhängige Muster in der allgemeinen Ähnlichkeit der Gemeinschaften.
Zeitliche Dynamiken der Bakteriendiversität waren stärker ausgeprägt in
Mesokosmen ohne oder mit geringen Copepodendichten, wogegen die
Bakteriengemeinschaften unter höchsten Copepodendichten nachhaltigste
Änderungen zeigten.
Deutliche Änderungen in der Bakteriengemeinschaft konnten Perioden mit einem
starken Anstieg der Copepodendichte zugeordnet werden.
Eine vorübergehende Massenentwicklung der Appendikularie Oikopleura dioica
reduzierte Bakterienabundanz und –produktion substanziell (3- bis 5-fach), aber
verursachte nur mäßige Änderungen der Zusammensetzung der
Bakteriengemeinschaft. Negative Effekte auf Protisten waren aufgrund einer
Kontamination der Mesokosmen mit Copepoden schwer zu interpretieren.
D) Fjord, Frühjahrs-Experimente Dichtegradienten von sowohl kleinen als auch großen Copepoden (> 500 µm),
letztere dominiert von Calanus finmarchicus, lösten sogar 4-stufige trophische
Kaskaden aus. Sie reduzierten Ciliaten beträchtlich und verursachten daran
anschließende starke Zunahmen von heterotrophem und phototrophem
Nanoplankton.
ZUSAMMENFASSUNG
132
Der trophische Einfluß der Copepoden veränderte den Protozoen-Fraßdruck auf
Bakterien und beeinflusste so die Pikoplanktongemeinschaft auf vielfältige Weise.
Dabei variierten relative Veränderungen bei Komponenten und Raten innerhalb
des mikrobiellen Nahrungsnetzes zwischen –99% und +188%.
Treatments mit hohen HNF-Dichten lieferten Anzeichen von reduzierter
Fraßanfälligkeit bei Bakterien.
Entsprechend der im Hinblick auf Abundanz und Aktivität stärker ausgeprägten
Nahrungsnetz-Dynamik im Frühjahr, zeigte die Bakteriengemeinschaft auch
hinsichtlich ihrer Zusammensetzung eine größere Reaktionsamplitude als im
Sommer. Abermals verursachten die Copepoden ansteigende Trends bei
bakterieller Diversität und OTU-Anzahl.
Wie auch im Sommer trugen hier eukaryotische OTUs zu einem gewissen Grade
zu den Abweichungen in den Gemeinschaftsprofilen bei, und in Mesokosmen
ohne Copepoden oder mit geringer Copepodendichte wurde ebenfalls eine
stärkere zeitliche Dynamik registriert. Bakteriengemeinschaften in Treatments mit
höchster Copepodendichte wichen allgemein am stärksten ab, mit einer generell
erhöhten Diversität sowie nachhaltigeren Änderungen der Zusammensetzung.
Es wurden unterschiedliche Trends und Korrelationen zwischen
Nahrungsnetzparametern und Bakterien-OTUs beobachtet. OTUs, die dem Taxon
Roseobacter zugeordnet wurden, erwiesen sich als wichtige Mitglieder der
Bakteriengemeinschaften und hohen Copepoden- und damit auch HNF-Dichten.
E) Allgemeine Muster und Unterschiede zwischen limnischen und marinen Systemen Der Vergleich von 7 unabhängigen, experimentell erzeugten Copepoden-
Dichtegradienten in den untersuchten limnischen und marinen Systemen ergab, trotz
beachtlicher Unterschiede in den biotischen und abiotischen Startbedingungen, ein
allgemeines Muster der Strukturierung mikrobieller Nahrungsnetze.
Die in sowohl limnischen als auch küstennahen marinen Nahrungsnetzen
untersuchten unterschiedlichen Copepodengemeinschaften zeigten offensichtlich eine
deutliche Präferenz für größere Beute-Partikel.
Diese größenabhängige Nahrungswahl der Copepoden resultierte meist in einer die
gesamte Gemeinschaft umfassenden trophischen Kaskade, führte zu signifikanten
Reduktionen der Ciliatenabundanzen und substantiellen Zunahmen der
Nanoplanktondichten, die zum Teil mehrere Größenordnungen umfassten. Somit
erwiesen sich Ciliaten als wichtige Komponente im Nahrungsspektrum der Copepoden
und als bedeutendes Bindeglied zwischen Piko- und Nanoplankton und höhreren
trophischen Ebenen in allen Systemen.
ZUSAMMENFASSUNG
133
Änderungen auf der Ebene des Mesozooplanktons setzten sich bis auf die
Bakterienebene fort und bewirkten Veränderungen der Abundanz, Aktivität,
Respiration und Stoffumsetzung sowie der phänotypischen und genotypischen
Zusammensetzung. Dabei zeigte die Bakteriengemeinschaftszusammensetzung in
limnischen sowie marinen Nahrungsnetzen allerdings eine allgemeine Stabilität
gegenüber Änderungen innerhalb der höheren trophischen Ebenen, obwohl
vergleichsweise starke Veränderungen bei Abundanz und Aktivität stattfanden.
In allen Systemen konnte ich eine deutliche Heterogenität innerhalb des Pikoplanktons
beobachten, die wahrscheinlich für die meisten der festgestellten Unterschiede
zwischen den untersuchten limnischen und marinen Nahrungsnetzen verantwortlich
war. Abschwächende Mechanismen wie Fraßresistenz gegenüber Protozoen waren
innerhalb des Bakterioplanktons festzustellen, und bottom-up-Faktoren wurden
zunehmend wichtig mit trophischer Entfernung zu den Copepoden.
Während die Copepoden-vermittelte trophische Kaskade die Biomasse und Aktivität
der limnischen Bakteriengemeinschaft eher positiv beeinflusste, verursachten
entsprechende Kaskadeneffekte negative Trends im marinen Bakterioplankton. Diese
Tatsache sowie unterschiedliche Ausprägungsformen von (Protozoen-) Fraßresistenz
bei Bakterien (Filamente im See, kleine gebogene und möglicherweise stark
bewegliche Bakterien im Fjord) könnten auf die Relevanz voneinander abweichender
stöchiometrischer Einschränkungen in den verschiedenen Systemen hindeuten.
Obwohl vorübergehende Massenentwicklungen von filtrierenden Appendikularien
einen beträchtlichen negativen Einfluss auf Bakterienbiomasse und –aktivität ausüben
können, konnte Oikopleura anhand dieser Studie keine den Daphnien im limnischen
Pelagial entsprechende trophische Stellung zugeschrieben werden.
Diese Änderungen in der Struktur von limnischen und marinen mikrobiellen Nahrungsnetzen,
die durch starke trophische Interaktionen geprägt wurden und in Abhängigkeit von
Änderungen in Mesozooplanktondichte und –zusammensetzung stattfanden, sollten wichtige
Implikationen für Energie- und Stoffflüsse in pelagischen Nahrungsnetzen haben.
REFERENCES
134
REFERENCES
Acinas, S. G., Anton, J. and Rodriguez-Valera, F. (1999). Diversity of free-living and attachedbacteriain offshore western Mediterranean waters as depicted by analysis of genes encoding 16SrRNA. Applied & Environmental Microbiology 65 (2), 514-522
Acinas, S. G., Rodriguez-Valera, F. and Pedros-Alio, C. (1997). Spatial and temporal variation inmarine bacterioplankton diversity as shown by RFLP fingerprinting of PCR amplified 16S rDNA.FEMS Microbiology Ecology. 24 (1), 27-40
Acuña, J. L. (2001). Pelagic tunicates: Why gelatinous? American Naturalist 158 (1), 100-107Acuña, J. L. and Kiefer, M. (2000). Functional response of the appendicularian Oikopleura dioica.
Limnology and Oceanography 45 (3), 608-618Adrian, R. and Schneider-Olt, B. (1999). Top-down effects of crustacean zooplankton on pelagic
microorganisms in a mesotrophic lake. Journal of Plankton Research 21 (1), 1-16Adrian, R., Wickham, S. A. and Butler, N. M. (2001). Trophic interactions between zooplankton and the
microbial community in contrasting food webs: the epilimnion and deep chlorophyll maximum of amesotrophic lake. Aquatic Microbial Ecology 24 (1), 83-97
Alldredge, A. L. (1981). The Impact of Appendicularian Grazing on Natural Food Concentrations Insitu.Limnology and Oceanography 26 (2), 247-257
Amann, R. I., Ludwig, W. and Schleifer, K.-H. (1995). Phylogenetic identification and in situ detectionof individual microbial cells without cultivation. Microbiological Reviews 59 143-169
Arndt, H. (1993). Rotifers as predators on components of the microbial web (bacteria,heterotrophicflagellates, ciliates) - a review. Hydrobiologia 255/256 231-246
Arndt, H., Dietrich, D., Auer, B., Cleven, E.-J., Gräfenhahn, T., Weitere, M. and Mylnikov, A. P. (2000).Functional diversity of heterotrophic flagellates in aquatic ecosystems. In: Leadbeater, B.S.C. &Green, J.C.: The Flagellates: Unity, diversity and evolution (Systematics Association SpecialVolumes), pp. 239-268
Azam, F., Fenchel, T., Field, J. G., Gray, J. S., Meyer-Reil, L. A. and Thingstad, F. (1983). Theecological role of water column microbes in the sea. Marine Ecology Progress Series 10 257-263
Bathmann, U., Bundy, M. H., Clarke, M. E., Cowles, T. J., Daly, K., Dam, H. G., Dekshenieks, M. M.,Donaghay, P. L., Gibson, D. M., Gifford, D. J., Hansen, B. W., Hartline, D. K., Head, E. J. H.,Hofmann, E. E., Hopcroft, R. R., Jahnke, R. A., Jonasdottir, S. H., Kiorboe, T., Kleppel, G. S.,Klinck, J. M., Kremer, P. M., Landry, M. R., Lee, R. F., Lenz, P. H., Madin, L. P., Paffenhofer, G. A.and et al. (2001). Future marine zooplankton research - a perspective. Marine Ecology ProgressSeries 222 297-308
Beardsley, C., Pernthaler, J., Wosniok, W. and Amann, R. (2003). Are readily culturable bacteria incoastal North Sea waters suppressed by selective grazing mortality? Applied and EnvironmentalMicrobiology 69 (5), 2624-2630
Bell, R. T. (1993). Estimating Production of Heterotrophic Bacterioplankton via Incorporation ofTritiatedThymidine. In: Handbook of Methods in Aquatic Microbial Ecology (Eds P.F.Kemp, B.F. Sherr,E.B. Sherr & J.J Cole), Lewis Publishers, Boca Raton, FL 495-503
Bettarel, Y., Amblard, C., Sime-Ngando, T., Carrias, J. F., Sargos, D., Garabetian, F. and Lavandier,P. (2003). Viral lysis, flagellate grazing potential, and bacterial production in Lake Pavin. MicrobialEcology 45 (2), 119-127
Bettarel, Y., Dolan, J. R., Hornak, K., Lemee, R., Masin, M., Pedrotti, M. L., Rochelle-Newall, E.,Simek, K. and Sime-Ngando, T. (2002). Strong, weak, and missing links in a microbial communityof the NW Mediterranean Sea. Fems Microbiology Ecology 42 (3), 451-462
Beutler, M., Wiltshire, K. H., Meyer, B., Moldaenke, C., Luring, C., Meyerhofer, M., Hansen, U. P. andDau, H. (2002). A fluorometric method for the differentiation of algal populations in vivo and in situ.Photosynthesis Research 72 (1), 39-53
Bianchi, M. (1989). Unusual bloom of a star-like prosthecate bacteria and filaments as a consequenceof grazing pressure. Microbial Ecology 17 (2), 137-142
Björnsen, P. K. (1986). Automatic determination of bacterioplankton biomass by image analysis.Applied & Environmental Microbiology 51 (6), 1199-1204
Blackburn, N., Zweifel, U. L. and Hagstrom, A. (1996). Cycling of marine dissolved organic matter .2. amodel analysis. Aquatic Microbial Ecology 11 (1), 79-90
Boenigk, J., Matz, C., Jürgens, K. and Arndt, H. (2001). Confusing selective feeding with differentialdigestion in bacterivorous nanoflagellates. Journal of Eukaryotic Microbiology 48 (4), 425-432
Bottrell, H. H., Duncan, A., Gliwicz, Z. M., Grygierek, E., Herzig, A., Hillbricht-Ilkowska, A., Kurasawa,H., Larsson, P. and Weglenska, T. (1976). A review of some problems in zooplankton productionstudies. Norw. J. Zool. 24 419-456
REFERENCES
135
Brendelberger, H. (1991). Filter mesh size of cladocerans predicts retention efficiency for bacteria.Limnology and Oceanography 36 884-894
Brendelberger, H., Herbeck, M., Lang, H. and Lampert, W. (1986). Daphnias Filters Are Not SolidWalls. Archiv Fur Hydrobiologie 107 (2), 197-202
Brett, M. T. and Goldman, C. R. (1996). A meta-analysis of the freshwater trophic cascade.Proceedings of the National Academy of Sciences of the United States of America 93 (15), 7723-7726
Brett, M. T. and Goldman, C. R. (1997). Consumer versus resource control in freshwater pelagicfoodwebs. Science 275 384-386
Brett, M. T., Wiackowski, K., Lubnow, F. S., Müller-Solger, A., Elser, J. J. and Goldman, C. R.(1994).Species-dependent effects of zooplankton on planktonic ecosystem processes in CastleLake, California. Ecology 75 2243-2254
Broglio, E., Johansson, M. and Jonsson, P. R. (2001). Trophic interaction between copepods andciliates: effects of prey swimming behavior on predation risk. Marine Ecology-Progress Series 220179-186
Burns, C. W. and Gilbert, J. J. (1993). Predation on ciliates by freshwater calanoid copepods: Rates ofpredation and relative vulnerabilities of prey. Freshwater Biology 30 (3), 377-393
Burns, C. W. and Schallenberg, M. (1996). Relative impacts of copepods, cladocerans and nutrientson the microbial food web of a mesotrophic lake. Journal of Plankton Research 18 (5), 683-714
Burns, C. W. and Schallenberg, M. (1998). Impacts of nutrients and zooplankton on the microbial foodweb of an ultra-oligotrophic lake. Journal of Plankton Research 20 (8), 1501-1525
Burns, C. W. and Schallenberg, M. (2001a). Calanoid copepods versus cladocerans: Consumereffects on protozoa in lakes of different trophic status. Limnology and Oceanography 46 (6), 1558-1565
Burns, C. W. and Schallenberg, M. (2001b). Short-term impacts of nutrients, Daphnia, and copepodson microbial food-webs of an oligotrophic and leutrophic lake. New Zealand Journal of Marine andFreshwater Research 35 (4), 695-710
Calbet, A. (2001). Mesozooplankton grazing effect on primary production: A global comparativeanalysis in marine ecosystems. Limnology and Oceanography 46 (7), 1824-1830
Calbet, A. and Landry, M. R. (1999). Mesozooplankton influences on the microbial food web: Directand indirect trophic interactions in the oligotrophic open ocean. Limnology & Oceanography 44 (6),1370-1380
Caron, D. A., Goldman, J. C. and Dennett, M. R. (1988). Experimental demonstration of the roles ofbacteria and bacterivorous protozoa in plankton nutrient cycles. Hydrobiologia 159 27-40
Carpenter, S. R., Cole, J. J., Hodgson, J. R., Kitchell, J. F., Pace, M. L., Bade, D., Cottingham, K. L.,Essington, T. E., Houser, J. N. and Schindler, D. E. (2001). Trophic cascades, nutrients, and lakeproductivity: whole-lake experiments. Ecological Monographs 71 (2), 163-186
Carpenter, S. R., Kitchell, J. F. and Hodgson, J. R. (1985). Cascading trophic interactions and lakeproductivity. Bioscience 35 635-639
Carrick, H. J., Fahnenstiel, G. L., Stoermer, E. F. and Wetzel, R. G. (1991). The importance ofzooplankton-protozoan trophic couplings in Lake Michigan. Limnology & Oceanography 36 (7),1335-1345
Chase, J. M. (2003). Strong and weak trophic cascades along a productivity gradient. Oikos 101 (1),187-195
Cho, B. C. and Azam, F. (1988). Major role of bacteria in biogeochemical fluxes in the ocean's interior.Nature 332 (6163), 441-443
Christaki, U., Jacquet, S., Dolan, J. R., Vaulot, D. and Rassoulzadegan, F. (1999). Growth and grazingon Prochlorococcus and Synechococcus by two marine ciliates. Limnology and Oceanography 44(1), 52-61
Christoffersen, K., Bernard, C. and Ekebom, J. (1996). A comparison of the ability of differentheterotrophic nanoflagellates to incorporate dissolved macromolecules. Ergebnisse derLimnologie 0 (48), 73-84
Christoffersen, K., Riemann, B., Klysner, A. and Søndergaard, M. (1993). Potential role of fishpredation and natural populations of zooplankton in structuring a plankton community in eutrophiclake water. Limnology & Oceanography 38 (3), 561-573
Chrzanowski, T. H. and Grover, J. P. (2001). The light : nutrient ratio in lakes: a test of hypothesizedtrends in bacterial nutrient limitation. Ecol Letters 4 (5), 453-457
Cleven, E.-J. (1996). Indirectly fluorescently labelled flagellates (IFLF): a tool to estimate the predationon free-living heterotrophic flagellates. J. Plankt. Res. 18 429-442
Cochran-Stafira, D. L. and von Ende, C. N. (1998). Integrating bacteria into food webs - studies withSarracenia purpurea inquilines. Ecology 79 (3), 880-898.
REFERENCES
136
Connon, S. A. and Giovannoni, S. J. (2002). High-throughput methods for culturing microorganisms invery-low-nutrient media yield diverse new marine isolates. Applied and EnvironmentalMicrobiology 68 (8), 3878-3885
Cotner, J. B. and Biddanda, B. A. (2002). Small players, large role: Microbial influence onbiogeochemical processes in pelagic aquatic ecosystems. Ecosystems 5 (2), 105-121
Crump, B. C., Hopkinson, C. S., Sogin, M. L. and Hobbie, J. E. (2004). Microbial Biogeography alongan Estuarine Salinity Gradient: Combined Influences of Bacterial Growth and Residence Time.Applied & Environmental Microbiology 70 (3), 1494-1505
Crump, B. C., Kling, G. W., Bahr, M. and Hobbie, J. E. (2003). Bacterioplankton community shifts in anarctic lake correlate with seasonal changes in organic matter source. Applied and EnvironmentalMicrobiology 69 (4), 2253-2268
Curtis, T. P., Sloan, W. T. and Scannell, J. W. (2002). Estimating prokaryotic diversity and its limits.Proceedings of the National Academy of Sciences of the United States of America 99 (16), 10494-10499
Daims, H., Bruhl, A., Amann, R., Schleifer, K. H. and Wagner, M. (1999). The domain-specific probeEUB338 is insufficient for the detection of all Bacteria: Development and evaluation of a morecomprehensive probe set. Systematic and Applied Microbiology 22 (3), 434-444
Dale, T. and Dahl, E. (1987). Mass Occurrence of Planktonic Oligotrichous Ciliates in a Bay inSouthern-Norway. Journal of Plankton Research 9 (5), 871-879
Degans, H., Zöllner, E., Van der Gucht, K., De Meester, L. and Jürgens, K. (2002). Rapid Daphnia-mediated changes in microbial community structure: an experimental study. Fems MicrobiologyEcology 42 (1), 137-149
Deibel, D. and Lee, S. H. (1992). Retention Efficiency of Submicrometer Particles by the PharyngealFilter of the Pelagic Tunicate Oikopleura vanhoeffeni. Marine Ecology-Progress Series 81 (1), 25-30
DelGiorgio, P. A. and Bouvier, T. C. (2002). Linking the physiologic and phylogenetic successions infree-living bacterial communities along an estuarine salinity gradient. Limnology & Oceanography47 (2), 471-486
DelGiorgio, P. A., Cole, J. J. and Cimbleris, A. (1997). Respiration rates in bacteria exceedphytoplankton production in unproductive aquatic systems. Nature 385 (N6612), 148-151
DelGiorgio, P. A. and Duarte, C. M. (2002). Respiration in the open ocean. Nature 420 (6914), 379-384
DelGiorgio, P. A., Gasol, J. M., Vaque, D., Mura, P., Agusti, S. and Duarte, C. M. (1996).Bacterioplankton community structure - protists control net production and the proportion of activebacteria in a coastal marine community. Limnology & Oceanography 41 1169-1179
DelGiorgio, P. A., Prairie, Y. T. and Bird, D. F. (1997). Coupling between rates of bacterial productionand the abundance of metabolically active bacteria in lakes, enumerated using CTC reduction andflow cytometry. Microbial Ecology. 34 (2), 144-154
DelGiorgio, P. A., Bird, D. F., Prairie, Y. T. and Planas, D. (1996). Flow cytometric determination ofbacterial abundance in lake plankton with the green nucleic-acid stain syto-13. Limnology andOceanography 41 (N4), 783-789
DeMott, W. R. (1982). Feeding selectivities and relative ingestion rates of Daphnia and Bosmina.Limnology and Oceanography 27 518-527
DeMott, W. R. (1988). Discrimination between algae and artificial particles by freshwater and marinecopepods. Limnology & Oceanography 33 (3), 397-408
Diez, B., Pedros-Alio, C., Marsh, T. L. and Massana, R. (2001). Application of denaturing gradient gelelectrophoresis (DGGE) to study the diversity of marine picoeukaryotic assemblages andcomparison of DGGE with other molecular techniques. Applied & Environmental Microbiology 67(7), 2942-2951
Dolan, J. R. and Simek, K. (1998). Ingestion and digestion of an autotrophic picoplankter,Synechococcus, by a heterotrophic nanoflagellate, Bodo saltans. Limnology and Oceanography43 (7), 1740-1746
Dollhopf, S. L., Hashsham, S. A. and Tiedje, J. M. (2001). Interpreting 16S rDNA T-RFLP data:Application of self- organizing maps and principal component analysis to describe communitydynamics and convergence. Microbial Ecology 42 (4), 495-505
Domaizon, and al., e. (2003). Taxon-specific and seasonal variations in flagellates grazing onheterotrophic bacteria in the oligotrophic lake Annecy-importance of mixotrophy. FemsMicrobiology Ecology 46, 317-329
Ducklow, H. (2000). Bacterial production and biomass in the oceans. In: Kirchman D (ed) Microbialecology of the, 85-120.
Ducklow, H. W., Kirchman, D. L. and Anderson, T. R. (2002). The magnitude of spring bacterialproduction in the North Atlantic Ocean. Limnology and Oceanography 47 (6), 1684-1693
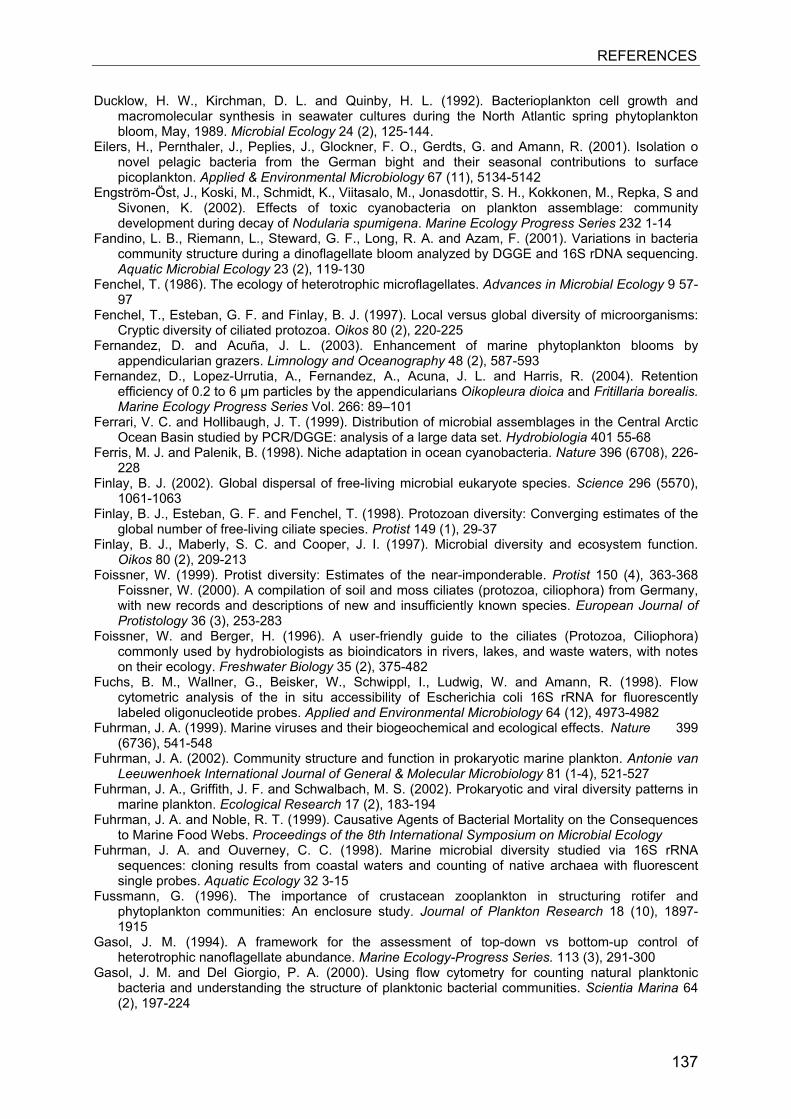
REFERENCES
137
Ducklow, H. W., Kirchman, D. L. and Quinby, H. L. (1992). Bacterioplankton cell growth andmacromolecular synthesis in seawater cultures during the North Atlantic spring phytoplanktonbloom, May, 1989. Microbial Ecology 24 (2), 125-144.
Eilers, H., Pernthaler, J., Peplies, J., Glockner, F. O., Gerdts, G. and Amann, R. (2001). Isolation onovel pelagic bacteria from the German bight and their seasonal contributions to surfacepicoplankton. Applied & Environmental Microbiology 67 (11), 5134-5142
Engström-Öst, J., Koski, M., Schmidt, K., Viitasalo, M., Jonasdottir, S. H., Kokkonen, M., Repka, S andSivonen, K. (2002). Effects of toxic cyanobacteria on plankton assemblage: communitydevelopment during decay of Nodularia spumigena. Marine Ecology Progress Series 232 1-14
Fandino, L. B., Riemann, L., Steward, G. F., Long, R. A. and Azam, F. (2001). Variations in bacteriacommunity structure during a dinoflagellate bloom analyzed by DGGE and 16S rDNA sequencing.Aquatic Microbial Ecology 23 (2), 119-130
Fenchel, T. (1986). The ecology of heterotrophic microflagellates. Advances in Microbial Ecology 9 57-97
Fenchel, T., Esteban, G. F. and Finlay, B. J. (1997). Local versus global diversity of microorganisms:Cryptic diversity of ciliated protozoa. Oikos 80 (2), 220-225
Fernandez, D. and Acuña, J. L. (2003). Enhancement of marine phytoplankton blooms byappendicularian grazers. Limnology and Oceanography 48 (2), 587-593
Fernandez, D., Lopez-Urrutia, A., Fernandez, A., Acuna, J. L. and Harris, R. (2004). Retentionefficiency of 0.2 to 6 µm particles by the appendicularians Oikopleura dioica and Fritillaria borealis.Marine Ecology Progress Series Vol. 266: 89–101
Ferrari, V. C. and Hollibaugh, J. T. (1999). Distribution of microbial assemblages in the Central ArcticOcean Basin studied by PCR/DGGE: analysis of a large data set. Hydrobiologia 401 55-68
Ferris, M. J. and Palenik, B. (1998). Niche adaptation in ocean cyanobacteria. Nature 396 (6708), 226-228
Finlay, B. J. (2002). Global dispersal of free-living microbial eukaryote species. Science 296 (5570),1061-1063
Finlay, B. J., Esteban, G. F. and Fenchel, T. (1998). Protozoan diversity: Converging estimates of theglobal number of free-living ciliate species. Protist 149 (1), 29-37
Finlay, B. J., Maberly, S. C. and Cooper, J. I. (1997). Microbial diversity and ecosystem function.Oikos 80 (2), 209-213
Foissner, W. (1999). Protist diversity: Estimates of the near-imponderable. Protist 150 (4), 363-368Foissner, W. (2000). A compilation of soil and moss ciliates (protozoa, ciliophora) from Germany,with new records and descriptions of new and insufficiently known species. European Journal ofProtistology 36 (3), 253-283
Foissner, W. and Berger, H. (1996). A user-friendly guide to the ciliates (Protozoa, Ciliophora)commonly used by hydrobiologists as bioindicators in rivers, lakes, and waste waters, with noteson their ecology. Freshwater Biology 35 (2), 375-482
Fuchs, B. M., Wallner, G., Beisker, W., Schwippl, I., Ludwig, W. and Amann, R. (1998). Flowcytometric analysis of the in situ accessibility of Escherichia coli 16S rRNA for fluorescentlylabeled oligonucleotide probes. Applied and Environmental Microbiology 64 (12), 4973-4982
Fuhrman, J. A. (1999). Marine viruses and their biogeochemical and ecological effects. Nature 399(6736), 541-548
Fuhrman, J. A. (2002). Community structure and function in prokaryotic marine plankton. Antonie vanLeeuwenhoek International Journal of General & Molecular Microbiology 81 (1-4), 521-527
Fuhrman, J. A., Griffith, J. F. and Schwalbach, M. S. (2002). Prokaryotic and viral diversity patterns inmarine plankton. Ecological Research 17 (2), 183-194
Fuhrman, J. A. and Noble, R. T. (1999). Causative Agents of Bacterial Mortality on the Consequencesto Marine Food Webs. Proceedings of the 8th International Symposium on Microbial Ecology
Fuhrman, J. A. and Ouverney, C. C. (1998). Marine microbial diversity studied via 16S rRNAsequences: cloning results from coastal waters and counting of native archaea with fluorescentsingle probes. Aquatic Ecology 32 3-15
Fussmann, G. (1996). The importance of crustacean zooplankton in structuring rotifer andphytoplankton communities: An enclosure study. Journal of Plankton Research 18 (10), 1897-1915
Gasol, J. M. (1994). A framework for the assessment of top-down vs bottom-up control ofheterotrophic nanoflagellate abundance. Marine Ecology-Progress Series. 113 (3), 291-300
Gasol, J. M. and Del Giorgio, P. A. (2000). Using flow cytometry for counting natural planktonicbacteria and understanding the structure of planktonic bacterial communities. Scientia Marina 64(2), 197-224
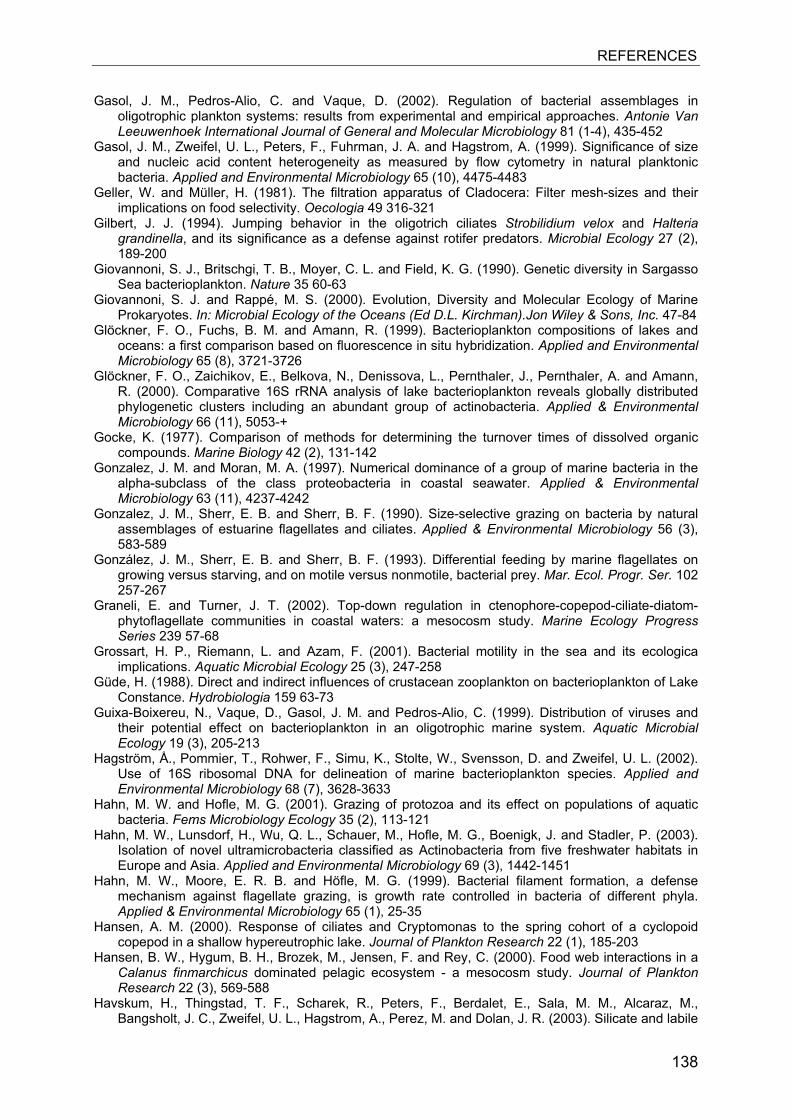
REFERENCES
138
Gasol, J. M., Pedros-Alio, C. and Vaque, D. (2002). Regulation of bacterial assemblages inoligotrophic plankton systems: results from experimental and empirical approaches. Antonie VanLeeuwenhoek International Journal of General and Molecular Microbiology 81 (1-4), 435-452
Gasol, J. M., Zweifel, U. L., Peters, F., Fuhrman, J. A. and Hagstrom, A. (1999). Significance of sizeand nucleic acid content heterogeneity as measured by flow cytometry in natural planktonicbacteria. Applied and Environmental Microbiology 65 (10), 4475-4483
Geller, W. and Müller, H. (1981). The filtration apparatus of Cladocera: Filter mesh-sizes and theirimplications on food selectivity. Oecologia 49 316-321
Gilbert, J. J. (1994). Jumping behavior in the oligotrich ciliates Strobilidium velox and Halteriagrandinella, and its significance as a defense against rotifer predators. Microbial Ecology 27 (2),189-200
Giovannoni, S. J., Britschgi, T. B., Moyer, C. L. and Field, K. G. (1990). Genetic diversity in SargassoSea bacterioplankton. Nature 35 60-63
Giovannoni, S. J. and Rappé, M. S. (2000). Evolution, Diversity and Molecular Ecology of MarineProkaryotes. In: Microbial Ecology of the Oceans (Ed D.L. Kirchman).Jon Wiley & Sons, Inc. 47-84
Glöckner, F. O., Fuchs, B. M. and Amann, R. (1999). Bacterioplankton compositions of lakes andoceans: a first comparison based on fluorescence in situ hybridization. Applied and EnvironmentalMicrobiology 65 (8), 3721-3726
Glöckner, F. O., Zaichikov, E., Belkova, N., Denissova, L., Pernthaler, J., Pernthaler, A. and Amann,R. (2000). Comparative 16S rRNA analysis of lake bacterioplankton reveals globally distributedphylogenetic clusters including an abundant group of actinobacteria. Applied & EnvironmentalMicrobiology 66 (11), 5053-+
Gocke, K. (1977). Comparison of methods for determining the turnover times of dissolved organiccompounds. Marine Biology 42 (2), 131-142
Gonzalez, J. M. and Moran, M. A. (1997). Numerical dominance of a group of marine bacteria in thealpha-subclass of the class proteobacteria in coastal seawater. Applied & EnvironmentalMicrobiology 63 (11), 4237-4242
Gonzalez, J. M., Sherr, E. B. and Sherr, B. F. (1990). Size-selective grazing on bacteria by naturalassemblages of estuarine flagellates and ciliates. Applied & Environmental Microbiology 56 (3),583-589
González, J. M., Sherr, E. B. and Sherr, B. F. (1993). Differential feeding by marine flagellates ongrowing versus starving, and on motile versus nonmotile, bacterial prey. Mar. Ecol. Progr. Ser. 102257-267
Graneli, E. and Turner, J. T. (2002). Top-down regulation in ctenophore-copepod-ciliate-diatom-phytoflagellate communities in coastal waters: a mesocosm study. Marine Ecology ProgressSeries 239 57-68
Grossart, H. P., Riemann, L. and Azam, F. (2001). Bacterial motility in the sea and its ecologicaimplications. Aquatic Microbial Ecology 25 (3), 247-258
Güde, H. (1988). Direct and indirect influences of crustacean zooplankton on bacterioplankton of LakeConstance. Hydrobiologia 159 63-73
Guixa-Boixereu, N., Vaque, D., Gasol, J. M. and Pedros-Alio, C. (1999). Distribution of viruses andtheir potential effect on bacterioplankton in an oligotrophic marine system. Aquatic MicrobialEcology 19 (3), 205-213
Hagström, Å., Pommier, T., Rohwer, F., Simu, K., Stolte, W., Svensson, D. and Zweifel, U. L. (2002).Use of 16S ribosomal DNA for delineation of marine bacterioplankton species. Applied andEnvironmental Microbiology 68 (7), 3628-3633
Hahn, M. W. and Hofle, M. G. (2001). Grazing of protozoa and its effect on populations of aquaticbacteria. Fems Microbiology Ecology 35 (2), 113-121
Hahn, M. W., Lunsdorf, H., Wu, Q. L., Schauer, M., Hofle, M. G., Boenigk, J. and Stadler, P. (2003).Isolation of novel ultramicrobacteria classified as Actinobacteria from five freshwater habitats inEurope and Asia. Applied and Environmental Microbiology 69 (3), 1442-1451
Hahn, M. W., Moore, E. R. B. and Höfle, M. G. (1999). Bacterial filament formation, a defensemechanism against flagellate grazing, is growth rate controlled in bacteria of different phyla.Applied & Environmental Microbiology 65 (1), 25-35
Hansen, A. M. (2000). Response of ciliates and Cryptomonas to the spring cohort of a cyclopoidcopepod in a shallow hypereutrophic lake. Journal of Plankton Research 22 (1), 185-203
Hansen, B. W., Hygum, B. H., Brozek, M., Jensen, F. and Rey, C. (2000). Food web interactions in aCalanus finmarchicus dominated pelagic ecosystem - a mesocosm study. Journal of PlanktonResearch 22 (3), 569-588
Havskum, H., Thingstad, T. F., Scharek, R., Peters, F., Berdalet, E., Sala, M. M., Alcaraz, M.,Bangsholt, J. C., Zweifel, U. L., Hagstrom, A., Perez, M. and Dolan, J. R. (2003). Silicate and labile
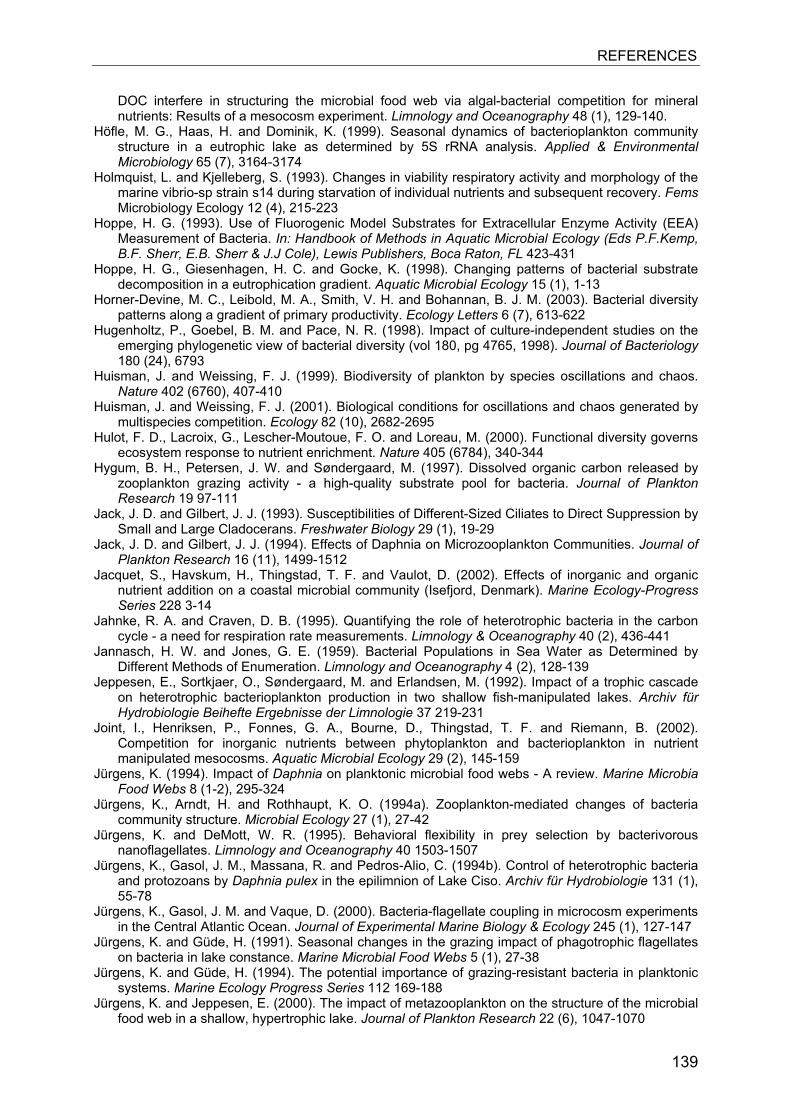
REFERENCES
139
DOC interfere in structuring the microbial food web via algal-bacterial competition for mineralnutrients: Results of a mesocosm experiment. Limnology and Oceanography 48 (1), 129-140.
Höfle, M. G., Haas, H. and Dominik, K. (1999). Seasonal dynamics of bacterioplankton communitystructure in a eutrophic lake as determined by 5S rRNA analysis. Applied & EnvironmentalMicrobiology 65 (7), 3164-3174
Holmquist, L. and Kjelleberg, S. (1993). Changes in viability respiratory activity and morphology of themarine vibrio-sp strain s14 during starvation of individual nutrients and subsequent recovery. FemsMicrobiology Ecology 12 (4), 215-223
Hoppe, H. G. (1993). Use of Fluorogenic Model Substrates for Extracellular Enzyme Activity (EEA)Measurement of Bacteria. In: Handbook of Methods in Aquatic Microbial Ecology (Eds P.F.Kemp,B.F. Sherr, E.B. Sherr & J.J Cole), Lewis Publishers, Boca Raton, FL 423-431
Hoppe, H. G., Giesenhagen, H. C. and Gocke, K. (1998). Changing patterns of bacterial substratedecomposition in a eutrophication gradient. Aquatic Microbial Ecology 15 (1), 1-13
Horner-Devine, M. C., Leibold, M. A., Smith, V. H. and Bohannan, B. J. M. (2003). Bacterial diversitypatterns along a gradient of primary productivity. Ecology Letters 6 (7), 613-622
Hugenholtz, P., Goebel, B. M. and Pace, N. R. (1998). Impact of culture-independent studies on theemerging phylogenetic view of bacterial diversity (vol 180, pg 4765, 1998). Journal of Bacteriology180 (24), 6793
Huisman, J. and Weissing, F. J. (1999). Biodiversity of plankton by species oscillations and chaos.Nature 402 (6760), 407-410
Huisman, J. and Weissing, F. J. (2001). Biological conditions for oscillations and chaos generated bymultispecies competition. Ecology 82 (10), 2682-2695
Hulot, F. D., Lacroix, G., Lescher-Moutoue, F. O. and Loreau, M. (2000). Functional diversity governsecosystem response to nutrient enrichment. Nature 405 (6784), 340-344
Hygum, B. H., Petersen, J. W. and Søndergaard, M. (1997). Dissolved organic carbon released byzooplankton grazing activity - a high-quality substrate pool for bacteria. Journal of PlanktonResearch 19 97-111
Jack, J. D. and Gilbert, J. J. (1993). Susceptibilities of Different-Sized Ciliates to Direct Suppression bySmall and Large Cladocerans. Freshwater Biology 29 (1), 19-29
Jack, J. D. and Gilbert, J. J. (1994). Effects of Daphnia on Microzooplankton Communities. Journal ofPlankton Research 16 (11), 1499-1512
Jacquet, S., Havskum, H., Thingstad, T. F. and Vaulot, D. (2002). Effects of inorganic and organicnutrient addition on a coastal microbial community (Isefjord, Denmark). Marine Ecology-ProgressSeries 228 3-14
Jahnke, R. A. and Craven, D. B. (1995). Quantifying the role of heterotrophic bacteria in the carboncycle - a need for respiration rate measurements. Limnology & Oceanography 40 (2), 436-441
Jannasch, H. W. and Jones, G. E. (1959). Bacterial Populations in Sea Water as Determined byDifferent Methods of Enumeration. Limnology and Oceanography 4 (2), 128-139
Jeppesen, E., Sortkjaer, O., Søndergaard, M. and Erlandsen, M. (1992). Impact of a trophic cascadeon heterotrophic bacterioplankton production in two shallow fish-manipulated lakes. Archiv fürHydrobiologie Beihefte Ergebnisse der Limnologie 37 219-231
Joint, I., Henriksen, P., Fonnes, G. A., Bourne, D., Thingstad, T. F. and Riemann, B. (2002).Competition for inorganic nutrients between phytoplankton and bacterioplankton in nutrientmanipulated mesocosms. Aquatic Microbial Ecology 29 (2), 145-159
Jürgens, K. (1994). Impact of Daphnia on planktonic microbial food webs - A review. Marine MicrobiaFood Webs 8 (1-2), 295-324
Jürgens, K., Arndt, H. and Rothhaupt, K. O. (1994a). Zooplankton-mediated changes of bacteriacommunity structure. Microbial Ecology 27 (1), 27-42
Jürgens, K. and DeMott, W. R. (1995). Behavioral flexibility in prey selection by bacterivorousnanoflagellates. Limnology and Oceanography 40 1503-1507
Jürgens, K., Gasol, J. M., Massana, R. and Pedros-Alio, C. (1994b). Control of heterotrophic bacteriaand protozoans by Daphnia pulex in the epilimnion of Lake Ciso. Archiv für Hydrobiologie 131 (1),55-78
Jürgens, K., Gasol, J. M. and Vaque, D. (2000). Bacteria-flagellate coupling in microcosm experimentsin the Central Atlantic Ocean. Journal of Experimental Marine Biology & Ecology 245 (1), 127-147
Jürgens, K. and Güde, H. (1991). Seasonal changes in the grazing impact of phagotrophic flagellateson bacteria in lake constance. Marine Microbial Food Webs 5 (1), 27-38
Jürgens, K. and Güde, H. (1994). The potential importance of grazing-resistant bacteria in planktonicsystems. Marine Ecology Progress Series 112 169-188
Jürgens, K. and Jeppesen, E. (2000). The impact of metazooplankton on the structure of the microbialfood web in a shallow, hypertrophic lake. Journal of Plankton Research 22 (6), 1047-1070

REFERENCES
140
Jürgens, K. and Matz, C. (2002). Predation as a shaping force for the phenotypic and genotypiccomposition of planktonic bacteria. Antonie van Leeuwenhoek International Journal of General &Molecular Microbiology 81 (1-4), 413-434.
Jürgens, K., Pernthaler, J., Schalla, S. and Amann, R. (1999a). Morphological and compositionalchanges in a planktonic bacterial community in response to enhanced protozoan grazing. Applied& Environmental Microbiology 65 (3), 1241-1250
Jürgens, K., Skibbe, O. and Jeppesen, E. (1999b). Impact of metazooplankton on the composition andpopulation dynamics of planktonic ciliates in a shallow, hypertrophic lake. Aquatic MicrobialEcology 17 (1), 61-75
Jürgens, K. and Stolpe, G. (1995). Seasonal dynamics of crustacean zooplankton, heterotrophicnanoflagellates and bacteria in a shallow, eutrophic lake. Freshwater Biology. 33 (1), 27-38
Jürgens, K., Wickham, S. A., Rothhaupt, K. O. and Santer, B. (1996). Feeding rates of macro- andmicrozooplankton on heterotrophic nanoflagellates. Limnology & Oceanography 41 (8), 1833-1839
Karner, M., Ferrierpages, C. and Rassoulzadegan, F. (1994). Phagotrophic Nanoflagellates Contributeto Occurrence of Alpha-Glucosidase and Aminopeptidase in Marine Environments. MarineEcology-Progress Series 114 (3), 237-244
Katechakis, A., Stibor, H., Sommer, U. and Hansen, T. (2002). Changes in the phytoplanktoncommunity and microbial food web of Blanes Bay (Catalan Sea, NW Mediterranean) underprolonged grazing pressure by doliolids (Tunicata), cladocerans or copepods (Crustacea). MarineEcology Progress Series 234 55-69
Kerkhof, L. J., Voytek, M. A., Sherrell, R. M., Millie, D. and Schohfield, O. (1999). Variability in bacterialcommunity structure during upwelling in the coastal ocean. Hydrobiologia 401 139-148
King, C. H., Sanders, R. W., Shotts, E. B., Jr. and Porter, K. G. (1991). Differential survival of bacteriaingested by zooplankton from a stratified eutrophic lake. Limnology & Oceanography 36 (5), 829-845
King, K. R., Hollibaugh, J. T. and Azam, F. (1980). Predator-prey interactions between the larvaceanOikopleura dioica and bacterioplankton in enclosed water columns. Marine Biology 56 49-57
Kiørboe, T. (1997). Population regulation and role of mesozooplankton in shaping marine pelagic foodwebs. Hydrobiologia 363 13-27
Kirchman, D. L. (1993). Leucine incorporation as a measure of biomass production by heterotrophicbacteria. In: Handbook of Methods in Aquatic Microbial Ecology (Eds P.F.Kemp, B.F. Sherr, E.B.Sherr & J.J Cole), Lewis Publishers, Boca Raton, FL 509-512
Kisand, V. and Zingel, P. (2000). Dominance of ciliate grazing on bacteria during spring in a shalloweutrophic lake. Aquatic Microbial Ecology 22 (2), 135-142
Kleppel, G. S. (1993). On the Diets of Calanoid Copepods. Marine Ecology-Progress Series 99 (1-2),183-195
Kogure, K., Simidu, U. and Taga, N. (1979). Tentative Direct Microscopic Method for Counting LivingMarine-Bacteria. Canadian Journal of Microbiology 25 (3), 415-420
Koshikawa, H., Harada, S., Watanabe, M., Kogure, K., Ioriya, T., Kohata, K., Kimura, T., Sato, K. andAkehata, T. (1999). Influence of plankton community structure on the contribution of bacterialproduction to metazooplankton in a coastal mesocosm. Marine Ecology-Progress Series 186 31-42
Koshikawa, H., Harada, S., Watanabe, M., Sato, K. and Akehata, K. (1996). Relative contribution ofbacterial and photosynthetic production to metazooplankton as carbon-sources. Journal ofPlankton Research 18 (N12), 2269-2281
Lampert, W., Fleckner, W., Rai, H. and Taylor, B. E. (1986). Phytoplankton control by grazingzooplankton: a study on the clear water phase. Limnology & Oceanography 31 478-490
Lampert, W. and Taylor, B. E. (1985). Zooplankton grazing in an eutrophic lake: quantitative andqualitative implications of diel vertical migration. Ecology 66 68-82
Langenheder, S. and Jürgens, K. (2001). Regulation of bacterial biomass and community structure bymetazoan and protozoan predation. Limnology & Oceanography 46 (1), 121-134
Langenheder, S., Kisand, V., Wikner, J. and Tranvik, L. J. (2003). Salinity as a structuring factor for thecomposition and performance of bacterioplankton degrading riverine DOC. Fems MicrobiologyEcology 45 (2), 189-202.
Larsen, A. (2004). Spring phytoplankton bloom dynamics in Norwegian coastal waters:... Limnologyand Oceanography 49 (1), 180-190
Larsen, A., Castberg, T., Sandaa, R. A., Brussaard, C. P. D., Egge, J., Heldal, M., Paulino, A.,Thyrhaug, R., van Hannen, E. J. and Bratbak, G. (2001). Population dynamics and diversity ofphytoplankton, bacteria and viruses in a seawater enclosure. Marine Ecology Progress Series 22147-57
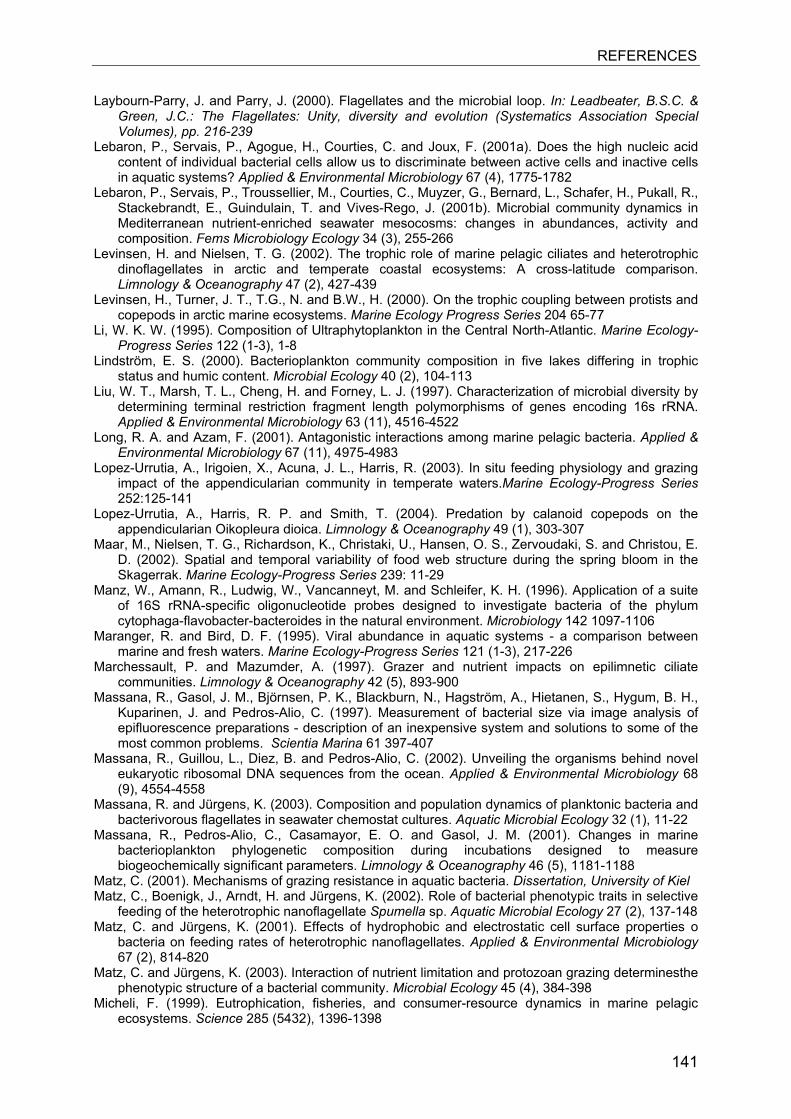
REFERENCES
141
Laybourn-Parry, J. and Parry, J. (2000). Flagellates and the microbial loop. In: Leadbeater, B.S.C. &Green, J.C.: The Flagellates: Unity, diversity and evolution (Systematics Association SpecialVolumes), pp. 216-239
Lebaron, P., Servais, P., Agogue, H., Courties, C. and Joux, F. (2001a). Does the high nucleic acidcontent of individual bacterial cells allow us to discriminate between active cells and inactive cellsin aquatic systems? Applied & Environmental Microbiology 67 (4), 1775-1782
Lebaron, P., Servais, P., Troussellier, M., Courties, C., Muyzer, G., Bernard, L., Schafer, H., Pukall, R.,Stackebrandt, E., Guindulain, T. and Vives-Rego, J. (2001b). Microbial community dynamics inMediterranean nutrient-enriched seawater mesocosms: changes in abundances, activity andcomposition. Fems Microbiology Ecology 34 (3), 255-266
Levinsen, H. and Nielsen, T. G. (2002). The trophic role of marine pelagic ciliates and heterotrophicdinoflagellates in arctic and temperate coastal ecosystems: A cross-latitude comparison.Limnology & Oceanography 47 (2), 427-439
Levinsen, H., Turner, J. T., T.G., N. and B.W., H. (2000). On the trophic coupling between protists andcopepods in arctic marine ecosystems. Marine Ecology Progress Series 204 65-77
Li, W. K. W. (1995). Composition of Ultraphytoplankton in the Central North-Atlantic. Marine Ecology-Progress Series 122 (1-3), 1-8
Lindström, E. S. (2000). Bacterioplankton community composition in five lakes differing in trophicstatus and humic content. Microbial Ecology 40 (2), 104-113
Liu, W. T., Marsh, T. L., Cheng, H. and Forney, L. J. (1997). Characterization of microbial diversity bydetermining terminal restriction fragment length polymorphisms of genes encoding 16s rRNA.Applied & Environmental Microbiology 63 (11), 4516-4522
Long, R. A. and Azam, F. (2001). Antagonistic interactions among marine pelagic bacteria. Applied &Environmental Microbiology 67 (11), 4975-4983
Lopez-Urrutia, A., Irigoien, X., Acuna, J. L., Harris, R. (2003). In situ feeding physiology and grazingimpact of the appendicularian community in temperate waters.Marine Ecology-Progress Series252:125-141
Lopez-Urrutia, A., Harris, R. P. and Smith, T. (2004). Predation by calanoid copepods on theappendicularian Oikopleura dioica. Limnology & Oceanography 49 (1), 303-307
Maar, M., Nielsen, T. G., Richardson, K., Christaki, U., Hansen, O. S., Zervoudaki, S. and Christou, E.D. (2002). Spatial and temporal variability of food web structure during the spring bloom in theSkagerrak. Marine Ecology-Progress Series 239: 11-29
Manz, W., Amann, R., Ludwig, W., Vancanneyt, M. and Schleifer, K. H. (1996). Application of a suiteof 16S rRNA-specific oligonucleotide probes designed to investigate bacteria of the phylumcytophaga-flavobacter-bacteroides in the natural environment. Microbiology 142 1097-1106
Maranger, R. and Bird, D. F. (1995). Viral abundance in aquatic systems - a comparison betweenmarine and fresh waters. Marine Ecology-Progress Series 121 (1-3), 217-226
Marchessault, P. and Mazumder, A. (1997). Grazer and nutrient impacts on epilimnetic ciliatecommunities. Limnology & Oceanography 42 (5), 893-900
Massana, R., Gasol, J. M., Björnsen, P. K., Blackburn, N., Hagström, A., Hietanen, S., Hygum, B. H.,Kuparinen, J. and Pedros-Alio, C. (1997). Measurement of bacterial size via image analysis ofepifluorescence preparations - description of an inexpensive system and solutions to some of themost common problems. Scientia Marina 61 397-407
Massana, R., Guillou, L., Diez, B. and Pedros-Alio, C. (2002). Unveiling the organisms behind noveleukaryotic ribosomal DNA sequences from the ocean. Applied & Environmental Microbiology 68(9), 4554-4558
Massana, R. and Jürgens, K. (2003). Composition and population dynamics of planktonic bacteria andbacterivorous flagellates in seawater chemostat cultures. Aquatic Microbial Ecology 32 (1), 11-22
Massana, R., Pedros-Alio, C., Casamayor, E. O. and Gasol, J. M. (2001). Changes in marinebacterioplankton phylogenetic composition during incubations designed to measurebiogeochemically significant parameters. Limnology & Oceanography 46 (5), 1181-1188
Matz, C. (2001). Mechanisms of grazing resistance in aquatic bacteria. Dissertation, University of Kiel Matz, C., Boenigk, J., Arndt, H. and Jürgens, K. (2002). Role of bacterial phenotypic traits in selective
feeding of the heterotrophic nanoflagellate Spumella sp. Aquatic Microbial Ecology 27 (2), 137-148Matz, C. and Jürgens, K. (2001). Effects of hydrophobic and electrostatic cell surface properties o
bacteria on feeding rates of heterotrophic nanoflagellates. Applied & Environmental Microbiology67 (2), 814-820
Matz, C. and Jürgens, K. (2003). Interaction of nutrient limitation and protozoan grazing determinesthephenotypic structure of a bacterial community. Microbial Ecology 45 (4), 384-398
Micheli, F. (1999). Eutrophication, fisheries, and consumer-resource dynamics in marine pelagicecosystems. Science 285 (5432), 1396-1398
REFERENCES
142
Middelboe, M., Hagström, A., Blackburn, N., Sinn, B., Fischer, U., Borch, N. H., Pinhassi, J., Simu, K.and Lorenz, M. G. (2001). Effects of bacteriophages on the population dynamics of four strains ofpelagic marine bacteria. Microbial Ecology 42 (3), 395-406
Moeseneder, M. M., Arrieta, J. M., Muyzer, G., Winter, C. and Herndl, G. J. (1999). Optimization ofterminal-restriction fragment length polymorphism analysis for complex marine bacterioplanktoncommunities and comparison with denaturing gradient gel electrophoresis. Applied &Environmental Microbiology 65 (8), 3518-3525
Møller, E. F. and Nielsen, T. G. (2001). Production of bacterial substrate by marine copepods: Effect ofphytoplankton biomass and cell size. Journal of Plankton Research 23 (5), 527-536
Møller, E. F., Thor, P. and Nielsen, T. G. (2003). Production of DOC by Calanus finmarchicus, C-glacialis and C-hyperboreus through sloppy feeding and leakage from fecal pellets. MarineEcology-Progress Series 262 185-191
Montagnes, D. J. S., Poulton, A. J. and Shammon, T. M. (1999). Mesoscale, finescale and microscaledistribution of micro- and nanoplankton in the Irish Sea, with emphasis on ciliates and their prey.Marine Biology 134 (1), 167-179
Moon-van der Staay, S. Y., De Wachter, R. and Vaulot, D. (2001). Oceanic 18S rDNA sequences frompicoplankton reveal unsuspected eukaryotic diversity. Nature 409 (6820), 607-610
Moon-van der Staay, S. Y., van der Staay, G. W. M., Guillou, L., Vaulot, D., Claustre, H. and Medlin, L.K. (2000). Abundance and diversity of prymnesiophytes in the picoplankton community from theequatorial Pacific Ocean inferred from 18S rDNA sequences. Limnology and Oceanography 45(1), 98-109
Moore, L. R., Post, A. F., Rocap, G. and Chisholm, S. W. (2002). Utilization of different nitrogensources by the marine cyanobacteria Prochlorococcus and Synechococcus. Limnology andOceanography 47 (4), 989-996
Morris, R. M., Rappe, M. S., Connon, S. A., Vergin, K. L., Siebold, W. A., Carlson, C. A. andGiovannoni, S. J. (2002). SAR11 clade dominates ocean surface bacterioplankton communities.Nature 420 (6917), 806-810
Müller, H., Schöne, A., Pinto Coelho, R. M., Schweizer, A. and Weisse, T. (1991). Seasonalsuccession of ciliates in Lake Constance. Microbial Ecology 21 (2), 119-138
Murray, A. E., Preston, C. M., Massana, R., Taylor, L. T., Blakis, A., Wu, K. and DeLong, E. F. (1998).Seasonal and spatial variability of bacterial and archaeal assemblages in the coastal waters nearAnvers Island, Antarctica. Applied and Environmental Microbiology 64 (7), 2585-2595
Muylaert, K., Van der Gucht, K., Vloemans, N., De Meester, L., Gillis, M. and Vyverman, W. (2002).Relationship between bacterial community composition and bottom-up versus top-down variablesin four eutrophic shallow lakes. Applied & Environmental Microbiology 68 (10), 4740-4750
Muyzer, G., Brinkhoff, T., Nübel, U., Santegoeds, C., Schäfer, H. and Wawer, C. (1998). Denaturinggradient gel electrophoresis (DGGE) in microbial ecology. Molecular Microbial Ecology Manual3.4.4 1-17
Muyzer, G., de Waal, E. C. and Uitterlinden, A. G. (1993). Profiling of complex microbial populationsby denaturing gradient gel electrophoresis analysis of polymerase chain reaction-amplified genescoding for 16S rRNA. Applied and Environmental Microbiology 59 695-700
Muyzer, G. and Smalla, K. (1998). Application of denaturing gradient gel electrophoresis (DGGE) andtemperature gradient gel electrophoresis (TGGE) in microbial ecology. Antonie van LeeuwenhoekInternational Journal of General & Molecular Microbiology 73 (1), 127-141
Nagata, T. (2000). Production mechanisms of Dissolved Organic Matter. In: Microbial Ecology of theOceans (Ed D.L. Kirchman). Jon Wiley & Sons, Inc. 121-152
Nakamura, Y., Suzuki, K., Suzuki, S. and Hiromi, J. (1997). Production of Oikopleura dioica(Appendicularia) following a picoplankton 'bloom' in a eutrophic coastal area. Journal of PlanktonResearch 19 (1), 113-124
Nee, S. (2003). Unveiling prokaryotic diversity. Trends in Ecology & Evolution 18 (2), 62-63Nübel, U., Garcia-Pichel, F., Kühl, M. and Muyzer, G. (1999). Quantifying microbial diversity:
Morphotypes, 16S rRNA genes, and carotenoids of oxygenic phototrophs in microbial mats.Applied & Environmental Microbiology 65 (2), 422-430
Ohman, M. D. and Hirche, H. J. (2001). Density-dependent mortality in an oceanic copepodpopulation. Nature 412 (6847), 638-641
Olsen, L. M., Reinertsen, H. and Vadstein, O. (2002). Can phosphorus limitation inhibit dissolvedorganic carbon consumption in aquatic microbial food webs? A study of three food web structuresin microcosms. Microbial Ecology 43 (3), 353-366
Ouverney, C. C. F., Jed A. (1999). Combined Microautoradiography - 16S rRNA Probe Technique forDetermination of Radioisotope Uptake by Specific Microbial Cell Types In Situ. Applied andEnvironmental Microbiology 65 (4), 1746-1752.

REFERENCES
143
Øvreås, L. (2000). Population and community level approaches for analysing microbial diversity innatural environments. Ecology Letters 3 (3), 236-251
Øvreås, L., Bourne, D., Sandaa, R. A., Casamayor, E. O., Benlloch, S., Goddard, V., Smerdon, G.,Heldal, M. and Thingstad, T. F. (2003). Response of bacterial and viral communities to nutrientmanipulations in seawater mesocosms. Aquatic Microbial Ecology 31 (2), 109-121
Pace, M. L. and Cole, J. J. (1994). Comparative and Experimental Approaches to Top-Down andBottom-Up Regulation of Bacteria. Microbial Ecology 28 181-193
Pace, M. L. and Cole, J. J. (1996). Regulation of bacteria by resources and predation tested in whole-lake experiments. Limnology & Oceanography 41 (7), 1448-1460
Pace, M. L., Cole, J. J., Carpenter, S. R. and Kitchell, J. F. (1999). Trophic cascades revealed indiverse ecosystems. Trends in Ecology & Evolution 14 (12), 483-488
Pace, M. L. and Vaqué, D. (1994). The importance of Daphnia in determining mortality rates ofprotozoans and rotifers in lakes. Limnology and Oceanography 39 (5), 985-996
Pace, M. L. F., Elizabeth (1991). Regulation of planktonic microbial communities by nutrients andherbivores. Ecology 72 (3), 904-914
Pace, M. L. M., George B.; Findlay, Stuart E.G. (1990). Planktonic community structure determines thefate of bacterial production in a temperate lake. Limnology and Oceanography 35 (4), 795-808
Paine, R. T. (1980). Food web linkage, interaction strength and community infrastructure. Journal ofAnimal Ecology 49 667-685
Patterson, D. J. and Lee, W. J. (2000). Geographic distribution and diversity of free-living heterotrophicflagellates. In: Leadbeater, B.S.C. & Green, J.C.: The Flagellates: Unity, diversity and evolution(Systematics Association Special Volumes), pp. 239-268
Paul, J. and Myers, B. (1982). Fluorometric determination of DNA in aquatic microorganisms by use ofHoechst 33258. Applied & Environmental Microbiology 43 1393-1399
Pernthaler, J., Alfreider, A., Posch, T., Andreatta, S. and Psenner, R. (1997a). In situ classification andimage cytometry of pelagic bacteria from a high mountain lake (Gossenköllesee, Austria). Applied& Environmental Microbiology 63 (12), 4778-4783
Pernthaler, J., Glockner, F. O., Schonhuber, W. and Amann, R. (2001). Fluorescence in situhybridization (FISH) with rRNA-targeted oligonucleotide probes. Methods in Microbiology, Vol 30,Academic Press, San Diego 30 207-226
Pernthaler, J., Glöckner, F. O., Unterholzner, S., Alfreider, A., Psenner, R. and Amann, R. (1998).Seasonal community and population dynamics of pelagic bacteria and archaea in a high mountainlake. Applied & Environmental Microbiology 64 (11), 4299-4306
Pernthaler, J., Posch, T., Simek, K., Vrba, J., Amann, R. and Psenner, R. (1997b). Contrastingbacterial strategies to coexist with a flagellate predator in an experimental microbial assemblage.Applied and Environmental Microbiology 63 (2), 596-601
Pernthaler, J., Sattler, B., Simek, K., Schwarzenbacher, A. and Psenner, R. (1996). Top-down effectson the size-biomass distribution of a freshwater bacterioplankton community. Aquatic MicrobialEcology 10 (3), 255-263
Pernthaler, J., Zöllner, E., Warnecke, F. and Jürgens, K. (2004). A bloom of filamentous bacteria in amesotrophic lake: identity and potential controlling mechanism. submitted to Applied andEnvironmental Microbiology
Persson, L. (1999). Trophic cascades: abiding heterogeneity and the trophic level concept at the endof the road. Oikos 85 385-397
Pierce, R. W. and Turner, J. T. (1992). Ecology of planktonic ciliates in marine food webs. Reviews inAquatic Sciences 6 (2), 139-181
Pinhassi, J., Azam, F., Hemphala, J., Long, R. A., Martinez, J., Zweifel, U. L. and Hagström, A. (1999).Coupling between bacterioplankton species composition, population dynamics, and organic matterdegradation. Aquatic Microbial Ecology 17 (1), 13-26.
Pinhassi, J. and Hagström, A. (2000). Seasonal succession in marine bacterioplankton. AquaticMicrobial Ecology 21 (3), 245-256
Polis, G. A. (1999). Why are parts of the world green? Multiple factors control productivity and thedistribution of biomass. Oikos 86 (1), 3-15
Pomeroy, L. R. (1974). The ocean´s food web, a changing paradigm. Bioscience 9 499-504Posch, T., Jezbera, J., Vrba, J., Simek, K., Pernthaler, J., Andreatta, S. and Sonntag, B. (2001). Size
selective feeding in Cyclidium glaucoma (Ciliophora, Scuticociliatida) and its effects on bacterialcommunity structure: A study from a continuous cultivation system. Microbial Ecology 42 (3), 217-227
Posch, T., Simek, K., Vrba, J., Pernthaler, J., Nedoma, J., Sattler, B., Sonntag, B. and Psenner, R.(1999). Predator-induced changes of bacterial size-structure and productivity studied on anexperimental microbial community. Aquatic Microbial Ecology 18 235-246.
REFERENCES
144
Power, M. E. (1992). Top-down and bottom-up forces in food webs do plants have primacy? Ecology73 (3), 733-746
Rappé, M. S., Connon, S. A., Vergin, K. L. and Giovannoni, S. J. (2002). Cultivation of the ubiquitousSAR11 marine bacterioplankton clade. Nature 418 (6898), 630-633
Rappé, M. S. and Giovannoni, S. J. (2003). The uncultured microbial majority. Annual Review ofMicrobiology 57 369-394
Rappé, M. S., Vergin, K. and Giovannoni, S. J. (2000). Phylogenetic comparisons of a coastalbacterioplankton community with its counterparts in open ocean and freshwater systems. FemsMicrobiology Ecology 33 (3), 219-232
Reid, P. C., Turley, C. M. and Burkill, P. H. (1991). Protozoa and their role in marine processes.Springer Verlag, Heidelberg [NATO ASI 25 Ser G: Ecol Sciences])
Riemann, B. (1985). Potential importance of fish predation and zooplankton grazing on naturalpopulations of freshwater bacteria. Applied & Environmental Microbiology 50 (2), 187-193
Riemann, B. and Christoffersen, K. (1993). Microbial trophodynamics in temperate lakes. MarineMicrobial Food Webs 7 (1), 69-100
Riemann, L. and Middelboe, M. (2002). Stability of bacterial and viral community compositions inDanish coastal waters as depicted by DNA fingerprinting techniques. Aquatic Microbial Ecology 27(3), 219-232
Riemann, L., Steward, G. F., Fandino, L. B., Campbell, L., Landry, M. R. and Azam, F. (1999).Bacterial community composition during two consecutive NE Monsoon periods in the Arabian Seastudied by denaturing gradient gel electrophoresis (DGGE) of rRNA genes. Deep-Sea ResearchPart Ii-Topical Studies in Oceanography 46 (8-9), 1791-1811
Rivkin, R. B. and Legendre, L. (2001). Biogenic carbon cycling in the upper ocean: Effects of microbialrespiration. Science 291 (5512), 2398-2400
Saage, A. (2003). Populationsentwicklungen des Zooplankton in Mesokosmosexperimenten.Diplomarbeit Christian-Albrechts-Universität, Kiel, Germany
Samuelsson, K. (2003). Mechanisms structuring the pelagic microbial food web. Dissertation, Umeå Samuelsson, K., Berglund, J., Haecky, P. and Andersson, A. (2002). Structural changes in an aquatic
microbial food web caused by inorganic nutrient addition. Aquatic Microbial Ecology 29 (1), 29-38Sanders, R. W. and Wickham, S. A. (1993). Planktonic protozoa and metazoa: Predation, food quality
and population control. Marine Microbial Food Webs 7 (2), 197-223Sanders, R. W. C., David A.; Berninger, Ulrike-G. (1992). Relationships between bacteria and
heterotrophic nanoplankton in marine and fresh waters: an inter-ecosystem comparison. MarineEcology Progress Series 86 1-14
Sarnelle, O. (1993). Herbivore effects on phytoplankton succession in a eutrophic lake. EcologicalMonographs 63 129-149
Sarnelle, O. (1997). Daphnia effects on microzooplankton: Comparisons of enclosure and whole-lakeresponses. Ecology 78 (3), 913-928
Schäfer, H., Bernard, L., Courties, C., Lebaron, P., Servais, P., Pukall, R., Stackebrandt, E.,Troussellier, M., Guindulain, T., Vives-Rego, J. and Muyzer, G. (2001). Microbial communitydynamics in Mediterranean nutrient-enriched seawater mesocosms: changes in the geneticdiversity of bacterial populations. Fems Microbiology Ecology 34 (3), 243-253
Schauer, M., Balague, V., Pedros-Alio, C. and Massana, R. (2003). Seasonal changes in thetaxonomic composition of bacterioplankton in a coastal oligotrophic system. Aquatic MicrobialEcology 31 (2), 163-174
Schauer, M., Massana, R. and Pedros-Alio, C. (2000). Spatial differences in bacterioplanktoncomposition along the Catalan coast (NW Mediterranean) assessed by molecular fingerprinting.Fems Microbiology Ecology 33 (1), 51-59.
Scheffer, M., Rinaldi, S., Huisman, J. and Weissing, F. J. (2003). Why plankton communities have noequilibrium: solutions to the paradox. Hydrobiologia 491 (1-3), 9-18
Schwieger, F. and Tebbe, C. C. (1998). A new approach to utilize PCR-single-strand-conformationpolymorphism for 16s rRNA gene-based microbial community analysis. Applied and EnvironmentalMicrobiology 64 (12), 4870-4876
Selje, N., Simon, M. and Brinkhoff, T. (2004). A newly discovered Roseobacter cluster in temperateand polar oceans. Nature 427 (6973), 445-448
Setälä, O. and Kivi, K. (2003). Planktonic ciliates in the Baltic Sea in summer: distribution, speciesassociation and estimated grazing impact. Aquatic Microbial Ecology 32 (3), 287-297
Shannon, C. E. (1948). A Mathematical Theory of Communication. Bell System Technical Journal 27(3), 379-423
Sherr, B. F., del Giorgio, P. and Sherr, E. B. (1999). Estimating abundance and single-cellcharacteristics of respiring bacteria via the redox dye CTC. Aquatic Microbial Ecology 18 (2), 117-131.

REFERENCES
145
Sherr, B. F., Sherr, E. B. and Fallon, R. D. (1987). Use of monodispersed fluorescently labeledbacteria to estimate in situ protozoan bacterivory. Applied & Environmental Microbiology 53 (5),958-965
Sherr, E. B. and Sherr, B. F. (1987). High rates of consumption of bacteria by pelagic ciliates. Nature325 (6106), 710-711
Sherr, E. B. and Sherr, B. F. (1996). Temporal offset in oceanic production and respiration processesimplied by seasonal changes in atmospheric oxygen - the role of heterotrophic microbes. AquaticMicrobial Ecology 11 (1), 91-100
Sherr, E. B. and Sherr, B. F. (2002). Significance of predation by protists in aquatic microbial foodwebs. Antonie van Leeuwenhoek International Journal of General & Molecular Microbiology 81 (1-4), 293-308
Shikano, S., Luckinbill, L. S. and Kurihara, Y. (1990). Changes of traits in a bacterial populationassociated with protozoan predation. Microbial Ecology 20 75-84
Shurin, J. B., Borer, E. T., Seabloom, E. W., Anderson, K., Blanchette, C. A., Broitman, B., Cooper,S.D. and Halpern, B. S. (2002). A cross-ecosystem comparison of the strength of trophiccascades. Ecology Letters 5 (6), 785-791
Sieracki, M. E., Cucci, T. L. and Nicinski, J. (1999). Flow cytometric analysis of 5-cyano-2,3-ditolyltetrazolium chloride activity of marine bacterioplankton in dilution cultures. Applied &Environmental Microbiology 65 (6), 2409-2417
Sime-Ngando, T. (1997). Viruses in aquatic ecosystems - a review. Annee Biologique 36 (3), 181-210Šimek, K. and Chrzanowski, T. H. (1992). Direct and indirect evidence of size-selective grazing on
pelagic bacteria by freshwater nanoflagellates. Applied & Environmental Microbiology 58 (11),3715-3720
Šimek, K., Jurgens, K., Nedoma, J., Comerma, M. and Armengol, J. (2000). Ecological role andbacterial grazing of Halteria spp.: small freshwater oligotrichs as dominant pelagic ciliatebacterivores. Aquatic Microbial Ecology 22 (1), 43-56
Šimek, K., Kojecka, P., Nedoma, J., Hartman, P., Vrba, J. and Dolan, J. R. (1999). Shifts in bacterialcommunity composition associated with different microzooplankton size fractions in a eutrophicreservoir. Limnology and Oceanography 44 (7), 1634-1644
Šimek, K., Nedoma, J., Pernthaler, J., Posch, T. and Dolan, J. R. (2002). Altering the balancebetweenbacterial production and protistan bacterivory triggers shifts in freshwater bacterialcommunity composition. Antonie Van Leeuwenhoek International Journal of General andMolecular Microbiology 81 (1-4), 453-463
Šimek, K., Pernthaler, J., Weinbauer, M. G., Hornak, K., Dolan, J. R., Nedoma, J., Masin, M. andAmann, R. (2001). Changes in bacterial community composition and dynamics and viral mortalityrates associated with enhanced flagellate grazing in a mesoeutrophic reservoir. Applied andEnvironmental Microbiology 67 (6), 2723-2733
Šimek, K., Vrba, J., Pernthaler, J., Posch, T., Hartman, P., Nedoma, J. and Psenner, R. (1997).Morphological and compositional shifts in an experimental bacterial community influenced byprotists with contrasting feeding modes. Applied and Environmental Microbiology 63 (2), 587-595
Sipura, J., Lores, E, Snyder, R.A. (2003). Effect of copepods on estuarine microbial plankton in short-term microcosms. Aquatic Microbial Ecology Vol. 33: 181–190
Smith, E. M. (1998). Coherence of microbial respiration rate and cell-specific bacterial activity in acoastal planktonic community. Aquatic Microbial Ecology 16 (1), 27-35
Smith, E. M. and Prairie, Y. T. (2004). Bacterial metabolism and growth efficiency in lakes:Theimportance of phosphorus availability. Limnology and Oceanography 49 (1), 137-147
Smits, J. D. and Riemann, B. (1988). Calculation of cell production from tritiated thymidineincorporation with freshwater bacteria. Applied & Environmental Microbiology 54 (9), 2213-2219
Sommaruga, R., Krossbacher, M., Salvenmoser, W., Catalan, J. and Psenner, R. (1995). Presence oflarge virus-like particles in a eutrophic reservoir. Aquatic Microbial Ecology 9 (3), 305-308
Sommaruga, R. and Psenner, R. (1995). Permanent presence of grazing-resistant bacteria in ahypertrophic Lake. Applied & Environmental Microbiology 61 (9), 3457-3459
Sommer, F. (2003). A comparison of the impact of major mesozooplankton taxa on marine, brackishand freshwater phytoplankton during summer. Ph.D. Thesis, University of Kiel
Sommer, F., Hansen, T., Feuchtmayr, H., Santer, B., Tokle, N. and Sommer, U. (2003a). Do calanoidcopepods suppress appendicularians in the coastal ocean? Journal of Plankton Research 25 (7),869-871
Sommer, F., Santer, B., Jamieson, C., Hansen, T. and Sommer, U. (2003b). Daphnia populationgrowth but not moulting is a substantial phosphorus drain for phytoplankton. Freshwater Biology48 (1), 67-74
REFERENCES
146
Sommer, U., Sommer, F., Santer, B., Jamieson, C., Boersma, M., Becker, C. and Hansen, T. (2001).Complementary impact of copepods and cladocerans on phytoplankton. Ecology Letters 4 (6),545-550
Sommer, U., Sommer, F., Santer, B., Zöllner, E., Jürgens, K., Jamieson, C., Boersma, M. and Gocke,K. (2003b). Daphnia versus copepod impact on summer phytoplankton: functional compensationat both trophic levels. Oecologia 135 (4), 639-647
Sommer, U. and Stibor, H. (2002). Copepoda-Cladocera-Tunicata: The role of three majormesozooplankton groups in pelagic food webs. Ecological Research 17 (2), 161-174
Staley, J. T. and Konopka, A. (1985). Measurement of Insitu Activities of Non-photosyntheticMicroorganisms in Aquatic and Terrestrial Habitats. Annual Review of Microbiology 39 321-346
Stepanauskas, R., Moran, M. A., Bergamaschi, B. A. and Hollibaugh, J. T. (2003). Covariance ofbacterioplankton composition and environmental variables in a temperate delta system. AquaticMicrobial Ecology 31 (1), 85-98
Sterner, R. W., Elser, J. J., Fee, E. J., Guildford, S. J. and Chrzanowski, T. H. (1997). The light:nutrientratio in lakes: The balance of energy and materials affects ecosystem structure and process.American Naturalist 150 (6), 663-684
Stibor, H. and Sommer, U. (2003). Mixotrophy of a photosynthetic flagellate viewed from an optimalforaging perspective. Protist 154 (1), 91-98
Stoecker, D. K. and Capuzzo, J. M. (1990). Predation on protozoa its importance to zooplankton.Journal of Plankton Research 12 (5), 891-908
Strong, D. (1992). Are trophic cascades all wet? Differentiation and donor-control in specioseecosystems. Ecology 73 747-754
Suttle, C. A. and Chan, A. M. (1993). Marine cyanophages infecting oceanic and coastal strains ofSynechococcus: Abundance, morphology, cross-infectivity and growth characteristics. MarineEcology Progress Series 92 (1-2), 99-109
Suzuki, M. T. and Giovannoni, S. J. (1996). Bias caused by template annealing in the amplification ofmixtures of 16s rRna genes by PCR. Applied & Environmental Microbiology 62 (2), 625-630
Tessier, A. J. and Woodruff, P. (2002). Cryptic trophic cascade along a gradient of lake size. Ecology83 (5), 1263-1270
Thingstad, T. F. (2000a). Control of Bacterial Growth in Idealized Food Webs. In: Microbial Ecology ofthe Oceans (Ed D.L. Kirchman). Jon Wiley & Sons, Inc.
Thingstad, T. F. (2000b). Elements of a theory for the mechanisms controlling abundance, diversity,and biogeochemical role of lytic bacterial viruses in aquatic systems. Limnology andOceanography 45 (6), 1320-1328
Thingstad, T. F., Heldal, M., Bratbak, G. and Dundas, I. (1993a). Are Viruses Important Partners inPelagic Food Webs. Trends in Ecology & Evolution 8 (6), 209-213
Thingstad, T. F. and Lignell, R. (1997). Theoretical models for the control of bacterial growth rate,abundance, diversity and carbon demand. Aquatic Microbial Ecology 13 (1), 19-27
Thingstad, T. F., Skjoldal, E. F. and Bohne, R. A. (1993b). Phosphorus Cycling and Algal-BacterialCompetition in Sandsfjord, Western Norway. Marine Ecology-Progress Series 99 (3), 239-259
Tiedje, J. M., Asuming-Brempong, S., Nusslein, K., Marsh, T. L. and Flynn, S. J. (1999). Opening theblack box of soil microbial diversity. Applied Soil Ecology 13 (2), 109-122
Ting, C. S., Rocap, G., King, J. and Chisholm, S. W. (2002). Cyanobacterial photosynthesis in theoceans: the origins and significance of divergent light-harvesting strategies. Trends in Microbiology10 (3), 134-142
Tiselius, P. and Jonsson, P. R. (1990). Foraging behavior of six calanoid copepods observations andhydrodynamic analysis. Marine Ecology-Progress Series 66 (1-2), 23-34.
Torrella, F. and Morita, R. (1981). Microcultural study of bacteria size changes and microcolony andultramicrocolony formation by heterotrophic bacteria in seawater. Applied and EnvironmentalMicrobiology 41 518-527
Torsvik, V., Ovreas, L. and Thingstad, T. F. (2002). Prokaryotic diversity - Magnitude, dynamics, andcontrolling factors. Science 296 (5570), 1064-1066
Tuomi, P., Fagerbakke, K. M., Bratbak, G. and Heldal, M. (1995). Nutritional enrichment of a microbialcommunity - the effects on activity, elemental composition, community structure and virusproduction. Fems Microbiology Ecology 16 (2), 123-134
Tuomi, P. and Kuuppo, P. (1999). Viral lysis and grazing loss of bacteria in nutrient- and carbon-manipulated brackish water enclosures. Journal of Plankton Research 21 (5), 923-937
Urban, J. L., McKenzie, C. H. and Deibel, D. (1992). Seasonal Differences in the Content ofOikopleura-Vanhoeffeni and Calanus-Finmarchicus Fecal Pellets - Illustrations of ZooplanktonFood Web Shifts in Coastal Newfoundland Waters. Marine Ecology-Progress Series 84 (3), 255-264.
REFERENCES
147
Vadstein, O. and al., e. (2003). Is phosphorus limitation of planktonic heterotrophic bacteria andaccumulation of degradable DOC a normal phenomenon in phosphorus-limited systems ? Amicrocosm study. Fems Microbiology Ecology 46 307-316
van Hannen Erik, J., Van Agterveld Miranda, P., Gons Herman, J. and Laanbroek Hendrikus, J.(1998). Revealing genetic diversity of eukaryotic microorganisms in aquatic environments bydenaturing gradient gel electrophoresis. Journal of Phycology 34 (2), 206-213
Vanni, M. J. and Temte, J. (1990). Seasonal patterns of grazing and nutrient limitation ofphytoplankton in a eutrophic lake. Limnology & Oceanography 35 697-709
Vaqué, D. and Pace, M. L. (1992). Grazing on bacteria by flagellates and cladocerans in lakes ofcontrasting food-web structure. Journal of Plankton Research 14 (2), 307-321
Vargas, C. and Gonzalez, H. E. (2004a). Plankton community structure and carbon cycling in a coastalupwelling system. I. Bacteria, microprotozoans and phytoplankton in the diet of copepods andappendicularians. Aquatic Microbial Ecology Vol. 34: 151–164
Vargas, C. and Gonzalez, H. E. (2004b). Plankton community structure and carbon cycling in a coastalupwelling system. II. Microheterotrophic pathway. Aquatic Microbial Ecology Vol. 34 165–180
Vargas, C. A., Tonnesson, K., Sell, A., Maar, M., Moller, E. F., Zervoudaki, T., Giannakourou, A.,Christou, E., Satapoomin, S., Petersen, J. K., Nielsen, T. G. and Tiselius, P. (2002). Importance ofcopepods versus appendicularians in vertical carbon fluxes in a Swedish fjord. Marine Ecology-Progress Series 241 125-138
Verity, P. G. and Smetacek, V. (1996). Organism life cycles, predation, and the structure of marinepelagic ecosystems. Marine Ecology-Progress Series 130 (1-3), 277-293
Von Wintzingerode, F., Göbel, U. B. and Stackebrandt, E. (1997). Determination of microbial diversityin environmental samples - pitfalls of PCR-based rRNA analysis. Fems Microbiology Reviews 21(3), 213-229
Vörös, L., Callieri, C., K, V. B. and Bertoni, R. (1998). Freshwater picocyanobacteria along a trophicgradient and light quality range. Hydrobiologia 369-370 (0), 117-125
Vrba, J., Nedoma, J., Kohout, L. and al., e. (2003). Massive occurrence of heterotrophic filaments inacidified lakes: seasonal dynamics and composition. Fems Microbiology Ecology 46 281-294
Weinbauer, M. G. and Höfle, M. G. (1998). Significance of viral lysis and flagellate grazing as factorscontrolling bacterioplankton production in a eutrophic lake. Applied & Environmental Microbiology64 (2), 431-438
Weisse, T. (1997). Growth and production of heterotrophic nanoflagellates in a meso-eutrophic lake.Journal of Plankton Research 19 703-722
Weisse, T. (2002). The significance of inter- and intraspecific variation in bacterivorous andherbivorous protists. Antonie van Leeuwenhoek International Journal of General & MolecularMicrobiology 81 (1-4), 327-341
Weisse, T. and Frahm, A. (2002). Direct and indirect impact of two common rotifer species (Keratellaspp.) on two abundant ciliate species (Urotricha furcata, Balanion planctonicum). FreshwaterBiology 47 (1), 53-64
Whitman, W. B., Coleman, D. C. and Wiebe, W. J. (1998). Prokaryotes: The unseen majority.Proceedings of the National Academy of Sciences of the United States of America 95 (12), 6578-6583
Wiackowski, K., Brett, M. T. and Goldman, C. R. (1994). Differential effects of zooplankton species onciliate community structure. Limnology & Oceanography 39 (3), 486-492
Wickham, S. A. (1995). Trophic Relations between Cyclopoid Copepods and Ciliated Protists -Complex Interactions Link the Microbial and Classic Food Webs. Limnology and Oceanography 40(6), 1173-1181.
Wickham, S. A. (1998). The direct and indirect impact of Daphnia and Cyclops on a freshwatermicrobial food web. Journal of Plankton Research 20 (4), 739-755
Woese, C. (1987). Bacterial evolution. Microbiol. Rev. 51 221-271Wommack, K. E., Ravel, J., Hill, R. T., Chun, J. S. and Colwell, R. R. (1999). Population dynamics of
Chesapeake bay virioplankton: Total-community analysis by pulsed-field gel electrophoresis.Applied & Environmental Microbiology 65 (1), 231-240
Wu, Q. L., Boenigk, J. and Hahn, M. W. (2004). Successful Predation of Filamentous Bacteria by aNanoflagellate Challenges Current Models of Flagellate Bacterivory Applied & EnvironmentalMicrobiology 70 (1), 332-339
Yin, B., Crowley, D., Sparovek, G., De Melo, W. J. and Borneman, J. (2000). Bacterial functionalredundancy along a soil reclamation gradient. Applied and Environmental Microbiology 66 (10),4361-4365
Yoshida, T., Gurung, T. B., Kagami, M. and Urabe, J. (2001). Contrasting effects of a cladoceran(Daphnia galeata) and a calanoid copepod (Eodiaptomus japonicus) on algal and microbialplankton in a Japanese lake, Lake Biwa. Oecologia 129 (4), 602-610
REFERENCES
148
Yu, Z. T. and Mohn, W. W. (2001). Bacterial diversity and community structure in an aerated lagoonrevealed by ribosomal intergenic spacer analyses and 16S ribosomal DNA sequencing. Applied &Environmental Microbiology 67 (4), 1565-1574
Zöllner, E., Santer, B., Boersma, M., Hoppe, H. G. and Jürgens, K. (2003). Cascading predationeffects of Daphnia and copepods on microbial food web components. Freshwater Biology 48 (12),2174-2193
Zubkov, M. V., Fuchs, B. M., Archer, S. D., Kiene, R. P., Amann, R. and Burkill, P. H. (2001). Linkingthe composition of bacterioplankton to rapid turnover of dissolved dimethylsulphoniopropionate inan algal bloom in the North Sea. Environmental Microbiology 3 (5), 304-311
Zubkov, M. V., Fuchs, B. M., Tarran, G. A., Burkill, P. H. and Amann, R. (2002). Mesoscale distributionof dominant bacterioplankton groups in the northern North Sea in early summer. Aquatic MicrobialEcology 29 (2), 135-144
Zubkov, M. V. and Lopez-Urrutia, A. (2003). Effect of appendicularians and copepods onbacterioplankton composition and growth in the English Channel. Aquatic Microbial Ecology 32(1), 39-46
Zubkov, M. V., Sleigh, M. A., Burkill, P. H. and Leakey, R. J. G. (2000). Bacterial growth and grazingloss in contrasting areas of North and South Atlantic. Journal of Plankton Research 22 (4), 685-711
Zwart, G., Crump, B. C., Agterveld, M. P. K.-v., Hagen, F. and Han, S. K. (2002). Typical freshwaterbacteria: an analysis of available 16S rRNA gene sequences from plankton of lakes and rivers.Aquatic Microbial Ecology 28 (2), 141-155
Zwart, G., Hiorns, W. D., Methe, B. A., Van Agterveld, M. P., Huismans, R., Nold, S. C., Zehr, J. P.and Laanbroek, H. J. (1998). Nearly identical 16S rRNA sequences recovered from lakes in NorthAmerica and Europe indicate the existence of clades of globally distributed freshwater bacteria.Systematic and Applied Microbiology 21 (4), 546-596
DANKSAGUNG - ACKNOWLEDGEMENTS
149
DANKSAGUNG - ACKNOWLEDGEMENTSEine Reihe von Personen und Institutionen haben mich in unterschiedlicher Weise unterstützt und damit direktoder indirekt zum Gelingen dieser Doktorarbeit beigetragen. Ihnen allen gilt mein herzlicher Dank.
An erster Stelle möchte ich Prof. Klaus Jürgens sehr herzlich für die Betreuung dieser Doktorarbeit danken,für inspirierende Diskussionen, die freundschaftliche Arbeitsatmosphäre sowie die Freiheit, die er mir bei derBearbeitung des Themas gelassen hat. Das inspirierende Umfeld seiner Arbeitsgruppe „mikrobielle Ökologie“(insbesondere in deren goldenen Zeiten mit bis zu 11 Leuten im Labor), seine Unterstützung im Hinblick aufTagungsbesuche und des Forschungsaufenthaltes in Barcelona und die Tatsache, dass er trotz seines Wechselszum IOW Warnemünde und eines zeitraubenden neuen Tätigkeitsfeldes immer Zeit für seinen „alten“Doktoranden gefunden hat, haben sehr zum Gelingen dieser Arbeit beigetragen.
Vielen Dank auch an Prof. Winfried Lampert für die Möglichkeit, im MPI für Limnologie diese Doktorarbeitanzufertigen und die finanzielle Unterstützung von Tagungsbesuchen. Die exzellenten Arbeitsbedingungen unddie Förderung der materialaufwendigen Mesokosmos-Experimente und molekularen Methoden haben die Arbeitin dieser Form erst ermöglicht.
Weiterhin gilt ein herzlicher Dank allen Mitgliedern des Mesokosmos-Teams, allen voran dem ProjektleiterProf. Ulrich Sommer und meinen Mitdoktorand(inn)en Heidrun Feuchtmayr, Claes Becker, Daniela Brepohl undFrank Sommer. Ich danke Euch für die gute Zusammenarbeit und die nette Atmosphäre während der Enclosure-Experimente und besonders der Norwegenaufenthalte. Zusammen haben wir über 150 Mesokosmen gebaut undgefüllt sowie unzählige „grosse und kleine Probennahmen“ bei Wind und Wetter durchgestanden. An Heidrunund Frank an dieser Stelle nochmal ein Dankeschön für ihren Einsatz bei der logistischen Abwicklung derNorwegen-Expeditionen.
Einen ganz lieben Dank an meine „Norwegen-Hiwi“ Jennifer Netzer für ihre unermüdliche Hilfe im Labor undihre ansteckend gute Laune, auch zu ungewöhnlichen Arbeitszeiten.
Ein herzlicher Dank gilt auch Thomas Hansen für die humorvollen Zeiten während der Experimente und desStationslebens, für die exzellente Nährstoff-Analytik und natürlich die „Trucker-Romantik“ während dergemeinsamen LKW-Fahrten nach Norwegen.
Maarten Boersma, Barbara Santer, Prof. Hans-Georg Hoppe, Andrea Saage und Klaus Gocke danke ichaußer für die Zusammenarbeit auch für wertvolle Kommentare zu Manuskripten und Statistik (Maarten) und dieBereitstellung von Rohdaten (Barbara, Andrea, Herr Hoppe). Vielen Dank auch an Jakob Pernthaler (MPIBremen) für die nette Kooperation und die Bereitstellung von Daten.
Sehr herzlich danken möchte meinem ehemaligen Bürogenossen, Freund und jetzigem WahlaustralierCarsten Matz für die stets heitere Stimmung in Büro 018a und interessante, nicht nur mikrobendominierteGespäche. Vielen Dank auch an die anderen Mitglieder der alten und neuen Arbeitsgruppe, Peter Deines,Gundula Eller, Gianluca Corno und Merle Hanke sowie alle anderen, die mich mit Tips, Diskussionen undAufmunterungen durch meine Doktorandenzeit in Plön begleitet haben.
Herzlich danken möchte ich ansonsten auch allen, die bei der erfolgreichen Durchführung derProbennahmen mitgewirkt und zur guten Arbeitsatmosphäre im „Feld“ und im Labor beigetragen haben. In Plönwaren das vor allem Cornelia Burghardt, Heike Paul-Wardenga, Ines Schultz, Regine Koppe (IfM), Ilka Dankert,Nadine Ryk, Claudia Schleker, Colleen Jamieson und Sonja Dembeck. Während der Norwegenexperimentehalfen zudem Friederike Funke und Jette Dröse (Sommer) sowie Julia Wohlers und Kerstin Maczassek(Frühjahr).
For interesting and instructive discussions and their hospitality during my stay in Barcelona I would like tothank my friends Ramon Massana and Pep Gasol (both Institut de Ciències del Mar, Barcelona) very much.Many thanks also go to Mike Zubkov (Southampton Oceanography Centre) and Hanne Degans (Laboratory ofAquatic Ecology, Leuven) for inspiration and the nice times during your stays in Plön.
Many thanks also to our Norwegian colleagues Prof. Yngvar Olsen, Andrea Neyts, Nils Tokle, ØysteinLeiknes and „Kro-Jon“ for giving diverse valuable help and support during our stays in Norway. I further wouldlike to acknowledge the support by the Trondheim Marine Systems Research Infrastructure and the EuropeanCommission´s Improving Human Potential Programme (Projekt COMEZOO) through contract HPRI-1999-CT-00060.
Der Deutschen Forschungsgemeinschaft (DFG) sei an dieser Stelle für die finanzielle Unterstützung(Projekte JU 367/4-1, 4-2) dieser Arbeit gedankt. Für weitere finanzielle Förderung dieser Arbeit sowie vonAuslandsaufenthalten danke ich zudem der Max-Planck-Gesellschaft (MPG), dem Consejo Superior deInvestigaciones Científicas (CSIC) und der Dr. Robert-Gedächtnisstiftung.
Nicht zuletzt möchte ich meiner Freundin Julia Wohlers und meiner Familie für Ihre nimmermüde Unterstützungund Aufmunterung sehr herzlich danken.
CURRICULUM VITAE
150
CURRICULUM VITAE
Name: Eckart ZöllnerGeboren: am 30.10.1971 in Kiel, deutsche NationalitätFamilienstand: ledigWohnhaft: Brückenstrasse 13, 24306 Plön
Schulausbildung
• Grundschule Bordesholm 1978 - 1982 • Alexander-von-Humboldt-Gymnasium Neumünster 1982 - 1991 • Abitur 1991
Wehrdienst
• Als Sanitäter und LKW-Fahrer 07/1991-07/1992
Studium
• Biologie (Diplom) an der Christian-Albrechts-
Universität zu Kiel WS 1992/93
• Vordiplom WS 1994/95
• Hauptstudium: Zoologie (Hauptfach) ab WS 1994/95
Nebenfächer Limnologie, Bodenkunde
und Biologische Meereskunde (Zusatzfach)
• Diplomhauptprüfung 06/1998
• Diplomarbeit 07/1998-07/1999„Bodenbiologische Untersuchungen im nordsibirischen Lena-Delta“ im BMBF-Projekt “System Laptev Sea 2000”
• Erlangung des Titels „Diplom-Biologe“ 09/1999
• 1 Semester Fernstudium Umweltingenieurwesen 09/1999-07/2000Gutachtertätigkeit für das Umweltamt NeumünsterForschungsaufenthalte am Max-Planck-Institut für Limnologie
• Promotion am Max-Planck-Institut für Limnologie 08/ 2000-03/2004

ERKLÄRUNG
Erklärung
Hiermit erkläre ich an Eides statt, dass die vorliegende Dissertation, abgesehen von
der Beratung durch meine akademischen Lehrer, nach Inhalt und Form meine eigene
Arbeit ist und ich keine anderen als die angegebenen Quellen und Hilfsmittel
verwendet habe. Des weiteren versichere ich, dass die vorliegende Dissertation
weder ganz noch zum Teil bei einer anderen Stelle im Rahmen eines
Prüfungsverfahrens vorgelegen hat.
Plön, den 17. März 2004 Eckart Zöllner
Teilergebnisse dieser Dissertation wurden bereits wie folgt vorab veröffentlicht bzw.eingereicht:
Veröffentlicht:Kapitel I:• Eckart Zöllner, Barbara Santer, Maarten Boersma, Hans-Georg Hoppe, Klaus Jürgens (2003):
Cascading predation effects of Daphnia and copepods on microbial food web components.FRESHWATER BIOLOGY 48, 2174–2193
Abgeleitete Datensätze von Kapitel I sind enthalten in:• Ulrich Sommer, Frank Sommer, Barbara Santer, Eckart Zöllner, Klaus Jürgens, Colleen
Jamieson, Maarten Boersma, Klaus Gocke (2003): Daphnia versus copepod impact on summerphytoplankton: functional compensation at both trophic levels. OECOLOGIA 135:639-647
Eingereicht:• Teile von Kapitel II wurden eingereicht bei „Applied and Environmental Microbiology“ :
Jakob Pernthaler, Eckart Zöllner, Falck Warnecke and Klaus Jürgens (2004). A bloom offilamentous bacteria in a mesotrophic lake: identity and potential controlling mechanism.
Manuskripte fertig zum Einreichen:(geplante Einreichung im April 2004 bei Marine Ecology Progress Series)
Eckart Zöllner et al.: Mesozooplankton (copepods, appendicularians) impact on microbial food webstructure in a coastal marine system. I. Cascading predation effects on protists and bacteria
Eckart Zöllner et al.: Mesozooplankton (copepods, appendicularians) impact on microbial food webstructure in a coastal marine system. II. Patterns of bacterial community composition and diversity
Plön, den 17. März 2004 Eckart Zöllner