Embed Size (px)
Citation preview

INTERVENTIONS FOR ADOLESCENT
STRUGGLING READERS
A Meta-Analysis with Implications for Practice


Nancy Scammacca, Greg Roberts, Sharon Vaughn, Meaghan Edmonds, Jade WexlerVaughn Gross Center for Reading and Language ArtsThe University of Texas at Austin
Colleen Klein ReutebuchTexas Tech University
Joseph K. TorgesenFlorida Center for Reading ResearchFlorida State University
2007
INTERVENTIONS FOR ADOLESCENT
STRUGGLING READERS
A Meta-Analysis with Implications for Practice

The authors would like to acknowledge thevaluable assistance given in the preparation ofthis document by Jan Dole and Tim Shanahan.
The Center on Instruction is operated by RMC ResearchCorporation in partnership with the Florida Center for ReadingResearch at Florida State University; RG Research Group; theTexas Institute for Measurement, Evaluation, and Statistics atthe University of Houston; and the Vaughn Gross Center forReading and Language Arts at the University of Texas atAustin.
The contents of this document were developed undercooperative agreement S283B050034 with the U.S.Department of Education. However, these contents do notnecessarily represent the policy of the Department ofEducation, and you should not assume endorsement by thefederal government.
The Center on Instruction requests that no changes be made tothe content or appearance of this product.
Preferred citation:Scammacca, N., Roberts, G., Vaughn. S., Edmonds, M., Wexler,J., Reutebuch, C. K., & Torgesen, J. K. (2007), Interventions foradolescent struggling readers: A meta-analysis withimplications for practice. Portsmouth, NH: RMC ResearchCorporation, Center on Instruction.
To download a copy of this document, visit www.centeroninstruction.org.

TABLE OF CONTENTS
1 EXECUTIVE SUMMARY
3 INTRODUCTION
5 RESEARCH QUESTIONS
7 FINDINGS
12 IMPLICATIONS FOR PRACTICE
19 BACKGROUND ON META-ANALYSIS WITHIN SPECIAL EDUCATION
21 METHOD
23 ADDITIONAL RESOURCES
25 REFERENCES
29 TABLE A
32 TABLE B
v


EXECUTIVE SUMMARY
This meta-analysis offers decision-makers research-based guidance forintervening with adolescent struggling readers. Here we outline majorimplications for practice; a more detailed account begins on page 12 and isrepresented in chart form in Table 3, page 15.
Implications for Practice:
1. Adolescence is not too late to intervene. Interventions do benefit olderstudents.
2. Older students with reading difficulties benefit from interventions focusedat both the word and the text level.
3. Older students with reading difficulties benefit from improved knowledgeof word meanings and concepts.
4. Word-study interventions are appropriate for older students struggling atthe word level.
5. Teachers can provide interventions that are associated with positiveeffects.
6. Teaching comprehension strategies to older students with readingdifficulties is beneficial.
7. Older readers’ average gains in reading comprehension are somewhatsmaller than those in other reading and reading-related areas studied.
8. Older students with learning disabilities (LD) benefit from readingintervention when it is appropriately focused.
9. To learn more about instructional conditions that could close the readinggap for struggling readers, we will need studies that provide instructionover longer periods of time and assess outcomes with measures more likethose schools use to monitor reading progress of all students.
1

2

INTRODUCTION
Reading instruction for older students with reading difficulties is a topicincreasingly in need of well-informed support and research-based guidance(Deshler, 2005; Dole, 1996). This report summarizes aspects of recent researchon reading instruction for adolescent struggling readers. It both synthesizesresearch findings to determine the relative effectiveness of interventions forstruggling older readers and outlines the implications of these findings forpractice. Its purpose is to advance the knowledge of technical assistanceproviders working with state departments of education and local educationagencies concerning reading-related issues for students with reading difficultiesand learning disabilities (LD). While our methods and general findings aredescribed, they are presented in terms of their impact on practice and policy.Specific suggestions for implementing these and other research findings areprovided in an accompanying practice brief.
This report is intended primarily for technical assistance providers atRegional Comprehensive Centers for their use in crafting evidence-basedguidance for states and local educational agencies. It is not a comprehensivereview of all aspects of the research on adolescent literacy instruction forstudents with LD. Rather, it addresses three important questions thoroughlyand systematically, based on findings from a set of studies that met establishedinclusion criteria (see page 21). While we value research using single subjectdesigns (SSD), we chose not to include these designs in this synthesis for thesake of brevity and simplicity.
This report is limited to reading interventions at the late elementary, middle,and high school levels and represents one data source for decision-makingabout instruction for older readers with reading difficulties or disabilities. Whileother elements of adolescent literacy, such as writing and oral communicationskills, are critically important for older students with related deficits in theseaspects of literacy, this report does not address them. It is limited to readinginterventions because sufficient literature exists to warrant a meta-analyticsynthesis. We encourage readers to consult other briefs and reports, includingthose available from the Center on Instruction (see box), for additionalinformation related to adolescent reading.
3

These documents are available from the Center on Instruction atwww.centeroninstruction.org.
Academic Literacy Instruction for Adolescents: A Guidance Document
from the Center on Instruction
This document is a resource for reading specialists in RegionalComprehensive Centers throughout the United States as they work withstates to improve educational policy and practice in adolescent reading. Itincludes three major sections: (1) research-based recommendations forimproving academic literacy instruction for students in grades 4-12; (2)responses from experts to questions about methods for improvingacademic reading in adolescents; and (3) examples of state activities insupport of improved adolescent reading.
Adolescent Literacy Resources: An Annotated Bibliography
This array of research summaries and policy documents on reading andreading comprehension for students in grades 4-12, while not exhaustive,includes discussions of all the current important research issues inadolescent literacy and the development of state- and district-level policies to support improvements in adolescent literacy outcomes. It is acompanion piece to the recently released Academic Literacy Instruction forAdolescents: A Guidance Document from the Center on Instruction.
Effective Instruction for Adolescent Struggling Readers:
A Practice Brief
Designed for teachers, principals, and instructional support staff, thisbooklet focuses on effective instructional practices in reading for olderstudents with reading difficulties and disabilities. It includes a discussion ofimportant issues, a description of research-based instructional tips, anddetails on other useful resources related to adolescent reading instruction.(Available Fall 2007)
Effective Instruction for Adolescent Struggling Readers:
Professional Development Module
This professional development package, designed for teachers, principals,instructional support staff, and technical assistance providers, explains the research basis of recommended reading interventions for strugglingadolescents and describes how to implement these interventions. Thepackage includes a PowerPoint presentation, a speaker notes packet, andhandouts. (Available Fall 2007)
Extensive Early Reading Interventions: Implications from Research
This document reports the effects of extensive reading interventions onyounger students struggling to read. It summarizes the methods andresults of studies published between 1995 and 2005 that delivered 100 or more sessions of intervention. Findings are discussed in terms ofinstructional practice and policy. (Available Fall 2007)
4

RESEARCH QUESTIONS
A recent consensus document issued by a group of eminent researchersstates: “Enough is already known about adolescent reading—both the nature of the problems of struggling readers and the types of interventions andapproaches to address these needs—in order to act immediately on a broadscale” (Biancarosa & Snow, 2006, p. 10). There is, indeed, a substantial body ofresearch on instructional methods for adolescent struggling readers. This reportattempts to bring together and synthesize findings from recent research in thisarea as a guide for developing policy and practice at the state, district, school,and classroom levels. It is one tool for addressing the instructional needs ofstruggling adolescent readers “immediately on a broad scale,” as Biancarosaand Snow suggest.
Torgesen et al. (2007) identified six critical factors underlying proficientreading performance at the late elementary, middle, and high school levels.They are:
• Fluency of text reading;
• Vocabulary, or the breadth and depth of knowledge about the meaning ofwords;
• Active and flexible use of reading strategies to enhance comprehension;
• Background, or prior knowledge related to the content of the text beingread;
• Higher level reasoning and thinking skills; and
• Motivation and engagement for understanding and learning from text.
This report focuses on interventions designed to affect fluency of text reading,vocabulary, and students’ use of reading comprehension strategies. It alsoassesses the impact of interventions that target accurate decoding of unfamiliarwords in text in order to increase reading accuracy, referred to here as “wordstudy” interventions. We addressed three primary questions:
1. Overall, how effective are the reading interventions for adolescent
struggling readers that have been examined in research studies?
2. What is the specific impact of these reading interventions on
measures of reading comprehension?
5

3. What is the specific impact of these reading interventions on
students with learning disabilities?
In the analysis related to questions 1 and 2, we investigated three variables thatwere thought to moderate the relative effectiveness of interventions:
a. The type of intervention (fluency, vocabulary, reading comprehensionstrategies, word study, or multiple components of reading instruction);
b. The grade level of students participating in the intervention (middle gradesor high school); and
c. The intervention provider (teacher or researcher).
6

FINDINGS
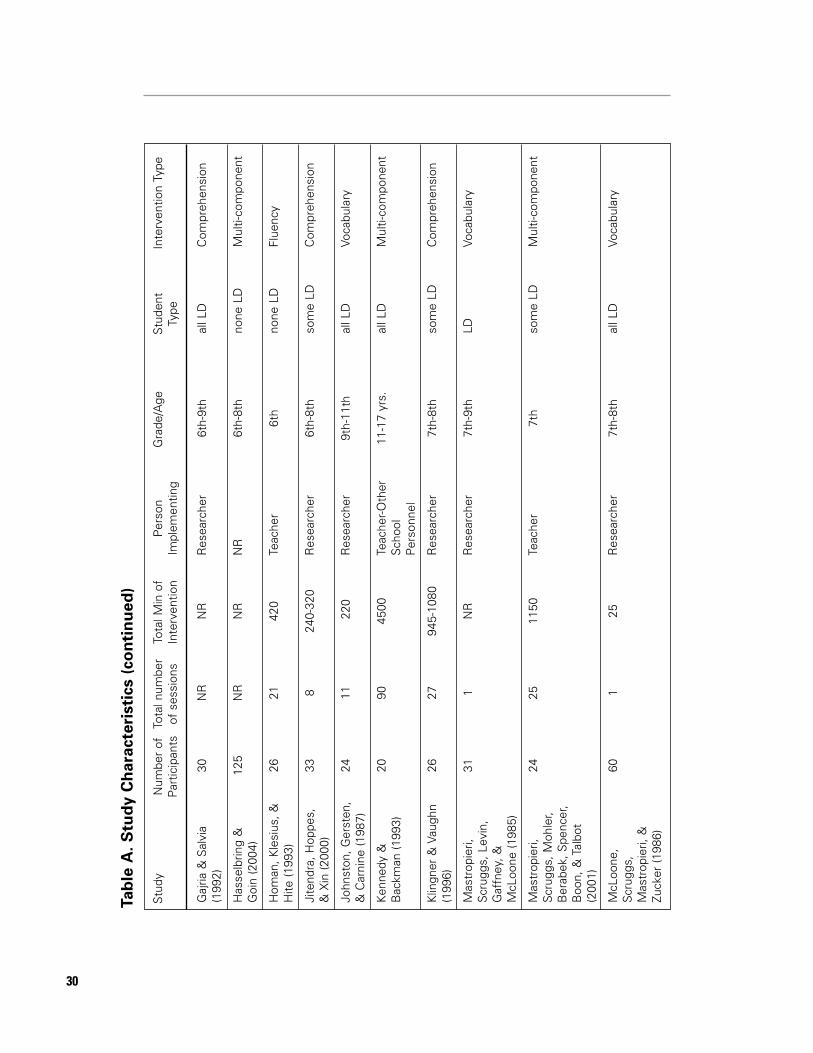
The findings presented in this section are based on a meta-analysis of 31studies. Table A (page 29) provides information on the characteristics of eachstudy included in the analysis. Those interested in more details should reviewthe Method section of this document (page 21) for information on how studieswere selected and how the meta-analysis was conducted.
1. Overall, how effective are the reading interventions for adolescentstruggling readers that have been examined in research studies?
The overall estimate of the effect size across all 31 studies was 0.95 (p<.001;95% CI=.68, 1.22).1 An effect size of almost 1 means that, on average, thetreatment groups in these 31 studies outscored the comparison groups (or thealternate treatment groups) by nearly one standard deviation. In the 11 studiesthat used standardized, norm-referenced measures, the average effect was 0.42(p=.002, 95% CI=.16, .68), which reflects an advantage for the treatment group(s)of just under one-half of a standard deviation. This finding may reflect themeasurement-related differences described earlier; more rigorous measures thatare less closely aligned with the instructional aims of the specific intervention(s)tend to yield smaller-sized effects. Table B (page 32) provides a brief descriptionof the intervention used in each study and the effect sizes by measure.
The variance across all 31 studies was statistically significant as measuredby the Q statistic (Q=150.45, p<.001; the Q statistic for the 11 studies thatused standardized measures also was statistically significant, p=.025). In meta-analysis, the presence of significant variation means that a factor or factors inaddition to the intervention may be contributing to the effect-size estimate (i.e.,these factors may moderate the effect of the intervention). Table 1 (page 9)summarizes results for the three moderators of interest in this study: type ofintervention, grade level of students, and provider of the intervention.
2. What is the specific impact of these reading interventions on measures ofreading comprehension?
While estimates of the overall effect on all reading and reading-related (e.g.,vocabulary) outcomes for the interventions included in this meta-analysis areuseful, reading comprehension outcomes are generally viewed as the mostimportant indicator of the effectiveness of reading interventions with older
7
1 A p value of .05 or smaller was used to evaluate the statistical significance of effect estimates. The 95% confidenceinterval (95% C.I.) is the range of values within which the “true” effect is likely to fall 95% of the time (between .68and 1.22 in this case). While the likelihood diminishes as one deviates from the .95 point estimate, effects are bestinterpreted in terms of their confidence intervals. Of particular importance is whether the interval includes 0. When theconfidence interval does include 0, it is possible that the “true” effect is, in fact, 0.

students. Gains in reading comprehension are critical if struggling adolescentreaders are to succeed in content-area classes, demonstrate proficiency onhigh-stakes state reading tests, or read for pleasure. For this reason, a separatemeta-analysis was conducted on the 23 intervention studies that included oneor more measures of reading comprehension to answer Research Question 2.The 8 studies that included a standardized, norm-referenced measure ofreading comprehension were also considered separately. Results for the 23studies that included one or more measures of reading comprehension and the8 studies that included a standardized, norm-referenced measure of readingcomprehension are discussed in order to address this research question.
With few exceptions, the pattern of results for reading comprehensionmirrors the results from the overall analysis of all outcome measures. Theestimate of effect size across all 23 studies was 0.97 (95% CI=.61, 1.33).Participation in the intervention(s) was associated, on average, with readingcomprehension skills almost 1 standard deviation greater than the skills ofstudents not participating in the treatment (i.e., comparison group(s) or thealternate treatment group(s)). The overall effect-size estimate for the 8 studiesusing standardized, norm-referenced measures of reading comprehension was0.35 (95% CI=-.05, .75). Note that the confidence interval does not exclude thepossibility of a “true” effect of 0. While less likely than the .35 point estimate,it is nonetheless possible.
The variance in the effect-size estimates was statistically significant for the 23 reading comprehension studies (Q=145.41, p<.001) and for the 8comprehension studies that included standardized reading comprehensionmeasures (p<.001). Table 1 summarizes the results of the follow-up moderator analyses.
3. What is the specific impact of these reading interventions on studentswith learning disabilities (LD)?
Information on the LD status of participants was available for all 31 studies (allstudies used school reports as the indicator of LD status). When all measureswere considered, there were significant differences in the outcomes of the 31studies depending on the proportion of the sample (all, some, or none) with LD(Q-between=13.20, p=.001). When the analysis focused only on readingcomprehension outcomes, however, there were no statistically significantdifferences based on the LD status of participants (Q-between=5.60, p=.061).
8

9
Table 1. Results for moderator variables
Moderator
variable
Type ofintervention
Gradegrouping
Type ofimplementer
Levels
Comprehensionstrategies
Word study
Fluency
Multi-component
Vocabulary
Middle grades (4-8)
High school (9-12)
Researcher
Teacher
ES for all
outcome
measures
1.23 (n=12,95% CI=.68, 1.79)
0.60 (n=4,95% CI=.25, .95)
0.26 (n=4,95% CI=-.08, .61)
0.56 (n=6,95% CI=.25, .95)
1.62 (n=5,95% CI=1.13, 2.10)
1.05 (n=19,95% CI=.70, 1.40)
0.78 (n=3,95% CI=.19, 1.38)
1.49 (n=11,95% CI=.99, 1.99)
0.63 (n=12,95% CI=.20, 1.07)
ES for
standardized
outcome
measures
0.55 (n=2,95% CI=-.99, 2.09)
0.68 (n=3,95% CI=.32, 1.03)
0.04 (n=2,95% CI=-.43, .50)
0.41 (n=3,95% CI=-.08, .61)
NA
0.56 (n=7,95% CI=.23, .89)
0.13 (n=8,95% CI=-.25, .51)
1.08 (n=2,95% CI=.57, 1.59)
0.21 (n=6,95% CI=-.09, .50)
ES for all
reading
comprehension
measures
1.35 (n=12,95% CI=.72, 1.97)
0.40 (n=2, 95% CI=-.15, .95)
0.26 (n=4, 95% CI=-.20, .73)
0.80 (n=4, 95% CI=-.21, 1.39)
NA
1.11 (n=15,95% CI=.61, 1.62)
0.59 (n=6, 95% CI=.05, 1.14)
1.89 (n=6, 95% CI=.90, 2.87)
0.65 (n=11,95% CI=.12, 1.18)
ES for
standardized
reading
comprehension
measures
0.54 (n=2, 95% CI=-1.04, 2.11)
0.40 (n=2, 95% CI=-.15, .95)
-.07 (n=2, 95% CI=-.54, .39)
0.59 (n=2, 95% CI=-.21, 1.39)
NA
0.47 (n=5, 95% CI=-.12, 1.06)
0.14 (n=3, 95% CI=-.28, .56)
NA
0.06 (n=5, 95% CI=-.20, .32)
ES=Effect SizeCI=Confidence Interval

Table 2 breaks down the effects by LD status of the participants. Effects arepresented separately for all outcomes and for reading comprehensionoutcomes. Given the absence of significant differences on readingcomprehension outcomes by LD status, the data in Table 2 should be viewedas descriptive of the range of possible effects for each group.
Closing the gapAlthough the analysis of effect sizes provides reliable information about theextent to which an intervention being studied has a greater impact on studentperformance than the control condition it is compared with, it does notprovide information about the degree to which students’ reading skills haveimproved relative to grade-level standards. Standard scores reported in someof the studies were examined to determine the extent to which theinterventions in these studies may have “closed the gap” between thereading skills of struggling readers and those of average readers of similarage or grade level. Not all studies reported standard scores. Of those thatdid, the scores were reported in different, often incomplete, ways, makingthe reporting of overall mean gains or mean posttest scores impossible. Forexample, Penney (2002) reported a mean raw score only on the Woodcock
10
Table 2. Effects of interventions by LD status
LD status of
participants
All designatedlearningdisabled
Somedesignatedlearningdisabled,somestruggling
All struggling,nonedesignatedlearningdisabled
ES for all
outcome
measures
1.19 (n=19, 95%CI=.84, 1.54)
0.86 (n=6, 95%CI=.27, 1.44)
0.39 (n=6, 95%CI=.13, .65)
ES for
standardized
outcome
measures
0.51 (n=3, 95%CI=.05, .98)
0.44 (n=3, 95%CI=-.22, 1.10)
0.40 (n=5, 95%CI=.00, .81)
ES for all
reading
comprehension
measures
1.33 (n=12, 95%CI=.74, 1.92)
0.82 (n=6, 95%CI=.21, 1.44)
0.43 (n=5, 95%CI=-.04, .89)
ES for
standardized
reading
comprehension
measures
NA
0.43 (n=3, 95%CI=-.24, 1.10)
0.39 (n=4, 95%CI=-.27, 1.06)

Reading Mastery Test—Passage Comprehension (WRMT-PC); however,students in the study varied in age, making it impossible to compute astandard score to compare with the standardized mean score. Across theWRMT-PC and the Ekwall Reading Inventory, students in the Conte andHumphreys study (1989) performed on average at the 3rd-4th grade readinglevel at posttest (an average gain of 0.5 to 1.6 grade levels over pretestscores). However, students ranged in age from 9-13 years, making it difficultto determine how their posttest performance compared to that of their non-struggling peers.
In the Hasselbrig and Goin study (2004), the mean posttest score forreading comprehension on the Stanford Diagnostic Reading Test for studentswho received intervention was at a normal curve equivalent (NCE) of 20.3(pretest score was a mean NCE of 11.0). An NCE of 50 is considered“average” and scores falling between 29 and 71 are within a standarddeviation of the mean (the standard deviation for NCE scores is 21.1.) Anaverage NCE score of 20.3 is about 11⁄2 standard deviations below the mean.The Klingner and Vaughn study (1996) reported a mean posttest score nearthe 9th percentile on the Gates-MacGinitie Reading Comprehension Test for agroup of middle-school students participating in an effective comprehensionstrategies intervention (pretest score was just below the 6th percentile). Apercentile rank score of 25 is often used as the low-end cut-off for the“normal” range, meaning that the students in the Klingner and Vaughn studywere still well below average levels of performance after participating in theintervention.
Some students receiving intervention did score close to or within thenormal range at posttest. The mean posttest standard score on the WRMT-PC for students who received intervention in Abbott and Berninger (1999)was 95.9. Students receiving intervention in Allinder (2001) had a meanposttest score of 95.48 on the WRMT-PC. Pretest scores on this measurewere not reported in either study, so it is not known whether averagestandard scores were higher at posttest than at pretest. In Alfassi (1998), themean posttest NCE on the Gates-MacGinitie Reading Comprehension Testfor students receiving the intervention was 42.3, compared to 34.8 at pretest.Overall, these results indicate that some of the interventions considered inthis review were powerful enough to accelerate students’ reading growthsufficiently to narrow the gap between their reading proficiency and that ofaverage readers at their grade level. However, we currently have littleevidence that the instructional conditions in these studies were sufficient tobring struggling readers’ reading skills into the average range.
11

IMPLICATIONS FOR PRACTICE
The findings suggest that researchers as well as teachers can influence readingoutcomes of older students with reading difficulties, that students in middleand high school may benefit from intervention (though interventions provided to middle-grade students were associated with overall higher effect sizes), andthat students with learning disabilities benefit from intervention, typically withlarger effects than for other students who are struggling in reading but notidentified as learning disabled. Table 3 (page 15) provides an overview of thekey findings and interpretations. Related implications follow:
1. Adolescence is not too late to intervene, and older students who
participate in interventions can benefit. These findings provideeducational leaders with a research-based foundation for making this casewith confidence. At the same time, the reported effect sizes should beconsidered in terms of their practical significance. As mentioned earlier,many older students with reading difficulties participating in these studieswere compared with older students receiving little or no intervention. Thisresearch design contrasts markedly with typical practice at the primarygrade level, where all students are given reading instruction. Further,school personnel may need to consider the level of intensity and amountof instruction needed to close the reading gap between struggling andaverage readers. Researchers and technical assistance providers should bemindful neither to over-interpret nor under-interpret the likely outcomes.
2. Older students with reading difficulties benefit from interventions
focused both at the word level and at the text level. Identifying needand intervening accordingly in the appropriate areas (e.g., vocabulary, wordreading, comprehension strategies, and so on) is associated with improvedoutcomes for older students with reading difficulties. Educators can usethis framework as a heuristic for identifying needs in reading and fordesigning necessary interventions.
3. This meta-analysis suggests that teaching comprehension strategies
to older students with reading difficulties is associated with an
overall effect equivalent to a gain of about one standard deviation.
Although the impact of these interventions on standardized measures ofreading comprehension was not significantly different from zero, this may
12

be due to insufficient intensity, i.e., the interventions may not have beenprovided for a sufficient length of time. Providing comprehension strategyinstruction to struggling readers at points throughout the school day,including during content-area classes in addition to instruction inspecialized reading interventions, may pay schoolwide dividends. Thiswould be no small undertaking. Successful implementation will requireschool-level leadership and coordinated planning. Content-area teacherswould need additional professional development in order to teach thesestrategies effectively.
4. Older students with reading difficulties benefit from improved
knowledge of word meanings and concepts. Reading at length andwidely is a valuable way to increase vocabulary knowledge, and studentswith reading difficulties spend less time reading than more capablereaders. Findings from this meta-analysis support the use of more directtypes of vocabulary instruction to improve students’ vocabulary. Studentsengaged in vocabulary interventions make gains when directly tested onthe words they were taught. Since vocabulary instruction is essential to alldomains of learning, it may be valuable for schools to initiate vocabulary-building practices schoolwide, thus benefiting a broad range of learners.Content-area teachers may see gains in achievement by focusinginstructional time on the vocabulary necessary to understand the subjectmatter that students are expected to master. An important caveat: none ofthe studies in this meta-analysis used standardized measures ofvocabulary. This is not surprising; standardized measures of vocabulary aredifficult to influence because students’ knowledge of specific wordmeanings or word types is typically the focus of intervention. Pendingadditional evidence, we know little about the extent to which thesefindings generalize to standardized types of measures.
5. Word-study interventions for older students with reading difficulties
are associated with small-to-moderate gains, even on standardized
outcome measures. For older students struggling at the word level,word-study intervention is an appropriate response.
6. Interventions provided by both researchers and teachers are
associated with positive effects, although, in this meta-analysis,interventions provided by researchers are associated with higher effects
13

than interventions provided by teachers. There are several possiblereasons: (a) researchers implement interventions more consistently, (b) researchers implement interventions with greater fidelity, (c) thenovelty of a different teacher providing interventions positively influencesstudents’ response, and (d) studies implemented by researchers also use researcher-developed outcome measures, which are known to beassociated with greater effects. Whatever the reason(s), teachers mostfrequently provide interventions in day-to-day school settings. Teachers of older struggling readers need additional training to implementinterventions effectively. The more knowledge and expertise that teachershave, the greater their potential impact on student achievement.
7. For older readers, average gains in reading comprehension are
smaller than gains in other reading and reading-related areas for the studies included in this meta-analysis, and the average effect size on standardized measures was associated with a very large confidenceinterval, suggesting a need for continued research. The effectiveness ofthese interventions for improving reading comprehension, the primary goal of intervention for older students, is not well established.
8. Additional research that uses measures that more closely mirror
typical group-administered reading assessments is needed. A numberof the studies in this analysis used individually administered measures of reading comprehension to assess the effects of the intervention. While these measures do provide useful information, they may not give a true indication of how students will perform in more typical classroomassessment situations. For example, individually administered standardizedmeasures often involve reading much shorter passages than typical group-administered tests (such as state reading assessments), and oftenproduce higher reading comprehension scores for struggling readers thangroup-administered tests (Torgesen, 2005). In order to provide betterinformation about the instructional conditions necessary to close thereading gap for struggling readers, we need to invest in studies thatprovide instruction over longer periods of time and assess outcomes with measures that are more similar to those used by schools to monitorthe reading progress of all students.
14
9. Older students with learning disabilities (LD) benefit from reading
intervention, when it is appropriately focused. It is important thatstudents with LD or reading difficulties receive appropriate intervention.The difficulty of the task should not be underestimated, and effectiveinstruction is only one piece of the larger puzzle, albeit an important piece.The results of this meta-analysis suggest that older students with readingdifficulties can benefit from well-designed, effectively deliveredintervention.
15
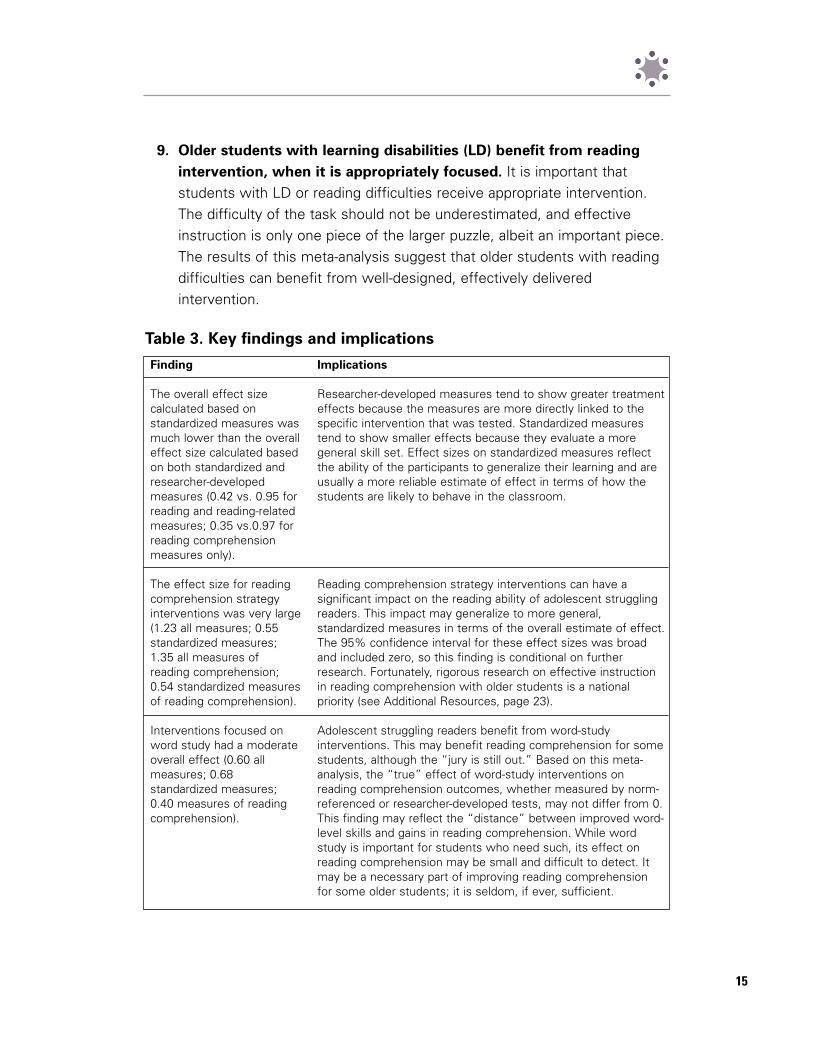
Table 3. Key findings and implications
Finding
The overall effect sizecalculated based onstandardized measures wasmuch lower than the overalleffect size calculated basedon both standardized andresearcher-developedmeasures (0.42 vs. 0.95 forreading and reading-relatedmeasures; 0.35 vs.0.97 forreading comprehensionmeasures only).
The effect size for readingcomprehension strategyinterventions was very large(1.23 all measures; 0.55standardized measures;1.35 all measures ofreading comprehension;0.54 standardized measuresof reading comprehension).
Interventions focused onword study had a moderateoverall effect (0.60 allmeasures; 0.68standardized measures;0.40 measures of readingcomprehension).
Implications
Researcher-developed measures tend to show greater treatmenteffects because the measures are more directly linked to thespecific intervention that was tested. Standardized measurestend to show smaller effects because they evaluate a moregeneral skill set. Effect sizes on standardized measures reflectthe ability of the participants to generalize their learning and areusually a more reliable estimate of effect in terms of how thestudents are likely to behave in the classroom.
Reading comprehension strategy interventions can have asignificant impact on the reading ability of adolescent strugglingreaders. This impact may generalize to more general,standardized measures in terms of the overall estimate of effect.The 95% confidence interval for these effect sizes was broadand included zero, so this finding is conditional on furtherresearch. Fortunately, rigorous research on effective instructionin reading comprehension with older students is a nationalpriority (see Additional Resources, page 23).
Adolescent struggling readers benefit from word-studyinterventions. This may benefit reading comprehension for somestudents, although the “jury is still out.” Based on this meta-analysis, the “true” effect of word-study interventions onreading comprehension outcomes, whether measured by norm-referenced or researcher-developed tests, may not differ from 0.This finding may reflect the “distance” between improved word-level skills and gains in reading comprehension. While wordstudy is important for students who need such, its effect onreading comprehension may be small and difficult to detect. Itmay be a necessary part of improving reading comprehensionfor some older students; it is seldom, if ever, sufficient.

16
Multi-componentinterventions demonstrateda moderate overall effect(0.56 all measures; 0.41standardized measures;0.80 all measures ofreading comprehension;0.59 standardizedmeasures of readingcomprehension).
Fluency interventions had a small effect (0.26 all measures; 0.04standardized measures;0.26 all measures ofreading comprehension; -.07 standardized measuresof reading comprehension).
Vocabulary interventionshad the largest overalleffect size, 1.62. Novocabulary interventionsused standardizedmeasures, and most ofthem assessed the extentto which students learnedthe meaning of the wordsthat were taught, ratherthan directly assessingtheir impact on reading.
Effect sizes were larger instudies where participantswere middle-gradestudents (1.05 allmeasures; 0.56standardized measures) asopposed to high schoolstudents (0.78 allmeasures; 0.13standardized measures).
Focusing on multiple components of reading instruction within the same intervention can produce meaningful effects.However, the average effect sizes for reading comprehensionmeasures and for norm-referenced measures are associatedwith very large confidence intervals, suggesting considerablevariability in effect across studies. This may be related tocomparing interventions that include “multiple components.”Having a greater number of “components” increases thenumber of possible permutations, which may result in a greatervariety of average effects. As the number of multi-componentstudies increases, this topic can be further explored. Questionsmight include: What is the relative effect of the differentcomponents? What is the best mix of components? How mightthe mix differ depending on student need and on local capacity?
Repeated reading was the most prevalent fluency intervention in the studies used for this meta-analysis, and it appears that itseffect on the reading ability of older readers is limited. Researchusing different intervention techniques is needed to determinehow to effectively remediate fluency in adolescent strugglingreaders. The effects of fluency interventions on standardizedmeasures and on all measures of reading comprehension werenot reliably different from zero.
Vocabulary interventions in the meta-analysis tended to focus on teaching words that are then assessed on the researcher-developed measures associated with the specific intervention.Generalization to standardized measures cannot be determinedfrom these studies. While standardized measures of vocabularyare challenging to construct and use, there is a need for such. Intheir absence, it is difficult to determine if instructional effectsgeneralize beyond the immediate context of the intervention. At this point, we have no evidence that relatively short-termvocabulary instruction with adolescents can produce ageneralized impact on reading comprehension
Consistent with research findings at the primary grade level,intervention for older struggling readers is most effective whenit is provided as early as possible. If limited funding is available,focusing intervention at the middle grade level may be the bestinvestment. However, older students do respond to interventionand all students who are struggling in reading should receiveintervention.
Table 3. Key findings and implications (continued)
Finding Implications

17
Across all studies, thosewith only participants withlearning disabilities hadsignificantly higher effectsthan those with noparticipants with learning-disabilities (ES=1.20 for allLD, 0.39 for no LD; p<.05).
Effect sizes were larger forresearcher-implementedinterventions (1.49 allmeasures; 1.08standardized measures)than for teacher-implemented interventions(0.63 all measures; 0.21standardized).
Learning disabled students respond to intervention in meaningfulways that reflect significant improvements in reading andreading-related skills.
The fidelity with which an intervention is implemented caninfluence the size of effects. Researcher-provided intervention is typically delivered with greater fidelity, due to training in theappropriate protocol. The result is a more appropriate level ofinstructional intensity by individual providers and greaterconsistency across providers. However, effects from teacher-implemented interventions remain sizable. When delivered with fidelity, teachers can provide effective interventions toadolescent struggling readers. Professional development is thekey to establishing and maintaining high levels of fidelity. Themore knowledge and expertise that teachers have about theinterventions they are using, the greater the likelihood that theintervention will have a positive impact on students.
Table 3. Key findings and implications (continued)
Finding Implications

18

BACKGROUND ON META-ANALYSIS
WITHIN SPECIAL EDUCATION
Meta-analysis is a methodology that allows for synthesizing research by using aconsistent quantitative method for describing the effectiveness of interventionsacross studies. It is not unlike primary research in its assumptions and handlingof data; however, instead of treating students as cases, it analyzes variationwithin and across studies, both in outcomes and in other characteristics of thestudies. Meta-analysis yields an average overall effect and its standarddeviation. A large (or statistically significant) standard deviation indicates thepresence of considerable and systematic variation around the mean overalleffect. It also suggests that factors other than the intervention may have a rolein explaining the overall pattern of findings across studies. These othervariables, known as moderators, can be related to research design andmeasurement or to more substantive factors that are associated with theintervention, such as attributes of participants in the studies, or of the settingswhere the interventions are implemented. Meta-analysis is useful for identifyingthese moderating factors.
Synthesizing research in the area of special education presents a number ofchallenges (as described in Berliner, 2002, and Odom et al. 2005). The sourcesand effects of this complexity vary in their details, but several general concernscut across this body of work and have particular relevance to meta-analysis.First, the empirical literature in special education is characterized by a diversityof research designs. Descriptive and correlational studies predominate,although quasi-experimental designs have increased in use over the past tenyears. Randomized approaches are still relatively rare, due, presumably, to thedifficulty of creating comparison groups in settings where every member of thepopulation may be entitled to the intervention in question. The absence of acomparison group, or the use of a nonrandomized treatment alternative, as inquasi-experimental studies, threatens a given study’s internal validity (theconfidence with which one can say “doing X causes Y”).
Differences in research design also have a bearing when, as in meta-analyses, individual studies are combined. Effect sizes of similar magnitude areoften discussed as though they represent comparable levels of impact. This isreasonable when they are derived from studies of equal rigor. However, when
19

the same-sized effects result from studies differing in the rigor of theirmethodology, the issue is less clear. For example, an effect of .50 from a quasi-experimental study is not truly comparable to an effect of .50 from a study withrandomized groups, even when the same intervention is the subject of bothstudies. Meta-analysis is helpful in this context. It offers a framework forreliably unraveling the respective roles of the research method used and theunderlying substantive effect, making it possible to combine a variety of studydesigns into a single overall estimate of impact.
While research design is the most prominent methodological variable, there are others. The fidelity with which a program is implemented increasesthe likelihood of obtaining a larger treatment effect. Comparing an interventionto typical classroom instruction generally provides a different estimate of the treatment effect than comparing two types of interventions does.Measurement of the dependent variable can also influence the size of aneffect. Effect sizes from norm-referenced standardized tests that assess theimpact of an intervention on a generalized skill are usually smaller than effectsizes from researcher-developed measures, which tend to be more closelyaligned to elements of the treatment. Again, meta-analysis is a means ofstudying these methods-related influences to arrive at a reasonable estimate of intervention effects.
20

METHOD
Studies for the meta-analysis were located by searching electronic databases,by perusing reference lists of prior syntheses on related topics, and byresearching citations to assure a comprehensive pool of eligible studies. To beincluded in the meta-analysis, studies had to have:
• been published between 1980 and 2006;
• included only students who were English-speaking struggling readers ingrades 4-12 (or disaggregated data provided for this group of participants ifother types of students participated in the study; only data for thesestudents were included in the meta-analysis);
• consisted of an intervention focused on word study, fluency, vocabulary,reading comprehension strategies, or multiple components of readinginstruction;
• used a multiple-group experimental or quasi-experimental design(treatment-comparison or comparison of multiple treatments);
• reported data for at least one dependent measure that assessed readingor reading-related variables; and
• reported sufficient data to allow for the computation of an effect size anda measure of standard error.
Coding. Thirty-one (31) studies met these criteria, and were coded on thefollowing variables:
• focus of intervention (fluency, vocabulary, reading comprehension, wordstudy, or multi-component);
• age/grade levels of the participants;
• type of participants (all with learning disabilities, some struggling andsome with learning disabilities, or all struggling, none with learningdisabilities); and
• provider of the intervention (researcher, teacher, or other personnel).
Table A (page 29) summarizes information for all 31 studies; backgroundinformation for each study is included as well. Studies that did not report dataon one or more variables were excluded from the analyses of the sub-questions
21

for which their data were not available. The total number of participants acrossall 31 studies was 1,306. Sample sizes of individual studies ranged from 13 to115.
Effect size calculation. For all 31 studies, the Hedges (1981) procedure forcalculating unbiased effect sizes for Cohen’s d was used (this statistic is alsoknown as Hedges g). In Bos and Anders (1990), multiple treatment groupswere compared. Only the effect size for the semantic/syntactic feature analysistreatment and the definition instruction comparison was included in the meta-analysis. The treatment group was retained because it represented a fullimplementation of the intervention, while other treatments in the studiesrepresented only a partial implementation.
In cases where a study included more than one reading-related outcomemeasure, effect sizes and standard errors were computed for all measures andthe mean effect size was retained in the meta-analysis. The majority ofoutcome measures in the 31 studies were non-standardized and researcher-developed (19 of the 31 studies included only these types of measures).Previous research has demonstrated that effect sizes tend to be higher onthese types of measures than on standardized, norm-referenced measures(Swanson, Hoskyn, & Lee, 1999). For this reason, two general analyses wereconducted, one with effect sizes based on both standardized and non-standardized measures and a second using only studies that included one ormore standardized, norm-referenced measures.
A study’s design and measurement contribute to the magnitude of its effectand should be considered when interpreting its results; a small-sized effect on astandardized measure may be more meaningful than a similar-sized effect on anon-standardized measure. Stronger research designs with standardizedmeasures typically yield more reliable estimates of a treatment’s effect andmay have greater value for informing practice than less rigorous designs.
A random effects model was used to analyze effect sizes. This modelassumes variance is present in the effects of intervention both within eachstudy and between the studies included in the analysis. Factors that differbetween studies (e.g., differences in the focus of the intervention, LD-designation of participants) are introduced into the analysis as moderatorvariables in an attempt to explain the sources of the variance in effects.
22

ADDITIONAL RESOURCES
We recommend the following additional resources on interventions foradolescents with LD and/or struggling in reading:
Other research syntheses on interventions for struggling older readers:
Edmonds, M., Vaughn, S., Wexler, J., Reutebach, C., Cable, A., Tackett, K, & Wick,J. (in press). A synthesis of reading interventions and effects on literacyoutcomes for older struggling readers. Review of Educational Research.
Gersten, R., Fuchs, L., Williams, J., & Baker, S. (2001). Teaching readingcomprehension strategies to students with learning disabilities. Review ofEducational Research, 71, 279-310.
Jitendra, A., Edwards, L., Sacks, G., & Jacobson, L. (2004). What research saysabout vocabulary instruction for students with learning disabilities. ExceptionalChildren, 70, 299-311.
Other resources:
Clapper, A., Bremer, C., & Kachgal, M. (2002, March). Never too late: Approachesto reading instruction for secondary students with disabilities. National Centeron Secondary Education and Transition Research to Practice Brief.
Osborn, J. & Lehr, F. (2003). A Focus on Fluency. Available atwww.prel.org/programs/rel/rel.asp.
Torgesen, J.K. (2005). Remedial interventions for students with dyslexia: Nationalgoals and current accomplishments. In Richardson, S., & Gilger, J. (Eds.)Research-Based Education and Intervention: What We Need to Know.(pp. 103-114). Boston: International Dyslexia Association.
Reading to Achieve: A governor’s guide to adolescent reading. (2005). NationalGovernor’s Association Center for Best Practices.
Reading at Risk: How states can respond to the crisis in adolescent reading. (2005).National Association of State Boards of Education.
Reading Next: A vision for action and research in middle and high school reading.(2006). Alliance for Excellent Education.
23

Creating a Culture of Literacy: A guide for middle and high school principals. (2005).National Association of Secondary School Principals.
Adolescent Reading Resources: Linking Research and Practice. (2002). Northeastand Islands Regional Educational Laboratory at Brown University.
Adolescents and Reading: Reading for the 21st Century. (2003). Alliance forExcellent Education.
Teaching children to read: An evidence-based assessment of the scientific researchliterature on reading and its implications for reading instruction. (2000). Reportof the National Reading Panel. National Institute of Child Health and HumanDevelopment.
Ten Years of Research on Adolescent Reading: 1994-2004: A review. (2005).Naperville, IL: Learning Point Associates.
24

REFERENCES
Abbott, S. P., & Berninger, V. W. (1999). It’s never too late to remediate: Teachingword recognition to students with reading disabilities in grades 4-7. Annals ofDyslexia, 49, 223-250.
Alfassi, M. (1998). Reading for meaning: The efficacy of reciprocal teaching infostering reading comprehension in high school students in remedial readingclasses. American Educational Research Journal, 35, 309-331.
Allinder, R. M., Dunse, L., Brunken, C. D., & Obermiller-Krolikowski, H. J. (2001).Improving fluency in at-risk readers and students with learning disabilities.Remedial and Special Education, 22, 48-45.
Anders, P. L. Bos, C. S., & Filip, D. (1984). The effect of semantic feature analysison the reading comprehension of learning-disabled students. In J. S. Niles andL. A. Harris (Eds.), Changing Perspectives on Reading/Language Processing andInstruction (pp.162-166). Rochester, NY: The National Reading Conference.
Biancarosa, G. & Snow, C. (2006). Reading next—A vision for action and research inmiddle and high school reading. A report to the Carnegie Corporation of NewYork (2nd Ed.). Washington, DC: Alliance for Excellent Education.
Berliner, D. C. (2002). Educational research: The hardest science of all. EducationalResearcher, 3J(S), 18-20.
Bhat, P., Griffin, C. C., & Sindelair, P. T. (2003). Phonological awareness instructionfor middle school students with learning disabilities. Learning DisabilityQuarterly, 26, 73-87.
Bhattacharya, A., & Ehri, L. C. (2004). Graphosyllabic analysis helps adolescentstruggling readers read and spell words. Journal of Learning Disabilities, 37,331-348.
Bos, C. S., & Anders, P. L. (1990). Effects of interactive vocabulary instruction onthe vocabulary learning and reading comprehension of junior-high learningdisabled students. Learning Disability Quarterly, 13, 31-42.
Bos, C. S., Anders, P. L., Filip, D., & Jaffe, L. E. (1989). The effects of an interactiveinstructional strategy for enhancing reading comprehension and content arealearning for students with learning disabilities. Journal of Learning Disabilities(22)6, 384-390.
25

Boyle, J. R. (1996). The effects of a cognitive mapping strategy on the literal andinferential comprehension of students with mild disabilities. LearningDisabilities Quarterly, 19, 86-98.
Chan, K. S. (1991). Promoting strategy generalization through self-instructionaltraining in students with reading disabilities. Journal of Learning Disabilities,(24)7, 427-290.
Conte, R., & Humphreys, R. (1989). Repeated readings using audiotaped materialenhances oral reading in children with reading difficulties. Journal ofCommunication Disorders, 22, 65-79.
Darch, C., & Gersten, R. (1986). Direct setting activities in reading comprehension:A comparison of two approaches. Learning Disability Quarterly, 9, 235-243.
Deshler, D. (2005). Adolescents with learning disabilities: Unique challenges andreasons for hope. Learning Disability Quarterly, 28, 112.
DiCecco, V. M., & Gleason, M. M. (2002). Using graphic organizers to attainrelational knowledge from expository texts. Journal of Learning Disabilities, 35,306-310.
Dole, J., Brown, K., & Trathen, W. (1996). The effects of strategy instruction on thecomprehension performance of at-risk students. Reading Research Quarterly,31, 62-88.
Edmonds, M., Vaughn, S., Wexler, J., Reutebach, C., Cable, A., Tackett, K, & Wick,J. (in press). A synthesis of reading interventions and effects on readingoutcomes for older struggling readers. Review of Educational Research.
Fuchs, L. S., Fuchs, D., & Kazdan, S. (1999). Effects of peer-assisted learningstrategies on high school students with serious reading problems. Remedial &Special Education, 20, 309-319.
Gajria, M., & Salvia, J. (1992). The effects of summarization instruction on textcomprehension of students with learning disabilities. Exceptional Children, 58(6)508-516.
Hasselbring, T. S., & Goin, L. I. (2004). Reading instruction for older strugglingreadings: What is the role of technology? Reading and Writing Quarterly, 20,113-144.
Hedges, L. V. (1981). Distribution theory for Glass’s estimator of effect size andrelated estimators. Journal of Education Statistics, 6, 107-118.
26

Homan, S.P., Klesius, J.P., & Hite, C. (1993). Effects of repeated readings andnonrepetitive strategies on students’ fluency and comprehension. Journal ofEducational Research, 87, 94-99.
Jitendra, A. K., Hoppes, M. K., & Xin, Y.P. (2000). Enhancing main ideacomprehension for students with learning problems: The role of asummarization strategy and self-monitoring instruction. Journal of SpecialEducation, 34, 117-139.
Johnson, G., Gersten, R., & Carnine, D. (1987). Effects of Instructional designvariables on vocabulary acquisition of learning disabilities students: A study ofcomputer-assisted instruction. Journal of Learning Disablities, 20(4), 206-213.
Kennedy, K. M., & Backman, J. (1993). Effectiveness of the Lindamood Auditory inDepth Program with students with learning disabilities. Learning DisabilitiesResearch & Practice, 8(4) 253-259.
Klingner, J. K., & Vaughn, S. (1996). Reciprocal teaching of reading comprehensionstrategies for students with learning disabilities who use English as a secondlanguage. Elementary School Journal, 96, 275-293.
Mastropieri, M. A., Scruggs, T., Mohler, L., Beranek, M., Spencer, V., Boon, R. T., &Talbott, E. (2001). Can middle school students with serious reading difficultieshelp each other and learn anything? Journal of Learning Disabilities, 16, 18-27.
Mastropieri, M. A., Scruggs, T. E., Levin, J. R., Gaffney, J., & McLoone, B. (1985).Mnemonic vocabulary instruction for learning disabled students. LearningDisability Quarterly, 8, 57-63.
McLoone, B. B., Scruggs, T. E., Mastropieri, M. A., & Zucker, S. F. (1986). Memorystrategy instruction and training with learning disabled adolescents. LearningDisabilities Research, 2(1), 45-52.
Moore, P. J., & Scevak, J. J. (1995). The effects of strategy training on high schoolstudents’ learning from science texts. European Journal of Psychology ofEducation, 10, 401-410.
O’Shea, L. J., Sindelar, P., & O’Shea, D. J. (1987). Effects of repeated readings andattentional cues on the reading fluency and comprehension of learning disabledreaders. Learning Disabilities Research, 2, 103-109.
Odom, S., Brantlinger, E., Gersten, R., Horner, R., Thompson, B., & Harris, K.(2005). Research in special education: Scientific methods and evidence-basedpractices. Exceptional Children, 71, 137-148.
27

Penney, C. G. (2002). Teaching decoding skills to poor readers in high school.Journal of Literary Research, 34, 99-118.
Reutebach, C. (2006). Reading intervention research for secondary students withlearning disabilities. Unpublished doctoral dissertation. The University of Texas,Austin.
Snider, V. E., (1989). Reading comprehension performance of adolescents withlearning disabilities. Learning Disability Quarterly, 11, 87-96.
Swanson, H. L., Hoskyn, M., & Lee, C. (1999). Interventions for students withlearning disabilities: A meta-analysis of treatment outcomes. New York: Guilford Press.
Torgesen, J. K., Houston, D. D., Rissman, L. M., Decker, S. M., Roberts, G.,Vaughn, S., Wexler, J., Francis, D. J., Rivera, M. O., & Lesaux, N. (2007).Academic literacy instruction for adolescents: A guidance document from theCenter on Instruction. Portsmouth, NH: RMC Research Corporation, Center on Instruction.
Torgesen, J. K. (2005). Remedial Interventions for students with dyslexia: Nationalhoals and current accomplishments. In Richardson, S., & Gilger, J. (Eds.)Research-Based Education and Intervention: What We Need to Know. (pp. 103-114). Boston: International Dyslexia Association.
Veit, D. T., Scruggs, T. E., & Mastropieri, M. A. (1986). Extended mnemonicinstruction with learning disabled students. Journal of Educational Psychology,78(4), 300-308.
Wilder, A. A., & Williams, J. P. (2001). Students with severe learning disabilities canlearn higher order comprehension skills. Journal of Educational Psychology, 93,268-278.
Williams, J. P., Brown, L. G., Silverstein, A. K., & deCani, J. S. (1994). Aninstructional program in comprehension of narrative themes for adolescentswith learning disabilities. Learning Disabilities Quarterly, 17, 205-221.
28

29
Stu
dy
Abb
ott
&B
erni
nger
(199
9)
Alfa
ssi (
1998
)
Alli
nder
, Dun
se &
Obe
rmill
er-
Kro
likow
ski (
2001
)
And
ers,
Bos
, &Fi
lip (1
983)
Bha
t, G
riffin
, &S
inde
lar
(200
3)
Bha
ttac
hary
a &
Ehr
i (20
04)
Bos
& A
nder
s(1
990)
Bos
, And
ers,
Fili
p,&
Jaf
fe (1
989)
Boy
le (1
996)
Cha
n (1
991)
Con
te &
Hum
phre
ys (1
989)
Dar
ch &
Ger
sten
(198
6)
DiC
ecco
&G
leas
on (2
002)
Fuch
s, F
uchs
, &K
azda
n (1
999)
Num
ber
ofP
artic
ipan
ts
20 75 49 62 40 40 30 50 30 20 26 24 24 102
Tota
l num
ber
of s
essi
ons
16 20 NR
1
2 18 4 8 2 11 5 30 9 20 NR
Tota
l Min
of
Inte
rven
tion
960
750
NR
100
NR
110
400
230
550
200
600
450
800
NR
Per
son
Impl
emen
ting
Oth
er S
choo
lP
erso
nnel
Teac
her
Teac
her
Teac
her-
Res
earc
her
Teac
her
Res
earc
her
Res
earc
her
Teac
her-
Res
earc
her
Res
earc
her
Teac
her
Teac
her
Teac
her-
Res
earc
her
Teac
her-
Res
earc
her
Teac
her
Gra
de/A
ge
4th-
7th
9th
7th
9-11
th
6th-
8th
6th-
9th
Avg
=13
.8 y
rs.
Avg
=16
.2 y
rs.
6th-
8th
5th-
6th
9-13
yrs
.
9th-
11th
6th-
8th
9th
Stu
dent
Type
none
LD
none
LD
som
e LD
all L
D
all L
D
none
LD
all L
D
all L
D
som
e LD
all L
D
none
LD
all L
D
all L
D
som
e LD
Inte
rven
tion
Type
Wor
d S
tudy
Com
preh
ensi
on
Flue
ncy
Voca
bula
ry
Wor
d S
tudy
Wor
d S
tudy
Mul
ti-co
mpo
nent
Mul
ti-co
mpo
nent
Com
preh
ensi
on
Com
preh
ensi
on
Flue
ncy
Com
preh
ensi
on
Com
preh
ensi
on
Mul
ti-co
mpo
nent
Tab
le A
. S
tud
y C
hara
cte
risti
cs
30
Gaj
ria &
Sal
via
(199
2)
Has
selb
ring
&G
oin
(200
4)
Hom
an, K
lesi
us, &
Hite
(199
3)
Jite
ndra
, Hop
pes,
& X
in (2
000)
John
ston
, Ger
sten
,&
Car
nine
(198
7)
Ken
nedy
&B
ackm
an (1
993)
Klin
gner
& V
augh
n(1
996)
Mas
trop
ieri,
Scr
uggs
, Lev
in,
Gaf
fney
, &M
cLoo
ne (1
985)
Mas
trop
ieri,
Scr
uggs
, Moh
ler,
Ber
abek
, Spe
ncer
,B
oon,
& T
albo
t(2
001)
McL
oone
,S
crug
gs,
Mas
trop
ieri,
&Zu
cker
(198
6)
30 125
26 33 24 20 26 31 24 60
NR
NR 21 8 11 90 27 1 25 1
NR
NR
420
240-
320
220
4500
945-
1080
NR
1150 25
Res
earc
her
NR
Teac
her
Res
earc
her
Res
earc
her
Teac
her-O
ther
Sch
ool
Per
sonn
el
Res
earc
her
Res
earc
her
Teac
her
Res
earc
her
6th-
9th
6th-
8th
6th
6th-
8th
9th-
11th
11-1
7 yr
s.
7th-
8th
7th-
9th
7th
7th-
8th
all L
D
none
LD
none
LD
som
e LD
all L
D
all L
D
som
e LD
LD som
e LD
all L
D
Com
preh
ensi
on
Mul
ti-co
mpo
nent
Flue
ncy
Com
preh
ensi
on
Voca
bula
ry
Mul
ti-co
mpo
nent
Com
preh
ensi
on
Voca
bula
ry
Mul
ti-co
mpo
nent
Voca
bula
ry
Stu
dyN
umbe
r of
Par
ticip
ants
Tota
l num
ber
of s
essi
ons
Tota
l Min
of
Inte
rven
tion
Per
son
Impl
emen
ting
Gra
de/A
geS
tude
ntTy
peIn
terv
entio
n Ty
pe
Tab
le A
. S
tud
y C
hara
cte
risti
cs (
co
nti
nu
ed
)

31
Moo
re &
Sce
vack
(199
5)
O' S
hea,
Sin
dela
r,&
O’S
hea
(198
7)
Pen
ney
(200
2)
Sni
der
(198
9)
Veit,
Scr
uggs
, &M
astr
opie
ri (1
986)
Wild
er &
Will
iam
s(2
001)
Will
iam
s, B
row
n,S
ilver
stei
n, &
deC
ani (
1994
)
21 31 32 26 64 91 93
7 1
15-1
8
13 5 11 9
420
NR
840-
1008
650
50 540
360
Teac
her
Res
earc
her
Teac
her
Res
earc
her
Res
earc
her
Teac
her
Teac
her
14-1
5 yr
s.
5th-
8th
9th-
11th
Avg
=14
yrs
.
6th-
8th
6th-
8th
5th-
8th
none
LD
all L
D
none
LD
all L
D
all L
D
all L
D
all L
D
Com
preh
ensi
on
Flue
ncy
Wor
d S
tudy
Com
preh
ensi
on
Voca
bula
ry
Com
preh
ensi
on
Com
preh
ensi
on
Stu
dyN
umbe
r of
Par
ticip
ants
Tota
l num
ber
of s
essi
ons
Tota
l Min
of
Inte
rven
tion
Per
son
Impl
emen
ting
Gra
de/A
geS
tude
ntTy
peIn
terv
entio
n Ty
pe
Tab
le A
. S
tud
y C
hara
cte
risti
cs (
co
nti
nu
ed
)
1N
R=
Not
rep
orte
d

32
Table B. Outcomes by intervention type and design
Comprehension
Alfassi (1998)• T (Reciprocal teaching): Working in
small groups, students read textaloud, generated questions,summarized the text for theirpeers, discussed and clarifieddifficulties, and made predictions(n=53).
• C (Current practices): School’stypical remedial reading instructionconsisting of skills acquisition (n=22).
Boyle (1996)• T (strategy instruction): Students
taught to create cognitive mapsfrom reading passages (n=15).
• C (no treatment): Administeredmeasures only (n=15).
Chan (1991)• T (intensive self-questioning
strategy instruction): Extensivetraining in how to generalize a self-questioning strategy for identifyingmain ideas (n=10).
• C (no generalization): Self-questioning strategy wasintroduced briefly and studentspracticed on their own (n=10).
Darch & Gersten (1986)• T1 (Basal pre-reading activities):
Improve comprehension throughdeveloping student interest andmotivation; connect relevance ofthe passage to students’ pastexperience; offer a generalintroductory discussion (n=11).
• T2 (Advanced organizer): A textoutline designed to help student’sprocess text information (n=11).
Gates MacGinitie Readingcomprehension subtest(standardized)Gates MacGinitie Readingvocabulary subtest(standardized)Reading assessments
Literal below grade levelcomprehension questionsInferential below grade levelcomprehension questionsLiteral on grade levelcomprehension questionsInferential on grade levelcomprehension questionsFormal Reading Inventory Silentreading subtest
Multiple choice comprehensiontestMain idea identification test (withprompt to use strategy)Main idea identification test (noprompt to use strategy)Rating sentences test (with promptto use strategy)Rating sentences test (no promptto use strategy)
Multiple choice content knowledgetest (per unit)Unit 1Unit 2Unit 3Multiple choice content posttest
T vs. CES=-.23
T vs. CES=-.17
T vs. CES=.98
T vs. CES=.76T vs. CES=.96T vs. CES=.87T vs. CES=1.33T vs. CES=.34
T vs. CES=.38T vs. CES=.28T vs. CES=1.92T vs. CES=-.28T vs. CES=.38
T1 vs. T2ES=.74ES=.63ES=1.16
T1 vs. T2ES=1.66
Intervention Measurea Findings/results

33
DiCecco & Gleason (2002)• T (Graphic organizers): Direct
instruction using a graphicorganizer of concept relationships(n=11).
• C (No graphic organizer):Instruction in the same contentusing guided discussions andnote-taking (n=11).
Gajria & Salvia (1992)• T (Summarization strategy): Five
rules of summarization taught tostudents with LD in resourceclasses (n=15).
• C (typical instruction): School’stypical reading instruction providedto students with LD in resourceclasses (n=15).
Jitendra, Hoppes, & Xin (2000)• T (Main idea): Main idea strategy
instruction using prompt cards andself-monitoring (n=18).
• C (Current practices): School’stypical reading instruction (n=15).
Klingner & Vaughn (1996)• T1 (Reciprocal teaching + tutoring):
Reciprocal teaching plus peertutoring on comprehensionstrategies (n=13).
• T2 (Reciprocal teaching +cooperative learning): Reciprocalteaching plus strategy practice incooperative learning groups (n=13).
Moore & Scevack (1995)• T (SLIC: Summarize, Link, Image,
Check): Explicit instruction in a setof strategies: summarize text, linktext and visual aids, visually depictthe relationship(s), and check forunderstanding (n=11).
• C (Current practices): School’stypical reading instruction (n=10).
Multiple choice content knowledgetestFact recall
Number of relational knowledgestatements essays
Multiple choice comprehension ofexpository passages5 condensation questions5 factual questions
Main idea: trained passages(identification/production of mainidea statements)Main idea: near transfer (similarnarrative passages)Main idea: far transfer (expositorypassages)
Gates MacGinitie Readingcomprehension subtest(standardized)Passage comprehension test (%correct)
Free recall (# details)
Free recall (# of main ideas)
Multiple choice comprehensiontestTransfer: free recall details
Transfer: free recall main idea
Transfer: multiple choice test
T vs. CES=.48T vs. CES=.08T vs. CES=1.62
T vs. CES=5.98T vs. CES=2.68
T vs. CES=2.18
T vs. CES=2.18T vs. CES=2.51
T1 vs. T2ES=1.38
T1 vs. T2ES=.34
T vs. CES=-.55T vs. CES=.07T vs. CES=-.36T vs. CES=-.37T vs. CES=-.54T vs. CES=-.35
Intervention Measure Findings/results
Table B. Outcomes by intervention type and design (continued)

34
Snider (1989)• T (Direct teaching of informational
and vocabulary concepts): Adaptedworksheets from Reading MasteryIII and IV were used to presentinformation and vocabulary orally;apply as a group; and provideindividual written practice of the newly acquired information (n=13).
• C (Current practices): School’stypical reading instruction (n=13).
Wilder & Williams (2001)• T1 (Theme identification):
Scaffolded instruction thatincluded a pre-reading discussion,reading the story, post-readingdiscussions guided by organizingquestions, identifying the storytheme and relating the theme toreal-life experiences (n=47).
• T2 (Story comprehension):Comprehension instructionemphasizing vocabulary and plotthrough teacher-generatedquestions and discussion (n=44).
Williams et al. (1994)• T1 (Themes instruction):
Scaffolded instruction inprereading discussion, reading thestory, participating in discussionsguided by organizing questions,identifying the story theme andrelating that theme to real-lifeexperiences (n=53).
• T2 (Basal reading instruction):Instruction on the same contentusing a basal reader seriesadapted to the structure ofprereading discussion, vocabularydevelopment, story reading andpostreading discussion (n=40).
Test of passage comprehension (1multiple choice question for eachof the 24 lessons)
Transfer: Story details in novel text(# recalled)Transfer: Story components innovel text (main ideas)Theme concepts (understandingexplicitly taught themes)Theme identification
Theme application
Vocabulary definitions
Using vocabulary in sentences
Theme concept (understandingexplicitly taught theme)Theme identification
Theme application
T vs. CES=1.36
T1 vs. T2ES=.41T1 vs. T2ES=.59T1 vs. T2ES=1.67T1 vs. T2ES=5.88T1 vs. T2ES=1.73T1 vs. T2ES=.25T1 vs. T2ES=.55
T1 v. T2ES=1.40T1 vs. T2ES=2.06T1 v. T2ES=2.93
Intervention Measure Findings/results
Table B. Outcomes by intervention type and design (continued)

35
Word Study
Abbott & Berninger (1999)• T1 (Structural analysis): Instruction
in the alphabetic principle,phonological decoding (appliedphonics and structural analysis),structural analysis focused onaffixes and suffixes, and repeatedoral reading with error correction(using structural analysis) andcomprehension monitoring (n=10).
• T2 (Study skills): T1 with syntheticphonics strategies (i.e., letter-sound correspondence) and studyskills instruction (workbook pageson note-taking, outlining andparagraph writing) in place ofstructural analysis instruction andapplication (n=10).
Bhattacharya & Ehri (2004)• T1 (Syllable chunking strategy):
Students were taught to orallydivide multisyllabic words intosyllables, state the number ofsyllables, match them to theirspelling and blend the syllables tosay the whole word. Correctivefeedback was provided after eachstep (n=20).
• T2 (Whole word reading): Studentspracticed reading multisyllabicwords with no applied strategy.Corrective feedback was provided(n=20).
• C1 (Current practices): School’stypical reading instruction (n=20).
Bhat et al. (2003)• T (Great Leaps Reading Program +
phonemic awareness):Phonological and phonemicawareness lessons from GreatLeaps reading programsupplemented with additional
WRMT-Rb: Comprehension(standardized)WRMT-R: Word identification(standardized)WRMT-R: Word attack(standardized)Qualitative Reading Inventory(standardized)TOWRE(standardized)TOWRE: pseudo-words(standardized)
WRMT-R Word attack(standardized)
Syllable segmentation
Decoding words
Decoding subtle misspellings
Decoding pseudo-words by analogy
CTOPPc
(standardized)WRMT-Word identification(standardized)
T1 vs. T2ES=.11T1 vs. T2ES=.16T1 vs. T2ES=.08T1 vs. T2ES=.18T1 vs. T2ES=.30T1 vs. T2ES=.04
T1 vs. CES=1.37T2 vs. CES=.42T1 vs. CES=1.11T2 vs. CES=.20T1 vs. CES=.64T2 vs. CES=.41T1 vs. CES=1.11T2 vs. CES=.50T1 vs. CES=.49T2 vs. CES=.03
T vs. CES=1.56T vs. CES=.15
Intervention Measure Findings/results
Table B. Outcomes by intervention type and design (continued)

36
phonemic awareness activitiesincluding phoneme blending,segmenting, reversal andsubstitutions (n=20).
• C (Current practices): School’stypical reading instruction (n=20).
Penney (2002)• T (Phonemic decoding): Students
read aloud from text; words readslowly or incorrectly were thentaught using the Glass Analysismethod of rehearsing thepronunciation of letter sequencesthat form pronounceable parts ofwords (n=21).
• C (Current practices): School’stypical reading instruction (n=11).
Fluency
Allinder (2001)• T1 (Specific Fluency Strategy
Instruction): Students taught tofocus on using a strategy duringread aloud conferences; strategiesincluded reading with inflection,self-monitoring for accuracy,reading at appropriate pace,watching for word endings, andtracking with finger (n=33).
• C (No Strategy Instruction):Students asked to do their bestwhile reading aloud (n=16).
Conte & Humphreys (1989)• T1: (Repeated Reading with
Audiotaped Material): In RRT, theteacher and student previewed thetext. Next, the student listened toa short passage (1st paragraph)once or twice and then began totrack the words in the book asthey were read on tape. Thestudent reads the passage alongwith the tape and then without thetape. Prior to the session and afterthe session the teacher reviewedthe content (n=13).
PPVT(standardized)WRMT: Word identification(standardized)WRMT: Word attack
WRMT: Passage comprehension
WJRM-Word identification(standardized)WJRM-Word attack(standardized)WJRM-comprehension(standardized)Slope on Maze Task
Oral reading: Ekwall reading grade
Silent reading: Ekwall reading grade
Oral reading: Ekwall speed scores
Silent reading: Ekwall speed scores
WRMT-Word attack(standardized)WRMT- Passage comprehension(standardized)Boder Test of Reading and SpellingPatterns
T vs. CES=.80T vs. CES=.47T vs. CES=.42T vs. CES=.63
T1 vs. CES=-.02T1 vs. CES=.08T1 vs. CES=-.03T1 vs. CES=.78
T1 vs. CES=.22T1 vs. CES=.00T1 vs. CES=.94T1 vs. CES=.98T1 vs. CES=-.77T1 vs. CES=-.16T1 vs. CES=-.64
Intervention Measure Findings/results
Table B. Outcomes by intervention type and design (continued)

37
• C: These students received analternative reading program similarto T1 (with respect to creativewriting, spelling, phonics, andvocabulary development), butdiffered in terms of passagereading exercises. This group readfrom basal readers (n=13).
Homan et al. (1993)• T1 (Repeated Reading): In pairs
with close teacher supervision,student read the same passagefour times. Peers did not givefeedback when a word could notbe pronounced (n=13).
• T2 (Assisted Non RepetitiveReading): Students used threestrategies: echo reading (thestudents echo the teacher’sreading), unison reading (thestudents and teacher readtogether), cloze reading (theteacher reads the selectionpausing to let students randomlyread words aloud). Students didnot repeat any passagespreviously read (n=13).
O’Shea et al. (1987)• T1 (Fluency Cue): Students were
given a cue to read quickly andaccurately. Students wereexposed to all three levels of therepeated reading condition: one,three, and seven readings (n=16).
• T2 (Comprehension Cue):Students were given a cue to readfor comprehension. Students wereexposed to all three levels of therepeated reading condition: one,three, and seven readings (n=16).
Multi-component
Bos & Anders (1990)• T1 (Definition instruction activity):
Directly teaching vocabulary termsfrom the content area text with anemphasis on oral recitation;
Errors: Words read incorrectly (notcounting hesitations, proper namemispronounciations, repetition ofone word, and repetitions of aword for self correction)
Time: Number of minutes requiredfor a student to read each selection
Comprehension retellings: Basedon unprompted story retellings
Reading rate: The number of wordsread correctly divided by the totalreading timeComprehension: The percentage ofstory propositions (POP) retoldduring the final reading
Multiple choice comprehensionposttest
T1 vs. T2ES=.04
T1 vs. T2ES=.50
T1 vs. T2ES=.35
T1 vs. T2ES=.03
T1 vs. T2ES=.89
T1 v. T2ES=1.29T1 vs. T3ES=.43T1 vs. T4
Intervention Measure Findings/results
Table B. Outcomes by intervention type and design (continued)

38
Table B. Outcomes by intervention type and design (continued)
correct and automaticpronunciation; and memorizationof precise definitions (n=11).
• T2 (Semantic mapping strategies):Construction of a hierarchicalrelationship map from thevocabulary list on which importantideas of the passage are listedacross the top and relatedvocabulary is listed down the side(n=19).
• T3 (Semantic feature analysiscondition): Predictions were madeabout the relationships amongconcepts using a relationshipmatrix on which important ideas ofthe passage are listed across thetop and related vocabulary is listeddown the side (n=17).
• T4 (Semantic/syntactic featureanalysis condition): Predictionswere made about the relationshipsamong concepts using arelationship matrix and participantpredicted the answers for cloze-type sentences using the matrixas a guide (n=14).
Bos et al. (1989)• T1 (Semantic feature analysis
condition): Predictions were madeabout the relationships amongconcepts using a relationshipmatrix on which important ideas of
Multiple choice vocabulary posttest
Written recall posttest
Scriptal knowledge recall posttest
Multiple choice comprehensiontest: vocabularyMultiple choice conceptualknowledge items
ES=1.14T2 v. T3ES=.33T2 vs. T4ES=.08T3 vs. T4ES=.20T1 vs. T2ES=1.24T1 vs. T3ES=1.00T1 vs. T4d
ES=.62T2 vs. T3ES=.04T2 vs. T4ES=.65T3 vs. T4ES=.53T1 vs. T2ES=.22T1 vs. T3ES=.23T1 vs. T4d
ES=.07T2 vs. T3ES=.62T2 vs. T4ES=.22T3 vs. T4ES=.46T1 vs. T2ES=.17T1 vs. T3ES=.20T1 vs. T4d
ES=.01T2 vs. T3ES=.52T2 vs. T4ES=.23T3 vs. T4ES=.31
T1 vs. T2ES=.94T1 vs. T2ES=.69
Intervention Measure Findings/results

39
the passage are listed across thetop and related vocabulary is listeddown the side (n=25).
• T2 (Dictionary method/typicalinstruction): Participants used thedictionary to write definitions ofwords supplied on their vocabularylist. Teacher first read the words,then students repeated. Finallystudents used a dictionary to writea definition and sentence usingthe word as it related to theirsocial studies content (n=11).
Fuchs, Fuchs, & Kazdan (1999)• T (Peer-assisted learning
strategies: PALS): Partner reading,paragraph shrinking, and predictionrelay implemented using a dyadicstructure (n=52; LD n=35).
• C (Current practices): School’stypical reading instruction with nopeer-mediated learning activities(n=50; LD n=39).
Hasselbring & Goin (2004)• T (Computer-based reading
instruction): Instruction in PeabodyReading Lab: Reading Lab withvideos to support students inbuilding mental models from text;Word Lab with practice readingwords on timed tasks; SpellingLab with practice typing a wordthat is pronounced, broken intoparts and used in a sentence plusadditional spelling fluency practice(n=63).
• C (Current practices): School’stypical reading instruction (n=62).
Kennedy & Backman (1993)• T (Remedial typical reading and
spelling instruction plusLindamood auditory discriminationin depth program): Taught throughindividual tutorial sessions withspelling taught through acombination of a phoneticapproach based on learning
Comprehensive ReadingAssessment Battery: Oral reading fluency(standardized)Comprehensive ReadingAssessment Battery:Comprehension questions(standardized)
SDRTe: Comprehension(standardized)SDRT: Auditory vocabulary(standardized)SDRT Phonetic analysis(standardized)SDRT Structural analysis(standardized)
LACf
May(Standardized)SORTg
May(Standardized)SAT-Sph
May(Standardized)
T vs. CES=.05
T vs. CES=.31
T vs. CES=.99T vs. CES=.75T vs. CES=.23T vs. CES=.44
T vs. CES=1.55
T vs. CES=.13
T vs. CES=.57
Intervention Measure Findings/results
Table B. Outcomes by intervention type and design (continued)

40
patterns, principles, and rules;sight words and commonsequences; and word families andhomonyms. Plus, Lindamoodreading and spelling multisensoryapproach to develop phonologicalawareness. Questioningtechniques are used to stimulateawareness of motor feedbackfrom articulatory movements.Blocks are used to representsyllables, which in turn helps makethe connection between soundsand orthographic symbols (n=10).
• C (Typical remedial instruction):Taught through individual tutorialsessions with spelling taughtthrough a combination of aphonetic approach based onlearning patterns, principles, andrules; sight words and commonsequences; and word families andhomonyms (n=10).
Mastropieri et al. (2001)• T (Peer Tutoring Condition):
Partner reading with errorcorrection, passage summarization(Get the Gist), and questioningstrategies for during and afterreading implemented using same-age peer tutoring sessions (n=11).
• C (Current practices): School’stypical reading instruction (n=11).
Vocabulary:
Anders, Bos, & Filip (1983)• T (Semantic feature analysis):
Students learn how to categorizewords and determine differencesand similarities among ideas(n=31).
• C (typical instruction): Look upwords in dictionary (n=31).
GORTi
May(Standardized)
Open-ended comprehension test
Comprehension test total
T vs. CES=-.28
T vs. CES=1.14
T vs. CES=1.66
Intervention Measure Findings/results
Table B. Outcomes by intervention type and design (continued)

41
Johnson, Gersten, & Carnine (1987)• T1 (small set): Computer drill &
practice on a small set of wordswith cumulative review (n=11).
• T2 (large set): Computer drill &practice on a large set of wordswithout cumulative review (n=11).
Mastropieri, Scruggs, Levin, Gaffney,& McLoone (1985)• T1 (pictorial mnemonic strategy):
Taught 14 words using a keywordand an associated picture with astrategy for remembering meaningof words (n=16).
• T2 (direct instruction): Taught 14words by showing picture; nostrategy for remembering meaningof words (n=16).
McLoone, Scruggs, Mastropieri, &Zucker (1986)• T1 (mnemonic strategy): Taught 14
words using a keyword and anassociated picture with a strategyfor remembering meaning ofwords (n=30).
• T2 (directed rehearsal): Taught 14words by repeating words andtheir definitions (n=30).
Viet, Scruggs, & Mastropieri (1986)• T1 (mnemonic strategy): Taught
dinosaur attributes using a pictorialmethod (n=32).
• T2 (direct instruction): Taughtdinosaur vocabulary and facts usingteacher-directed questioning, groupresponding, and review (n=32).
Percent correctPercent correctSessions to mastery
Recall
Training task
Transfer task
Attribute learningDelayed recall identificationDelayed recall productionExtinction learningVocabulary applicationVocabulary loose scoringVocabulary strict scoring
T1 vs. T2ES=.18ES=.41ES=.85
T1 vs. T2 exp. 1ES=2.45T1 vs. T2 exp. 2ES=1.05
T1 vs. T2ES=3.00T1 vs. T2ES=1.65
T1 vs. T2ES=1.70ES=1.95ES=1.38ES=2.25ES=1.33ES=1.48ES=1.16
Intervention Measure Findings/results
a. All measures are researcher-developed unless indicated by a parenthetical note (e.g., standardized)b. WRMT=Woodcock Reading Mastery Test; WRMT-R=Woodcock Reading Mastery Test – Revisedc. CTOPP=Comprehensive Test of Phonological Processingd. Only this comparison was included in the meta-analysise. SDRT=Stanford Diagnostic Reading Testf. LAC=Lindamood Auditory Conceptualization Testg. SORT=Slosson Oral Reading Testh. SAT-Sp=Stanford Achievement Test -Spellingi. GORT=Gray Oral Reading Test
Table B. Outcomes by intervention type and design (continued)

42

43

44