Embed Size (px)
Citation preview
SENATE FINANCE COMMITTEE
Stuck in Neutral: In Search of the Elusive Solution to
Transportation Funding Challenges
Jason Powell
Legislative Fiscal Analyst
November 14, 2012
SENATE FINANCE COMMITTEE
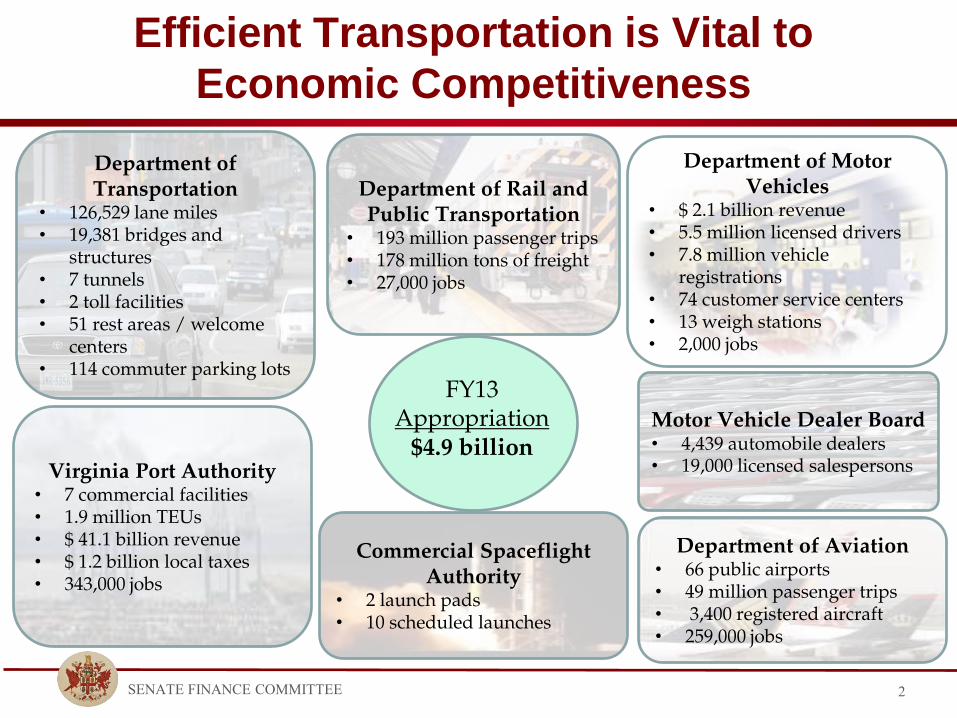
Efficient Transportation is Vital to
Economic Competitiveness
2
Department of Transportation
• 126,529 lane miles • 19,381 bridges and
structures • 7 tunnels • 2 toll facilities • 51 rest areas / welcome
centers • 114 commuter parking lots
Department of Aviation • 66 public airports • 49 million passenger trips • 3,400 registered aircraft • 259,000 jobs
Virginia Port Authority • 7 commercial facilities • 1.9 million TEUs • $ 41.1 billion revenue • $ 1.2 billion local taxes • 343,000 jobs
Department of Motor Vehicles
• $ 2.1 billion revenue • 5.5 million licensed drivers • 7.8 million vehicle
registrations • 74 customer service centers • 13 weigh stations • 2,000 jobs
Department of Rail and Public Transportation
• 193 million passenger trips • 178 million tons of freight • 27,000 jobs
FY13 Appropriation
$4.9 billion Motor Vehicle Dealer Board • 4,439 automobile dealers
• 19,000 licensed salespersons
Commercial Spaceflight Authority
• 2 launch pads • 10 scheduled launches

SENATE FINANCE COMMITTEE
Congestion Threatens Economic
Productivity and Competitiveness
• The Commonwealth is home to three of the nation’s most congested regions.
– Cost to citizens and businesses in lost time, money and safety.
– Estimated annual economic loss of $3.7 billion.
• Cost to business productivity and Virginia’s ability to attract employers.
– Slipped to the 3rd “Top State for Business” in CNBC annual rankings.
– Cites a rank of 33rd among states in Transportation & Infrastructure.
• S&P has cautioned that costs of maintaining infrastructure and expanding capacity may fall to state and local governments.
3
Region
Annual Hours of Delay
Annual Fuel per Commuter
Annual Cost per Commuter
National Rank
Northern Virginia 74 37 gallons / year $1,495 1
Hampton Roads 34 9 gallons / year $ 654 29
Richmond 20 5 gallons / year $ 375 63
Source: Texas Transportation Institute, 2011 Urban Mobility Report.
SENATE FINANCE COMMITTEE
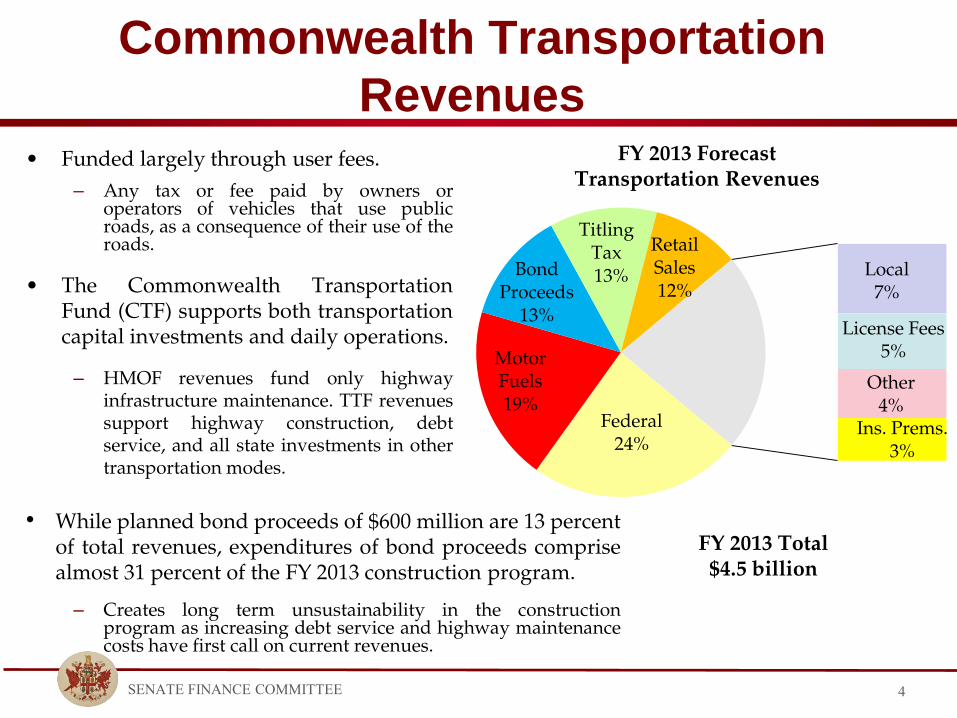
Federal 24%
Motor Fuels 19%
Bond Proceeds
13%
Titling Tax
13%
Retail Sales 12%
Local 7%
License Fees 5%
Other 4%
Ins. Prems. 3%
Commonwealth Transportation
Revenues
4
• Funded largely through user fees.
– Any tax or fee paid by owners or operators of vehicles that use public roads, as a consequence of their use of the roads.
• The Commonwealth Transportation Fund (CTF) supports both transportation capital investments and daily operations.
– HMOF revenues fund only highway infrastructure maintenance. TTF revenues support highway construction, debt service, and all state investments in other transportation modes.
FY 2013 Forecast Transportation Revenues
FY 2013 Total $4.5 billion
• While planned bond proceeds of $600 million are 13 percent of total revenues, expenditures of bond proceeds comprise almost 31 percent of the FY 2013 construction program.
– Creates long term unsustainability in the construction program as increasing debt service and highway maintenance costs have first call on current revenues.

SENATE FINANCE COMMITTEE
Financing Transportation
5
Motor Fuels Taxes
HMOF $.1485
Every 1¢ generates about $50 million. TTF .0250
DMV .0015
Total (per gallon) $.1750
Motor Vehicle Sales and Use Tax
HMOF 2.00%
Every 1% generates approximately $182 million. TTF 1.00%
Total 3.00%
Motor Vehicle Registration
HMOF $ 26.00
Every $1 generates approximately $6 million.
DMV 4.00
TTF 3.00
Department of Health – EMS 6.00
State Police 1.50
Department of Health – RSAF 0.25
Total $ 40.75
State Sales and Use Tax
TTF 0.50% Every 1% generates approximately $1.0 billion.
Motor Vehicle Insurance Premiums
Priority Transportation Fund 1/3 prior
year
collection
Every 0.25% generates about $40 million.
Recordation Tax
Transit Operating
HMOF 2¢ per $100
1¢ per $100 Every 1¢ generates approximately $13 million.
Motor Vehicle Rental Tax
Rail Capital 3.0% Every 1% generates approximately $8 million.

SENATE FINANCE COMMITTEE
Local Funding Mechanisms
Mechanism Issues
Regional Motor Fuels Tax • 2.1 percent sales tax on motor fuel in the localities represented on the Northern Virginia and Potomac-Rappahannock Transportation Commissions.
- FY 2012 revenues totaled approximately $78.6 million.
Local Option Income Tax • Certain Northern Virginia and Hampton Roads localities authorized to levy local income tax by referendum for transportation purposes.
- Limited duration, not adequate to service long-term debt. - Has not been used.
Proffers • In FY11, 40 localities collected more than $36 million in proffered payments.
• Primary uses are transportation and schools.
Debt • Local governments can dedicate a portion of their general revenues for debt service on transportation bonds.
• State programs manage local and regional debt pools for Transportation Districts. (i.e. Route 28, NVTD, Oak Grove Connector).
Impact Fees • Can be levied in lieu of proffers.
• Can apply to all new development, not just development authorized because of rezoning.
Tax Districts • Additional property tax assessment on commercial and industrial properties.
• Dedicated revenues can be used to support specific projects.
6

SENATE FINANCE COMMITTEE
Withdrawal from
Secondary System
• Legislation approved by the 2001 General Assembly allows counties to assume responsibility for their local roads, as follows:
– County Board of Supervisors must pass resolution requesting to resume responsibility for secondary highways.
– VDOT Commissioner may then enter into an agreement with the respective county to take over any portion of the state secondary system.
– Could include planning, constructing, maintaining, and operating such highways.
– Agreement would specify equipment, facilities, personnel, and funding to implement the transfer.
• To date, no county has taken advantage of the authority.
– Increases local prioritization of projects and funding decisions.
– Trade-off is assumed maintenance costs and level of State reimbursement.
7
SENATE FINANCE COMMITTEE
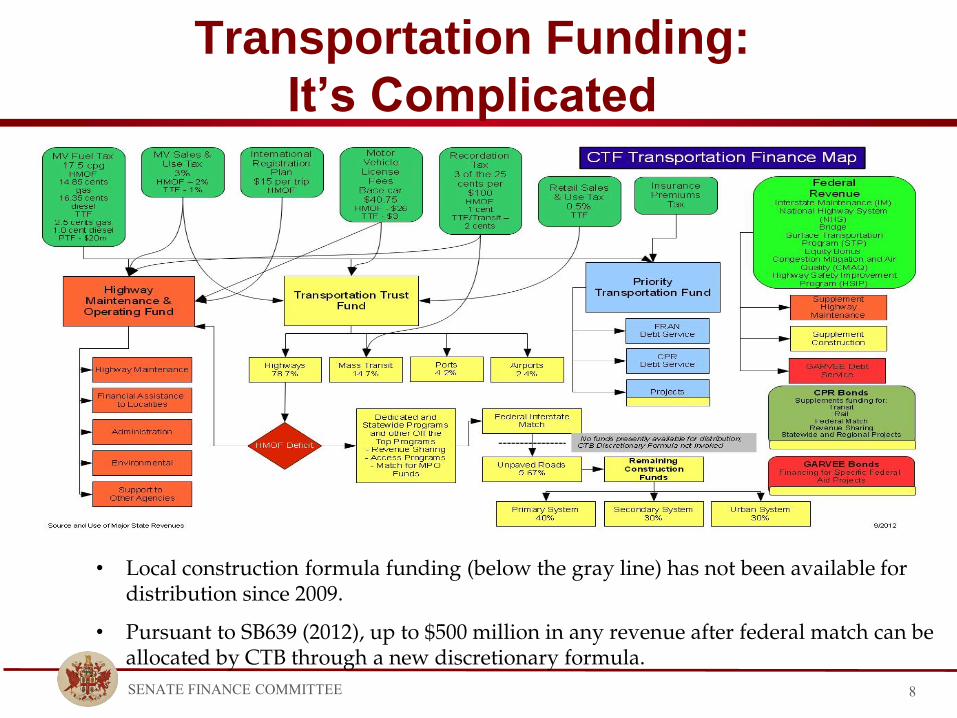
Transportation Funding:
It’s Complicated
• Local construction formula funding (below the gray line) has not been available for distribution since 2009.
• Pursuant to SB639 (2012), up to $500 million in any revenue after federal match can be allocated by CTB through a new discretionary formula.
8

SENATE FINANCE COMMITTEE
Primary State Funding Mechanism:
Motor Fuels Tax
9
Comparison of State Gasoline and Diesel Taxes
State Gas Tax Diesel Tax Indexed
Virginia 17.5 17.5 No
North Carolina 37.5 37.5 Yes
Washington D.C. 23.5 23.5 No
West Virginia 33.4 32.1 Yes
South Carolina 16.8 16.8 Yes
Maryland 23.5 24.3 No
Pennsylvania 32.3 39.2 Yes
Tennessee 21.4 18.4 No
Georgia 28.6 31.8 Yes
Kentucky 29.9 26.9 Yes
Massachusetts 23.5 23.5 No
New York 51.3 50.3 Yes
New Jersey 14.5 17.5 No
Average for All States 30.9 30.1 Source: API October 2012
• As a static cents per gallon levy, motor fuels tax receipts have lost purchasing power since 1986.
– The effects are compounded by increased fuel efficiency and inflation.
• Since motor fuel taxes were not indexed from the outset, it would require doubling the tax to achieve 1987 purchasing power.
– Compared to the cost of primary price inputs, as measured by the producer price index (PPI), the fixed levy has a relative purchasing power of approximately 8 cents.

SENATE FINANCE COMMITTEE
Despite Growth in Motor Fuels Tax Collections,
Revenue per Mile of Travel is Declining
2000 2001 2002 2003 2004 2005 2006 2007 2008 2009 2010
All VMT % change 0 -0.5% 3.6% 5.5% 8.2% 10.5% 11.6% 12.6% 12.9% 11.4% 13.0%
Revenue Per VMT Percent Change 0 -0.3% -2.2% -2.3% -0.3% -2.0% -0.6% -2.7% -2.6% -3.9% -6.4%
Revenue Percent Change 0 -0.8% 1.3% 3.1% 7.9% 8.3% 11.0% 9.6% 10.0% 7.0% 5.8%
-10.0%
-5.0%
0.0%
5.0%
10.0%
15.0%
Cumulative Percent Change of Motor Fuel Revenue and VMT
10
• In addition to reduced purchasing power relative to cost inputs, increased fuel economy, and alternative fuel vehicles have reduced revenues relative to highway usage.

SENATE FINANCE COMMITTEE
Responsibility for Highway Infrastructure was
Established in the 1930s
• Virginia has the third-largest state-maintained highway system in the country, behind North Carolina and Texas.
– Interstate – 1,118 miles of federally-designated, access controlled highways. – Primary – 8,041 miles of major arterials. – Secondary – 48,305 miles of local county roads including subdivisions and
collectors. Also includes some major arterials. – Urban – all roadways within city and town boundaries except Interstates.
Includes the counties of Arlington and Henrico.
• The Commonwealth maintains both roads of statewide and regional significance as well as local roads in the counties.
– Only four other states – Alaska, Delaware, North Carolina and West Virginia – maintain and construct local roads.
• Funding challenges have resulted from tensions around local zoning decisions and development patterns which increase the maintenance costs borne by the state.
11

SENATE FINANCE COMMITTEE
Responsibility for Public Transit Programs
was Established in the 1980s
• Responsibility for funding transit programs is shared by federal, state, and local sources in addition to fares.
– Currently, state payments cover less than 20 percent of annual operating expenses and exclude labor costs.
• State share of funding is being diluted as more expensive projects in Northern Virginia and Hampton Roads come on line, and services are expanded in other regions.
– Proposal to implement efficiency based distribution of state contributions (SJ 297) may create instability and discourage the expansion of services.
• Northern Virginia localities benefit from a 2.1% regional motor fuels sales tax to support transit operating costs.
12
29%
26%
21%
23%
Fares
Local
Federal
State
Transit Expenditures 2008 -2011

SENATE FINANCE COMMITTEE
Other Transportation Program Activities
Are Primarily State Supported
• Port operations -- including sea, air, and space facilities -- are supported by revenues of the TTF.
– The Port of Virginia receives approximately $33.6 million in TTF allocations and more than $105 million in terminal revenues.
– The Virginia Commercial Spaceflight Authority is appropriated $9.5 million in FY13 and FY14.
• The Department of Motor Vehicles is the primary point of collection for most transportation revenues and is supported by fees levied on driver’s licenses, vehicle registrations, titles, and records.
– As operations of the transportation secretariat are largely funded by nongeneral fund sources; increases in VRS, health insurance, and IT rates have to be funded from annual collections.
• Revenues of the TTF are also used to calculate debt capacity for transportation programs prior to the consideration of other operational demands.
13

SENATE FINANCE COMMITTEE
Federal Funding is Stable,
for Now… • Federal transportation legislation, MAP-21, was signed into law in July 2012,
providing a two-year authorization.
– Predecessor legislation, SAFETEA-LU, expired at the end of federal fiscal year 2009; spending was maintained through a series of ten continuing resolutions.
– Extends the current authorized funding levels through the end of this federal fiscal year and authorizes $105 billion over the next two years.
– Primary policy focus is on:
Consolidating 60 discreet funding programs into five;
Mandating implementation of performance measures;
Expanding the federal infrastructure banking program (up to 49% of project cost); and
Expanding state tolling programs.
• Federal transportation commitments -- backed by federal gas taxes -- have required general fund supplements of $8 billion in FY 2009, $9 billion in FY 2010, $15 billion in FY 2011, and $18.8 billion for FY 2012 through 2014.
– Federal general fund transfers are continued at the current level in the reauthorization.
– Transportation general funds are subject to sequestration beginning in FY 2014.
14

SENATE FINANCE COMMITTEE
• In 1986, when most transportation funding sources and responsibilities were established, the primary challenges were:
– Forecast decline in construction funding relative to maintenance;
– Demand for dedicated transit funding; and
– Dedicated funding for capital expansion at the Port of Virginia.
The More Things Change…
15
Source: Report of the Special Subcommittee on Highway Fund Revenues and the Highway Construction Revenue Enhancement Act, 2/4/86.
SENATE FINANCE COMMITTEE
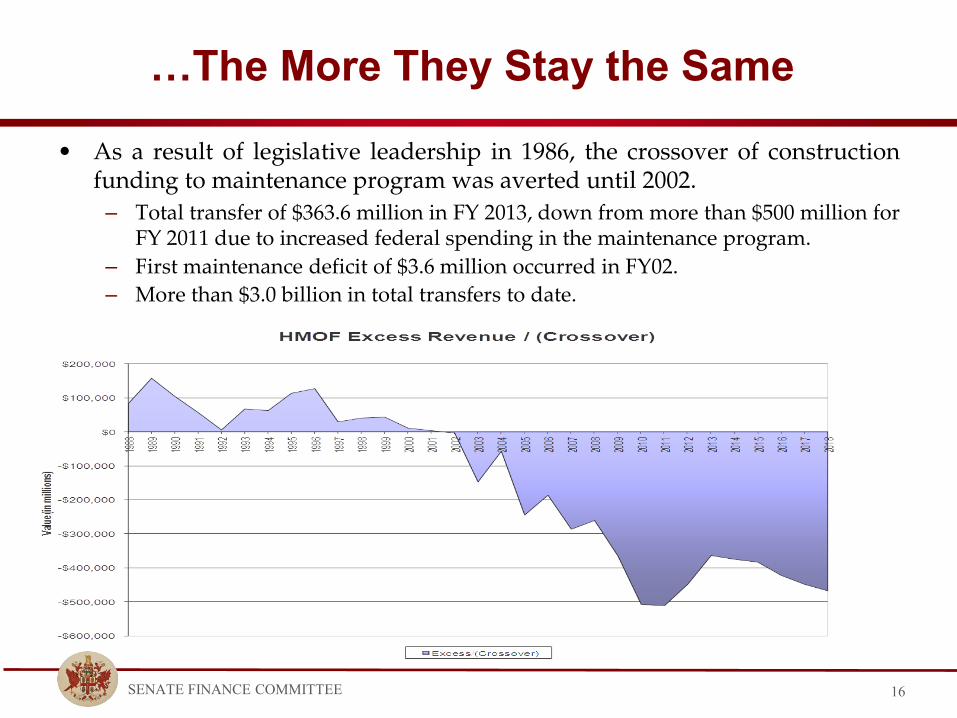
…The More They Stay the Same
• As a result of legislative leadership in 1986, the crossover of construction funding to maintenance program was averted until 2002.
– Total transfer of $363.6 million in FY 2013, down from more than $500 million for FY 2011 due to increased federal spending in the maintenance program.
– First maintenance deficit of $3.6 million occurred in FY02.
– More than $3.0 billion in total transfers to date.
16
SENATE FINANCE COMMITTEE
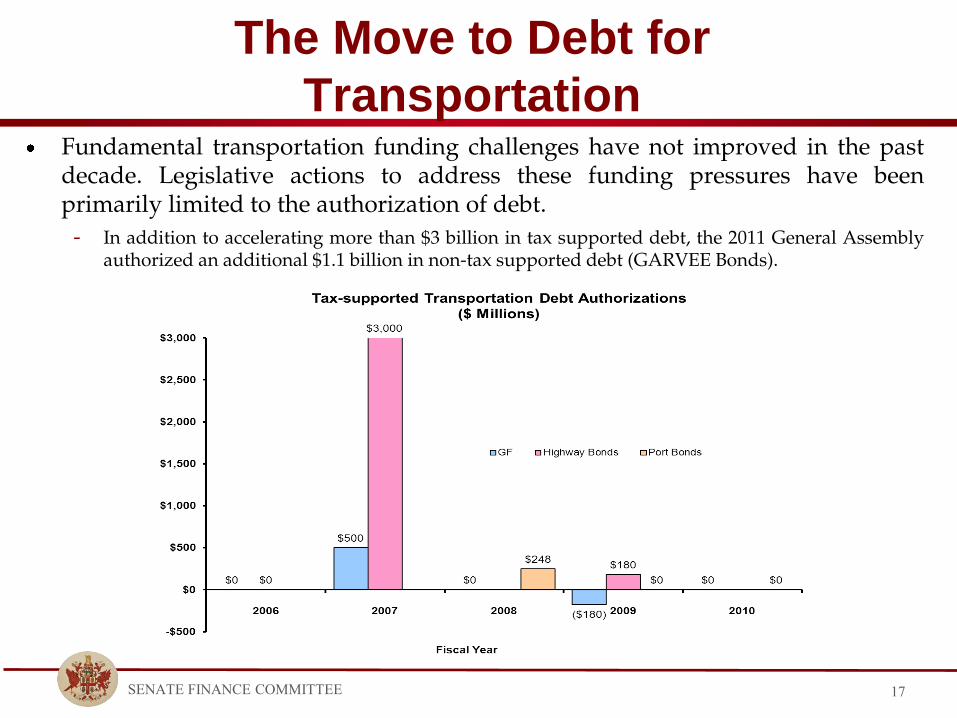
The Move to Debt for
Transportation Fundamental transportation funding challenges have not improved in the past decade. Legislative actions to address these funding pressures have been primarily limited to the authorization of debt.
- In addition to accelerating more than $3 billion in tax supported debt, the 2011 General Assembly authorized an additional $1.1 billion in non-tax supported debt (GARVEE Bonds).
17
SENATE FINANCE COMMITTEE
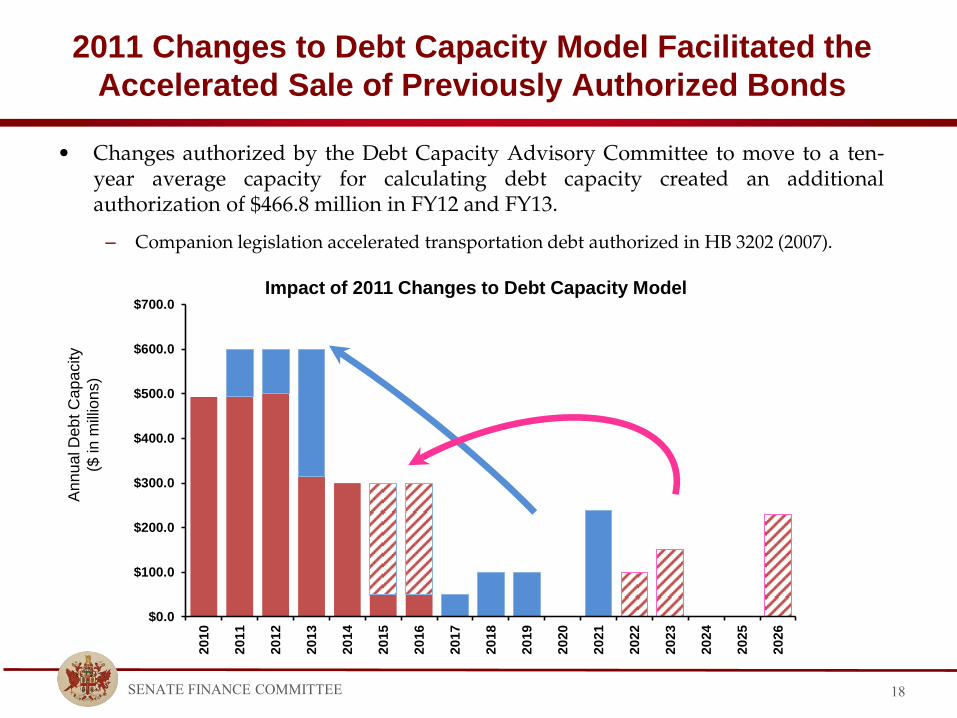
2011 Changes to Debt Capacity Model Facilitated the
Accelerated Sale of Previously Authorized Bonds
18
• Changes authorized by the Debt Capacity Advisory Committee to move to a ten-year average capacity for calculating debt capacity created an additional authorization of $466.8 million in FY12 and FY13.
– Companion legislation accelerated transportation debt authorized in HB 3202 (2007).
$0.0
$100.0
$200.0
$300.0
$400.0
$500.0
$600.0
$700.0
20
10
20
11
20
12
20
13
20
14
20
15
20
16
20
17
20
18
20
19
20
20
20
21
20
22
20
23
20
24
20
25
20
26
An
nu
al D
eb
t C
ap
acity
($ in
mill
ion
s)
Impact of 2011 Changes to Debt Capacity Model

SENATE FINANCE COMMITTEE
Funding Challenges have Resulted in Alternative
Financing Mechanisms
• Bonds – Virginia has increasingly relied on debt financed projects; however, the use of tax-supported debt for transportation projects can crowd out other statewide capital project needs.
• Loans – At both the federal and state level, low-cost loans to project sponsors are being increasingly used to subsidize the cost of private capital.
– Federal TIFIA program.
– Virginia Transportation Infrastructure Bank.
• Tolls – Proposed not only for new capacity, but increasingly for maintenance of existing assets.
– Virginia has several state-owned toll facilities in addition to new privately constructed facilities coming on line.
– “We are pursuing tolling not because we want to, but because we have to.” – Secy. Connaughton (Richmond-Times Dispatch 8/16/12).
19

SENATE FINANCE COMMITTEE
High Dollar Construction Projects are Delivered
Through Increasingly Complex Structures
• Public-Private Partnerships
– Virginia’s Public-Private Transportation Act is a national model for financing transportation facilities.
– Flexible financing packages utilizing bonds and loans, as well as private capital, allow for larger investments.
– Could use financing similar to a capital lease, but increasingly derive long-term return on capital through tolls.
• The Office of Transportation Public Private Partnerships (OTP3) is responsible for vetting PPTA proposals. – Not established in statute (1 FTE in Office of the Secretary, 12 VDOT employees). – Facilitates review of proposals primarily through a staff augmentation contract. – About $4 million in total expenditures since 2011; $1.5 million annual budget. – Attorney General opinion clarifies that agencies are the responsible public
entities.
• Organizational structures intended to facilitate project delivery limit the Commonwealth’s direct oversight of construction costs and time schedules. – Limited public access to project documents or financial records. – Generally higher cost of capital.
20

SENATE FINANCE COMMITTEE
Cost and Complexity of Large Projects
Increase Challenges
• Metro’s Silver Line extension to Dulles Airport and Loudoun County is the “perfect storm” of high project cost and management complexity. – Managed by the Metropolitan Washington Airports Authority (MWAA) but
funded from federal, state, and local sources. – Total construction cost is estimated at $5.7 billion. – Depending on financing, interest on the debt issued to construct the project will
total between $7 and $10 billion.
• Downtown / Midtown Tunnel / MLK Expressway – $2.1 billion investment in new tunnel capacity combined with maintenance of
existing facility and extension of new surface lanes. – Requires a “system-wide” tolling structure be established for all three facilities to
recover costs primarily related to the new tunnel.
• I-95 Capacity Expansion / High-Occupancy Toll Lanes – Leverages approximately $1 billion highway construction investment with a
state commitment of $71 million. – Private financing package, variable rate tolling.
21
SENATE FINANCE COMMITTEE
US Route 460 Corridor Improvement Project Uses Innovative
Financing Mechanisms and Most Remaining Debt Authorization
• The Commonwealth chartered a 63-20 non-stock nonprofit corporation to act as principle “private” partner in the P3 relationship – was last employed for Pocahontas Parkway.
– Day-to-day activities will be handled by VDOT staff.
• Funding Corporation will use $216 million net proceeds from toll bonds.
– BBB- rated.
– Estimated average daily traffic count of 5-6 thousand vehicles.
• The Commonwealth will provide $1.18 billion in public funding.
– VDOT will provide $930 million primarily from bond proceeds.
$150 million CPR (HB 3202) and $631 million GARVEE.
– The Port Authority will provide $250 million dollars from their TTF allocation.
• The Virginia Transportation Infrastructure Bank (capitalized in FY11 and FY12) has approved a backstop line of credit of $80 million.
• The project has applied for a federal TIFIA loan of $422 million.
• Actual project construction and delivery is a fixed price design-build.
– Comprehensive agreement expected to be executed in December 2012.
22

SENATE FINANCE COMMITTEE
Recent Legislative Activity
Session Legislative Proposals
2000 Virginia Transportation Act (SB 33) • Authorized $800 million in Federal Revenue Anticipation Notes, subsequently increased to $1.2 billion • Legislative mandate for specific investments with a total construction cost over $17 billion
2002 Regional Referendum (SB 668) • November 2002 ballot initiative • 1% sales tax in Hampton Roads – defeated 38-62 • ½% sales tax in Northern Virginia – defeated 45-55
2004 Virginia Investment Act (SB 635) • Increase gas and diesel tax by $0.03 • Remove sales tax exemption on motor fuel (wholesale rate) • Increase titling tax by 1% (from 3% to 4%) • Dedicate auto insurance premiums to transportation • Increase vehicle registration fee
2006 Driving Virginia’s Future (SB 708) • Equalize gas and diesel tax rates • Remove 2% discount on motor vehicle sales • Remove sales tax exemption on auto repairs • Dedicate auto insurance premiums to transportation
23
Note: Italics indicates proposals that have been implemented in statute.

SENATE FINANCE COMMITTEE
Recent Legislative Activity
Session Legislative Proposals
2007 SB 1379 / HB 3202 • Remove sales tax exemption on motor fuels (4/1 split) • Dedicate insurance premiums revenue to debt service • Equalize diesel and gas tax rates • Dedicate 2/3 undesignated GF balances to transportation • HR and NOVA local revenues (sales tax, grantor’s tax, vehicle rental tax)
2008 (SSII) A Dynamic Model for the Future (SB 3010) • Recapture Index – approx. 1.6 cpg, annual / 10-years • Remove sales tax on food relative to TTF share • Increase Titling Tax by 0.75 percent • Goal of minimum of 30 percent new projects would be tolled • Seek federal waiver to impose tolls on interstates
2010 SB 343 • Index Motor Fuels Tax to corporate average fuel economy (CAFE) standards.
2011 SB 1446 • Accelerated sale of debt authorized in 2007 • Reauthorized $1.1 billion FRAN as direct GARVEE • Created Virginia Transportation Infrastructure Bank
2012 SB 639 – Senate Substitute • Index tax on motor fuels to Producer Price Index • Repeal sunset provision on local option income tax • Imposes $50 license fee on electric vehicles
24
Note: Italics indicates proposals that have been implemented in statute.

SENATE FINANCE COMMITTEE
Other State Transportation Legislation
State Legislative Action
Arkansas • November 2012 ballot initiative for ½ cent sales tax to support transportation projects was successful.
Florida • Increased auto license fees to generate approximately $200 million annually.
Georgia • July 2012 ballot initiative for 1-cent, 10-year regional sales tax (TSPLOST) was defeated.
Illinois • 2011 legislation requires legislative approval of P3 projects prior to issuance of RFP.
Mississippi • Expanded tolling authority to routes without free alternatives.
North Carolina • Delayed implementation of ferry tolls on new routes until July 2013.
• Capped motor fuels tax rate at 37.5 cents per gallon through July 2013.
West Virginia • Directed ½ of surplus appropriation to Rainy Day Fund be deposited to State Road Fund.
• Increased from 10% to 15% the total annual appropriations to Rainy Day Fund.
25
SENATE FINANCE COMMITTEE
Fundamental Questions
• A funding solution for transportation will depend on answers to the following basic questions:
– Has congestion increased to the degree that it poses an economic risk for Virginia?
– Should state transportation funds remain the primary funding source for maintenance of the existing system?
– Should state transportation funds remain the primary funding source for construction?
What is the tolerance for tolling?
What is the capacity for additional debt?
– Do opportunities exist to expand the role of regional funding programs?
• Should projects representing all modes of transportation -- including commercial aerospace, passenger rail, commuter ferry, port operations, as well as transit operations and capital needs -- be eligible for funding consideration?
26

SENATE FINANCE COMMITTEE
Fundamental Questions
• What funding sources could be used to finance transportation projects?
– State gas taxes for maintenance and construction?
– Regional gas tax increase and if so, how much?
– Should the gas tax be increased in fixed cents per gallon, or should the additional levy be an additional sales tax (similar to 2.1% ad valorem currently levied in Northern Virginia localities)?
– State sales tax?
– Regional sales tax?
– Transfer of current state General Fund revenues?
• If new revenue is raised regionally, would these funds be returned directly to localities, transferred to a regional MPO, or administered by VDOT?
27

SENATE FINANCE COMMITTEE
Possible Solutions
• Eliminate the sales tax exemption on motor fuels.
• Expand on fees for all-electric or hybrid vehicles to recover average gas tax revenues.
• Replace current excise tax with ad valorem levy.
• Provide regional funding mechanisms for transportation needs.
– 1% local option sales tax
– Expand regional motor fuel sales tax authorization.
• Implement a Mileage Based User Fee pilot project.
• Expand tolls to other interstate corridors or major corridors.
• Devolve maintenance responsibilities to localities combined with increased revenue sources.
28

SENATE FINANCE COMMITTEE
Conclusions
• An efficient transportation network is vital to economic competiveness and public safety. – From the commuter perspective, service options should be seamless. Customers
care about reliability of service. – Immediate challenge is maintaining existing service levels as state funding is
diluted among a growing network and operational cost increases.
• State investments should focus on modal interconnectivity and system coordination. – Current proposals provide an opportunity to further develop a statewide vision
for Virginia’s transportation systems.
• The 2013 General Assembly has a unique opportunity to play a leadership role in funding and managing a modern robust transportation program.
– Addressing current maintenance funding challenges and evaluation of transit funding priorities within the state formula should be considered alongside implementation of performance based funding models.
29