Embed Size (px)
Citation preview
Student Achievement and Predictors of Student Achievement and Predictors of Student Achievement in a State Level Student Achievement in a State Level Agricultural Mechanics Career Agricultural Mechanics Career Development EventDevelopment Event
Edward FranklinEdward Franklin
Glen MillerGlen Miller
Department of Agricultural EducationDepartment of Agricultural Education
College of Agriculture and Life SciencesCollege of Agriculture and Life Sciences
University of ArizonaUniversity of Arizona
IntroductionIntroduction
Agricultural mechanic instruction plays an integral part of a total high school comprehensive agricultural education program and serves as a vehicle to provide students with psychomotor skill development. An opportunity for students to gain additional agricultural mechanics experience outside of the agricultural mechanics laboratory is through participation in agricultural mechanics career development events (CDE).
Introduction (continued)Introduction (continued)
High stakes testing is used to measure student competency in mathematics, reading and writing.
Problem solving activities in the state agricultural mechanics event has included mathematical computations.
Does the level of mathematics experience affect student performance in a state-level agricultural mechanic CDE?
Literature ReviewLiterature Review
Students with the highest math scores explained 5.2 percent of variance associated with achievement on an agricultural mechanics competency evaluation (Chapman, 1987). Combination of average grade in agriculture classes and farm residence or work experience were the best predictors of student achievement in the agricultural mechanics contest (Johnson,1991; 1993).“Investigations of the prediction value of selected variables could prove useful in the development and enhancement of the contests” (Buriak, Harper and Gliem, 1985)
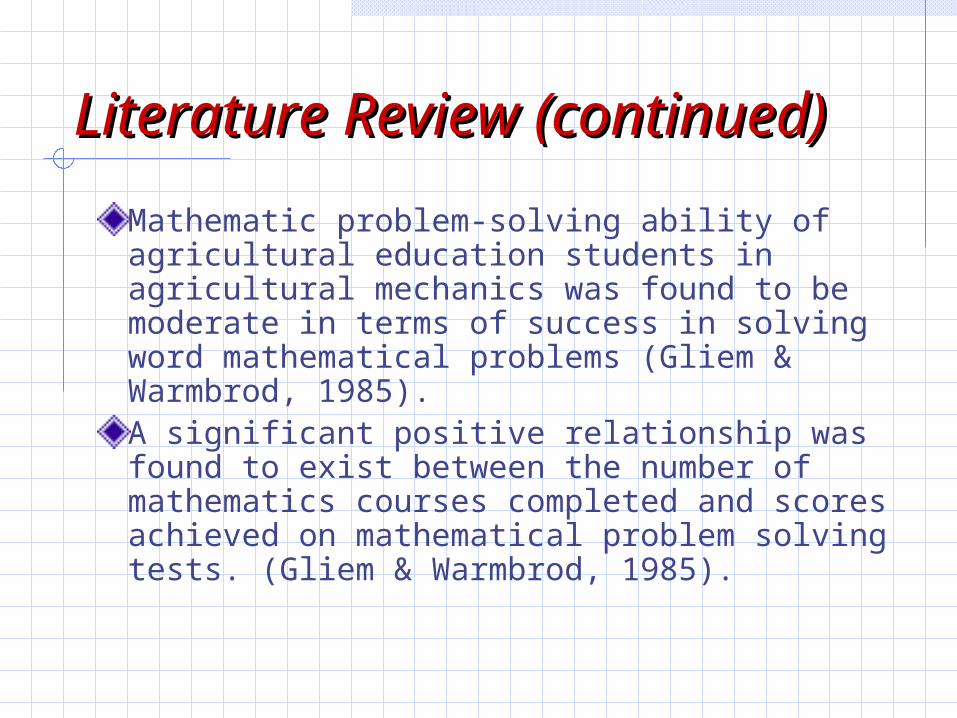
Literature Review (continued)Literature Review (continued)
Mathematic problem-solving ability of agricultural education students in agricultural mechanics was found to be moderate in terms of success in solving word mathematical problems (Gliem & Warmbrod, 1985). A significant positive relationship was found to exist between the number of mathematics courses completed and scores achieved on mathematical problem solving tests. (Gliem & Warmbrod, 1985).
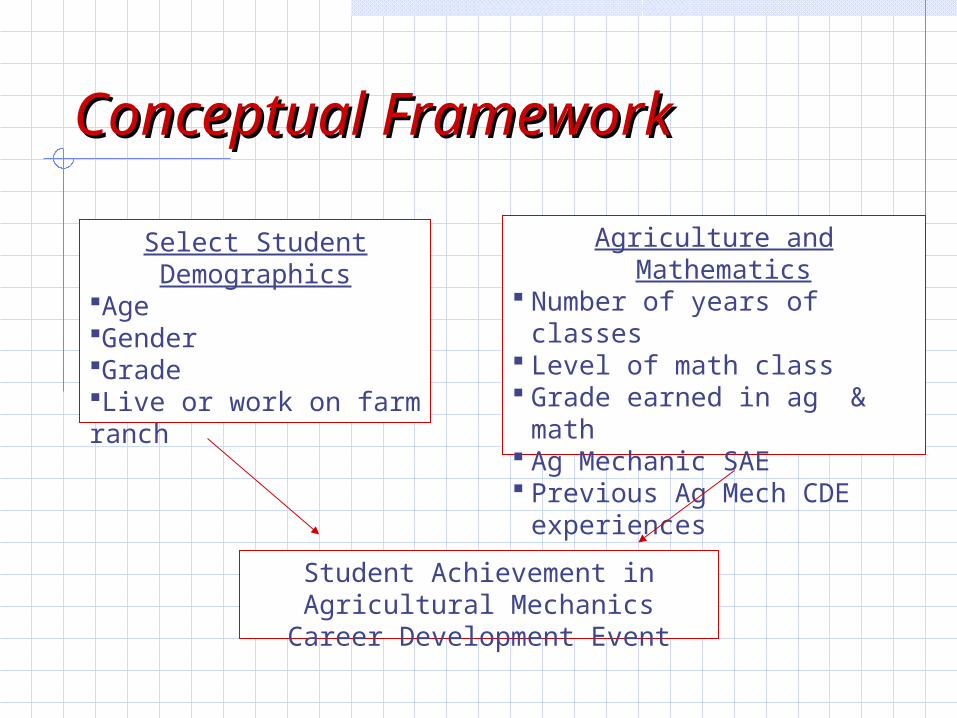
Conceptual FrameworkConceptual Framework
Select Student Demographics
AgeGenderGradeLive or work on farm ranch
Agriculture and Mathematics Number of years of classes Level of math class Grade earned in ag & math Ag Mechanic SAE Previous Ag Mech CDE
experiences
Student Achievement in Agricultural Mechanics Career Development Event
Purpose & ObjectivesPurpose & Objectives
To examine student achievement and factors related to student achievement in a state level Agricultural Mechanics Career Development Event.
1. To describe students participating in a state level Agricultural Mechanics Career Development Event based on select demographic characteristics.
2. To describe student achievement in a state level Agricultural Mechanic Career Development Event as indicated by event scores.
Purpose & Objectives Purpose & Objectives (continued)(continued)
3. To determine the relationship between student achievement in a state level Agricultural Mechanic Career Development Event and selected student demographic characteristics.
4. To determine if a linear combination of student demographic characteristics could explain a significant portion of the variance associated with achievement in a state level Agricultural Mechanic Career Development Event.
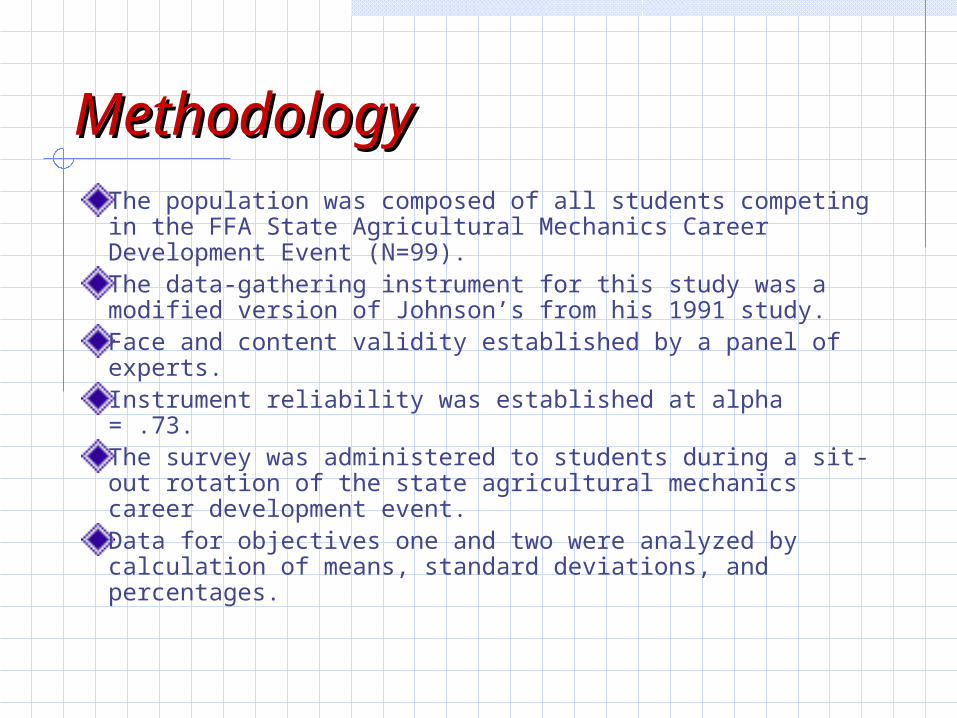
MethodologyMethodologyThe population was composed of all students competing in the FFA State Agricultural Mechanics Career Development Event (N=99). The data-gathering instrument for this study was a modified version of Johnson’s from his 1991 study. Face and content validity established by a panel of experts.Instrument reliability was established at alpha = .73. The survey was administered to students during a sit-out rotation of the state agricultural mechanics career development event. Data for objectives one and two were analyzed by calculation of means, standard deviations, and percentages.
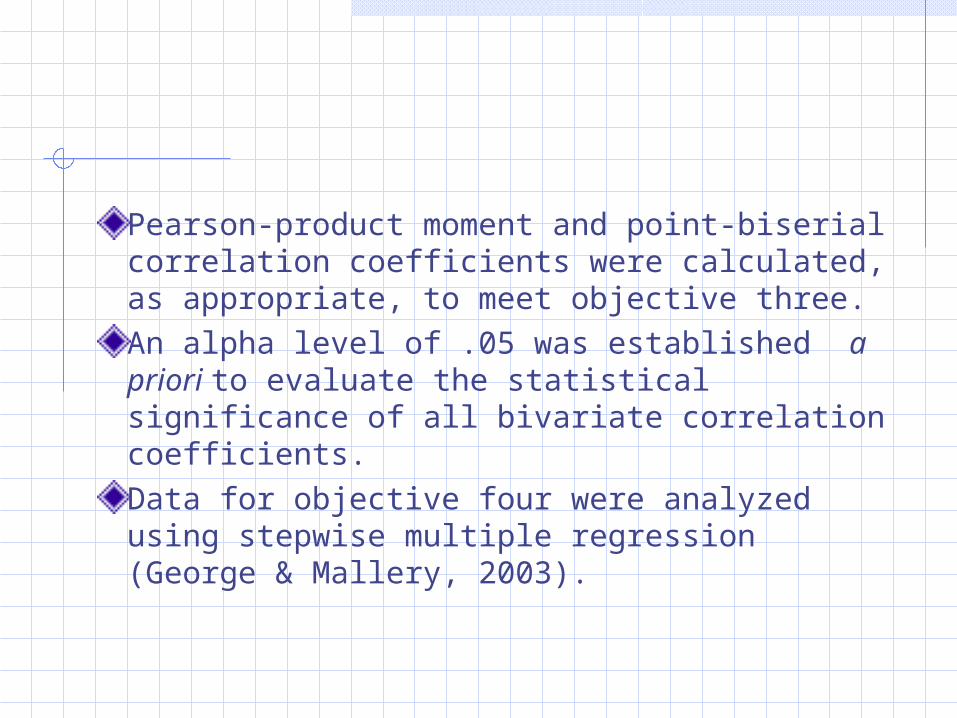
Pearson-product moment and point-biserial correlation coefficients were calculated, as appropriate, to meet objective three.
An alpha level of .05 was established a priori to evaluate the statistical significance of all bivariate correlation coefficients.
Data for objective four were analyzed using stepwise multiple regression (George & Mallery, 2003).
FindingsFindings
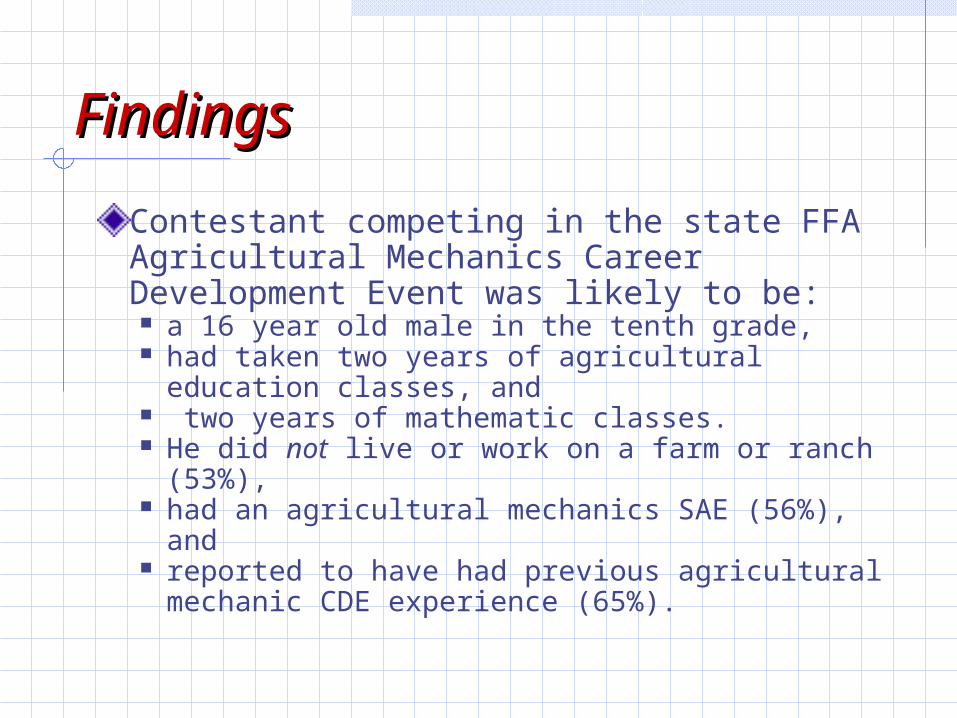
Contestant competing in the state FFA Agricultural Mechanics Career Development Event was likely to be: a 16 year old male in the tenth grade, had taken two years of agricultural education
classes, and two years of mathematic classes. He did not live or work on a farm or ranch (53%), had an agricultural mechanics SAE (56%), and reported to have had previous agricultural
mechanic CDE experience (65%).
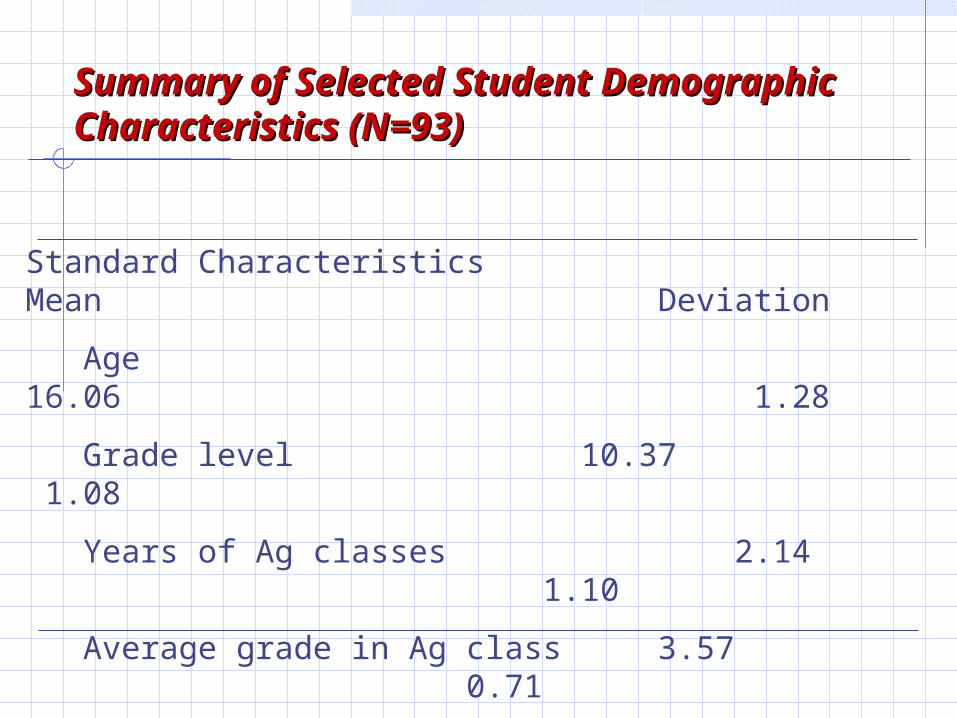
Summary of Selected Student Demographic Summary of Selected Student Demographic Characteristics (N=93)Characteristics (N=93)
Standard Characteristics Mean Deviation
Age 16.06 1.28
Grade level 10.37 1.08
Years of Ag classes 2.14 1.10
Average grade in Ag class 3.57 0.71
Years of mathematics 2.07 1.00
Avg. grade in mathematics 2.61 0.90
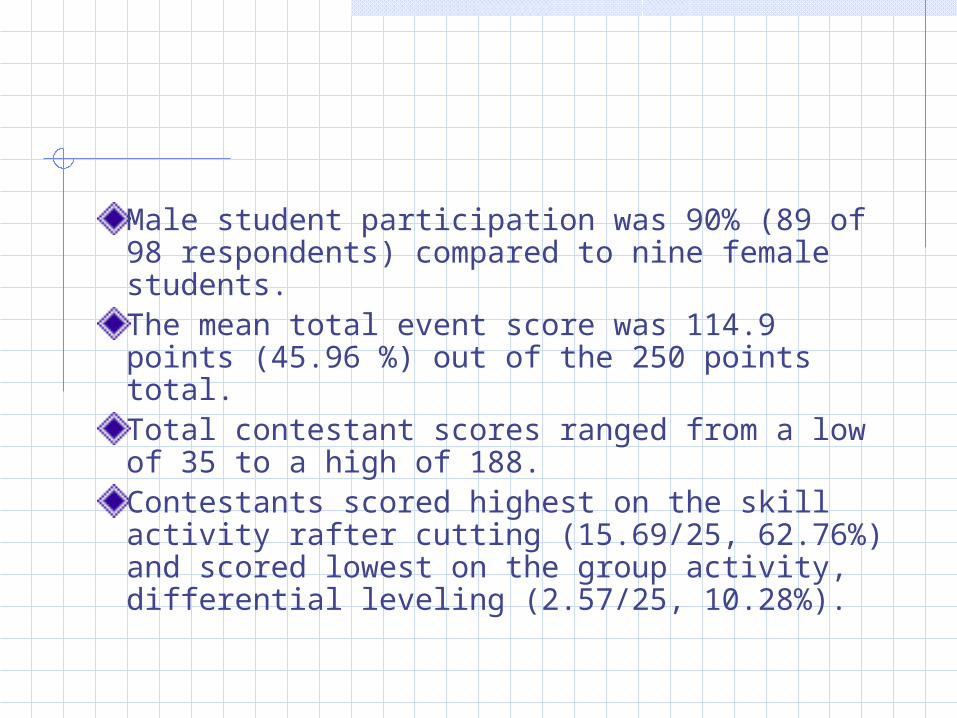
Male student participation was 90% (89 of 98 respondents) compared to nine female students. The mean total event score was 114.9 points (45.96 %) out of the 250 points total. Total contestant scores ranged from a low of 35 to a high of 188. Contestants scored highest on the skill activity rafter cutting (15.69/25, 62.76%) and scored lowest on the group activity, differential leveling (2.57/25, 10.28%).
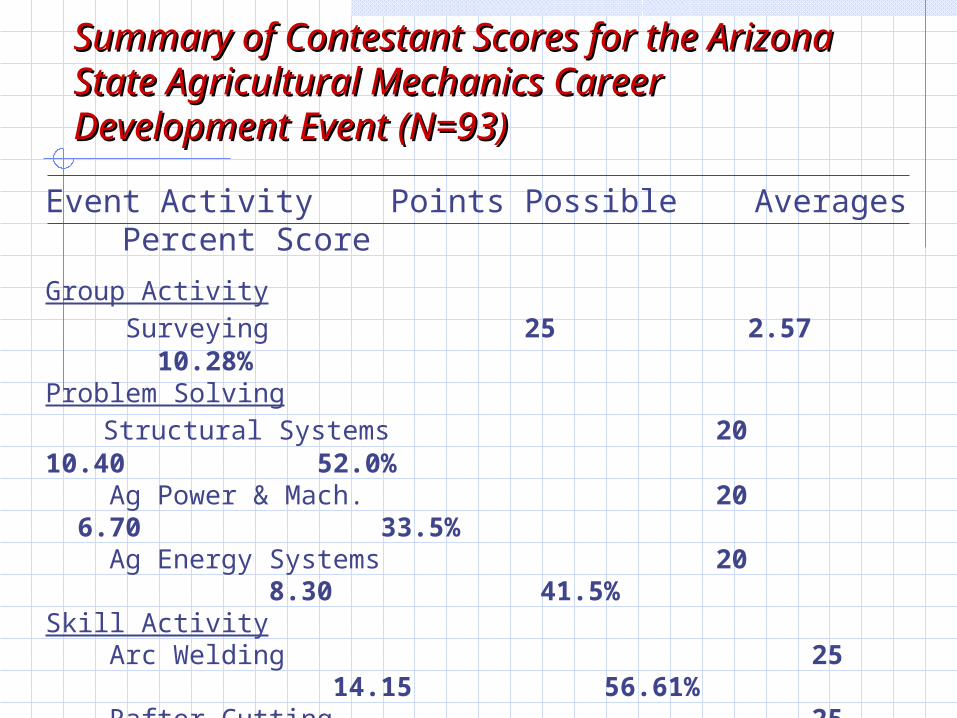
Summary of Contestant Scores for the Arizona Summary of Contestant Scores for the Arizona State Agricultural Mechanics Career State Agricultural Mechanics Career Development Event (N=93)Development Event (N=93)
Event Activity Points Possible Averages Percent Score
Group Activity
Surveying 25 2.57 10.28%Problem Solving
Structural Systems 20 10.40 52.0% Ag Power & Mach. 20 6.70 33.5% Ag Energy Systems 20 8.30 41.5% Skill Activity Arc Welding 25 14.15 56.61% Rafter Cutting 25 15.69 62.76% Electrical Wiring 25 14.89 59.56%
Written Exam 90 42.20 46.88%
Total Event Score 250 114.90 45.96%
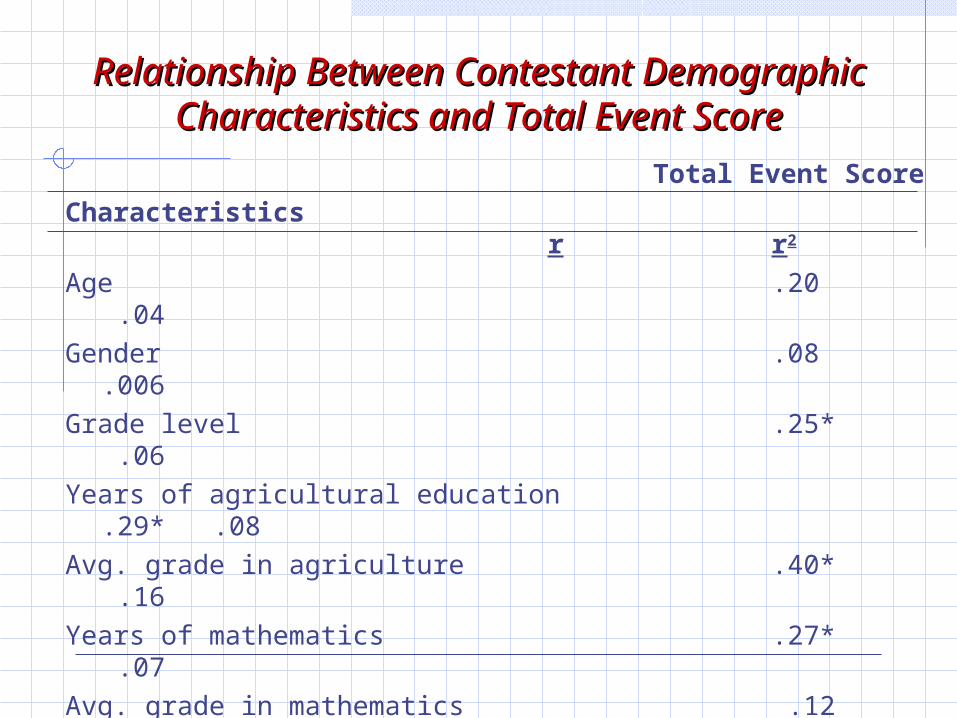
Relationship Between Contestant Demographic Relationship Between Contestant Demographic Characteristics and Total Event ScoreCharacteristics and Total Event Score
Total Event Score
Characteristics r r2
Age .20 .04
Gender .08 .006
Grade level .25* .06
Years of agricultural education .29* .08
Avg. grade in agriculture .40* .16
Years of mathematics .27* .07
Avg. grade in mathematics .12 .01
Farm residence and/or work experience -.14 .01
Related to SAE -.07 .005
Previous Ag Mechanics CDE experience -.22* .04
Instruction received in agricultural mechanics -.11 .01
*p.<05
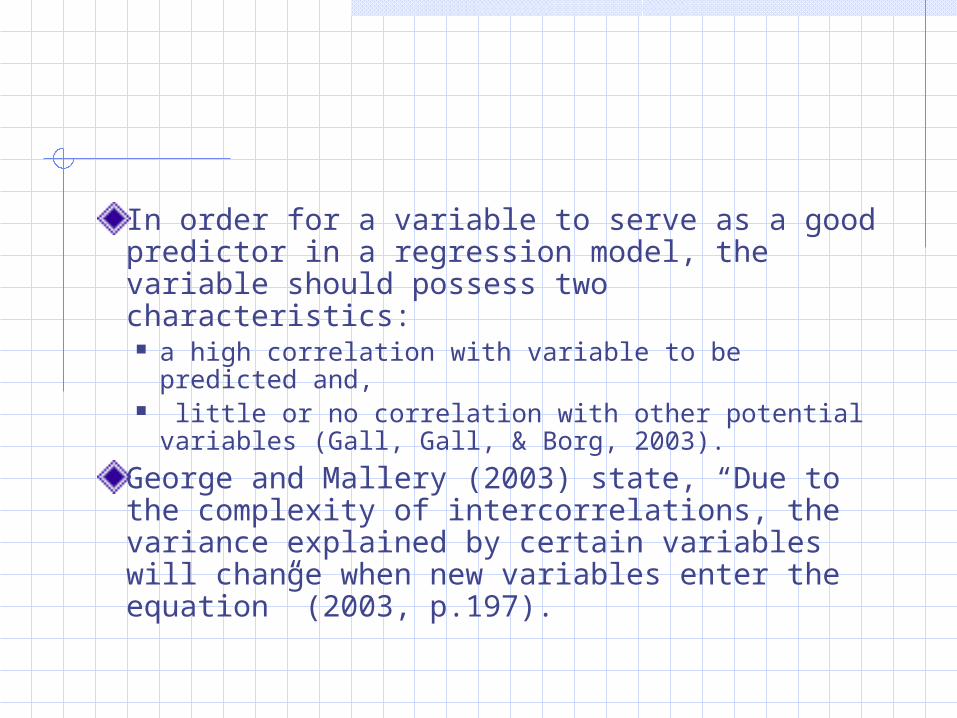
In order for a variable to serve as a good predictor in a regression model, the variable should possess two characteristics: a high correlation with variable to be predicted and, little or no correlation with other potential variables
(Gall, Gall, & Borg, 2003).
George and Mallery (2003) state, “Due to the complexity of intercorrelations, the variance explained by certain variables will change when new variables enter the equation” (2003, p.197).
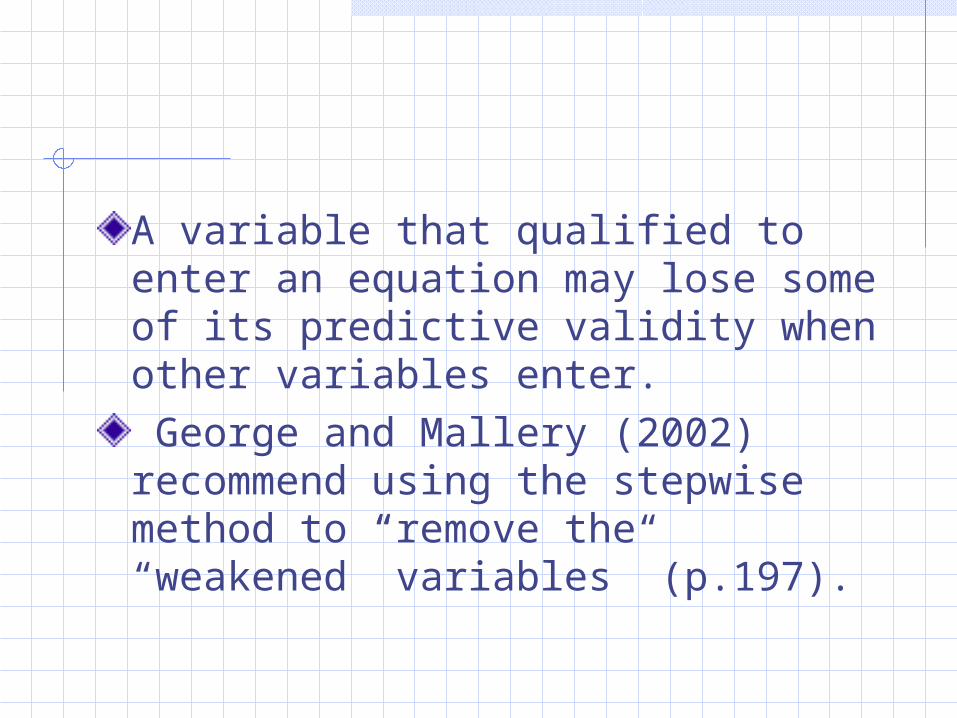
A variable that qualified to enter an equation may lose some of its predictive validity when other variables enter.
George and Mallery (2002) recommend using the stepwise method to “remove the “weakened” variables” (p.197).
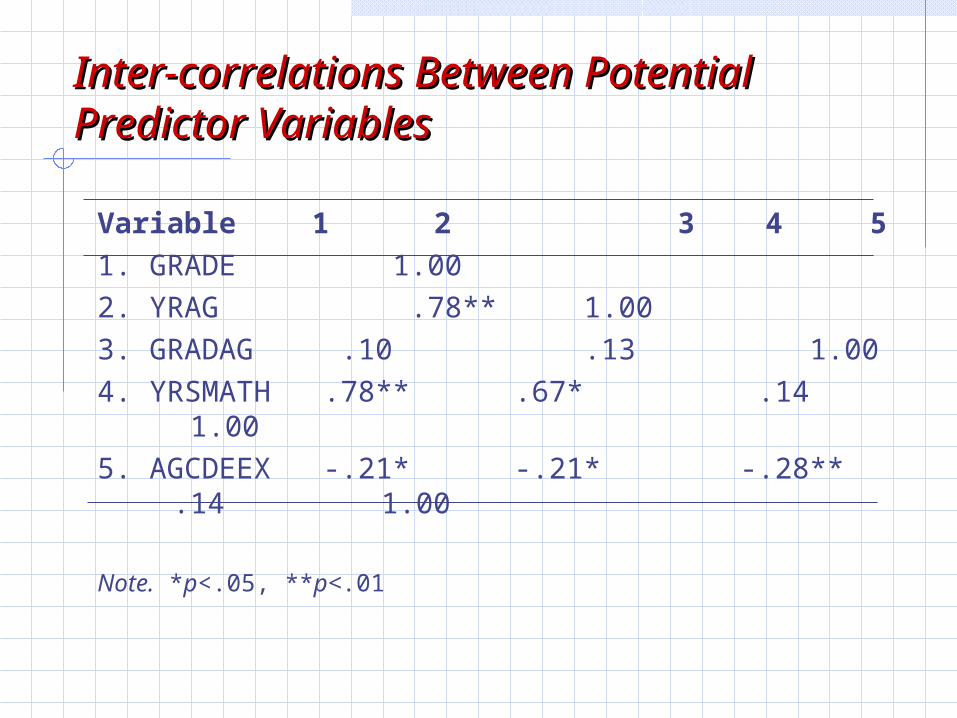
Inter-correlations Between Potential Inter-correlations Between Potential Predictor VariablesPredictor Variables
Variable 1 2 3 4 5
1. GRADE 1.00
2. YRAG .78** 1.00
3. GRADAG .10 .13 1.00
4. YRSMATH .78** .67* .14 1.00
5. AGCDEEX -.21* -.21* -.28** .14 1.00
Note. *p<.05, **p<.01
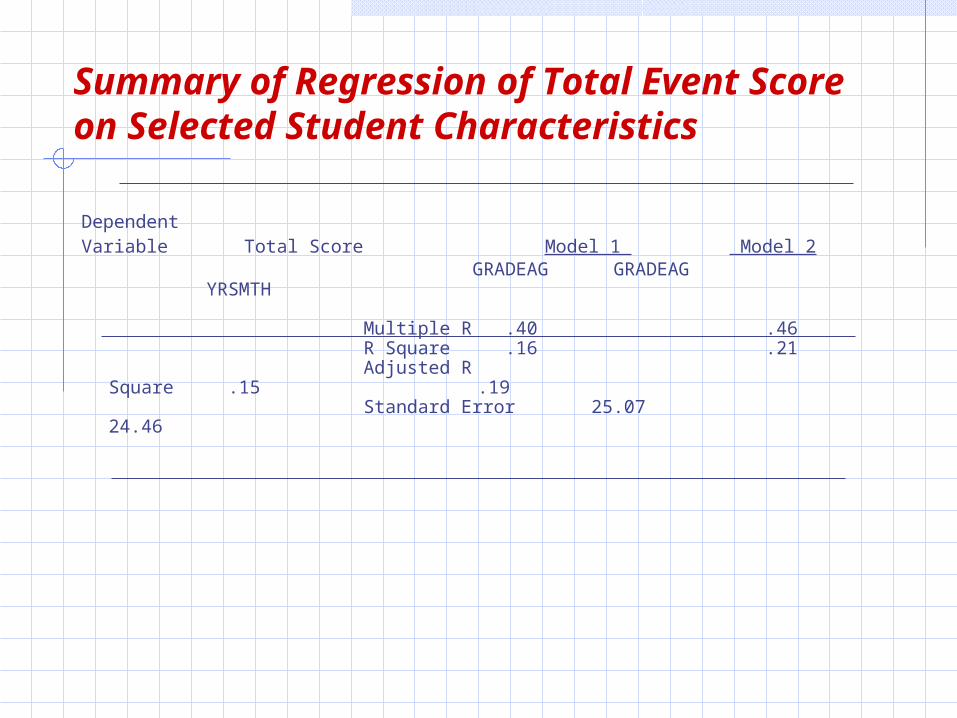
Summary of Regression of Total Event Score on Selected Student Characteristics
DependentVariable Total Score Model 1 Model 2 GRADEAG GRADEAG YRSMTH
Multiple R .40 .46 R Square .16 .21 Adjusted R Square .15 .19 Standard Error 25.07 24.46
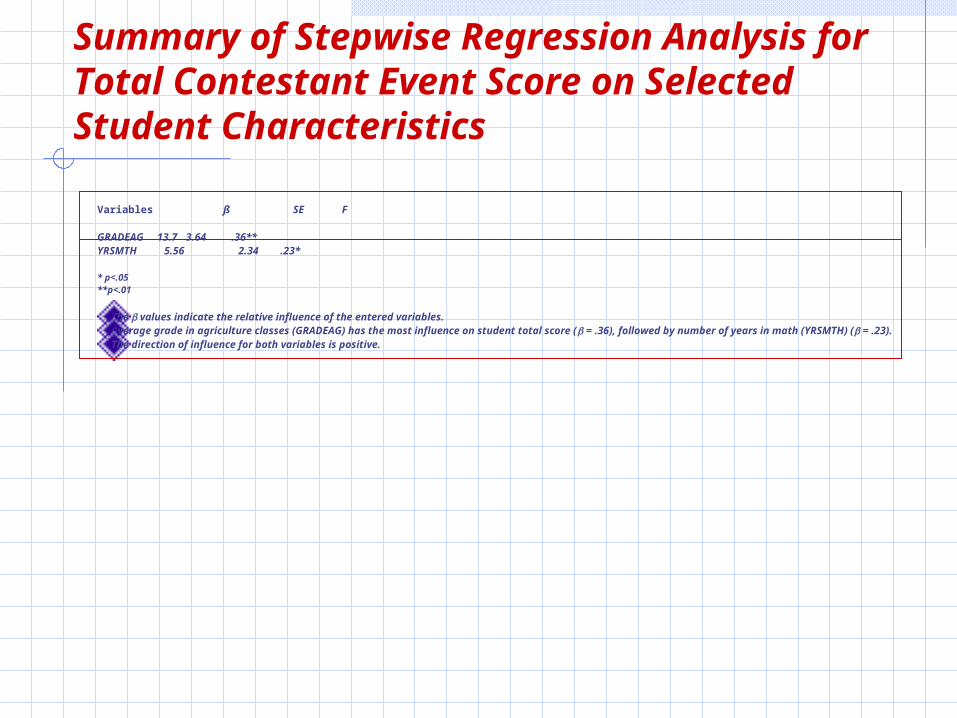
Summary of Stepwise Regression Analysis for Total Contestant Event Score on Selected Student Characteristics
Variables ß SE F GRADEAG 13.7 3.64 .36**YRSMTH 5.56 2.34 .23*
* p<.05**p<.01
The values indicate the relative influence of the entered variables. Average grade in agriculture classes (GRADEAG) has the most influence on student total score ( = .36), followed by number of years in math (YRSMTH) ( = .23). The direction of influence for both variables is positive.
ConclusionsConclusions
Female student participation made up less than ten percent (9.2%) of the student population. There still exists gender-inequity in regards to
female student participation in the agricultural mechanics CDE.
Finding is consistent with Johnson (1991) and Cole (1985).
Slightly more students participate from urban school settings (53.1%) than rural settings.
Overall level of student achievement in was relatively low as evidenced by a mean student total score of 114.90 points out of a possible 250 points (45.9%).
Student achievement was lowest for the team activity, which was surveying (10.28%). Factors such as lack of knowledge or skills in
equipment set up, leveling or reading the rod, or setting up data for analysis.
Contestants tending to achieve higher total event scores were found to: have more years of agriculture classes, higher grades in agriculture classes, more years of math class, were in higher grade levels.
This was consistent with previous research on agricultural mechanics achievement.Contestant characteristics age, gender, and average grade in math were not significantly related to overall event achievement.
Farm residence and/or work experience, related to SAE, and instruction received in agricultural mechanics were found to be negatively correlated with total event score.
The characteristic, “previous ag mechanic CDE experience” was found to be significant, though negatively related at a low level.
The best predictor of total student achievement in agricultural mechanics CDE was a linear combination of average grade in agriculture classes and the number of years of mathematics courses taken.
Together, these two characteristics were capable of explaining approximately 21% of the total event score variance.
RecommendationsRecommendations
A longitudinal study gathering data from events conducted during future years will provide more information. Research should be conducted to examine if female student participation in career development events is lower than male participation in all events conducted in Arizona, or if the low number of female students is a characteristic of this event. Research should be conducted to determine why female students do not participate in the agricultural mechanics CDE.
ImplicationsImplications
Are there barriers to female students participating in agricultural mechanics CDE’s?Are there measurable differences between gender in regards to mathematics skill and achievement?Agricultural education teachers and agricultural mechanic CDE organizers should examine the effects of strengthening the mathematical content of their course curriculum to closely match the CDE.

Thank You!!