Embed Size (px)
Citation preview

F L O R I D A D E P A R T M E N T O F E D U C A T I O NI m p r o v i n g K - 1 2 E d u c a t i o n a l C h o i c e O p t i o n s
Student Achievement in Florida’s Charter Schools:A Comparison of the Performance of
Charter School Students with Traditional Public School Students

S t u d e n t A c h i e v e m e n t i n F l o r i d a ’s C h a r t e r S c h o o l s | i i i
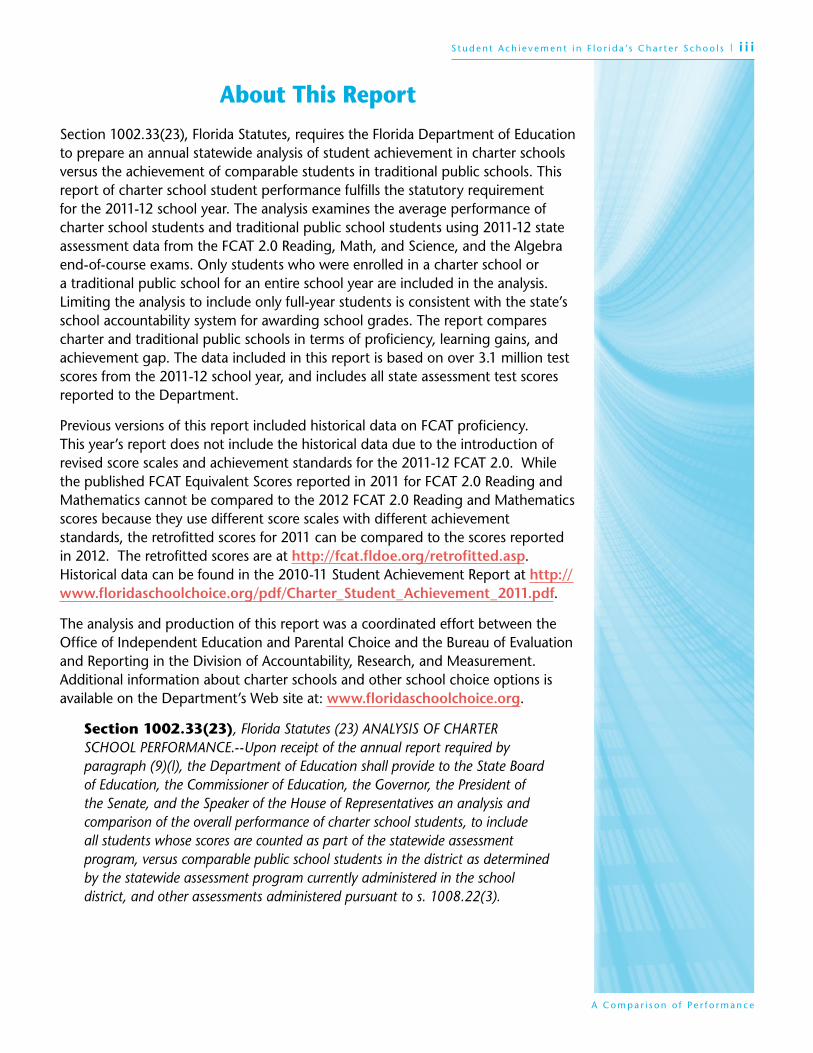
About This ReportSection 1002.33(23), Florida Statutes, requires the Florida Department of Education to prepare an annual statewide analysis of student achievement in charter schools versus the achievement of comparable students in traditional public schools. This report of charter school student performance fulfills the statutory requirement for the 2011-12 school year. The analysis examines the average performance of charter school students and traditional public school students using 2011-12 state assessment data from the FCAT 2.0 Reading, Math, and Science, and the Algebra end-of-course exams. Only students who were enrolled in a charter school or a traditional public school for an entire school year are included in the analysis. Limiting the analysis to include only full-year students is consistent with the state’s school accountability system for awarding school grades. The report compares charter and traditional public schools in terms of proficiency, learning gains, and achievement gap. The data included in this report is based on over 3.1 million test scores from the 2011-12 school year, and includes all state assessment test scores reported to the Department.
Previous versions of this report included historical data on FCAT proficiency. This year’s report does not include the historical data due to the introduction of revised score scales and achievement standards for the 2011-12 FCAT 2.0. While the published FCAT Equivalent Scores reported in 2011 for FCAT 2.0 Reading and Mathematics cannot be compared to the 2012 FCAT 2.0 Reading and Mathematics scores because they use different score scales with different achievement standards, the retrofitted scores for 2011 can be compared to the scores reported in 2012. The retrofitted scores are at http://fcat.fldoe.org/retrofitted.asp. Historical data can be found in the 2010-11 Student Achievement Report at http://www.floridaschoolchoice.org/pdf/Charter_Student_Achievement_2011.pdf.
The analysis and production of this report was a coordinated effort between the Office of Independent Education and Parental Choice and the Bureau of Evaluation and Reporting in the Division of Accountability, Research, and Measurement. Additional information about charter schools and other school choice options is available on the Department’s Web site at: www.floridaschoolchoice.org.
Section 1002.33(23), Florida Statutes (23) ANALYSIS OF CHARTER SCHOOL PERFORMANCE.--Upon receipt of the annual report required by paragraph (9)(l), the Department of Education shall provide to the State Board of Education, the Commissioner of Education, the Governor, the President of the Senate, and the Speaker of the House of Representatives an analysis and comparison of the overall performance of charter school students, to include all students whose scores are counted as part of the statewide assessment program, versus comparable public school students in the district as determined by the statewide assessment program currently administered in the school district, and other assessments administered pursuant to s. 1008.22(3).

i v | S t u d e n t A c h i e v e m e n t i n F l o r i d a ’s C h a r t e r S c h o o l s
Key Achievement FindingsThe ultimate proof of success for any charter school is the achievement of its students. The 2011-12 student achievement data demonstrates that charter schools offer parents and policy makers a viable option for improving education in the state.
The data contained in this report, based on over 3 million test scores, is derived from student performance on the Florida Comprehensive Achievement Test (FCAT 2.0) and Algebra end-of-course exams. This report is designed to allow a comparative analysis of the academic achievement of students attending charter schools versus students attending traditional public schools. Using data from the 2011-12 school year the report makes 177 comparisons using three metrics: proficiency, achievement gaps, and learning gains. Each of these metrics is further broken down to offer a more nuanced view of student achievement.
The FCAT 2.0 proficiency percentages are used to measure both overall rates of proficiency by grade groupings, and comparisons of subgroup performance. This section of the report contains 63 separate comparisons of student achievement. Charter school students outperformed traditional public school students in 55 of the 63 comparisons, with one tie.
The achievement gap section of the report contains data that are used to analyze the gap between white students and African American students, and white students and Hispanic students, in reading, math, and science. This section of the report includes 18 separate comparisons of current achievement gaps. The achievement gap was lower for charter school students in 18 of the 18 comparisons.
The learning gains section of the report includes 96 comparisons. The report compares the percentage of students in charter schools making learning gains against the percentage of students in traditional public schools making learning gains, by subject, grade level, and subgroup. The percentage of students making learning gains was higher in charter schools in 83 of the 96 comparisons. The percentage of students making learning gains was higher in traditional public schools in 6 of the 96 comparisons. There was no difference in the percentage of students making learning gains in 7 of the 96 comparisons.

S t u d e n t A c h i e v e m e n t i n F l o r i d a ’s C h a r t e r S c h o o l s | v
Table of Contents
Overview . . . . . . . . . . . . . . . . . . . . . . . . . . . . . . . . . . . . . . . . . . . . . . . . . . . . . . . 1
Demographics . . . . . . . . . . . . . . . . . . . . . . . . . . . . . . . . . . . . . . . . . . . . . . . . . . . 2
School Grades . . . . . . . . . . . . . . . . . . . . . . . . . . . . . . . . . . . . . . . . . . . . . . . . . . . 3
FCAT Reading: All and Subgroup Comparisons . . . . . . . . . . . . . . . . . . . . . . . . . . . 4
FCAT Math: All and Subgroup Comparisons . . . . . . . . . . . . . . . . . . . . . . . . . . . . . 8
FCAT Science: All and Subgroup Comparisons . . . . . . . . . . . . . . . . . . . . . . . . . . 12
Algebra: All and Subgroup Comparisons . . . . . . . . . . . . . . . . . . . . . . . . . . . . . . . 16
Achievement Gap: Reading 2011-2012 . . . . . . . . . . . . . . . . . . . . . . . . . . . . . . . . 20
Achievement Gap: Math 2011-2012 . . . . . . . . . . . . . . . . . . . . . . . . . . . . . . . . . . 21
Achievement Gap: Science 2011-2012 . . . . . . . . . . . . . . . . . . . . . . . . . . . . . . . . . 22
Achievement Gap: Algebra 2011-2012 . . . . . . . . . . . . . . . . . . . . . . . . . . . . . . . . . 23
Learning Gains Comparison in Reading and Math, 2011-2012 School Year . . . . . 24
FCAT Proficiency Data . . . . . . . . . . . . . . . . . . . . . . . . . . . . . . . . . . . . . . . . . . . . . 36
FCAT Learning Gains Data . . . . . . . . . . . . . . . . . . . . . . . . . . . . . . . . . . . . . . . . . 39


S t u d e n t A c h i e v e m e n t i n F l o r i d a ’s C h a r t e r S c h o o l s | 1
Student Achievement in Florida’s Charter Schools: A Comparison with Achievement in
Traditional Public SchoolsCharter schools are independent public schools created on the basis of an agreement between a group of school organizers and a sponsoring body. Florida’s charter schools have been growing by near record numbers since the first five charter schools were opened in 1996. During the 2011-12 school year, 518 operated throughout the state in 43 school districts and at two state universities. While each charter school is unique in its educational approach, charter schools are generally classified as independent schools, schools managed by educational management organizations, conversion public schools, or University charter lab schools. Each charter school has its own governing board that is responsible for setting policies and procedures. Charter schools have the autonomy and flexibility to provide expanded learning experiences to meet students’ individual educational needs. In return, they are held accountable for achieving results. Although provided more freedom than traditional public schools, charter schools are held accountable on multiple levels. The charter contract delineates expectations of the governing board and the sponsor regarding the school’s academic and financial performance. As part of their contract, charter schools are held accountable for academic and financial results, embodied in the following three guiding principles:
• Meethighstandardsofstudentachievementwhileprovidingparentsflexibilityto choose among diverse educational opportunities within the state’s public school system;
• Promoteenhancedacademicsuccessandfinancialefficiencybyaligningre-sponsibility with accountability; and
• Provideparentswithsufficientinformationonwhetherornotthechildgainsat least a year’s worth of learning for every year spent in the charter school.

2 | S t u d e n t A c h i e v e m e n t i n F l o r i d a ’s C h a r t e r S c h o o l s
Students Served by Florida Charter SchoolsCharter schools provide parents with additional choices for selecting the most effective educational programs for their children and offer creative solutions for improving student achievement in Florida. The charter school movement in Florida began as an avenue to improve student learning, increase parental choice, influence the traditional public school system, and foster innovative instructional practices. Charter school enrollment has grown steadily over the last decade. As shown below, charter schools served over 183,000 students in the 2011-12 school year, which translates to more than 7% of Florida’s total public school population.
2011-12 Charter School and Traditional School Student Populations
Charter Traditional
Student Membership 183,926 2,589,662
Gender
Male 49.78% 51.56%
Female 50.22% 48.44%
Race
White 36.10% 43.23%
African American 22.99% 22.83%
Hispanic 35.81% 27.85%
English Language Program 10.68% 11.64%
Free and Reduced Lunch Eligible 46.87% 56.89%
Exceptional Student Education 9.22% 13.06%

S t u d e n t A c h i e v e m e n t i n F l o r i d a ’s C h a r t e r S c h o o l s | 3
Grading Charter Schools
Like traditional public schools, charter schools are assigned a performance grade if they meet the eligibility criteria and are not an alternative school. To receive a school grade a public school (charter or traditional) must have at least 30 full-time students that have two years worth of FCAT performance data in both reading and mathematics.
2011-12 School Grades for Charter and Traditional Schools
Charter Traditional
Grade Number % Graded Number % Graded
A 193 54% 1,280 47%
B 72 20% 691 25%
C 53 15% 530 19%
D 23 6% 204 7%
F 18 5% 34 1%
Total A-F 359 100% 2,739 100%
*High school grades are preliminary. Percentages may not equal 100% due to rounding.
2012 Charter School Grades
A
B
C
D
F
A54%
B20%
C15%
D6%
F5%
2012 Traditional Public School Grades
A
B
C
D
FB
25%
C19%
D7%
F1%
A47%

4 | S t u d e n t A c h i e v e m e n t i n F l o r i d a ’s C h a r t e r S c h o o l s
FCAT Reading Traditional Public Schools and Charter Schools
A L L - S T U D E N T S C O M P A R I S O N S 2 0 1 2Percent of Students Scoring a Level 3 or Above on FCAT 2.0 Reading
Charter Schools and Traditional Public Schools All Students
70.0%
60.0%
50.0%
40.0%
30.0%
20.0%
10.0%
0.0%
65.2%
52.4%
Elementary Middle High School
Charter Traditional
64.3%
57.3%60.3%
58.5%
S U B - G R O U P C O M P A R I S O N S 2 0 1 2
Percent of Students Scoring a Level 3 or Above on FCAT 2.0 Reading Charter Schools and Traditional Public Schools
White Students76.0%
74.0%
72.0%
70.0%
68.0%
66.0%
64.0%
62.0%
60.0%
58.0%
72.1%73.6%
68.4%
71.5%
64.5%
Elementary Middle High SchoolCharter Traditional
69.4%
S t u d e n t A c h i e v e m e n t i n F l o r i d a ’s C h a r t e r S c h o o l s | 5
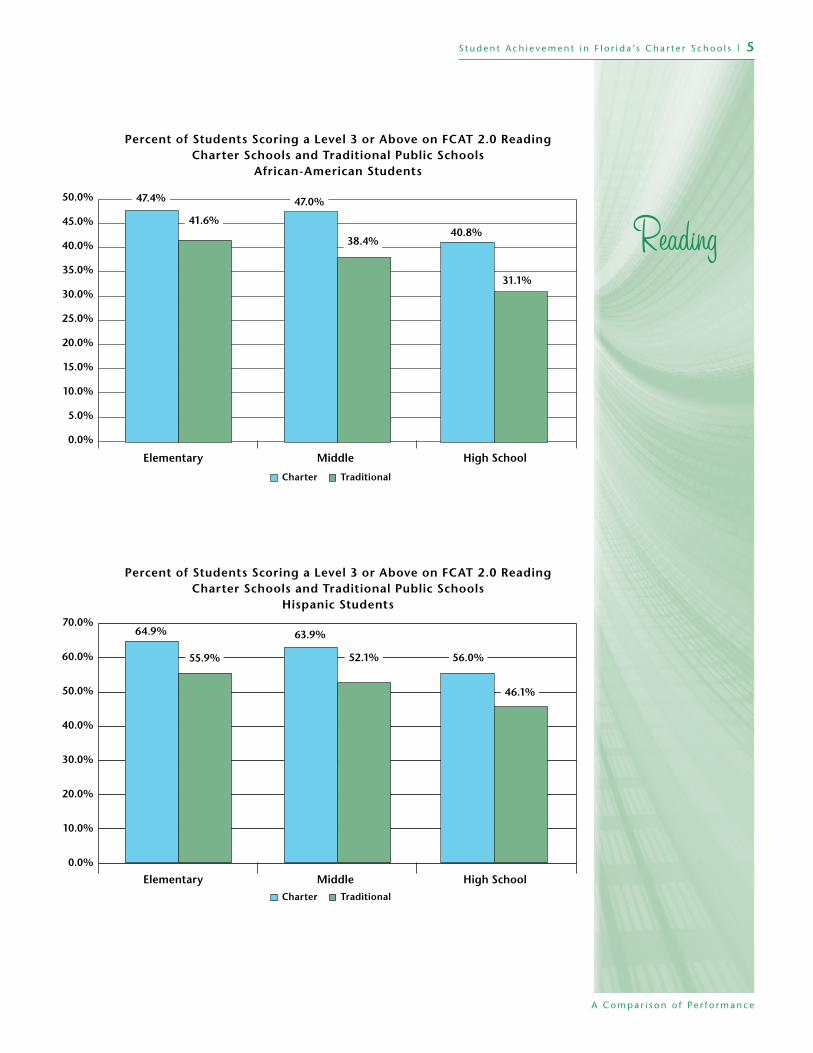
Percent of Students Scoring a Level 3 or Above on FCAT 2.0 Reading Charter Schools and Traditional Public Schools
African-American Students
50.0%
45.0%
40.0%
35.0%
30.0%
25.0%
20.0%
15.0%
10.0%
5.0%
0.0%
47.4%
40.8%
31.1%
Elementary Middle High School
Charter Traditional
47.0%
38.4%
41.6%
Percent of Students Scoring a Level 3 or Above on FCAT 2.0 Reading Charter Schools and Traditional Public Schools
Hispanic Students70.0%
60.0%
50.0%
40.0%
30.0%
20.0%
10.0%
0.0%
64.9%
52.1%
Elementary Middle High SchoolCharter Traditional
55.9%
63.9%
46.1%
56.0%
6 | S t u d e n t A c h i e v e m e n t i n F l o r i d a ’s C h a r t e r S c h o o l s
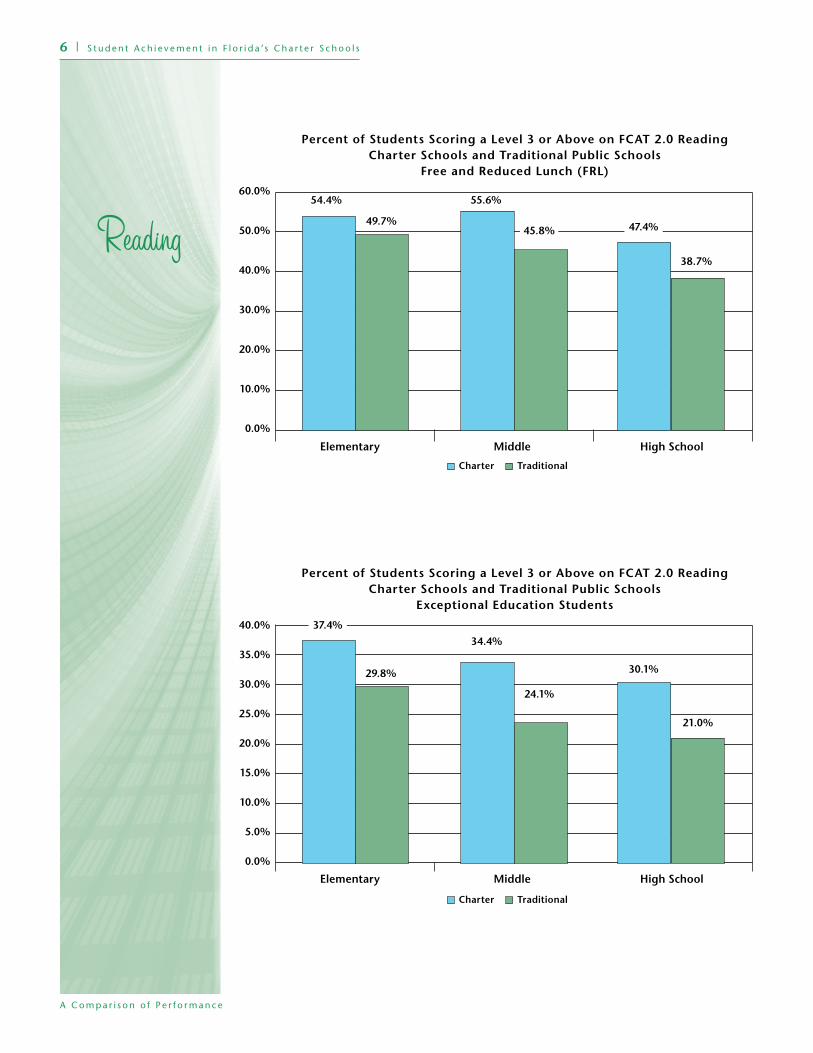
Percent of Students Scoring a Level 3 or Above on FCAT 2.0 Reading Charter Schools and Traditional Public Schools
Free and Reduced Lunch (FRL)
60.0%
50.0%
40.0%
30.0%
20.0%
10.0%
0.0%
49.7%
38.7%
Elementary Middle High School
Charter Traditional
55.6%
45.8%
54.4%
47.4%
Percent of Students Scoring a Level 3 or Above on FCAT 2.0 Reading Charter Schools and Traditional Public Schools
Exceptional Education Students
40.0%
35.0%
30.0%
25.0%
20.0%
15.0%
10.0%
5.0%
0.0%
37.4%
21.0%
Elementary Middle High School
Charter Traditional
34.4%
24.1%
29.8% 30.1%

S t u d e n t A c h i e v e m e n t i n F l o r i d a ’s C h a r t e r S c h o o l s | 7
Percent of Students Scoring a Level 3 or Above on FCAT 2.0 Reading Charter Schools and Traditional Public Schools
English Language Learner Students
30.0%
25.0%
20.0%
15.0%
10.0%
5.0%
0.0%
23.9%
Elementary Middle High School
Charter Traditional
19.9%
11.5%
8.9%
27.7%
17.2%
8 | S t u d e n t A c h i e v e m e n t i n F l o r i d a ’s C h a r t e r S c h o o l s
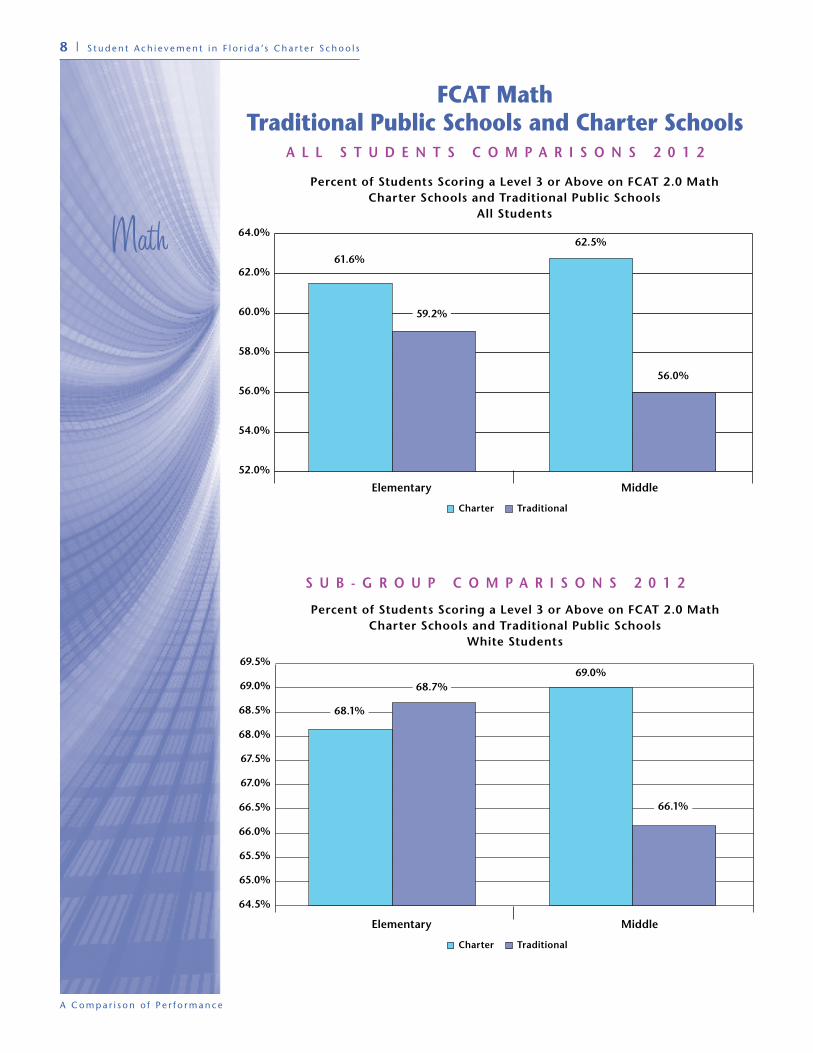
FCAT Math Traditional Public Schools and Charter Schools
A L L S T U D E N T S C O M P A R I S O N S 2 0 1 2
Percent of Students Scoring a Level 3 or Above on FCAT 2.0 Math Charter Schools and Traditional Public Schools
All Students
64.0%
62.0%
60.0%
58.0%
56.0%
54.0%
52.0%
61.6%
Elementary Middle
Charter Traditional
62.5%
56.0%
59.2%
S U B - G R O U P C O M P A R I S O N S 2 0 1 2
Percent of Students Scoring a Level 3 or Above on FCAT 2.0 Math Charter Schools and Traditional Public Schools
White Students
69.5%
69.0%
68.5%
68.0%
67.5%
67.0%
66.5%
66.0%
65.5%
65.0%
64.5%
68.1%
Elementary Middle
Charter Traditional
69.0%
66.1%
68.7%

S t u d e n t A c h i e v e m e n t i n F l o r i d a ’s C h a r t e r S c h o o l s | 9
Percent of Students Scoring a Level 3 or Above on FCAT 2.0 Math Charter Schools and Traditional Public Schools
African-American Students
50.0%
45.0%
40.0%
35.0%
30.0%
25.0%
20.0%
15.0%
10.0%
5.0%
0.0%
Elementary Middle
Charter Traditional
43.2%46.2%
36.9%
41.3%
Percent of Students Scoring a Level 3 or Above on FCAT 2.0 Math Charter Schools and Traditional Public Schools
Hispanic Students
70.0%
60.0%
50.0%
40.0%
30.0%
20.0%
10.0%
0.0%
Elementary Middle
Charter Traditional
63.4% 62.5%
52.0%56.3%

1 0 | S t u d e n t A c h i e v e m e n t i n F l o r i d a ’s C h a r t e r S c h o o l s
Percent of Students Scoring a Level 3 or Above on FCAT 2.0 Math Charter Schools and Traditional Public Schools
Free and Reduced Lunch (FRL)
60.0%
50.0%
40.0%
30.0%
20.0%
10.0%
0.0%
Charter Traditional
51.9% 54.8%
44.5%
49.2%
Elementary Middle
Percent of Students Scoring a Level 3 or Above on FCAT 2.0 Math Charter Schools and Traditional Public Schools
Exceptional Education Students45.0%
40.0%
35.0%
30.0%
25.0%
20.0%
15.0%
10.0%
5.0%
0.0%
Elementary Middle
Charter Traditional
39.1%
32.6%
23.9%
32.9%

S t u d e n t A c h i e v e m e n t i n F l o r i d a ’s C h a r t e r S c h o o l s | 1 1
Percent of Students Scoring a Level 3 or Above on FCAT 2.0 Math Charter Schools and Traditional Public Schools
English Language Learner Student
Charter Traditional
36.7%
31.5%
20.6%
32.3%
40.0%
35.0%
30.0%
25.0%
20.0%
15.0%
10.0%
5.0%
0.0%
Elementary Middle

1 2 | S t u d e n t A c h i e v e m e n t i n F l o r i d a ’s C h a r t e r S c h o o l s
FCAT Science Traditional Public Schools and Charter Schools
A L L S T U D E N T S C O M P A R I S O N S 2 0 1 2
Percent of Students Scoring a Level 3 or Above on FCAT 2.0 Science Charter Schools and Traditional Public Schools
All Students
Charter Traditional
Elementary Middle
53.0%
52.0%
51.0%
50.0%
49.0%
48.0%
47.0%
46.0%
45.0%
44.0%
51.9%52.5%
47.4%
51.8%
S U B - G R O U P C O M P A R I S O N S 2 0 1 2
Percent of Students Scoring a Level 3 or Above on FCAT 2.0 Science Charter Schools and Traditional Public Schools
White Students
65.0%
64.0%
63.0%
62.0%
61.0%
60.0%
59.0%
58.0%
57.0%
Charter Traditional
Elementary Middle
60.9%
61.7%
59.6%
64.2%

S t u d e n t A c h i e v e m e n t i n F l o r i d a ’s C h a r t e r S c h o o l s | 1 3
Percent of Students Scoring a Level 3 or Above on FCAT 2.0 Science Charter Schools and Traditional Public Schools
African-American Students
40.0%
35.0%
30.0%
25.0%
20.0%
15.0%
10.0%
5.0%
0.0%
Charter Traditional
Elementary Middle
29.5%
33.5%
26.6%
30.4%
Percent of Students Scoring a Level 3 or Above on FCAT 2.0 Science Charter Schools and Traditional Public Schools
Hispanic Students
60.0%
50.0%
40.0%
30.0%
20.0%
10.0%
0.0%
Elementary Middle
Charter Traditional
52.6% 51.1%
41.0%
46.7%
1 4 | S t u d e n t A c h i e v e m e n t i n F l o r i d a ’s C h a r t e r S c h o o l s
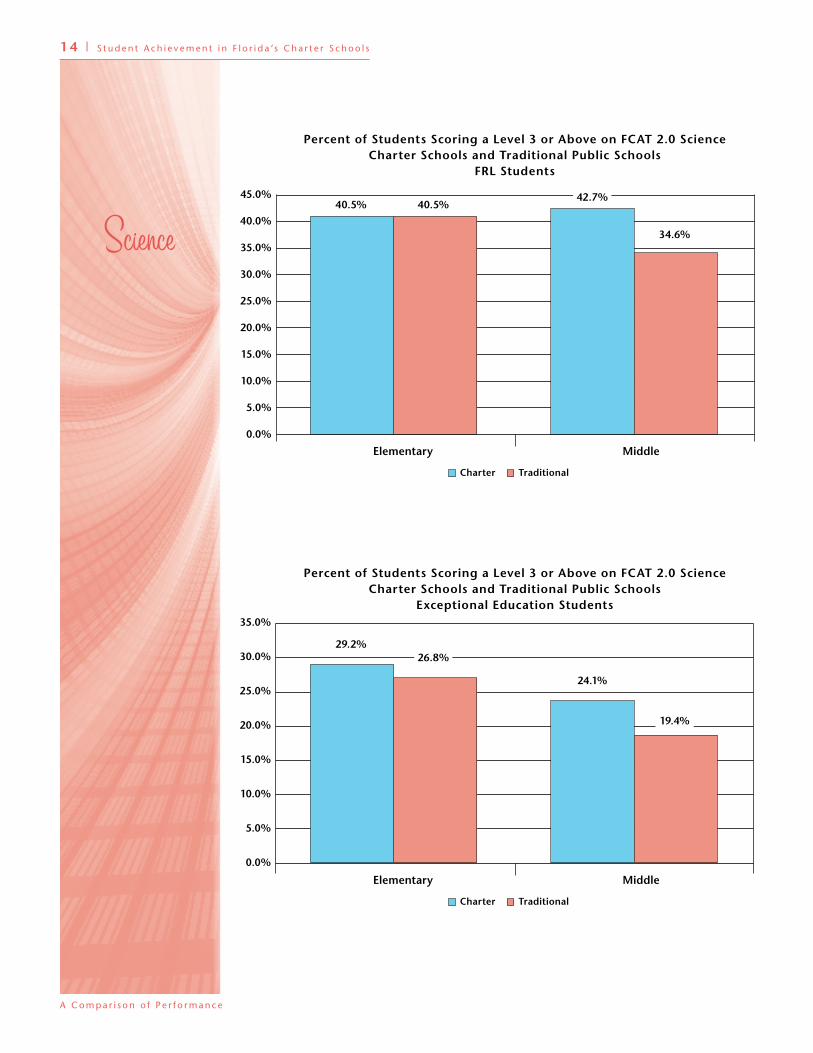
Percent of Students Scoring a Level 3 or Above on FCAT 2.0 Science Charter Schools and Traditional Public Schools
FRL Students
Charter Traditional
Elementary Middle
45.0%
40.0%
35.0%
30.0%
25.0%
20.0%
15.0%
10.0%
5.0%
0.0%
40.5%42.7%
34.6%
40.5%
Percent of Students Scoring a Level 3 or Above on FCAT 2.0 Science Charter Schools and Traditional Public Schools
Exceptional Education Students35.0%
30.0%
25.0%
20.0%
15.0%
10.0%
5.0%
0.0%
Charter Traditional
Elementary Middle
29.2%
24.1%
19.4%
26.8%

S t u d e n t A c h i e v e m e n t i n F l o r i d a ’s C h a r t e r S c h o o l s | 1 5
Percent of Students Scoring a Level 3 or Above on FCAT 2.0 Science Charter Schools and Traditional Public Schools
English Language Learner Students
16.0%
14.0%
12.0%
10.0%
8.0%
6.0%
4.0%
2.0%
0.0%
Charter Traditional
Elementary Middle
14.5%15.1%
7.2%
14.8%
1 6 | S t u d e n t A c h i e v e m e n t i n F l o r i d a ’s C h a r t e r S c h o o l s
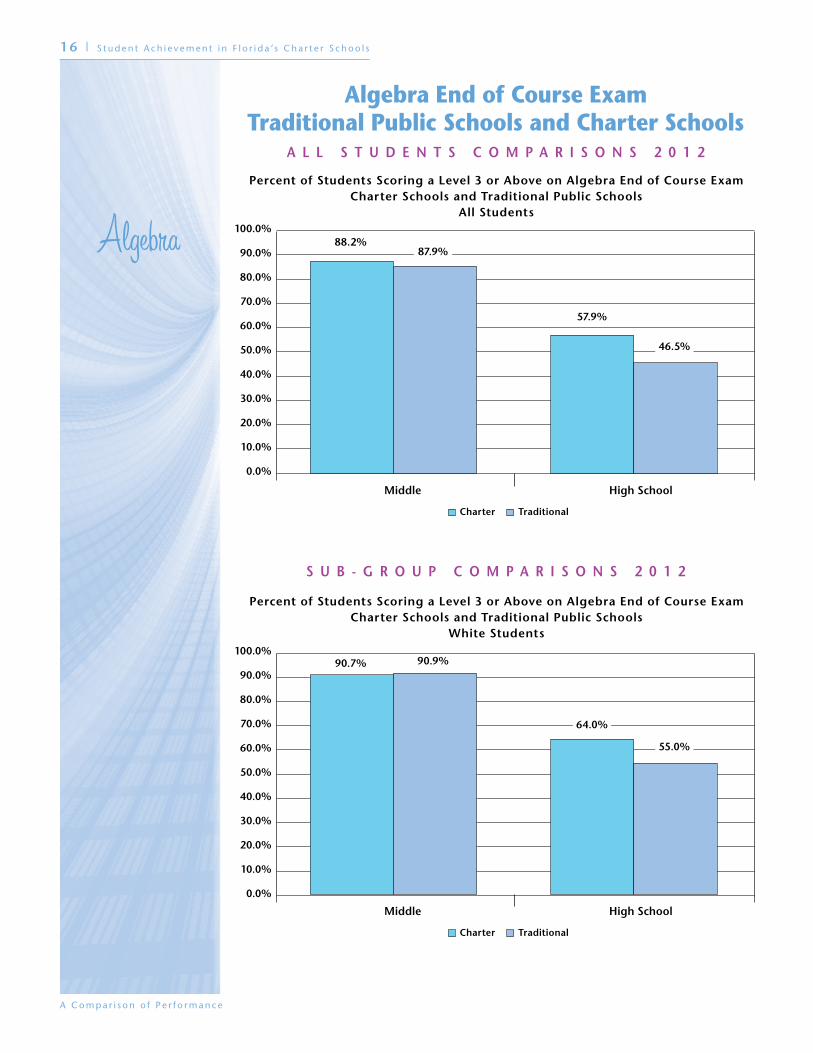
Algebra End of Course Exam Traditional Public Schools and Charter Schools
A L L S T U D E N T S C O M P A R I S O N S 2 0 1 2
Percent of Students Scoring a Level 3 or Above on Algebra End of Course Exam Charter Schools and Traditional Public Schools
All Students100.0%
90.0%
80.0%
70.0%
60.0%
50.0%
40.0%
30.0%
20.0%
10.0%
0.0%
Charter Traditional
Middle High School
88.2%
57.9%
46.5%
87.9%
S U B - G R O U P C O M P A R I S O N S 2 0 1 2
Percent of Students Scoring a Level 3 or Above on Algebra End of Course Exam Charter Schools and Traditional Public Schools
White Students100.0%
90.0%
80.0%
70.0%
60.0%
50.0%
40.0%
30.0%
20.0%
10.0%
0.0%
Charter Traditional
Middle High School
90.7%
64.0%
55.0%
90.9%

S t u d e n t A c h i e v e m e n t i n F l o r i d a ’s C h a r t e r S c h o o l s | 1 7
Percent of Students Scoring a Level 3 or Above on Algebra End of Course Exam Charter Schools and Traditional Public Schools
African-American Students
80.0%
70.0%
60.0%
50.0%
40.0%
30.0%
20.0%
10.0%
0.0%
Charter Traditional
Middle High School
75.3%
45.9%
34.0%
74.0%
Percent of Students Scoring a Level 3 or Above on Algebra End of Course Exam Charter Schools and Traditional Public Schools
Hispanic Students
90.0%
80.0%
70.0%
60.0%
50.0%
40.0%
30.0%
20.0%
10.0%
0.0%
Middle High School
Charter Traditional
88.9%
59.2%
43.7%
87.5%
100.0%

1 8 | S t u d e n t A c h i e v e m e n t i n F l o r i d a ’s C h a r t e r S c h o o l s
Percent of Students Scoring a Level 3 or Above on Algebra End of Course Exam Charter Schools and Traditional Public Schools
FRL Students90.0%
80.0%
70.0%
60.0%
50.0%
40.0%
30.0%
20.0%
10.0%
0.0%
Charter Traditional
Middle High School
82.3%
52.4%
39.8%
81.6%
Percent of Students Scoring a Level 3 or Above on Algebra End of Course Exam Charter Schools and Traditional Public Schools
Exceptional Student Education Students90.0%
80.0%
70.0%
60.0%
50.0%
40.0%
30.0%
20.0%
10.0%
0.0%
Charter Traditional
Middle High School
74.4%
36.2%
24.9%
77.3%
S t u d e n t A c h i e v e m e n t i n F l o r i d a ’s C h a r t e r S c h o o l s | 1 9
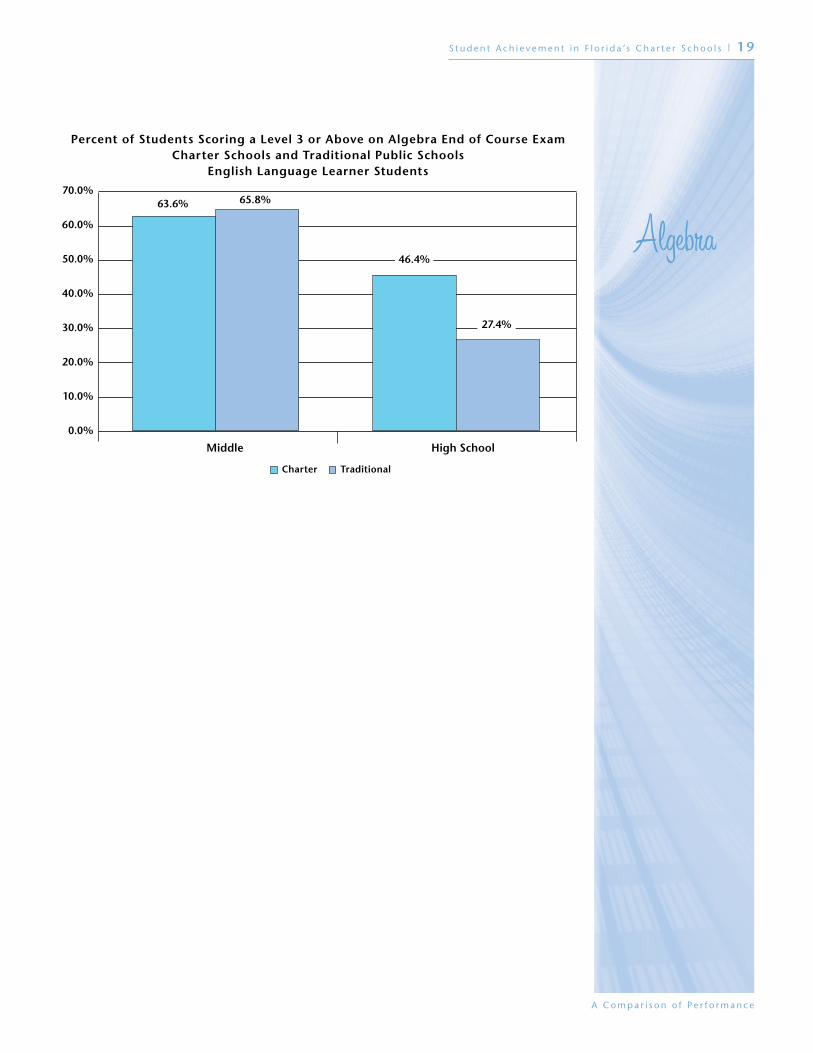
Percent of Students Scoring a Level 3 or Above on Algebra End of Course Exam Charter Schools and Traditional Public Schools
English Language Learner Students
70.0%
60.0%
50.0%
40.0%
30.0%
20.0%
10.0%
0.0%
Charter Traditional
Middle High School
63.6%
46.4%
27.4%
65.8%

2 0 | S t u d e n t A c h i e v e m e n t i n F l o r i d a ’s C h a r t e r S c h o o l s
Achievement Gap Summary Data 2011-12 School Year
Achievement Gap in Reading Charter Schools and Traditional Public Schools African-American Students and White Students
0%
-5%
-10%
-15%
-20%
-25%
-30%
-35%
Elementary Middle High School
Charter Traditional
-28.6%-29.9%
-33.4%
-25.1%
-30.0%
-26.2%
Achievement Gap in Reading Charter Schools and Traditional Public Schools
Hispanic Students and White Students
0%
-2%
-4%
-6%
-8%
-10%
-12%
-14%
-16%
-18%
-20%
Elementary Middle High School
-15.6%
-8.2%
-16.3%
-8.7%
Charter Traditional
-18.4%
-13.4%
S t u d e n t A c h i e v e m e n t i n F l o r i d a ’s C h a r t e r S c h o o l s | 2 1
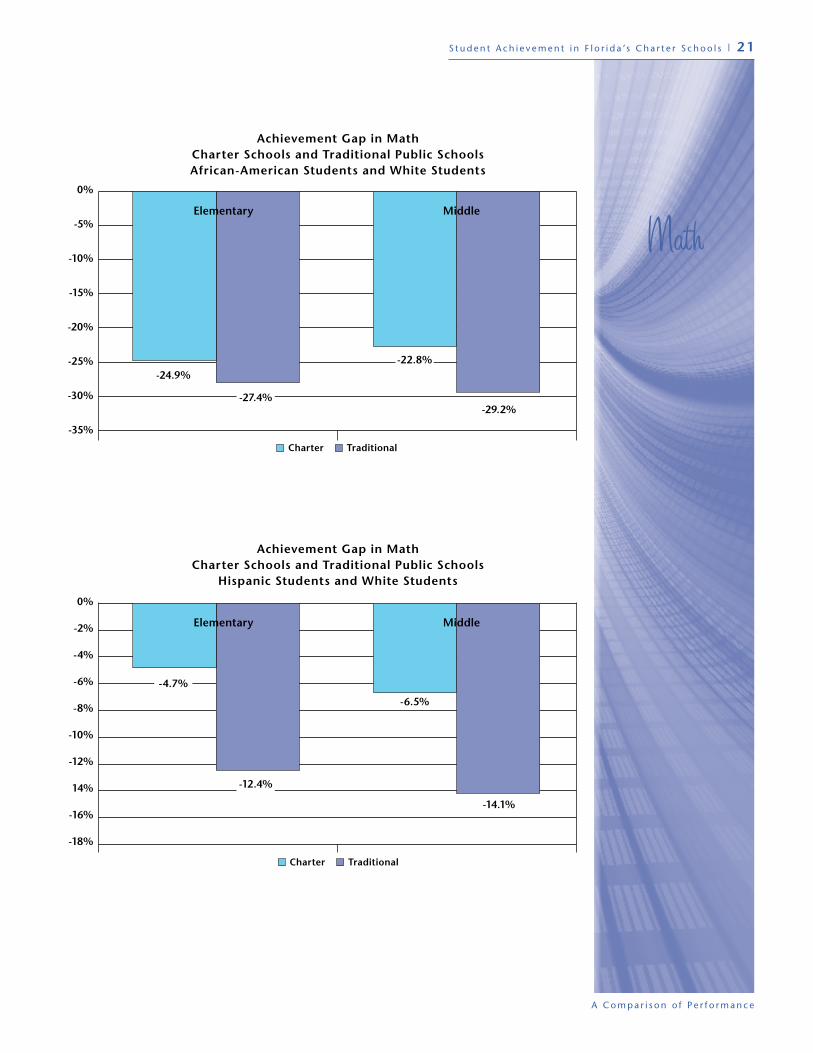
Achievement Gap in Math Charter Schools and Traditional Public Schools African-American Students and White Students
0%
-5%
-10%
-15%
-20%
-25%
-30%
-35%
Charter Traditional
-24.9%-22.8%
-29.2%-27.4%
Elementary Middle
Achievement Gap in Math Charter Schools and Traditional Public Schools
Hispanic Students and White Students
0%
-2%
-4%
-6%
-8%
-10%
-12%
14%
-16%
-18%
Charter Traditional
-4.7%
-6.5%
-14.1%
-12.4%
Elementary Middle
2 2 | S t u d e n t A c h i e v e m e n t i n F l o r i d a ’s C h a r t e r S c h o o l s
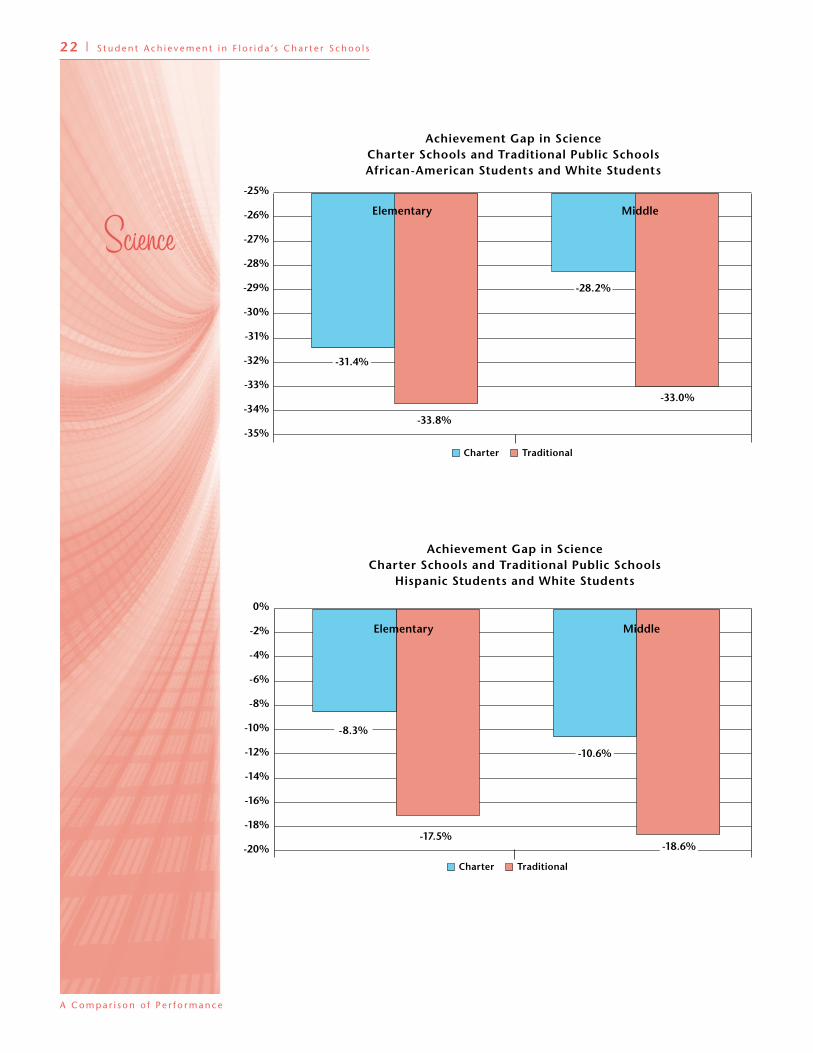
Achievement Gap in Science Charter Schools and Traditional Public Schools African-American Students and White Students
Charter Traditional
-25%
-26%
-27%
-28%
-29%
-30%
-31%
-32%
-33%
-34%
-35%
-31.4%
-28.2%
-33.0%
-33.8%
Elementary Middle
Achievement Gap in Science Charter Schools and Traditional Public Schools
Hispanic Students and White Students
0%
-2%
-4%
-6%
-8%
-10%
-12%
-14%
-16%
-18%
-20%
Charter Traditional
-8.3%
-10.6%
-18.6%-17.5%
Elementary Middle

S t u d e n t A c h i e v e m e n t i n F l o r i d a ’s C h a r t e r S c h o o l s | 2 3
Achievement Gap in Algebra Charter Schools and Traditional Public Schools African-American Students and White Students
0%
-5%
-10%
-15%
-20%
-25%
Charter Traditional
-15.4%
-18.1%
-21.0%
-16.9%
Middle High School
Achievement Gap in Algebra Charter Schools and Traditional Public Schools
Hispanic Students and White Students
Charter Traditional
-1.8%
-4.8%
-11.3%
-3.4%
Middle High School
0%
-2%
-4%
-6%
-8%
-10%
-12%
2 4 | S t u d e n t A c h i e v e m e n t i n F l o r i d a ’s C h a r t e r S c h o o l s
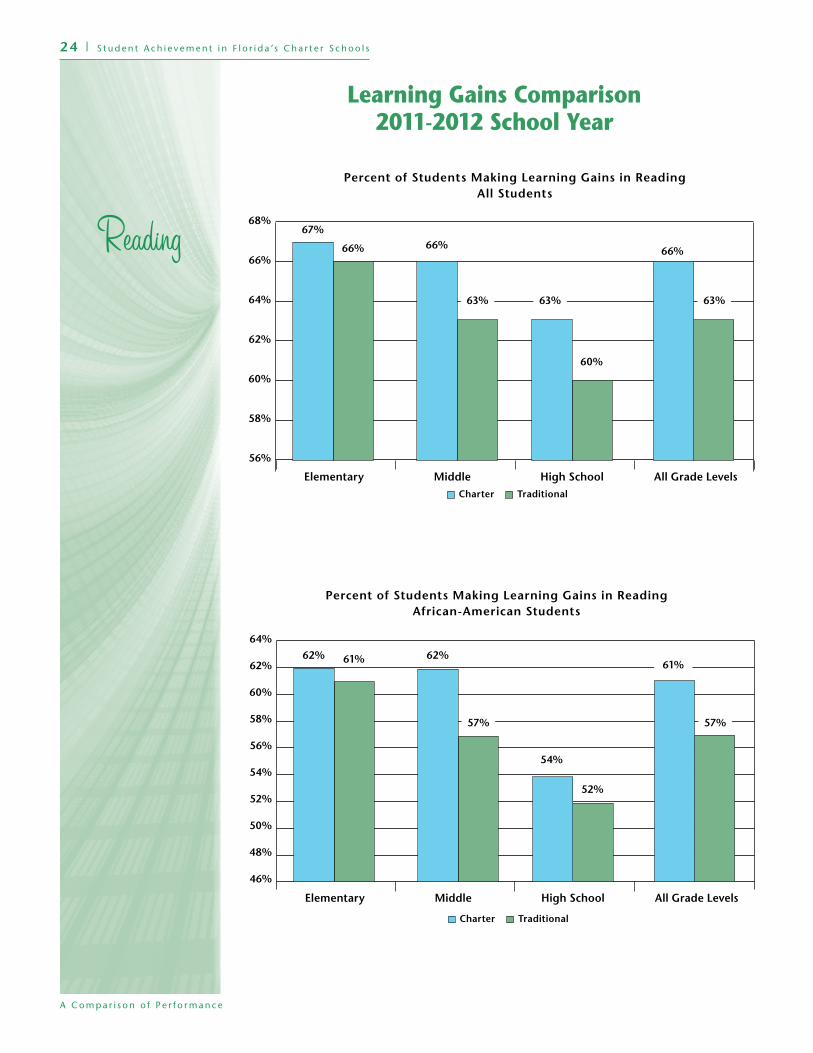
Learning Gains Comparison 2011-2012 School Year
Percent of Students Making Learning Gains in ReadingAll Students
68%
66%
64%
62%
60%
58%
56%
Elementary Middle High School All Grade LevelsCharter Traditional
67%66% 66%
63%
66%
63% 63%
60%
Percent of Students Making Learning Gains in ReadingAfrican-American Students
64%
62%
60%
58%
56%
54%
52%
50%
48%
46%
Elementary Middle High School All Grade Levels
Charter Traditional
62% 62%61%
54%
61%
57% 57%
52%
S t u d e n t A c h i e v e m e n t i n F l o r i d a ’s C h a r t e r S c h o o l s | 2 5
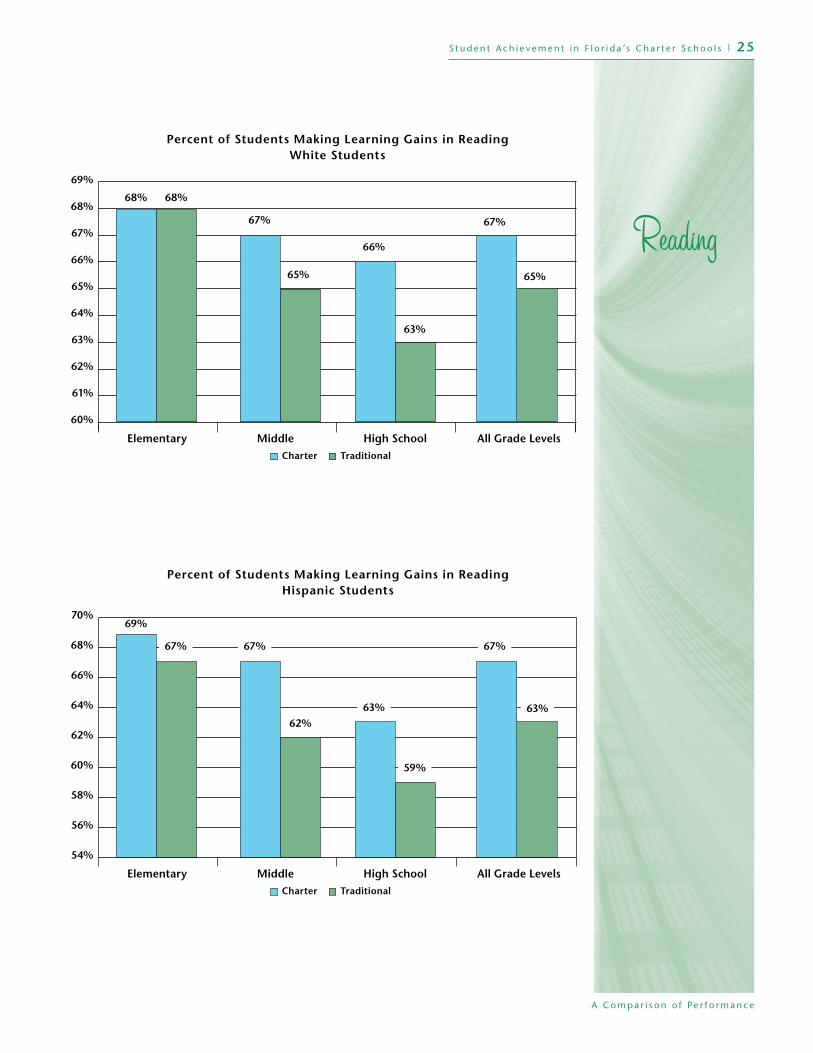
Percent of Students Making Learning Gains in ReadingWhite Students
69%
68%
67%
66%
65%
64%
63%
62%
61%
60%
Elementary Middle High School All Grade LevelsCharter Traditional
68%
67% 67%
66%
68%
65% 65%
63%
Percent of Students Making Learning Gains in ReadingHispanic Students
70%
68%
66%
64%
62%
60%
58%
56%
54%
Elementary Middle High School All Grade LevelsCharter Traditional
69%
67% 67%
63%
67%
62%63%
59%
2 6 | S t u d e n t A c h i e v e m e n t i n F l o r i d a ’s C h a r t e r S c h o o l s
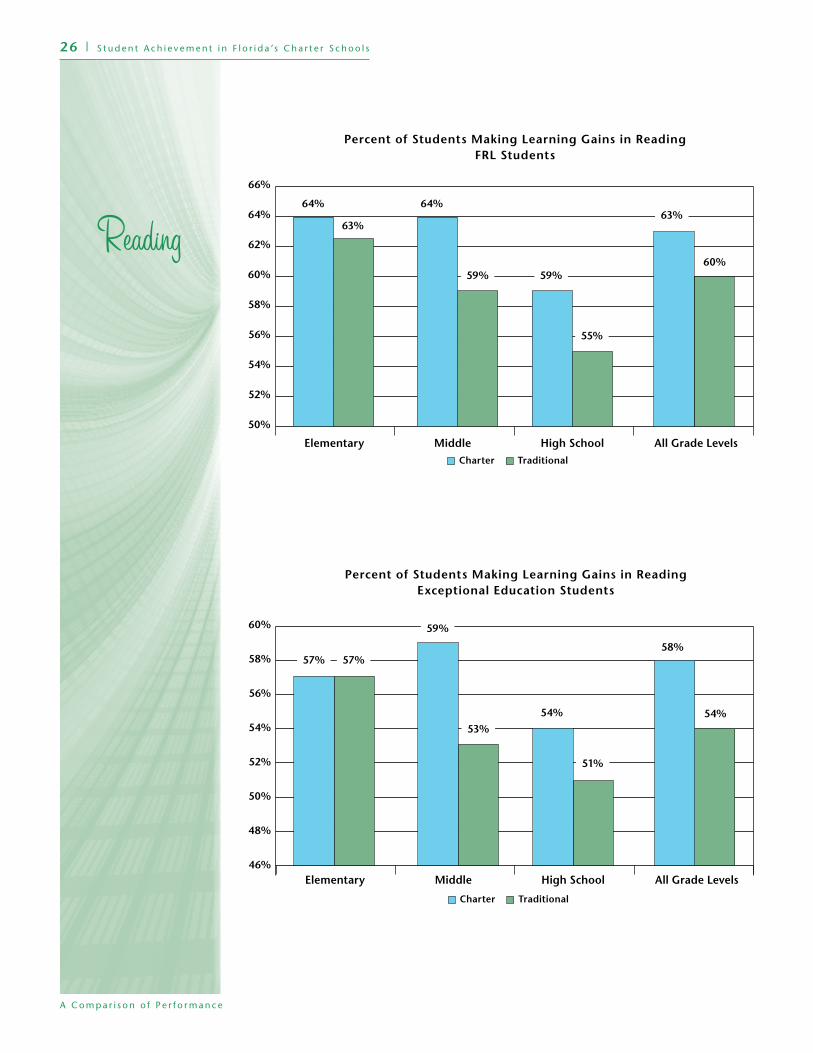
Percent of Students Making Learning Gains in ReadingFRL Students
66%
64%
62%
60%
58%
56%
54%
52%
50%
Elementary Middle High School All Grade LevelsCharter Traditional
64% 64%63%
59%
63%
59%60%
55%
Percent of Students Making Learning Gains in ReadingExceptional Education Students
60%
58%
56%
54%
52%
50%
48%
46% Elementary Middle High School All Grade Levels
Charter Traditional
57%
59%
58%
54%
57%
53%54%
51%
S t u d e n t A c h i e v e m e n t i n F l o r i d a ’s C h a r t e r S c h o o l s | 2 7
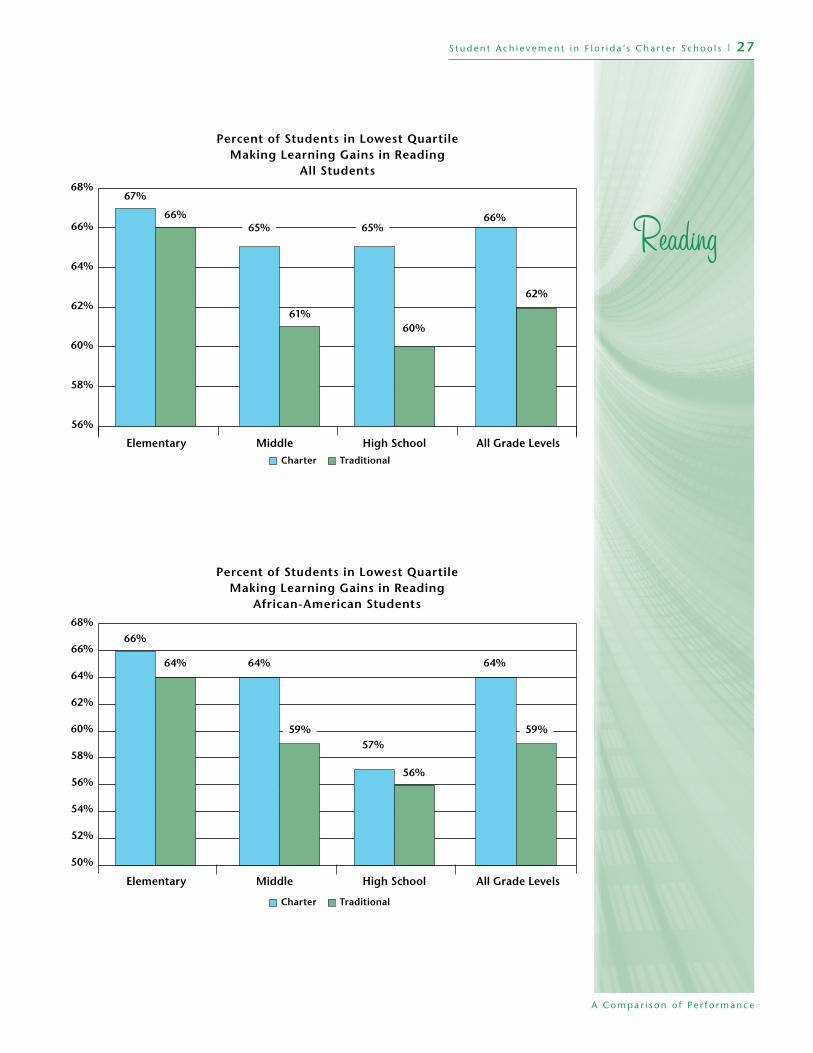
Percent of Students in Lowest Quartile Making Learning Gains in Reading
All Students68%
66%
64%
62%
60%
58%
56%
Elementary Middle High School All Grade LevelsCharter Traditional
67%
65%66%
65%66%
61%
62%
60%
Percent of Students in Lowest Quartile Making Learning Gains in Reading
African-American Students68%
66%
64%
62%
60%
58%
56%
54%
52%
50%
Elementary Middle High School All Grade Levels
Charter Traditional
66%
64% 64%
57%
64%
59% 59%
56%
2 8 | S t u d e n t A c h i e v e m e n t i n F l o r i d a ’s C h a r t e r S c h o o l s
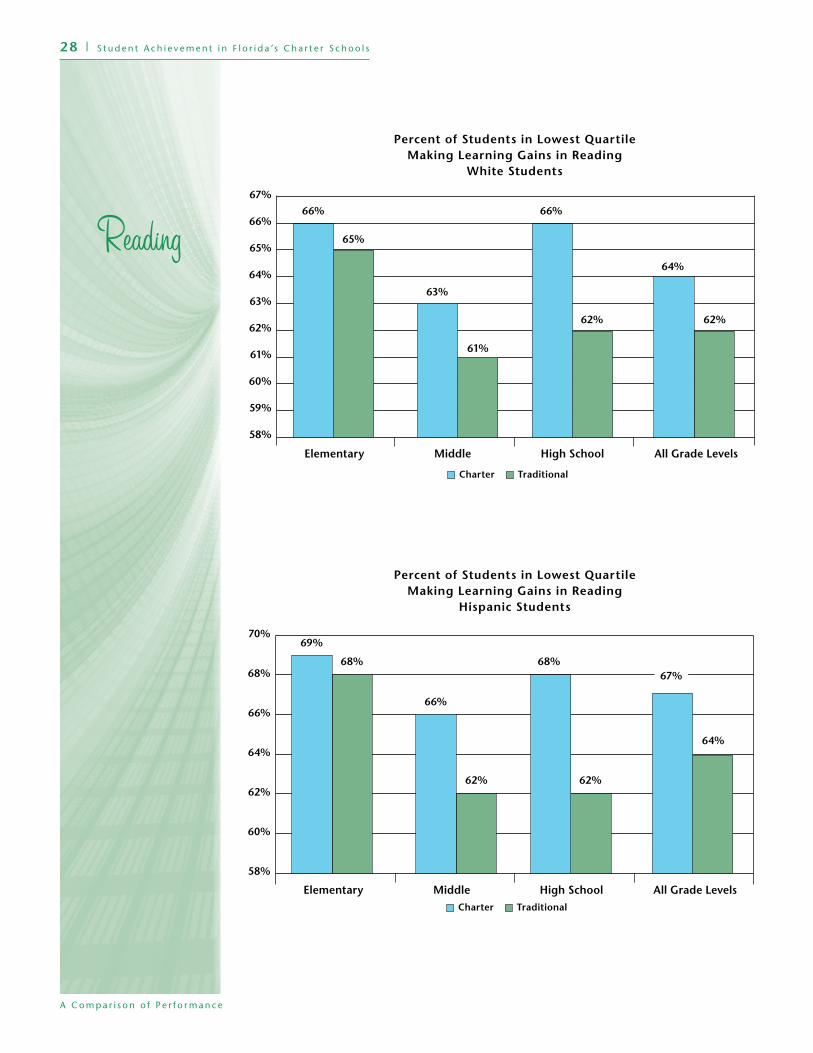
Percent of Students in Lowest Quartile Making Learning Gains in Reading
White Students
67%
66%
65%
64%
63%
62%
61%
60%
59%
58%
Elementary Middle High School All Grade Levels
Charter Traditional
66%
63%
64%
66%
65%
61%
62%62%
Percent of Students in Lowest Quartile Making Learning Gains in Reading
Hispanic Students
70%
68%
66%
64%
62%
60%
58%
Elementary Middle High School All Grade LevelsCharter Traditional
69%
66%
67%68%68%
62%
64%
62%

S t u d e n t A c h i e v e m e n t i n F l o r i d a ’s C h a r t e r S c h o o l s | 2 9
Percent of Students in Lowest Quartile Making Learning Gains in Reading
FRL Students
68%
66%
64%
62%
60%
58%
56%
54% Elementary Middle High School All Grade Levels
Charter Traditional
67%
64%
65%
64%
65%
60%
61%
59%
Percent of Students in Lowest Quartile Making Learning Gains in Reading
Exceptional Education Students
Elementary Middle High School All Grade LevelsCharter Traditional
60%
59%
58%
57%
56%
55%
54%
53%
52%
51%
50%
56%
59%
58%
55%
57%
54%
55%
53%

3 0 | S t u d e n t A c h i e v e m e n t i n F l o r i d a ’s C h a r t e r S c h o o l s
Percent of Students Making Learning Gains in MathAll Students
70%
68%
66%
64%
62%
60%
58%
56%
54%
Elementary Middle High School All Grade LevelsCharter Traditional
64%
69%
67%
65%65%
64% 64%
59%
Percent of Students Making Learning Gains in MathAfrican-American Students
66%
64%
62%
60%
58%
56%
54%
52%
50%
Elementary Middle High School All Grade LevelsCharter Traditional
57%
65%
61%
59%
57% 57%56%
57%

S t u d e n t A c h i e v e m e n t i n F l o r i d a ’s C h a r t e r S c h o o l s | 3 1
Percent of Students Making Learning Gains in MathWhite Students
72%
70%
68%
66%
64%
62%
60%
58%
56%
Elementary Middle High School All Grade LevelsCharter Traditional
65%
71%
68%
66%
69%
67% 67%
61%
Percent of Students Making Learning Gains in MathHispanic Students
70%
68%
66%
64%
62%
60%
58%
56%
54%
52%
Elementary Middle High School All Grade Levels
Charter Traditional
66%
69%68%
66%
64% 64%63%
58%

3 2 | S t u d e n t A c h i e v e m e n t i n F l o r i d a ’s C h a r t e r S c h o o l s
Percent of Students Making Learning Gains in MathFRL Students
68%
66%
64%
62%
60%
58%
56%
54%
52%
50%
Elementary Middle High School All Grade Levels
Charter Traditional
60%
67%
64%
62%61%
60% 60%
56%
Percent of Students Making Learning Gains in MathExceptional Education Students
60%
58%
56%
54%
52%
50%
48%
Elementary Middle High School All Grade LevelsCharter Traditional
55%
58%
57%
59%
55%
52%
53%53%
S t u d e n t A c h i e v e m e n t i n F l o r i d a ’s C h a r t e r S c h o o l s | 3 3
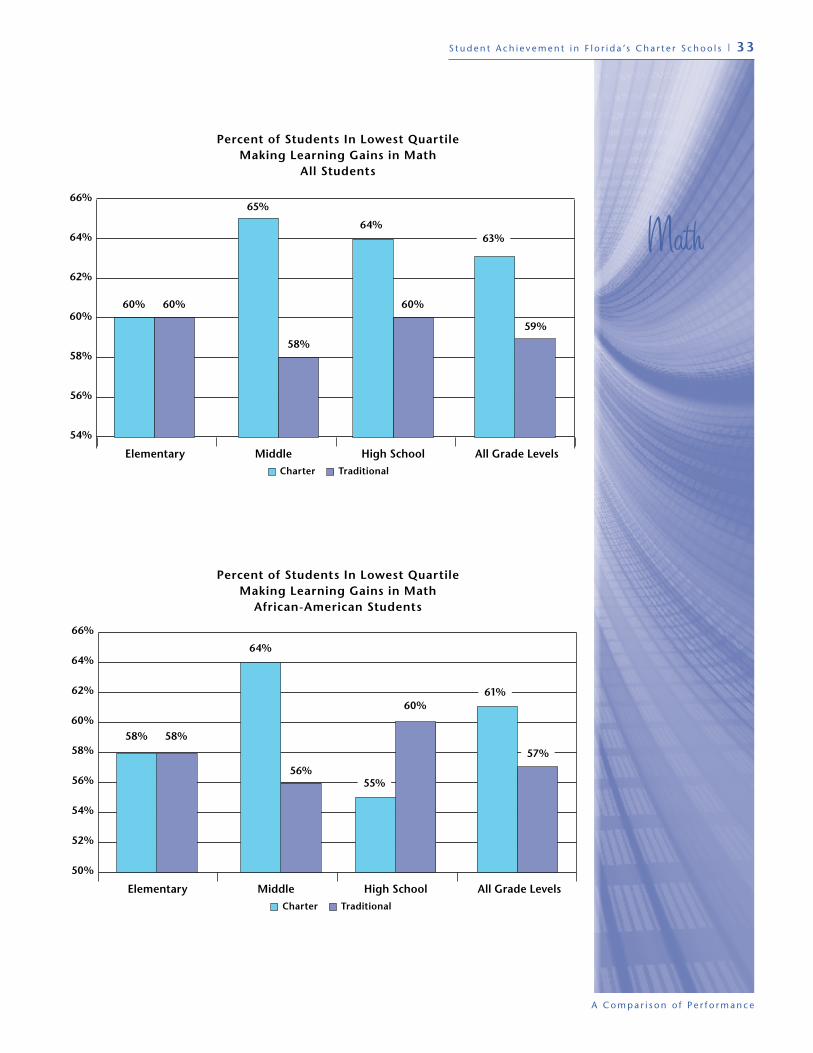
Percent of Students In Lowest QuartileMaking Learning Gains in Math
All Students
66%
64%
62%
60%
58%
56%
54%
Elementary Middle High School All Grade LevelsCharter Traditional
60%
65%
63%64%
60%
58%
59%
60%
Percent of Students In Lowest QuartileMaking Learning Gains in Math
African-American Students
66%
64%
62%
60%
58%
56%
54%
52%
50%
Elementary Middle High School All Grade LevelsCharter Traditional
58%
64%
61%
55%
58%
56%
57%
60%
3 4 | S t u d e n t A c h i e v e m e n t i n F l o r i d a ’s C h a r t e r S c h o o l s
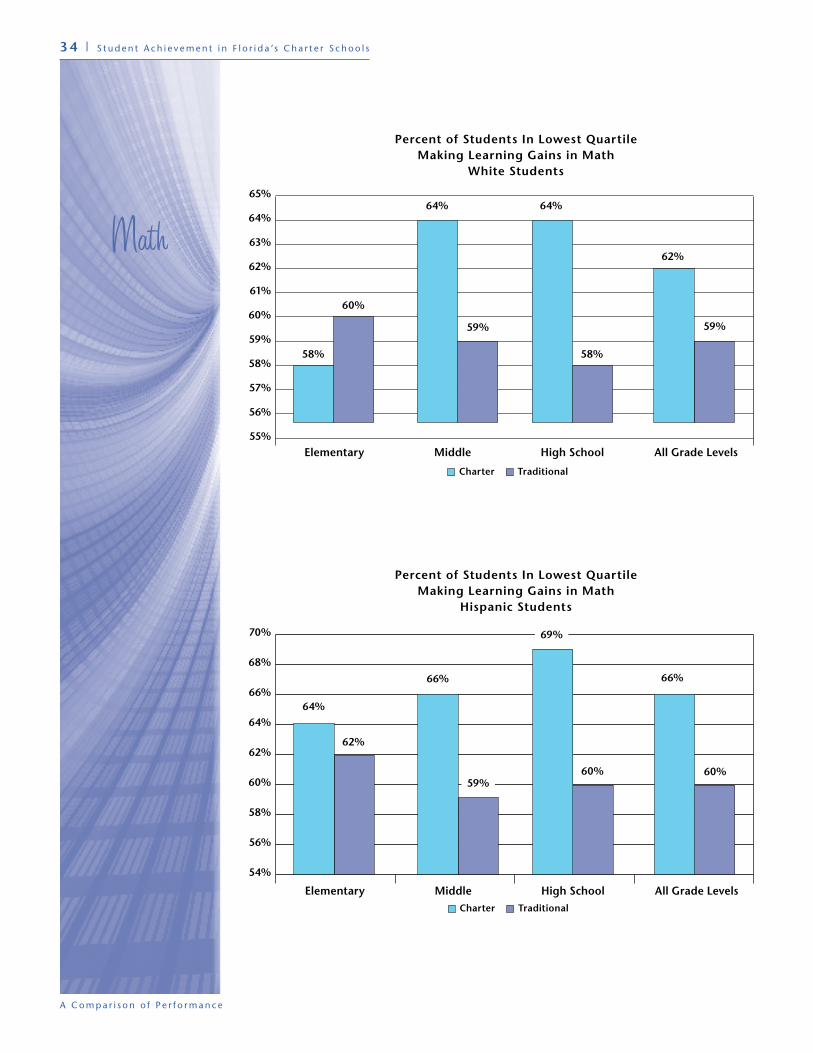
Percent of Students In Lowest QuartileMaking Learning Gains in Math
White Students
65%
64%
63%
62%
61%
60%
59%
58%
57%
56%
55%
58%
64%
62%
64%
60%
59% 59%
58%
Elementary Middle High School All Grade Levels
Charter Traditional
Percent of Students In Lowest QuartileMaking Learning Gains in Math
Hispanic Students
70%
68%
66%
64%
62%
60%
58%
56%
54%
Elementary Middle High School All Grade LevelsCharter Traditional
64%
66% 66%
69%
62%
59%60%60%
S t u d e n t A c h i e v e m e n t i n F l o r i d a ’s C h a r t e r S c h o o l s | 3 5
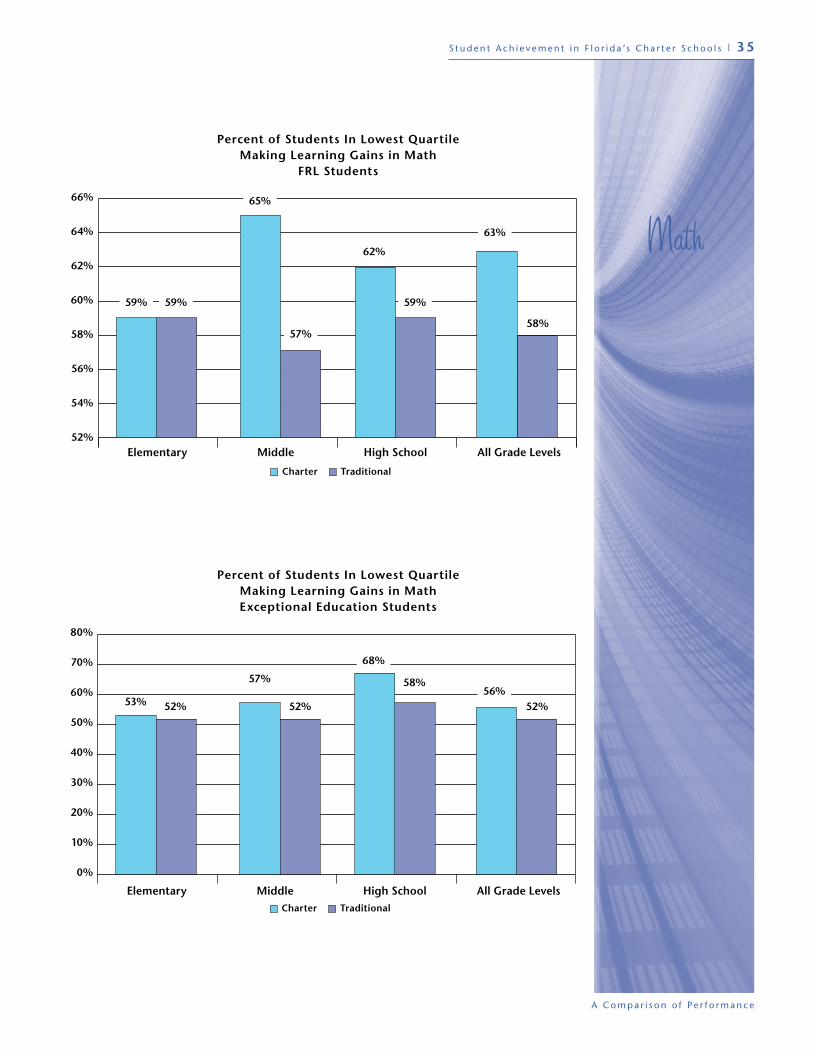
Percent of Students In Lowest QuartileMaking Learning Gains in Math
FRL Students
66%
64%
62%
60%
58%
56%
54%
52% Elementary Middle High School All Grade Levels
Charter Traditional
59%
65%
63%
62%
59%
57%58%
59%
Percent of Students In Lowest QuartileMaking Learning Gains in MathExceptional Education Students
80%
70%
60%
50%
40%
30%
20%
10%
0%
Elementary Middle High School All Grade LevelsCharter Traditional
53%
57%56%
68%
52% 52% 52%
58%
3 6 | S t u d e n t A c h i e v e m e n t i n F l o r i d a ’s C h a r t e r S c h o o l s
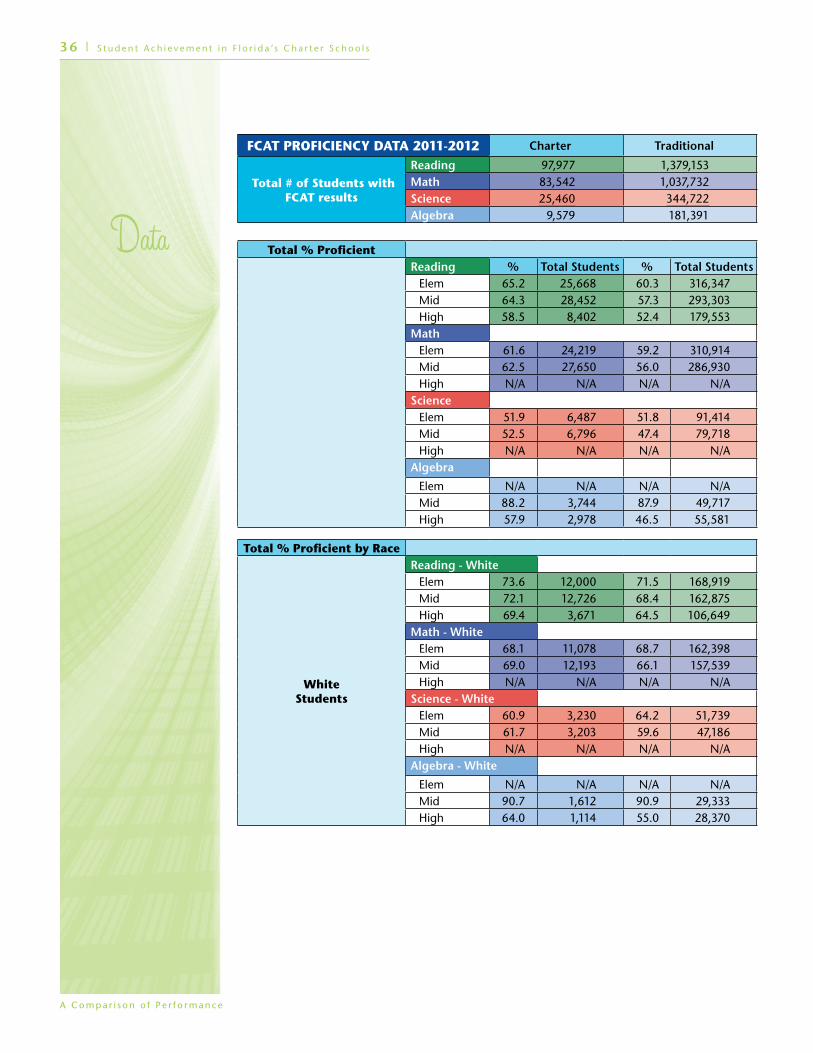
FCAT PROFICIENCY DATA 2011-2012 Charter Traditional
Total # of Students with FCAT results
Reading 97,977 1,379,153Math 83,542 1,037,732Science 25,460 344,722Algebra 9,579 181,391
Total % Proficient Reading % Total Students % Total Students
Elem 65.2 25,668 60.3 316,347Mid 64.3 28,452 57.3 293,303High 58.5 8,402 52.4 179,553
Math Elem 61.6 24,219 59.2 310,914Mid 62.5 27,650 56.0 286,930High N/A N/A N/A N/A
Science Elem 51.9 6,487 51.8 91,414Mid 52.5 6,796 47.4 79,718High N/A N/A N/A N/A
Algebra
Elem N/A N/A N/A N/AMid 88.2 3,744 87.9 49,717High 57.9 2,978 46.5 55,581
Total % Proficient by Race
White Students
Reading - White Elem 73.6 12,000 71.5 168,919Mid 72.1 12,726 68.4 162,875High 69.4 3,671 64.5 106,649
Math - White Elem 68.1 11,078 68.7 162,398Mid 69.0 12,193 66.1 157,539High N/A N/A N/A N/A
Science - White Elem 60.9 3,230 64.2 51,739Mid 61.7 3,203 59.6 47,186High N/A N/A N/A N/A
Algebra - White
Elem N/A N/A N/A N/AMid 90.7 1,612 90.9 29,333High 64.0 1,114 55.0 28,370
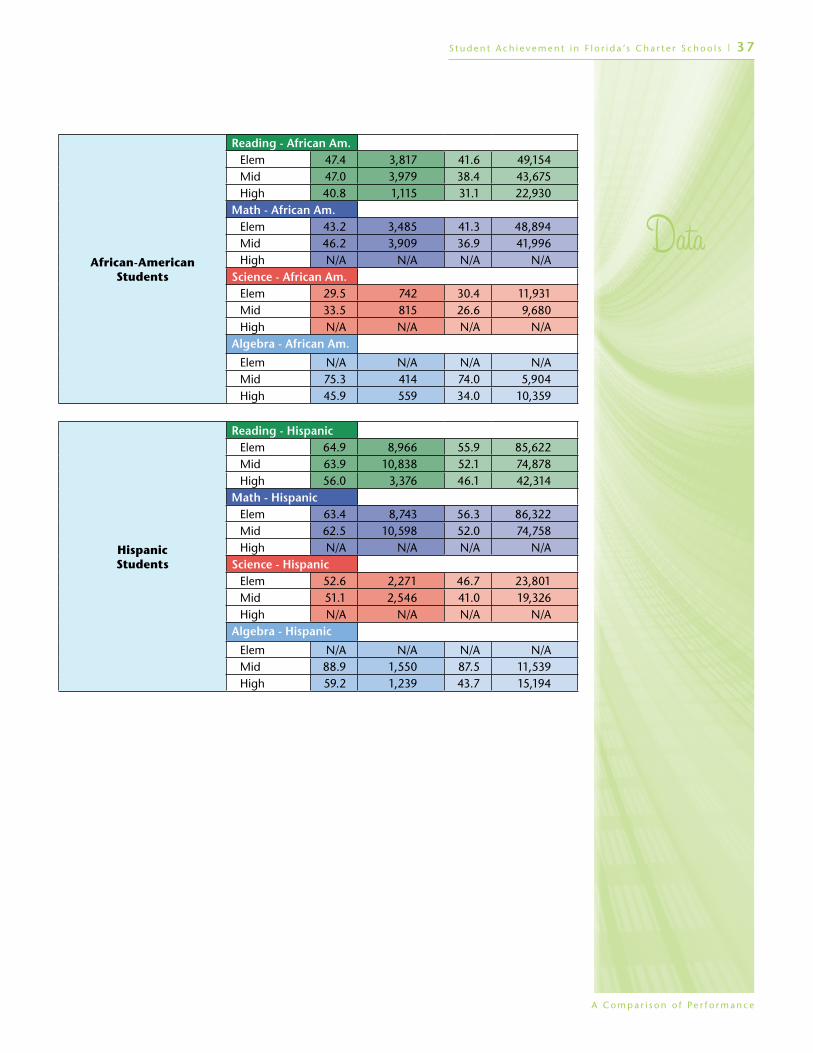
S t u d e n t A c h i e v e m e n t i n F l o r i d a ’s C h a r t e r S c h o o l s | 3 7
African-American Students
Reading - African Am. Elem 47.4 3,817 41.6 49,154Mid 47.0 3,979 38.4 43,675High 40.8 1,115 31.1 22,930
Math - African Am. Elem 43.2 3,485 41.3 48,894Mid 46.2 3,909 36.9 41,996High N/A N/A N/A N/A
Science - African Am. Elem 29.5 742 30.4 11,931Mid 33.5 815 26.6 9,680High N/A N/A N/A N/A
Algebra - African Am.
Elem N/A N/A N/A N/AMid 75.3 414 74.0 5,904High 45.9 559 34.0 10,359
Hispanic Students
Reading - Hispanic Elem 64.9 8,966 55.9 85,622Mid 63.9 10,838 52.1 74,878High 56.0 3,376 46.1 42,314
Math - Hispanic Elem 63.4 8,743 56.3 86,322Mid 62.5 10,598 52.0 74,758High N/A N/A N/A N/A
Science - Hispanic Elem 52.6 2,271 46.7 23,801Mid 51.1 2,546 41.0 19,326High N/A N/A N/A N/A
Algebra - Hispanic
Elem N/A N/A N/A N/AMid 88.9 1,550 87.5 11,539High 59.2 1,239 43.7 15,194

3 8 | S t u d e n t A c h i e v e m e n t i n F l o r i d a ’s C h a r t e r S c h o o l s
Charter TraditionalTotal % Proficient by Free
and Reduced Lunch
Reading Elem 54.4 10,825 49.7 166,312Mid 55.6 12,486 45.8 141,163High 47.4 3,291 38.7 68,802
Math Elem 51.9 10,315 49.2 165,215Mid 54.8 12,308 44.5 137,441High N/A N/A N/A N/A
Science Elem 40.5 2,527 40.5 44,944Mid 42.7 2,712 34.6 33,987High N/A N/A N/A N/A
AlgebraElem N/A N/A N/A N/AMid 82.3 1,400 81.6 18,685High 52.4 1,448 39.8 29,459
Total % Proficient by ESE Reading
Elem 37.4 1,230 29.8 19,963Mid 34.4 1,155 24.1 14,461High 30.1 295 21.0 7,443
Math Elem 39.1 1,287 32.9 22,115Mid 32.6 1,105 23.9 14,377High N/A N/A N/A N/A
Science Elem 29.2 312 26.8 6,014Mid 24.1 230 19.4 3,717High N/A N/A N/A N/A
AlgebraElem N/A N/A N/A N/A
Mid 74.4 93 77.3 1,338
High 36.2 179 24.9 4,208
Total % Proficient by ELL Reading
Elem 27.7 676 23.9 11,922Mid 19.9 336 11.5 2,993High 17.2 97 8.9 1,472
Math Elem 36.7 899 32.3 16,202Mid 31.5 534 20.6 5,364High N/A N/A N/A N/A
Science Elem 14.5 73 14.8 1,928Mid 15.1 64 7.2 584High N/A N/A N/A N/A
AlgebraElem N/A N/A N/A N/AMid 63.6 14 65.8 290High 46.4 91 27.4 2,163

S t u d e n t A c h i e v e m e n t i n F l o r i d a ’s C h a r t e r S c h o o l s | 3 9
LEARNING GAINS DATA
READING All Students
% who made learning gains
African American % who made learning gains
White
% who made learning gains
Hispanic
% who made learning gains
FRL
% who made learning gains
SWD
% who made learning gains
Charter Schools
Grades 4 and 5 67 62 68 69 64 57
Grades 6, 7 and 8 66 62 67 67 64 59
Grades 9 and 10 63 54 66 63 59 54
All Grade levels 66 61 67 67 63 58
Traditional Schools
Grades 4 and 5 66 61 68 67 63 57
Grades 6, 7 and 8 63 57 65 62 59 53
Grades 9 and 10 60 52 63 59 55 51
All Grade levels 63 57 65 63 60 54
LEARNING GAINS OF THE LOWEST QUARTILE
READING All Students
% in the low 25% who made learning gains
African American% in the low
25% who made learning gains
White
% in the low 25% who made learning gains
Hispanic
% in the low 25% who made learning gains
FRL
% in the low 25% who made learning gains
SWD
% in the low 25% who made learning gains
Charter Schools
Grades 4 and 5 67 66 66 69 67 56
Grades 6, 7 and 8 65 64 63 66 64 59
Grades 9 and 10 65 57 66 68 64 55
All Grade levels 66 64 64 67 65 58
Traditional Schools
Grades 4 and 5 66 64 65 68 65 57
Grades 6, 7 and 8 61 59 61 62 60 54
Grades 9 and 10 60 56 62 62 59 53
All Grade levels 62 59 62 64 61 55
Note: Retained 3rd grade students eligible for gains therefore included with grades 4 and 5.

4 0 | S t u d e n t A c h i e v e m e n t i n F l o r i d a ’s C h a r t e r S c h o o l s
LEARNING GAINS DATA
MATH All Students
% who made learning gains
African American % who made learning gains
White
% who made learning gains
Hispanic
% who made learning gains
FRL
% who made learning gains
SWD
% who made learning gains
Charter Schools
Grades 4 and 5 67 62 68 69 64 57
Grades 6, 7 and 8 66 62 67 67 64 59
Grades 9 and 10 63 54 66 63 59 54
All Grade levels 66 61 67 67 63 58
Traditional Schools
Grades 4 and 5 66 61 68 67 63 57
Grades 6, 7 and 8 63 57 65 62 59 53
Grades 9 and 10 60 52 63 59 55 51
All Grade levels 63 57 65 63 60 54
LEARNING GAINS OF THE LOWEST QUARTILE
MATH All Students
% in the low 25% who made learning gains
African American% in the low
25% who made learning gains
White
% in the low 25% who made learning gains
Hispanic
% in the low 25% who made learning gains
FRL
% in the low 25% who made learning gains
SWD
% in the low 25% who made learning gains
Charter Schools
Grades 4 and 5 67 66 66 69 67 56
Grades 6, 7 and 8 65 64 63 66 64 59
Grades 9 and 10 65 57 66 68 64 55
All Grade levels 66 64 64 67 65 58
Traditional Schools
Grades 4 and 5 66 64 65 68 65 57
Grades 6, 7 and 8 61 59 61 62 60 54
Grades 9 and 10 60 56 62 62 59 53
All Grade levels 62 59 62 64 61 55
Note: Retained 3rd grade students eligible for gains therefore included with grades 4 and 5.


Florida Department of Education Dr. Tony Bennett, Commissioner
www.fldoe.org
Bureau of Evaluation and Reporting 325 West Gaines Street, Suite 844
Tallahassee, FL 32399-0400 850/245-0429
www.fldoe.org/evaluation/
Office of Independent Education and Parental Choice 325 West Gaines Street, Suite 1044
Tallahassee, FL 32399-0400 850/245-0502
www.floridaschoolchoice.org
March 2013